Article

Equipment Sizing and Operation Strategy of Photovoltaic-Powered Hydrogen Refueling Station Based on AE-PEM Coupled Hydrogen Production

School of Electrical Engineering, Xinjiang University, Ürümqi 830000, China
*
Author to whom correspondence should be addressed.
Electronics 2025, 14(6), 1195; https://doi.org/10.3390/electronics14061195
Submission received: 18 February 2025 / Revised: 12 March 2025 / Accepted: 14 March 2025 / Published: 18 March 2025

Abstract

:
With the global commercialization of hydrogen fuel cell vehicles, the number of hydrogen refueling stations is steadily increasing. On-site hydrogen production stations are expected to play a key role in future power systems by absorbing renewable energy and supplying electricity during peak grid loads, aiding in peak shaving and load leveling. However, renewable energy sources like photovoltaic (PV) systems have highly fluctuating power generation curves, making it difficult to provide stable energy for hydrogen production. Traditional stations mainly use alkaline electrolyzers (AE), which are sensitive to power fluctuations, leading to operational instability. To address this, this paper proposes using capacitors and energy storage batteries to mitigate PV fluctuations and introduces a combined AE and Proton Exchange Membrane (PEM) electrolyzer hydrogen production method. Study cases demonstrate that capacitors and energy storage batteries reduce the variance of PV power output by approximately 0.02. Building on this, the hybrid approach leverages the low cost of AE and the rapid response of PEM electrolyzers to better adapt to PV fluctuations and maximize PV absorption. The model is mathematically formulated and the station’s equipment planning and operational strategy are optimized using CPLEX. The results show that, compared to pure AE and PEM hydrogen production, the combined AE and PEM hydrogen production method reduces the total annual cost of the hydrogen refueling station by 4.3% and 5.9%, respectively.

1. Introduction

Hydrogen energy is a zero-emission, clean energy source with broad applications. It can be used in various sectors, such as energy storage, power generation, and transportation [1]. Therefore, developing hydrogen energy-related industries, particularly applying hydrogen energy to the power and transportation sectors, is an important approach to reducing low-carbon emissions. From 2014 to 2015, the United States and Japan pioneered the commercialization of hydrogen fuel cell vehicles [2], and China plans to have at least 50,000 hydrogen fuel vehicles on the road by the end of 2025 [3]. As the number of hydrogen fuel vehicles grows, the number of hydrogen refueling stations is also increasing year by year. By June 2024, China had 507 hydrogen refueling stations. California has over 100 stations [4] and Germany plans to build 1000 hydrogen refueling stations by 2030 [5].
On-site hydrogen production refueling stations, which produce hydrogen using electricity, can absorb renewable energy to produce hydrogen fuel [6]. Hydrogen fuel can be used for hydrogen fuel vehicles and also serves as an efficient form of energy storage, supplying electricity to the grid during peak load periods. Therefore, hydrogen refueling stations are expected to be an essential part of the future power system’s renewable energy absorption and energy storage system [7]. Ideally, the operation strategy of on-site hydrogen production refueling stations should not only meet the hydrogen fueling demand of fuel cell vehicles but also maximize renewable energy absorption while reducing the dependence on grid electricity and providing power to the grid when necessary. Thus, the operation strategy of such refueling stations is crucial for both hydrogen fuel vehicle users and the power system.
Ref. [8] by Abdullah Al-Sharafi et al. indicates that photovoltaic-powered hydrogen refueling stations are economically feasible and encourages hydrogen production during periods of sufficient sunlight to supply fuel cell vehicles. Ref. [9] by Raul Pereira Micena et al. demonstrates that large-scale hydrogen refueling stations can significantly reduce hydrogen production costs, while the application of photovoltaic systems provides a viable alternative to reduce reliance on traditional fuels. Ref. [10] by Reyhan Atabay and Yılser Devrim focuses on the techno-economic performance of renewable energy systems under different hydrogen refueling capacities. The results show that in hybrid energy systems, photovoltaic power generation significantly exceeds wind power, indicating greater potential for solar energy utilization. Ref. [11] by Rizk M. Rizk-Allah et al. conducts a techno-economic analysis of an off-grid wind–solar hybrid system which not only supplies hydrogen to refueling stations but also powers an electrocoagulation wastewater treatment reactor. Ref. [12] by Reza Hemmati et al. proposes an off-grid electricity–hydrogen integrated system powered by solar and hydroelectric units, demonstrating a 9% increase in annual profit through optimized seasonal hydrogen storage and complementary P2H-H2P operations. The study highlights the system’s economic viability while addressing limitations such as storage lifetime and hydroelectric dependency, suggesting future enhancements with wind energy and demand response programs. Ref. [13] by Murat Gökçek et al. evaluates the feasibility of stand-alone hydrogen refueling stations powered by hybrid renewable energy systems in Niğde, Türkiye and Zaragoza, Spain, demonstrating their potential to reduce hydrogen production costs and CO2 emissions. The findings highlight the technical and economic viability of renewable-powered hydrogen stations, supporting the transition to sustainable transportation and net-zero emissions. Ref. [14] by Manaf Zghaibeh et al. optimizes green hydrogen production in a hydroelectric–photovoltaic hybrid power station in southern Oman, demonstrating its potential to reduce greenhouse gas emissions and achieve a competitive levelized cost of hydrogen. Ref. [15] by M.F. Roslan et al. explores the techno-economic impacts of a renewable energy-based hybrid energy storage system integrated into grid-connected electric vehicle charging stations in Malaysia, demonstrating its potential to enhance grid stability and reduce carbon emissions. Ref. [16] by Mohamed Hajjaji and Christian Cristofari presents a techno-economic analysis of a hydrogen refueling station in Ajaccio, demonstrating its potential to reduce CO2 emissions by 87.3% and achieve a cost-effective Levelized Hydrogen Cost of 6.95 €/kg. The findings highlight the economic viability and sustainability of green hydrogen as a key solution for decarbonizing heavy-duty transportation. Ref. [17] by Yuyan Yang et al. proposes a planning model for expressway hydrogen refueling stations powered by wind–PV systems, integrating hydrogen production, storage, and delivery to address renewable energy and demand uncertainties.
Research on existing operation strategies for hydrogen refueling stations typically focuses on two aspects: the capacity configuration of refueling station equipment and the operation strategy of the stations. Several studies have investigated the capacity configuration of refueling stations. Refs. [18,19] by Bhogilla S.S. and Niyas H. and Specklin M. et al. detail the design and modeling of compressors. Refs. [20,21] by Ruffio E. et al. and Xiao J. et al. analyze and optimize the hydrogen fueling process in storage hydrogen pipes. In addition, other studies have focused on the operation strategies of refueling stations. Ref. [22] by Zhao L. and Brouwer J. proposes different control strategies for on-site hydrogen production refueling stations to absorb photovoltaic and wind power. Ref. [23] by Pol Cardona et al. presents an integrated refueling station design powered by photovoltaic systems, utilizing steam methane reforming for hydrogen production and multiple hydrogen storage tanks. Ref. [24] by Bartolucci L. et al. further suggests a hydrogen storage system for different types of users and provides an in-depth analysis of operational costs and user satisfaction. In general, the existing equipment composition of on-site hydrogen production refueling stations usually includes hydrogen storage equipment, hydrogen production equipment, compressors, and renewable energy power generation equipment. Based on these components, existing studies typically aim to optimize the operation strategies of refueling stations with the goal of minimizing operational costs while meeting hydrogen fueling demand.
Although there have been studies on the basic equipment composition and operation strategy optimization for hydrogen refueling stations, on-site hydrogen production refueling stations still face several challenges. Firstly, the power generated by small photovoltaic systems exhibits high-frequency fluctuations and randomness [25,26,27,28,29]. This low-quality photovoltaic power cannot support the stable operation of electrolyzers, causing frequent start–stop cycles that ultimately reduce the lifespan of the electrolyzers [30]. Additionally, the conventional alkaline electrolysis method for hydrogen production is characterized by a slow startup, slow power regulation, and a small power regulation range [31]. Fluctuating power sources can cause alkaline electrolyzers to operate in unstable states or lead to frequent start–stop cycles, reducing hydrogen production efficiency [32]. Moreover, alkaline electrolyzers are not well-suited for rapid power regulation in response to photovoltaic power generation.
Building on existing research, this paper improves the equipment composition and operation strategy of hydrogen refueling stations. Small-scale photovoltaic (PV) systems in urban areas are often affected by rapidly changing cloud cover, as well as shadows from surrounding trees and buildings, leading to minute-level fluctuations in the power generation curve [29]. To address the high-frequency fluctuations of photovoltaic power, large capacitors are added to filter these fluctuations. Moreover, a mode combining energy storage batteries and capacitors is used to smooth the power fluctuations of photovoltaic systems, achieving peak shaving and valley filling of the photovoltaic output. The paper also introduces a combined AE-PEM hydrogen production method, which improves the rapid response capability of hydrogen production equipment and expands the operating power range to accommodate the uncertainty of renewable energy generation. Additionally, the paper optimizes the capacity configuration of the refueling station and proposes a 15 min granularity AE-PEM joint hydrogen production strategy. Case studies demonstrate that capacitors and energy storage batteries reduce the variance of PV power output by approximately 0.02. The results show that, compared to standalone AE and PEM hydrogen production systems, the proposed AE-PEM hybrid hydrogen production refueling station reduces annual total costs by 4.3% and 5.9%, respectively. Moreover, the AE-PEM hybrid hydrogen production refueling station achieves higher energy utilization efficiency, reducing electricity consumption by approximately 6% compared to traditional refueling stations relying solely on AE hydrogen production.

2. Model of the Hydrogen Refueling Station

The structure diagram of the AE-PEM hydrogen production and refueling station is shown in Figure 1. Other articles, such as [10,33], also describe hydrogen refueling stations using photovoltaic hydrogen production with structures similar to that in Figure 1. In general, the hydrogen refueling station is mainly composed of two major parts: the electricity consumption section and the hydrogen utilization section. The blue lines represent electrical circuits, while the black lines represent hydrogen pipelines. The blue arrows indicate the direction of energy flow, and the orange dashed lines represent part of the PLC control lines. The primary power sources for the refueling station are photovoltaic power generation, grid electricity, and energy stored in batteries. The main electricity-consuming devices are the AE and PEM combined hydrogen production equipment. The equipment used for hydrogen storage and processing includes compressors, hydrogen storage tanks, hydrogen fuel filling equipment, and hydrogen fuel cells. The overall operation of the hydrogen refueling station is controlled by a Programmable Logic Controller (PLC).
The photovoltaic power generation equipment is connected to capacitors to filter low-frequency components. Meanwhile, the grid power serves as a stable additional power source, also providing power to both types of electrolyzers. The energy storage battery stores renewable energy during the peak of photovoltaic power generation and discharges during the photovoltaic power generation low period, allowing the electrolyzers to operate within the normal power range. The refueling station produces hydrogen via AE and PEM, and the hydrogen produced is compressed by a compressor and stored in hydrogen storage tanks. The hydrogen fuel can also be supplied to users directly through the compressor during hydrogen demand peaks. The hydrogen is stored in multiple sealed tanks to prevent large-scale leakage of hydrogen all at once. Excess hydrogen is consumed by the hydrogen fuel cell, which generates stable electricity that can be sold to the grid. The operation of each device in the refueling station is controlled by a PLC.
Section 2.1, Section 2.2, Section 2.3, Section 2.4, Section 2.5, Section 2.6 and Section 2.7 provide mathematical models for various devices in the refueling station.

2.1. Model of Alkaline Electrolyzer

AE hydrogen production is the mainstream method for existing on-site hydrogen refueling stations. Its characteristics are low cost, but slower response, making it suitable for stable electricity sources for hydrogen production. The operation constraints of the electrolyzer mainly include startup and shutdown constraints, power ramp-up constraints, and power range constraints [34,35]. Formulas (1) and (2) describe the startup and shutdown constraints of the alkaline electrolyzer. Typically, a cold startup of the alkaline electrolyzer requires 1 h and shutdown requires several minutes. t o n and t o f f represent the startup and shutdown t times of the AE, while u t A E is the operating state of the electrolyzer at a given time; when u t A E = 1 , the electrolyzer is operating; when u t A E = 0 , the electrolyzer is stopped. Formula (3) is the power climb constraint of the AE and P t A E is the power consumption of the AE at time t, Q A E is the rated power. Formula (4) explains the power operating range of the AE. The AE can exceed the rated power consumption for a short period, up to 1.1 times the rated power.
m = 0 t o n 1 u t + m A E t o n ( u t A E u t 1 A E )
m = 0 t o f f 1 ( 1 u t + m A E ) t o f f ( u t 1 A E u t A E )
d P t A E d t 30 % Q A E
0.4 Q A E P t A E 1.1 Q A E
Formula (5) is the total energy consumption formula for water electrolysis hydrogen production. α is the hydrogen thermal energy constant, β is the electrical energy constant, η e l e is the electrical efficiency, and η h y d is the overall energy consumption for the water electrolysis hydrogen production. The electrical efficiency η e l e , A E is set at 76%, the hydrogen thermal energy constant is 1.287 × 10⁷, and the electrical energy constant is 0.36 × 10⁷. This results in the overall energy consumption for the AE hydrogen production, which is η h y d , A E = 52.36 kWh / kg H 2 . Formula (6) shows that when the AE consumes power P t A E , it will produce hydrogen with quality M t A E .
η h y d , A E = α η e l e , E × β
P t A E × η h y d , A E = M t A E

2.2. Model of PEM

PEMs have fast startup and shutdown times, quick power regulation responses, and high energy utilization for hydrogen production. However, PEMs also have the characteristic of high investment and maintenance costs. The startup and shutdown constraints of PEM hydrogen production are similar to those of AE hydrogen production, with its startup and shutdown constraints being essentially the same as Formulas (1) and (2). The startup time of the PEM is 5 min and the shutdown time is 1 min. The power ramp-up constraint for the PEM is shown in Formula (7). In Formula (8), η e l e , P E M is the electrical efficiency of the PEM, taken as 85%. This results in the overall energy consumption for PEM hydrogen production, which is η h y d , P E M = 46.816   kWh / kg H 2 . Formula (9) shows the quality M t P E M of hydrogen produced by the PEM at time t . Formula (10) defines the operational range of the PEM. The PEM can exceed the rated power for a short period, with its maximum operational power being 1.2 times the rated power Q P E M .
d P t P E M d t 100 % Q A E
η h y d , P E M = α η e l e , P E M × β
P t P E M × η h y d , P E M = M t P E M
0.1 Q P E M P t P E M 1.2 Q P E M

2.3. Model of Compressor

The compressor is an important component of the hydrogen refueling station. It compresses the hydrogen produced by the electrolyzer and stores it in the hydrogen storage tank. Additionally, after compressing the hydrogen, the compressor can also directly provide hydrogen fuel to the hydrogen injection equipment. The operating power of the compressor is mainly influenced by factors such as the hydrogen mass and hydrogen leakage rate. The compressor operating model is shown in Formulas (11)–(13), which can be found in Ref. [36]. P t p r e s s is the power of the compressor at time t , M t p r e s s is the hydrogen mass flowing into the compressor at time t , E r e f p r e s s is the power consumption of the compressor at the reference pressure, F r e f p r e s s is the reference compressor pressure, which is 35 Mpa, and F i n i is the standard atmospheric pressure. μ l e a k is the hydrogen leakage rate, taken as 0.01%, M t e l e is the hydrogen production mass, and M t p r e s s is the hydrogen mass entering the compressor. The energy consumption of the compressor at the reference pressure is calculated to be 2.43 kWh/kgH2.
P t p r e s s = M t p r e s s E r e f p r e s s ln ( F p r e s s / F i n i ) ln ( F r e f p r e s s / F i n i )
M t p r e s s = ( 1 μ l e a k ) M t e l e
P min p r e s s P t p r e s s P max p r e s s

2.4. Model of Hydrogen Storage Tank

The hydrogen storage tank stores hydrogen fuel produced by electrolysis and can directly supply hydrogen to hydrogen fuel cell vehicles. Additionally, excess hydrogen can be provided to fuel cells for power generation. The operation constraints of the hydrogen storage tank are mainly its capacity limits and the rate of hydrogen flow in and out. In practical engineering applications, the configuration of the hydrogen storage tank is usually measured by its volume rather than the maximum gas mass it can store. When considering the volume of the hydrogen storage tank, its operational state must meet the upper and lower pressure limits of the tank. Therefore, this section also introduces the operational pressure range constraint of the hydrogen storage tank. As shown in Formula (14), the sum of the hydrogen output and input rates of the storage tank should be less than the upper limit of the flow rate Q C , S . M t i n and M t o u t are the input and output hydrogen fuel masses at time t for the storage tank. In Formula (15), μ is the storage efficiency and μ l e a k is the hydrogen leakage rate. The equivalent charge state of the hydrogen storage tank is calculated using Formula (16). As shown in Formula (17), the equivalent charge state cannot exceed the upper and lower charge state limits, S max O C and S min O C . To maintain consistent initial conditions for the hydrogen storage tank each day, the equivalent charge state at the first step of the day is equal to that at the last step of the previous day, as shown in Formula (18).
0 d ( M t i n ) d t + d ( M t o u t ) d t Q C , S
μ = 1 μ l e a k
S t O C = S t 1 O C + M t i n μ M t o u t μ Q C Δ t
S min O C S t O C S max O C
S 1 O C = S 96 O C
Additionally, the operating pressure of the hydrogen storage tank should be within the normal range. Formula (19) presents the pressure calculation formula for the hydrogen storage tank, where T H S T is the thermodynamic temperature, V H S T is the volume of the hydrogen storage tank, and p t H S T is the pressure of the storage tank at time t . The maximum pressure range is shown in Formula (20). The volume of the hydrogen storage tank V H S T is calculated using Formula (21), with the rated pressure of the hydrogen storage tank P max H S T set at 35 MPa, the temperature T of the hydrogen storage tank at the Kelvin scale set to 298 K, and the gas constant R set to 8.314 J/(mol·K). n is the molar amount of hydrogen, measured in moles. Then, it can be calculated that one cubic meter of hydrogen storage tank can hold 28.48 kg of hydrogen.
p t H S T = p t 1 H S T ( R T H S T V H S T ) ( μ M t i n μ M t o u t ) Δ t
p min H S T p t H S T p max H S T
V H S T = n R T P max H S T

2.5. Model of Capacitance

Due to the high-frequency oscillation characteristics of renewable energy generation, which are unfavorable for the normal operation of electrolyzers, photovoltaic power generation needs to be filtered through capacitors to smooth out the high-frequency oscillations [37]. As shown in Formula (22), the photovoltaic power generation P t P V consists of low-frequency components P t P V , l f and high-frequency components P t P V , h f . P t S C , c h and P t S C , c h are the power for capacitor discharge and charge, respectively. The ranges for charging and discharging power are shown in Formulas (24) and (25). Formulas (26) and (27) calculate the charge state of the capacitor, where H t S C is the charge state of the capacitor, and μ S C , c h and μ S C , d i s are the charging and discharging rates, respectively. E S C is the capacitor capacity and μ S C , l o s s is the self-discharge coefficient of the capacitor. Formula (28) represents the upper and lower charge state constraints, where H max S C and H min S C are the maximum and minimum charge states of the capacitor, respectively.
P t P V = P t P V , l f + P t P V , h f
P t S C , d i s = P t P V , l f , P t P V , l f 0 P t S C , c h a = P t P V , l f , P t P V , l f > 0
0 P t S C , d i s P max S C , d i s
0 P t S C , c h a P max S C , c h a
H t S C = ( 1 μ S C , l o s s ) H t 1 S C + ( μ S C , c h a P t S C , c h a E S C P t S C , d i s μ S C , d i s E S C ) Δ t
μ S C , c h a t = 1 T ( P t S C , c h a Δ t ) 1 μ S C , d i s t = 1 T ( P t S C , d i s Δ t ) = 0
H min S C H t S C H max S C

2.6. Model of Hydrogen Cell

The hydrogen fuel cell is a device that converts hydrogen fuel into electrical energy, and the hydrogen fuel cell model appears in several articles [38,39]. The system in this article uses the hydrogen fuel cell to consume excess hydrogen fuel and sell electricity to the grid. Formula (29) is the energy balance equation for the hydrogen fuel cell, where the negligible air loss heat of the stack Q b , l is ignored and considered as zero. Therefore, the output power of the hydrogen fuel cell is simplified to Formula (30). P t F C , O U T is the output power of the fuel cell and Q b , w is the heat absorption power of the stack. Formula (31) calculates the heat absorption power of the stack, where n represents the number of electrons in hydrogen and η t F C is the fuel cell’s generation efficiency, which is assumed to be constant at 60%. F is Faraday’s constant, E H 2 is the enthalpy of hydrogen, I t F C is the operating current of the stack, and P max F C , O U T is the rated generation power of the hydrogen fuel cell.
P t F C , I N = P t F C , O U T + Q t b , w + Q t b . l
P t F C , O U T = P t F C , I N Q t b , w
Q t b , w = ( 1 η t F C ) I t F C n F E H 2
0 P t F C , O U T P max F C , O U T

2.7. Model of Energy Storage Battery

When the electrolyzer cannot fully absorb the photovoltaic power generation, the energy storage battery is mainly used to store the electrical energy during the photovoltaic generation peak periods. When there is a fluctuation in photovoltaic generation, the energy storage battery discharges to smooth the photovoltaic power generation curve. Formula (33) calculates the energy P t B a stored in the battery, where P t 1 B a , c h is the battery charging energy and P t 1 B a , c h is the battery discharging energy.
P t B a = P t 1 B a + P t 1 B a , c h + P t 1 B a , d i s
0 P t B a P max B a

3. Hydrogenation Station Operation Scheme

The objective of the hydrogen station operation scheme is to meet the user’s hydrogen demand at the same time with the lowest operating cost of the hydrogen station. In addition, the hydrogenation station operation plan should also make the electrolyzer consume photovoltaic power generation as much as possible in a reasonable operation state.

3.1. Operation Scheme of Electrolytic Cell

The goal of the electrolyzer operation plan is to minimize operational costs while maximizing the absorption of solar power. As shown in Formula (35), when the real-time hydrogen production power P t e l e is lower than the solar generation value, the real-time operating power strategies for the AE and PEM are shown in Formulas (36) and (37), where P t A E , max is the maximum hydrogen production power of the AE at step t and P t P E M , min is the minimum hydrogen production power of the PEM at step t. Equations (38) and (39) demonstrate the calculation of P t A E , max and P t P E M , min , which are primarily influenced by the AE and PEM output constraints from the previous time step. The AE cannot respond quickly to fluctuations in renewable energy, so it is used to absorb relatively smooth renewable energy output. The PEM, due to its fast response characteristics, is responsible for absorbing the fluctuating renewable energy output.
P t e l e < P t P V
P t A E = min ( P t A E , max , P t e l e P t P E M , min )
P t P E M = max ( P t e l e P t A E , max , P t P E M , min )
P t A E , max = min ( P t 1 A E + 0.3 Q A E , 1.1 Q A E )
P t P E M , min = max ( P t 1 P E M Q P E M , 0.1 Q P E M )
As shown in Formula (40), when the P t e l e is higher than the wind and solar generation value, based on the PEM’s fast response characteristics and low hydrogen production costs, the PEM is used to absorb the majority of the renewable energy, while the AE tries to maintain lower power. The corresponding real-time operation strategy is expressed by Formulas (41) and (42), where P t A E , min is the minimum hydrogen production power of the AE at step t and P t P E M , max is the maximum hydrogen production power of the PEM at step t.
P t e l e > P t P V
P t A E = max ( P t A E , min , P t e l e P t P E M , max )
P t P E M = min ( P t e l e P t A E , min , P t P E M , max )
P t A E , min = max ( P t 1 A E 0.3 Q A E , 0.4 Q A E )
P t P E M , max = min ( P t 1 P E M + Q P E M , 1.2 Q P E M )

3.2. Hydrogen Storage Tank Operation Scheme

The operation plan for the hydrogen storage tank is shown in Formula (45). The hydrogen storage tank releases hydrogen when the hydrogen demand is greater than the hydrogen production from the electrolyzer and stores hydrogen when the hydrogen demand is less than the hydrogen production from the electrolyzer.
M t i n = M t P E M + M t A E M t L o a d , M t P E M + M t A E > M t L o a d M t o u t = M t L o a d M t P E M M t A E , M t L o a d > M t P E M + M t A E t = 1 T M t i n = t = 1 T M t o u t

3.3. Energy Storage Battery Operation Plan

Considering that there are times when PV energy fluctuations are large and do not meet the standards for selling electricity to the grid, excess renewable energy generation is not sold to the grid, but instead stored in the energy storage battery. The energy storage battery is charged when photovoltaic generation exceeds the rated power of the AE and PEM, as shown in Formula (46). When electricity demand exceeds photovoltaic generation, priority is given to using battery storage. When the daily hydrogen refueling demand is close to zero, the energy storage battery discharges and the AE consumes electrical energy to produce hydrogen fuel and store it.
P t B a , c h = P t P V Q P E M Q A E

3.4. Balance Constraints

The operation of the hydrogen refueling station must meet the following two balance constraints. As shown in Formula (47), the hydrogen production rate from the electrolyzer and the change in hydrogen fuel mass in the storage tank should equal the hydrogen demand in real time. As shown in Formula (48), the electricity supply from various power sources and the electricity consumption of the equipment should balance in real time.
Hydrogen balance constraint:
M t A E + M t P E M M t i n + M t o u t = M t L o a d
Electricity balance constraint:
M t A E + M t P E M M t i n + M t o u t = M t L o a d

3.5. Objective Function

The daily costs of various devices are shown in Formulas (49)–(61) and the relevant data in the formulas can be found in Refs. [40,41,42,43]. Formula (49) shows the AE equipment’s daily cost C A E . The depreciation cost ratio is η d e p A E = 0.02 % , the operation and maintenance cost ratio is η r u n A E = 0.01 % , and the unit investment cost is C u n i t A E = 304   USD / kW .
C A E = ( η d e p A E + η r u n A E ) C u n i t A E Q A E
Formula (50) shows the PEM equipment’s daily cost C P E M . The depreciation cost ratio is η d e p P E M = 0.04 % , the operation and maintenance cost ratio is η r u n P E M = 0.01 % , and the unit investment cost is C u n i t P E M = 551   USD / kW .
C P E M = ( η d e p P E M + η r u n P E M ) C u n i t P E M Q P E M
Formula (51) shows the hydrogen storage tank equipment daily cost C H S T . C H S T is the daily operating cost of the PEM, the depreciation cost ratio is η d e p H S T = 0.01 % , the hydrogen flow in and out rate cost is η r u n H S T = 392.5 USD / ( kg / h ) , the operation and maintenance cost ratio is η r u n H S T = 0.002 % , the unit investment cost is C u n i t H S T = 182 USD / kg , and the M max H S T is the rated storage quality of the hydrogen.
C H S T = ( η d e p H S T + η r u n H S T + η s p e e d H S T ) C u n i t H S T M max H S T
M max H S T = V H S T P max H S T R T 1.008
Formula (53) shows the compressor equipment daily cost C p r e s s , where the depreciation cost ratio is η d e p p r e s s = 0.01 % , the operation and maintenance cost ratio is η r u n p r e s s = 0.002 % , and the unit investment cost is C u n i t p r e s s = 270 USD / kW .
C p r e s s = ( η d e p p r e s s + η r u n p r e s s ) C u n i t p r e s s P max p r e s s
Formula (54) shows the capacitance equipment daily cost C c a p , where the depreciation cost ratio is η d e p c a p = 0.005 % , the operation and maintenance cost ratio is η r u n c a p = 0.001 % , and the unit investment cost is C u n i t c a p = 1377 USD / kWh .
C c a p = ( η d e p c a p + η r u n c a p ) C u n i t c a p E S C
Formula (55) shows the PV equipment daily cost C P V . The depreciation cost ratio is η d e p P V = 0.005 % , the operation and maintenance cost ratio is η r u n P V = 0.001 % , the unit investment cost is C u n i t P V = 578.5 USD / kW , and P i n s P V is the PV installed capacity.
C P V = ( η d e p P V + η r u n P V ) C u n i t P V P i n s P V
Formula (56) shows the energy storage battery daily cost C B a t t e r y . The depreciation cost ratio is η d e p B a t t e r y = 0.005 % , the operation and maintenance cost ratio is η r u n B a t t e r y = 0.001 % , the unit investment cost is C u n i t B a t t e r y = 68.9 USD / kWh , and P max B a is the maximum energy storage of the battery.
C B a t t e r y = ( η d e p B a t t e r y + η r u n B a t t e r y ) C u n i t B a t t e r y P max B a
Formula (57) shows the fuel cell daily cost C F C . The depreciation cost ratio is η d e p F C = 0.01 % , the operation and maintenance cost ratio is η r u n F C = 0.002 % , and the unit investment cost is C u n i t F C = 626.7 USD / kW .
C F C = ( η d e p F C + η r u n F C ) C u n i t F C P max F C , O U T
The total daily operating cost of the hydrogen refueling station is calculated using Formulas (58)–(61). C D a y is the hydrogen refueling station total daily cost. C D a y , e q u represents the equipment daily cost and C D a y , e l e is the daily electricity cost of the station. C b u y is the cost of purchasing electricity, with its unit price determined by the time-of-use electricity price C t e l e . C t a b d is the cost of curtailed renewable energy, set at 137.7 USD/kWh to maximize the utilization rate of renewable energy and reduce the amount of electricity purchased. C t F C is the revenue from selling electricity generated by the fuel cell. Excess hydrogen is consumed by the fuel cell, and the electricity produced is sold to the grid at a price of 0.04 USD/kWh.
C b u y = t = 1 T [ ( P t A E + P t P E M + P t p r e s s P t P V ) C t e l e ] P t A E + P t P E M + P t p r e s s > P t P V
C D a y , e q u = C A E + C P E M + C H S T + C p r e s s + C c a p + C P V + C B a t t e r y + C F C
C D a y , e l e = t = 1 T ( C t b u y + C t a b d ) C F C , s e l l
C D a y = C D a y , e q u + C D a y , e l e
M i n i m i z e ( C D a y )

3.6. Hydrogen Fuel Cell Operation Scheme

Hydrogen fuel cells utilize excess hydrogen fuel generated within a day to produce electricity, and the stable power generated is sold to the grid. The total amount of electricity sold by the hydrogen fuel cells in a day is as shown in Formula (63), where M e x , H 2 is the mass of excess hydrogen, L H 2 is the lower heating value of hydrogen (33.6 kWh/kg), C S e l l , e l e is the electricity selling price, taken as 0.04 USD/kWh, and C F C is the daily profit from electricity sales.
t = 1 T P t F C , O U T = t = 1 T ( M t e x , H 2 L H 2 Q t b , w )
C F C , s e l l = t = 1 T P t F C , O U T C S e l l , e l e

4. Case Study

The photovoltaic (PV) system of this hydrogen refueling station has a peak power capacity of 2.5 MW. The system is equipped with monocrystalline silicon photovoltaic panels, which are known for their high efficiency and durability. The panels are installed using a fixed-tilt mounting system, oriented towards the south with an azimuth angle of 180 degrees to maximize solar energy capture. The system utilizes 10 central inverters, each with a capacity of 250 kW, to convert the generated DC power into AC power for grid integration. The inverters are selected for their high efficiency and reliability, ensuring optimal performance under varying weather conditions.
The PV generation data for the hydrogen refueling station in the case study is referenced from a PV power station in Northwest China. The hydrogen refueling load of the station is equivalently derived from the electric vehicle charging load in a city in China [44]. The specific prices of the time-of-use electricity tariffs are based on the real electricity prices in a city in western China [45]. The time resolution for the operational decision-making of the hydrogen refueling station in the case study is 15 min. The simulation environment used for the program in this study is MATLAB version R2021b, with a CPU of 12th Gen Intel(R) Core(TM) i7-12700H and 16 GB of RAM. The CPLEX solver is employed to solve the model.

4.1. Data Preparation

The specific data of time-of-use electricity prices are shown in Table 1.
In addition, the example references PV power generation data from the northwestern region as the PV system power generation data for the hydrogen refueling station. Figure 2 displays the PV power generation data after high-frequency component filtering using a capacitor alongside the original PV power generation data. Moreover, the variance of the PV power generation curve after filtration is reduced by 0.02.
The system is influenced by solar irradiance and fluctuations in solar intensity can significantly impact the output of the photovoltaic (PV) power generation system. The severe fluctuations in PV output are mitigated by capacitors, while excessively high or low output is regulated by the energy storage battery.
The study case uses electric vehicle (EV) charging data from a city in China to approximate hydrogen refueling data. A similar method was employed in Ref. [46] to obtain hydrogen refueling loads. Here, P t E l o a d represents the charging load of electric vehicles, η E c a r is the energy consumption rate of electric vehicles (the energy required for an EV to travel 100 km, e.g., 15.4 kWh/100 km for the Model Y), η H c a r is the energy consumption rate of hydrogen fuel cell vehicles (e.g., 1.08 kg/100 km for the Toyota Mira), and M t L o a d is the equivalent hydrogen refueling load. Thus, Equation (65) converts the charging loads of 233 EV charging stations into equivalent hydrogen refueling loads for 233 hydrogen refueling stations.
M t L o a d η H c a r = P t E l o a d η E c a r
Due to the large volume of equivalent hydrogen refueling load data, the example uses the DBSCAN algorithm to cluster the equivalent hydrogen refueling load curves, resulting in eight typical hydrogen refueling station load curves. Figure 3 shows the daily hydrogen refueling load curves for these eight typical hydrogen refueling stations.
For hydrogen refueling stations with high refueling loads (Stations 2 and 8) and those with low refueling loads (Stations 4, 5, and 7), their refueling load curves are less affected by temporal factors. In other words, their refueling load curves do not exhibit significant variations over time, as these stations are located in areas with relatively stable population dynamics. On the other hand, for stations with moderate refueling loads (Stations 1, 3, 5, and 6), their refueling load fluctuations are more pronounced over time. These stations are situated in areas with significant population mobility and their refueling loads are heavily influenced by time-varying traffic flow, leading to noticeable fluctuations in their refueling curves.

4.2. Equipment Sizing Results

In the case study, the eight hydrogen refueling stations are powered by their respective PV generation systems. To avoid the risk of large-scale hydrogen storage tank leaks, each station uses multiple small hydrogen storage tanks. Considering the precision limitations of hydrogen storage tank manufacturing, the volume of a single small hydrogen storage tank is set to 5 m3. Due to land use constraints at the hydrogen refueling stations, the rated installed capacity of the PV generation equipment is set to 2.5 MW per station. Additionally, since Station 4 cannot fully utilize excess PV generation, the penalty for curtailment during its operation is eliminated.
Taking Station 1 as an example, three electrolyzer configuration schemes are designed in Table 2. Scheme 1 employs AE for hydrogen production, Scheme 2 uses PEM electrolyzers, and Scheme 3 combines both AE and PEM electrolyzers for hydrogen production. The example uses CPLEX to solve the sizing results for the three schemes, and the costs of each scheme are shown in Table 2. The results indicate that Scheme 3 has the lowest total annual cost, followed by Scheme 1.
From the capacity determination results in Table 2, it can be observed that the hydrogen production equipment in Scheme 1 has the largest capacity. To accommodate the highly fluctuating photovoltaic (PV) power generation, the capacity of Scheme 1 is 14.8% larger than that of Scheme 3. As a result, the initial investment cost of Scheme 1 is 6.1% higher than that of Scheme 3. Additionally, Scheme 2 employs a full PEM (Proton Exchange Membrane) hydrogen production system, which has a faster response speed and a wider power operating range. Therefore, the installed capacity of the hydrogen production equipment in Scheme 2 is 8.4% smaller than that of Scheme 3. However, due to the high operating costs associated with PEM hydrogen production, the daily operating cost of Scheme 2 is 35.4% higher than that of Scheme 3.
Overall, Scheme 3 has the lowest initial investment cost, while also maintaining relatively low daily operating costs. Consequently, the total annual cost of Scheme 3 is 4.3% and 5.9% lower than that of Scheme 1 and Scheme 2, respectively.
Table 3 and Table 4 present the final equipment sizing results for the eight typical hydrogen refueling stations based on Scheme 3.
We can observe that hydrogen refueling stations equipped with large-capacity hydrogen production systems require smaller hydrogen storage tanks, whereas stations with smaller hydrogen production capacities need larger storage tanks. This is because, under the condition that each station generates the same amount of photovoltaic (PV) power, stations with lower refueling loads require larger containers to store the hydrogen produced from PV power. In contrast, stations with higher refueling loads can rapidly consume hydrogen fuel, reducing the need for hydrogen storage and consequently decreasing the required volume of storage tanks. Additionally, refueling stations with sufficiently large AE and PEM capacities can absorb the peak output of PV power generation, thereby requiring smaller or even no energy storage batteries.

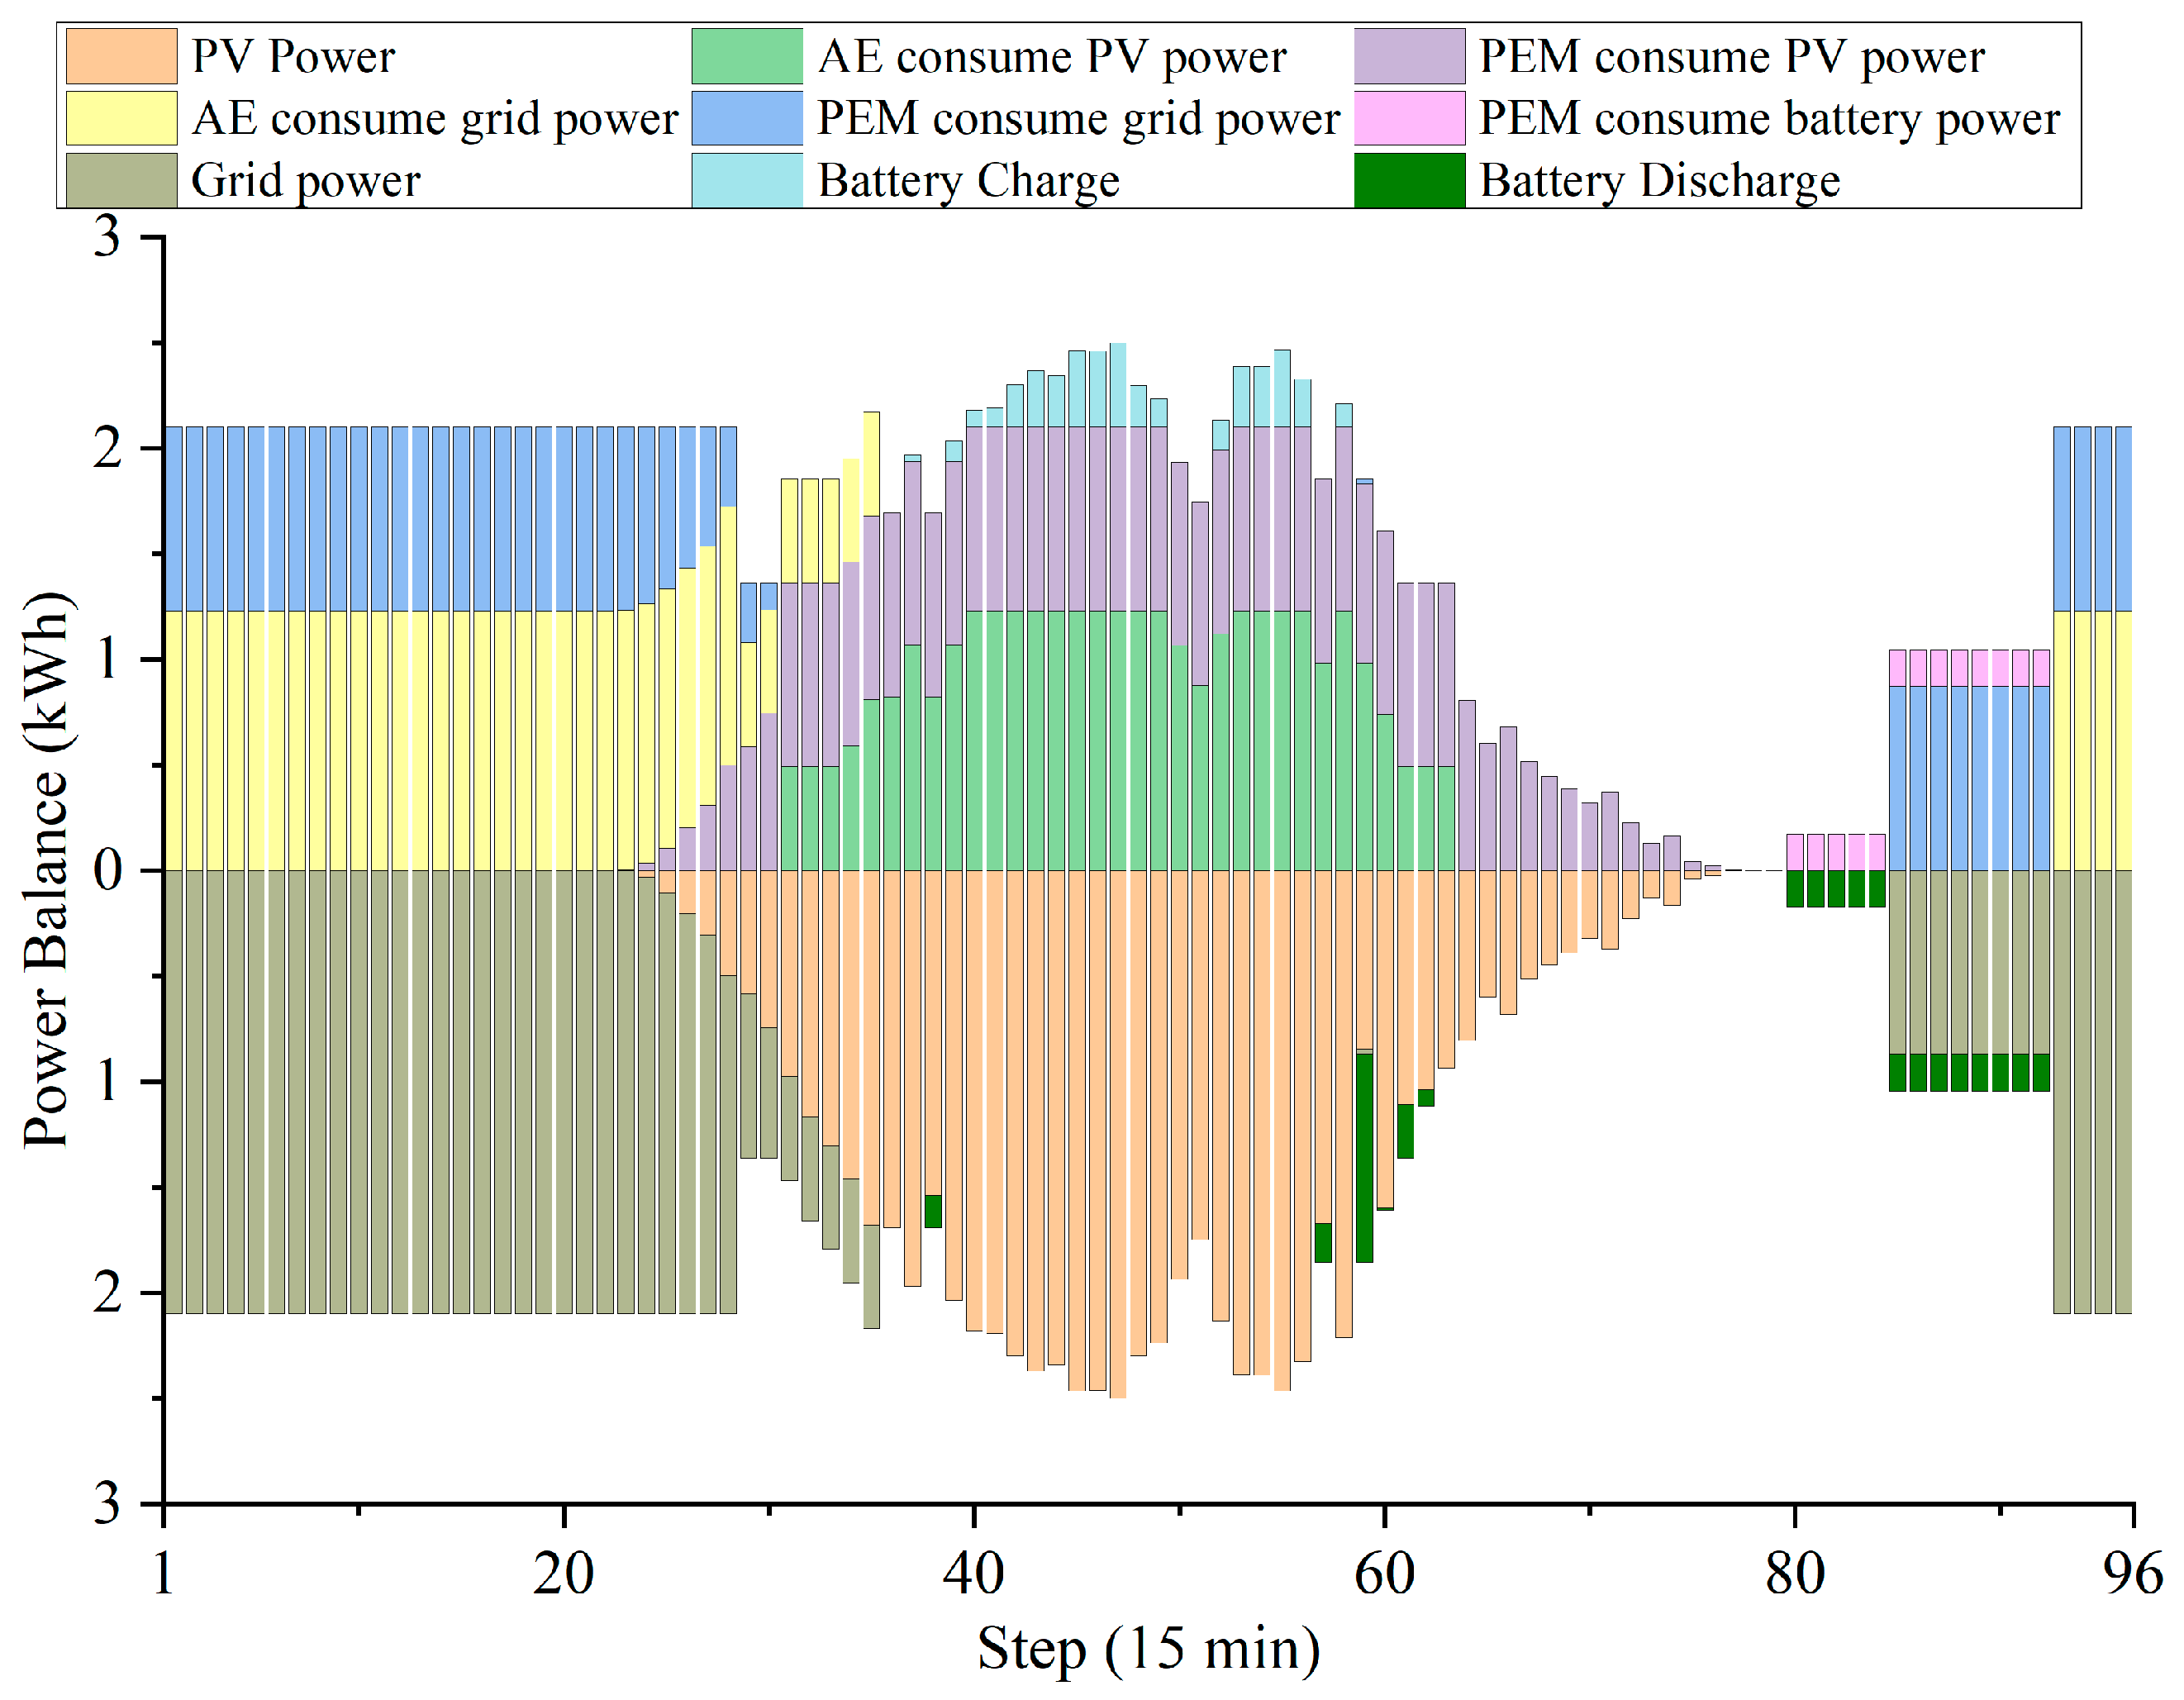
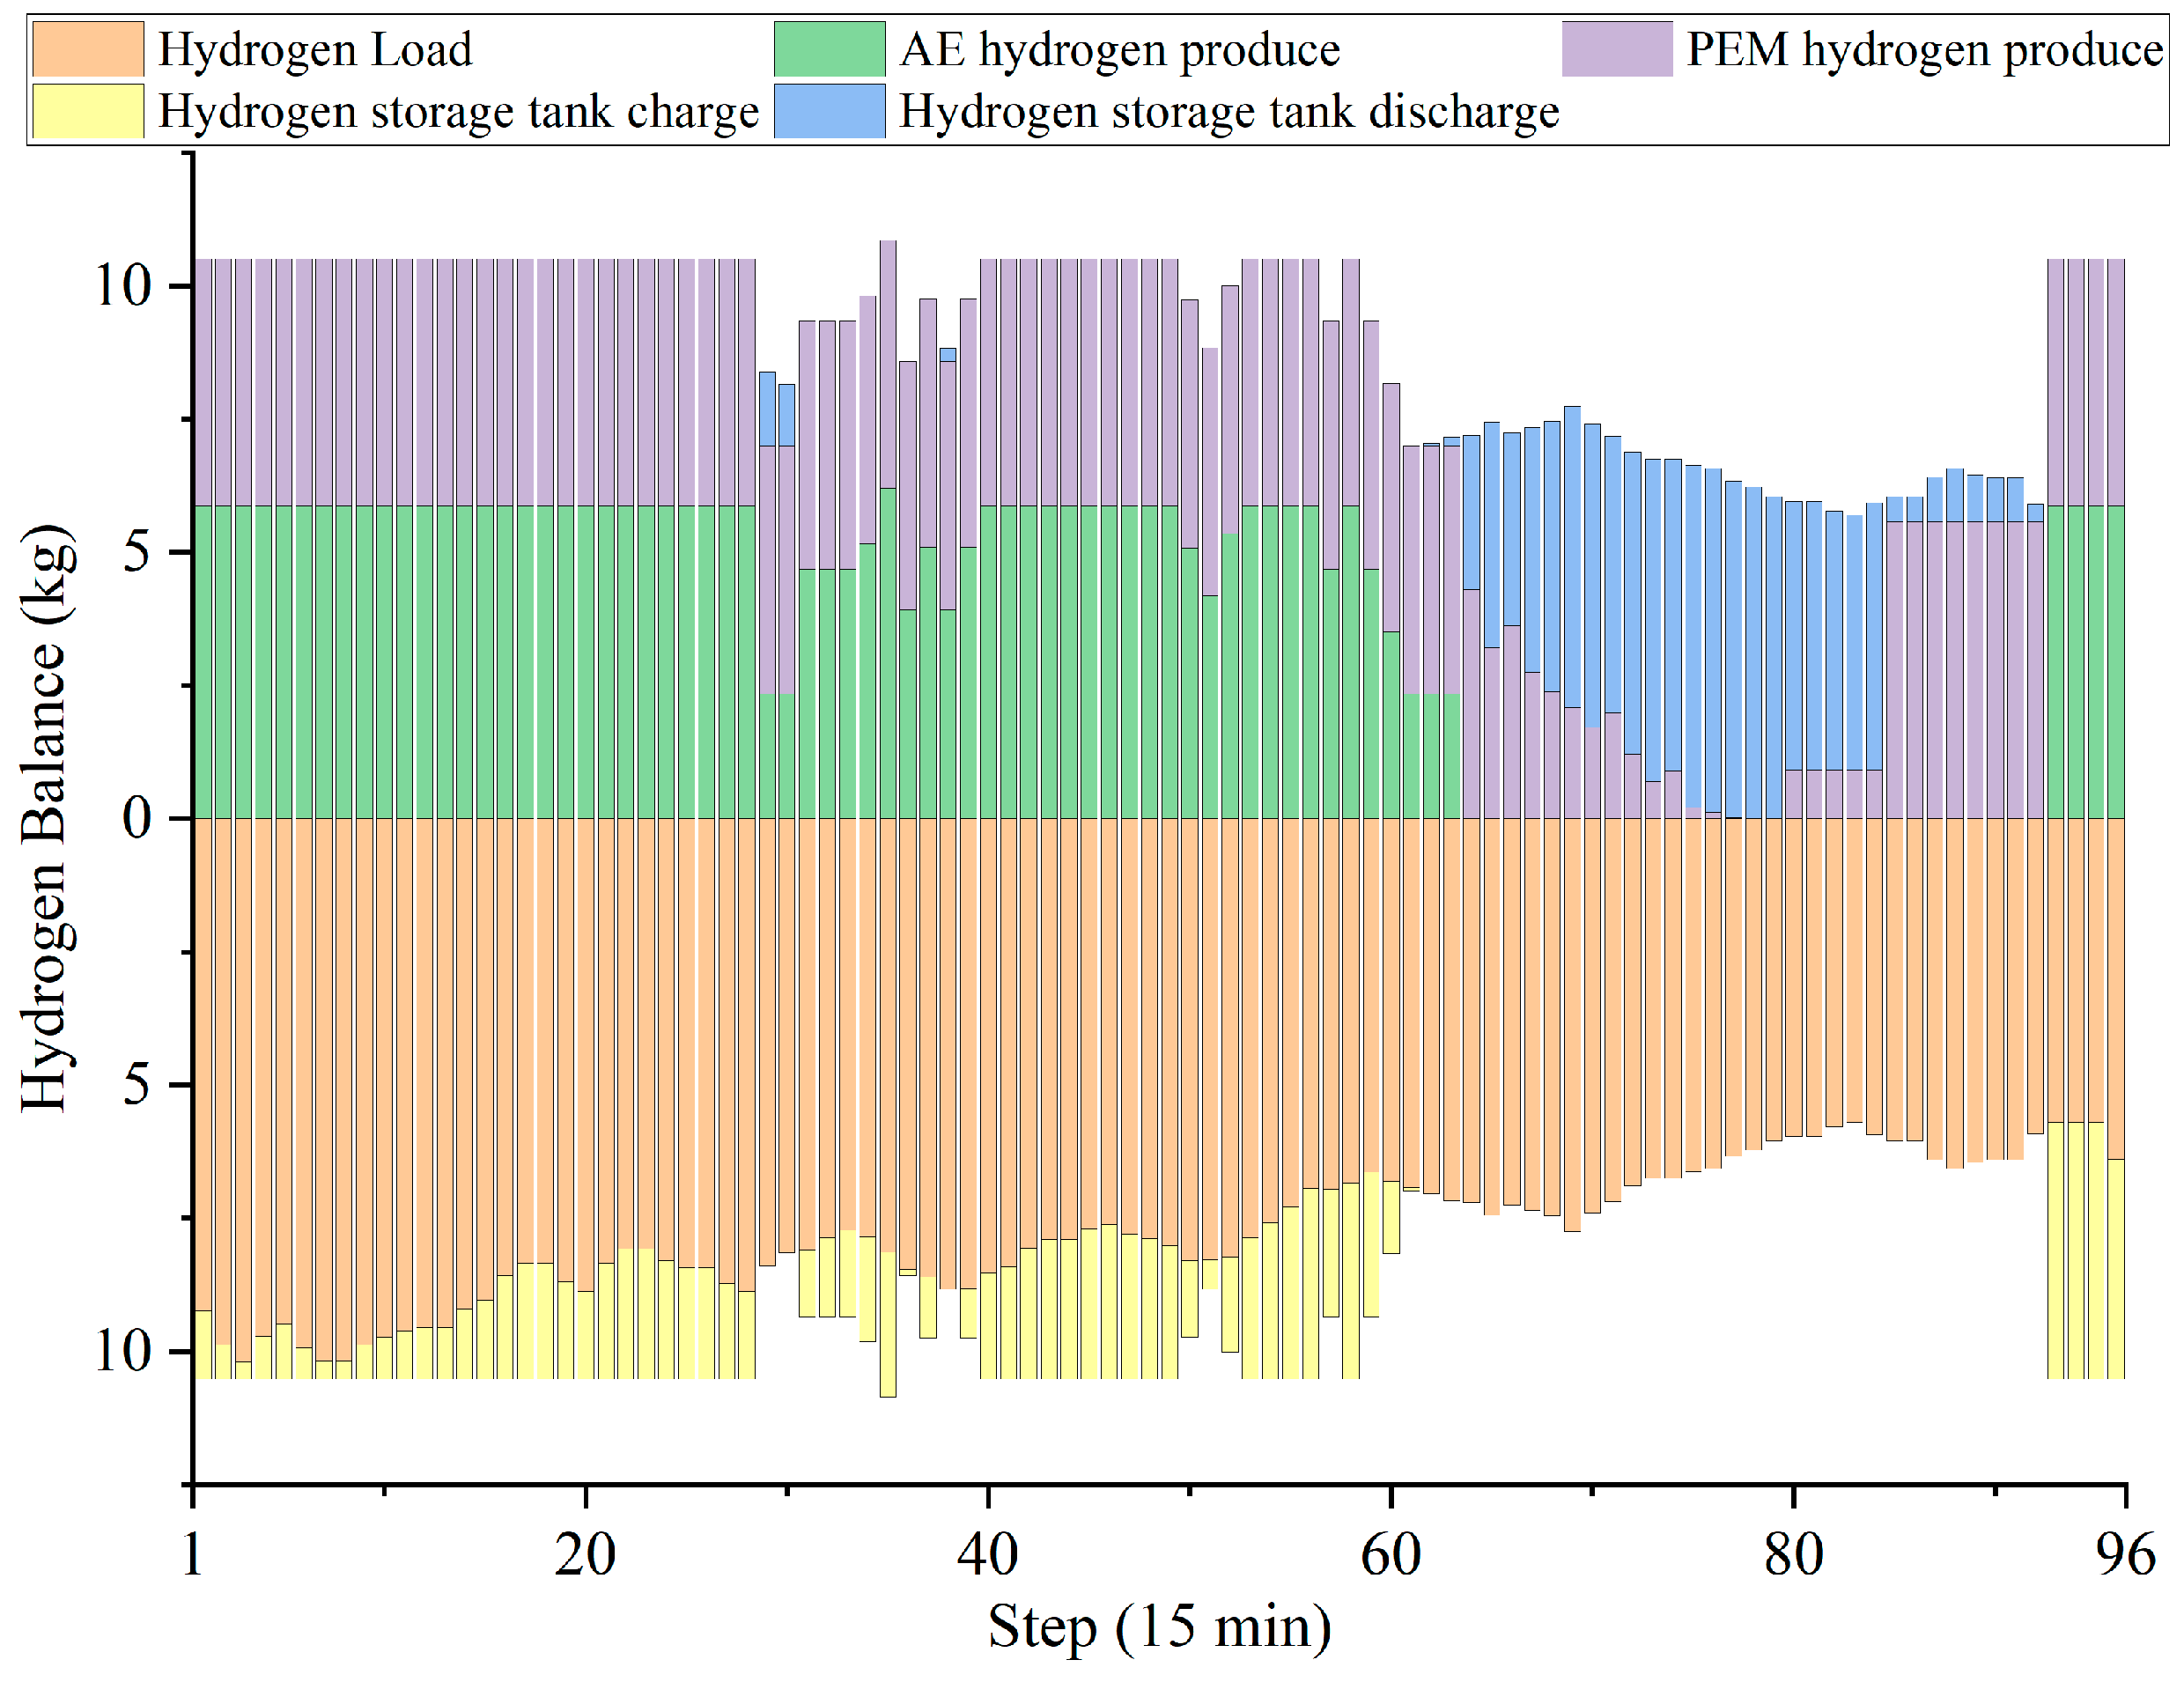
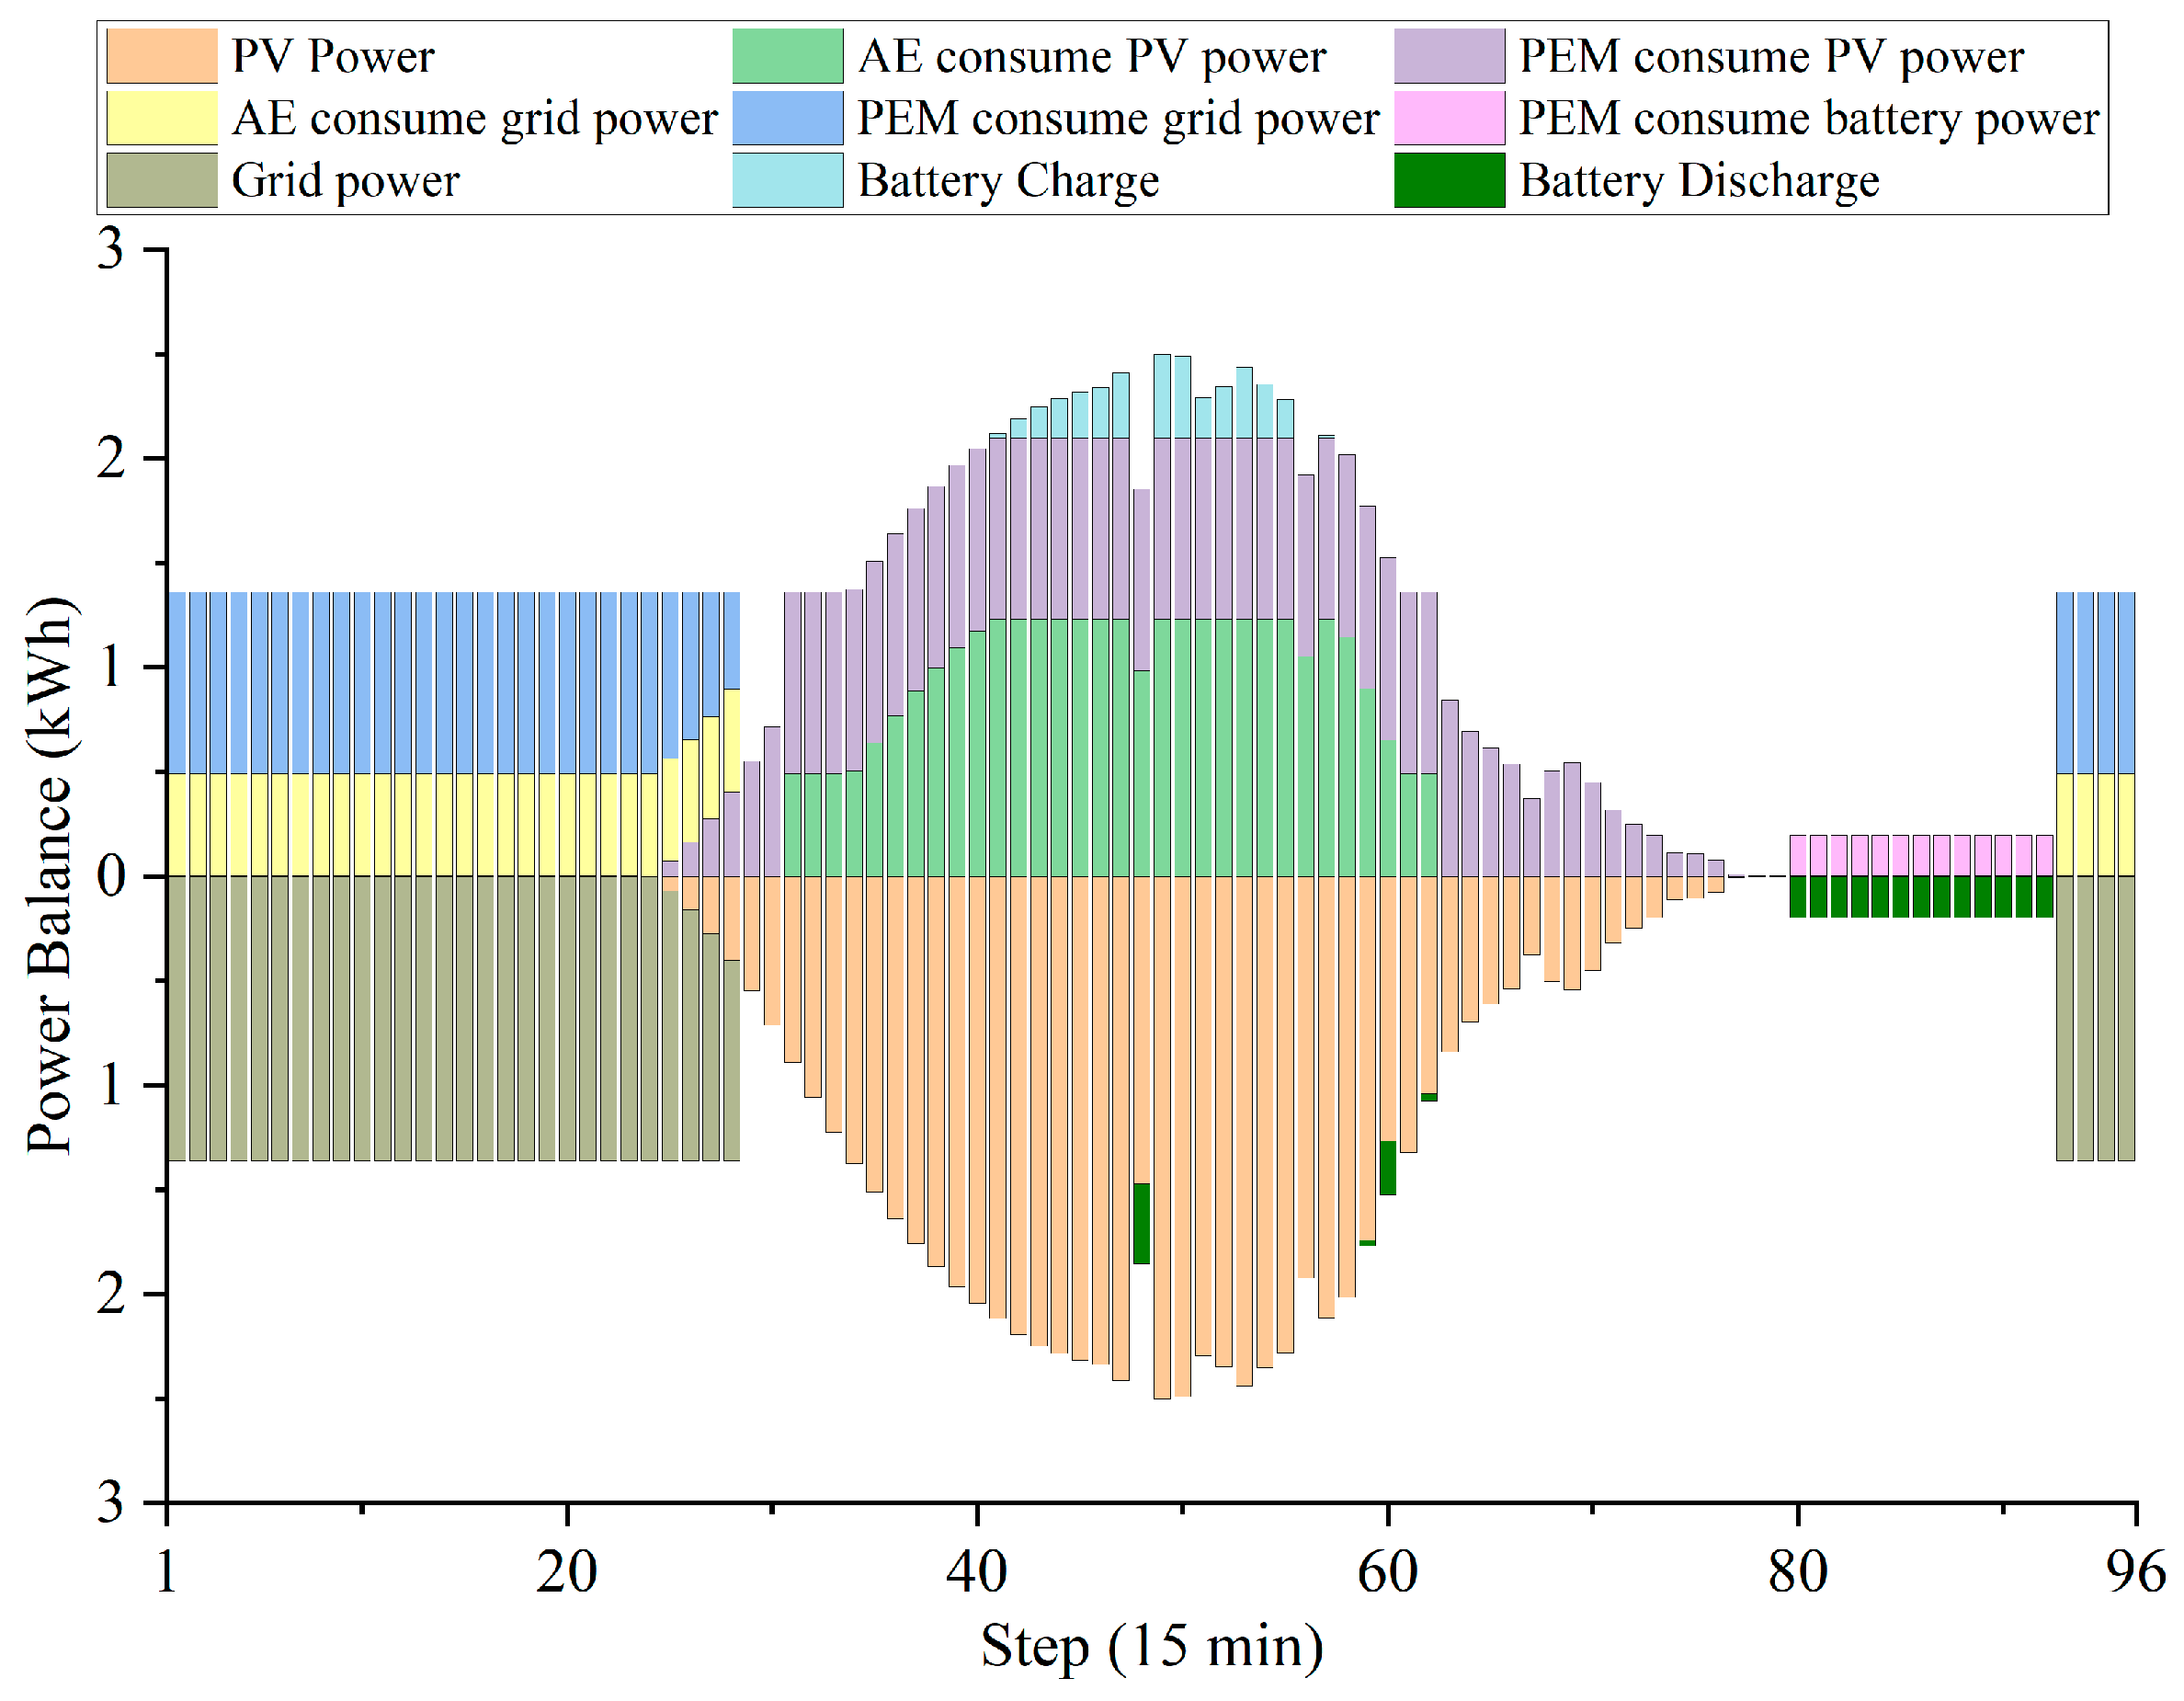
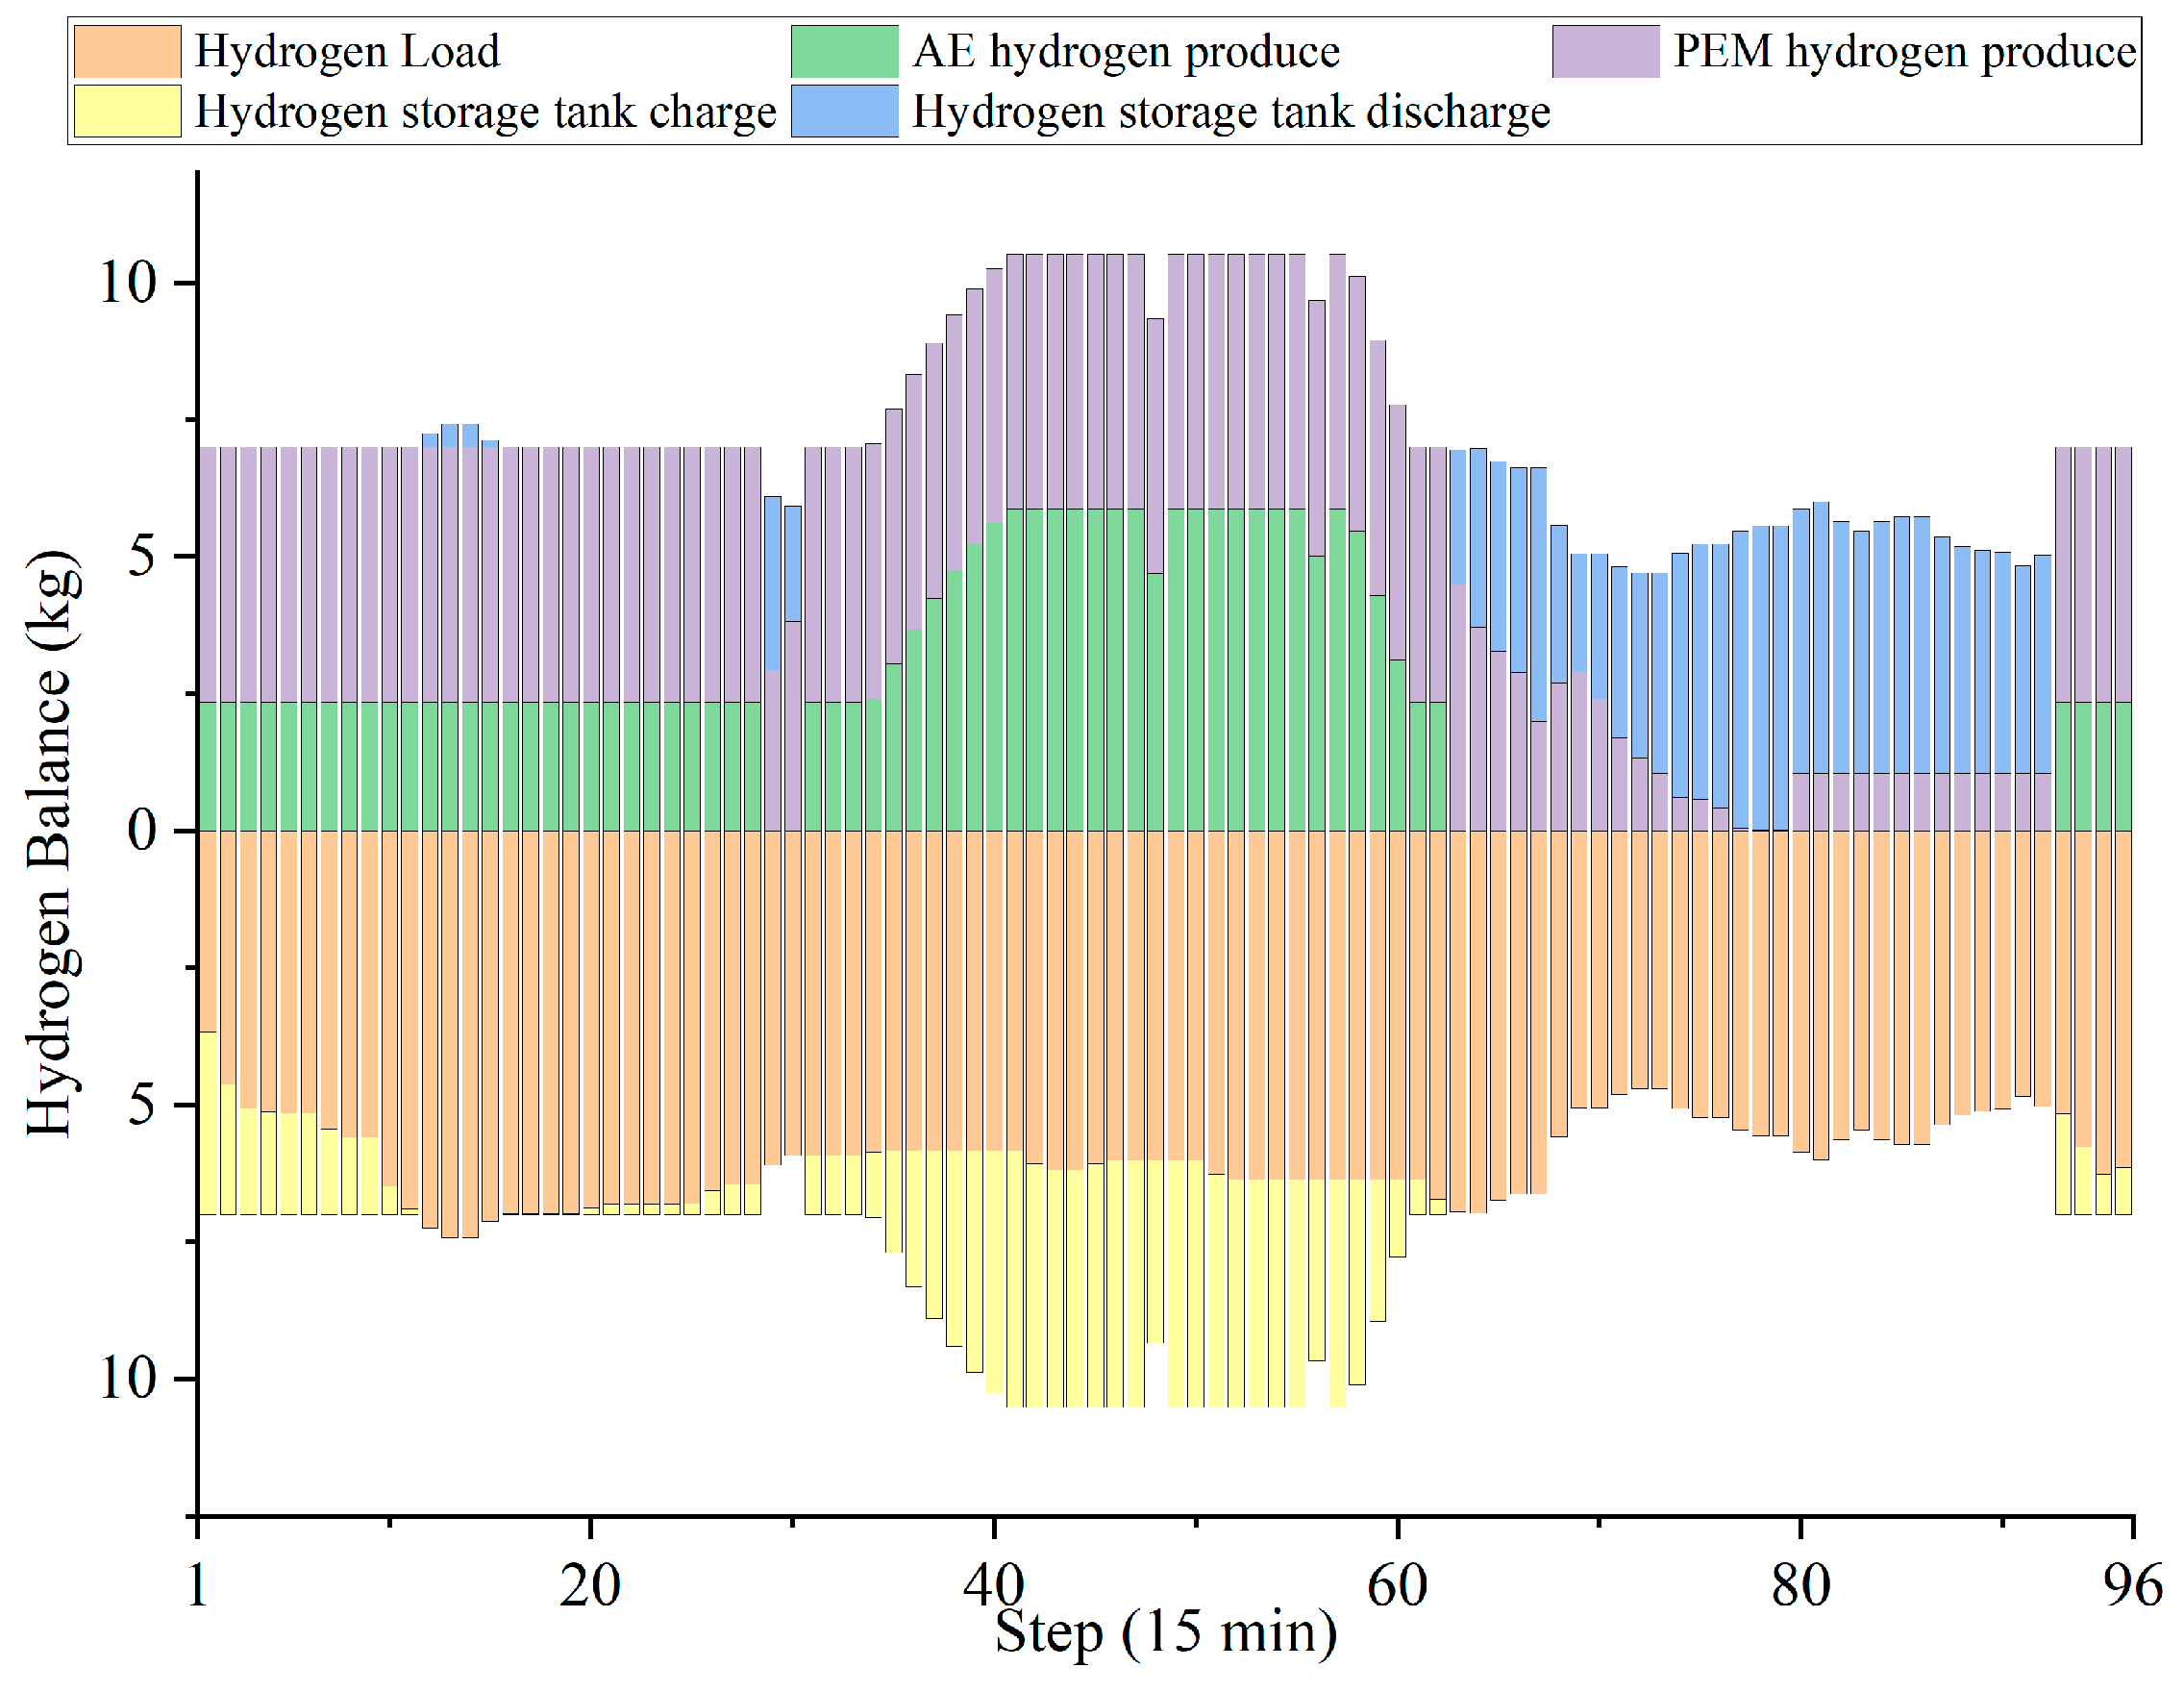
4.3. Operation Results

Section 4.3 uses Hydrogen Refueling Station 1 as an example to primarily demonstrate the optimal operation results obtained by CPLEX. The pseudocode in Appendix A briefly illustrates the basic logic that CPLEX follows. The example presents the operation results of the station for three typical days. Table 5 shows the electricity consumption results for the three typical days, while Figure 4, Figure 5, Figure 6, Figure 7, Figure 8 and Figure 9 illustrate the specific results of the station’s electricity balance and hydrogen fuel supply balance.
On Typical Day 1, 2, and 3, the PV system provided 69.16 MWh, 68.69 MWh, and 69.23 MWh of electricity, respectively. The hydrogen refueling loads for Typical Day 1, 2, and 3 were 743 kg, 574 kg, and 324 kg, respectively. As a result, the proportion of electricity used for hydrogen production from the PV system increased sequentially from Typical Day 1 to 3.
In Figure 4, the energy storage battery discharges to compensate for extreme fluctuations in PV generation, smoothing the PV power generation curve. During peak PV generation periods, the electrolyzers are insufficient to consume all the PV-generated electricity. At this time, the excess PV generation is stored in the energy storage battery. Thus, the energy storage battery plays a role in peak shaving and valley filling for PV generation. During time steps 25 to 75, the power of the AE remains relatively stable, while the PEM electrolyzer is responsible for handling the highly fluctuating PV generation. The combined operation of the AE-PEM electrolyzers and the energy storage battery effectively consumes almost all the PV generation. Additionally, since the total PV generation is less than the electricity required for a full day of hydrogen production, the electrolyzers also utilize grid electricity during low-price periods and stored energy from the battery for hydrogen production.
In Figure 5 the hydrogen storage tanks store hydrogen during low-price electricity periods and peak PV generation periods. They supply hydrogen to fuel cell vehicles during periods without PV generation and high electricity prices. Therefore, it can be concluded that the primary role of the hydrogen storage tanks is to shift the hydrogen refueling load, transferring the load from high-operating-cost periods to low-operating-cost periods, ultimately reducing operating costs.
Figure 6 and Figure 7 present the operation results for Typical Day 2. Compared to Typical Day 1, the hydrogen refueling load on Typical Day 2 is lower, resulting in reduced reliance on grid electricity by the hydrogen refueling station.
From Figure 5, it can be observed that compared to Typical Day 1, the photovoltaic (PV) power generation trend in Typical Day 2 does not change significantly, but the daily hydrogen refueling load shows a noticeable decrease. This indicates that the hydrogen production at the refueling station has reduced its reliance on grid electricity, with a decrease of approximately 25% in grid electricity usage compared to Typical Day 1. The PV power generation accounts for about 60% of the total electricity used for hydrogen production. From Figure 7, it can be seen that, compared to Typical Day 1, the hydrogen production activities in Typical Day 2 are primarily concentrated during periods of high PV output. During high electricity price periods, the refueling station mainly relies on the hydrogen storage tank to supply hydrogen fuel to users.
Figure 8 and Figure 9 display the operation results for Typical Day 3. The results show that the total PV output is fully capable of meeting the hydrogen production demand, so the electrolyzers do not need to use grid electricity for hydrogen production. However, the hydrogen production period is overly concentrated during the peak PV generation hours, and the hydrogen storage tank transfers approximately 50% of the hydrogen produced during these peak hours to other periods of hydrogen usage. Moreover, even after fully satisfying the hydrogen fuel supply, there is still an excess of hydrogen fuel. The mass of hydrogen sold is 4.7 kg. The surplus hydrogen fuel is converted into stable electricity using a hydrogen fuel cell and sold to the grid.
At present, on-site hydrogen refueling stations predominantly use pure alkaline electrolyzer (AE) systems for hydrogen production. Compared to the AE-PEM (Proton Exchange Membrane) hybrid hydrogen production system, the pure AE system consumes significantly more electricity in Typical Day 1. Specifically, the pure AE system consumes 38,903 kWh, 30,054 kWh, and 18,744 kWh of electricity in Typical Day 1, Typical Day 2, and Typical Day 3, respectively. Therefore, the AE-PEM hybrid hydrogen production system demonstrates higher electricity efficiency, reducing electricity consumption by 5%, 6%, and 5.8% in the three typical days, respectively.
In general, the advantages and differences of this paper compared with other papers are shown in Table 6: In general, the advantages and differences of this paper compared with other papers are shown in Table 6:

5. Conclusions

This study addresses the challenge of integrating large-scale fluctuating photovoltaic (PV) power generation into hydrogen refueling stations by proposing a novel sizing and operation strategy for hydrogen refueling stations utilizing a hybrid alkaline electrolyzer (AE) and Proton Exchange Membrane Electrolyzer (PEM) hydrogen production system. The proposed model, which includes AE, PEM, compressors, hydrogen storage tanks, capacitors, hydrogen fuel cells, and energy storage batteries, is designed to maximize the utilization of highly fluctuating PV power generation while meeting the hydrogen refueling demands of fuel cell vehicles.
The key findings of this study are as follows:
  • Hybrid AE-PEM hydrogen production: The hybrid approach leverages the low cost of an AE and the rapid response of a PEM to better adapt to PV power fluctuations. This combination mitigates the high investment cost of the PEM and the slow dynamic response of the AE, resulting in a more efficient and cost-effective hydrogen production system.
  • Operational strategy: The proposed operational strategy uses capacitors to filter high-frequency components of PV power generation and energy storage batteries to perform peak shaving and valley filling on the low-frequency PV output curve. This enables the electrolyzers to operate more steadily, improving hydrogen production efficiency and extending the lifespan of the equipment.
  • Cost savings: The case study demonstrates that the hybrid AE-PEM hydrogen production mode can fully utilize all PV power generation while significantly reducing annual costs. Specifically, the annual cost of the hybrid hydrogen refueling station is 143,250 USD lower than that of a station using only AEs and 196,970 USD lower than that of a station using only PEM electrolyzers. This represents a cost reduction of 4.3% and 5.9%, respectively.
  • PV fluctuation mitigation: The use of capacitors and energy storage batteries reduces the variance of PV power output by approximately 0.02, enabling more stable operation of the electrolyzers.
While this study demonstrates the effectiveness of the hybrid AE-PEM hydrogen production system, further research could explore the integration of other advanced electrolysis technologies, such as anion exchange membrane (AEM) electrolyzers, which may offer additional cost and efficiency benefits. Additionally, the impact of larger-scale renewable energy integration and the potential for grid services, such as peak shaving and load leveling, could be investigated to further enhance the economic and operational viability of hydrogen refueling stations.
In conclusion, the proposed hybrid AE-PEM hydrogen production system, combined with the innovative operational strategy, provides a promising solution for integrating fluctuating renewable energy into hydrogen refueling stations while achieving significant cost savings and operational stability. This approach contributes to the development of sustainable hydrogen infrastructure and supports the global transition to clean energy.

Author Contributions

Conceptualization, Z.Y. and Y.F.; methodology, Z.Y.; software, Z.Y.; validation, Z.Y., Y.F. and J.H.; data curation, Z.Y.; writing—original draft preparation, Z.Y.; writing—review and editing, Y.F., J.H.; visualization, J.H.; supervision, Y.F.; project administration, Y.F.; funding acquisition, Y.F. All authors have read and agreed to the published version of the manuscript.

Funding

This research was funded by the Tianshan Talent Training Program (2022TSYCLJ0019).

Data Availability Statement

The data are contained within the article.

Conflicts of Interest

The authors declare that this study was conducted without any commercial or financial relationships that could be considered potential conflicts of interest. The authors declare that there are no other conflicts of interest that could affect the objectivity and integrity of the study design, data collection, analysis, or interpretation, nor the writing of the manuscript or the decision to publish the results.

Appendix A

START
// Initialize components and parameters
Initialize AE (alkaline electrolyzer)
Initialize PEM (Proton Exchange Membrane) electrolyzer
Initialize Compressor
Initialize HydrogenStorageTank
Initialize Capacitor
Initialize HydrogenFuelCell
Initialize EnergyStorageBattery
Initialize PLC (Programmable Logic Controller)

// Main loop for hydrogen refueling station operation
WHILE TRUE DO
// Step 1: Monitor power sources (photovoltaic, grid, battery)
IF PhotovoltaicPower > 0 THEN
PowerSource = PhotovoltaicPower
FilterHighFrequencyComponents(PowerSource, Capacitor)
ELSE IF GridPower > 0 THEN
PowerSource = GridPower
ELSE
PowerSource = EnergyStorageBattery.Discharge()
END IF

// Step 2: AE and PEM hydrogen production
IF PowerSource > 0 THEN
// AE hydrogen production
IF AE.StartupTime ≥ 1 h AND AE.ShutdownTime ≥ several minutes THEN
AE.PowerConsumption = CalculateAEPowerConsumption(PowerSource)
IF AE.PowerConsumption ≥ 0.4 × AE.RatedPower AND AE.PowerConsumption ≤ 1.1 × AE.RatedPower THEN
AE.HydrogenProduction = CalculateAEHydrogenProduction(AE.PowerConsumption)
HydrogenStorageTank.Store(AE.HydrogenProduction)
END IF
END IF

// PEM hydrogen production
IF PEM.StartupTime ≥ 5 min AND PEM.ShutdownTime ≥ 1 min THEN
PEM.PowerConsumption = CalculatePEMPowerConsumption(PowerSource)
IF PEM.PowerConsumption ≥ 0.1 × PEM.RatedPower AND PEM.PowerConsumption ≤ 1.2 × PEM.RatedPower THEN
PEM.HydrogenProduction = CalculatePEMHydrogenProduction(PEM.PowerConsumption)
HydrogenStorageTank.Store(PEM.HydrogenProduction)
END IF
END IF
END IF

// Step 3: Compress and store hydrogen
IF HydrogenStorageTank.HydrogenMass > Compressor.Threshold THEN
CompressedHydrogen = Compressor.Compress(HydrogenStorageTank.HydrogenMass)
HydrogenStorageTank.Store(CompressedHydrogen)
END IF

// Step 4: Dispense hydrogen to users or fuel cell
IF HydrogenDemand > 0 THEN
IF HydrogenStorageTank.HydrogenMass > HydrogenDemand THEN
DispenseHydrogen(HydrogenDemand)
ELSE
PRINT “Insufficient hydrogen in storage tank”
END IF
ELSE
ExcessHydrogen = HydrogenStorageTank.HydrogenMass − HydrogenStorageTank.Capacity
IF ExcessHydrogen > 0 THEN
HydrogenFuelCell.GenerateElectricity(ExcessHydrogen)
END IF
END IF

// Step 5: Monitor and control system via PLC
PLC.Monitor(AE, PEM, Compressor, HydrogenStorageTank, Capacitor, HydrogenFuelCell, EnergyStorageBattery)
END WHILE
END

References

  1. Blanchette, S. A hydrogen economy and its impact on the world as we know it. Energy Policy 2008, 36, 522–530. [Google Scholar] [CrossRef]
  2. Muratori, M.; Bush, B.; Hunter, C.; Melaina, M.W. Modeling Hydrogen Refueling Infrastructure to Support Passenger Vehicles. Energies 2018, 11, 1171. [Google Scholar] [CrossRef]
  3. National Energy Administration. Medium and Long-Term Plan for the Development of Hydrogen Energy Industry (2021–2035). Available online: http://zfxxgk.nea.gov.cn/1310525630_16479984022991n.pdf (accessed on 3 March 2024).
  4. Federal Ministry of Transport. Building and Urban Development (BMVBS), the Mobility and Fuels Strategy of the German Government (MFS). 2013. Available online: https://www.h2euro.org/wp-content/uploads/2013/09/German-Mobility-and-Fuels-Strategy.pdf (accessed on 1 March 2024).
  5. State of California. AB-8 Alternative Fuel and Vehicletechnologies: Funding Programs. 2013. Available online: http://leginfo.legislature.ca.gov/faces/billTextClient.xhtml?bill_id=201320140AB8 (accessed on 1 March 2024).
  6. Aki, H.; Sugimoto, I.; Sugai, T. Optimal operation of a photovoltaic generation-powered hydrogen production system at a hydrogen refueling station. Int. J. Hydrogen Energy 2018, 43, 14892–14904. [Google Scholar] [CrossRef]
  7. Bartolucci, L.; Cordiner, S.; Mulone, V.; Pasquale, S. Hydrogen based multi energy systems: Assessment of the marginal utility of increasing hydrogen penetration on system performances. Int. J. Hydrogen Energy 2021, 46, 38588e602. [Google Scholar] [CrossRef]
  8. Al-Sharafi, A.; Al-Buraiki, A.S.; Al-Sulaiman, F.; Antar, M.A. Hydrogen refueling stations powered by hybrid PV/wind renewable energy systems: Techno-socio-economic assessment. Energy Convers. Manag. X 2024, 22, 100584. [Google Scholar] [CrossRef]
  9. Micena, R.P.; Llerena-Pizarro, O.R.; de Souza, T.M.; Silveira, J.L. Solar-powered Hydrogen Refueling Stations: A techno-economic analysis. Int. J. Hydrogen Energy 2020, 45, 2308–2318. [Google Scholar] [CrossRef]
  10. Atabay, R.; Devrim, Y. Design and techno-economic analysis of solar energy based on-site hydrogen refueling station. Int. J. Hydrogen Energy 2024, 80, 151–160. [Google Scholar] [CrossRef]
  11. Rizk-Allah, R.M.; Hassan, I.A.; Snasel, V.; Hassanien, A.E. An optimal standalone wind-photovoltaic power plant system for green hydrogen generation: Case study for hydrogen refueling station. Results Eng. 2024, 22, 102234. [Google Scholar] [CrossRef]
  12. Hemmati, R.; Bornapour, S.M.; Saboori, H. Standalone hybrid power-hydrogen system incorporating daily-seasonal green hydrogen storage and hydrogen refueling station. Energy 2024, 295, 131122. [Google Scholar] [CrossRef]
  13. Gökçek, M.; Paltrinieri, N.; Liu, Y.; Badia, E.; Dokuz, A.Ş.; Erdoğmuş, A.; Urhan, B.B.; Yoldaş, Ö. Optimum sizing of hybrid renewable power systems for on-site hydrogen refuelling stations: Case studies from Türkiye and Spain. Int. J. Hydrogen Energy 2024, 59, 715–729. [Google Scholar] [CrossRef]
  14. Zghaibeh, M.; Belgacem, I.B.; Baloch, M.H.; Chauhdary, S.T.; Kumar, L.; Arıcı, M. Optimization of green hydrogen production in hydroelectric-photovoltaic grid connected power station. Int. J. Hydrogen Energy 2024, 52, 440–453. [Google Scholar] [CrossRef]
  15. Roslan, M.F.; Ramachandaramurthy, V.K.; Mansor, M.; Mokhzani, A.S.; Jern, K.P.; Begum, R.A.; Hannan, M.A. Techno-economic impact analysis for renewable energy-based hydrogen storage integrated grid electric vehicle charging stations in different potential locations of Malaysia. Energy Strategy Rev. 2024, 54, 101478. [Google Scholar] [CrossRef]
  16. Hajjaji, M.; Cristofari, C. Economic and technical evaluation of on-site electrolysis solar hydrogen refueling station in Corsica: A case study of Ajaccio. Renew. Energy 2024, 231, 120982. [Google Scholar] [CrossRef]
  17. Yang, Y.; Xu, X.; Luo, Y.; Liu, J.; Hu, W. Distributionally robust planning method for expressway hydrogen refueling station powered by a wind-PV system. Renew. Energy 2024, 225, 120210. [Google Scholar] [CrossRef]
  18. Bhogilla, S.S.; Niyas, H. Design of a hydrogen compressor for hydrogen fueling stations. Int. J. Hydrogen Energy 2019, 44, 29329–29337. [Google Scholar] [CrossRef]
  19. Specklin, M.; Deligant, M.; Sapin, P.; Solis, M.; Wagner, M.; Markides, C.N.; Bakir, F. Numerical study of a liquid-piston compressor system for hydrogen applications. Appl. Therm. Eng. 2022, 216, 118946. [Google Scholar] [CrossRef]
  20. Ruffio, E.; Saury, D.; Petit, D. Thermodynamic analysis of hydrogen tank filling. effects of heat losses and filling rate optimization. Int. J. Hydrogen Energy 2014, 39, 12701–12714. [Google Scholar] [CrossRef]
  21. Xiao, J.; Benard, P.; Chahine, R. Estimation of final hydrogen temperature from refueling parameters. Int. J. Hydrogen Energy 2017, 42, 7521–7528. [Google Scholar] [CrossRef]
  22. Zhao, L.; Brouwer, J. Dynamic operation and feasibility study of a self-sustainable hydrogen fueling station using renewable energy sources. Int. J. Hydrogen Energy 2015, 40, 3822–3837. [Google Scholar] [CrossRef]
  23. Cardona, P.; Costa-Castelló, R.; Roda, V. Modelling and operation strategy approaches for on-site Hydrogen Refuelling Stations. Int. J. Hydrogen Energy 2024, 52, 49–64. [Google Scholar] [CrossRef]
  24. Bartolucci, L.; Cordiner, S.; Mulone, V. Multi-hub hydrogen refueling station with on-site and centralized production. Int. J. Hydrogen Energy 2023, 48, 20861–20874. [Google Scholar] [CrossRef]
  25. Yang, D.; Xia, X.; Mayer, M.J. A Tutorial Review of the Solar Power Curve: Regressions, Model Chains, and Their Hybridization and Probabilistic Extensions. Adv. Atmos. Sci. 2024, 41, 1023–1067. [Google Scholar] [CrossRef]
  26. Kreuwel, F.P.; Knap, W.H.; Visser, L.R.; van Sark, W.G.; de Arellano, J.V.G.; van Heerwaarden, C.C. Analysis of high frequency photovoltaic solar energy fluctuations. Sol. Energy 2020, 206, 381–389. [Google Scholar] [CrossRef]
  27. Zou, H.; Du, H.; Brown, M.A.; Mao, G. Large-scale PV power generation in China: A grid parity and techno-economic analysis. Energy 2017, 134, 256–268. [Google Scholar] [CrossRef]
  28. Shivashankar, S.; Mekhilef, S.; Mokhlis, H.; Karimi, M. Mitigating methods of power fluctuation of photovoltaic (PV) sources—A review. Renew. Sustain. Energy Rev. 2016, 59, 1170–1184. [Google Scholar] [CrossRef]
  29. McCarty, J.; Waibel, C.; Leow, S.W.; Schlueter, A. Solar energy in the city: Data-driven review on urban photovoltaics. Renew. Sustain. Energy Rev. 2025, 211, 115326. [Google Scholar] [CrossRef]
  30. Ge, L.; Cui, Q.; Li, M.; Yao, F.; Yang, X.; Du, T. Review on water electrolysis for hydrogen production powered by fluctuating wind power and PV. Integr. Intell. Energy 2022, 44, 1–14. Available online: https://lutpub.lut.fi/handle/10024/104326 (accessed on 1 March 2024).
  31. Fang, R.; Liang, Y. Control strategy of electrolyzer in a wind-hydrogen system considering the constraints of switching times. Int. J. Hydrogen Energy 2019, 44, 25104–25111. [Google Scholar] [CrossRef]
  32. Varela, C.; Mostafa, M.; Zondervan, E. Modeling alkaline water electrolysis for power-to-x applications: A scheduling approach. Int. J. Hydrogen Energy 2021, 46, 9303–9313. [Google Scholar] [CrossRef]
  33. Ghaithan, A.M.; Kondkari, M.; Mohammed, A.; Attia, A.M. Optimal design of concentrated solar power-based hydrogen refueling station: Mixed integer linear programming approach. Int. J. Hydrogen Energy 2024, 86, 703–718. [Google Scholar] [CrossRef]
  34. Abdin, Z.; Webb, C.J.; Gray, E.M.A. Modelling and simulation of an alkaline electrolyser cell. Energy 2017, 138, 316–331. [Google Scholar] [CrossRef]
  35. Shen, X.; Zhang, X.; Li, G.; Lie, T.T.; Hong, L. Experimental study on the external electrical thermal and dynamic power characteristics of alkaline water electrolyzer. Int. J. Energy Res. 2018, 42, 3244–3257. [Google Scholar] [CrossRef]
  36. Yang, G.; Jiang, Y. Siting and sizing of the hydrogen refueling stations with on-site water electrolysis hydrogen production based on robust regret. Int. J. Energy Res. 2020, 44, 1–22. [Google Scholar] [CrossRef]
  37. Şahin, M.E.; Blaabjerg, F.; Sangwongwanich, A. A Comprehensive Review on Supercapacitor Applications and Developments. Energies 2022, 15, 674. [Google Scholar] [CrossRef]
  38. Acakpovi, A.; Adjei, P.; Nwulu, N.; Asabere, N.Y. Optimal hybrid renewable energy system: A comparative study of wind/hydrogen/fuel-cell and wind/battery storage. J. Electr. Comput. Eng. 2020, 2020, 1756503. [Google Scholar] [CrossRef]
  39. Sharaf, O.Z.; Orhan, M.F. An overview of fuel cell technology: Fundamentals and applications. Renew. Sustain. Energy Rev. 2014, 32, 810–853. [Google Scholar] [CrossRef]
  40. Liu, Y.; Fan, Y.; Hao, J. Capacity configuration and optimal scheduling of a wind-photovoltaic-hydrogen-thermal virtual power plant based on a wide range power adaptation strategy for an alkaline electrolyzer. Power Syst. Prot. Control 2022, 50, 48–60. [Google Scholar] [CrossRef]
  41. Yuan, T.; Wang, Z.; Wang, J.; Zhang, D.; Jiang, D. The day-ahead output plan of hydrogen production system considering the start-stop characteristics of electrolytic cell. Electr. Power 2022, 55, 101–109. [Google Scholar] [CrossRef]
  42. Abomazid, A.M.; El-Taweel, N.A.; Farag, H.E.Z. Optimal energy management of hydrogen energy facility using integrated battery energy storage and solar photovoltaic systems. IEEE Trans. Sustain. Energy 2022, 13, 1457–1468. [Google Scholar] [CrossRef]
  43. Liu, C.; Guo, W.; Kong, X.; Zhang, H.; Li, Z.; Guo, J.; Bian, W. Progress and Development Prospects of Wide-power Photovoltaic Off-grid Hydrogen Production Technology in Northwest China. J. Chin. Soc. Power Eng. 2022, 42, 762–768. [Google Scholar] [CrossRef]
  44. Qu, H.; Kuang, H.; Wang, Q.; Li, J.; You, L. A Physics-Informed and Attention-Based Graph Learning Approach for Regional Electric Vehicle Charging Demand Prediction. IEEE Trans. Intell. Transp. Syst. 2024, 25, 14284–14297. [Google Scholar] [CrossRef]
  45. Chengdu Development and Reform Commission. 17 February 2022. Chengdu Development and Reform Commission. Available online: https://cddrc.chengdu.gov.cn/cdsfzggw/c120772/2024-08/27/content_fc29b1337fd64b7ab0e098bc07b4b2a8.shtml (accessed on 1 March 2024).
  46. Cheng, W. Synergistic Planning of Photovoltaic-Storage-Charging Stations and Hydrogen Refueling Stations Considering Carbon Emission Flows. Autom. Electr. Power Syst. 2024, 48, 40–49. [Google Scholar] [CrossRef]
Figure 1. Structure of AE-PEM coupled hydrogen production.
Electronics 14 01195 g001
Figure 2. The PV power data after filtering comparing with the original PV power data.
Electronics 14 01195 g002
Figure 3. Hydrogen load curves of 8 typical hydrogen refueling stations.
Electronics 14 01195 g003
Figure 4. Electricity balance results for Typical Day 1.
Electronics 14 01195 g004
Figure 5. Hydrogen balance results for Typical Day 1.
Electronics 14 01195 g005
Figure 6. Electricity balance results for Typical Day 2.
Electronics 14 01195 g006
Figure 7. Hydrogen balance results for Typical Day 2.
Electronics 14 01195 g007
Figure 8. Electricity balance results for Typical Day 3.
Electronics 14 01195 g008
Figure 9. Hydrogen balance results for Typical Day 3.
Electronics 14 01195 g009
Table 1. Time-of-use electricity prices of a city in western China.
Time RangePrice (USD)
23:00–Next Day 7:000.0358
7:00–10:000.0753
10:00–12:000.1038
12:00–15:000.0753
15:00–21:000.1038
21:00–23:000.0753
Table 2. Scheme 1 to 3 for Hydrogen Refueling Station 1.
EquipmentScheme 1Scheme 2Scheme 3
AE (MW)2.4101.228
PEM (MW)01.9220.871
Hydrogen Storage Tank (m3)252020
Energy storage Battery (MWh)1056
Hydrogen Fuel Cell (kW)282024
Compressor (kW)1009898
Capacitance Capacity (kWh)939393
Initial Investment Cost (USD)3,171,0433,120,5172,986,643
Daily Operation Cost (USD)376.8661.7488.8
A year Cost (USD)3,308,5723,362,0523,165,050
Table 3. Schemes of Hydrogen Refueling Stations 1 to 4.
EquipmentStation 1Station 2Station 3Station 4
AE (MW)1.2282.5591.2870.142
PEM (MW)0.8711.8140.9150.101
Hydrogen storage tank (m3)2010205
Energy storage battery (MWh)6056
Hydrogen fuel cell (kW)24033
Compressor (kW)982041026
Capacitance capacity (kWh)93939393
Initial investment Cost (USD)2,986,6433,459,8662,947,8962,115,928
Daily operation cost (USD)488.8840.6500.6163.5
A year cost (USD)3,165,0503,766,7323,130,6562,175,636
Table 4. Schemes of Hydrogen Refueling Stations 5 to 8.
EquipmentStation 5Station 6Station 7Station 8
AE (MW)0.5391.0190.5691.804
PEM (MW)0.3820.7220.4061.281
Hydrogen storage tank (m3)10201010
Energy storage battery (MWh)326310
Hydrogen fuel cell (kW)157361500
Compressor (kW)264927144
Capacitance capacity (kWh)93939393
Initial investment cost (USD)4,310,1052,835,2004,259,4732,920,151
Daily operation cost (USD)400427.9404.6622.8
A year cost (USD)4,456,1162,991,4074,407,2093,147,547
Table 5. Electricity consumption results of Typical Day 1 to 3.
Typical Day 1Typical Day 2Typical Day 3
Power cost (kWh)38,90330,05418,744
Electricity cost (USD)318215280
Discarded PV power generation (kWh)000
Excess hydrogen (kg)004.7
Power sale quantity (kWh)0094.6
Profit from sale of electricity (USD)0028.4
Table 6. Comparison between this paper and other articles.
ArticlesAE-PEM Combined Hydrogen ProductionPV Fluctuation Mitigation
[10]NoNo
[11]NoNo
[13]NoNo
[14]NoNo
[15]NoNo
[16]NoNo
[17]NoNo
This
paper
YesYes
Disclaimer/Publisher’s Note: The statements, opinions and data contained in all publications are solely those of the individual author(s) and contributor(s) and not of MDPI and/or the editor(s). MDPI and/or the editor(s) disclaim responsibility for any injury to people or property resulting from any ideas, methods, instructions or products referred to in the content.

