Article

DualNetIQ: Texture-Insensitive Image Quality Assessment with Dual Multi-Scale Feature Maps

1
Electrical Engineering Department, Faculty of Engineering, Aswan University, Aswan 81542, Egypt
2
Electrical Engineering Department, College of Engineering, King Khalid University, Abha 61411, Saudi Arabia
*
Author to whom correspondence should be addressed.
Electronics 2025, 14(6), 1169; https://doi.org/10.3390/electronics14061169
Submission received: 10 February 2025 / Revised: 10 March 2025 / Accepted: 11 March 2025 / Published: 17 March 2025

Abstract

:
The precise assessment of image quality that matches human perception is still a major challenge in the field of digital imaging. Digital images play a crucial role in many technological and media applications. The existing deep convolutional neural network (CNN)-based image quality assessment (IQA) methods have advanced considerably, but there remains a critical need to improve the performance of existing methods while maintaining explicit tolerance to visual texture resampling and texture similarity. This paper introduces DualNetIQ, a novel full-reference IQA method that leverages the strengths of deep learning architectures to exhibit robustness against resampling effects on visual textures. DualNetIQ includes two main stages: feature extraction from the reference and distorted images, and similarity measurement based on combining global texture and structure similarity metrics. In particular, DualNetIQ takes features from input images using a group of hybrid pre-trained multi-scale feature maps carefully chosen from VGG19 and SqueezeNet pre-trained CNN models to find differences in texture and structure between the reference image and the distorted image. The Grey Wolf Optimizer (GWO) calculates the weighted combination of global texture and structure similarity metrics to assess the similarity between reference and distorted images. The unique advantage of the proposed method is that it does not require training or fine-tuning the CNN deep learning model. Comprehensive experiments and comparisons on five databases, including various distortion types, demonstrate the superiority of the proposed method over state-of-the-art models, particularly in image quality prediction and texture similarity tasks.

1. Introduction

Visual perception plays a vital role in our daily lives, and over the past century, there has been a significant technological shift in the field of imaging. Advances in mobile multimedia technology now allow people to access numerous high-resolution images on their smartphones or other devices at any time. However, various processes in an image system such as capture, reproduction, compression, storage, transmission, and restoration can introduce noise, distortions, or artifacts. As a result, monitoring and assessing image quality is essential. The demand for accurate image quality assessment (IQA) has grown with the increasing reliance on digital imaging in fields like communications, surveillance, medical imaging, and visual information. Thus, precise IQA methods are fundamental for many image-based applications. The objective of IQA is to develop algorithms that automatically assess digital image quality in a manner consistent with human perception [1,2].
Notably, existing IQA methods are generally classified into three categories: full-reference (FR), reduced-reference (RR), and no-reference (NR) methods. The FR-IQA techniques, such as mean square error (MSE) and the structural similarity index (SSIM) [3], evaluate image quality by directly comparing the distorted image with a pristine reference image. However, these methods often fail to align with human visual perception, especially when comparing images with similar textures that may differ in the exact arrangement of features but appear nearly identical to the human eye (see Figure 1). This discrepancy arises from their dependence on pixel-wise accuracy, making them overly sensitive to point-by-point differences between images that share the same overall texture.
In response to the limitations of FR-IQA methods, and with the rise of deep learning across various fields, deep learning has significantly impacted IQA [7,8,9]. Deep learning-based models have shifted the paradigm by leveraging large-scale datasets to automatically learn complex distortion patterns, eliminating the need for manually crafted features that traditional methods rely on. Moreover, the use of convolutional neural networks (CNNs) for IQA tasks has been further enhanced by transfer learning, where pre-trained networks initially trained on large-scale image recognition tasks exhibit strong capabilities in capturing intricate patterns and textures, closely resembling the processing of the human visual system [9,10,11,12].
Despite the advancements in the realm of IQA, there remains a need for further improvements in IQA models, particularly regarding texture similarity and sensitivity to texture resampling effects. The key challenge lies in developing an IQA model that can accurately assess image quality while withstanding the impact of texture resampling commonly encountered during image processing tasks. While models such as deep image structure and texture similarity (DISTS) [11] and deep distance correlation (DeepDC) [12] have explored the concept of IQA models that are less influenced by texture resampling, they should also strive for alignment with human visual perception. It is important to note that both DISTS and DeepDC utilize the VGG pre-trained model [13] for feature extraction. However, relying on a single deep feature extractor like VGG may not fully capture the complete range of image appearance, structure, and texture, especially under various distortion types. While DISTS and DeepDC have achieved satisfactory IQA results, there remains a need for further improvement in the performance of IQA methods, particularly in traditional image quality assessment.
This paper introduces a novel full-reference IQA method, termed DualNetIQ, designed to be resilient to resampling effects on visual textures by leveraging the capabilities of deep learning architectures. The proposed DualNetIQ method has two steps: first, it pulls out features from both the original image and the distorted image; second, it measures similarity by combining global texture and structure similarity metrics. In particular, this method takes features from input images by using a mix of pre-trained feature maps carefully chosen from the VGG19 and SqueezeNet CNN models to find differences in texture and structure. Each deep CNN network uses hybrid feature maps in the proposed IQA method to pull out specific patterns from images. This makes sure that a full description of the textures and structures of both the original image and the distorted image under different types of distortion is given. The proposed scheme then evaluates the similarity between the reference and distorted images by calculating a weighted combination of global texture and structure similarity metrics, which we then optimize using the Grey Wolf Optimizer (GWO). This research highlights the following key contributions:
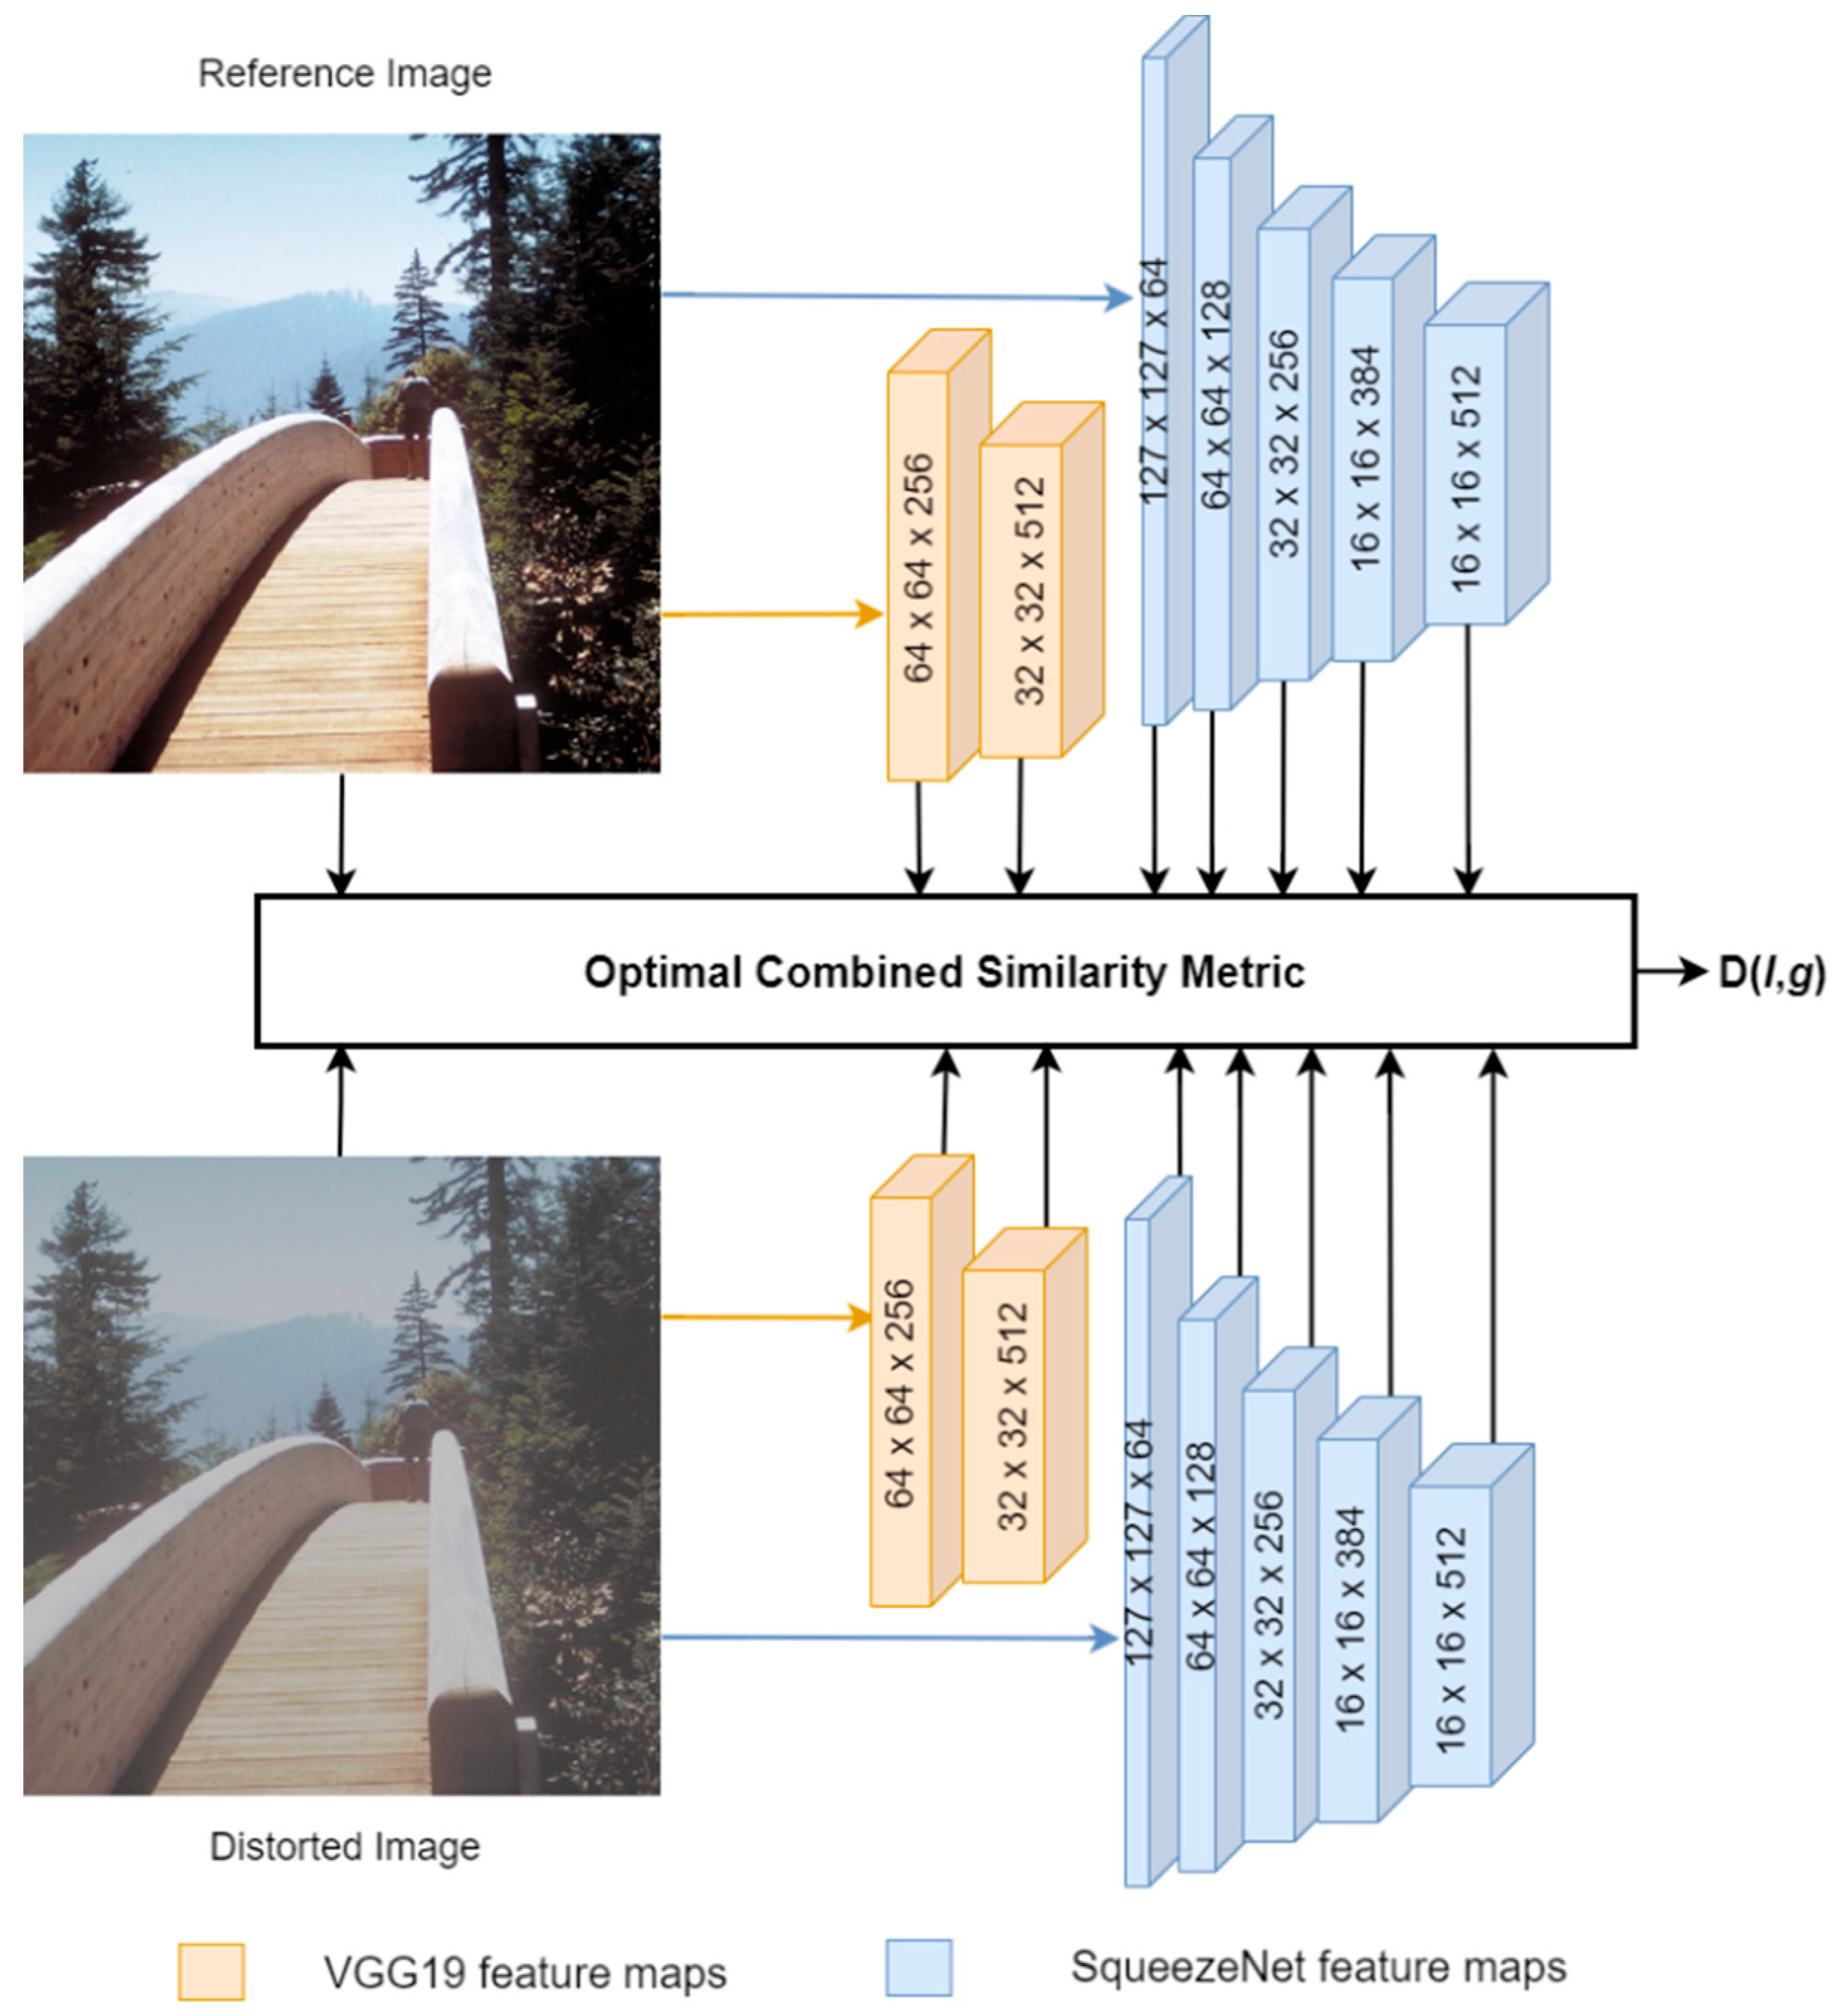
  • Proposing a novel IQA method called DualNetIQ for texture-insensitive full reference IQA. Unlike existing IQA methods that employ a single deep feature extractor, the proposed method utilizes hybrid multi-scale feature maps selected from robust pre-trained CNNs models (VGG19 and SqueezeNet) to assess the quality of textured images effectively and withstand the effects of texture resampling under different distortion types. DualNetIQ makes a complete description of the textures and structures of the reference and the distorted images under different types of distortion. It addresses the limitations of similar existing models, particularly in handling various types of distortions.
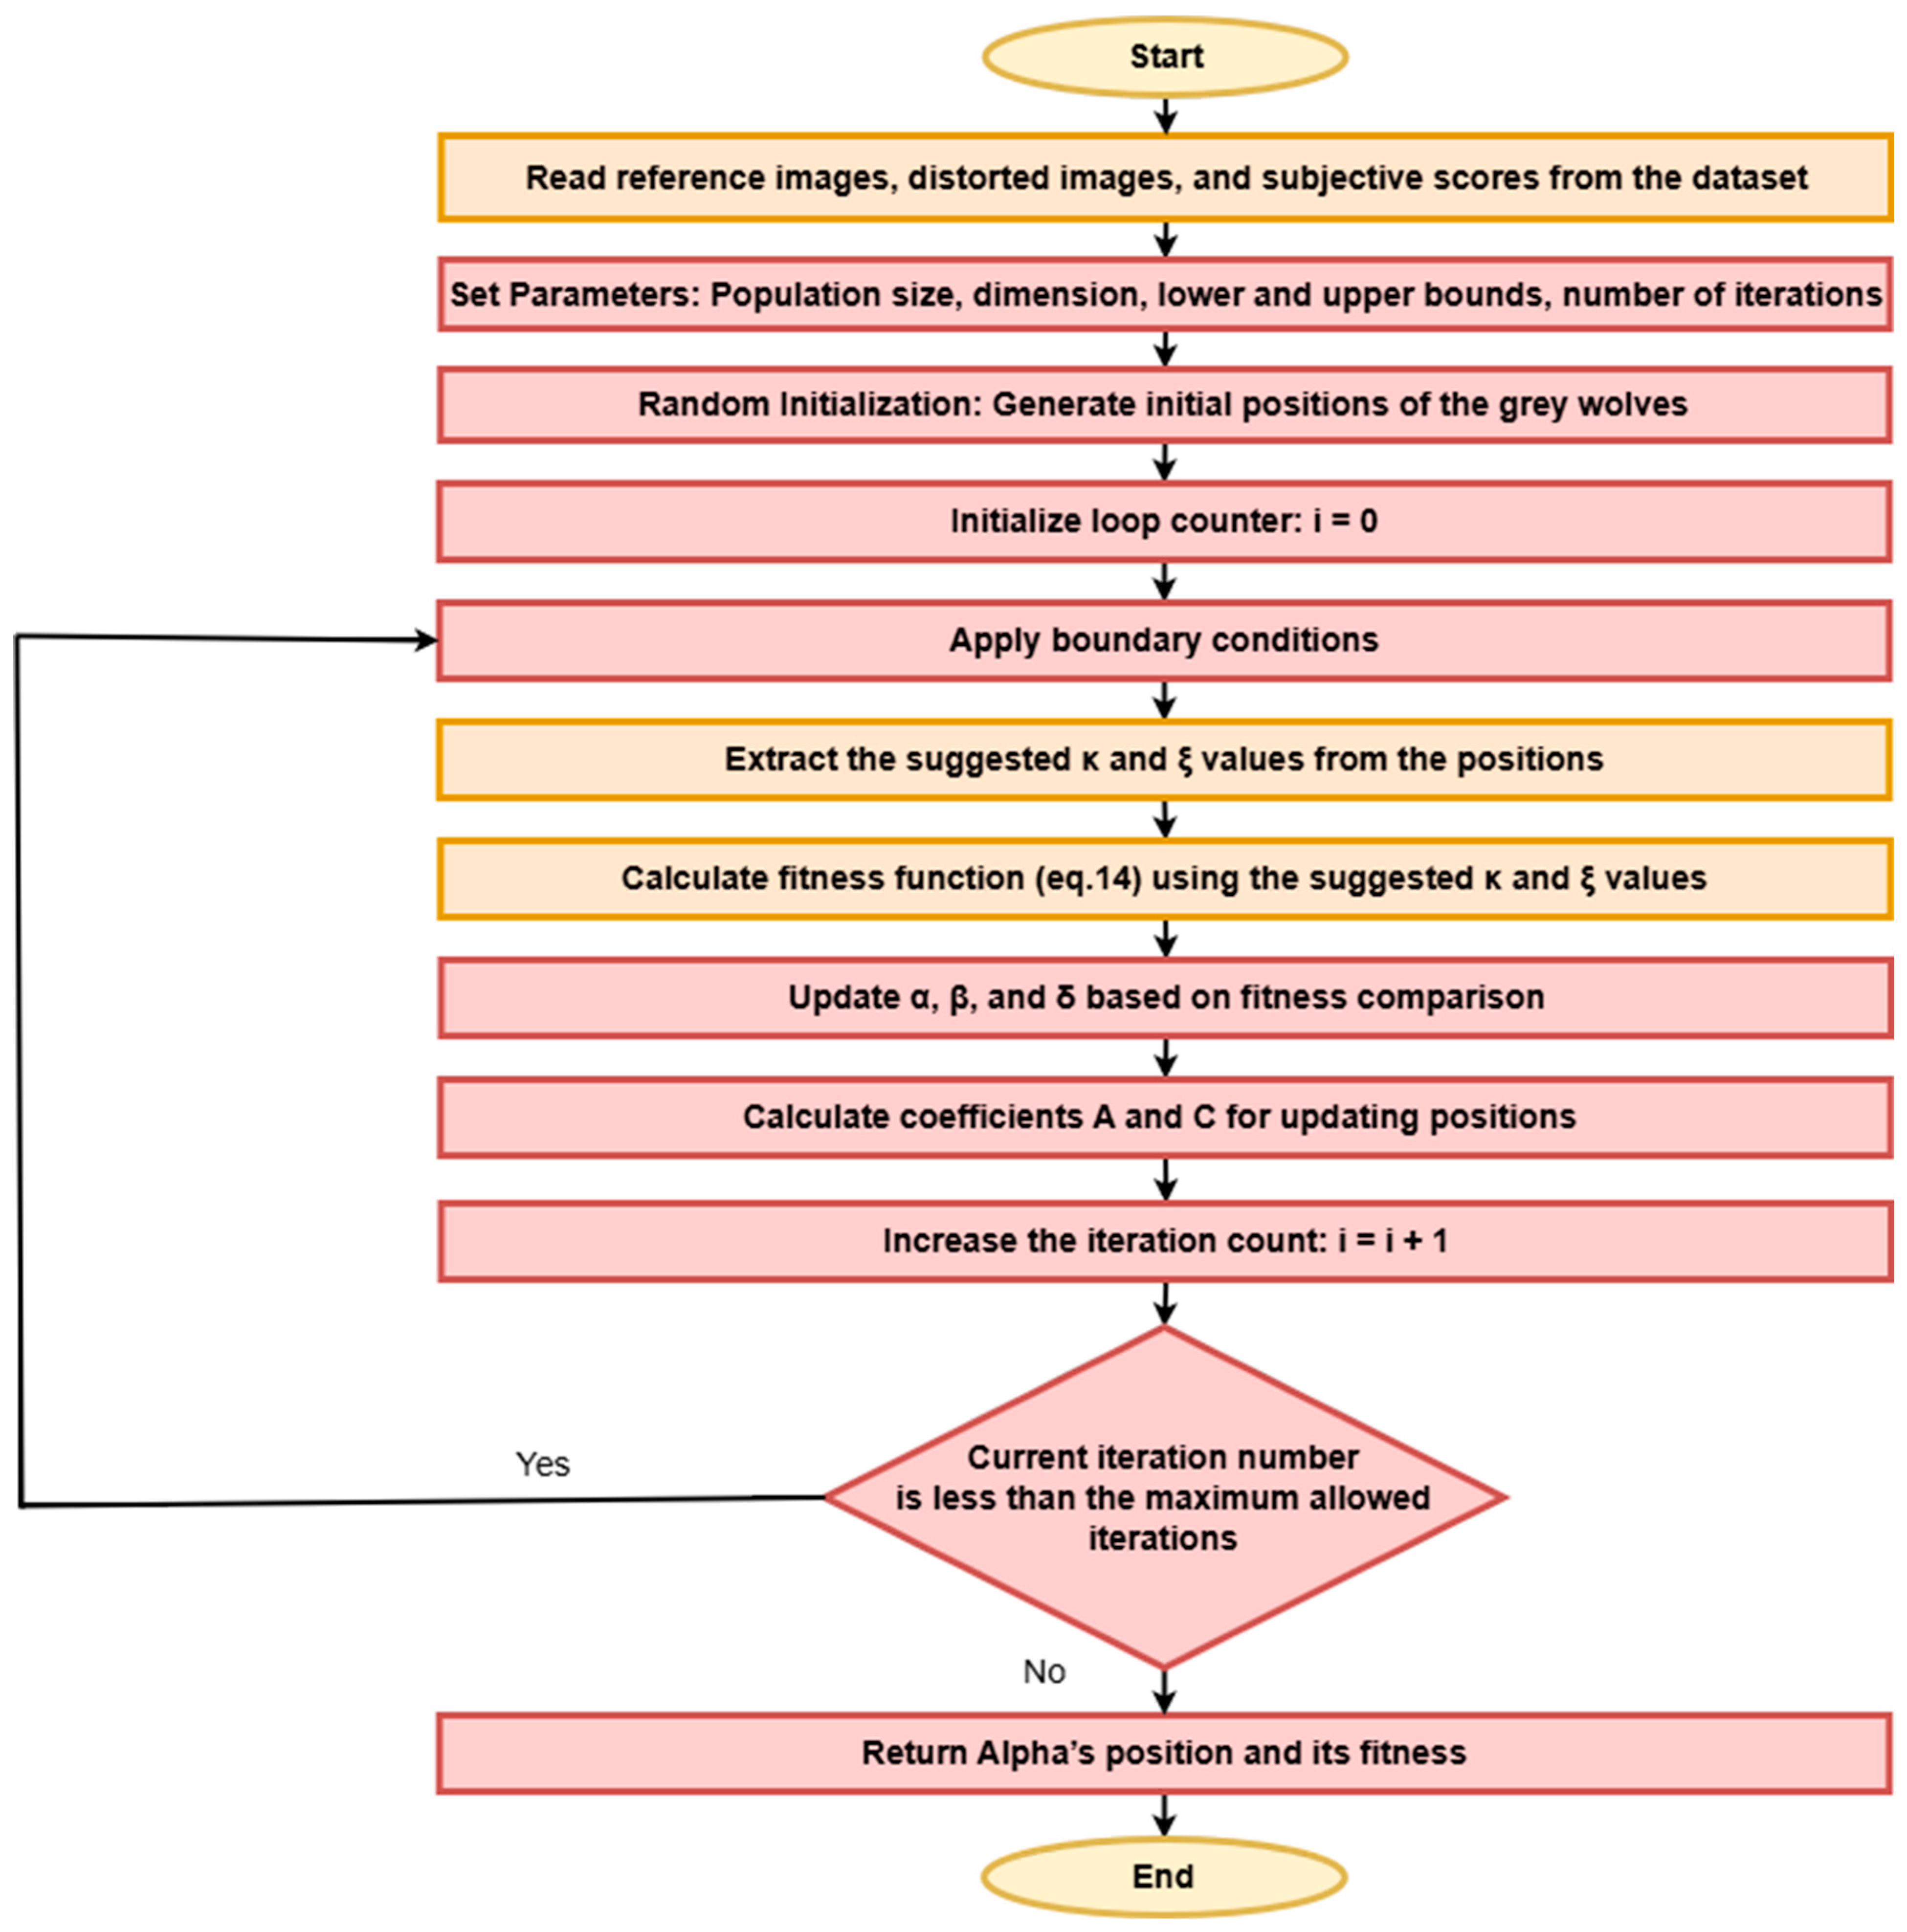
  • Proposing an efficient method for assessing the similarity between the reference and distorted images by optimally combining structure and texture similarity metrics utilizing the GWO algorithm, allowing the model to align closely with human perceptual judgement.
  • Providing an extensive ablation study and comparative analysis against existing methods on five IQA datasets (LIVE [14], CSIQ [15], TID2013 [16], KADID-10k [17], and PIPAL [18]), one texture similarity dataset, SynTEX [4], and one perceptual similarity dataset, BAPPS [10]. These datasets encompass a wide range of distortions, including traditional synthetic artifacts and those created by modern image processing algorithms. The employment of such datasets provides a rigorous benchmark that confirms the adaptability and robustness of the DualNetIQ method across various evaluation scenarios.
The remainder of this study includes four sections: Section 2 presents a brief review of existing research on IQA methods. Section 3 introduces the proposed DualNetIQ model in detail. Section 4 provides experimental comparisons and discussion to evaluate the model’s performance. Lastly, Section 5 concludes the study.

2. Related Work

The field of IQA has seen significant advancements in recent years. It began with traditional IQA methods, which were primarily based on modeling the human visual system. In the last decade, IQA techniques have evolved to include deep learning approaches, whether through training neural networks from scratch or leveraging pre-trained models. Additionally, hybrid models that combine knowledge-driven and data-driven methods have emerged. Below, we provide a brief overview of the most prominent traditional approaches and deep learning-based IQA methods.

2.1. Traditional Full-Reference IQA Methods

For over five decades, knowledge-driven techniques have been the primary approach in FR-IQA models. Early FR-IQA methods, like peak signal-to-noise ratio (PSNR) and mean squared error (MSE), compared things in a way that was certain by computing differences between pixels. However, these methods demonstrated poor correlation with the human visual system (HVS) [19]. Wang et al. introduced the SSIM metric [3], recognizing that earlier models failed to capture perceptual image quality effectively. This marked a paradigm shift, incorporating structural information, contrast, and luminance into the evaluation process. Despite these advances, SSIM and its variants, such as multi-scale SSIM (MS-SSIM) [20], information weighting SSIM (IW-SSIM) [21], and complex wavelet SSIM (CW-SSIM) [22], faced challenges in handling complex distortions and accurately representing textures.
Additional techniques, such as visual saliency similarity (VSI) [23], Visual Information Fidelity (VIF) [24], and feature similarity (FSIM) [25], have been proposed to improve performance. While these models have shown significant improvements, they still face challenges in accurately handling visual textures and certain distortion types.

2.2. Deep Learning-Based IQA Methods

Deep learning-based models have significantly outperformed traditional metrics in capturing high-level perceptual cues. In recent years, numerous deep learning-based IQA methods have been proposed. For example, Liang et al. [26] introduced a dual-path CNN network that processes both distorted and reference image patches to predict corresponding quality scores. Kim and Lee [7] developed an IQA method called DeepQA in which a CNN learns the behavior of the HVS from the underlying data distribution of IQA datasets.
The successful application of pre-trained networks like AlexNet [27], SqueezeNet [28], and VGG [13] across various vision tasks has inspired the use of deep features in FR-IQA, significantly enhancing the accuracy and reliability of these estimations [8]. Gao et al. [9] introduced the DeepSim IQA model, which utilizes a deep CNN pre-trained on the ImageNet database [29]. In their approach, pairs of distorted and reference images are fed into the CNN, and each output layer serves as a feature map. Global image quality scores are then computed by pooling local similarities between the feature maps from the distorted and reference images. The authors of LPIPS [10] used pre-trained CNN models to extract feature stacks from various network layers and normalize them in the channel dimension to compute the distance between reference and distorted image patches.
The development of transformers has greatly energized IQA and ushered in a new era in artificial intelligence. Junyong You and Korhonen [30] employed transformers to effectively manage images of diverse resolutions and improve their focus on global features. Building on this, Ke et al. [31] presented a novel technique that combines scale embedding and hash-based 2D spatial embedding to make it easier to handle images with different sizes and aspect ratios. Many vision transformer-based methods have since emerged [32,33,34,35] that have shown excellent performance in image quality assessment.
While all these models have achieved acceptable results, they did not address the issue of sensitivity to texture resampling.
Recent studies have aimed to address the issue of texture resampling sensitivity. One of the first deep learning-based models designed to explicitly handle this problem is the DISTS model [11]. DISTS employs a pre-trained VGG model to extract features from both reference and corrupt images. It then constructs a similar measure by combining texture and structural terms across all feature maps. The authors of [36] proposed an improved version of DISTS called A-DISTS by introducing adaptive strategies to calculate the structure and texture similarities. They employed a dispersion index to adaptively localize the texture regions at different scales. DeepDC [12] proposed the distance correction to measure the similarity between the reference and corrupted images in the deep feature domain.
Although the methods mentioned above can address texture resampling and texture similarity, they still have limitations, such as sensitivity to specific distortion types, largely due to their reliance on a single pre-trained CNN feature extractor. According to the no-free-lunch theorem, using one pre-trained model (i.e., a pre-trained VGG19 network) for feature extraction may work well for certain distortions but not for all. Specifically, DISTS and DeepDC perform a little poorly on the large-scale IQA dataset TID2013, which involves 3000 images with 24 types of distortion. These methods yield limited results when dealing with high-frequency noise, impulse noise, local block-wise distortion, color saturation, and changes in contrast. In contrast, this paper proposes the DualNetIQ model, which utilizes carefully selected multi-scale feature maps from multiple powerful pre-trained models, enabling it to handle various distortion types. DualNetIQ offers improved computational efficiency and reliability in image quality assessment and texture similarity tasks.

3. Proposed Method

3.1. DualNetIQ Model

Figure 2 presents an overview of the architecture of the proposed DualNetIQ model. In this process, there are two main steps: using multi-scale hybrid feature maps to extract features and using the proposed optimal combined similarity metric to measure similarity in the deep feature domain. Given the clean reference image (I) and the damaged image (G), DualNetIQ uses robust pre-trained models to choose the best multiscale feature maps to represent the input images. Notably, effectively capturing the perceptual quality of images requires a robust image representation approach. Since perceptual distances are non-uniform in pixel space [37,38], the goal of an image representation function is to transform the pixel representation into a space that is more perceptually uniform. In the proposed DualNetIQ model, we carefully select hybrid multi-scale feature maps from powerful pre-trained CNN models to extract robust representations of pristine reference and distorted images across various distortion types. Through an exhaustive ablation study [39] on different CNN models, including VGG19 [13], ResNet [40], AlexNet [27], and SqueezeNet [28], we found that VGG19 and SqueezeNet performed the best for feature representation. We also expanded the comparative study to include a stage-by-stage analysis to identify the most effective stages for our task. Additionally, this study involved some transformer-based models for further evaluation.
As shown in Figure 2, DualNetIQ includes two identical branches: the top branch extracts representation for the reference image while the bottom branch extracts representation for the corrupted image. Each branch consists of eight layers: the first layer represents the input images, the second and third layers are feature maps rendered from the VGG19 pre-trained model, and the last five layers are feature maps rendered from the SqueezeNet pre-trained model. The feature vector extracted by each feature map is passed to the optimal combined similarity metric (OCSM) to compute the similarity score.
The feature representation of the input reference image, f I , and the representation of the distorted image f G are formed by concatenating the features resulting from the feature maps of the top and bottom branches:
f I = { I ~ j i ; i = 0 , m ; j = 1 , , n i }
f G = { G ~ j i ; i = 0 , m ; j = 1 , , n i }
Here, m represents the number of feature maps in each branch, f stands for the feature representation, n i denotes the dimensions of features extracted from the i-th feature map, and I ~ ( 0 ) and G ~ ( 0 ) are the input reference and corrupted images.
Table 1 provides a description of the stages of the proposed model as well as the output feature dimension for each stage. The first stage corresponds to the input image. The second and third stages correspond to the convolutional responses from conv1_8 and conv2_4 layers of the VGG19 network. The fourth stage captures the convolutional response from the conv1_1 layer of SqueezeNet. The remaining four stages correspond to the responses from fire modules 2, 4, 6, and 8, respectively. As described in [28], a fire module consists of a squeeze convolution layer with 1 × 1 filters, followed by an expanding layer that combines both 1 × 1 and 3 × 3 convolution filters.

3.2. Optimal Combined Similarity Metric

At each stage, DualNetIQ computes global texture and structure similar measurements between the corresponding feature maps of reference and distorted images. The overall image quality score, D ( I , G ) , is determined through a weighted summation of the similarity scores across all stages. The formula is given by:
D ( I , G ) = 1 i = 0 m j = 1 n i κ i j l I ˇ j i , G ˇ j i + ξ i j s I ˇ j i , G ˇ j i
where { κ i j , ξ i j } are positive learned values that are constrained such that
i = 0 n j = 1 n i ( κ i j + ξ i j ) = 1
I ˇ j i and G ˇ j i are defined in Equations (1) and (2), respectively. l I ˇ j i , G ˇ j i and s I ˇ j i , G ˇ j i represent texture similarity and structure similarity, respectively, and are equal:
l I ˇ j i , G ˇ j i = 2 μ I ~ j i μ G ~ j i + c 1 μ I ~ j i 2 + μ G j i 2 + c 1
s I ˇ j i , G ˇ j i = 2 σ I ~ j i σ G ~ j i + c 2 σ I ~ j i 2 + σ G ~ j i 2 + c 2
where µ I and σ I are the mean and standard deviation of the image x, respectively, and σ I G is the covariance of the I and G images.
The parameters in Equation (3), known as ĸ and ξ , determine the weight of texture and structure similarity, so they are important in our model performance improvement. It should be noted that we explored many optimization methods to select the most appropriate tuning method for our model, including Random Search [41], Blend Search [42], Ax Search, Nevergrad Search [43], Bayesian Opt/HyperBand (BOHB) Search [44], and Bayesian Optimization (BO) Search within Raytune framework [45]. Moreover, we investigated some metaheuristic algorithms such as Particle Swarm Optimization [46], Grey Wolf Optimization (GWO) [47], and Tree-structured Parzen Estimator [48]. Ultimately, GWO yielded the best results, so we adopted this algorithm for the tuning of ĸ and ξ .
Grey wolves are at the top of the food chain. They exhibit a complex hunting behavior where they encircle their prey. This behavior is mathematically modeled in GWO with the following equations:
D = | C . X p t X ( t ) |
X t + 1 = X p t A . D
where X p t is the position of the prey (best solution obtained so far), X ( t ) is the position vector of a grey wolf, and A and C are coefficient vectors. These vectors are calculated as:
A = 2 a . r 1 a
C = 2 . r 2
where a decreases linearly from 2 to 0 over the course of iterations, and r 1 and r 2 are random vectors in [0, 1].
Grey wolves have a hierarchy made up of four kinds of wolves: α ,   β ,   δ , and ω . This hierarchy is very important in the coordination of group hunting and survival systems; GWO takes advantage of this when it comes to problem-solving techniques in complex optimization. The social hierarchy in the GWO algorithm is modeled by considering the best solution as alpha ( α ), the second-best solution as beta ( β ), the third-best solution as delta ( δ ), and other remaining solutions are omegas ( ω ). This hierarchy is very important for guiding the optimization process where α , β , and δ wolves guide ω wolves towards promising areas of search space while maintaining a balance between exploration and exploitation. The wolves update their positions in terms of the best three solutions so far obtained ( α ,   β ,   δ ) to show how they hunt by tracking, chasing, and attacking. The next equations present how to update positions:
X 1 = X α A 1 . | C 1 . X α X |
X 2 = X β A 2 . | C 2 . X β X |
X 3 = X δ A 3 . | C 3 . X δ X |
X t + 1 = ( X 1 + X 2 + X 3 ) / 3
Figure 3 shows the steps of using GWO to fine-tune our model parameters. The fitness function for this method is
f i t n e s s = | 1 ρ ( g t _ s c o r e s , d _ s c o r e s ) |
where ρ ( g t _ s c o r e s , d _ s c o r e s ) is the Spearman’s correlation coefficient (SRCC) between ground truth scores and the scores computed by our model using the instance κ and ξ values suggested by the GWO algorithm. Equation (14) is the equation that GWO seeks to minimize in order to obtain the optimal values of κ and ξ that result in the best alignment between the human subjective scores and the quality expectations resulting from our model. Application of GWO is best suited because this algorithm’s performance in exploring complex and high-dimensional search spaces helps us refine parameters influencing the model’s outputs.
We conduct this parameter learning on a rich dataset containing various types of image distortions. This ensures that the tuned parameters will enable DualNetIQ to perform exceptionally well across various types of distortions, thereby enhancing its usability and dependability in practical applications. The values of κ and ξ that yield the smallest value of 1-SRCC are the final optimal values. This will confirm not only that the quality predictions made by the model are accurate but that they are also in tune with the subtle perceptual preferences of human observers.

3.3. Implementation of DualNetIQ

The implementation of DualNetIQ, as outlined in Algorithm 1, begins with loading the tuned parameters, κ and ξ , and then the pre-trained models are loaded, VGG19 and SqueezeNet, partially freezing their parameters to maintain the features that have been learned while lowering computational complexity. Code is available at https://github.com/Hossam-Mady/DualNetIQ.
Algorithm 1: Pseudocode of DualNetIQ
1
2
3

4
5
Load tuned κ and ξ from files
Load pretrained VGG19 and SqueezeNet models
Define stages as sequential models for different layers of VGG19 and SqueezeNet
Freeze model parameters
Set mean and standard deviation for input normalization
Define channel sizes list ([3,256,512,64,128,256,384,512])
6
7

8
9

10
11
12
13
14
15
def forward_once(x):
                     Normalize x using mean and std
                     # Pass x through VGG19 stages
                     Pass x through VGG19_stage1 -> h1
                     Pass h1 through VGG19_stage2 -> h2
                    # Pass x through SqueezeNet stages
                     Pass x through SqueezeNet_stage1 -> h3
                     Pass h3 through SqueezeNet_stage2 -> h4
                     Pass h4 through SqueezeNet_stage3 -> h5
                     Pass h5 through SqueezeNet_stage4 -> h6
                     Pass h6 through SqueezeNet_stage5 -> h7
                     Return [x, h1, h2, h3, h4, h5, h6, h7]
16
17
18
19
20
21
22
23
24
25
26
27
28
29
30
31
def forward(x, y, require_grad = False, batch_average = False):
                     Normalize kappa and xi
                     term1 = 0
                     term2 = 0
                     for i in range(len(channel_sizes)):
                                          x_mean, y_mean = Compute mean of features from x and y
                                          S1 = Compute similarity using x_mean, y_mean
                                          term1 += kappa[i] * S1
                                          x_var, y_var = Compute variance of features from x and y
                                           S2 = Compute similarity using x_var, y_var
                                           term2 += xi[i] * S2
                      score = 1 − (term1 + term2).squeeze()
                      if batch_average:
                                          return score.mean()
                      else:
                                          return score
The VGG19 and SqueezeNet stages are then defined, with each stage representing specific layers within each architecture. Additionally, we specify input normalization, which provides the mean and standard deviation to properly scale the input images for feeding into the network. The forward_once function passes an input image through the defined stages of VGG19 and SqueezeNet. First, it normalizes the image and then feeds it sequentially through the VGG19 stages, extracting features h1 and h2, and through the SqueezeNet stages, extracting features h3 to h7. The algorithm returns a list of features from both models, which subsequently serve as the basis for computing similarity. The core of the algorithm is the forward function, which computes the similarity between the features extracted from two images, x and y . It normalizes first the κ and ξ parameters, and it initializes two terms, term1 and term2, which will accumulate the score. For each stage, it calculates the meaning and variance of the features from both images. Then, it computes two similarities, S 1 (texture similarity) and S 2 (structure similarity), weighted respectively by kappa[i] and xi[i]. The combination of these two weighted similarities produces an image quality score, normalized to fall within a specific range.

3.4. Evaluation Metrics

The correlation between the objective IQA quality score and mean opinion scores (MOSs) is a commonly used measure to evaluate the objective performance of IQA. Three metrics are commonly used to measure this correlation: SRCC, KRCC, and PLCC.
While PLCC gauges the predicted quality score’s linearity, SRCC and KRCC assess the predicted quality score’s monotonicity. We use SRCC and KRCC, as PLCC requires the produced scores to exhibit linearity in relation to subjective ratings; higher SRCC and KRCC values indicate higher-caliber prediction outcomes.
S R C C = 1 6 i = 1 n d i 2 n ( n 2 1 )
K R C C = 2 ( C D ) n ( n 1 )
where d i is the difference between the i t h image’s ranks in the objective and the subjective ratings, C is the number of concordant pairs, D is the number of discordant pairs, and n is the number of observations.

4. Results and Discussion

In this section, we discuss the comprehensive tests conducted to validate the effectiveness of our suggested model. These consisted of standard image quality prediction evaluation, perceptual similarity measurement, and texture similarity assessment. Finally, we conducted ablation studies to demonstrate the impact of each component on the model.

4.1. Parameter Setting

As previously mentioned, we optimized the weights using the GWO method. It was configured with a population size equal to four and a maximum number of iterations of 50 iterations. The dimensionality of the search space was set to 16, reflecting the number of parameters (the total of the kappa and xi values over all stages). Parameter values were restricted within the range [0, 1]. The error function was defined as the absolute value of (1-SRCC), and the goal was to minimize this value.
We performed all computations on an NVIDIA GeForce GTX 1650 GPU using PyTorch version 2.2.0, with all computations offloaded to the CUDA-enabled GPU to enhance performance and reduce runtime. Our system was running Windows 10 64-bit with CUDA version 12.1 for GPU acceleration. This experiment was conducted on a machine with an Intel(R) core (TM) i7-9700K processor (3.60 GHz) and 32 GB of RAM.
Algorithm 1 shows the steps taken on the reference image and the distorted image to calculate the final assessment of the quality of the distorted image.

4.2. Performance in Quality Prediction and Texture Similarity

In this section, we compare DualNetIQ with 11 FR-IQA models on five standard IQA datasets (LIVE [14], CSIQ [15], TID2013 [16], KADID-10k [17], and PIPAL [18]), as well as on a specialized texture similarity dataset, SynTEX [4], which contains 105 synthesized texture images created using five different methods of texture synthesis based on 21 high-quality textures. The 11 FR-IQA methods include six knowledge-driven models (PSNR, SSIM [3], MS-SSIM [20], FSIM [25], VIF [24], and NLPD [49]) and five data-driven CNN-based models (PieAPP [50], LPIPS [10], DISTS [11], A-DISTS [36], and DeepDC [12]). For consistent evaluation, all models were evaluated using their original implementations, and we selected the default implementation of LPIPS, which is LPIPS-VGG-lin.
Table 2 presents the comparative results that provide a number of important insights. Every existing IQA dataset shows that the proposed DualNetIQ is strong, outperforming older methods like PSNR, SSIM, and MS-SSIM as well as newer CNN-based methods like PieAPP and LPIPS. It is intriguing that DualNetIQ does better than DISTS, A-DISTS, and DeepDC in most of the IQA datasets. This demonstrates its ability to conduct more comprehensive structural and textural analysis, a crucial step in accurately evaluating image quality. DualNetIQ achieves the second-highest SRCC and KRCC values on the LIVE, TID2013, and KADID-10K datasets. Notably, the difference between its performance and the top-performing model on KADID-10K (DeepDC) is only 0.008. It is clear that DualNetIQ enhances performance on TID2013, achieving strong results compared to other methods, especially those that are insensitive to texture resampling. On the CSIQ dataset, DualNetIQ delivers comparable results (SRCC = 0.930 and KRCC = 0.764). Furthermore, when evaluating individual distortions on CSIQ, it outperforms other models. When it comes to the pipal dataset, which has a lot of GAN-generated images that are hard to work with because they have synthesized textures that are not in the reference images, DualNetIQ also does well.
With S R C C = 0.938 and K R C C = 0.792 , DualNetIQ is much better than any knowledge-based or advanced data-driven model at figuring out how similar two textures are across the SynTEX dataset. DualNetIQ’s superior feature extraction capabilities, which effectively extract key attributes related to visual texture, account for its performance edge. This aspect presents a challenge for traditional models, as they rely on precise pixel correspondence. Also, it is worth noting that DualNetIQ outperforms modern methods known for their ability and superiority in texture similarity assessment, such as DISTS and DeepDC.

4.3. Performance on Perceptual Similarity Measurment

In addition to the traditional image quality evaluation, DualNetIQ performance was also evaluated for the perceptual similarity measurement on the BAPPS dataset. BAPPS contains a diverse collection of image patches that includes distortions produced by real-world algorithms such as super resolution, video deblurring, and frame interpolation, as well as synthetic ones, whether traditional or CNN-based. The evaluation of perceptual similarities in BAPPS follows a Two-Alternative Forced Choice (2AFC) experimental setup. This score quantifies the consistency between the model and human preference; the higher the score, the more consistent the model is, providing a strong indication of its perceptual alignment with human visual perception.
The results shown in Table 3 highlight the excellent performance of DualNetIQ both for synthetic and real-world distortions. The proposed model outperformed all methods in managing distortions generated by real-world algorithms by achieving the highest 2AFC score of 0.661 and it also surpassed all methods in managing synthetic distortions by achieving the highest 2AFC score of 0.797 and thus the highest 2AFC score in total, which was 0.693.

4.4. Performance Comparison Across Diversity of Distortion Types

Table 4 shows how well DualNetIQ performed compared to DISTS, A-DISTS, and DeepDC for a certain group of noise types in the TID2013 dataset, using SRCC and KRCC. The results show that our proposed model achieved strong generalization across a wide range of distortion types. The proposed model consistently achieved the best or at least the second-best result for each type of distortion, demonstrating its remarkable versatility and robustness.
Figure 4 shows a boxplot of SRCC values for IQA metrics for different types of distortion in the TID2013, CSIQ, and LIVE datasets. It is easy to see that our suggested model, DualNetIQ, had the highest median and upper whisker. DeepDC demonstrated a slightly lower yet comparable median; however, it presented outliers that suggest limitations associated with certain distortion types. Conversely, A-DISTS recorded the lowest median, and despite the absence of visible outliers, the behavior of its lower whisker was comparable to or worse than that of other metrics’ outliers. DISTS had a median slightly lower than both DualNetIQ and DeepDC, albeit still comparable, and it also exhibited outliers that highlighted limitations for specific distortion types.
Furthermore, Figure 5 provides a similar analysis for KRCC values. DualNetIQ also had the highest median, as well as the highest upper and lower whiskers. DeepDC exhibited a slightly lower median and the smallest lower whisker, suggesting that it performs poorly under certain distortion classes. A-DISTS had the lowest median, with its lower whisker slightly higher than DeepDC’s. Furthermore, DISTS exhibited a marginally lower median than both DualNetIQ and DeepDC, all while maintaining a lower whisker.
In summary, it is evident that DualNetIQ performs better than the other models, resolving issues and improving generalizability across different kinds of distortion.

4.5. Ablation Study

We conducted a series of ablation experiments to delve into the influences of various CNNs acting as feature extractors in the DualNetIQ framework. Specifically, the aim was to study how different CNN selections affect the performance of the model.
First, we carefully tuned κ and ξ parameters in each configuration using the GWO algorithm to ensure the validity and reliability of our findings. This study was essential because it provided a means to identify settings that would result in optimum performance for each CNN network and ensure fair comparison.
Second, we tested the performance of each CNN variant (VGG19, SqueezeNet, AlexNet, and ResNet50) on a wide range of five datasets, including four benchmark IQA datasets and one texture similarity dataset. Table 5 shows how each architecture performed in terms of evaluating texture similarity and image quality, offering a detailed comparison of the performance metrics for each CNN. It also presents the results of combining the VGG19 and SqueezeNet networks (i.e., the proposed DualNetIQ model).
As one can see in Table 5, the VGG19 and SqueezeNet networks achieved SRCC values higher than 0.9 with the LIVE and SynTEX datasets. However, AlexNet obtained good results with LIVE, CSIQ, TID2013, and KADID-10k, and it achieved limited results with the SynTEX dataset (KRCC values < 0.72). In turn, ResNet50 obtained limited results with the SynTEX dataset (SRCC values < 0.7 and KRCC values < 0.5). According to the results, VGG19 demonstrated commendable performance, approaching that of DualNetIQ in certain cases, and even outperforming in the case of CSIQ. However, it is important to note that DualNetIQ outperformed VGG19 across all datasets if we consider the different distortion types separately in CSIQ. In addition, DualNetIQ reduced the computational load of the model by selecting and utilizing only selective layers from VGG19, particularly by replacing some of the computation-intensive layers from VGG19 with more efficient counterparts from SqueezeNet. The quality prediction became much better, especially on the TID2013 dataset, where it achieved SRCC = 0.865 and KRCC = 0.678, compared to SRCC = 0.833 and KRCC = 0.648 when VGG19 was used alone. Additionally, on the SynTEX dataset, adding efficient SqueezeNet layers increased SRCC to 0.938 and KRCC to 0.792, which was better than the SRCC of 0.928 and KRCC of 0.733 that was achieved with VGG19 alone.

4.6. Complexity Comparison

We compared our proposed method, DualNetIQ, with a set of methods used to evaluate image quality in computational complexity, a perspective that is crucial for real-time applications. The methods used in comparison were FPS and FLOPS. As shown in Table 6, DualNetIQ achieved a competitive FPS value of 29.8 and FLOPS of 46.92 billion, which was the second-best result after DISTS, which achieved a slightly better result. However, DualNetIQ outperformed DISTS in terms of image quality assessment and texture similarity, particularly when dealing with certain types of distortions.
It should be noted that one limitation of the model is that it has not been extensively tested on images with unusual colors such as night shots and underwater. Also, we did not present results for real systems (e.g., in surveillance cameras or vision systems) in this study. Additionally, the performance of the proposed model with other transformer architectures [52] could be studied. All these points will be addressed in future studies.

5. Conclusions and Future Work

In this paper, we proposed DualNetIQ, an FR-IQA model with explicit tolerance to texture resampling. Our model utilizes two powerful CNNs, VGG19 and SqueezeNet, to extract features from both reference and distorted images. The eight feature maps are then combined using the optimal combined similarity metric, with its weighting parameters fine-tuned using GWO. Our model architecture enables it to address the limitations of traditional metrics as well as deep learning-based metrics that rely on a single CNN for feature extraction. DualNetIQ was tested on IQA, texture similarity, perceptual similarity, and different types of distortion. The results show that our model works better and more efficiently than other existing models.
Future work may involve incorporating additional metrics to calculate the similarity at each stage of the DualNetIQ model, with the aim of enhancing its performance. Additionally, different methods for parameter tuning may be investigated. The effectiveness of various architectures, such as EfficientNet or Swin Transformer, with the proposed model will be also assessed. Moreover, we will conduct real-world deployment tests and evaluate the model’s performance in handling images with unusual colors.

Author Contributions

Conceptualization, A.A., H.M., H.E. and M.A.-N.; methodology, A.A., H.M., A.M.A. and M.A.-N.; software, A.A., M.A.-N. and H.M.; validation, H.E., A.M.A. and A.A.A.; formal analysis, A.A. and A.A.A.; investigation, H.M., H.E. and A.A.A.; resources, A.A. and H.M.; data curation, A.A.A. and A.M.A.; writing—original draft preparation, A.A., H.M. and M.A.-N.; writing—review and editing, H.E., A.A.A. and A.M.A.; visualization, H.E., A.M.A., A.A.A. and M.A.-N.; supervision, A.A., A.M.A. and M.A.-N.; project administration, A.A., A.A.A. and M.A.-N.; funding acquisition, H.E. and A.A.A. All authors have read and agreed to the published version of the manuscript.

Funding

The authors extend their appreciation to the Deanship of Research and Graduate Studies at King Khalid University for funding this work through the Large Research Project under grant number RGP2/301/46.

Data Availability Statement

The authors declare that the data used to support the findings of this study will be available from the corresponding author upon request.

Conflicts of Interest

There are no conflicts of interest.

References

  1. Bosse, S.; Maniry, D.; Müller, K.R.; Wiegand, T.; Samek, W. Deep Neural Networks for No-Reference and Full-Reference Image Quality Assessment. IEEE Trans. Image Process. 2018, 27, 206–219. [Google Scholar] [CrossRef] [PubMed]
  2. Ma, C.; Shi, Z.; Lu, Z.; Xie, S.; Chao, F.; Sui, Y. A Survey on Image Quality Assessment: Insights, Analysis, and Future Outlook. arXiv 2025, arXiv:2502.08540. [Google Scholar]
  3. Wang, Z.; Bovik, A.C.; Sheikh, H.R.; Simoncelli, E.P. Image quality assessment: From error visibility to structural similarity. IEEE Trans. Image Process. 2004, 13, 600–612. [Google Scholar] [CrossRef] [PubMed]
  4. Golestaneh, S.A.; Subedar, M.M.; Karam, L.J. The effect of texture granularity on texture synthesis quality. In Proceedings of the SPIE Optical Engineering + Applications, San Diego, CA, USA, 9–13 August 2015; Volume 9599, pp. 356–361. [Google Scholar] [CrossRef]
  5. Efros, A.A.; Freeman, W.T. Image quilting for texture synthesis and transfer. In Proceedings of the 28th Annual Conference on Computer Graphics and Interactive Techniques, Los Angeles, CA, USA, 12–17 August 2001; pp. 341–346. [Google Scholar] [CrossRef]
  6. Wei, L.Y.; Levoy, M. Fast Texture Synthesis using Tree-structured Vector Quantization. In Proceedings of the 27th Annual Conference on Computer Graphics and Interactive Techniques, New Orleans, LA, USA, 23–28 July 2000; pp. 479–488. [Google Scholar] [CrossRef]
  7. Kim, J.; Lee, S. Deep Learning of Human Visual Sensitivity in Image Quality Assessment Framework. In Proceedings of the 2017 IEEE Conference on Computer Vision and Pattern Recognition (CVPR), Honolulu, HI, USA, 21–26 July 2017; pp. 1969–1977. [Google Scholar] [CrossRef]
  8. Varga, D. A Combined Full-Reference Image Quality Assessment Method Based on Convolutional Activation Maps. Algorithms 2020, 13, 313. [Google Scholar] [CrossRef]
  9. Gao, F.; Wang, Y.; Li, P.; Tan, M.; Yu, J.; Zhu, Y. DeepSim: Deep similarity for image quality assessment. Neurocomputing 2017, 257, 104–114. [Google Scholar] [CrossRef]
  10. Zhang, R.; Isola, P.; Efros, A.A.; Shechtman, E.; Wang, O. The Unreasonable Effectiveness of Deep Features as a Perceptual Metric. In Proceedings of the IEEE Conference on Computer Vision and Pattern Recognition, Salt Lake City, UT, USA, 18–23 June 2018; pp. 586–595. [Google Scholar]
  11. Ding, K.; Ma, K.; Wang, S.; Simoncelli, E.P. Image Quality Assessment: Unifying Structure and Texture Similarity. IEEE Trans. Pattern Anal. Mach. Intell. 2020, 44, 2567–2581. [Google Scholar] [CrossRef]
  12. Zhu, H.; Chen, B.; Zhu, L.; Wang, S.; Lin, W. DeepDC: Deep Distance Correlation as a Perceptual Image Quality Evaluator. arXiv 2023, arXiv:2211.04927v2. [Google Scholar]
  13. Simonyan, K.; Zisserman, A. Very Deep Convolutional Networks for Large-Scale Image Recognition. arXiv 2014, arXiv:1409.1556. [Google Scholar]
  14. Sheikh, H.R.; Wang, Z.; Cormack, L.; Bovik, A.C. Image and Video Quality Assessment Research at LIVE. Available online: http://live.ece.utexas.edu/research/quality/ (accessed on 3 October 2024).
  15. Chandler, D.M.; Larson, E.C. Most apparent distortion: Full-reference image quality assessment and the role of strategy. J. Electron. Imaging 2010, 19, 011006. [Google Scholar] [CrossRef]
  16. Ponomarenko, N.; Jin, L.; Ieremeiev, O.; Lukin, V.; Egiazarian, K.; Astola, J.; Vozel, B.; Chehdi, K.; Carli, M.; Battisti, F.; et al. Image database TID2013: Peculiarities, results and perspectives. Signal Process. Image Commun. 2015, 30, 57–77. [Google Scholar] [CrossRef]
  17. Lin, H.; Hosu, V.; Saupe, D. KADID-10k: A Large-scale Artificially Distorted IQA Database. In Proceedings of the 2019 Eleventh International Conference on Quality of Multimedia Experience (QoMEX), Berlin, Germany, 5–7 June 2019; pp. 1–3. [Google Scholar] [CrossRef]
  18. Gu, J.; Cai, H.; Chen, H.; Ye, X.; Ren, J.; Dong, C. PIPAL: A Large-Scale Image Quality Assessment Dataset for Perceptual Image Restoration. In Proceedings of the Computer Vision–ECCV 2020: 16th European Conference, Glasgow, UK, 23–28 August 2020; Volume 16, pp. 633–651. [Google Scholar]
  19. Lin, W.; Li, D.; Xue, P. Discriminative Analysis of Pixel Difference towards Picture Quality Prediction. In Proceedings of the IEEE International Conference on Image Processing, Barcelona, Spain, 4–17 September 2003; Volume 3, pp. 193–196. [Google Scholar] [CrossRef]
  20. Wang, Z.; Simoncelli, E.P.; Bovik, A.C. Multi-Scale Structural Similarity For Image Quality Assessment. In Proceedings of the IEEE Asilomar Conference on Signals, System and Computers, Pacific Grove, CA, USA, 9–12 November 2003; pp. 1398–1402. [Google Scholar]
  21. Wang, Z.; Li, Q. Information content weighting for perceptual image quality assessment. IEEE Trans. Image Process. 2011, 20, 1185–1198. [Google Scholar] [CrossRef]
  22. Wang, Z.; Simoncelli, E.P. Translation insensitive image similarity in complex wavelet domain. In Proceedings of the IEEE International Conference on Acoustics, Speech and Signal Processing, Philadelphia, PA, USA, 23 March 2005; Volume 2. [Google Scholar] [CrossRef]
  23. Zhang, L.; Shen, Y.; Li, H. VSI: A visual saliency-induced index for perceptual image quality assessment. IEEE Trans. Image Process. 2014, 23, 4270–4281. [Google Scholar] [CrossRef] [PubMed]
  24. Sheikh, H.R.; Bovik, A.C. A Visual Information Fidelity Approach To Video Quality Assessment. In Proceedings of the First International Workshop on Video Processing and Quality Metrics for Consumer Electronics, Scottsdale, AZ, USA, 23–25 January 2005; Volume 7. [Google Scholar]
  25. Zhang, L.; Zhang, L.; Mou, X.; Zhang, D. FSIM: A Feature Similarity Index for Image Quality Assessment. IEEE Trans. Image Process. 2011, 20, 2378–2386. [Google Scholar] [CrossRef]
  26. Liang, Y.; Wang, J.; Wan, X.; Gong, Y.; Zheng, N. Image quality assessment using similar scene as reference. In Proceedings of the Computer Vision—ECCV 2016, Amsterdam, The Netherlands, 11–14 October 2016; Volume 9909, pp. 3–18. [Google Scholar] [CrossRef]
  27. Krizhevsky, A.; Sutskever, I.; Hinton, G.E. ImageNet Classification with Deep Convolutional Neural Networks. Commun. ACM 2017, 60, 84–90. [Google Scholar] [CrossRef]
  28. Iandola, F.N.; Han, S.; Moskewicz, M.W.; Ashraf, K.; Dally, W.J.; Keutzer, K. SqueezeNet: AlexNet-level accuracy with 50x fewer parameters and <0.5 MB model size. arXiv 2016, arXiv:1602.07360. [Google Scholar]
  29. Deng, J.; Dong, W.; Socher, R.; Li, L.J.; Li, K.; Fei-Fei, L. ImageNet: A Large-Scale Hierarchical Image Database. In Proceedings of the 2009 IEEE Conference on Computer Vision and Pattern Recognition, CVPR 2009, Miami, FL, USA, 20–25 June 2009; pp. 248–255. [Google Scholar] [CrossRef]
  30. You, J.; Korhonen, J. Transformer For Image Quality Assessment. In Proceedings of the 2021 IEEE International Conference on Image Processing (ICIP), Anchorage, AK, USA, 19–22 September 2021; pp. 1389–1393. [Google Scholar] [CrossRef]
  31. Ke, J.; Wang, Q.; Wang, Y.; Milanfar, P.; Yang, F. MUSIQ: Multi-scale Image Quality Transformer. In Proceedings of the IEEE International Conference on Computer Vision, Montreal, QC, Canada, 10–17 October 2021; pp. 5128–5137. [Google Scholar] [CrossRef]
  32. Cheon, M.; Yoon, S.J.; Kang, B.; Lee, J. Perceptual image quality assessment with transformers. In Proceedings of the IEEE Computer Society Conference on Computer Vision and Pattern Recognition Workshops, Nashville, TN, USA, 19–25 June 2021; pp. 433–442. [Google Scholar] [CrossRef]
  33. Golestaneh, S.A.; Dadsetan, S.; Kitani, K.M. No-Reference Image Quality Assessment via Transformers, Relative Ranking, and Self-Consistency. In Proceedings of the 2022 IEEE/CVF Winter Conference on Applications of Computer Vision, WACV 2022, Waikoloa, HI, USA, 3–8 January 2022; pp. 3989–3999. [Google Scholar] [CrossRef]
  34. Yang, S.; Wu, T.; Shi, S.; Lao, S.; Gong, Y.; Cao, M.; Wang, J.; Yang, Y. MANIQA: Multi-dimension Attention Network for No-Reference Image Quality Assessment. In Proceedings of the IEEE Computer Society Conference on Computer Vision and Pattern Recognition Workshops, Orleans, LA, USA, 19–20 June 2022; pp. 1190–1199. [Google Scholar] [CrossRef]
  35. Keshari, A.; Subudhi, B. Multi-Scale Features and Parallel Transformers Based Image Quality Assessment. arXiv 2022, arXiv:2204.09779. [Google Scholar]
  36. DIng, K.; Liu, Y.; Zou, X.; Wang, S.; Ma, K. Locally Adaptive Structure and Texture Similarity for Image Quality Assessment. In Proceedings of the 29th ACM International Conference on Multimedia, Chengdu, China, 20–24 October 2021; pp. 2483–2491. [Google Scholar] [CrossRef]
  37. Wang, Z.; Simoncelli, E.P. Maximum differentiation (MAD) competition: A methodology for comparing computational models of perceptual quantities. J. Vis. 2008, 8, 8. [Google Scholar] [CrossRef]
  38. Berardino, A.; Ballé, J.; Laparra, V.; Simoncelli, E.P. Eigen-Distortions of Hierarchical Representations. arXiv 2018, arXiv:1710.02266. [Google Scholar]
  39. Mady, H.; Agamy, A.; Aly, A.M.; Abdel-Nasser, M. A Comparative Analysis of CNN Feature Extractors and Parameter Tuning with Ray Tune Search Algorithms for Image Quality Assessment. Aswan Univ. J. Sci. Technol. 2024, 4, 132–148. [Google Scholar] [CrossRef]
  40. He, K.; Zhang, X.; Ren, S.; Sun, J. Deep Residual Learning for Image Recognition. In Proceedings of the IEEE Conference on Computer Vision and Pattern Recognition, Las Vegas, NV, USA, 26 June–1 July 2016; pp. 770–778. [Google Scholar]
  41. Bergstra, J.; Bengio, Y. Random search for hyper-parameter optimization. J. Mach. Learn. Res. 2012, 13, 281–305. [Google Scholar]
  42. Wang, C.; Wu, Q.; Weimer, M.; Zhu, E. FLAML: A Fast and Lightweight AutoML Library. Proc. Mach. Learn. Syst. 2021, 3, 434–447. [Google Scholar]
  43. Rapin, J.; Teytaud, O. Nevergrad—A Gradient-Free Optimization Platform. Available online: https://GitHub.com/FacebookResearch/Nevergrad (accessed on 10 March 2025).
  44. Falkner, S.; Klein, A.; Hutter, F. BOHB: Robust and Efficient Hyperparameter Optimization at Scale. In Proceedings of the 35th International Conference on Machine Learning, Stockholm, Sweden, 10–15 July 2018; pp. 1437–1446. [Google Scholar]
  45. Liaw, R.; Liang, E.; Nishihara, R.; Moritz, P.; Gonzalez, J.E.; Stoica, I. Tune: A Research Platform for Distributed Model Selection and Training. arXiv 2018, arXiv:1807.05118. [Google Scholar]
  46. Kennedy, J.; Eberhart, R.; bls gov. Particle Swarm Optimization. In Proceedings of the ICNN’95—International Conference on Neural Network, Perth, WA, Australia, 27 November–1 December 2002; Volume 4, pp. 1942–1948. [Google Scholar]
  47. Mirjalili, S.; Mirjalili, S.M.; Lewis, A. Grey Wolf Optimizer. Adv. Eng. Softw. 2014, 69, 46–61. [Google Scholar] [CrossRef]
  48. Watanabe, S. Tree-Structured Parzen Estimator: Understanding Its Algorithm Components and Their Roles for Better Empirical Performance. arXiv 2023, arXiv:2304.11127. [Google Scholar]
  49. Laparra, V.; Ballé, J.; Berardino, A.; Simoncelli, E.P. Perceptual image quality assessment using a normalized Laplacian pyramid. Electron. Imaging 2016, 2016, 1–6. [Google Scholar] [CrossRef]
  50. Prashnani, E.; Cai, H.; Mostofi, Y.; Sen, P. PieAPP: Perceptual Image-Error Assessment through Pairwise Preference. In Proceedings of the IEEE Conference on Computer Vision and Pattern Recognition, Salt Lake City, UT, USA, 18–22 June 2018; pp. 1808–1817. [Google Scholar]
  51. Xue, W.; Zhang, L.; Mou, X.; Bovik, A.C. Gradient Magnitude Similarity Deviation: A Highly Efficient Perceptual Image Quality Index. IEEE Trans. Image Process. 2013, 23, 684–695. [Google Scholar] [CrossRef]
  52. Rehman, M.U.; Nizami, I.F.; Ullah, F.; Hussain, I. IQA Vision Transformed: A Survey of Transformer Architectures in Perceptual Image Quality Assessment. IEEE Access 2024, 12, 183369–183393. [Google Scholar] [CrossRef]
Figure 1. Three images of the same texture from the Syntex dataset [4] accompanied by MOS scores and quality assessments from some IQA models. (a) Reference image (Curtain). (b) Synthesized image using Algorithm 1 [5]. (c) Synthesized image using Algorithm 3 [6]. It is obvious from the results that PSNR and SSIM assign quality scores that do not correlate well with MOSs, as they give low scores to the synthesized images. DISTS assigns the same score to the synthesized images. DeepDC assigns quality scores that are higher than those reflected in the MOSs. DualNetIQ assigns scores that most closely match the MOSs.
Electronics 14 01169 g001
Figure 2. The architecture of the proposed DualNetIQ for full-reference IQA.
Electronics 14 01169 g002
Figure 3. Constructing the optimal combined similarity metric using the GWO algorithm.
Electronics 14 01169 g003
Figure 4. Boxplot of SRCC values for some IQA metrics across various distortion types in TID2013, CSIQ, and LIVE datasets.
Electronics 14 01169 g004
Figure 5. Boxplot of KRCC values for some IQA metrics across various distortion types in the TID2013, CSIQ, and LIVE datasets.
Electronics 14 01169 g005
Table 1. Description of the stages of the proposed model.
Stage (i)DescriptionOutput Feature Dimension (ni)
1Input image3 × 256 × 256
2VGG19 stage1: conv1_8256 × 64 × 64
3VGG19 stage2: conv2_4512 × 32 × 32
4SqueezeNet stage1: conv1_164 × 127 × 127
5SqueezeNet stage2: conv2_6 (fire1 + fire2)128 × 64 × 64
6SqueezeNet stage3: conv3_6 (fire3 + fire4)256 × 32 × 32
7SqueezeNet stage4: conv4_6 (fire5 + fire6)384 × 16 × 16
8SqueezeNet stage5: conv5_6 (fire7 + fire8)512 × 16 × 16
Table 2. Performance comparison of the DualNetIQ model against multiple state-of-the-art FR-IQA models on four standard IQA datasets, as well as one texture similarity dataset.
MethodQuality PredictionTexture Similarity
LIVE [14]CSIQ [15]TID2013 [16]KADID-10k [17]PIPAL [18]SynTEX [4]
SRCCKRCCSRCCKRCCSRCCKRCCSRCCKRCCSRCCKRCCSRCCKRCC
PSNR0.8730.6800.8090.5990.6870.4960.6760.4880.4070.2330.3200.211
SSIM [3]0.9310.7630.8720.6780.7200.5270.7240.5370.4980.2760.6200.446
MS-SSIM [20]0.9510.8050.9060.7300.7860.6050.8260.6350.5520.2910.6320.454
FSIMc [25]0.9650.8370.9310.7680.8510.6660.8540.6650.5690.3040.0810.077
VIF [24]0.9640.8280.9110.7430.6770.5180.6790.5070.4430.2610.6060.492
NLPD [49]0.9370.7780.9320.7690.8000.6250.8120.6230.4690.2550.6060.464
PieAPP [50]0.9190.7500.8920.7150.8760.6830.8360.6470.7000.4920.7150.532
LPIPS [10]0.9320.7650.8760.6890.6700.4970.8430.6530.5730.3230.6630.478
DISTS [11]0.9540.8110.9390.7800.8300.6390.8870.7090.6240.4330.9230.759
A-DISTS [36]0.9550.8120.9420.7960.8360.6420.8900.7150.6220.4310.760-
DeepDC [12]0.9400.7810.9370.7740.8440.6510.9050.7330.6840.4670.8960.727
DualNetIQ (ours)0.9550.8150.9300.7640.8650.6780.8970.7190.6350.4520.9380.792
Table 3. Performance comparison of various IQA models on the BAPPS [10] dataset. The table displays the 2AFC scores for each model, which quantify the agreement with human judgments on image quality. Scores range from [0, 1], with higher values indicating better performance and closer alignment with human perceptual evaluations.
MethodSynthetic DistortionsDistortions by Real-World AlgorithmsAll
TraditionalCNN-BasedAllSuper
Resolution
Video
Deblurring
ColorizationFrame
Interpolation
All
Human0.8080.8440.8260.7340.6710.6880.6860.6950.739
PSNR0.5730.8010.6870.6420.5900.6240.5430.6140.633
SSIM [3]0.6050.8060.7050.6470.5890.6240.5730.6170.640
MS-SSIM [20]0.5850.7680.6760.6380.5890.5240.5720.5960.617
FSIMc [25]0.6270.7940.7100.6600.5900.5730.5810.6150.640
VSI [23]0.6300.8180.7240.6680.5920.5970.5680.6220.648
VIF [24]0.5560.7440.6500.6510.5940.5150.5970.6030.615
NLPD [49]0.5500.7640.6570.6550.5840.5280.5520.6000.615
GMSD [51]0.6090.7720.6900.6770.5940.5170.5750.6130.633
DeepIQA [1]0.7030.7940.7480.6600.5820.5850.5980.6150.650
PieAPP [50]0.7270.7700.7460.6840.5850.5940.5980.6270.659
LPIPS [10]0.7140.8140.7640.7050.6050.6250.6300.6410.692
DISTS [11]0.7490.8240.7860.7050.6000.6290.6250.6490.685
DeepDC [12]0.7570.8250.7960.7120.6080.6310.6260.6550.692
DualNetIQ (ours)0.7390.8320.7970.7190.6060.6480.6310.6610.693
Table 4. Performance of DualNetIQ against texture-resampling-insensitive methods over a subset of distortion types in the TID2013 dataset.
Noise TypeDISTS [11]A-DISTS [36]DeepDC [12]DualNetIQ
SRCCKRCCSRCCKRCCSRCCKRCCSRCCKRCC
Quantization Noise0.8310.6440.7990.620.8720.6820.8620.672
Gaussian Blur0.9380.7760.9380.7740.9540.8080.9410.78
Contrast Change0.4880.3350.4330.2890.4720.2970.4720.303
JPEG Compression0.9040.7020.9070.7090.9170.7250.9210.736
JPEG 2000 Compression0.9440.7950.9450.7970.9490.8010.9460.798
Additive Gaussian Noise0.8770.6770.8580.6510.8680.6670.8830.688
High-Frequency Noise0.8780.6590.8720.6510.8790.6630.8950.677
Impulse Noise0.7130.5060.7080.5030.6930.480.80.591
Image Denoising0.9050.7360.8920.7140.9120.7550.9230.762
Mean Shift0.8010.5940.8010.5980.7370.5380.8040.604
Change of Color Saturation0.8140.6120.8390.6440.7170.5180.8360.642
Multiplicative Gaussian Noise0.830.6160.7950.5780.8230.6110.8260.612
Table 5. Ablation study results: comparative performance of DualNetIQ using different CNN architectures as standalone feature extractors.
CNN ModelQuality PredictionTexture Similarity
LIVE [14]CSIQ [15]TID2013 [16]KADID-10k [17]SynTEX [4]
SRCCKRCCSRCCKRCCSRCCKRCCSRCCKRCCSRCCKRCC
VGG190.9540.8130.9410.7860.8330.6480.8960.7180.9280.773
SqueezeNet0.9530.8120.8960.7140.8580.6680.8810.6950.9300.778
AlexNet0.9420.7970.9000.7160.8330.6400.8600.6660.8920.713
ResNet500.8620.6810.8160.6330.7740.5780.8010.6120.6310.490
VGG19 + SqueezeNet
(DualNetIQ)
0.9550.8150.9300.7640.8650.6780.8970.7190.9380.792
Table 6. FPS and FLOPS results for five IQA models including DualNetIQ.
ModelFPSFLOPS (Billion)
LPIPS [10]9.68401
PieAPP [50]0.36827.3
DISTS [11]32.940.125
DeepDC [12]27.7756.69
DualNetIQ (ours)29.846.92
Disclaimer/Publisher’s Note: The statements, opinions and data contained in all publications are solely those of the individual author(s) and contributor(s) and not of MDPI and/or the editor(s). MDPI and/or the editor(s) disclaim responsibility for any injury to people or property resulting from any ideas, methods, instructions or products referred to in the content.

