Article

Towards Robust SDN Security: A Comparative Analysis of Oversampling Techniques with ML and DL Classifiers

1
Department of Information Systems, Faculty of Computing and Information Technology, King Abdulaziz University, Jeddah 21589, Saudi Arabia
2
Department of Computer Science, Faculty of Computing and Information Technology, King Abdulaziz University, Jeddah 21589, Saudi Arabia
3
Department of Computer Science and Artificial Intelligence, Faculty of Computer Science and Engineering, University of Jeddah, Jeddah 23890, Saudi Arabia
4
Department of Information Technology, Faculty of Computing and Information Technology, King Abdulaziz University, Jeddah 21589, Saudi Arabia
*
Author to whom correspondence should be addressed.
Electronics 2025, 14(5), 995; https://doi.org/10.3390/electronics14050995
Submission received: 9 January 2025 / Revised: 22 February 2025 / Accepted: 27 February 2025 / Published: 28 February 2025
(This article belongs to the Special Issue Security in System and Software)

Abstract

:
Software-defined networking (SDN) is becoming a predominant architecture for managing diverse networks. However, recent research has exhibited the susceptibility of SDN architectures to cyberattacks, which increases its security challenges. Many researchers have used machine learning (ML) and deep learning (DL) classifiers to mitigate cyberattacks in SDN architectures. Since SDN datasets could suffer from class imbalance issues, the classification accuracy of predictive classifiers is undermined. Therefore, this research conducts a comparative analysis of the impact of utilizing oversampling and principal component analysis (PCA) techniques on ML and DL classifiers using publicly available SDN datasets. This approach combines mitigating the class imbalance issue and maintaining the effectiveness of the performance when reducing data dimensionality. Initially, the oversampling techniques are used to balance the classes of the SDN datasets. Then, the classification performance of ML and DL classifiers is evaluated and compared to observe the effectiveness of each oversampling technique on each classifier. PCA is applied to the balanced dataset, and the classifier’s performance is evaluated and compared. The results demonstrated that Random Oversampling outperformed the other balancing techniques. Furthermore, the XGBoost and Transformer classifiers were the most sensitive models when using oversampling and PCA algorithms. In addition, macro and weighted averages of evaluation metrics were calculated to show the impact of imbalanced class datasets on each classifier.

1. Introduction

Security is considered a significant challenge when deploying a software-defined network (SDN) across many networks, despite the benefits of SDN [1]. The migration of the networks that have various conventional devices to SDNs increases the complexity of the system. Many issues need to be resolved, including the single point of failure of the centralized controller [2]. This can lead to bigger problems when the attackers take over the central controller so they can have unauthorized access and control of the network. Several cyberattacks constitute a risk to the SDN, but the distributed denial-of-service (DDoS) attack is one of the main causes because it can target the interconnected layers, including control, application, and data layers [3]. In addition, the DDoS attack can be grouped into two attacks based on the protocol level of attack, one at the network/transport layer and the other at the application layer. The communication links that link data with the control layer can be targeted by a DDoS attack. Several researchers are proposing a backup controller to eliminate DDoS attack damage, but this controller is still susceptible to the attack of DDoS [4]. Intrusion detection systems (IDSs) are standard solutions that are used for attack detection in network solutions; some of the solutions use conventional IDS, which can be a challenging aspect, while the environment of the network supports the Internet of Things (IoT) as well as traditional protocols and utilize SDN [5]. Recently, intrusion detection systems have given attention to machine learning (ML) and the subset of ML, which is deep learning (DL) for advanced attacks because of the limitations in traditional IDS [6]. The researchers explored ML in network intrusion detection [7], botnet attack detection [8], and malware detection [9]. The ability of SDNs to differentiate between control and data traffic is an important feature [10]. Complex jobs with less human intervention and low implementation costs can be possible because of this feature of SDN [11].
One significant challenge that researchers face is the imbalanced data that are transmitted to intrusion detection systems in SDN systems. The IDS is an important tool for detecting abnormal attacks and activities in a network. In SDN, network traffic and the attack distribution can create a data imbalance that might reduce the efficacy of the IDS designed based on ML [12]. Most of the datasets with intrusions include intense class imbalance ratios. A dataset called InSDN [13] has many cyberattacks like DDoS, probe attacks, and DoS. A large imbalance of class can cause lower learning algorithm performance when generalizing the minority classes [14]. The imbalanced data means that a dataset where one class, e.g., regular traffic, outbalances another class, such as malicious traffic. Since malicious activity may occur occasionally, it can be considered a minority in SDN-based IDS, as the majority of the traffic is normal in the network [12]. To cope with this imbalanced data, techniques called resampling could be used, including oversampling the minor class and undersampling the major class, which can be useful to balance the data. Several methods can handle this, including random undersampling and the synthetic minority oversampling technique (SMOTE) [12]. An effective way to learn from unbalanced data is to oversample minority classes before training. Using the SMOTE [15] technique, the minority class is oversampled by generating synthetic samples across the line sections that connect any class of minority of k nearest neighbors. The problem of class imbalance is still a challenge in the field, and it is constantly changing despite the fact that it was initially identified decades ago [14]. The problem of class imbalance is addressed in two manners [16]. The first method is considered a method at the data level by using the technique of balancing the dataset before classification, and the second is a method at the classification level that utilizes classification techniques that are aware of imbalances. To accomplish balanced learning, the first method adds or subtracts instances from datasets of training by changing their sizes. The second method suggests models that do not change an unbalanced dataset; instead, they learn from it directly [14]. The class imbalance has been researched using the most common datasets in intrusion detection, like UNSW-NB15 [17] and NSL-KDD [18], but this issue has not been tackled in SDN intrusion publicly available datasets. The InSDN dataset can be considered one of the earliest available datasets in intrusion detection, and it is publicly accessible and created through the testbed of SDN. This dataset faces the issue of imbalanced data, like other datasets in intrusion detection. The classification performance of ML/DL classifiers becomes unstable when the training datasets are imbalanced.
Employing oversampling techniques to balance the classes of imbalanced datasets, such as using Random Oversampling, results in increasing the size of the data. Therefore, PCA can be used to reduce the dimensionality of the dataset [19].
Therefore, it is essential to study the challenges of imbalanced classes of SDN datasets when using ML/DL classifiers. In addition, there is a need to explore the impact of using oversampling techniques and PCA to mitigate class imbalance issues of SDN datasets on the performance of ML/DL classifiers.
This paper presents a comparative study to analyze the influence of oversampling techniques and PCA on the classification performance of several ML and DL classifiers. The study utilizes four publicly available IDS datasets in the SDN environment with imbalanced classes to examine the effectiveness of oversampling techniques, PCA, and various ML and DL models on classification performance. The contribution of this study can be summarized as follows:
  • Applying oversampling techniques, including Random Oversampling, synthetic minority oversampling technique (SMOTE), and adaptive synthetic sampling (ADASYN), and analyzing their results on public imbalanced SDN datasets.
  • Investigating the impact of integrating oversampling techniques with PCA on datasets to observe its impact on classification performance.
  • Addressing the challenge of class imbalance issues in SDN datasets, not limited to the InSDN dataset, which is heavily used in the literature.
  • Comparing and evaluating the classification performance of several ML and DL models before using oversampling techniques, after using oversampling techniques, using PCA, and without using PCA to present a comprehensive analysis of these methods for classifying cyberattacks in the SDN environment. The test accuracy and evaluation metrics (precision, recall, and F1-score) were computed to show in-depth analyses of the results.
  • Comparing the computational time (in seconds) of executing each oversampling technique and PCA to evaluate their computational cost.
The rest of the paper is organized as follows: Section 2 discusses the related works, Section 3 provides background information on SDN architecture, Section 4 explains the methodology used for conducting this research, Section 5 presents and discusses the findings, and Section 6 concludes the study.

2. Related Works

The fast advancement of SDN has shown a significant improvement in managing and controlling the network. However, this progress has been directed at the increased attacks that made IDS an important part of securing the environment of SDN. Several researchers have proposed methods, including ML, optimization algorithms, and DL, to improve the performance of IDS. This section provides the recent developments in IDS progress, presenting methodologies, datasets, and outcomes. A summary of the related works is shown in Table 1, as the table summarizes the details of each article, including the publication year, methods used, datasets used, and key findings.
Authors in [20] proposed an intrusion detection system to identify probe attacks using a grey wolf optimizer and light gradient boosting machine classifier. They utilized the InSDN dataset, which can be considered a benchmark dataset in SDN, to train and test the IDS that they proposed. When compared with other IDSs, the proposed IDS presented optimal performance while detecting probe attacks in SDN. Their proposed model achieved an accuracy of 99.8%, which outperforms other IDS models in the literature.
Researchers in [21] created DL-based IDS for detecting and mitigating network intrusions. Their proposed model has a number of phases, starting with the data augmentation approach called deep convolutional generative adversarial networks to tackle the imbalance data issue. Then, the feature extraction method is used to extract data input using an approach based on CenterNet. After gathering efficient features, the Slime Mold Algorithm (SMA) with ResNet152V2-based DL is used to categorize the assaults in the InSDN dataset. When the intrusion on the network is identified, the proposed model of defense is triggered to quickly return to normal network connectivity. Lastly, the authors have conducted many experiments to validate the algorithms, and their findings show that they have proposed a system that can detect and mitigate intrusion efficiently. According to their results, they achieved an accuracy of 99.65%.
The paper in [22] concentrated on using real-time flow-based characteristics to identify intrusion in SDN as early as feasible. In addition to facilitating early intrusion detection, the authors aimed to identify intrusions with fewer packets for each flow, which is helpful while an attack flow comprises fewer packets. They demonstrated the way machine learning algorithms work well while trained offline using a dataset; with fewer packets utilized to produce characteristics for the model generated by ML, its accuracy drops by about 25%. In their experiments, they observed that random forest (RF) outperformed a DL algorithm when applied to a dataset that is publicly accessible in SDN for intrusion detection. The authors accomplished an accuracy of 98.72% with the random forest algorithm when applied to the InSDN dataset. The authors also mentioned that they did not apply steps to overcome the imbalanced classes’ issues as there were imbalanced classes in the dataset.
The study in [23] used a genetic algorithm (GA) to select features using a correlation coefficient as a function of fitness. To evaluate the reliance on the objective variable, mutual information (MI) was utilized for ranking the features. To detect threats in IoT networks, a hybrid DNN algorithm was trained using the chosen optimal characteristics. In order to train the input data, the hybrid DNN combines bidirectional long short-term memory, CNN, and bi-gated recurrent Units. In addition to an ablation investigation, the effectiveness of their suggested model was compared to a number of alternative baseline DL models. The model’s efficacy was evaluated using three important datasets: InSDN, UNSW-NB15, and CICIoT 2023, which included a variety of attack scenarios. With less use of resources, the suggested model outperforms the current model in terms of detection time and accuracy. They achieved an accuracy of 98.66%.
The researchers in [24] proposed an approach that includes a synthetic data augmentation technique (S-DATE) and a diverse self ensemble model (D-SEM) based on the particle swarm optimizer (PSO). Their approach presented a dataset called M-En that combines three datasets from a different network architecture comprising InSDN, IoTID-20, and UNSWNB-15. Then, S-DATE is used to overcome imbalanced data distribution in the generated M-En dataset, improving the rate of detection for both regular and anomalous traffic and facilitating improved convergence of the model. They provide an ensemble model called PSO-D-SEM that uses the variety that PSO offers to manage the complicated nature of M-En networks. Each model was trained on a part of the M-En dataset and then combined with the PSO-D-SEM to increase overall performance. The test results demonstrate the advantages of their approach, with an accuracy rate of 98.9%. They further employed a statistical T-test to highlight the importance of the suggested PSO-D-SEM method in contrast to cutting-edge approaches.
The paper in [25] proposed a two-phase detection method for DDoS attacks in SDN-based multidimensional characteristics. First, a coarse-grained identification of DDoS assaults inside the network was conducted by analyzing the traffic data collected from the SDN ports of the switch. Then, multidimensional features were extracted from the traffic data going via suspected switches by building a multidimensional deep convolutional classifier (MDDCC) with CNN and wavelet decomposition. A simple classifier may be used to precisely identify attack instances based on these collected multidimensional features. Lastly, the origin of attacks in SDN networks may be effectively detected and separated by combining graph theory with restricted techniques. The experimental findings show that the suggested approach that uses very little statistical data is capable of promptly and precisely detecting SDN network threats. They evaluated their model using public and generated datasets and achieved better accuracy than traditional detection techniques. The technique effectively reduces the effect of attacks by separating the compromised nodes and confirming that genuine traffic continues to flow normally, even during network intrusions. This method protects the efficiency and security of the network by improving detection abilities and offering a barrier against an increased number of cyber threats. The MDDCC achieved an accuracy of 99.24% on the InSDN dataset.
The authors in [26] proposed a federated learning approach (FedLAD) used to counter attacks in SDN, particularly in multi-controller architectures. They used datasets called InSDN, CICDDoS2019, and CICDoS2017 to explore the effectiveness of the proposed model, and the results showed an accuracy of over 98%. Additionally, the FedLAD protocol’s capacity to identify DDoS assaults with high accuracy and low resource consumption is demonstrated by its assessment using traffic in real-time in SDN. The paper presented a method for using FL to identify DDoS attacks in large-scale SDN. They achieved a 99.86% binary classification accuracy rate when applied to the InSDN. Furthermore, they achieved an accuracy of 98.07% in FedLAD binary classification when applied to the InSDN.
The work in [27] presented a deep learning threat hunting framework (DLTHF) to defend SD-IoT data and identify attack vectors. Firstly, an unsupervised extracting features module was created that filters and converts dataset values into the protected format using the suggested long short-term memory contractive sparse AutoEncoder method in combination with data perturbation-driven encoding and normalization-driven scaling. Second, a unique Threat Detection System (TDS) that uses Multi-head Self-attention-based Bidirectional Recurrent Neural Networks (MhSaBiGRNN) was developed to identify various kinds of attacks according to the data that has been encoded. Specifically, a novel TDS approach was created where each event was examined and given a weight that was self-learned according to its level of significance. They achieved an accurate level of 99.97% with DLTHF binary classification on the InSDN dataset. Furthermore, they achieved an accuracy of 99.88 with DLTHF multi-classification on the InSDN dataset.
In [28], the authors concentrated on designing robust DL models to counteract dynamically emerging threat vectors. To provide a comprehensive IDS, they constructed an approach to compare two models, including a hybrid CNN-LSTM architecture and a Transformer encoder architecture. In particular, they aimed at the controller for SDN, which is a critical component. For the training and evaluation of the models that they developed, they used the InSDN dataset. They employed accuracy, F1 score, recall, and precision for evaluation. The Transformer model using 48 features obtained an accuracy rate of 99.02%, while the CNN-LSTM model achieved an accuracy of 99.01%.
The research in [29] presented an enhanced framework (SDN-ML-IoT) that works like an Intrusion and Prevention Detection System (IDPS) that can help with more effective detection and real-time mitigation of attacks using DDoS. To secure Internet of Things devices in the smart home from DDoS attacks, they employed the SDN-ML-IoT, which has an ML technique in an SDN context. They used a one-versus-rest (OvR) technique using an ML approach using logistic regression (LR), random forest (RF), naive Bayes (NB), and k-nearest neighbors (kNN). They compared their study to other relevant research. The authors achieved the highest rate of accuracy of 99.99% with the RF algorithm, and according to their findings, it can mitigate DDoS in 3 s or less.
Table 1. Summary of related works.
ResearchYearMethodsDatasetKey Findings
[20]2023(GWO) and (LightGBM)InSDNAn accuracy of 99.8%.
[21]2024(DCGAN), CenterNet-based approach and ResNet152V2 with Slime Mold Algorithm (SMA)InSDNAn accuracy of 99.65%.
[22]2023(RF)InSDNAn accuracy of 98.72%.
[23]2024(GA), (MI), bidirectional long short-term memory, CNN, and bi-gated recurrent Units.InSDN, UNSW-NB15, and CICIoT 2023An accuracy of 98.66%.
[24]2024(S-DATE) and (D-SEM) based on (PSO).InSDN, IoTID-20 and UNSWNB-15An accuracy of 98.9%.
[25]2024(MDDCC) with wavelet decomposition and convolutional neural networksInSDNAn accuracy rate of 99.24%
[26]2025Federated learning approachInSDN, CICDDoS2019 and CICDoS2017An accuracy rate of 98.07% in FedLAD binary classification
[27]2025(DLTHF), Long Short-Term Memory Contractive Sparse AutoEncoder, and (MhSaBiGRNN)InSDNAn accuracy level of 99.97 with binary classification and an accuracy level of 99.88 with multi-classification
[28]2024CNN-LSTM and Transformer encoderInSDNThe Transformer obtains an accuracy rate of 99.02% and the CNN-LSTM achieves an accuracy level of 99.01%.
[29]2024(OvR) technique using an ML approach using (LR), (RF), (NB) and (kNN).InSDNThey achieved the highest rate of accuracy of 99.99% with RF.
The majority of research dealt with data imbalance, which results in biased models that have difficulty identifying minority attack kinds. Inconsistent selection of features frequently leads to higher computing expenses or less-than-optimal model performance. It is clear that most of the researchers have used the InSDN dataset as a benchmarking dataset in the SDN environment, but relying on one dataset for SDN may raise some concerns regarding the generalizability of systems to various or unique attacks.

3. SDN Architecture

The general architecture of SDN involves data (or infrastructure), control, and application layers. These layers utilize northbound and southbound application programming interfaces (APIs) to communicate. In other words, these interfaces are used to exchange information between the layers. Nevertheless, these APIs remain closely connected to the core physical or virtual infrastructure’s forwarding components, such as switches, filters, and routers. In SDN, it has been noted that the functionalities of the forwarding elements are separated from the control and data layers. The data layer comprises data forwarding elements, whereas the control layer comprises controllers acting as a network operating system. To simplify, SDN is a revolutionary network management design that separates the control plane from the data forwarding plane to centralize management. For dynamic and centralized administration of computer network architecture, SDN integrates numerous network tools. It empowers the network managers to rapidly control the needs of the business. To manage computer network architecture centrally and dynamically, SDN incorporates several network tools [30,31,32,33].
In the data layer, SDN switches and routers are responsible for transporting packets between locations, while the control layer decides how they must travel across the network. Briefly, the primary advantage of SDN is the decoupling of the control layer from the data layer, which allows data forwarding devices to merely implement the forwarding function [34].
To clarify, SDN is a novel technology used for managing networks, offering a diverse set of applications that aims to extract as much logic from the hardware as possible. The fundamental objective is to be able to reduce the dependency on hardware and consolidate all of the network’s “intelligence” into a single controller as opposed to distributing it across all routers and/or switches. This separation of the control plane and data forwarding plane is intended to improve efficiency by lowering process durations in intermediary nodes through the use of multiple flow protocols, most commonly OpenFlow. For instance, packet forwarding in network devices is made easier by detaching those two layers. SDNs are designed to improve software applications and lessen reliance on hardware, which increases network intelligence [35].
As above, the general architecture of the SDN, as shown in Figure 1, is composed of three conceptual planes or layers [31,36,37,38,39]:
Data Plane: Also known as the forwarding plane or infrastructure layer. This layer contains physical and virtual networking switches, routers, and networking equipment that oversee forwarding data and are in charge of data routing and statistics storage. An OpenFlow switch has programmable tables that outline a course of action for each packet connected to a certain flow. The control plane can dynamically configure a flow table. In an SDN network, a switch typically searches its flow table whenever a new packet arrives to ascertain the output port. A new packet can be discarded, flooded across all end nodes, forwarded to a selected end node, or transmitted to the network controller when it enters a switch. The switches participating in this connection maintain statistical data for each flow that the control plane can access.
Control Plane: This layer is made up of at least one SDN controller. The major responsibility of this plane is to preserve a logically consolidated view that enables applications to make inferences about the behavior and characteristics of the network. The control plane supplies an application programming interface (API) to build applications and monitor the state of the network using the open interface with the devices. This layer can handle the data gathered by switches at the data plane to coordinate traffic behavior, such as flow statistics. Moreover, this plane can give tools for fault detection, make choices regarding current traffic allocations, and enforce QoS regulations since it has a global network perspective. Typically, the control plane is conceptually centralized but physically spread among controller devices.
Application Plane: In this top layer, all the features and services are defined. Applications that operate across the network infrastructure must be executed by the application plane, which hosts the applications that are not related to the control plane. These programs often include some level of human interaction when making changes to the network components, such as the network’s routing behavior. For instance, examples of network applications employed on this layer include network visualization, network provisioning, and path reservation. SDN applications take advantage of the separation of the application functionality from the network equipment in addition to the logical centralized nature of the network control for directly sharing the intended aims and methods in a centralized superior fashion without getting bound by the specifics of how the basic infrastructure is implemented and distributed between states.
Every one of the three layers interacts and depends on the others. The main benefit of the SDN design is that it gives users a comprehensive perspective of all the network applications available, thereby turning the network into a “smart” system. In addition, since SDN is a virtual network overlay, there is no requirement that these components be situated in the same physical location [13].
The northbound interface oversees forwarding processes, event alerts, statistical reporting, and network capacity advertising. In essence, it gives a controller the ability to specify how the network’s hardware should behave. The northbound interface offers abstractions to ensure programming language and controller platform-independent support. Stated differently, high-level abstract programming languages are critical to programming simplification in SDN. Network engineers employ language abstractions like Frenetic [40], Pyretic [41], Procera [42], and NetCore [43] for application development to avoid disclosing the intricacies of South-bound APIs. For instance, REST north-bound APIs are supported by both FloodLight and OpenDaylight SDN controllers. One commonality among these four abstract programming languages is their ability to work with the NOX/POX controllers to translate a few high-level rules into complex OpenFlow instructions [44].
The desire for a new network architectural design came from the loss of the ability of current fixed network infrastructures and dependence on established protocols to manage the dramatically rising volume of traffic and its service requirements without resorting to over-provisioning, which is both expensive and ineffective. Furthermore, network operators’ flexibility was severely constrained by their reliance on suppliers that created specialized computers for varied uses. As a result, the innovation potential was limited by both vendor dependency and long-established procedures. To solve this, the SDN paradigm in communication networks separates control (control plane) from forwarding (data plane). Using open protocols like OpenFlow, applications run on a logically centralized controller to manage how routers and switches act in the network on a dynamic basis [45].
Figure 1. SDN architecture.
Electronics 14 00995 g001
Fortunately, the latest solutions in this area do not need large changes to the forwarding switches and routers, making them appealing not just to the academic community but also to the networking business. For example, OpenFlow-enabled devices may readily exist simultaneously with conventional Ethernet devices, allowing for gradual adoption (i.e., without disrupting existing networks) [46,47]. To improve security, OpenFlow version 1.5.1 suggested header encryption; however, the security settings are currently optional and are anticipated to be fixed in future protocol versions [48].

4. Methodology

In this study, we conducted a series of scientific experiments to compare the impact of using three oversampling algorithms and PCA on several ML and DL models with four SDN datasets, as shown in Figure 2. To the best of our knowledge, most of the publicly available SDN datasets suffer from class imbalance issues. Therefore, several oversampling techniques, named Random Oversampling, SMOTE, and ADASYN, were utilized to balance the classes of the SDN datasets. In addition, we also studied the impact of applying PCA to the data after using the aforementioned oversampling algorithms to study its effectiveness. We trained several ML and DL classifiers such as DT, RF, XGBoost, Transformer, and DNN to compare their classification performance using the discussed techniques.
The workflow outlines a comparative analysis process for evaluating different datasets using ML and DL classifiers. All datasets were specific to the SDN environment. Selected datasets were loaded for processing as part of the data import procedure. Preprocessing operations like resolving missing values and eliminating duplicate rows were carried out in the cleaning stage to guarantee data quality. We used data.dropna() function provided by Python libraries to remove missing values that are referred to NaN from the datasets. This is useful for cleaning tasks such as handling incomplete datasets. Missing values can negatively impact ML or DL classifiers by reducing accuracy or introducing bias. These values might occur in the context of SDNs due to data packet loss or incomplete logging, making it necessary to preprocess the data effectively. Usually, datasets include noisy and unreliable data that might impact training and analysis. Furthermore, datasets employed in attack detection exhibit high dimensionality, complicating the extraction of information during training. Therefore, the elimination of inconsistent data guarantees that the classifiers can generalize better.
After that, data oversampling (or the data balancing stage) comes to address the class imbalance issue. Next, applying PCA is an optional step to reduce the dimensionality of the dataset. It retains the most significant features while discarding redundant ones. Applying ML and DL classifiers for modeling will split the dataset into two sets: training (80%) and testing (20%) to train the classifiers and evaluate their performance. The model then predicted the class labels for the testing data. The classification and evaluation phases were used to evaluate the model’s accuracy, precision, recall, and F1-score in classifying samples and assess its performance relatively to ensure a thorough evaluation of the model’s ability to classify data samples effectively. These procedures, in collaboration, ensure the development of robust models adapted to the unique challenges of SDN environments.
Figure 2. Comparative analysis workflow.
Electronics 14 00995 g002
The dataset is defined as a structured data collection that may be used to achieve different purposes. It is the foundation for all operations, strategies, and models that developers employ to analyze it [49]. Datasets typically include a number of data points organized into a single table with rows and columns. While columns provide the characteristics of the dataset, rows show the number of data points. In an SDN dataset, the columns represent the flow features, such as the source IP. However, the rows represent a unique data point or instance of data. Labeled datasets usually contain a column with labels to categorize the class of each row. They are commonly used in the field of machine learning, specifically supervised learning, while unlabeled datasets are typically used with unsupervised learning. They are utilized by developers to gather insights, make learned decisions, and train algorithms. The number of training samples relating to some classes is higher than that of other classes in circumstances when there is a data imbalance problem. In other words, class imbalance happens when there is a notable difference between two classes of the target variable, with one represented by many instances and the other by a few. Using an unbalanced dataset may result in classification or prediction bias [50,51].
Learning a classifier from an unbalanced dataset is a crucial and difficult topic in supervised learning models. In simple terms, class imbalance is a prevalent and persistent issue in classification. The term “class imbalance data” refers to information with an unbalanced distribution of classes. The number of training samples relating to some classes is higher than that of other classes in circumstances when there is a data imbalance problem. This problem, which arises when the number of samples in each class is not roughly equal, is a prevalent one in data mining. For instance, in binary classification, the data are said to be “imbalanced” if 80% of the samples belong to class A, whereas only 20% do so for class B [52]. According to conventional customs, the class with the most examples is known as the majority or negative class, while the class with the fewest examples is known as the minority or positive class [53].

4.1. Datasets Overview

SDN has specific characteristics, including its dynamic nature, centralized control, and the prevalence of certain attack types. By comparing SDN datasets with IoT datasets, for example, SDN datasets focus on cyberattacks targeting centralized network behaviors, while IoT datasets emphasize cyberattacks aimed at diverse devices. Therefore, understanding these characteristics helps researchers design optimal solutions when developing IDSs for the SDN environment.
In this study, we used four publicly available datasets specific to the SDN network: the DDoS SDN dataset [54], SDN Intrusion Detection [55], LR-HR DDoS 2024 Dataset for SDN-Based Networks [56], and the InSDN dataset [57]. They are referred to as Datasets 1, 2, 3, or 4, as shown in Table 2.

4.1.1. Dataset 1

The first dataset includes benign network traffic and DDoS attack traffic, allowing for a straightforward comparison between normal and malicious activities. This binary classification dataset contains three categorical and twenty numeric features (including the Label). Some of these features are packetins, pktperflow, byteperflow, Protocol, port_no, tot_kbps. Minority class represents anomalous data, and it is higher than typical anomaly datasets, which often have much smaller anomaly proportions. Therefore, this distribution can help models learn both classes more effectively compared to more extreme imbalances. Table 3 and Figure 3 illustrate the distribution of these data instances.
Table 3. Distribution of classes in Dataset 1.
CategoryRowsClass Distribution (%)
Benign63,33561%
DDoS40,50439%
Figure 3. Proportion of classes in Dataset 1.
Electronics 14 00995 g003

4.1.2. Dataset 2

The second dataset includes five categories: benign network traffic, DDoS attack, web attack Brute Force, Web attack Cross-Site Scripting (XSS), and Web attack Structured Query Language (SQL) Injection, containing 79 features with 1,048,083 instances after cleaning the data. This multiclass dataset is heavily imbalanced, with the benign class comprising the majority and SQL Injection being extremely rare. DDoS attacks dominate predictions due to their higher frequency compared to Web attacks. Table 4 lists the distribution of these data instances, and Figure 4 shows the proportions of the dataset’s classes. In addition, Destination Port, Flow Duration, Total Fwd Packets, Total Backward Packets, Total length of Fwd Packets, and Total length of Bwd Packets are examples of features within this dataset.

4.1.3. Dataset 3

The third dataset is extensive, including both low-rate and high-rate DDoS attacks in SDN environments. This dataset represents real-world settings, containing 22 features that were extracted from controller and network traffic, and contains 113,407 instances after cleaning the data. Some of the features of this dataset are flow_duration, protocol, srcport, dstport, byte_count, Tot Bwd Pkts, and TotLen Fwd Pkts. Table 5 and Figure 5 present the distribution of these data instances.
Table 5. Distribution of classes in Dataset 3.
CategoryRowsClass Distribution (%)
Benign42,89938%
DDoS70,50862%
Figure 5. Proportions of classes in Dataset 3.
Electronics 14 00995 g005

4.1.4. Dataset 4

The fourth dataset contains seven categories of attacks. Furthermore, the regular traffic in the produced data includes many common applications that offer services like SSL, DNS, FTP, Email, HTTPS, HTTP, and SSH. This dataset was created using four virtual machines (VMs). The total number of dataset instances is 343,939, which will be only 186,560 instances after cleaning the data. This dataset has more than 80 features such as Flow-id, Protocol, Duration, Src-IP, Dst-IP, TotLen-Fwd-Pkts, TotLen-Bwd-Pkts, SYN-Flg-Cnt, Flow-Byts/s, and Number of packets. Table 6 and Figure 6 show the distribution of these data instances.
Table 6. Distribution of classes in Dataset 4.
CategoryRowsClass Distribution (%)
DDoS73,52939.4131%
Probe61,70233.0735%
Benign35,76419.1702%
DoS14,6717.8640%
Brute Force Attacks7040.3774%
Web-Attack980.0525%
BOTNET820.0440%
U2R100.0054%
Figure 6. Proportions of classes in Dataset 4.
Electronics 14 00995 g006
Class imbalance can negatively impact classifier performance by biasing the learning process toward the majority class. In highly imbalanced datasets, such as Dataset 2, the benign class constitutes around 67.16% of the data, while some classes, such as Web Attack SQL Injection, represent only 0.0053% of the dataset. This significant disparity in class distribution means that the classifier favors the dominant class (benign) while neglecting the rare classes. As a result, the classifier may struggle to detect less frequent attacks, such as Web Attack XSS and Web Attack SQL Injection. To address this issue, oversampling techniques for minority classes can be applied to help the classifier focus more on underrepresented categories.
Principal component analysis (PCA) is a common standard approach that identifies the most relevant basis for re-expressing a given data collection by reducing dimensionality. When evaluating high-dimensional data, lowering the number or dimension of features related to a single class while maintaining their distinctiveness is essential for analyzing data [58,59]. Figure 7 illustrates the process of PCA that was used to reduce the dimensionality of the datasets. As was discussed earlier, each dataset has a number of features that are equal to n. After applying PCA, the resulting dataset will have a reduced number of features called PCA components, which can be referred to as z. In our case, the number of PCA components was 10.

4.2. Oversampling Algorithms

In data analysis, there are two primary methods for randomly resampling an unbalanced dataset: undersampling, which involves removing instances from the majority class, and oversampling, which comprises adding instances from the minority to the training dataset by copying them with replacement. Some important data that might be essential for classifier training may be dropped by undersampling strategies. While algorithms that oversample do not remove samples from the majority class, preserving original data from loss of information [60]. The main reason behind adopting oversampling techniques here is the lack of dataset instances. When the dataset contains a limited number of samples, applying undersampling techniques significantly reduces the dataset size, leading to the loss of necessary information from the majority class and less accuracy because it may not learn sufficient patterns [52].
In this research, three oversampling strategies were used: Random Oversampling, SMOTE, and ADASYN.

4.2.1. Random Oversampling

Random Oversampling is a useful process to deal with the issue of class imbalance and enhancing performance. Using this technique, original samples from the minority category are increased until the distribution of classes is balanced. It is easy to use because it indiscriminately duplicates current samples without adding any new data, while the two other strategies produce fresh synthetic data to supplement genuine instances. To clarify, Random Oversampling augments training data with numerous copies of selected minority classes. Oversampling can be performed repeatedly.
We consider the following:
  • Nmaj as the number of majority class samples.
  • Nmin as the number of minority class samples.
To balance the classes, we need to increase the number of minority class samples to match that of the majority class, as shown in Equation (1):
Number of synthetic samples needed = Nmaj − Nmin

4.2.2. SMOTE

Instead of oversampling with replacement, Chawla and colleagues suggested an oversampling strategy that aims to balance the dataset by producing synthetic samples for oversampling the minority class [15]. Recently, SMOTE has undergone several improvements and is a widely recognized approach for mitigating the effects of class imbalance in classifier construction [61]. Using feature space similarity between minority samples, this method synthesizes data [52]. For each minority instance, the k-nearest neighbors (kNN) of the same class are computed, and a subset of instances is selected at random according to the oversampling rate. The relationship between the minority instance and its closest neighbors is used to generate new synthetic instances. Consequently, the minority class’s choice limit extends wider into the majority class area, avoiding the overfitting issue [62].
The kNN algorithm is one of the most widely used anomaly detection techniques since it not only has a strong theoretical foundation but also provides high accuracy, low retraining costs, and realism and supports incremental learning [63]. kNN is a supervised regression and classification technique that makes a local approximation of the function and postpones all computation until the function has been evaluated. Based on the preponderance of a specific class in this neighborhood, kNN classification determines which group of k objects in the training set are closest to the test item. An unlabeled item is classified by computing its distance from the labeled objects, identifying its k-nearest neighbors, and using the class labels of these closest neighbors to obtain the object’s class label. The fundamental drawback of nearest neighbor-based solutions is that the KNN methodology cannot accurately label the traffic if the regular traffic data or the attack traffic does not have close enough neighbors. Complex calculations may also be needed to determine the distance between each item [64,65]. The mathematical formula for creating a new synthetic sample is shown in Equation (2):
N e w   S a m p l e = O r i g i n a l   S a m p l e + λ × ( N e a r e s t   N e i g h b o r O r i g i n a l   S a m p l e )
where λ is a random number between 0 and 1.

4.2.3. ADASYN

The fundamental concept behind ADASYN is to use a weighted distribution for different minority class instances according to their learning difficulty. This means that instances from the minority classes that are more challenging to learn generate more synthetic data than simpler instances. Consequently, the ADASYN method enhances learning concerning distributions of data in two strategies: (1) by mitigating the bias caused via the class imbalance and (2) by adaptively moving the classification decision limit in the direction of the challenging cases [10].
In fact, this algorithm builds on the methodology of SMOTE by giving those challenging minority classes more weight at the categorization border to solve the problem of overlapping between classes.
The formula as presented in Equation (3):
New Sample = Original Sample + λ × (Nearest Neighbor−Original Sample)
where λ is adjusted based on the density of the minority samples.
Algorithm 1 presents an oversampling technique. The input file, ImbalancedDataset, refers to the CSV file that contains the data of the imbalance classes dataset. In our case, these can be Datasets 1, 2, 3, or 4. The output of the algorithm is the BalancedDataset, which contains a dataset with balanced classes. To ensure the oversampling technique can focus on generating synthetic samples based solely on the feature values, separating features and labels from the dataset is necessary. This step prevents errors, as oversampling techniques generally do not operate on labels. Then, oversampling techniques (SMOTE, ADASYN, or Random Oversampling) are applied to balance the dataset by creating new samples for the minority class. The variable random_state refers to the number of the generated synthetic samples and is set to 42, as is a common practice in research [66]. This value ensures that the same synthetic data points are generated each time the code runs.
After generating new samples, they are recombined with their corresponding labels to create a complete dataset. This phase guarantees that the dataset is in the required format for ML/DL classifiers, which need both features and labels for training and evaluation. The output is a balanced dataset with evenly distributed class labels, improving classifier performance and fairness in training.
Algorithm 1: Applying an Oversampling Technique
Input:
1:ImbalancedDataset
Output:
2:BalancedDataset
Procedure:
3:Separate features and label from ImbalancedDataset
4:Apply the Oversampling technique (random_state = 42)
5:Combine Oversampled data with label
6:Save the balanced dataset to BalancedDataset
End Algorithm

4.3. ML and DL Classifiers

ML and its subset, DL classifiers, are critical tools for data analysis, pattern detection, and prediction. These models are meant to uncover patterns in datasets, making them useful for applications such as anomaly detection. Their capacity to learn and adapt from data improves predictive accuracy, driving innovation across sectors. In this paper, we trained five well-known classifiers, including decision tree (DT), random forest (RF), XGBoost, Transformer, and deep neural network (DNN), as shown in Figure 8. The objective is to compare the impact of the three oversampling techniques, with and without PCA, on the aforementioned classifiers.
The selection of these classifiers was based on their diverse attributes and suitability for the functionalities of this field. DT and RF are interpretable classifiers that efficiently handle structured data and facilitate identifying critical decision patterns. XGBoost is a robust boosting algorithm known for its superior handling of imbalanced datasets, which is vital in our experiments. Transformer classifiers capture sequential dependencies in network traffic, rendering them suitable for detecting sophisticated attacks. DNNs leverage hierarchical feature extraction to facilitate deep pattern recognition in complex datasets. This selection ensures a balance between traditional tree-based classifiers and advanced DL approaches, optimizing both interpretability and prediction efficacy. Furthermore, traditional ML classifiers (e.g., DT, RF) are computationally less expensive but may generalize well with complex attack patterns. However, DL classifiers (e.g., Transformers, DNNs) tend to achieve higher accuracy but require more resources, computation, and training time. High-complexity models enhance detection but demand more memory, limiting real-time applicability.

4.3.1. Decision Tree

Decision tree (DT) is extensively utilized in classification problems and facilitates decision-making using a tree-like model composed of decisions and their consequences. DT is a common supervised learning classification approach that works with category or numerical data in IDS. A trained DT selects numerous packet features to establish its class. An optimum DT stores the most data with the fewest number of levels. This approach offers a clear classification method, is interpretable and simple to apply, and frequently allows for improved generalization by post-construction pruning, making it a popular model in intrusion detection. The classification procedure simply involves going from the tree’s root to the leaves with a fresh sample and selecting the path at each intermediate node based on the parameters determined during the training phase [59,67].

4.3.2. Random Forest

One of the popular and powerful ML classifiers is the random forest (RF) algorithm. This algorithm operates by generating a number of trees during the training phase to predict if a class is benign or unusual. The final class prediction is produced according to a majority vote of each tree’s class predictions. Each tree is built by taking a random subset of the dataset and measuring a random subset of characteristics in each division. This unpredictability creates heterogeneity among individual trees. This technique improves forecast accuracy and helps to prevent overfitting in decision trees. Moreover, it predicts error rates more precisely than decision trees [68].

4.3.3. XGBoost

XGBoost, or Extreme Gradient Boosting, is a systematic and advanced machine learning method known for its superior prediction accuracy. This algorithm proposed by Chen and Guestrin, is based on ensemble techniques. It uses depth-first search to create trees and improve gradients using parallel processing. XGBoost improves accuracy by efficiently implementing the stochastic gradient boosting technique. It has a built-in procedure for determining feature relevance and selecting features based on numerous criteria. The system uses decision trees to forecast outcomes. The regularization term penalty helps to prevent bias and overfitting during the training phase [67,69].

4.3.4. Transformer

A Transformer model is a fast DL model that handles input sequences in parallel, making them extremely efficient for training and inference. This model is a neural network based on the attention mechanism that was primarily employed to enable translation models to evaluate the significance of individual words in the source language to predict a single word in the object language, resulting in an integrated encoder-decoder model. This approach creates the encoder and decoder without RNNs by leveraging the self-attention method for the source and object language texts, respectively, in which distinct attention layers instruct the model to concentrate on useful words and ignore words that are not relevant in the texts. Nowadays, Transformer-based architectures are utilized for numerous applications, such as computer vision, time series predictions, and natural language processing (NLP) [70,71].

4.3.5. DNN

A deep neural network (DNN) is an advanced model of an artificial neural network (ANN) that has two or more hidden layers for data processing and analyzing between the input and output. DNNs are capable of simulating complex non-linear interactions, much like shallow artificial neural networks. The primary function of a neural network is to accept a collection of inputs, execute more sophisticated computations on them, and output results to solve real-world problems such as categorization. Every layer in DNN consists of one or more artificial nodes or neurons in such a way that these nodes are interconnected from layer to layer. This model has two advantages: its ability to learn features automatically and its scalability. Furthermore, the information is processed and propagated through DNN in a feed-forward fashion, that is, throughout the hidden layers from the input to the output layers [72,73].
Table 7 lists each classifier’s parameters along with their values and descriptions. These parameters were used in the experiments conducted in this study.
In XGBoost, the n_estimators parameter is set to 50, which is the boosting iterations, and it is used to speed up training and lower memory usage. The maximum depth, max_depth, is used as a default value when training the XGBoost classifier, which is 6. The learning rate and learning_rate are set to 0.1, as decreasing this number helps reduce overfitting and increases the generality of training [74]. The common values of subsample and colsample_bytree are 0.8 [75]. The random_state is set to 42 because it is a default value. The eval_metric is set to mlogloss when using multiclass classification and logloss when using binary classification.
In RF, the n_estimators parameter is set to 100 [76] as a default value, and max_depth is set to 10, which is common in practice. The minimum number of samples required to split an internal node in each decision tree, min_samples_split, is set to 10 to reduce overfitting and improve generalization. The minimum number of samples required to be in a leaf node, min_samples_leaf, is set to 5 to reduce variance and overfitting [77]. max_features is set to sqrt as a default parameter, which is used to set the number of features that are randomly selected for each split in the decision trees. The common parameters between DT and RF have similar values.
For the Transformer model, the embedding layer is set to Linear (input_dim -> 128), as the dataset contains numerical features. The encoder layers parameter is set to 3 to speed up training. The hidden dimension is set to 128, the number of heads is set to 8, the feedforward dimension is set to 512, and the number of layers is set to 3, as these parameters are efficient choices for tabular datasets. The loss function, learning rate, and batch size are set to default values [78]. Adam optimizer is used. Epochs are set to 10 to speed training and avoid unnecessary training of the model.
In DNN, the dense parameter of the input layer is set to 128 neurons, and ReLU is used as an activation function. These values are common with tabular datasets. The dropout of layer 1 is set to 0.3, and the dropout of layer 2 is set to 0.2 to maintain the generality of the model and reduce overfitting. For the output layer, the activation function is softmax, as it is commonly used with multiclass classification. The number of Epochs is set to 20. The batch size is set to 32, as it is the default [79].
Table 7. Classifiers parameters.
ClassifierParameterValueDescription
XGBoostn_estimators50The number of boosting rounds. Higher values can improve performance but increase computation time.
max_depth6Maximum depth of each tree. Limits complexity to avoid overfitting.
learning_rate0.1Step size shrinkage to prevent overfitting and improve generalization.
subsample0.8Fraction of training samples used per boosting round to prevent overfitting.
colsample_bytree0.8Fraction of features used per tree to enhance diversity.
random_state42Ensures reproducibility by setting a seed for the random number generator.
eval_metricmloglossEvaluation metric used to measure model performance in multi-class classification.
RFn_estimators100Number of trees in the forest. Higher values improve performance but increase computation time.
max_depth10Maximum depth of each tree. Limits overfitting by restricting tree depth.
min_samples_split10Minimum number of samples required to split an internal node. Higher values prevent unnecessary splits.
min_samples_leaf5Minimum number of samples required in a leaf node. Prevents learning noise by ensuring meaningful leaf nodes.
max_featuressqrtNumber of features considered at each split. ’sqrt’ selects the square root of total features to reduce overfitting.
random_state42Ensures reproducibility by setting a seed for the random number generator.
DTmax_depth10Maximum depth of each tree. Limits overfitting by restricting tree depth.
min_samples_split10Minimum number of samples required to split an internal node. Higher values prevent unnecessary splits.
min_samples_leaf5Minimum number of samples required in a leaf node. Prevents learning noise by ensuring meaningful leaf nodes.
random_state42Ensures reproducibility by setting a seed for the random number generator.
TransformerEmbedding LayerLinear (input_dim -> 128)Embedding layer maps input features to a 128-dimensional space.
Encoder Layers3Transformer encoder applies attention mechanisms across input features.
Hidden Dimension (d_model)128Hidden dimension size used in Transformer encoder layers.
Number of Heads (nhead)8Number of attention heads in the Transformer model.
Feedforward Dimension512Dimension of the feedforward network within each Transformer encoder layer.
Number of Layers3Number of Transformer encoder layers stacked sequentially.
OptimizerAdamAdam optimizer is used for training the model.
Loss FunctionCrossEntropyLossCross-entropy loss function is used for classification tasks.
Batch Size32Number of samples per batch during training.
Epochs10Number of complete passes through the dataset.
Learning Rate0.001Step size for adjusting weights during training.
DNNInput LayerDense (128, activation = ‘relu’)Input layer with 128 neurons using ReLU activation function.
Hidden Layer 1Dense (64, activation = ‘relu’)First hidden layer has 64 neurons and ReLU activation.
Dropout 1Dropout(0.3)Dropout layer with a rate of 0.3 to prevent overfitting.
Hidden Layer 2Dense (64, activation = ‘relu’)Second hidden layer has 64 neurons and ReLU activation.
Dropout 2Dropout(0.2)Dropout layer with a rate of 0.2 to further reduce overfitting.
Output LayerDense(y_train.shape [1], activation = ‘softmax’)Output layer with softmax activation to classify multiple classes.
OptimizerAdamAdam optimizer is used for efficient learning.
Loss Functioncategorical_crossentropyCategorical cross-entropy loss function for multi-class classification.
Epochs20Number of times the model will go through the training dataset.
Batch Size32Number of samples per batch during training.

5. Results and Discussion

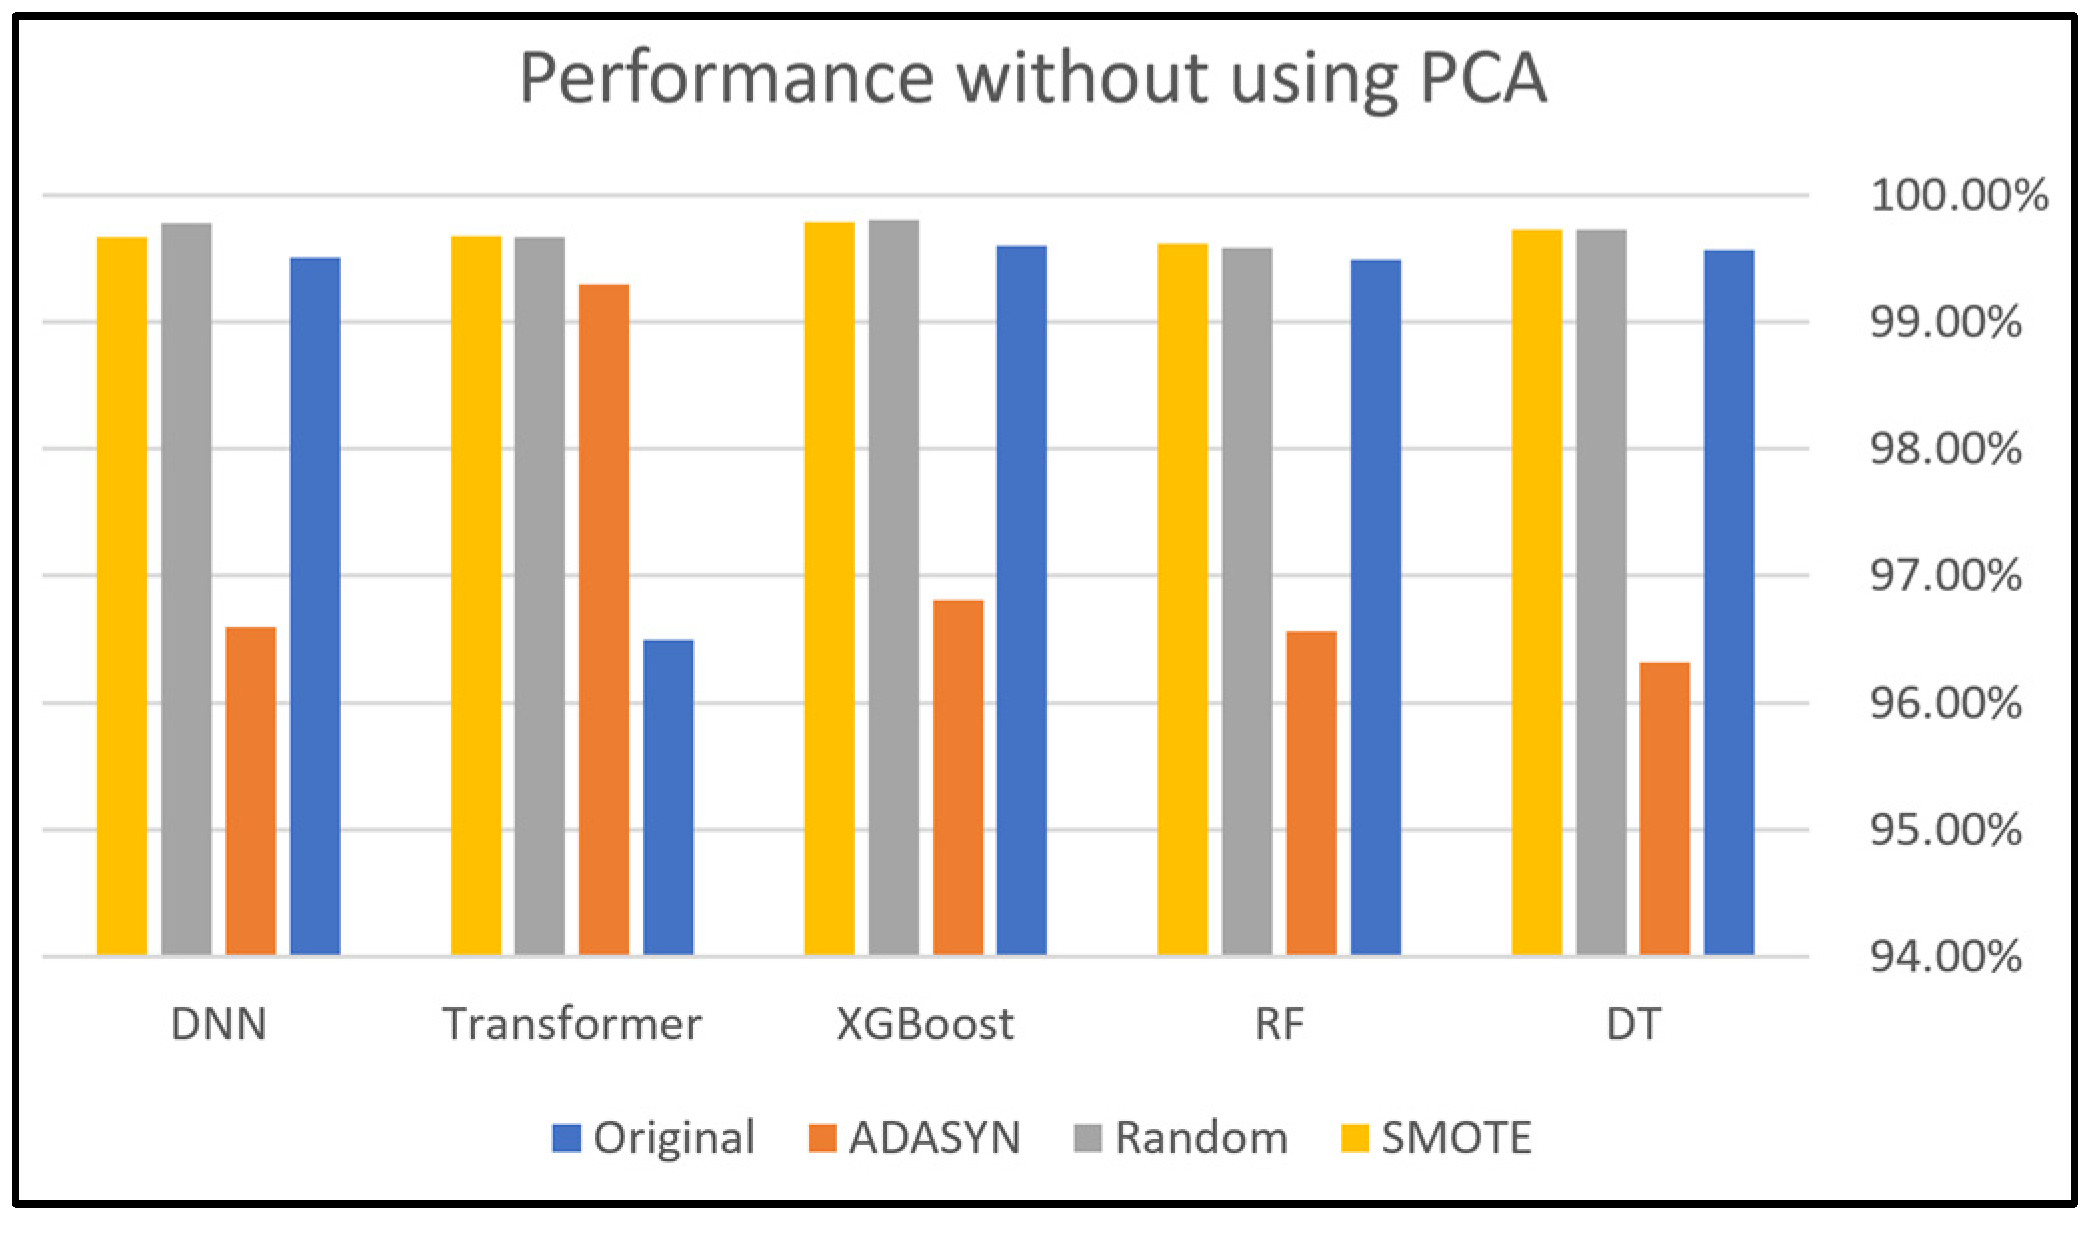
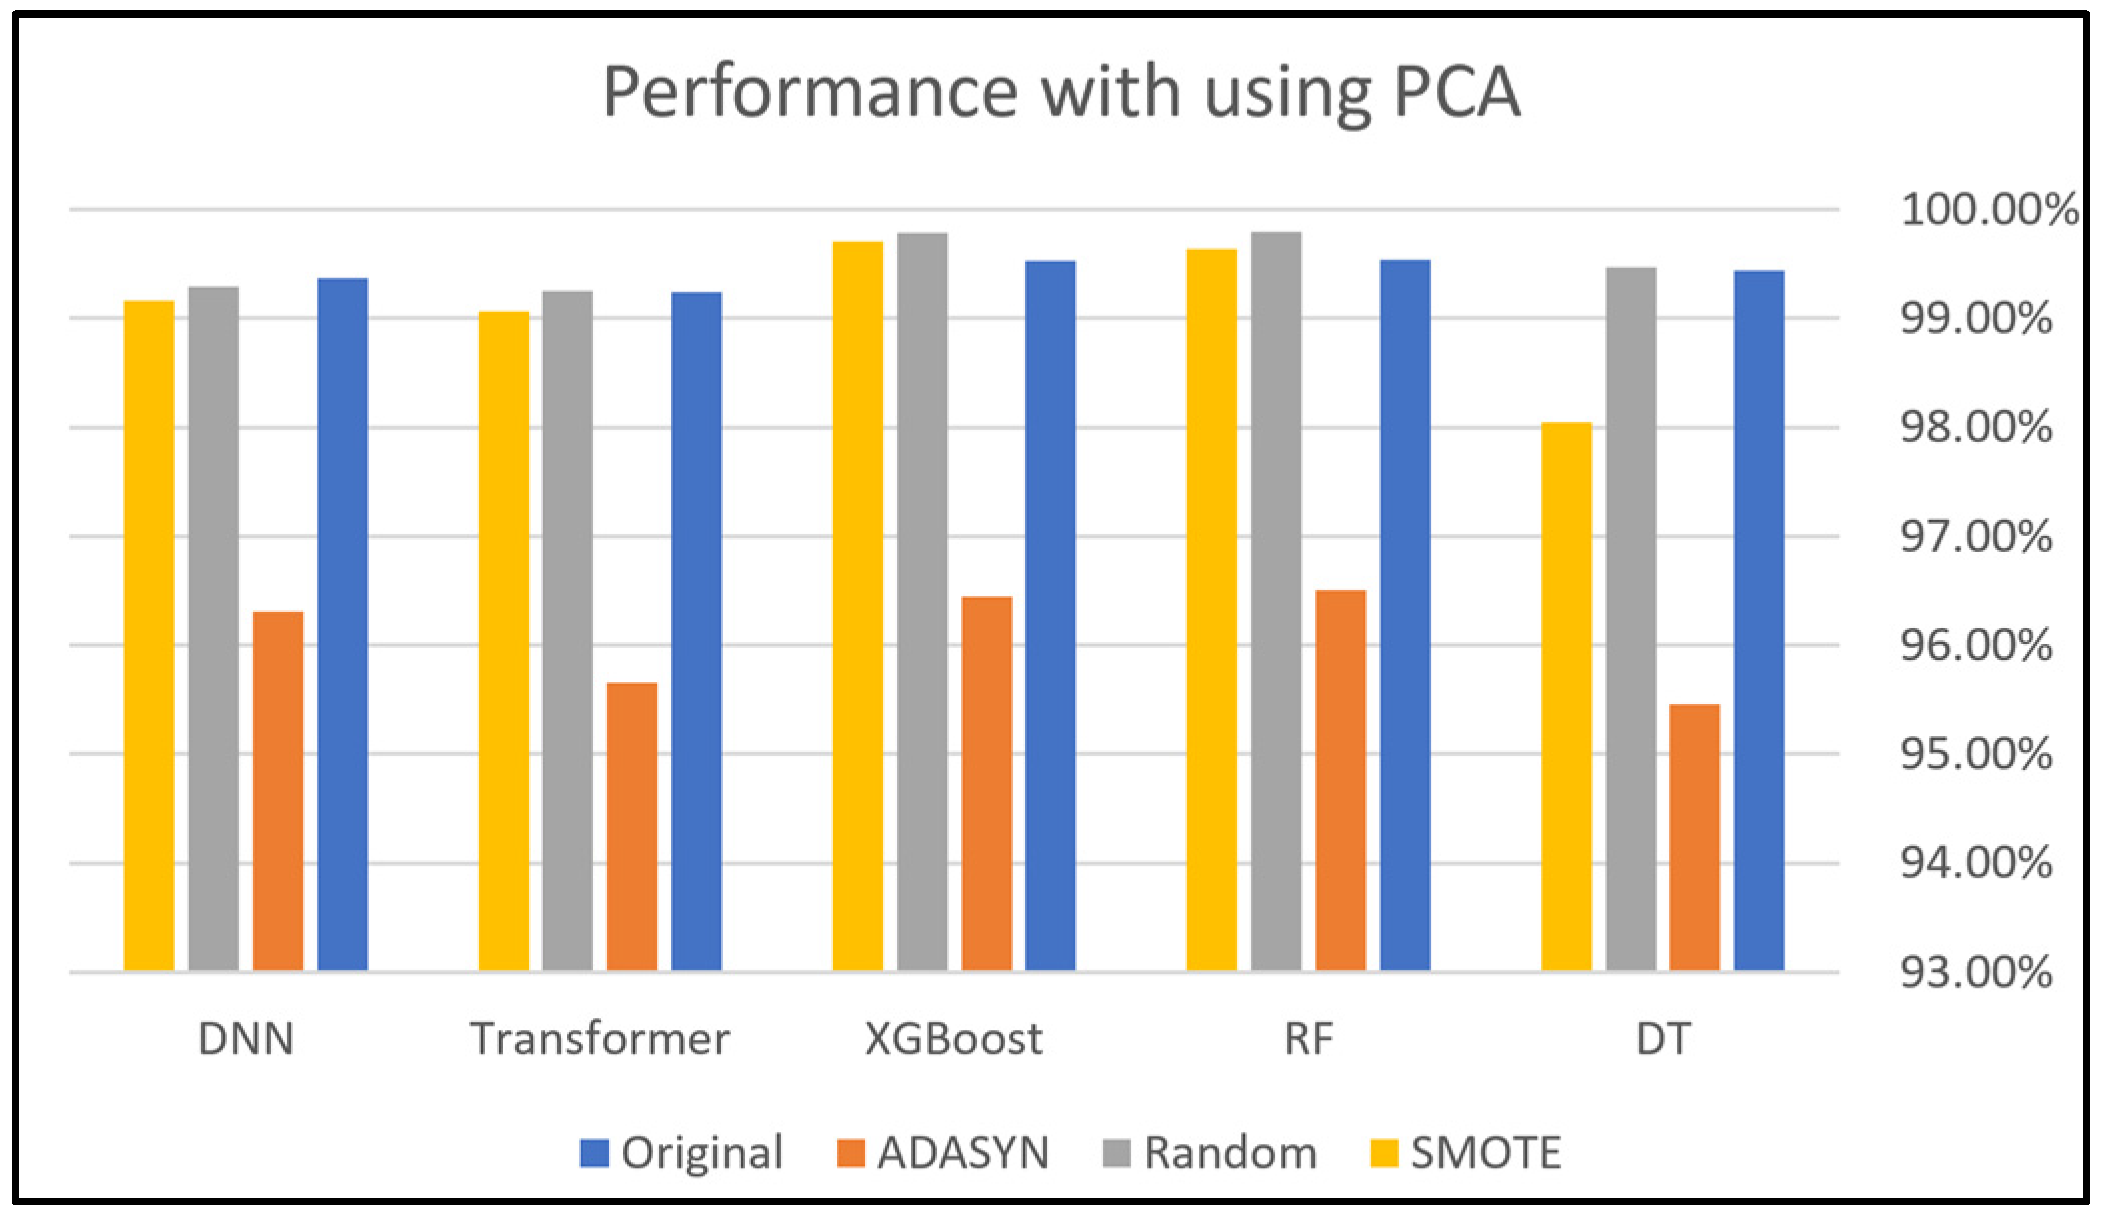
This section presents and discusses the findings of this work. A comparison study was conducted to demonstrate the impact of using oversampling techniques: Random Oversampling, SMOTE, and ADASYN on the performance of DNN, Transformer, XGBoost, RF, and DT classifiers on four SDN datasets. The original dataset, which refers to a dataset without applying oversampling techniques, was also included in this study to compare it with the oversampling techniques. In addition, this study analyzes the performance of using PCA along with these oversampling techniques to evaluate its effectiveness on classification performance. Moreover, computational cost analysis using oversampling and PCA techniques was provided in this study.
Section 5.1, Section 5.2, Section 5.3, Section 5.4 present the results of the test accuracy organized by dataset, from Dataset 1 to Dataset 4, and the results are presented in Figure 9, Figure 10, Figure 11, Figure 12, Figure 13, Figure 14, Figure 15 and Figure 16 after using Equation (4) [80].
The evaluation metrics results are discussed in Section 5.5, Section 5.6, Section 5.7, Section 5.8, Section 5.9, organized by the classifier (DT, RF, XGBoost, Transformer, and DNN). Table 8, Table 9, Table 10, Table 11 and Table 12 list the calculated evaluation metrics: precision, recall, and F1-score, using Equations (5) to (7) [80].
Section 5.10 evaluates the performance of each classifier when predicting attack types.
Section 5.11 compares the performance of each classifier when using different numbers of PCA components.
Section 5.12 presents the computation cost results, which are presented in Table 13 and Table 14.
Section 5.13 delves into the limitations encountered in the research.
Lastly, Section 5.14 highlights the learned lessons and implications.
The experiments in this research were conducted on a personal computer equipped with an NVIDIA® GeForce RTX™ 4090 GPU with 24 GB of memory. All of this hardware was designed by NVIDIA, a manufacturer located in Santa Clara, CA, USA.
The processor is an Intel Core i9 14900K, with 3.20 GHz. It was manufactured by Intel Corporation, also located in Santa Clara, CA, USA. The computer is equipped with 32 GB of RAM and 1 TB of Hard Disk storage [81].
Regarding software, the Python programming language (Version 3.11.9), which runs on the Jupyter platform, was used. The imblearn library [82] was used to provide oversampling techniques: Random Oversampling, SMOTE, and ADASYN. The library Scikit-Learn [83] was used to implement the PCA algorithm [81].

5.1. Findings of Dataset 1

This subsection presents the evaluation of employing five classifiers: DNN, Transformer, XGBoost, RF, and DT classifiers to Dataset 1. Figure 9 and Figure 10 compare the accuracies of these classifiers with and without PCA, demonstrating the impact of different class-balancing techniques on each classifier’s performance. XGBoost shows the best performance with all oversampling techniques used in this study, which indicates its robust performance even without applying PCA. In addition, the DNN, RF, and DT classifiers show similar performance across all oversampling techniques, producing good results. However, the Transformer recorded the lowest performance compared to other classifiers with every oversampling technique.
Without PCA, we can say that the XGBoost classifier had the best performance overall because its accuracy was close to 100%. Specifically, the DT and DNN classifiers achieved their best performance when applying the SMOTE technique, while they performed slightly less effectively with the other two techniques. The accuracy of the Transformer classifier was good, but its best accuracy was achieved with the Random Oversampling technique. PCA sometimes improves performance, particularly in models like DT. This can be attributed to PCA reducing dimensionality and noise, which makes it easier for ML/DL models to learn significant patterns. The DNN and RF models have great stability and resilience; however, the XGBoost model was heavily impacted when using PCA, as shown in Figure 10, which is the opposite scenario compared to Figure 9. The sensitivity of this model comes from its performance, which varies by data preprocessing and PCA. The variability in accuracy across oversampling techniques indicates that XGBoost is highly influenced by data distribution. This dual approach mitigates the risk of overfitting while maintaining the robustness of the model.
The primary strength of XGBoost lies in its capability to refine predictions from the errors of previous steps, incorporating both a convex loss function and a penalty term that addresses model complexity. The implementation of this dual approach serves to mitigate the risk of overfitting while concurrently maintaining the robustness of the model.
As a gradient-boosting algorithm, its iterative error optimization process amplifies the impact of even minor changes in the input data. This makes it highly responsive to synthetic instances provided by oversampling. XGBoost functions by incrementally incorporating new trees that forecast the residuals generated by the preceding trees. The iterative process enables the model to continuously refine its predictions. The algorithm employs a gradient descent method to minimize the loss function, which is essential for enhancing the accuracy of the predictions. Moreover, PCA may contribute to this sensitivity by removing features that XGBoost relies on for accurate residual predictions. This can lead to instability, especially when combined with oversampling techniques that provide synthetic data points.
These findings also highlight the necessity of carefully selecting class-balancing approaches and dimensionality reduction strategies for optimizing model performance.
Test   Accuracy = T r u e   P o s i t i v e + T r u e   N e g a t i v e T r u e   P o s i t i v e + F a l s e   P o s i t i v e + T r u e   N e g a t i v e + F a l s e   N e g a t i v e × 100
Precision = T r u e   P o s i t i v e T r u e   P o s i t i v e + F a l s e   P o s i t i v e × 100
Recall = T r u e   P o s i t i v e T r u e   P o s i t i v e + F a l s e   N e g a t i v e × 100
F 1 - score = 2 P r e c i s i o n × R e c a l l P r e c i s i o n + R e c a l l × 100
Figure 9. Dataset 1 analysis without using PCA.
Electronics 14 00995 g009
Figure 10. Dataset 1 analysis using PCA.
Electronics 14 00995 g010

5.2. Findings for Dataset 2

Figure 11 and Figure 12 depict the effects of data balancing and PCA techniques on the same classifiers using Dataset 2. At first glance, we find that the performance of all classifiers is close to 100% before applying any data balancing techniques. In this dataset, these techniques, with all five applied classifiers, did not maintain the testing accuracy observed in the original scenario before their use; the accuracy did not exceed 90% except for the XGBoost model in the case of not using PCA. This result might be caused by the nature of this dataset and the scarcity of data instances in some classes, as previously shown in Table 4. Furthermore, this may be attributed to the fact that the original data may contain information that directly contributes to improving the model’s performance, which can become less effective when oversampling techniques are applied.
Random Oversampling outperformed the other two balancing techniques, both with PCA and without PCA, because both SMOTE and ADASYN balance a dataset by generating synthetic data that could lead to synthetic noise that may mislead the classifier. Random Oversampling balances a dataset based on duplicating samples from the minority class, which avoids synthetic noise. However, Random Oversampling could lead to overfitting issues, but using techniques such as cross-validation and PCA can help address this issue.
The success of the oversampling techniques varies according to the model’s effectiveness and the dataset’s particular properties. While ADASYN may cause early performance reductions, it can eventually lead to more adaptable synthetic samples. Also, the ADASYN technique appeared to have lower performance, coming close to 80% with the Transformer and DNN models, likely due to the complexity it introduces in the data.
Figure 11. Dataset 2 analysis without using PCA.
Electronics 14 00995 g011
Figure 12. Dataset 2 analysis using PCA.
Electronics 14 00995 g012

5.3. Findings for Dataset 3

Regarding Dataset 3, without PCA, as shown in Figure 13, the accuracy ranges from 97.32% to 100, indicating a significantly broader range of performance, which may imply that classifiers without PCA are more sensitive to fluctuations when using data balancing strategies. With PCA, as shown in Figure 14, the accuracy ranges from 97.68% to 100%, suggesting that PCA helps maintain slightly higher overall performance by reducing dimensionality and noise. Moreover, the accurate results with PCA were excellent, as it achieved over 99.50% in all cases except for the Transformer model.
Both graphs illustrate that the Transformer classifier experiences a clear drop in performance when utilizing ADASYN, reaching the lowest position among all classifiers and approaches. This shows that the Transformer model is extremely sensitive to ADASYN. This sensitivity could be attributed to the nature of the classifier itself, as the Transformer may heavily rely on the original data distribution, making any alterations (like oversampling with ADASYN) cause performance instability. As a context-aware model, Transformer learns long-range dependencies, and any alterations can introduce inconsistencies that disrupt these dependencies. Additionally, the classifier’s complexity might render it more susceptible to inconsistencies provided by these techniques. Specifically, ADASYN generates new samples for underrepresented data, which could introduce more inconsistencies, further affecting the classifier’s performance. Therefore, the Transformer’s sensitivity arises from its dependence on the original data patterns and its limited compatibility with changes provided by ADASYN. Furthermore, this classifier relies on contextual relationships, and when PCA reduces dimensionality, critical dependencies may be altered, impacting performance. Hyperparameter tuning to mitigate overfitting is one of the solutions to address this issue.
The utilization of PCA has no meaningful impact on the performance of most classifiers in Dataset 3. This could be attributed to the oversampling technique on Dataset 3, where there was no clear variance in the data, and it is known that PCA captures the highest variance in the data [80]. However, in this case, PCA contributes to slightly improving the Transformer classifier and provides more stable performance across models.
Figure 13. Dataset 3 analysis without using PCA.
Electronics 14 00995 g013
Figure 14. Dataset 3 analysis using PCA.
Electronics 14 00995 g014

5.4. Findings for Dataset 4

Figure 15 and Figure 16 show how PCA did not enhance or sustain high performance across models when paired with data balancing techniques. The transformer classifier demonstrated the lowest performance when using the original dataset compared with other classifiers, which can be attributed to its sensitivity to redundant features in the original dataset without using PCA. Irrelevant features may hinder the effective ability of the Transformer model to learn patterns. Additionally, for this classifier to function at its best, it requires descriptive and well-structured features.
It is noteworthy that the application of the ADASYN strategy on all models was the least efficient among the three balancing strategies, especially with the Transformer model, and this does not mean that the performance is not good, but we described its effectiveness among them. The performance of the Transformer when using ADASYN fell below 96% with PCA after it achieved over 99% without PCA. Random Oversampling and SMOTE were more effective than ADASYN in Figure 15 and Figure 16 because of the necessity for neighboring computations and synthetic sample creation. Random Oversampling is computationally less costly since it simply requires simple duplication.
Figure 15. Dataset 4 analysis without using PCA.
Electronics 14 00995 g015
Figure 16. Dataset 4 analysis using PCA.
Electronics 14 00995 g016
Overall, according to all previous figures, the results sometimes show a slight improvement in the performance of the ML and DL classifiers using PCA, with data balancing techniques such as Random Oversampling and SMOTE. The performance of the majority of models is maintained by the use of PCA. This comparison, however, emphasizes the necessity of using adequate preprocessing and dimensionality reduction strategies to obtain the best model performance. It is worth mentioning that the performance of oversampling techniques varies depending on the nature of the dataset, the classifier used, and the complexity of the dataset. A comparative analysis of oversampling techniques was conducted to evaluate their varying performances in the context of SDN security. Each oversampling technique handles the creation of synthetic samples differently, which influences their effectiveness. Generally, SMOTE performs better than ADASYN in high-dimensional datasets since it minimizes excessive noise while enhancing synthetic diversity. Data from SDN security typically involves high-dimensional features that affect the effectiveness of oversampling techniques. Random Oversampling is simpler but risks overfitting. Although ADASYN is adaptive, it can degrade performance in complex or noisy data. Simpler classifiers may benefit more from Random Oversampling or SMOTE, as they do not rely on complex representations. Tree-based classifiers like RF and XGBoost generally benefit from oversampling techniques that add diversity, like SMOTE and ADASYN.
This research enhances the validity of the experiments and improves the reliability of the findings by calculating evaluation metrics that include precision, recall, and F1-score. Table 8, Table 9, Table 10, Table 11 and Table 12 record the macro average (M) and weighted average (W) values of each of these metrics, which are computed using Equations (8) and (9) [80]. Here, N refers to the number of classes in a dataset, metric refers to the evaluation metric (precision, recall, or F1-score) for class i , and support refers to the number of samples in class i .
Macro average calculates the simple average of the metric for each class individually without considering the number of samples for each class. It is useful for highlighting how the classifier performs on all classes equally. However, the weighted average multiplies each metric by the proportion of samples in the class relative to the total samples to provide a realistic view of classifier performance by emphasizing larger classes.
Macro   Average = 1 N   i = 1 N M e t r i c i
Weighted   Average = i = 1 N S u p p o r t i × M e t r i c i i = 1 N S u p p o r t i

5.5. Evaluation of DT

Table 8 shows the evaluation metrics using a macro average and a weighted average for the DT classifier. The macro average evaluation for all metrics of the classifier was low using the Original Dataset 2 in both scenarios: with and without PCA. However, the performance for the same dataset was excellent when calculating the weighted average. This indicates that the performance of a classifier on imbalanced datasets can produce significant differences between macro average and weighted average metrics. After applying oversampling techniques, it is observed that the values of all evaluation metrics using macro average and weighted average become identical, which is expected since the dataset classes were balanced. Additionally, it is observed that PCA often maintains the performance of the DT classifier.
Table 8. DT Evaluation metrics report.
Oversampling TechniquesDatasetWithout PCAWith PCA
Precision (M)Precision (W)Recall (M)Recall (W)F1-Score (M) F1-Score (W)Precision (M)Precision (W)Recall (M)Recall (W)F1-Score (M) F1-Score (W)
Original10.991.001.000.990.990.990.991.001.000.990.990.99
20.671.000.591.000.581.000.671.000.591.000.581.00
31.001.001.001.001.001.001.001.001.001.001.001.00
40.921.000.991.000.941.000.880.990.810.990.840.99
ADASYN11.001.001.001.001.001.001.001.001.001.001.001.00
20.860.860.860.860.860.860.860.860.860.860.860.86
31.001.001.001.001.001.001.001.001.001.001.001.00
40.970.970.960.960.960.960.960.960.950.950.950.95
Random11.001.001.001.001.001.001.001.001.001.001.001.00
20.910.910.900.900.900.900.910.910.900.900.900.90
31.001.001.001.001.001.001.001.001.001.001.001.00
41.001.001.001.001.001.000.990.990.990.990.990.99
SMOTE11.001.001.001.001.001.001.001.001.001.001.001.00
20.900.900.890.890.890.890.900.900.890.890.890.89
31.001.001.001.001.001.001.001.001.001.001.001.00
41.001.001.001.001.001.000.980.980.980.980.980.98

5.6. Evaluation of RF

Table 9 provides an analysis of the findings of the RF classifier. When PCA is applied, there is a noticeable decline in classifier performance with Dataset 1 for all oversampling techniques. Without PCA, this dataset has distinctive features that make classification nearly perfect. Using PCA to reduce dimensions, likely discarding some of these critical features, leads to a loss of important patterns. Additionally, Dataset 2 consistently shows lower performance compared to other datasets across all those techniques.
Table 9. RF evaluation metrics report.
Oversampling TechniquesDatasetWithout PCAWith PCA
Precision (M)Precision (W)Recall (M)Recall (W)F1-Score (M) F1-Score (W)Precision (M)Precision (W)Recall (M)Recall (W)F1-Score (M) F1-Score (W)
Original11.001.001.001.001.001.000.930.940.940.940.930.94
20.741.000.581.000.561.000.731.000.601.000.561.00
31.001.001.001.001.001.001.001.001.001.001.001.00
40.890.990.830.990.850.990.881.000.831.000.851.00
ADASYN10.990.990.990.990.990.990.940.940.930.930.930.93
20.860.860.860.860.850.860.850.850.820.820.790.79
31.001.001.01.001.01.001.001.001.001.001.001.00
40.970.970.970.970.970.970.970.970.970.970.960.96
Random11.001.001.001.001.001.000.940.940.940.940.940.94
20.900.900.900.900.890.890.890.890.890.890.890.89
31.001.001.001.001.001.001.001.001.001.001.001.00
41.001.001.001.001.001.001.001.001.001.001.001.00
SMOTE11.001.001.001.001.001.000.940.940.940.940.940.94
20.890.890.890.890.880.880.890.890.880.880.880.88
31.001.001.001.001.001.001.001.001.001.001.001.00
41.001.001.001.001.001.001.001.001.001.001.001.00

5.7. Evaluation of XGBoost

Table 10 illustrates the evaluation metrics of the XGBoost classifier. When PCA is applied, there is a noticeable decline in classifier performance with Dataset 1 and Dataset 2 for original and all oversampling techniques. This decline in performance for these two datasets can be attributed to several factors, such as dropping less-variant features. Without PCA, Dataset 1 has a perfect classification, where all metrics achieved 100%. These results show the reliability of the SMOTE technique in improving the performance of the XGBoost classifier, even when PCA is used.
Table 10. XGBoost evaluation metrics report.
Oversampling TechniquesDatasetWithout PCAWith PCA
Precision (M)Precision (W)Recall (M)Recall (W)F1-Score (M) F1-Score (W)Precision (M)Precision (W)Recall (M)Recall (W)F1-Score (M) F1-Score (W)
Original11.001.001.001.001.001.000.920.930.930.930.920.93
20.901.000.731.000.751.000.731.000.601.000.571.00
31.001.001.001.001.001.001.001.001.001.001.001.00
40.891.000.861.000.871.000.891.000.851.000.871.00
ADASYN11.001.001.001.001.001.000.930.930.930.930.930.93
20.860.860.860.860.860.860.860.860.830.830.800.80
31.001.001.001.001.001.001.001.001.001.001.001.00
40.970.970.970.970.970.970.970.970.960.960.960.96
Random11.001.001.001.001.001.000.930.930.930.930.930.93
20.920.920.910.910.910.910.880.880.880.880.880.88
31.001.001.001.001.001.001.001.001.001.001.001.00
41.001.001.001.001.001.001.001.001.001.001.001.00
SMOTE11.001.001.001.001.001.000.940.940.930.930.930.93
20.900.900.890.890.890.890.880.880.880.880.870.87
31.001.001.001.001.001.001.001.001.001.001.001.00
41.001.001.001.001.001.001.001.001.001.001.001.00

5.8. Evaluation of Transformer

Table 11 presents the evaluation metrics for the Transformer classifier. The Transformer’s classification of the original data performs well across all datasets without using PCA, especially on Dataset 1 and Dataset 3. Its performance declines significantly for Dataset 2. Nonetheless, the Transformer performance has improved for Dataset 2 after using oversampling techniques. In general, model classification of original data exhibits inferior performance compared to oversampling techniques. As a result, these observations indicate the need for oversampling techniques to handle imbalance. While the ADASYN did not perform as well as the Random and SMOTE with the Transformer classifier, its ability was still higher than the original data. The slight decline in the performance of this classifier with ADASYN might be due to its inherent focus on generating synthetic samples for minority classes based on their density. This technique may provide fewer representative samples in areas of sparse data, leading to reduced generalization ability for the Transformer classifier.
Table 11. Transformer evaluation metrics report.
Oversampling TechniquesDatasetWithout PCAWith PCA
Precision (M)Precision (W)Recall (M)Recall (W)F1-Score (M) F1-Score (W)Precision (M)Precision (W)Recall (M)Recall (W)F1-Score (M) F1-Score (W)
Original10.980.980.980.980.980.980.970.980.980.970.970.97
20.501.000.591.000.531.000.500.990.580.990.530.99
31.001.001.001.001.001.001.001.001.001.001.001.00
40.730.990.681.000.701.000.760.990.740.990.750.99
ADASYN10.980.980.980.980.980.980.960.960.960.960.960.96
20.810.810.810.810.810.810.890.890.820.820.770.77
30.970.970.970.970.970.970.980.980.980.980.980.98
40.970.970.970.970.960.960.960.960.960.960.960.96
Random10.990.990.990.990.990.990.980.980.980.980.980.98
20.860.860.860.860.860.860.860.860.860.860.860.86
30.990.990.990.990.990.991.001.001.001.001.001.00
41.001.001.001.001.001.000.990.990.990.990.990.99
SMOTE10.980.980.980.980.980.980.970.970.970.970.970.97
20.860.860.860.860.860.860.850.850.850.850.850.85
31.001.001.001.001.001.001.001.001.001.001.001.00
41.001.001.001.001.001.000.990.990.990.990.990.99

5.9. Evaluation of DNN

Table 12 compares the evaluation metrics to assess the DNN classifier. The results were presented with and without PCA, highlighting the effect of dimensionality reduction on classifier accuracy. Applying this classifier to the imbalanced data before using any oversampling technique exhibits suboptimal performance for Dataset 2, with a macro precision of 70%, a macro recall of 60%, and a macro f1-score of 54%. Random Oversampling and SMOTE techniques outperformed ADASYN across all datasets. This analysis demonstrates the necessity of oversampling techniques in improving classifier performance on imbalanced datasets.
Table 12. DNN evaluation metrics report.
Oversampling TechniquesDatasetWithout PCAWith PCA
Precision (M)Precision (W)Recall (M)Recall (W)F1-Score (M) F1-Score (W)Precision (M)Precision (W)Recall (M)Recall (W)F1-Score (M) F1-Score (W)
Original10.990.990.990.990.990.990.980.980.980.980.980.98
20.701.000.601.000.541.000.701.000.600.990.540.99
31.001.001.001.001.001.001.001.001.001.001.001.00
40.881.000.841.000.851.000.860.990.810.990.830.99
ADASYN10.990.990.990.990.990.990.980.980.980.980.980.98
20.890.890.820.820.770.770.890.890.810.810.770.77
31.001.001.001.001.001.001.001.001.001.001.001.00
40.970.970.970.970.970.970.970.970.960.960.960.96
Random10.990.990.990.990.990.990.990.990.990.990.990.99
20.860.860.860.860.850.850.850.850.850.850.850.85
31.001.001.001.001.001.001.001.001.001.001.001.00
41.001.001.001.001.001.000.990.990.990.990.990.99
SMOTE10.990.990.990.990.990.990.980.980.980.980.980.98
20.860.860.860.860.860.860.820.820.800.800.800.80
31.001.001.001.001.001.001.001.001.001.001.001.00
41.001.001.001.001.001.000.990.990.990.990.990.99

5.10. Evaluation of Predicting Attack Types

This subsection is dedicated to a detailed analysis of evaluating the detection performance of attack types of Dataset 2, given the evidence from previous experiments that the performance of this dataset was affected and had different behaviors.
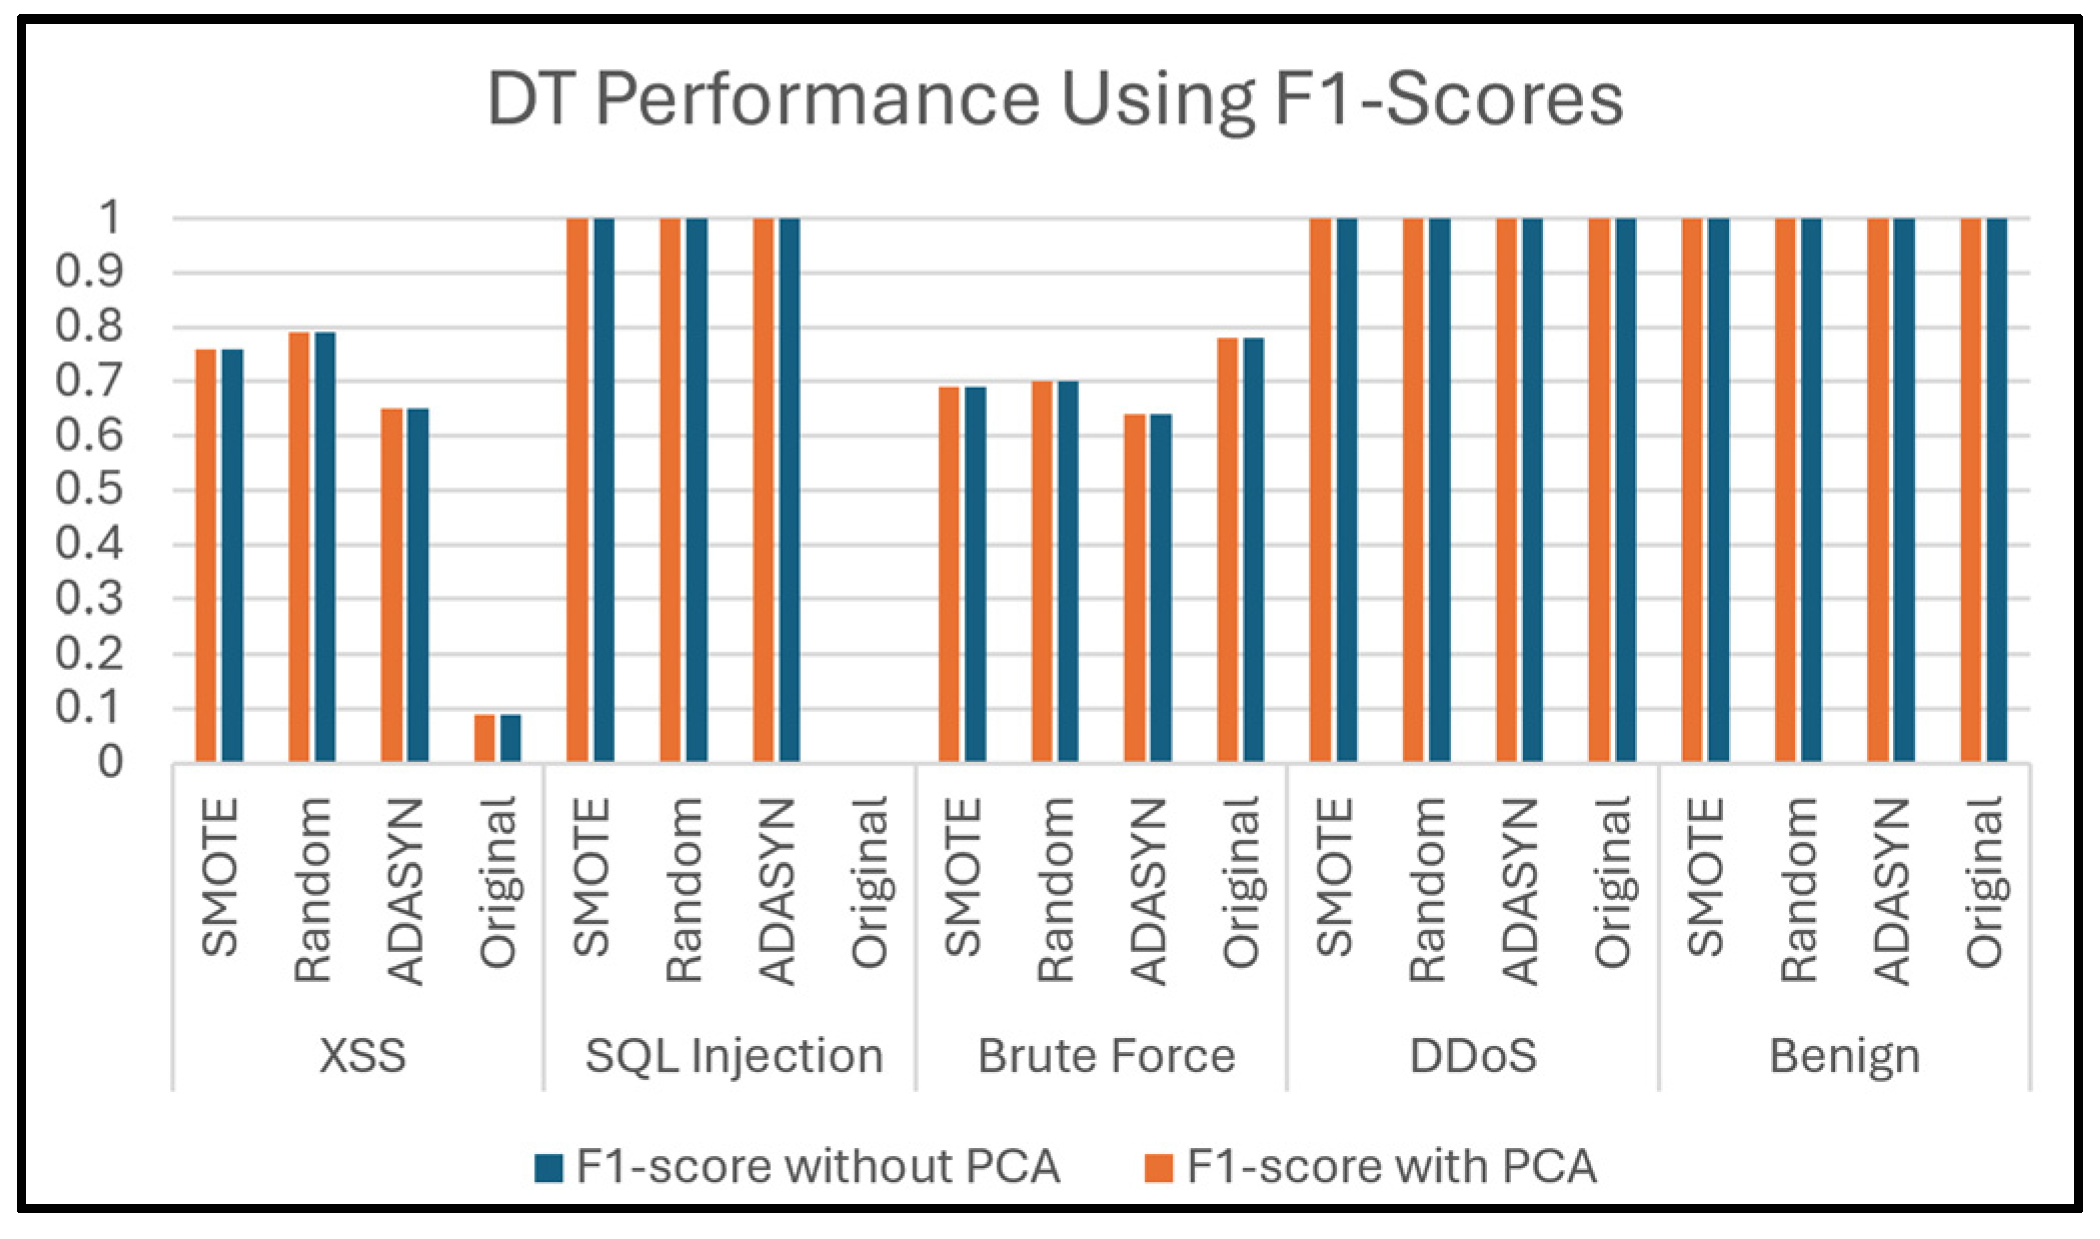
Figure 17 presents the F1-score values of the DT classifier when classifying five attack types of Dataset 2. It is clear, in the beginning, the effectiveness of PCA in maintaining performance.
For benign and DDoS attacks, the classifier achieves perfect classification with an F1-score of 1, demonstrating its excellent capability in detecting these attacks across all oversampling techniques, both with and without PCA. This indicates that the classes of these attacks are well-represented and easily distinguishable in this dataset. On the other hand, oversampling techniques maintain an F1-score of 100% in all cases, with and without PCA, suggesting that class imbalance does not impact the classifier’s ability to detect these types of attacks, irrespective of class balancing or dimensionality reduction techniques.
Conversely, for Web Attack Brute Force, the original dataset yields an F1-score of 78%, showing moderate detection performance. However, using ADASYN produces the lowest F1-score of 64% among oversampling techniques, possibly attributable to providing synthetic samples that do not accurately reflect the true distribution of Brute Force features. Random Oversampling yields 70%, while SMOTE achieves a similar score of 69%, but neither matches the performance of the original dataset.
The DT classifier struggles significantly in classification SQL Injection attacks within the original dataset, with a low F1-score of 0%. This implies that the classifier was unable to correctly classify any instances of this type in the original dataset. A likely explanation for this failure is the class imbalance, where SQL Injection attacks are underrepresented in the dataset, or the lack of sufficient training samples. All oversampling techniques (ADASYN, Random, and SMOTE) significantly improved performance, achieving an F1-score of 1 in both cases (with and without PCA), indicating the effectiveness of oversampling in handling the imbalance for this attack type. In summary, the inability of the DNN classifier to predict SQL Injection attacks in the original dataset highlights the critical role of oversampling techniques in addressing class imbalance. By balancing the dataset, oversampling allows the classifier to learn more discriminative patterns, leading to perfect classification in this situation. In addition, the absence of enhancement using PCA indicates that dimensionality reduction alone cannot resolve data representation issues.
Furthermore, the classifier achieved a low F1-score value when predicting XSS attacks in the original dataset of only 9%, indicating severe challenges in distinguishing this class, likely due to class imbalance or feature similarity. ADASYN enhances the F1-score to 65%, Random Oversampling to 79%, and SMOTE to 76%. These findings underscore that oversampling significantly helps in XSS detection, although it does not entirely resolve the challenge.
Figure 17. Prediction of attack types using DT.
Electronics 14 00995 g017
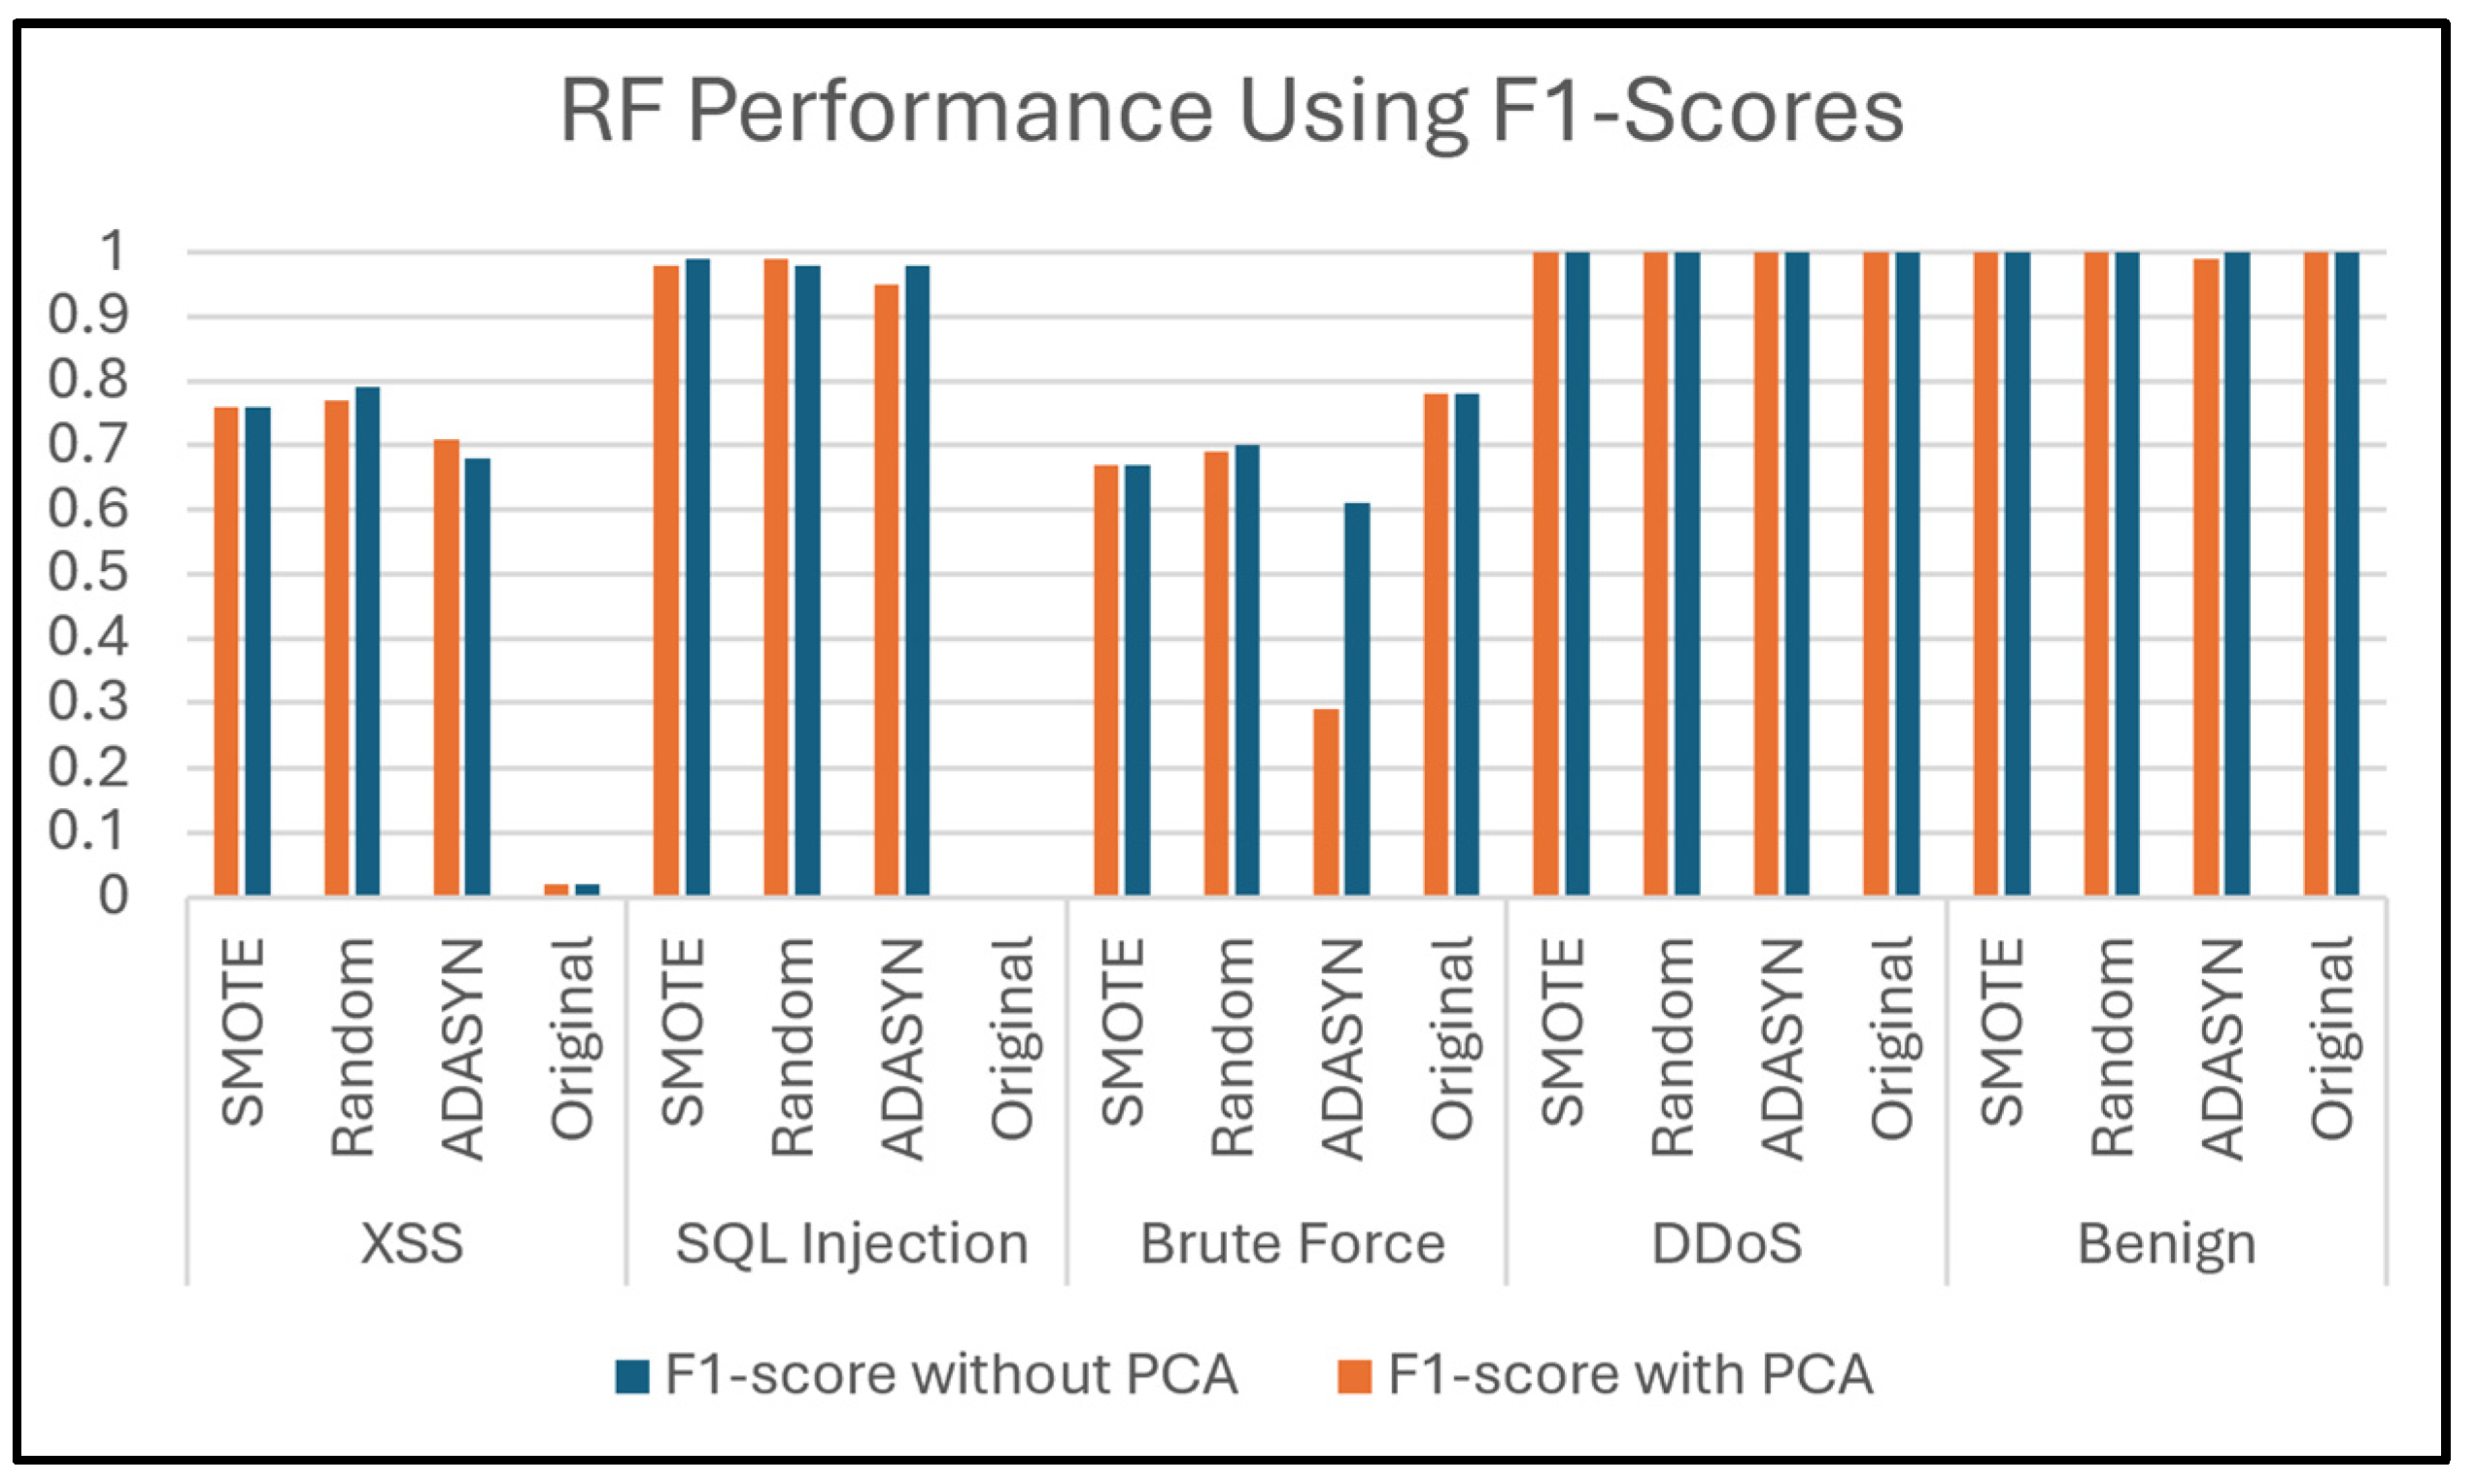
Figure 18 illustrates the F1-score values of the RF classifier when predicting attack types of Dataset 2. It is clear, only in most cases here, the effectiveness of PCA in maintaining performance.
A perfect classification is achieved by the classifier for benign and DDoS attacks and it achieves excellent prediction of these attacks across all oversampling techniques, both with and without PCA. This indicates that the classes of these attacks are well-represented and easily distinguishable in this dataset. On the other hand, oversampling techniques maintain a very high level of F1-score in all cases, with and without PCA, suggesting that class imbalance does not impact the classifier’s ability to detect these types of attacks, irrespective of class balancing or dimensionality reduction techniques.
Conversely, the original dataset of the Web Attack Brute Force class results in an F1-score of 78%, showing moderate detection performance. However, using ADASYN produces the lowest F1-score of 61% among oversampling techniques, possibly attributable to providing synthetic samples that do not accurately reflect the true distribution of Brute Force features. Random Oversampling yields 70%, while SMOTE achieves a similar score of 69%, but neither matches the performance of the original dataset. All oversampling results are almost identical (or very close) to their results without using it, except the F1-score when ADASYN was applied decreased to 29%. This consistency, in most cases, demonstrates that PCA generally does not substantially alter the F1-score across most attack types and oversampling techniques when using the RF classifier and indicates that PCA effectively retains the critical features needed for accurate classification in most cases. However, a notable exception is observed for Brute Force attacks when applying ADASYN, which may be attributed to its nature of oversampling that focuses on difficult-to-classify samples near decision boundaries and its interaction with dimensionality reduction. When PCA is applied after oversampling, it may discard some of the newly generated variations or synthetic features critical for distinguishing between Brute Force attacks and other classes.
This classifier struggles significantly in classification SQL Injection attacks within the original dataset, with a low F1-score of 0%. This implies that the classifier was unable to correctly classify any instances of this type in the original dataset. A likely explanation for this failure is the class imbalance, where SQL Injection attacks are underrepresented in the dataset, or the lack of sufficient training samples. All oversampling techniques (ADASYN, Random, and SMOTE) significantly improved performance, achieving a high F1-score (95 to 99%) in both cases, with and without PCA, indicating the effectiveness of oversampling in handling the imbalance for this attack type. In summary, the inability of the RF classifier to predict SQL Injection attacks in the original dataset highlights the critical role of oversampling techniques in addressing class imbalance. By balancing the dataset, oversampling allows the classifier to learn more discriminative patterns, leading to perfect classification in this case. In addition, the absence of enhancement using PCA indicates that dimensionality reduction alone cannot resolve data representation issues.
Furthermore, the classifier achieves extremely low in the original dataset of XSS attacks, with an F1-score of only 2%, indicating a severe challenge in distinguishing this class, likely due to class imbalance or feature similarity. Using oversampling significantly improves performance. ADASYN enhances the F1-score to 68%, Random Oversampling to 79%, and SMOTE to 76%. These findings underscore that oversampling significantly helps in XSS detection, although it does not entirely resolve the challenge. The use of PCA with this type of attack is not much different from the case of not using it.
Figure 18. Prediction of attack types using RF.
Electronics 14 00995 g018
Figure 19 depicts the F1-score values of the XGBoost classifier when predicting attack types of Dataset 2.
For benign and DDoS attacks, the classifier achieves perfect classification with a high F1-score, demonstrating excellent performance in detecting these attacks across all oversampling techniques, both with and without PCA. This indicates the robustness of the XGBoost classifier in detecting these types of attacks, irrespective of class balancing or dimensionality reduction techniques.
In contrast, for Web Attack Brute Force, the original dataset produces a high F1-score; nevertheless, the efficiency of oversampling strategies varies. Using ADASYN, the F1-score drops significantly to 63%, possibly attributable to providing synthetic samples that do not accurately reflect the true distribution of Brute Force features. Random Oversampling improves the F1-score to 75%, while SMOTE achieves a similar score of 69%, but neither matches the performance of the original dataset. PCA marginally decreases the F1-score, indicating that dimensionality reduction could eliminate essential information necessary for accurate classification.
The XGBoost classifier has difficulties in classification SQL Injection attacks within the original dataset, with a low F1-score of 56%, likely due to class imbalance or overlapping features with other attack types. Oversampling significantly improves performance. Both ADASYN and Random Oversampling lead to a perfect F1-score of 1, while SMOTE also achieves an F1-score of 1. These results highlight the effectiveness of oversampling in tickling the imbalanced nature of SQL Injection data.
Furthermore, the classifier performs poorly on XSS attacks in the original dataset, with an F1-score of only 22%, indicating severe difficulties in detecting this type, likely due to limited representation or significant overlap with other classes. Overlapping greatly improves performance. ADASYN enhances the F1-score to 68%, while Random Oversampling achieves the best score of 80%, and SMOTE yields 76%. However, PCA slightly reduces the results for all oversampling techniques, which may indicate that dimensionality reduction removes important low-variance features critical for distinguishing XSS attacks.
These findings underscore the need for careful selection of oversampling techniques and dimensionality reduction. The negligible difference between F1-scores with and without PCA suggests that dimensionality reduction does not significantly affect the performance of XGBoost for this task.
Figure 19. Prediction of attack types using XGBoost.
Electronics 14 00995 g019
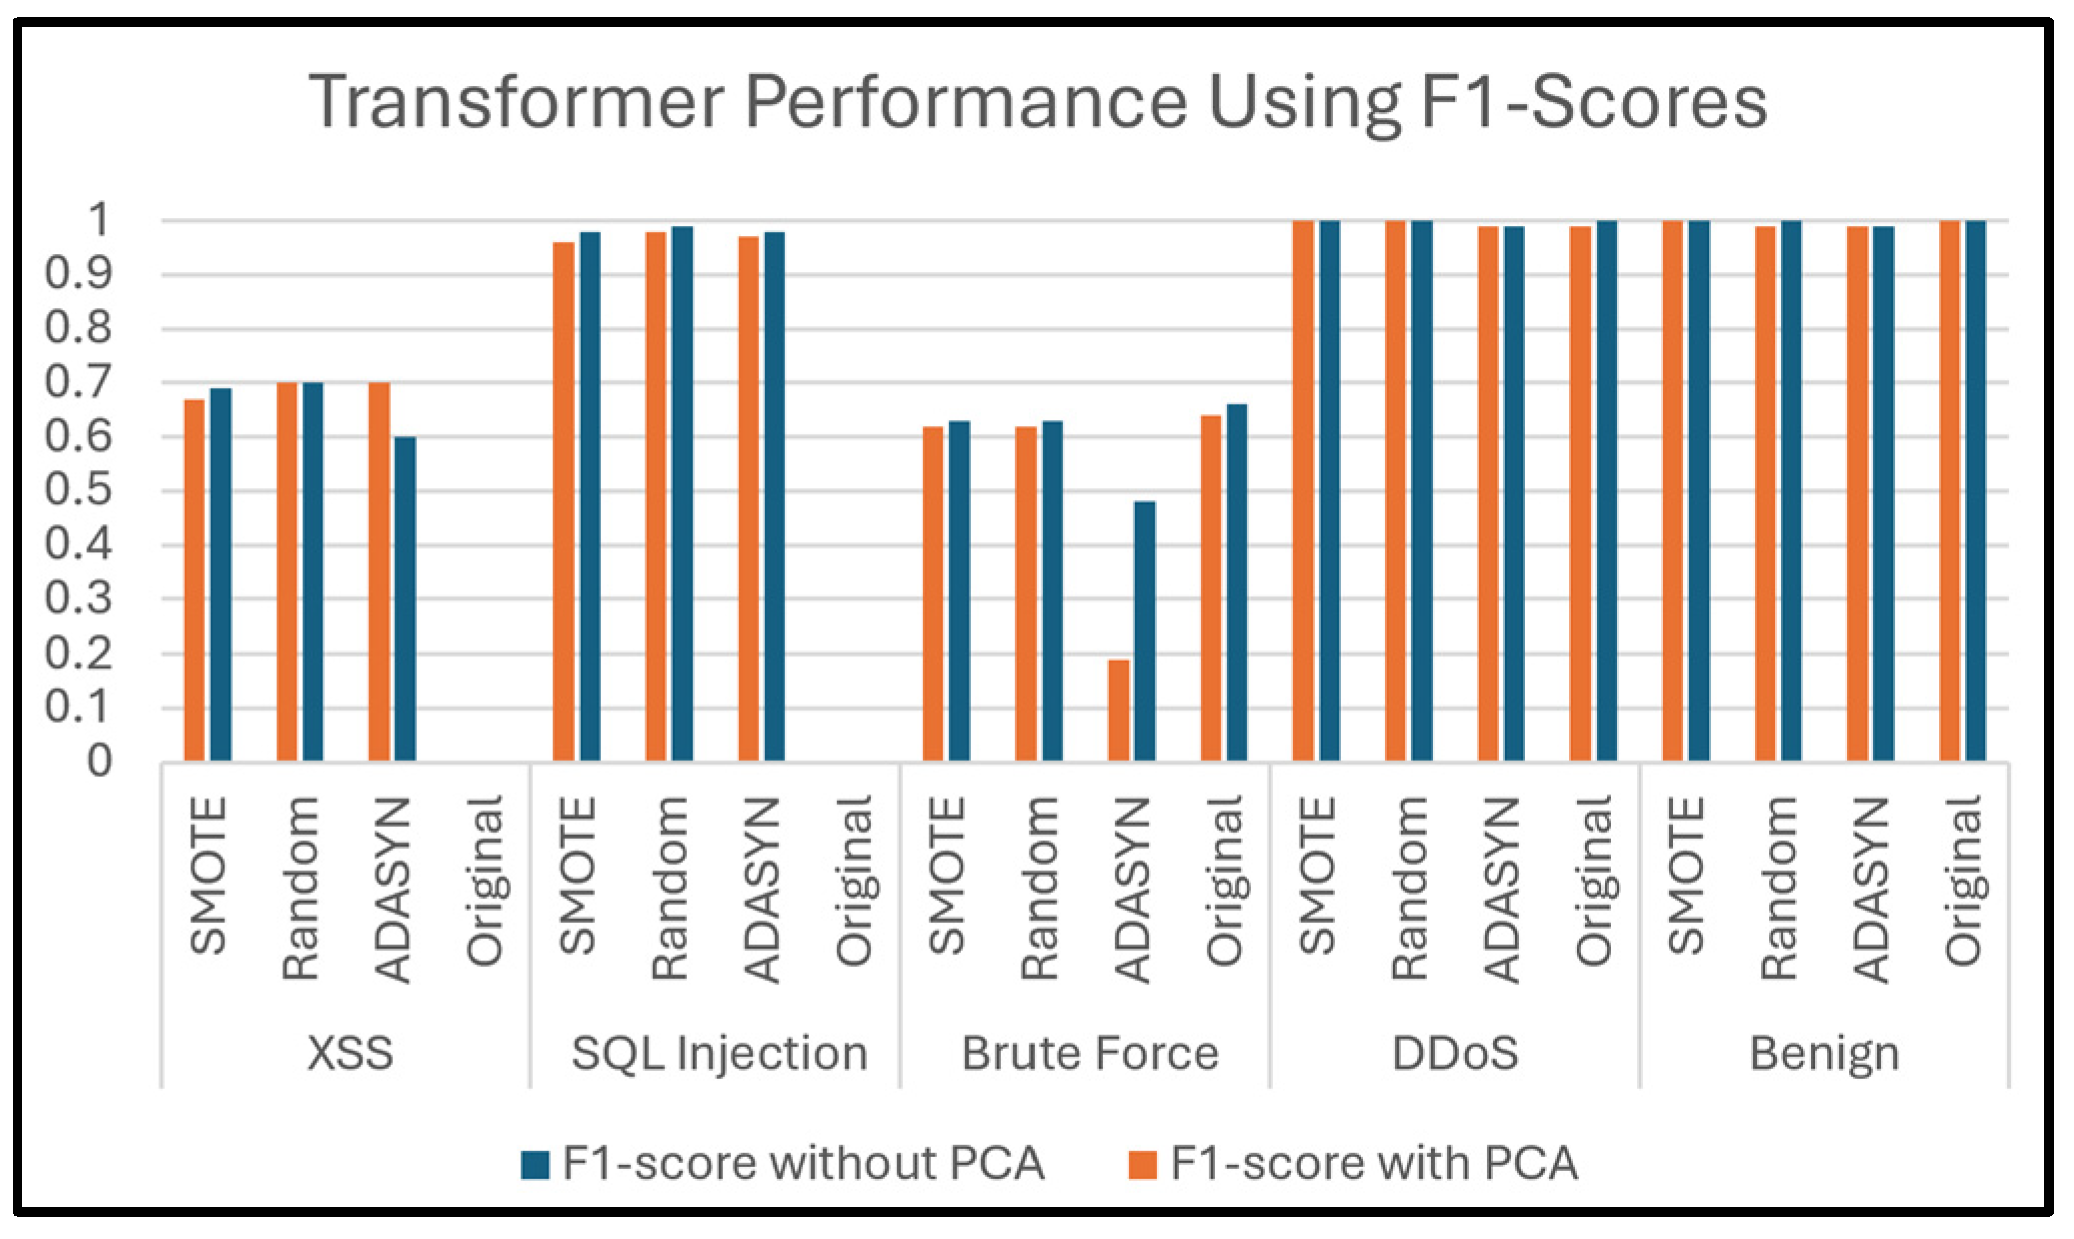
Figure 20 compares the findings of the F1-score achieved by a Transformer classifier, which reached 99% or more, achieving consistently high performance across all scenarios for benign and DDoS samples, regardless of the oversampling technique or PCA. This demonstrates that the classifier performs exceptionally well in the detection of these two types of attacks, exhibiting robustness and consistency. The use of techniques like ADASYN, Random, and SMOTE, as well as the original dataset, maintained this perfect score, showing that the classifier was highly capable of identifying these classes without misclassification. PCA also had no impact on the F1 score for these categories, indicating that the reduction in dimensionality did not affect the separability of benign and DDoS data points. This could be attributed to the inherent distinction between these classes and the others, where features were already highly discriminative.
In contrast, the results for Brute Force attacks exhibit a significant drop compared to the previous two classes. Without PCA, the scores range from 63% to 66%, depending on the oversampling technique, while applying PCA results in a slight decline to values between 62% and 64%. Applying ADASYN significantly drops the F1-score values to 48% without PCA and 19% when using PCA. This suggests that Brute Force attacks pose a greater difficulty for the classifier, and the application of PCA appears to exacerbate this challenge, especially with ADASYN. To clarify, their data may have specific features that are either lost during dimensionality reduction or are not well represented by synthetic samples generated by this oversample algorithm. SMOTE and Random Oversampling yield comparable results to the original dataset, implying that they neither significantly enhance nor degrade detection capability.
The classifier performs relatively well for SQL Injection and XSS attacks, with F1 scores between 96% and 99% for the first type and between 60% and 70% for XSS among all oversampling techniques in the absence of PCA. Also, the performance of XSS was significantly lower compared to SQL Injection. With PCA, the scores remain stable for SQL Injection but slightly vary for XSS. Notably, oversampling improves performance for XSS detection by ADASYN and Random Oversampling. The actual problem lies in the original data, where the F1-score was 0% for SQL Injection and XSS. This demonstrates that the Transformer classifier suffers significant challenges in the classification of these two classes before using oversampling techniques. Overall, the findings highlight that the classifier’s performance is heavily influenced by the attack type and the chosen data preprocessing technique.
Figure 20. Prediction of attack types using Transformer.
Electronics 14 00995 g020
Figure 21 shows the evaluation of the DNN classifier performance using the F1-score when predicting attack types of Dataset 2. A perfect classification is achieved by the classifier for benign and DDoS attacks and it achieves perfect identification of these attacks across all oversampling techniques, both with and without PCA. This indicates the robustness of the DNN classifier in detecting these types of attacks, irrespective of class balancing or dimensionality reduction techniques.
On the other hand, for Web Attack Brute Force, the original dataset yields a high F1-score, but oversampling techniques show varying effectiveness. Using ADASYN, the F1-score drops significantly to 19%, possibly attributable to providing synthetic samples that do not accurately reflect the true distribution of Brute Force features. Random Oversampling improves the F1-score to 55%, while SMOTE achieves a similar score of 59%, but neither matches the performance of the original dataset. PCA marginally decreases the F1-score, indicating that dimensionality reduction could eliminate essential information necessary for accurate classification.
The DNN classifier has difficulties in classifying SQL Injection attacks within the original dataset, evidenced by an extremely low F1-score of 0%, likely due to class imbalance or overlapping features with other attack types. Oversampling significantly improves performance. All oversampling techniques lead to a high level of F1-score (98% without using PCA), highlighting the effectiveness of oversampling for addressing the imbalanced nature of SQL Injection data. However, PCA slightly reduces F1-scores for the SMOTE technique, which may indicate that dimensionality reduction removes important low-variance features critical for differentiating SQL Injection attacks.
Moreover, the classifier exhibits inadequate performance on XSS assaults in the original dataset, achieving an F1-score of only 2%, which suggests substantial challenges in identifying this type might be attributable to insufficient representation or significant overlap with other classes. There is considerable performance improvement when overlap occurs. ADASYN enhances the F1-score to 70%, while Random Oversampling and SMOTE achieve a score of 71%. These findings underscore the need for careful selection of oversampling techniques and dimensionality reduction. The negligible difference between F1-scores with and without PCA suggests that dimensionality reduction does not significantly affect the performance of DNN for this task. Lastly, it is clear, in most cases, the effectiveness of PCA in maintaining performance.
Figure 21. Prediction of attack types using DNN.
Electronics 14 00995 g021
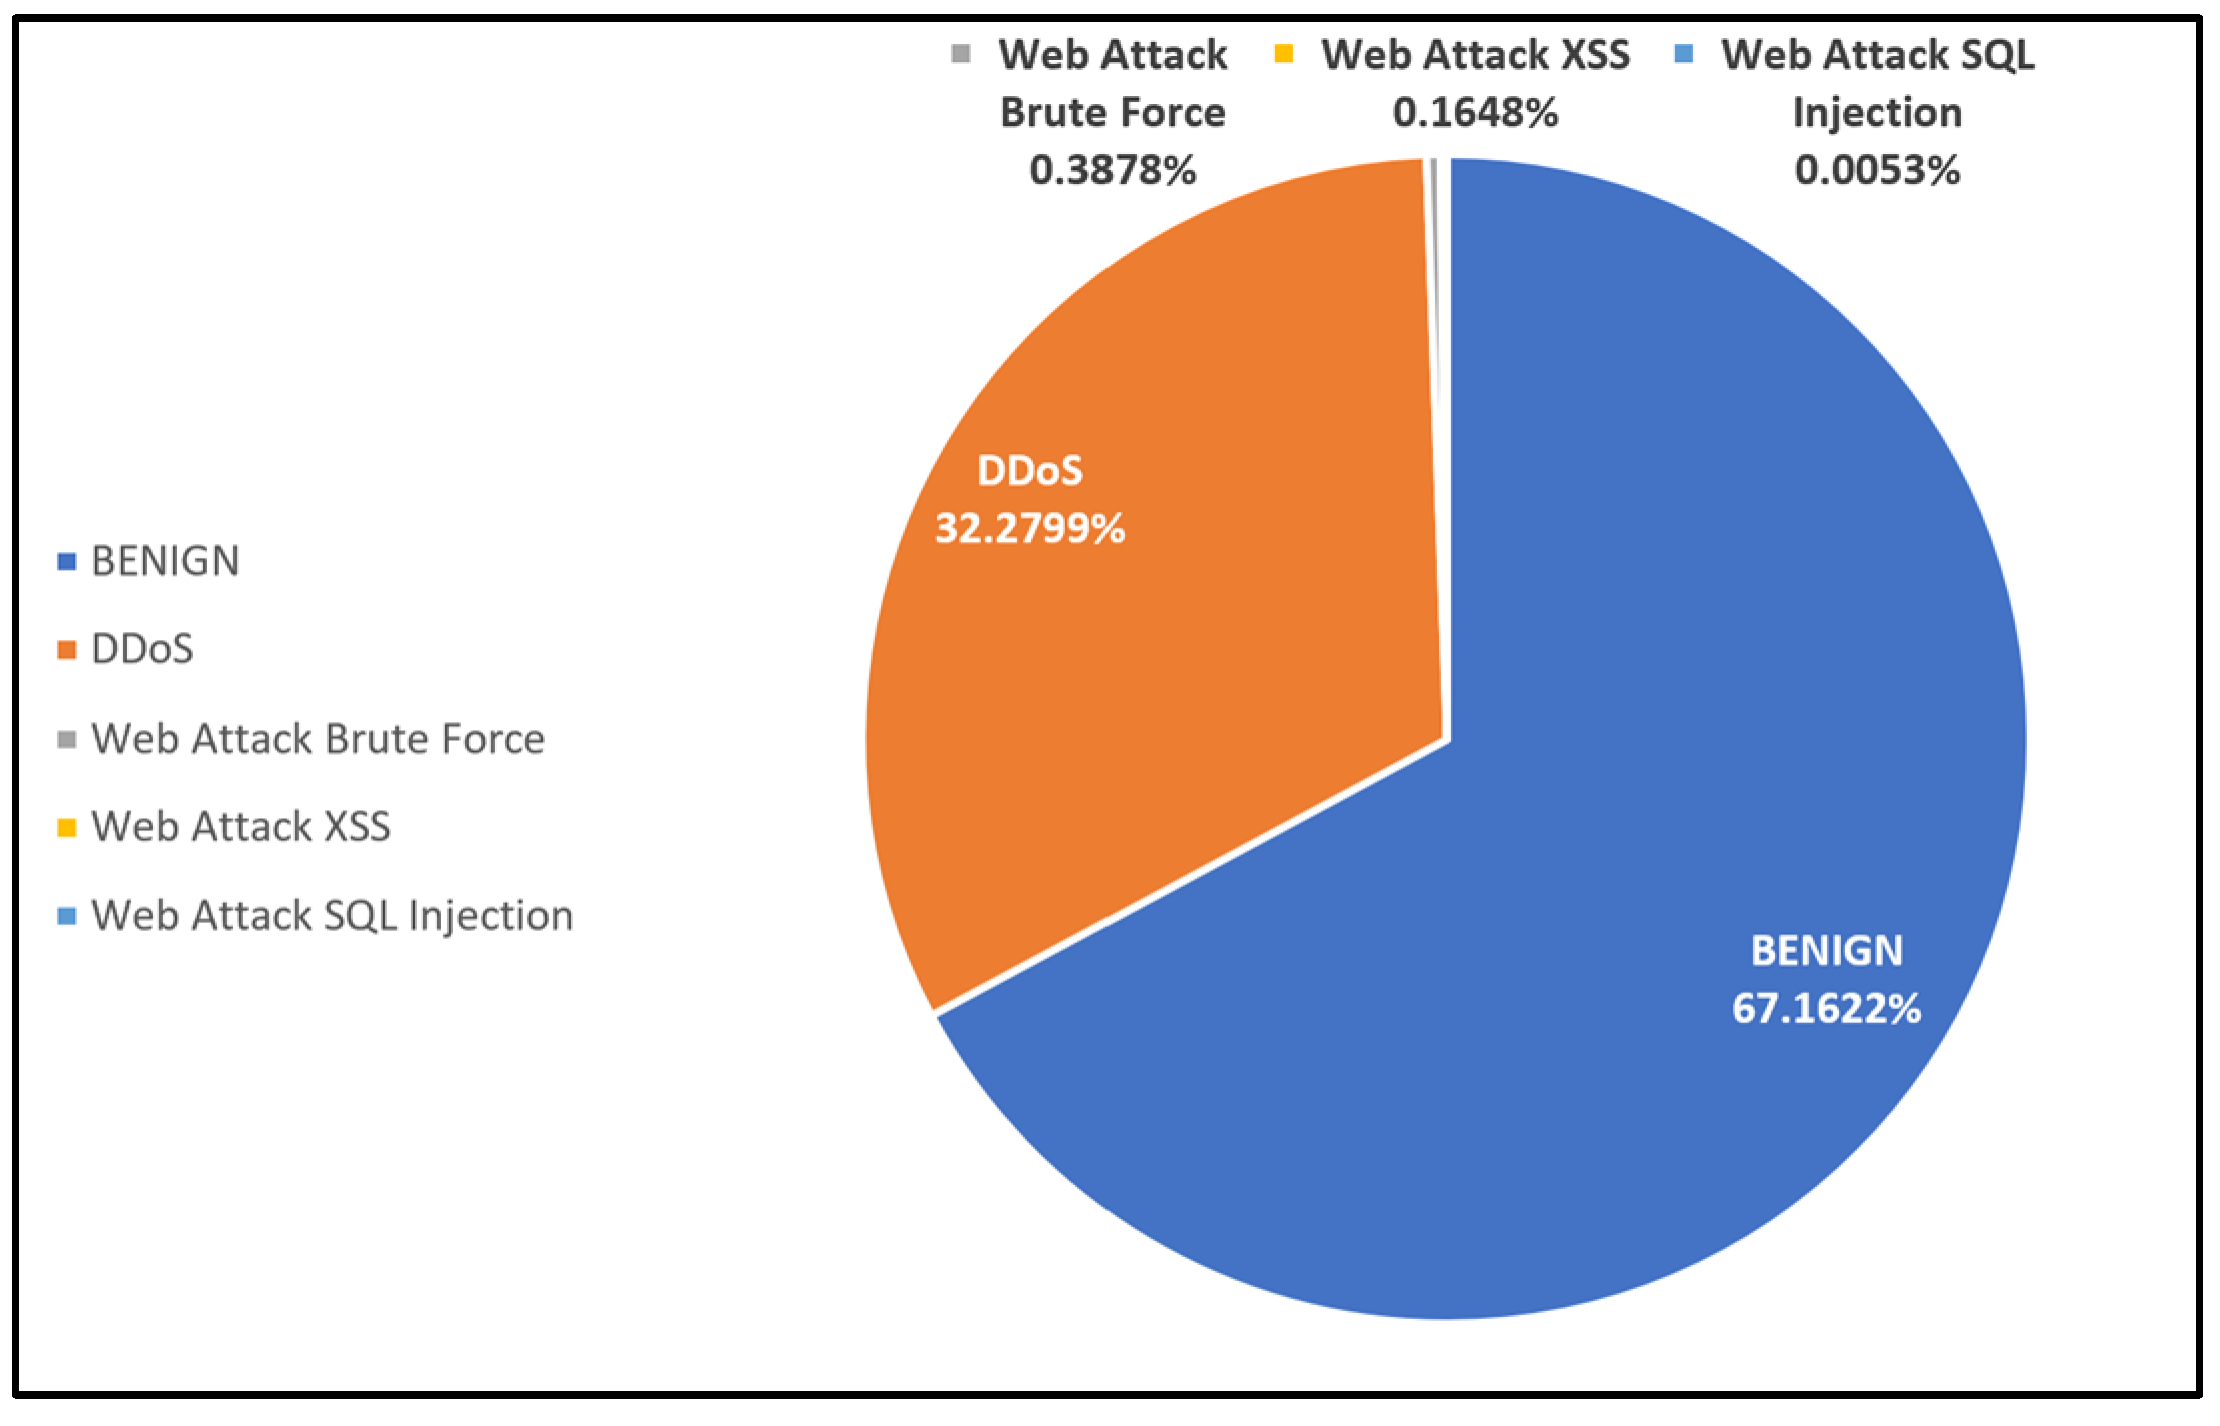
Overall, Dataset 2 suffers from imbalanced class issues that lead classifiers to become biased toward detecting benign and DDoS classes more effectively than others. This can be observed in the results of Figure 17, Figure 18, Figure 19, Figure 20 and Figure 21. Brute Force, XSS, and SQL Injection attacks occur at significantly lower frequencies, which can further affect classifier performance if temporal variations are not handled properly.

5.11. Experiments on Different PCA Components

Figure 22 and Figure 23 compare the impact of using PCA with 5 components and 10 components on the performance of ML/DL classifiers on Dataset 2. Both figures clearly show that altering the parameters of the number of PCA components yields similar testing classification results as 5 principal components may already capture most of the variance in the data, then increasing the number of components to 15 may not provide significant additional information for the model. Therefore, increasing the number of components did not provide any change to the performance since it does not add any new information when training the model. This indicates that the important features are confined to the first few components.
Figure 22. Testing classification using 5 PCA components.
Electronics 14 00995 g022
Figure 23. Testing classification using 10 PCA components.
Electronics 14 00995 g023

5.12. Computational Cost

The computation cost of Oversampling and PCA techniques was also recorded in this study and measured in seconds. Table 13 indicates that ADASYN consumed the highest computational time compared to SMOTE and Random Oversampling. This can be observed clearly with the result of Dataset 2, in which ADASYN needed 144.67 s to complete its task. However, Random Oversampling exhibited the lowest computational cost among all oversampling techniques used in this research. This is evident with Dataset 1, where Random Oversampling needed only 0.04 s to finish its task. This highlights the trade-off between selecting the oversampling technique that provides the best synthetic data generation and the simplest technique that exhibits the lowest computation cost.
Table 13. Computational cost of oversampling techniques.
Dataset ADASYN (Seconds) SMOTE (Seconds) Random (Seconds)
11.060.390.04
2144.6740.914.83
31.290.560.14
416.034.090.66
As observed, ADASYN has the highest computational cost because it adaptively generates synthetic samples based on the density of minority class instances. This requires additional calculations to determine the level of imbalance and assign varying numbers of synthetic points per instance. Unlike SMOTE, which distributes synthetic samples uniformly, ADASYN consumes more process time when generating synthetic data in the area where the classification is difficult due to weight adjustment for kNN. In essence, while Random Oversampling is straightforward but prone to overfitting (which can be tackled when training the ML/DL classifier), SMOTE offers a more diversified approach, and ADASYN further refines this by focusing on difficult instances to enhance classifier performance. SMOTE requires more processing than Random Oversampling because it provides a more varied method and generates synthetic samples by calculating distances between minority class instances and their nearest neighbors. This step adds complexity compared to Random Oversampling, which duplicates existing minority samples without any calculations. Therefore, Random Oversampling is the fastest.
Table 14 presents the computational cost results of PCA on both the original and oversampled datasets. Across all four datasets, the computational cost of PCA is high once oversampling is applied. This can be observed clearly in Dataset 2, in which PCA needed 0.46 s to accomplish its task. Meanwhile, PCA takes less time when processing original datasets. These results show the influence of oversampling techniques on PCA’s computation cost. Therefore, it is important to balance the benefits of using oversampling algorithms by considering the computation cost.
The computational cost differs between the original and oversampled datasets owing to the increased number of samples in the oversampled type. Since PCA depends on calculating the covariance matrix and performing eigen decomposition, an increase in dataset size results in higher computational complexity. The variation in computational cost is probably impacted by the nature of the oversampling process and the structure of added data.
Table 14. Computational cost of PCA.
DatasetOriginal Dataset (Seconds)Oversampled Dataset (Seconds)
10.010.01
20.140.46
30.010.01
40.040.10
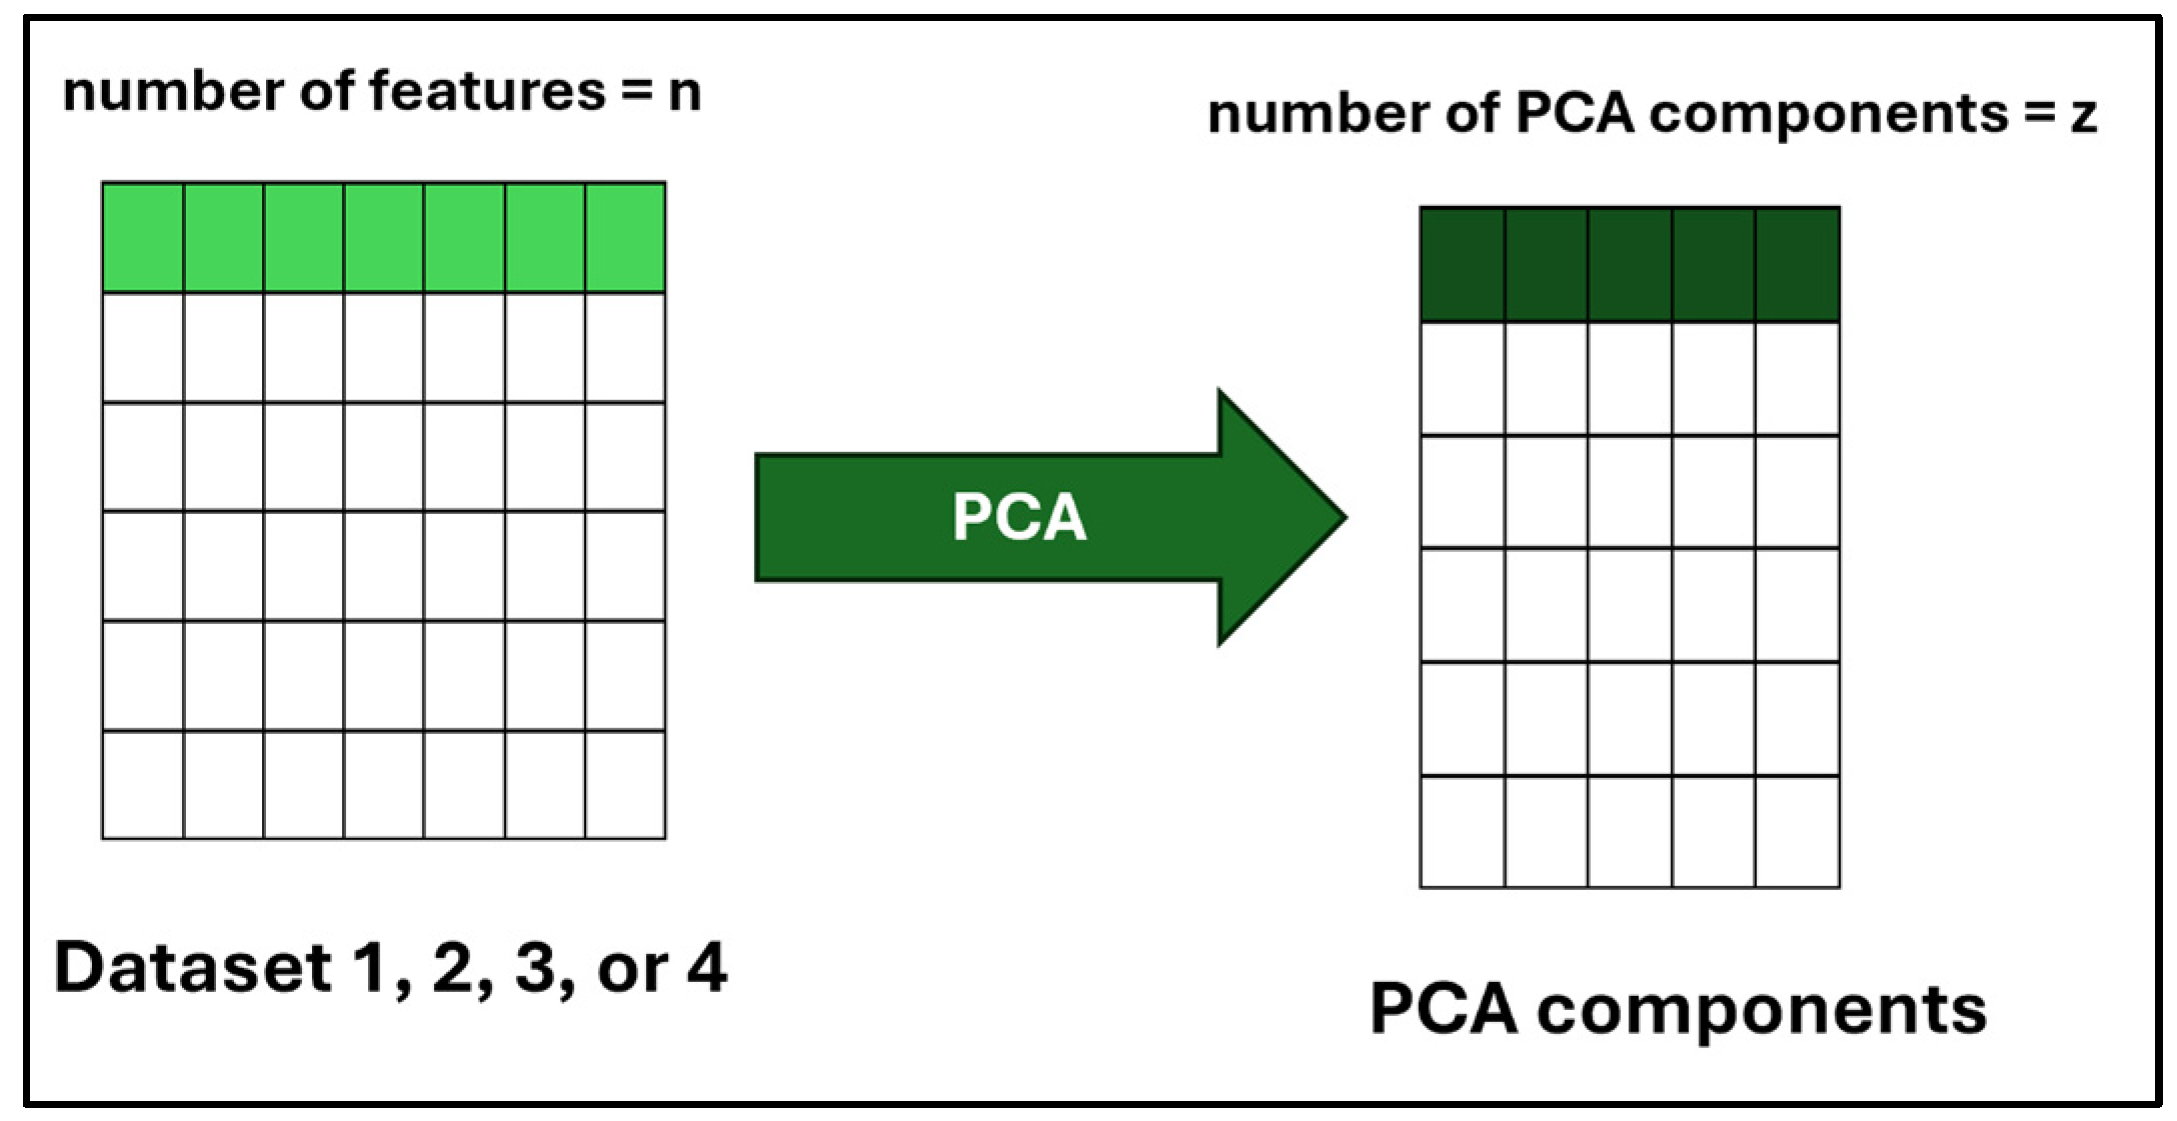
Indeed, there are many advantages to employing PCA for attack detection with SDN datasets. PCA helps eliminate redundant and highly correlated features, which can improve model efficiency and prevent overfitting. Additionally, PCA enhances computational performance by lowering the number of input features, leading to faster training times and reducing memory usage. This is beneficial in high-dimensional datasets like Datasets 2 and 4, where processing large amounts of data can be computationally expensive. Our findings demonstrate that lower dimensional representations reduce the processing time of classifiers while maintaining their classification performance.
Generally, using all available features that do not include redundancy or noise enhances the classification performance of classifiers but increases computational cost. However, applying PCA reduces the dimensionality of data by selecting more relevant features, which speed up the computation process.
Despite its advantages, PCA has certain limitations when selecting the number of PCA components. The low number of components may lead to the possibility of losing significant information, thus negatively impacting the classification performance of a classifier. Increasing the number of components causes more irrelevant information to be added to the data. As a result, PCA will keep a high number of components, which will also impact the performance of the classifier. However, this can be tackled by using a different number of PCA components during the experiments to explore the impact of changing the number of components, as was performed in this research.

5.13. Research Limitation

Offline analysis: In our experiments, offline analysis is used instead of real-time for practical considerations such as the availability of resources, reproducibility, and the need for controlled experimentation. We used four publicly available SDN datasets; these datasets were collected in a real-world setup to help researchers study the impact of cyberattacks on SDN, which helps to mitigate their negative consequences. It is well known that many researchers conduct their published research on publicly available SDN datasets in a batch (offline) format, as the datasets allow for systematic experimentation and the easy repetition of experiments multiple times.
Limited number of samples: The publicly available datasets have a low number of samples in some classes, which limits our use to only oversampling techniques instead of researching other techniques like undersampling.

5.14. Learned Lessons

This section discusses the effects and significance of the research findings and suggests their application in practice. This study applied three oversampling techniques and PCA to address data imbalance issues in the SDN environment. The findings demonstrate that oversampling techniques significantly enhance the performance of ML/DL classifiers in SDN-based attack detection.
Oversampling techniques improved the classification of minority classes to prevent dependence only on major classes when classifying data. This helps improve the reliability of IDSs. In real-world SDN intrusion detection, where attack instances are often rare, without these adjustments, classifiers may appear to perform well overall but fail to detect attacks that have minority classes.
Our findings demonstrate that the choice of an appropriate oversampling technique is not solely dependent on class distribution but also on the computational resources available. Techniques, such as ADASYN, generate large data that require high computational power, and it is recommended with rare datasets. In contrast, simpler techniques, like SMOTE and Random Oversampling, provide a computationally efficient alternative, and they are suitable for constraint devices. The trade-off between computational cost and available resources suggests that high-performance computing environments can benefit from adaptive techniques, like ADASYN, whereas low-resource computing systems may require simpler techniques, such as Random Oversampling or SMOTE.
By demonstrating the impact of data balancing on security performance, our study provides a foundation for developing more resilient SDN security solutions.

6. Conclusions

In conclusion, this paper provided a comparative study of different types of oversampling techniques on four publicly available SDN datasets that face class imbalance issues. This could lead to inaccurate performance of ML and DL classifiers. To address this, the most well-known oversampling techniques were used to balance the classes of the datasets. Additionally, PCA was applied to the four datasets after employing the oversampling techniques to observe its impact. Subsequently, several ML and DL classifiers were used to compare their performance after applying the oversampling and PCA techniques. The results demonstrated the importance of employing oversampling techniques in imbalanced datasets, especially in SDN datasets using ML and DL classifiers. Moreover, these techniques mitigate the overfitting issues associated with the imbalanced datasets. Despite its simplicity, the Random Oversampling demonstrated noticeable superiority with multiclass datasets. Meanwhile, the SMOTE technique strongly competed with the Random Oversampling algorithm in cases where PCA was not used. On the other hand, ADASYN consumes the highest computational time. Our experiments also highlighted that the Transformer classifier is sensitive to the ADASYN technique. Additionally, the XGBoost and Transformer classifiers were sensitive to various balancing strategies. When applying oversampling techniques to data, the data size will be increased. Therefore, there is a need to reduce the size of data by using the PCA to maintain the performance of classifiers in most cases. While the performance of most classifiers was not significantly increased by using PCA, our study concludes that the effectiveness of PCA for maintaining performance in most cases. Also, since there are only a limited number of datasets that are directly related to SDN, we recommend conducting real-time experiments on SDN to collect comprehensive SDN datasets and release them on publicly available platforms. We also suggest implementing real-time architecture to conduct SDN-based experiments in a real-time manner.

Author Contributions

Conceptualization, A.B. and F.E.E.; validation, M.K., F.E.E., F.B. and A.A.A.; formal analysis, F.E.E., J.M.Q. and A.A.A.; writing—original draft preparation, A.B. and B.A.; writing—review and editing, AB. and A.A.A.; supervision, M.K.; project administration, M.K. All authors have read and agreed to the published version of the manuscript.

Funding

This research received no external funding.

Data Availability Statement

This paper used four datasets as follows. Dataset 1 is available at https://www.kaggle.com/datasets/aikenkazin/ddos-sdn-dataset?resource=download (accessed on 7 January 2024). Dataset 2 is available at https://www.kaggle.com/datasets/subhajournal/sdn-intrusion-detection/data (accessed on 7 January 2024). Dataset 3 is available at https://www.kaggle.com/datasets/abdussalamahmed/lr-hr-ddos-2024-dataset-for-sdn-based-networks (accessed on 8 January 2024). Dataset 4 is available at https://www.kaggle.com/datasets/badcodebuilder/insdn-dataset (accessed on 8 January 2024). The corresponding author can make the codes available on request.

Conflicts of Interest

The authors declare no conflicts of interest.

References

  1. Maleh, Y.; Qasmaoui, Y.; El Gholami, K.; Sadqi, Y.; Mounir, S. A comprehensive survey on SDN security: Threats, mitigations, and future directions. J. Reliab. Intell. Environ. 2023, 9, 201–239. [Google Scholar] [CrossRef]
  2. Mehraban, S.; Yadav, R.K. Traffic engineering and quality of service in hybrid software defined networks. China Commun. 2024, 21, 96–121. [Google Scholar] [CrossRef]
  3. Bahashwan, A.A.; Anbar, M.; Manickam, S.; Al-Amiedy, T.A.; Aladaileh, M.A.; Hasbullah, I.H. A Systematic Literature Review on Machine Learning and Deep Learning Approaches for Detecting DDoS Attacks in Software-Defined Networking. Sensors 2023, 23, 4441. [Google Scholar] [CrossRef] [PubMed]
  4. Anand, N.; Saifulla, M.A.; Ponnuru, R.B.; Alavalapati, G.R.; Patan, R.; Gandomi, A.H. Securing Software Defined Networks: A Comprehensive Analysis of Approaches, Applications, and Future Strategies against DoS Attacks. IEEE Access, 2024; early access. [Google Scholar] [CrossRef]
  5. Chaganti, R.; Suliman, W.; Ravi, V.; Dua, A. Deep Learning Approach for SDN-Enabled Intrusion Detection System in IoT Networks. Information 2023, 14, 41. [Google Scholar] [CrossRef]
  6. Agrawal, S.; Sarkar, S.; Aouedi, O.; Yenduri, G.; Piamrat, K.; Alazab, M.; Bhattacharya, S.; Maddikunta, P.K.R.; Gadekallu, T.R. Federated Learning for intrusion detection system: Concepts, challenges and future directions. Comput. Commun. 2022, 195, 346–361. [Google Scholar] [CrossRef]
  7. Ravi, V.; Chaganti, R.; Alazab, M. Recurrent deep learning-based feature fusion ensemble meta-classifier approach for intelligent network intrusion detection system. Comput. Electr. Eng. 2022, 102, 108156. [Google Scholar] [CrossRef]
  8. Khan, R.U.; Zhang, X.; Kumar, R.; Sharif, A.; Golilarz, N.A.; Alazab, M. An Adaptive Multi-Layer Botnet Detection Technique Using Machine Learning Classifiers. Appl. Sci. 2019, 9, 2375. [Google Scholar] [CrossRef]
  9. Rathore, H.; Agarwal, S.; Sahay, S.K.; Sewak, M. Malware Detection Using Machine Learning and Deep Learning. In International Conference on Big Data Analytics; Springer International Publishing: Cham, Switzerland, 2018; pp. 402–411. [Google Scholar] [CrossRef]
  10. Guo, Y.; Wang, Y.; Khan, F.; Al-Atawi, A.A.; Al Abdulwahid, A.; Lee, Y.; Marapelli, B. Traffic Management in IoT Backbone Networks Using GNN and MAB with SDN Orchestration. Sensors 2023, 23, 7091. [Google Scholar] [CrossRef]
  11. Cunha, J.; Ferreira, P.; Castro, E.M.; Oliveira, P.C.; Nicolau, M.J.; Núñez, I.; Sousa, X.R.; Serôdio, C. Enhancing Network Slicing Security: Machine Learning, Software-Defined Networking, and Network Functions Virtualization-Driven Strategies. Future Internet 2024, 16, 226. [Google Scholar] [CrossRef]
  12. Hassan, H.A.; Hemdan, E.E.; El-Shafai, W.; Shokair, M.; El-Samie, F.E.A. Detection of attacks on software defined networks using machine learning techniques and imbalanced data handling methods. Secur. Priv. 2023, 7, e350. [Google Scholar] [CrossRef]
  13. Elsayed, M.S.; Le-Khac, N.-A.; Jurcut, A.D. InSDN: A Novel SDN Intrusion Dataset. IEEE Access 2020, 8, 165263–165284. [Google Scholar] [CrossRef]
  14. Mirsadeghi, S.M.H.; Bahsi, H.; Vaarandi, R.; Inoubli, W. Learning From Few Cyber-Attacks: Addressing the Class Imbalance Problem in Machine Learning-Based Intrusion Detection in Software-Defined Networking. IEEE Access 2023, 11, 140428–140442. [Google Scholar] [CrossRef]
  15. Chawla, N.V.; Bowyer, K.W.; Hall, L.O.; Kegelmeyer, W.P. SMOTE: Synthetic Minority Over-sampling Technique. J. Artif. Intell. Res. 2002, 16, 321–357. [Google Scholar] [CrossRef]
  16. He, H.; Garcia, E.A. Learning from Imbalanced Data. IEEE Trans. Knowl. Data Eng. 2009, 21, 1263–1284. [Google Scholar] [CrossRef]
  17. Moustafa, N.; Slay, J. UNSW-NB15: A comprehensive data set for network intrusion detection systems (UNSW-NB15 network data set). In Proceedings of the 2015 Military Communications and Information Systems Conference (MilCIS), Canberra, ACT, Australia, 10–12 November 2015; pp. 1–6. [Google Scholar]
  18. Tavallaee, M.; Bagheri, E.; Lu, W.; Ghorbani, A. A detailed analysis of the KDD CUP 99 data set. In Proceedings of the Second IEEE Symposium on Computational Intelligence for Security and Defence Applications, Ottawa, ON, Canada, 8–10 July 2009; pp. 1–6. [Google Scholar] [CrossRef]
  19. Rao, R.S.; Dewangan, S.; Mishra, A.; Gupta, M. A study of dealing class imbalance problem with machine learning methods for code smell severity detection using PCA-based feature selection technique. Sci. Rep. 2023, 13, 16245. [Google Scholar] [CrossRef]
  20. Almazyad, A.; Halman, L.; Alsaeed, A. Probe Attack Detection Using an Improved Intrusion Detection System. Comput. Mater. Contin. 2023, 74, 4769–4784. [Google Scholar] [CrossRef]
  21. Maddu, M.; Rao, Y.N. Network intrusion detection and mitigation in SDN using deep learning models. Int. J. Inf. Secur. 2023, 23, 849–862. [Google Scholar] [CrossRef]
  22. Towhid, S.; Shahriar, N. Early Detection of Intrusion in SDN. In Proceedings of the NOMS 2023-2023 IEEE/IFIP Network Operations and Management Symposium, Miami, FL, USA, 8–12 May 2023; pp. 1–6. [Google Scholar]
  23. Behera, A.; Sahoo, K.S.; Mishra, T.K.; Bhuyan, M. A combination learning framework to uncover cyber attacks in IoT networks. Internet Things 2024, 28, 101395. [Google Scholar] [CrossRef]
  24. Rustam, F.; Jurcut, A.D. Malicious traffic detection in multi-environment networks using novel S-DATE and PSO-D-SEM approaches. Comput. Secur. 2024, 136, 103564. [Google Scholar] [CrossRef]
  25. Wang, K.; Fu, Y.; Duan, X.; Liu, T. Detection and mitigation of DDoS attacks based on multi-dimensional characteristics in SDN. Sci. Rep. 2024, 14, 16421. [Google Scholar] [CrossRef]
  26. Fotse, Y.S.N.; Tchendji, V.K.; Velempini, M. Federated Learning Based DDoS Attacks Detection in Large Scale Software-Defined Network. IEEE Trans. Comput. 2025, 74, 101–115. [Google Scholar] [CrossRef]
  27. Kumar, P.; Jolfaei, A.; Islam, A.N. An enhanced Deep-Learning empowered Threat-Hunting Framework for software-defined Internet of Things. Comput. Secur. 2025, 148, 104109. [Google Scholar] [CrossRef]
  28. Ataa, M.S.; Sanad, E.E.; El-Khoribi, R.A. Intrusion detection in software defined network using deep learning approaches. Sci. Rep. 2024, 14, 29159. [Google Scholar] [CrossRef] [PubMed]
  29. Karmous, N.; Aoueileyine, M.O.-E.; Abdelkader, M.; Romdhani, L.; Youssef, N. Software-Defined-Networking-Based One-versus-Rest Strategy for Detecting and Mitigating Distributed Denial-of-Service Attacks in Smart Home Internet of Things Devices. Sensors 2024, 24, 5022. [Google Scholar] [CrossRef]
  30. Jiménez Agudelo, Y.A. Scalability and Robustness of the Control Plane in Software-Defined Networking (SDN). Ph.D. Thesis, Universitat Politècnica de Catalunya, Barcelona, Spain, 2016. [Google Scholar]
  31. Santos, A.; Silva, D.A. Atlantic: A Framework for Anomaly Traffic Detection, Classification, and Mitigation in SDN. Master’s Thesis, Universidade Federal do rio Grande do sul Instituto de Informática Programa de Pós-Graduação em Computação, Porto Alegre, RS, Brazil, 2015. [Google Scholar]
  32. Jimenez, M.B.; Fernandez, D.; Rivadeneira, J.E.; Bellido, L.; Cardenas, A. A Survey of the Main Security Issues and Solutions for the SDN Architecture. IEEE Access 2021, 9, 122016–122038. [Google Scholar] [CrossRef]
  33. Alshammri, G.H.; Samha, A.K.; Hemdan, E.E.-D.; Amoon, M.; El-Shafai, W. An Efficient Intrusion Detection Framework in Software-Defined Networking for Cybersecurity Applications. Comput. Mater. Contin. 2022, 72, 3529–3548. [Google Scholar] [CrossRef]
  34. Fan, C.; Kaliyamurthy, N.M.; Chen, S.; Jiang, H.; Zhou, Y.; Campbell, C. Detection of DDoS Attacks in Software Defined Networking Using Entropy. Appl. Sci. 2021, 12, 370. [Google Scholar] [CrossRef]
  35. Jafarian, T.; Masdari, M.; Ghaffari, A.; Majidzadeh, K. SADM-SDNC: Security anomaly detection and mitigation in software-defined networking using C-support vector classification. Computing 2021, 103, 641–673. [Google Scholar] [CrossRef]
  36. Fonseca, P.C.d.R.; Mota, E.S. A Survey on Fault Management in Software-Defined Networks. IEEE Commun. Surv. Tutor. 2017, 19, 2284–2321. [Google Scholar] [CrossRef]
  37. Sudar, K.M.; Deepalakshmi, P. Comparative study on IDS using machine learning approaches for software defined networks. Int. J. Intell. Enterp. 2020, 7, 104642. [Google Scholar] [CrossRef]
  38. Xie, J.; Yu, F.R.; Huang, T.; Xie, R.; Liu, J.; Wang, C.; Liu, Y. A survey of machine learning techniques applied to software defined networking (SDN): Research issues and challenges. IEEE Commun. Surv. Tutor. 2019, 21, 393–430. [Google Scholar] [CrossRef]
  39. Bannour, F.; Souihi, S.; Mellouk, A. Distributed SDN Control: Survey, Taxonomy, and Challenges. IEEE Commun. Surv. Tutor. 2018, 20, 333–354. [Google Scholar] [CrossRef]
  40. Foster, N.; Harrison, R.; Freedman, M.J.; Monsanto, C.; Rexford, J.; Story, A.; Walker, D. Frenetic: A network programming language. ACM Sigplan Not. 2011, 46, 279–291. [Google Scholar] [CrossRef]
  41. Reich, J.; Monsanto, C.; Foster, N.; Rexford, J.; Walker, D. Modular SDN Programming with Pyretic. Tech. Reprot USENIX 2013, 38, 40–47. [Google Scholar]
  42. Voellmy, A.; Kim, H.; Feamster, N. Procera: A language for high-level reactive network control. In Proceedings of the HotSDN’12—Proceedings of the 1st ACM International Workshop on Hot Topics in Software Defined Networks, Helsinki, Finland, 13 August 2012; pp. 43–48. [Google Scholar] [CrossRef]
  43. Monsanto, C.; Foster, N.; Harrison, R.; Walker, D. A compiler and run-time system for network programming languages. ACM SIGPLAN Not. 2012, 47, 217–230. [Google Scholar] [CrossRef]
  44. Ahmad, S.; Mir, A.H. Scalability, Consistency, Reliability and Security in SDN Controllers: A Survey of Diverse SDN Controllers. J. Netw. Syst. Manag. 2020, 29, 9. [Google Scholar] [CrossRef]
  45. Rhaban Simon, H. Monitoring Federated Softwarized Networks: Approaches for Efficient and Collaborative Data Collection in Large-Scale Software-Defined Networks. Ph.D. Thesis, Primary Publication, Darmstadt, Germany, 2019. [Google Scholar]
  46. Kreutz, D.; Ramos, F.M.V.; Verissimo, P.E.; Rothenberg, C.E.; Azodolmolky, S.; Uhlig, S. Software-Defined networking: A comprehensive survey. Proc. IEEE 2015, 103, 14–76. [Google Scholar] [CrossRef]
  47. Isyaku, B.; Zahid, M.S.M.; Kamat, M.B.; Abu Bakar, K.; Ghaleb, F.A. Software Defined Networking Flow Table Management of OpenFlow Switches Performance and Security Challenges: A Survey. Future Internet 2020, 12, 147. [Google Scholar] [CrossRef]
  48. Pathak, G.; Gutierrez, J.; Rehman, S.U. Security in low powered wide area networks: Opportunities for software defined network-supported solutions. Electronics 2020, 9, 1195. [Google Scholar] [CrossRef]
  49. Sarker, I.H. Smart City Data Science: Towards data-driven smart cities with open research issues. Internet Things 2022, 19, 100528. [Google Scholar] [CrossRef]
  50. Gopalan, S.S.; Ravikumar, D.; Linekar, D.; Raza, A.; Hasib, M. Balancing Approaches towards ML for IDS: A Survey for the CSE-CIC IDS Dataset. In Proceedings of the 2020 International Conference on Communications, Signal Processing, and Their Applications (ICCSPA), Sharjah, United Arab Emirates, 16–18 March 2021; pp. 1–6. [Google Scholar]
  51. Dina, A.S.; Siddique, A.B.; Manivannan, D. Effect of Balancing Data Using Synthetic Data on the Performance of Machine Learning Classifiers for Intrusion Detection in Computer Networks. IEEE Access 2022, 10, 96731–96747. [Google Scholar] [CrossRef]
  52. Yang, W.; Pan, C.; Zhang, Y. An oversampling method for imbalanced data based on spatial distribution of minority samples SD-KMSMOTE. Sci. Rep. 2022, 12, 16820. [Google Scholar] [CrossRef] [PubMed]
  53. Satou, K. Features and Algorithms for Embedded Protein Sequence Classification with Class Imbalance. Ph.D. Dissertation, Kanazawa University, Kanazawa, Japan, 2022. [Google Scholar]
  54. Kazin, A. DDoS SDN Dataset. Kaggle. Available online: https://www.kaggle.com/datasets/aikenkazin/ddos-sdn-dataset?resource=download (accessed on 28 December 2024).
  55. Cyber Cop. SDN Intrusion Detection. Kaggle. Available online: https://www.kaggle.com/datasets/subhajournal/sdn-intrusion-detection/data (accessed on 28 December 2024).
  56. Abdussalam Ahmed. LR-HR DDoS 2024 Dataset for SDN-Based Networks. Kaggle. Available online: https://www.kaggle.com/datasets/abdussalamahmed/lr-hr-ddos-2024-dataset-for-sdn-based-networks (accessed on 28 December 2024).
  57. Badcodebuilder. InSDN Dataset. Kaggle. Available online: https://www.kaggle.com/datasets/badcodebuilder/insdn-dataset (accessed on 28 December 2024).
  58. Bruni, V.; Cardinali, M.L.; Vitulano, D. A Short Review on Minimum Description Length: An Application to Dimension Reduction in PCA. Entropy 2022, 24, 269. [Google Scholar] [CrossRef]
  59. Yang, Z.; Liu, X.; Li, T.; Wu, D.; Wang, J.; Zhao, Y.; Han, H. A systematic literature review of methods and datasets for anomaly-based network intrusion detection. Comput. Secur. 2022, 116, 102675. [Google Scholar] [CrossRef]
  60. Joloudari, J.H.; Marefat, A.; Nematollahi, M.A.; Oyelere, S.S.; Hussain, S. Effective Class-Imbalance Learning Based on SMOTE and Convolutional Neural Networks. Appl. Sci. 2023, 13, 4006. [Google Scholar] [CrossRef]
  61. He, Y.; Lu, X.; Fournier-Viger, P.; Huang, J.Z. A novel overlapping minimization SMOTE algorithm for imbalanced classification. Front. Inf. Technol. Electron. Eng. 2024, 25, 1266–1281. [Google Scholar] [CrossRef]
  62. Kotsiantis, S.; Kanellopoulos, D.; Pintelas, P. Handling imbalanced datasets: A review. Science (1979) 2006, 30, 25–36. [Google Scholar]
  63. Peng, H.; Sun, Z.; Zhao, X.; Tan, S.; Sun, Z. A Detection Method for Anomaly Flow in Software Defined Network. IEEE Access 2018, 6, 27809–27817. [Google Scholar] [CrossRef]
  64. Atefinia, R.; Ahmadi, M. Network intrusion detection using multi-architectural modular deep neural network. J. Supercomput. 2020, 77, 3571–3593. [Google Scholar] [CrossRef]
  65. Aslam, M.; Ye, D.; Tariq, A.; Asad, M.; Hanif, M.; Ndzi, D.; Chelloug, S.A.; Elaziz, M.A.; Al-Qaness, M.A.A.; Jilani, S.F. Adaptive Machine Learning Based Distributed Denial-of-Services Attacks Detection and Mitigation System for SDN-Enabled IoT. Sensors 2022, 22, 2697. [Google Scholar] [CrossRef]
  66. Alghazzawi, D.; Ullah, H.; Tabassum, N.; Badri, S.K.; Asghar, M.Z. Explainable AI-based suicidal and non-suicidal ideations detection from social media text with enhanced ensemble technique. Sci. Rep. 2025, 15, 1111. [Google Scholar] [CrossRef] [PubMed]
  67. Alzahrani, A.O.; Alenazi, M.J.F. Designing a network intrusion detection system based on machine learning for software defined networks. Future Internet 2021, 13, 111. [Google Scholar] [CrossRef]
  68. Schonlau, M.; Zou, R.Y. The random forest algorithm for statistical learning. Stata J. Promot. Commun. Stat. Stata 2020, 20, 3–29. [Google Scholar] [CrossRef]
  69. Talukder, A.; Hasan, K.F.; Islam, M.; Uddin, A.; Akhter, A.; Abu Yousuf, M.; Alharbi, F.; Moni, M.A. A dependable hybrid machine learning model for network intrusion detection. J. Inf. Secur. Appl. 2023, 72, 103405. [Google Scholar] [CrossRef]
  70. Ludwig, S.; Mayer, C.; Hansen, C.; Eilers, K.; Brandt, S. Automated Essay Scoring Using Transformer Models. Psych 2021, 3, 897–915. [Google Scholar] [CrossRef]
  71. Salam, A.; Ullah, F.; Amin, F.; Abrar, M. Deep Learning Techniques for Web-Based Attack Detection in industry 5.0: A novel approach. Technologies 2023, 11, 107. [Google Scholar] [CrossRef]
  72. Elmasry, W.; Akbulut, A.; Zaim, A.H. Evolving deep learning architectures for network intrusion detection using a double PSO metaheuristic. Comput. Netw. 2020, 168, 107042. [Google Scholar] [CrossRef]
  73. Masood, A.; Ahmad, K. A review on emerging artificial intelligence (AI) techniques for air pollution forecasting: Fundamentals, application and performance. J. Clean. Prod. 2021, 322, 129072. [Google Scholar] [CrossRef]
  74. Chen, Z.; Fan, W. A Freeway Travel Time Prediction Method Based on an XGBoost Model. Sustainability 2021, 13, 8577. [Google Scholar] [CrossRef]
  75. Song, J.; Yu, C. Missing Value Imputation using XGboost for Label-Free Mass Spectrometry-Based Proteomics Data. bioRxiv 2021. [Google Scholar] [CrossRef]
  76. Zulbeari, N.; Wang, F.; Mustafova, S.S.; Parhizkar, M.; Holm, R. Machine learning strengthened formulation design of pharmaceutical suspensions. Int. J. Pharm. 2024, 668, 124967. [Google Scholar] [CrossRef] [PubMed]
  77. Natras, R.; Soja, B.; Schmidt, M. Ensemble Machine Learning of Random Forest, AdaBoost and XGBoost for Vertical Total Electron Content Forecasting. Remote. Sens. 2022, 14, 3547. [Google Scholar] [CrossRef]
  78. Xue, C.; Deng, Z.; Yang, W.; Hu, E.; Zhang, Y.; Wang, S.; Wang, Y. Vision transformer-based robust learning for cloth-changing person re-identification. Appl. Soft Comput. 2024, 163, 111891. [Google Scholar] [CrossRef]
  79. Maragheh, H.K.; Gharehchopogh, F.S.; Majidzadeh, K.; Sangar, A.B. A New Hybrid Based on Long Short-Term Memory Network with Spotted Hyena Optimization Algorithm for Multi-Label Text Classification. Mathematics 2022, 10, 488. [Google Scholar] [CrossRef]
  80. Alqahtani, A.; Alsulami, A.A.; Alqahtani, N.; Alturki, B.; Alghamdi, B.M. A Comprehensive Security Framework for Asymmetrical IoT Network Environments to Monitor and Classify Cyberattack via Machine Learning. Symmetry 2024, 16, 1121. [Google Scholar] [CrossRef]
  81. Alsulami, A.A.; Abu Al-Haija, Q.; Alturki, B.; Alqahtani, A.; Binzagr, F.; Alghamdi, B.; Alsemmeari, R.A. Exploring the efficacy of GRU model in classifying the signal to noise ratio of microgrid model. Sci. Rep. 2024, 14, 15591. [Google Scholar] [CrossRef]
  82. Imbalanced-Learn Documentation. Over-Sampling Methods. Available online: https://imbalanced-learn.org/stable/over_sampling.html (accessed on 21 February 2025).
  83. Scikit-Learn Documentation. Sklearn.Decomposition. Available online: https://scikit-learn.org/stable/api/sklearn.decomposition.html (accessed on 21 February 2025).
Figure 4. Proportions of classes in Dataset 2.
Electronics 14 00995 g004
Figure 7. PCA overview.
Electronics 14 00995 g007
Figure 8. Used ML/DL classifiers.
Electronics 14 00995 g008
Table 2. Datasets used in this study.
Dataset NameAcronym
DDoS SDN datasetDataset 1
SDN Intrusion DetectionDataset 2
LR-HR DDoS 2024 Dataset for SDN-Based NetworkDataset 3
InSDNDataset 4
Table 4. Distribution of classes in Dataset 2.
CategoryRowsClass Distribution (%)
Benign703,91667.1622%
DDoS338,32032.2799%
Web Attack Brute Force40640.3878%
Web Attack XSS17270.1648%
Web Attack SQL Injection560.0053%
Disclaimer/Publisher’s Note: The statements, opinions and data contained in all publications are solely those of the individual author(s) and contributor(s) and not of MDPI and/or the editor(s). MDPI and/or the editor(s) disclaim responsibility for any injury to people or property resulting from any ideas, methods, instructions or products referred to in the content.

