1. Introduction
The rapid development of Internet technology introduced new online shopping methods that gained popularity. E-commerce or “electronic commerce” is the online trading of products and services. It refers to serial business activities, which instead of being achieved through traditional methods, are achieved through electronic operations on the Internet [
1]. The shortcomings of traditional commerce, on the other hand, gradually pushed entrepreneurs to switch to online shopping methods. These shortcomings include high costs, asymmetric information, and the need for manpower resources [
2].
As more enterprises entered the online market, the industries faced the pressure to demand sales performance in marketing analysis from e-commerce products. The introduction of big data analytics from sales not only improved companies’ sales performance, but also conducted a company’s product position in the market by further promoting its transformation and upgrading [
3].
Sazu, 2022 [
4], in its paper, suggests that big data is a long-lasting competitive benefit that helps enterprises achieve higher operational efficiency. They created a model to explore how big data impacts innovation in e-commerce by carrying out an empirical investigation of data-driven tasks from the USA and Asia.
An organizational learning concept indicates that exploration of new information is the foundation for firms’ innovative ability, as it could strategically fix troubles and wisely use firm’s energy sources by lowering casual ambiguity [
5].
Therefore, processing brand details available by e-commerce sites attains new insights for developing sustainable competitive advantage. Rational choices require evaluation of different options, and incorporation of information from external and internal resources. Collecting it in real time, as empowered by e-commerce, enables firms to learn quickly what consumers want and improve decisions before competitors’ or clients’ interest changes [
6].
One of the leaders in e-commerce is Amazon, which operates as a significant nucleus for exchanges of information in this field. Therefore, we selected it as a focal point of the data source for our research. In this part, we aim to introduce some of the operational dynamics of Amazon’s review system.
One key factor for selecting Amazon is its emphasis on customer reviews, striving for their reliability through a set of stringent policies. Amazon’s Community Guidelines enforce strict regulations prohibiting the alteration of reviews in exchange for financial incentives.
Every review made by a customer who purchased the product from Amazon is provided with the inscription “Verified Purchase” to further guarantee that the review is true. Additionally, in the total average of stars, Amazon does not consider reviews made by “Non-verified buyers”.
From creation to publication, reviews undergo thorough automated and manual checks to prevent fake and manipulative content. Amazon also takes legal action against groups engaged in such activities.
To the best of our knowledge, Amazon’s algorithm is confidential and thus not publicly disclosed. However, the company assures customers of the reliability of reviews and remains committed to providing users with valuable information across all sections of its platform [
7].
Opinions are key influencers in people’s behavior, as in every decision, we want to consult other attitudes. In the business world, companies are always searching for consumer opinions about their products. Consumers are interested in knowing the opinions of existing users of a product before buying it. Previously, individuals, when facing the need for opinions, turned to word of mouth (WoM), and organizations conducted surveys, polls, and focus groups.
Opinions and sentiments share a common characteristic: they are both subjective. To achieve high accuracy, it is important to examine a large collection of opinions from many people. There are different forms of opinion text; for example, news articles, tweets, blogs, and Facebook or other social media posts. In this research, we are focused on reviews as examples of sentiment documents. Reviews are pieces of text, highly rich in opinion and focused on determined aspects of the product or services, containing less irrelevant information [
8].
In our analysis, text-mining methods used are similar to classical data mining, as the text data obtained, following preprocessing, will be transformed into standard numerical forms.
Text categorization is broadly used in document classification, where the spreadsheet contains labeled answers. After documents are categorized, when a new document is presented, the task is to classify this document in the appropriate category.
Sentiment analysis is a text-mining technique that involves the process of analyzing digital text to determine the tone of the message transmitted; also called opinion mining, it analyzes people’s opinions, sentiments, and emotions expressed about products, services, organizations, and more. Although research in this area appeared earlier, the first appearance of this term is found in [
9].
By utilizing web-scraped Amazon reviews, our study offers a real-world application of text mining and sentiment analysis to extract meaningful insights from unstructured customer feedback.
The research emphasizes consumer sentiment using a specific machine learning (ML) sentiment analysis technique: the naïve Bayes classifier to analyze consumer reviews of Apple AirPods, demonstrating the effectiveness of machine learning in understanding consumer electronics evaluation.
The study highlights noise cancellation, battery life, integration within the Apple ecosystem, and connectivity issues as the main factors influencing consumer sentiment. This provides valuable insights into aspects of the product that require improvements.
The paper is structured as follows:
Section 2 presents the literature review and theoretical background. Subsequently,
Section 3 describes the data and the applied methodology, focusing on the Naive Bayes ML classifier. Finally, we present our results, discuss there, and draw conclusions.
2. Theoretical Background and Literature Review
Nandal et al., 2020 [
10], explain sentiment analysis as form of statistical analysis based on natural language processing (NLP), which extracts information from various online sources such as social media, surveys, and e-commerce reviews. This analysis can be categorized into three levels: sentence level, document level, and sub-sentence level or aspect analysis [
11]. Sentence-level analysis determines the overall polarity of a review, ranging from very negative to very positive. The document-level analysis focuses on emotion detection, while aspect analysis extracts sentiments related to specific features within the data. This method of exploring client feedback is considered crucial, providing valuable insights into product aspects that can influence sales [
12].
Their data collection methodology employs an automated approach using Scrapy to scrape data, which is then stored in CSV format. Features corresponding to product properties are extracted, followed by visualizing the map of sentiments relative to ratings. Data preprocessing involves cleaning operations to enhance analysis efficiency. This includes POS tagging, which tags each word to its part of speech, and stemming and lemmatization, which simplifies word forms (e.g., “heavier” and “heaviest” to “heavy”). Additionally, stop words that do not contribute value to the data are removed [
13].
For example, aspects of a product such as earphones might include sound quality, portability, size, design, and cost. Support vector machines (SVM) are used to plot the analysis of the confusion matrix, learning rate, and area under the curve. The recall rate, calculated as true positive sentiments/total positive sentiments, and the true negative rate (TNR), which measures the SVM’s ability to recognize negative samples, are also considered [
14].
Sentiment analysis represents a significant challenge for both researchers and firms aiming to better understand customer perspectives on product performance. Achieving this understanding necessitates employing state-of-the-art tools to optimize the analysis at a granular level [
15,
16].
Aljuhani et al., 2019 [
17], in their work, argue that when an interaction between a client and a seller culminates in the selling and purchasing of a product, both parties rely on product reviews. They significantly influence consumer choices, as individuals tend to assess the benefits and experiences of others before making their own decisions [
18]. Word of mouth is recognized as one of the most potent marketing strategies, and customers’ online feedback serves as a digital form of word of mouth, expressing their feelings, attitudes, opinions, evaluations, and emotions through text and comments in online marketplaces [
19]. Entrepreneurs, on the other hand, need to comprehend client behavior and identify ways to enhance and improve their products to increase customer satisfaction, thereby driving higher revenues and sales.
As the online market expands rapidly, people increasingly depend on these platforms for buying and selling. Sentiment analysis, a complex process involving NLP, computational linguistics, and textual analysis, addresses this need. Given the human impossibility of analyzing and retrieving data from vast amounts of text, sentiment analysis is crucial for its ability to provide comprehensive overviews of consumer sentiment, which can be used in targeted advertising, system development for understanding product perceptions, and other applications.
ML algorithms, including logistic regression (LR), naïve Bayes (NB), stochastic gradient descent (SGD), and convolutional neural networks (CNN), are used to assign sentiment to the reviews [
20,
21]. LR, a binary classification method, performs multi-class classification, while NB, based on Bayes’ theorem, classifies data into Gaussian, Bernoulli, or multinomial categories depending on the nature of the database [
22,
23,
24,
25].
Elmurngi et al., 2018 [
26], in their paper, after following the removal of stop words, performed attribute selection or feature selection to identify a subset of relevant features for model construction [
27,
28]. They implemented the naïve Bayes algorithm, which is based on Bayes’ rule of conditional probability, assuming independence between features.
Some researchers [
29,
30,
31] study sentiment analysis at the aspect level, which presents a significant challenge due to the necessity of extracting product features and accurately associating them with the corresponding sentiments. Additionally, reviews often mention competing products, complicating the task of linking sentiments to the correct product.
Other studies [
32,
33,
34] aim to achieve several objectives: understanding NLP, performing data cleaning, and transforming structured data from unstructured data. Additionally, they seek to create word clouds and determine sentiment from reviews.
Additionally, Singla et al., 2017 [
35], analyze online reviews as significant factors for influencing consumer behavior, playing a crucial role in building trust and facilitating informed decision making.
Another piece of relevant research in this field [
36] states that to have a competitive advantage, it is essential for companies to extract valuable information from contemporary markets where huge amounts of data are generated from different sources.
In this context, user-generated content (UGC) is particularly significant, thus influencing other consumers and the brand’s marketing decisions. Therefore, consumers are influenced not only by the opinions of experts, but also by the experiences of the other customers, especially in the scenario of online shopping, where the perceived risk is higher than in-store purchases. These data provide insights into business performance and highlight areas of sales segments that require attention.
This research confirms that sentiment analysis is an effective technique for classifying sentiment of text by its valence. However, challenges such as the detection of fake reviews, handling interrogative or conditional sentences, sarcasm, and context-specific word meanings complicate the process. A robust sentiment analysis approach requires a comprehensive sentiment lexicon.
Furthermore, this paper proposes a modular framework that leverages sentiment analysis and addresses the critical issue of fake review detection to aid marketing managers and consumers in their decision-making processes. The framework provides comparative insights derived from consumer reviews, utilizing NLP technology to quantify sentiment, thereby illuminating customer behavior.
Rain, 2012 [
37], in his study, utilizes naïve Bayes and decision list classifiers to categorize reviews as either positive or negative, with the number of stars serving as training data for supervised learning. The focus is on top-selling and most-reviewed books to ensure sufficient data collection.
A comparison is made between the bag-of-words model and bigrams. Through sentiment analysis, the aim is to identify textual features indicative of context and build systems leveraging these features.
3. Materials and Methods
3.1. Data Collecting
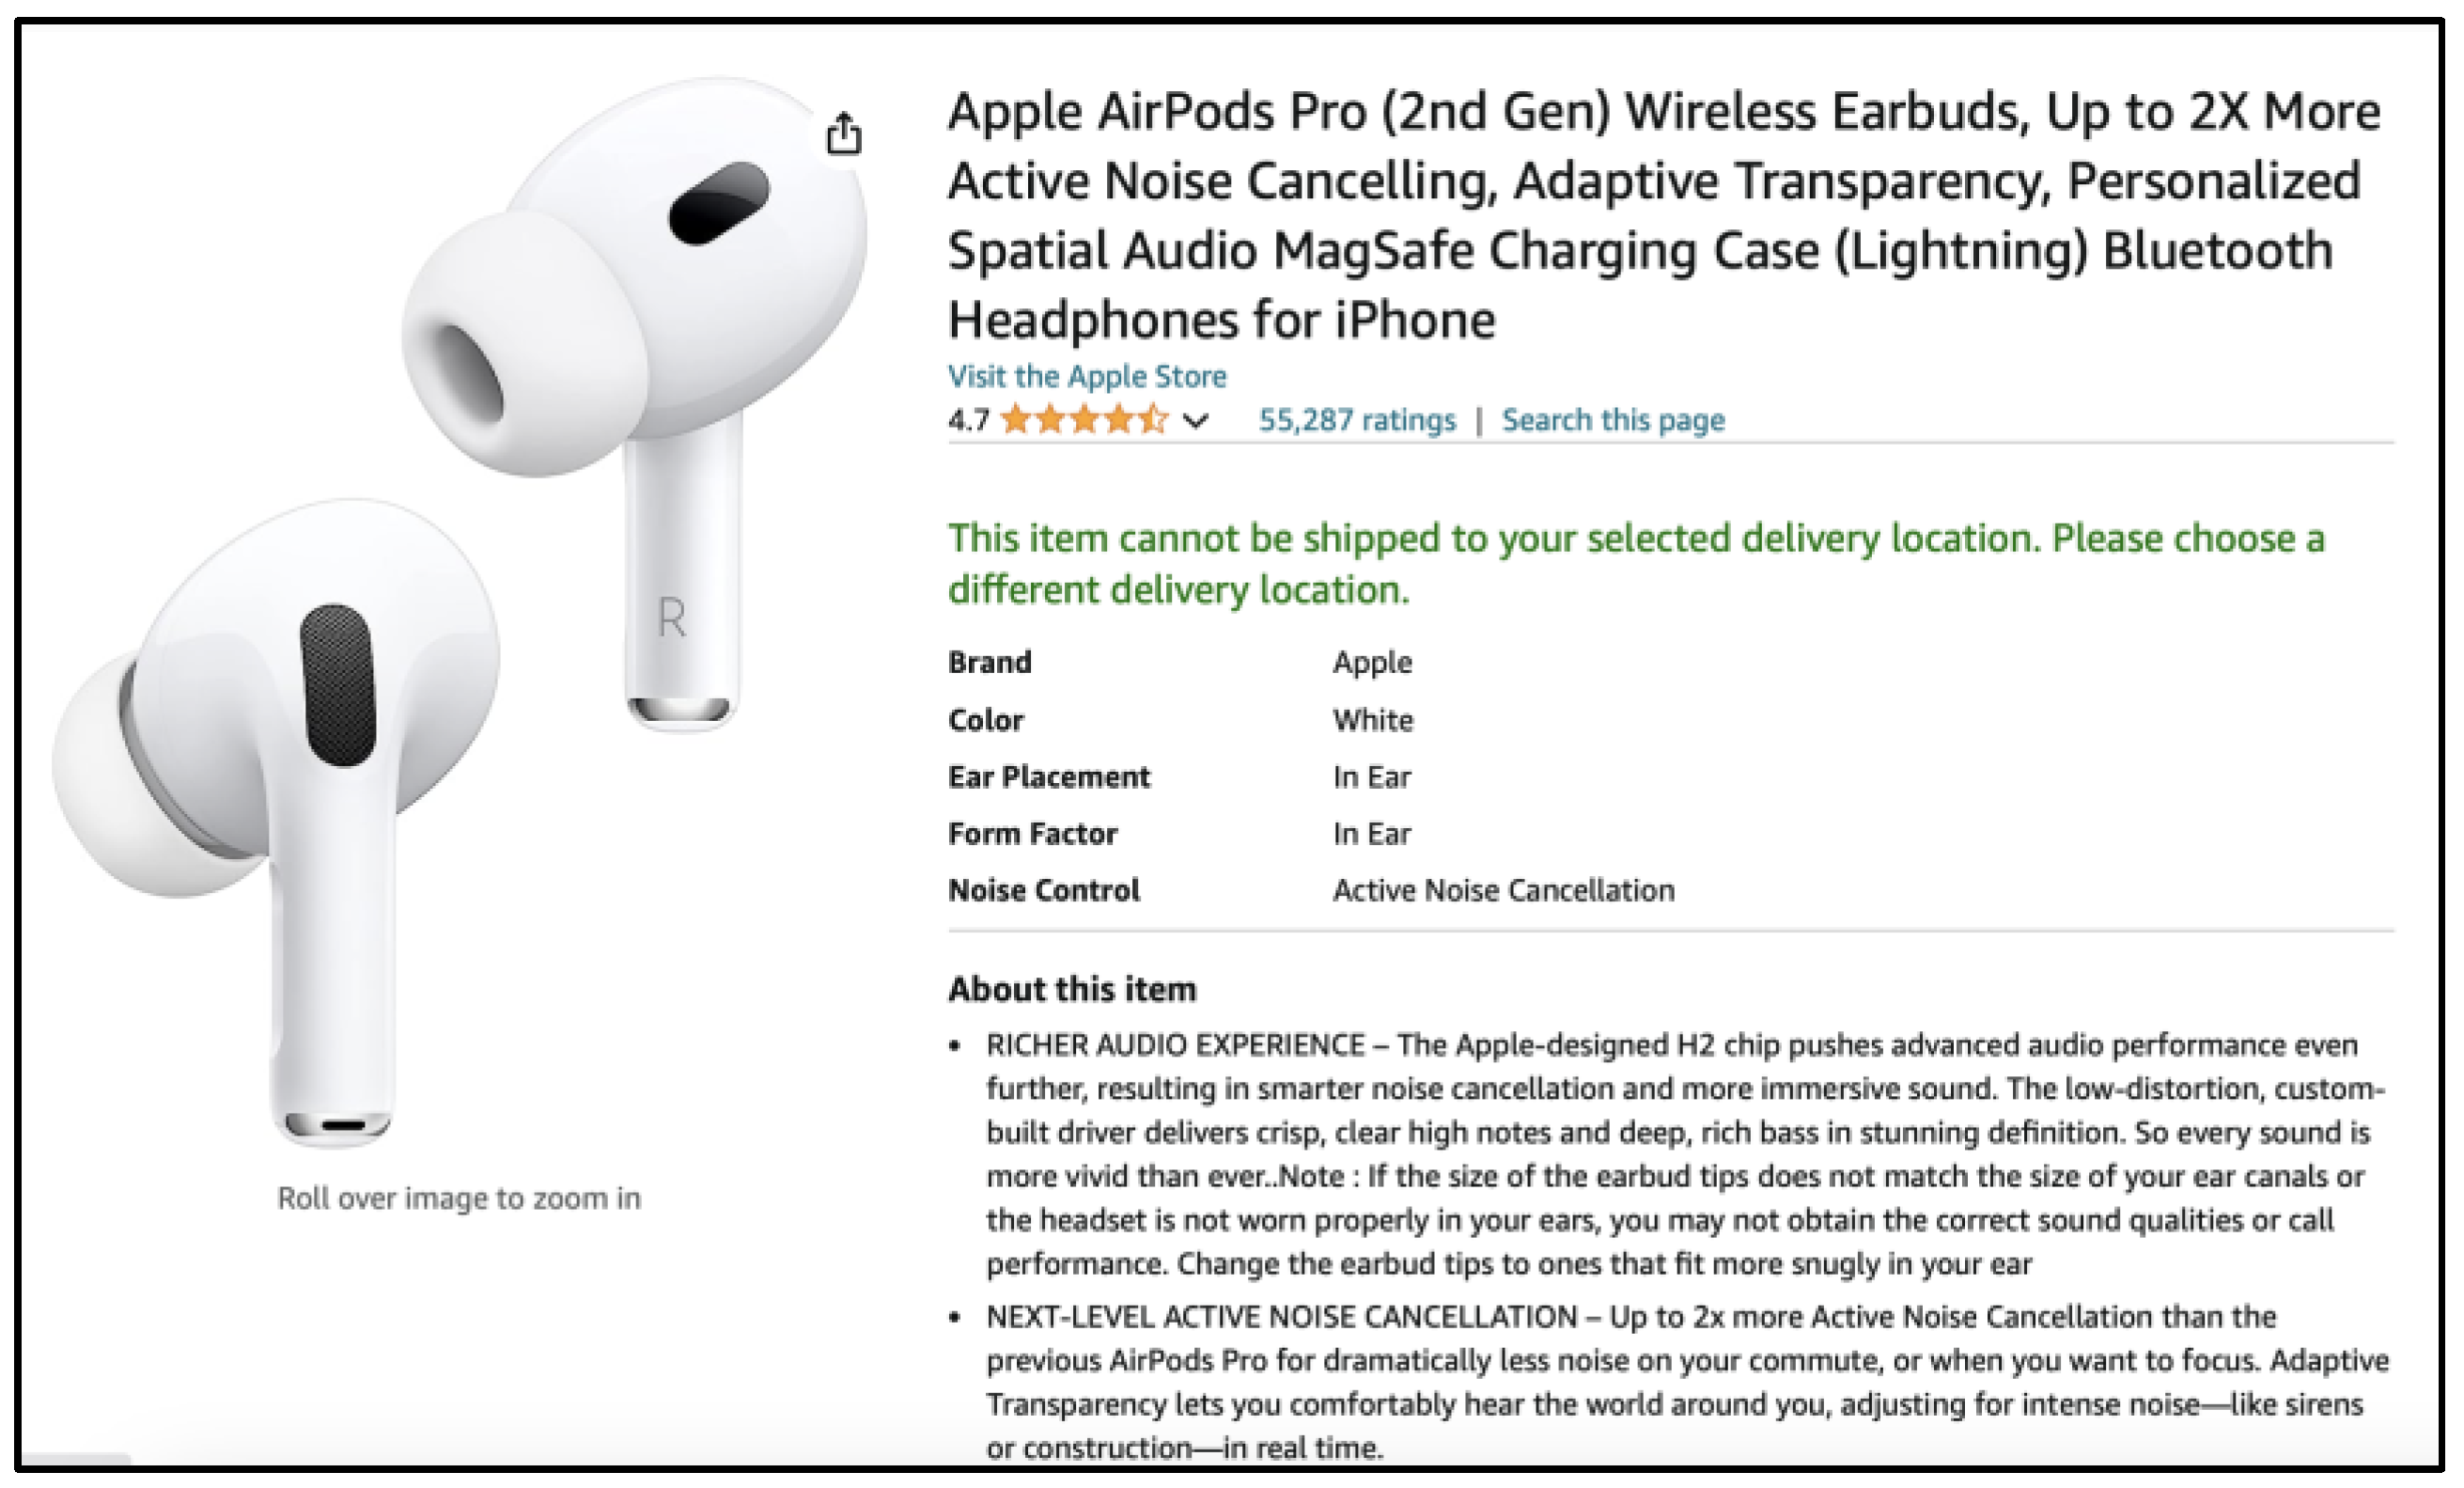
Our database was built from customer reviews of Apple AirPods 2nd Generation on Amazon USA during the period December 2023–January 2024. The reviews considered are authored by reviewers with a positive reputation who consistently contribute reviews for Amazon products, which are estimated as helpful. Additionally, the presence of the “Verified Purchase” label testifies their credibility.
Conducting market research, competitive analysis, and trend tracking is crucial for making informed business decisions. One of the effective methods to gather large amounts of data from online sources is web scraping [
38].
After specifying the product number and URL, the next step is to point to a specific node in the structure of the page. To implement web scraping and all statistical methodologies, we have chosen R language version 4.3.2 and RStudio version 2023.12.1 as our working IDE.
In accordance with Amazon’s ethical guidelines for scraping reviews, only the 100 most helpful reviews for each rating category are permitted to be scrapped. Each review consists of at least two paragraphs.
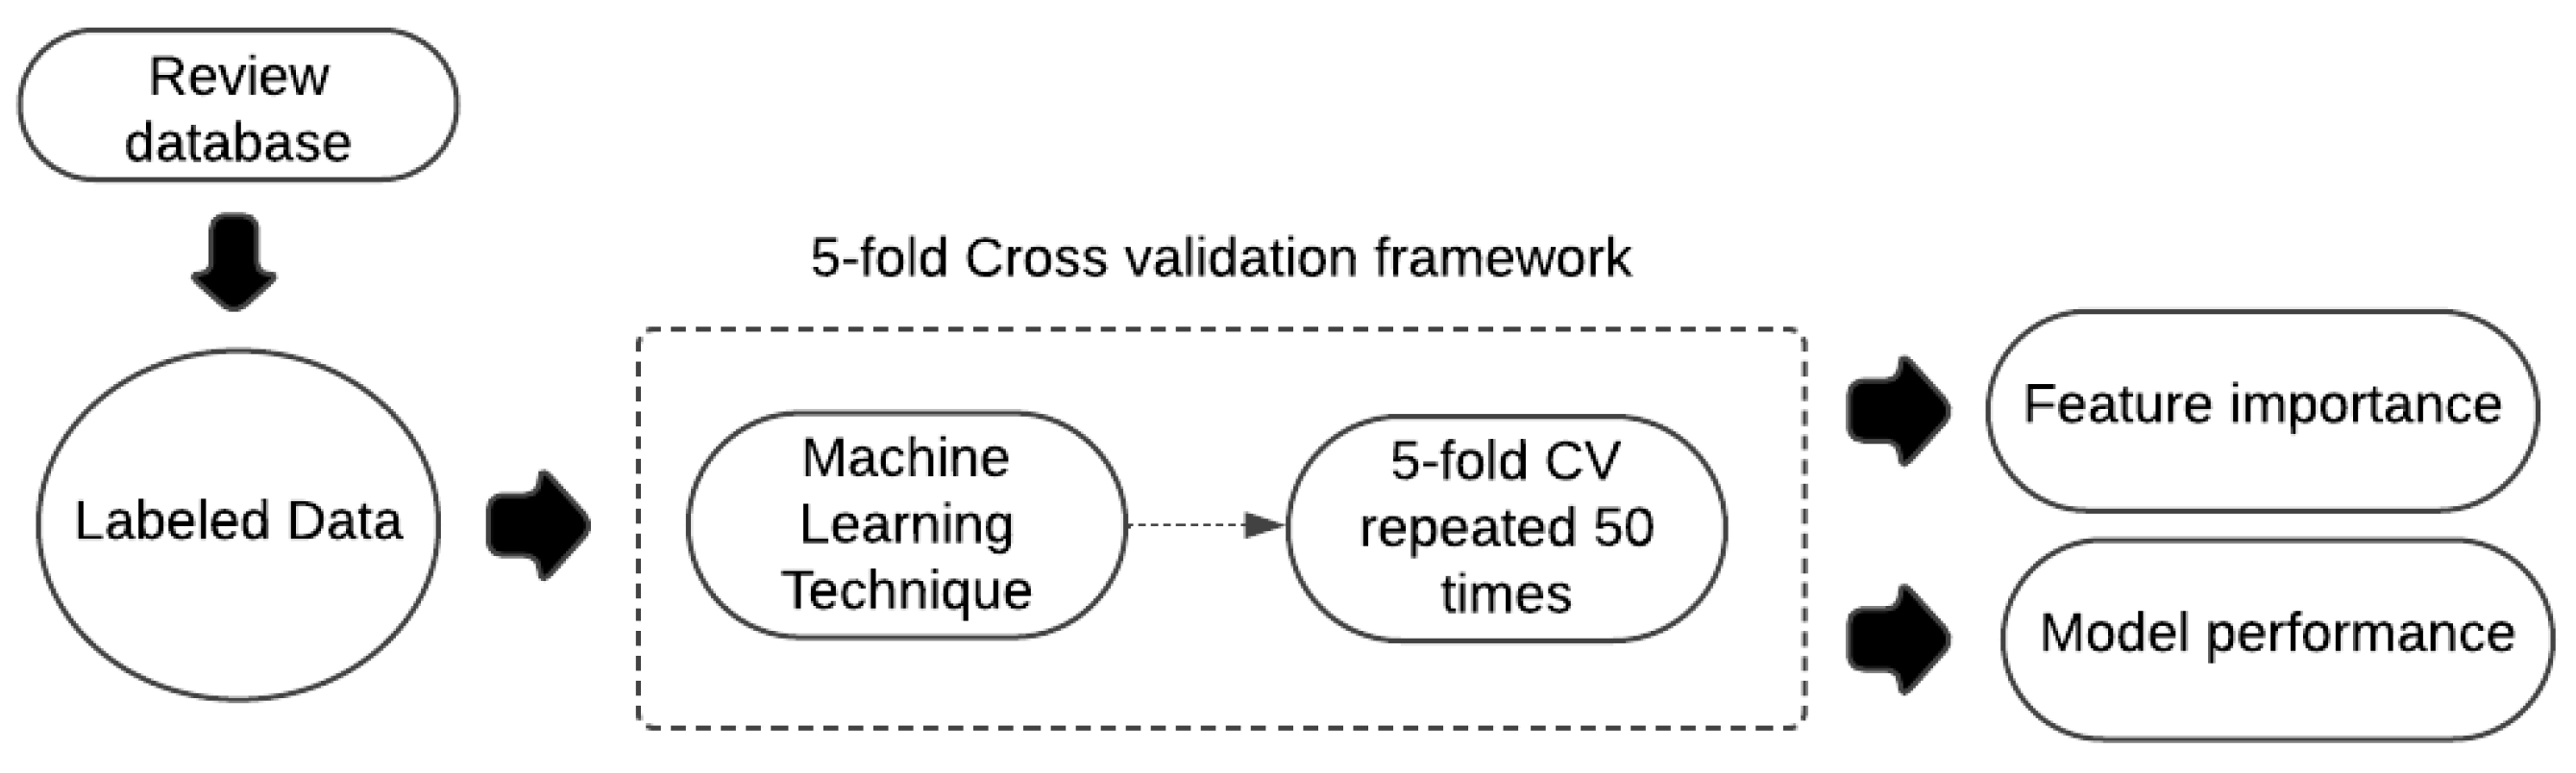
Reviews with 1 and 2 stars are classified negative and labeled as 0, while those with 3, 4, and 5 stars are classified as positive and labeled as 1. The dataset was unbalanced (60% positive reviews and 40% negative one), so we used a random subsampling method to balance data. Then, the dataset was pre-processed and a TF-IDF matrix was created to feed it into ML models. The resulting term frequency-inverse document frequency (TF-IDF) matrix had dimensions of 400 × 5477.
Determining the optimal dimensionality of a dataset for training ML models lacks a definitive answer, as it depends on the context of the analysis and various factors. In our case, the choice of using a naïve Bayes model presents an important advantage as it is less prone to overfitting, particularly when compared to more complex models. This characteristic effectively mitigates issues commonly associated with small datasets [
39,
40].
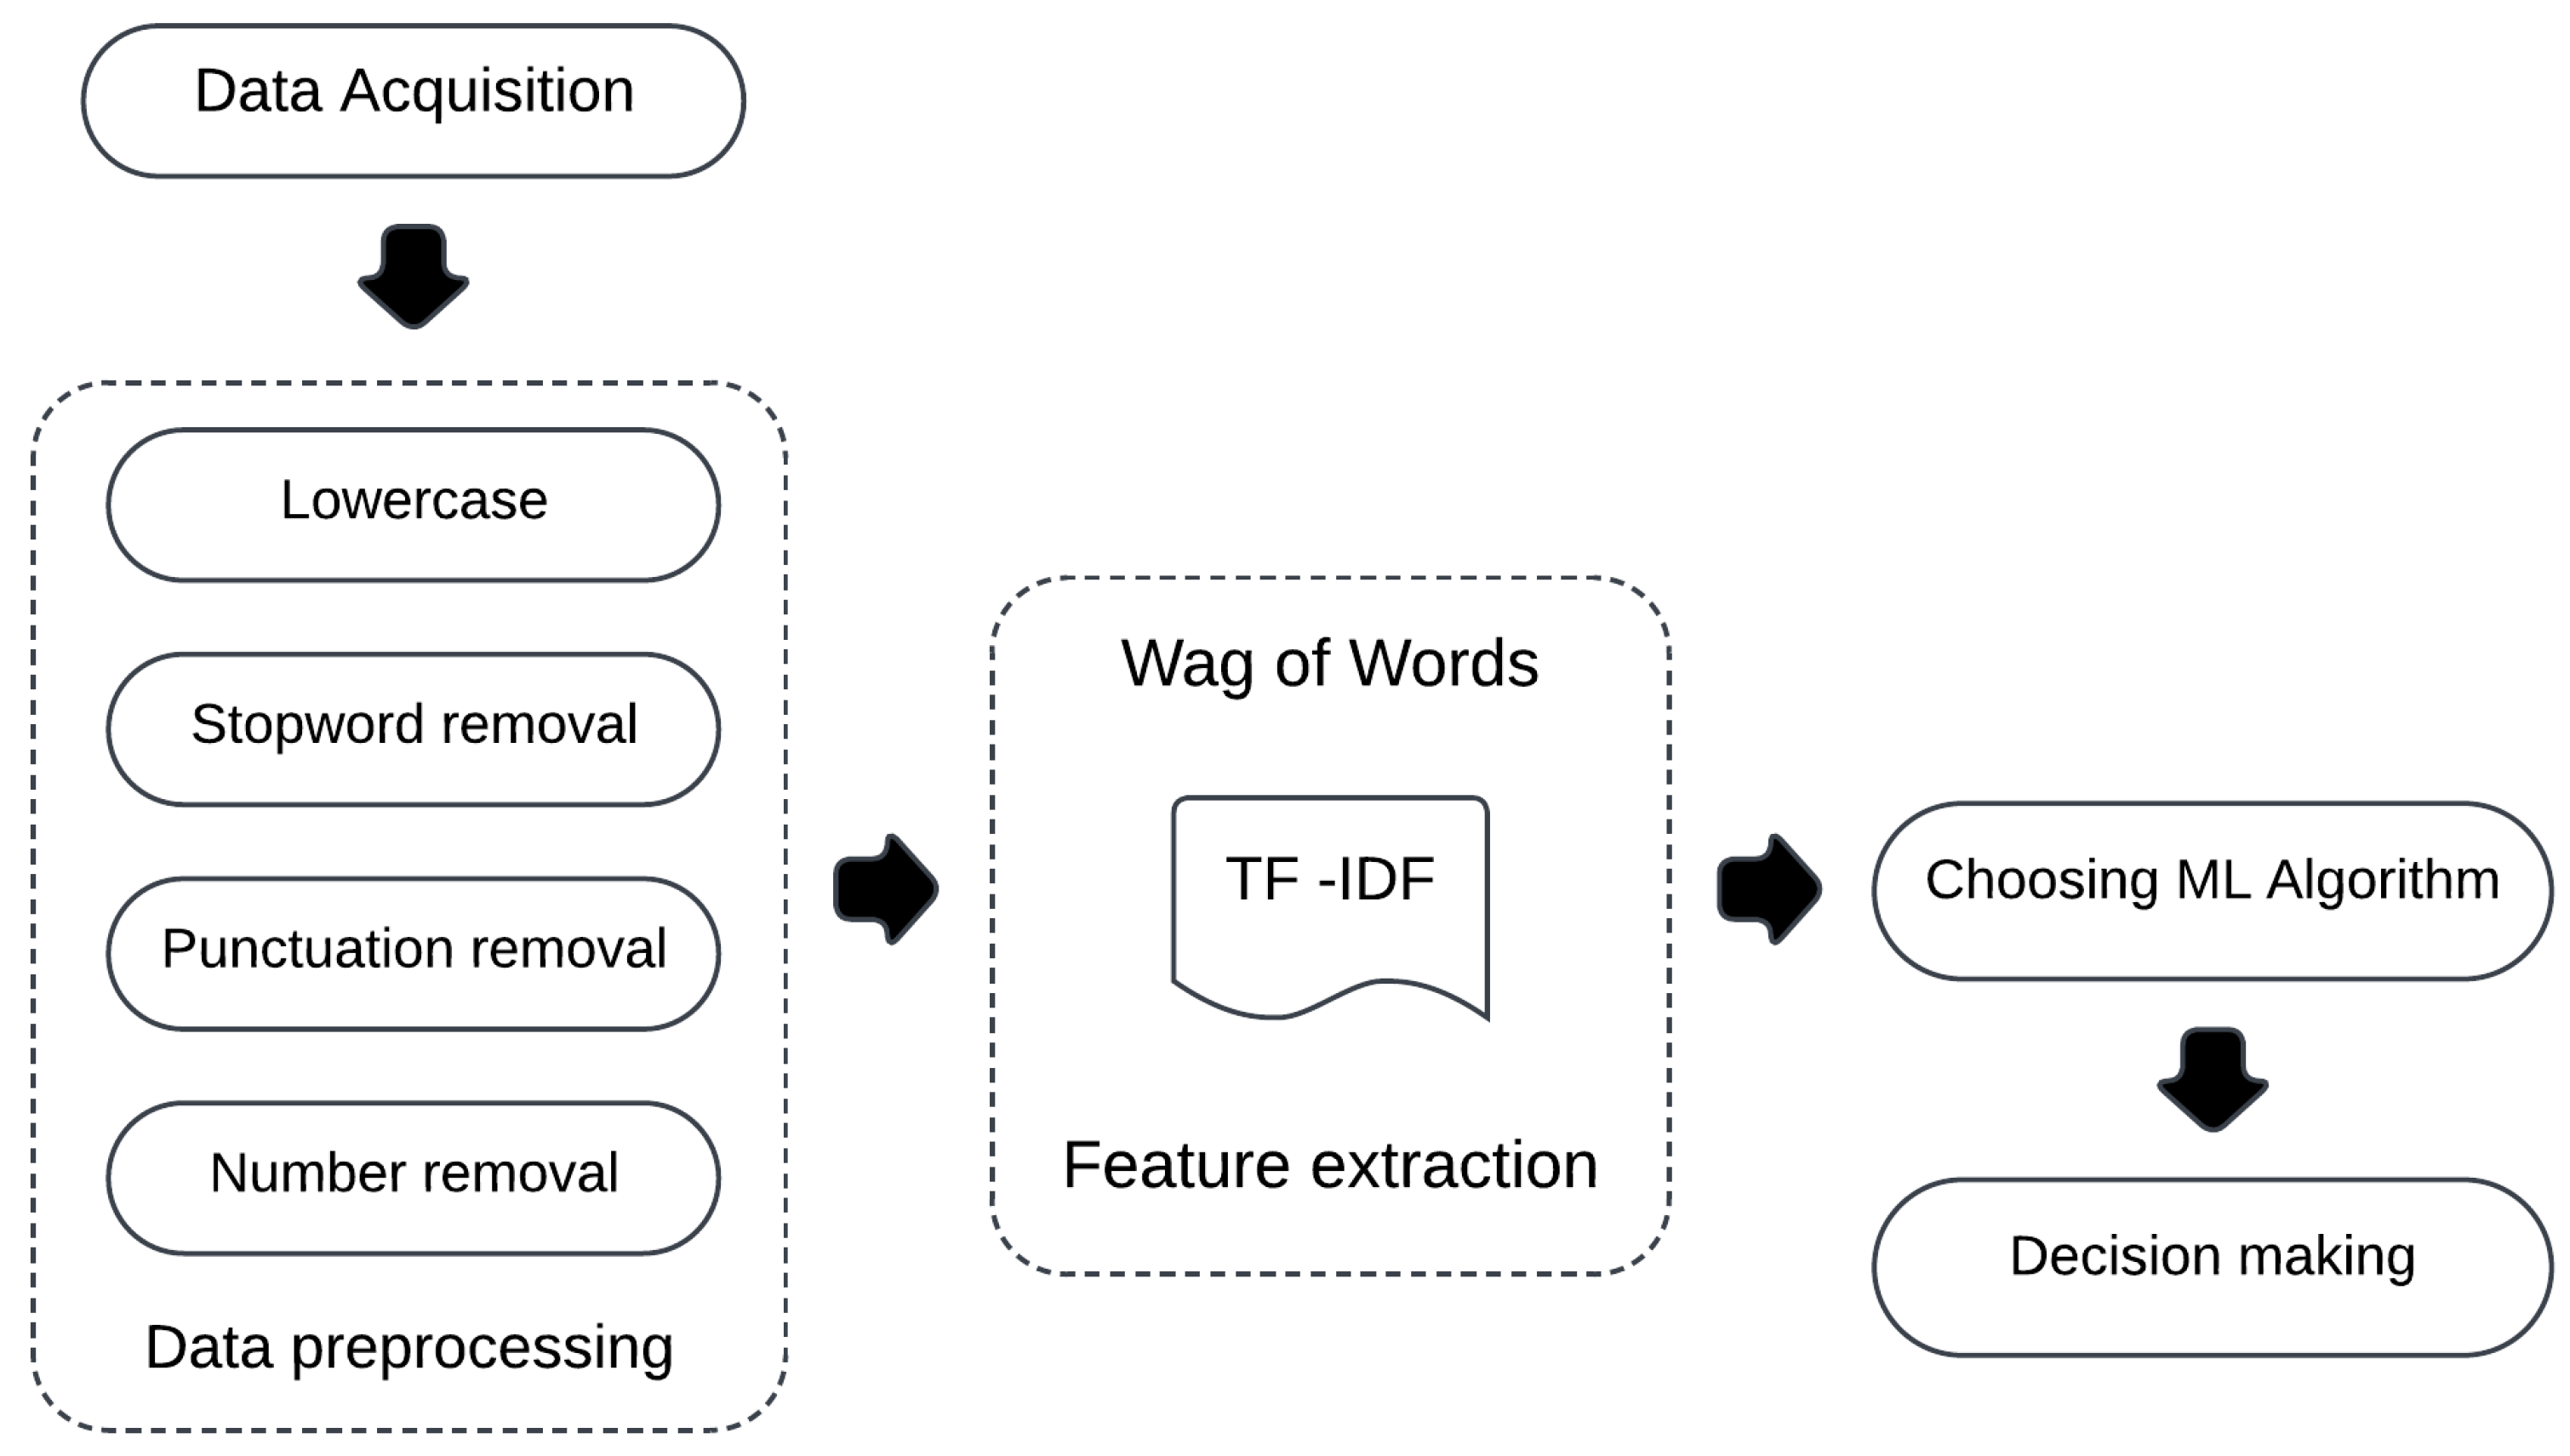
Figure 1 illustrates the workflow proposed in this study. The process begins with data acquisition, followed by its transformation into the appropriate format through preprocessing techniques. The input to the ML model is a TF-IDF matrix, which serves for training the naïve Bayes classifier.
3.2. Data Preprocessing Methods
A central step in sentiment analysis is the preprocessing of the textual data by cleaning, normalizing the language, and removing noisy information caused by the occurrence of words that do not present any value in classifying the polarity of the review.
We used the “tm Package Text Mining in R” [
41] to perform these preprocessing techniques, as showed schematically in
Figure 1:
Lowercase: Converts all texts to lowercase and merges words that differ only by case. For example, it treats “noise”, “Noise”, and “noIse” as the same word.
Stop word removal: these words often appear in the text, but they do not convey any sentiment in the review, as they have less meaningful content.
Punctuation removal: for the same reason of not containing specific sentiment and for reducing noise, punctuation is removed.
Number removal: Numbers are unnecessary characters in the text. They are additionally removed, in addition to not being present in our datasets as emotional icon expression [
42].
We cannot directly feed words to the algorithms, instead, we need to transform them into numerical representations. For this purpose, we utilize TF-IDF, a statistical approach to derive a feature weight matrix from the data [
43]. Researchers considered TF-IDF as the superior feature extraction method [
44]. It is used to represent textual information as a vector composed of
n weighted words terms by the product of the two following measures:
By using this concept, the calculation of this score would be as follows:
where
D is the set of the reviews and
d(
i) is the number of elements in
D containing the word
i at least once as demonstrated in Equation (2) [
45].
TF-IDF values are generally normalized in the range of (0, 1). The final formula in Equation (3) that decides the matrix of words is given by the multiplication of the above factors [
46].
3.3. Naïve Bayes Model
In terms of sentiment extraction, in our work, we used the ML classifier naïve Bayes. This method has been preferred in this context over other heavier ML (e.g., VML, RF, and XGB) and deep learning (DL) methods (e.g., BERT). Indeed, unlike other supervised methods that are computationally expensive and require significant storage, time and large annotated datasets, NB possess the following attributes:
It is much faster in analyzing results and is a great performance trade-off in terms of computation cost efficiency [
29,
31]. Naïve Bayes trains quickly, while BERT can take a long time because it is a DL model with millions of parameters, which requires GPU to train and is slower both in training and inference.
It works well with small datasets, as it is based on conditional probabilities and does not need millions of examples to generalize well [
39,
40].
It is an easily interpretable model that specifies the words that have the greatest influence on the classification. A DL algorithm such as BERT is useful if the meaning of the word changes based on the context. In cases of simple reviews, the benefit may not justify the computational cost, and furthermore, we are in the presence of a “black box” that is difficult to analyze [
47,
48].
Bayes’ theorem is fundamental for inferential statistics. Bayesian statistics is a data analysis method based on Bayes’ theorem, the approach of which stands in updating the probability of an event, using the information of new evidence [
49]. In this theorem, the information in observed data updates the knowledge about statistical parameters. Bayesian posterior distribution is determined by combining the background knowledge expressed as prior distribution and observational data as a likelihood function. Then, the posterior distribution can be used to make predictions about future events.
In Bayesian statistics, all observed and unobserved parameters are given a joint probability distribution. The Bayesian workflow consists of three main steps: capturing available data using a prior distribution, determining the likelihood function using the information parameters in the observed data, and obtaining the posterior distribution reflecting updated knowledge to conduct inferences.
Prior distributions can be represented by normal, uniform, or Poisson distribution. In literature, there are 3 most used classifications to categorize the degree of uncertainty of the population parameter value: informative, weakly informative, and diffuse. A normal distribution defined by mean and variance linked to the level of informativeness may be considered informative, weakly, or diffuse based on the researcher judgment for the likelihood and parameter settings. Parameters controlling the amount of uncertainty in prior distributions are called hyperparameters. Normal prior distribution could be written as , where represents the mean seen as the peak of the distribution, and the variance. Informative prior distribution confirms a high degree of certainty for the parameters estimated, including that in some cases, it does not produce an accurate posterior for the population model parameter.
Weakly informative prior distribution has a larger variance and less impact in posterior compared to informative. It is used when information about a parameter at a given level of uncertainty is desired. Given an example of a regression model known to have a coefficient near 0, a weakly informative distribution can reduce the probability of observing out of bond values by reducing the range to .
A diffuse prior, or non-informative, reflects a large amount of uncertainty about the parameter and may be used when there is a complete lack of uncertainty about the parameter. A diffuse prior can be used to gain information and then apply a more informative prior to the same data.
Priors are known to be subjective, including the model and error assumptions. However, subjectivity is not necessarily a drawback, as it can be used as tool to shrink information from data, influence algorithms to higher density regions, and improve estimation values [
50].
Likelihood is used to quantify the strength of observed data to possible values for unknown parameters. Even though likelihood is also used by frequentists, they do not consider useful probability statements about unknown parameters. Bayesian inference is used to make probability statements, referring to unknown parameters as random variables. Whereas observed data are treated as fixed, parameter values are treated as varied.
Therefore, the likelihood is a function for the fixed data . The posterior distribution is the result after combining the prior with the assumed probability model of the observed data. Once the posterior distribution is obtained, the model is used to estimate unknown parameters. It is often associated with a credible interval, as direct inference is usually not possible from the high dimensionality and number of parameters.
Bayes theorem derives from various probability concepts, which we will consider before explaining the final theorem. The first one is the “Total probability theorem”. The addition rule of 2 events,
A and
B, is given by the following:
Assuming that sample space can be divided in
n equally exclusive events
, where:
Set B can be expressed as follows:
Now we can write the total probability theorem as follows:
If
and
, it can be stated:
Therefore, we can write the following:
which is the formulation of Bayes’ theorem. In data analysis, it is used to derive posterior probability
of a hypothesis given observed data, as shown below:
The likelihood of the data is given by
; it responds to “If hypothesis is true, what is the probability of observing these data?”.
shows the prior probability of the hypothesis or “What is the a priori probability of the hypothesis?”, also referred to as a degree of belief in the hypothesis.
is the probability of observing data, not respective of the specified hypothesis, or often referred to as a model [
49].
Bayes’ theorem is commonly used in the ML and data mining approach. In our analysis, we aim to build a binary classification, using the naïve Bayes classifier, as a kind of probabilistic mechanism based on the Bayesian theorem. The task is to find the best mapping for new data in a set of predefined classification [
40,
51].
The naïve Bayes classifier (NB) is part of the probabilistic classifiers based on the assumption that all features are independent of each other, given the category variable [
52]. There are different NB classifiers, where their differences stand in the assumption they make for the distribution of features. NB is used often in text analysis as a baseline due to its fast implementation.
In the naïve Bayes classifier, every feature, or word in our case , is involved in determining which category will be applied to an unseen document.
The NB classifier starts by calculating the prior distribution
Pr(
c) for each class
. Prior probability is determined by the frequency of each category in the training set. To arrive at a likelihood estimation, the contribution of each feature combined with prior distribution is calculated. Known also as MAP, or maximum a posteriori, it is shown in Equation (15):
Considering a training document set as
, with
word tokens in document
m, and
) prior distribution, it is calculated by counting the number of documents
, for each category
in set
D, by adding a smoothing prior
called Laplace smoothing if
. To estimate
we should generate non-parametric models for features called event models [
53].
Systematic reviews demonstrate an increase in empirical studies using Bayes’ theorem, as it finds application in various fields including psychology, sociology, and political sciences [
54]. This theory serves as an underlying foundation for understanding reasoning, decision making, and cognition of mind, contributing to the development of different fields.
The large amount of available literature on implementing Bayesian inference serves as a rich source to derive prior distributions. In the last decade, it has been noted that there is an increase in publications concerning Bayesian statistics due to further development in accessible software.
3.4. Training Naïve Bayes Classifier
The naïve Bayes classifier was implemented within the TF-IDF matrix framework utilizing the R programming language and the RStudio integrated development environment (IDE). To train the naïve Bayes algorithm, a label column was attached, assigning a value of (1) to positive reviews and (0) to negative ones. Following this training step, various metrics were employed to evaluate the performance of the model.
We selected four performance metrics, which are presented below, to evaluate the model.
In Equation (17),
accuracy (
Acc) presents the proportion of correctly classified reviews relative to the total number of reviews. In this context,
true positive (
TP) and
true negative (
TN) denote the correctly classified samples. Instead,
false positive (
FP) and
false negative (
FN) represent the misclassified reviews.
In Equation (18),
sensitivity (
Sens) illustrates the ratio of correctly positive classified reviews by dividing the number of true positives by the total number of positive reviews.
In Equation (19),
specificity (Spec) defines the ratio of the correctly negative classified reviews relative to the total number of negative reviews in the database.
In Equation (20),
F1-
score is defined as the harmonic mean of correctly classified samples.
4. Results
Our product object to analyze is Apple AirPods 2nd generation, illustrated in
Figure 3.
Amazon’s 1–5 scale for product ratings presents challenges in discerning the pros and cons of various product aspects. The review texts were tokenized and cleaned. Reviews with 1 and 2 stars were assigned a score of 0, while those with 3, 4, and 5 stars were assigned a score of 1, balancing the number of negative and positive reviews by matching the number of negative reviews with an equal number of positive ones.
For feature extraction, several methods were tested, including bag-of-words (found to be the most effective), collocations (bigrams), handling negation, spell checking, part-of-speech tagging, and analyzing sentence length (noting that negative reviews tend to have shorter sentences). For classification, the naïve Bayes classifier has proven to be the most effective method compared to more complex methods.
Our exploratory analyses verifies the variability of the data within the dataset, highlights that the keywords used by clients sharing negative experiences are issues related to noise canceling problems, the product falling off, connection issues, disappointed about battery life, controls command do not work always, and concerns regarding an Amazon seller of whether the product seemed refurbished, and the terrible return process.
On the other hand, 5-star reviews prove the contrary for these aspects, as they are mentioned again, but the consumers think that the product gives a good cancellation of noise, has crystal audio, has reasonable battery duration, is comfortable, pretty, integrates seamlessly in the Apple eco-system, and thanks to its features, helped even persons who have disabilities and need ear enhancements.
The testimonials with 2 and 4 stars generally present the same keywords as their relative sentiment. However, they do not associate an extremely negative or extremely positive sentiment. For example, clients who rated the product with 4 stars admit that Air Pods are expensive but retain that they are worthy of their price. Instead, those with a rating of 2 stars state the quality of the sound, which is good, but the cancellation of background noises is unsatisfactory.
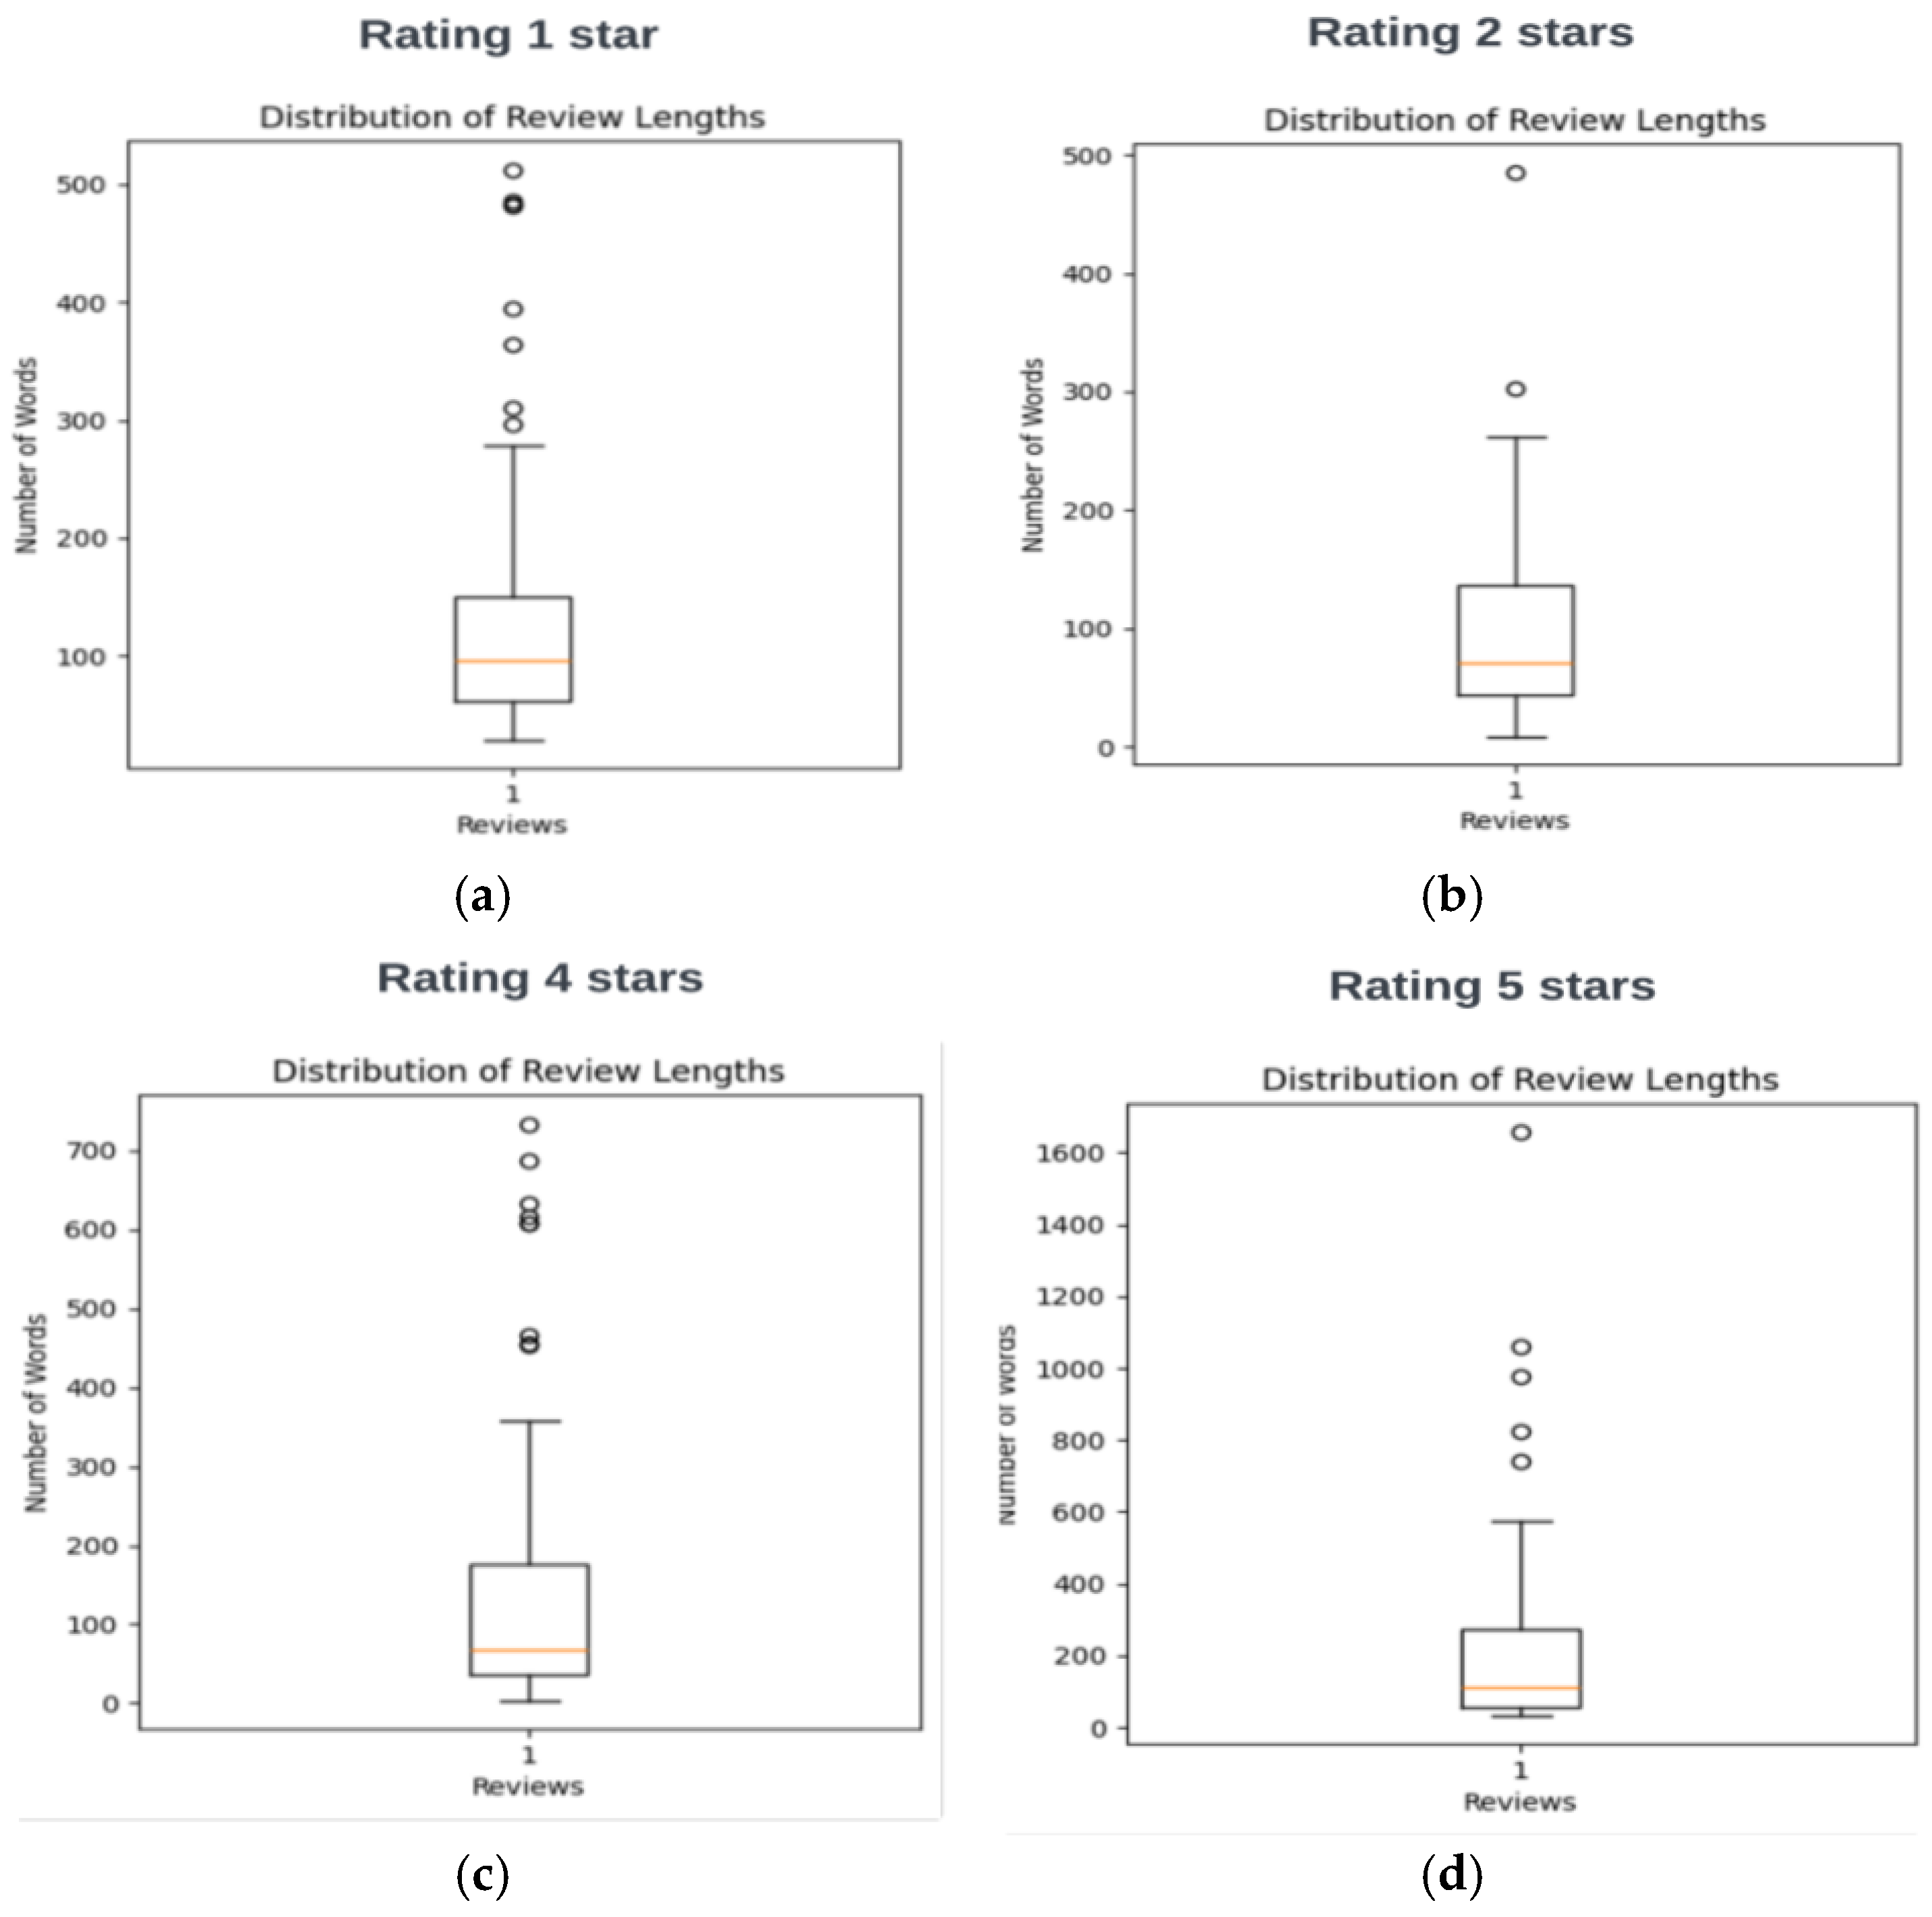
As shown in
Figure 4, to explore more about sentiments and other aspects in our databases, firstly, we analyzed the length review for all 4 rating categories.
We observe that the median value of the review lengths classified as extremely negative (96 words) is slightly longer than those with 2-star ratings (71 words). Reviews with 4-star ratings (62 words) exhibit a similar length to 2-star reviews but show a greater number of outliers. In contrast, 5-star reviews are notably the longest among all rating categories (123 words).
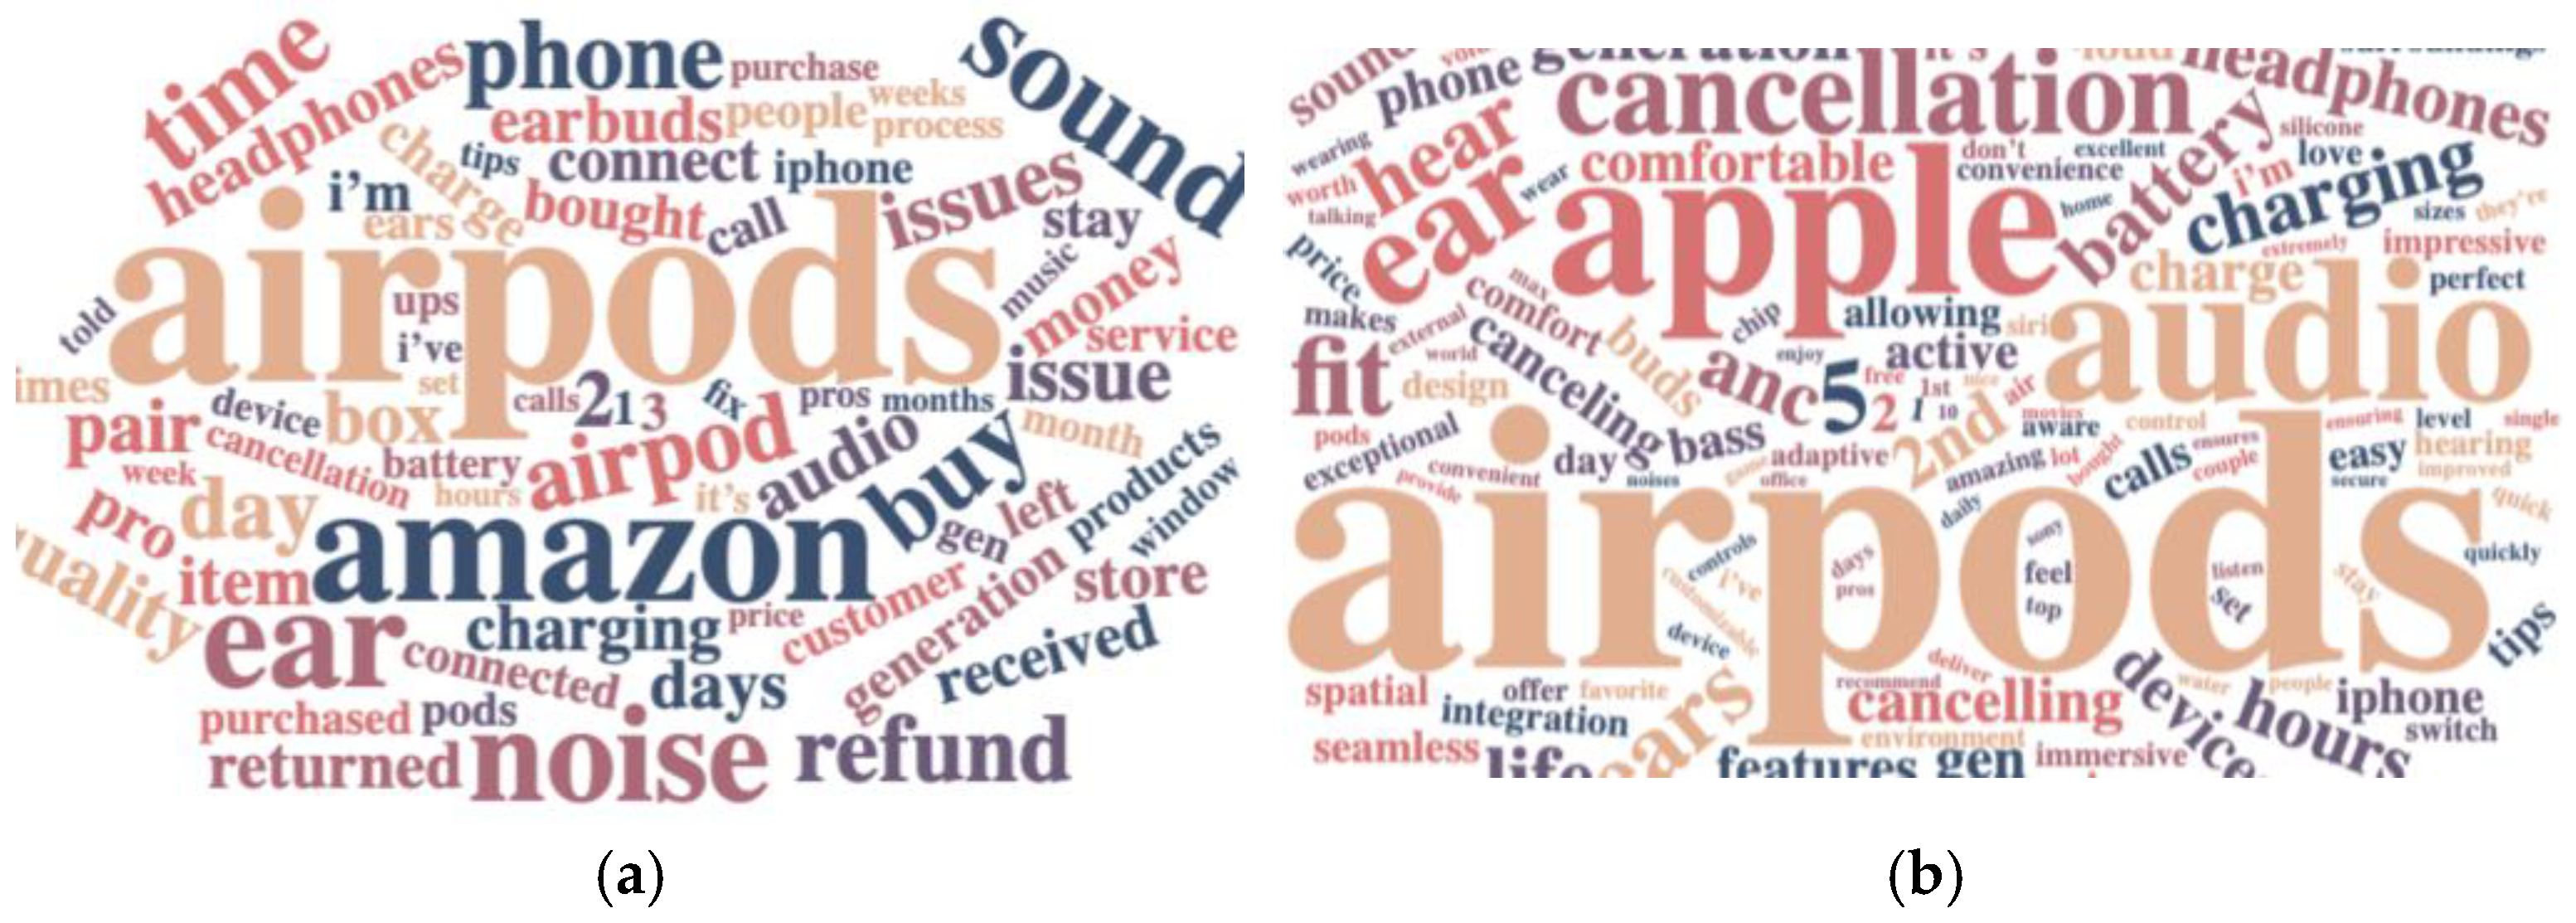
In a word cloud, the most used words in 1 rating reviews are presented below.
Word clouds serve as a visual representation in text analytics, identifying the most frequently used and significant terms that influence the polarity of reviews for these AirPods, shedding light on the factors that drive customers to rate the product.
We observe that the most frequently used word in both positive and negative reviews is “AirPods”. In
Figure 5a, several words are associated with negative reviews. The second most common word is “Amazon”, which may be related to post-purchase services and returns managed by the company. The third word, “ear”, could refer to the tendency of the headphones to fall out easily. The fourth word, “noise”, may indicate unwanted background noise. Additionally, the word cloud highlights terms such as “buy”, “phone”, “refunding”, and “time”, which are likely connected to negative experiences related to purchasing, connectivity issues between the headphones and the phone, unsuccessful return attempts, and excessive time spent on returns.
In
Figure 5b, positive reviews appear to focus on favorable features such as “audio” quality and “noise” cancellation. The word “Apple” is also prominently featured, suggesting that the brand name adds perceived value to the purchase. Furthermore, the presence of the word “features” implies a range of functionalities that improve user experience through multifunctionality and interconnectivity.
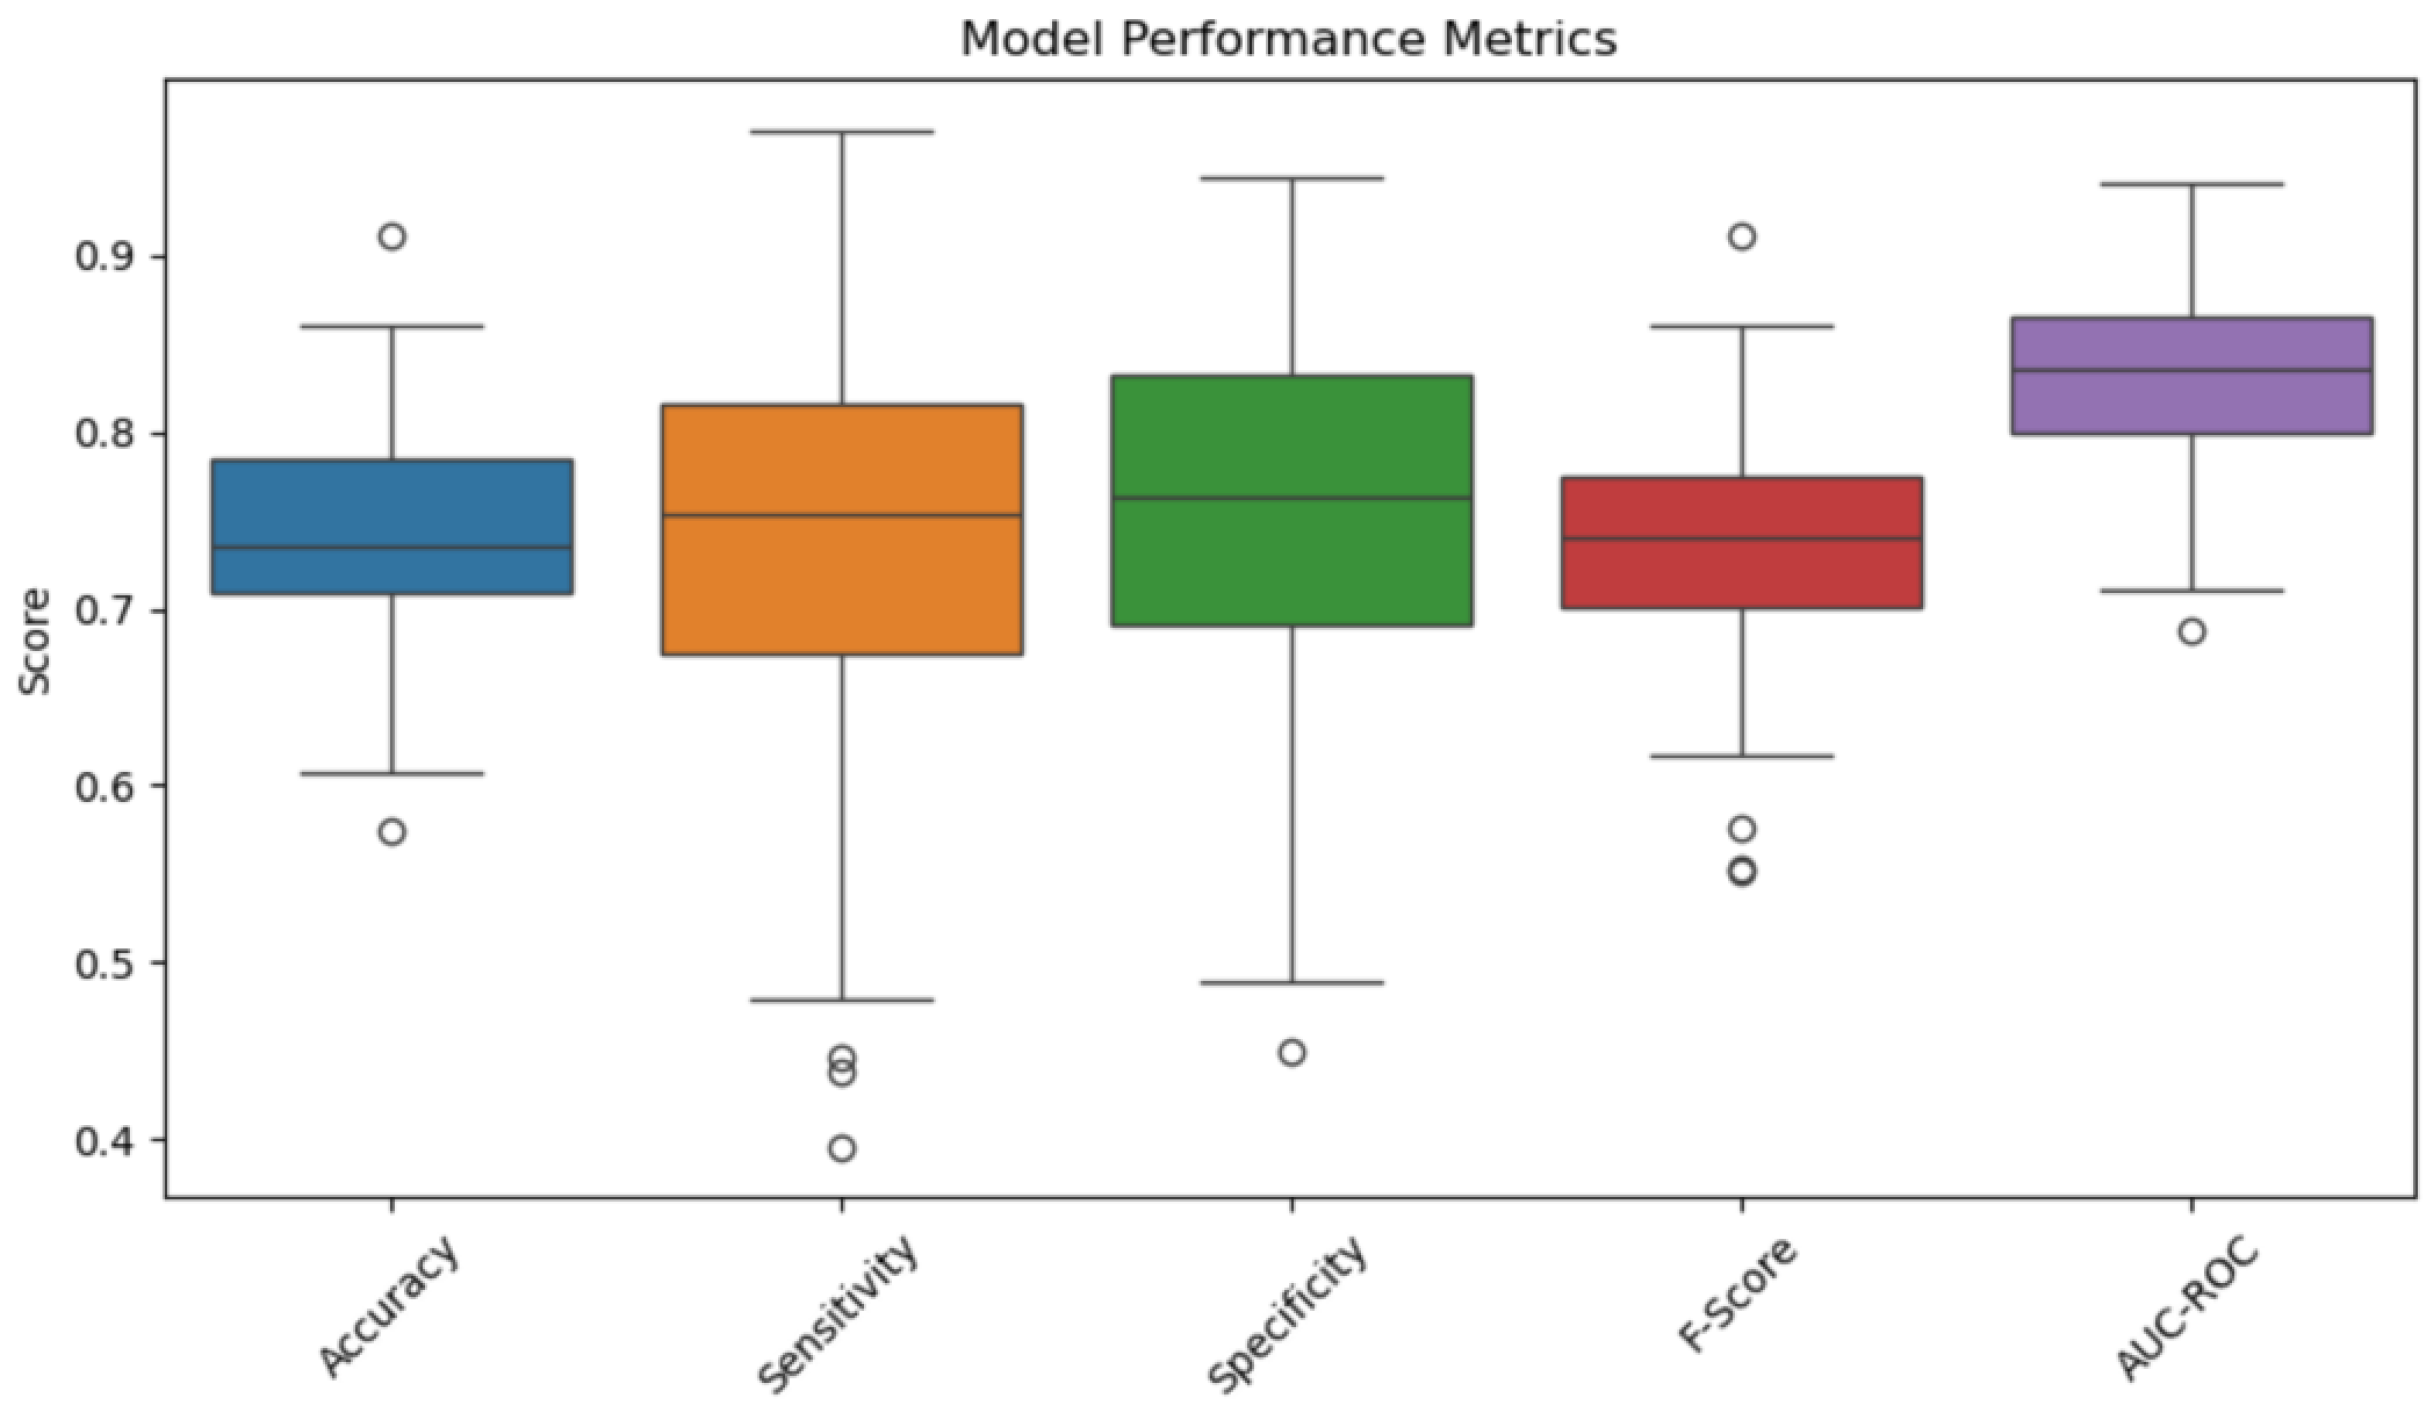
Upon completion of the model’s training, the average resulting accuracy is approximately 75%, indicating that the model performs relatively well on this dataset (
Table 1).
For better understanding, accuracy, sensitivity, specificity, and F-score are presented in a boxplot below in
Figure 6.
We suggest that the model can be utilized to further examine specific acoustic features identified by customers for this product. These results will be further analyzed using the sentiment analysis methods outlined below.
Sentiment Analysis Methods
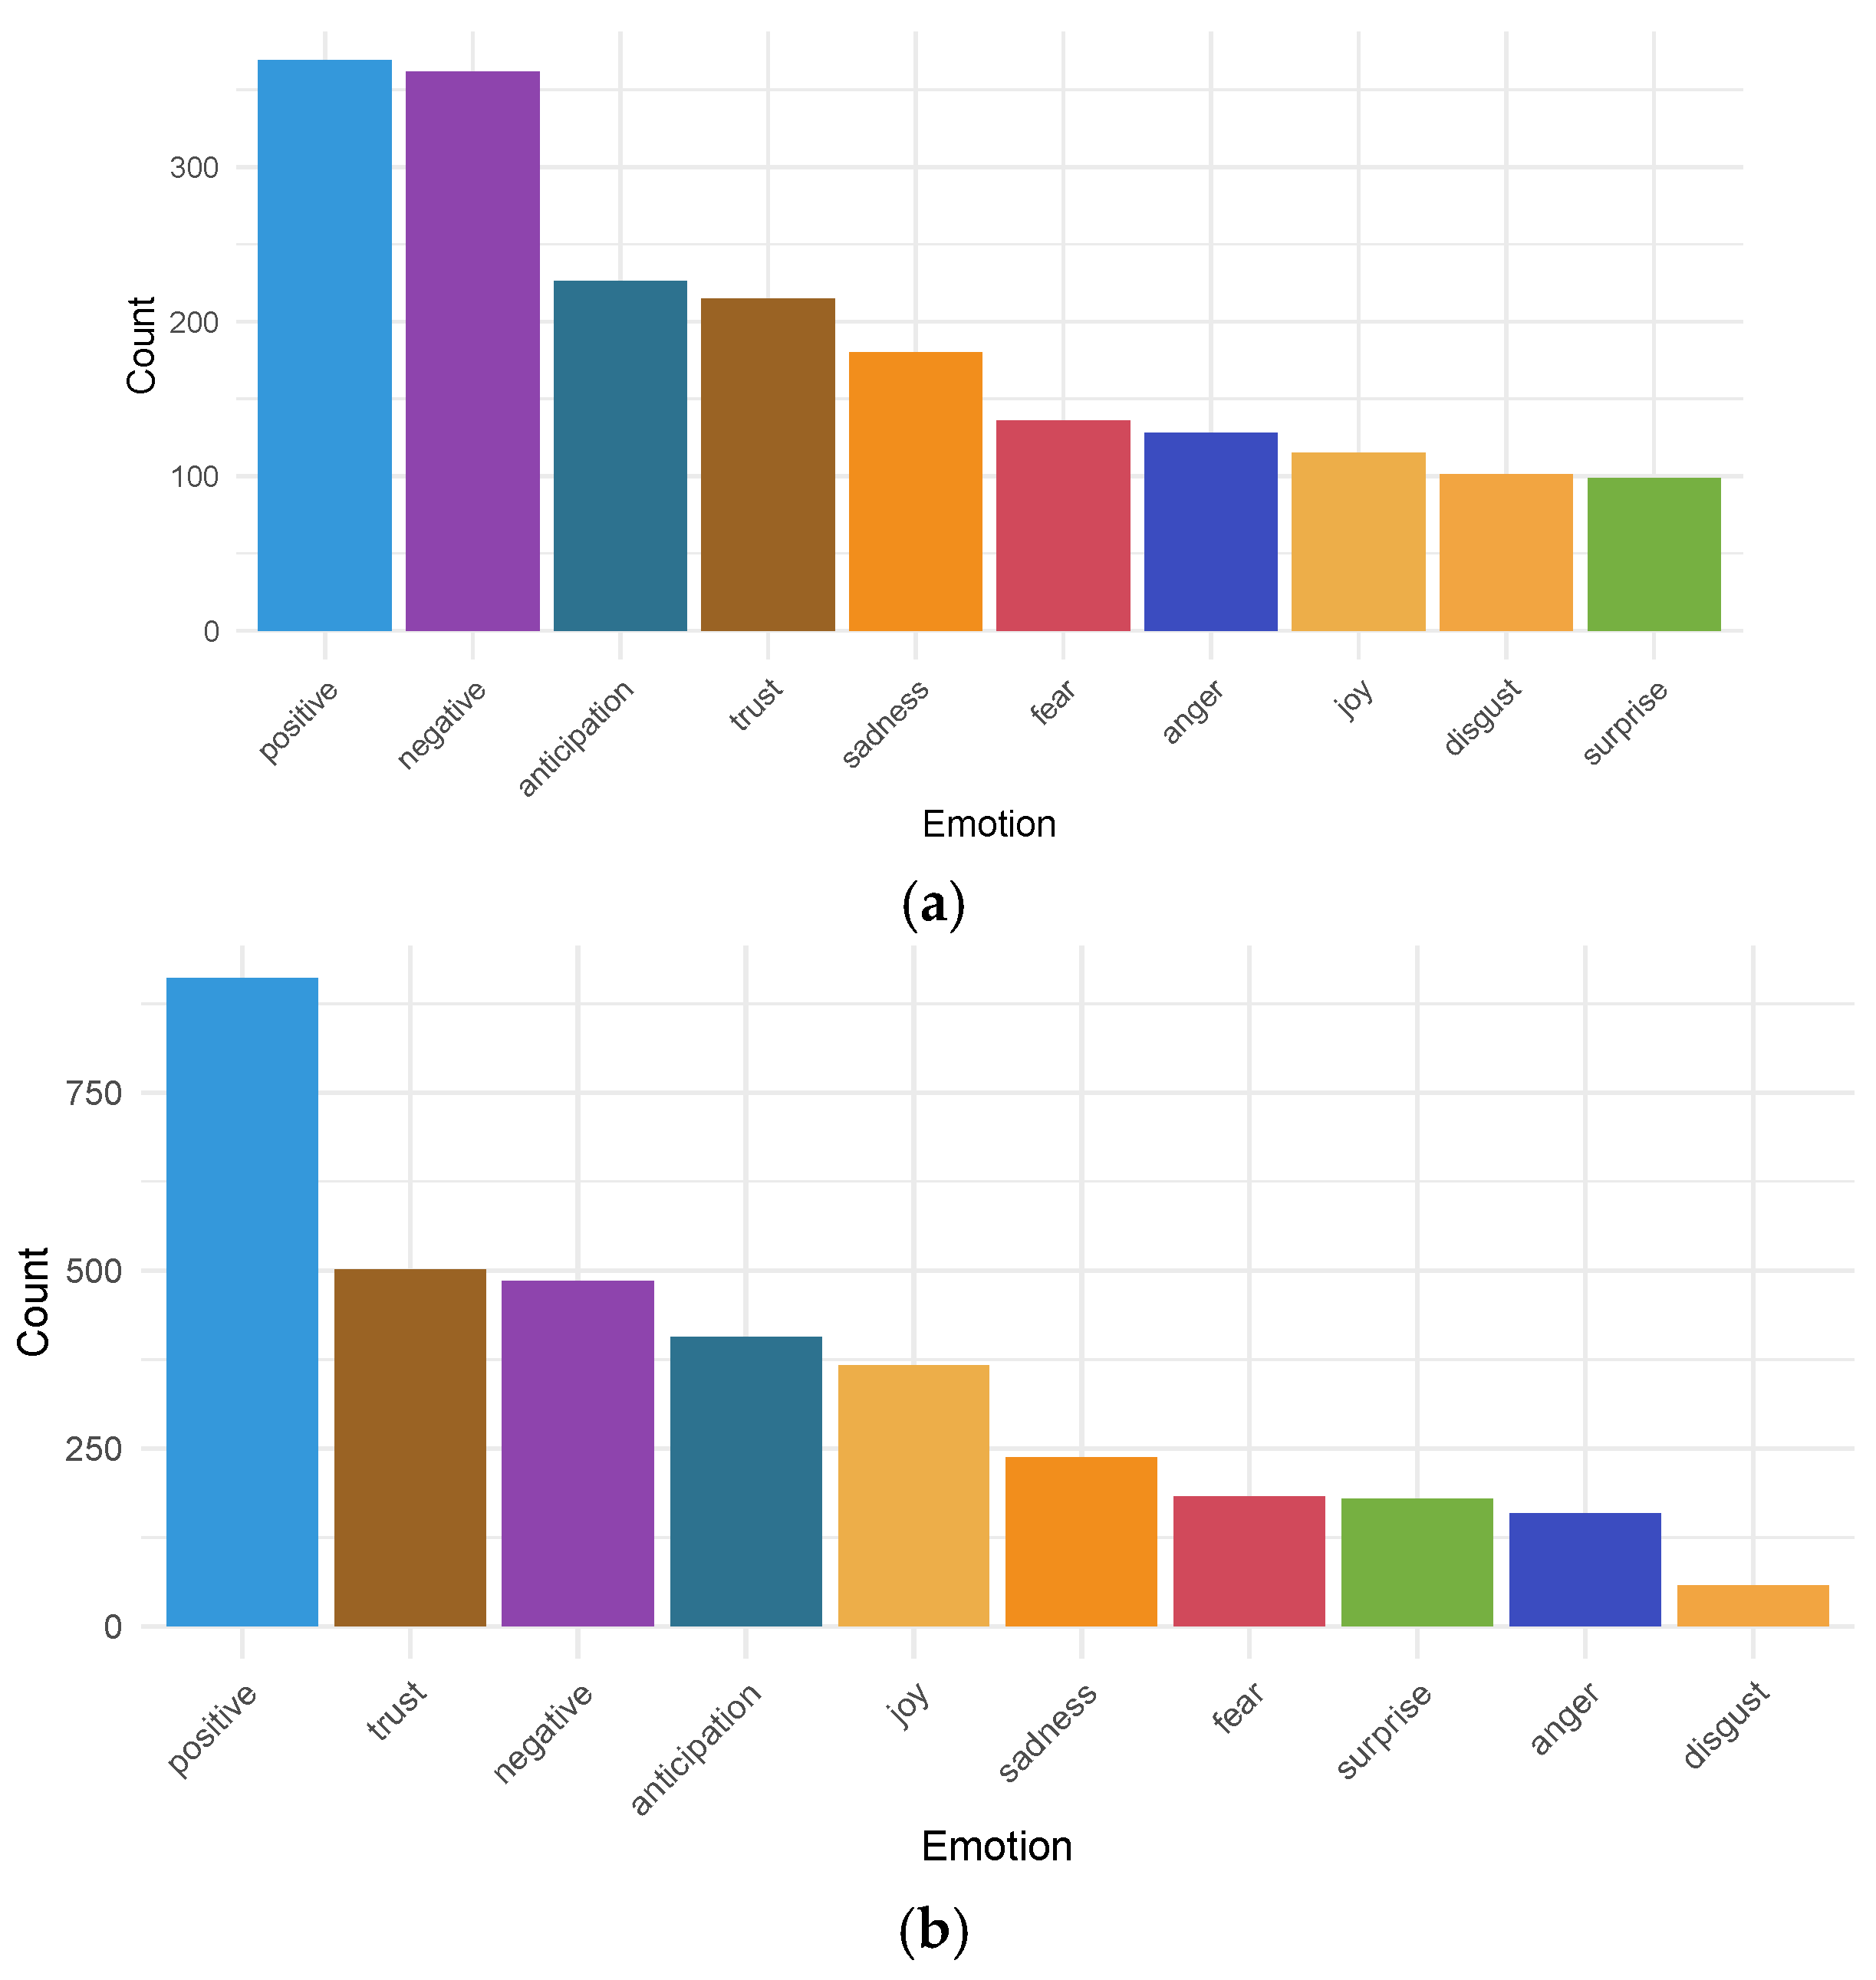
Figure 7 illustrates the emotions most frequently associated with this product based on customer reviews. In
Figure 7a, it can be observed that even in reviews with negative polarity, customers significantly associated the emotion of “trust”. This finding reaffirms the trust they place in these products, despite certain aspects leading them to leave negative reviews.
In
Figure 7b, where emotion distribution for positive reviews is presented, we notice that positive and trust are two main categories of positive sentiment that analysis associates in the 5-star reviews.
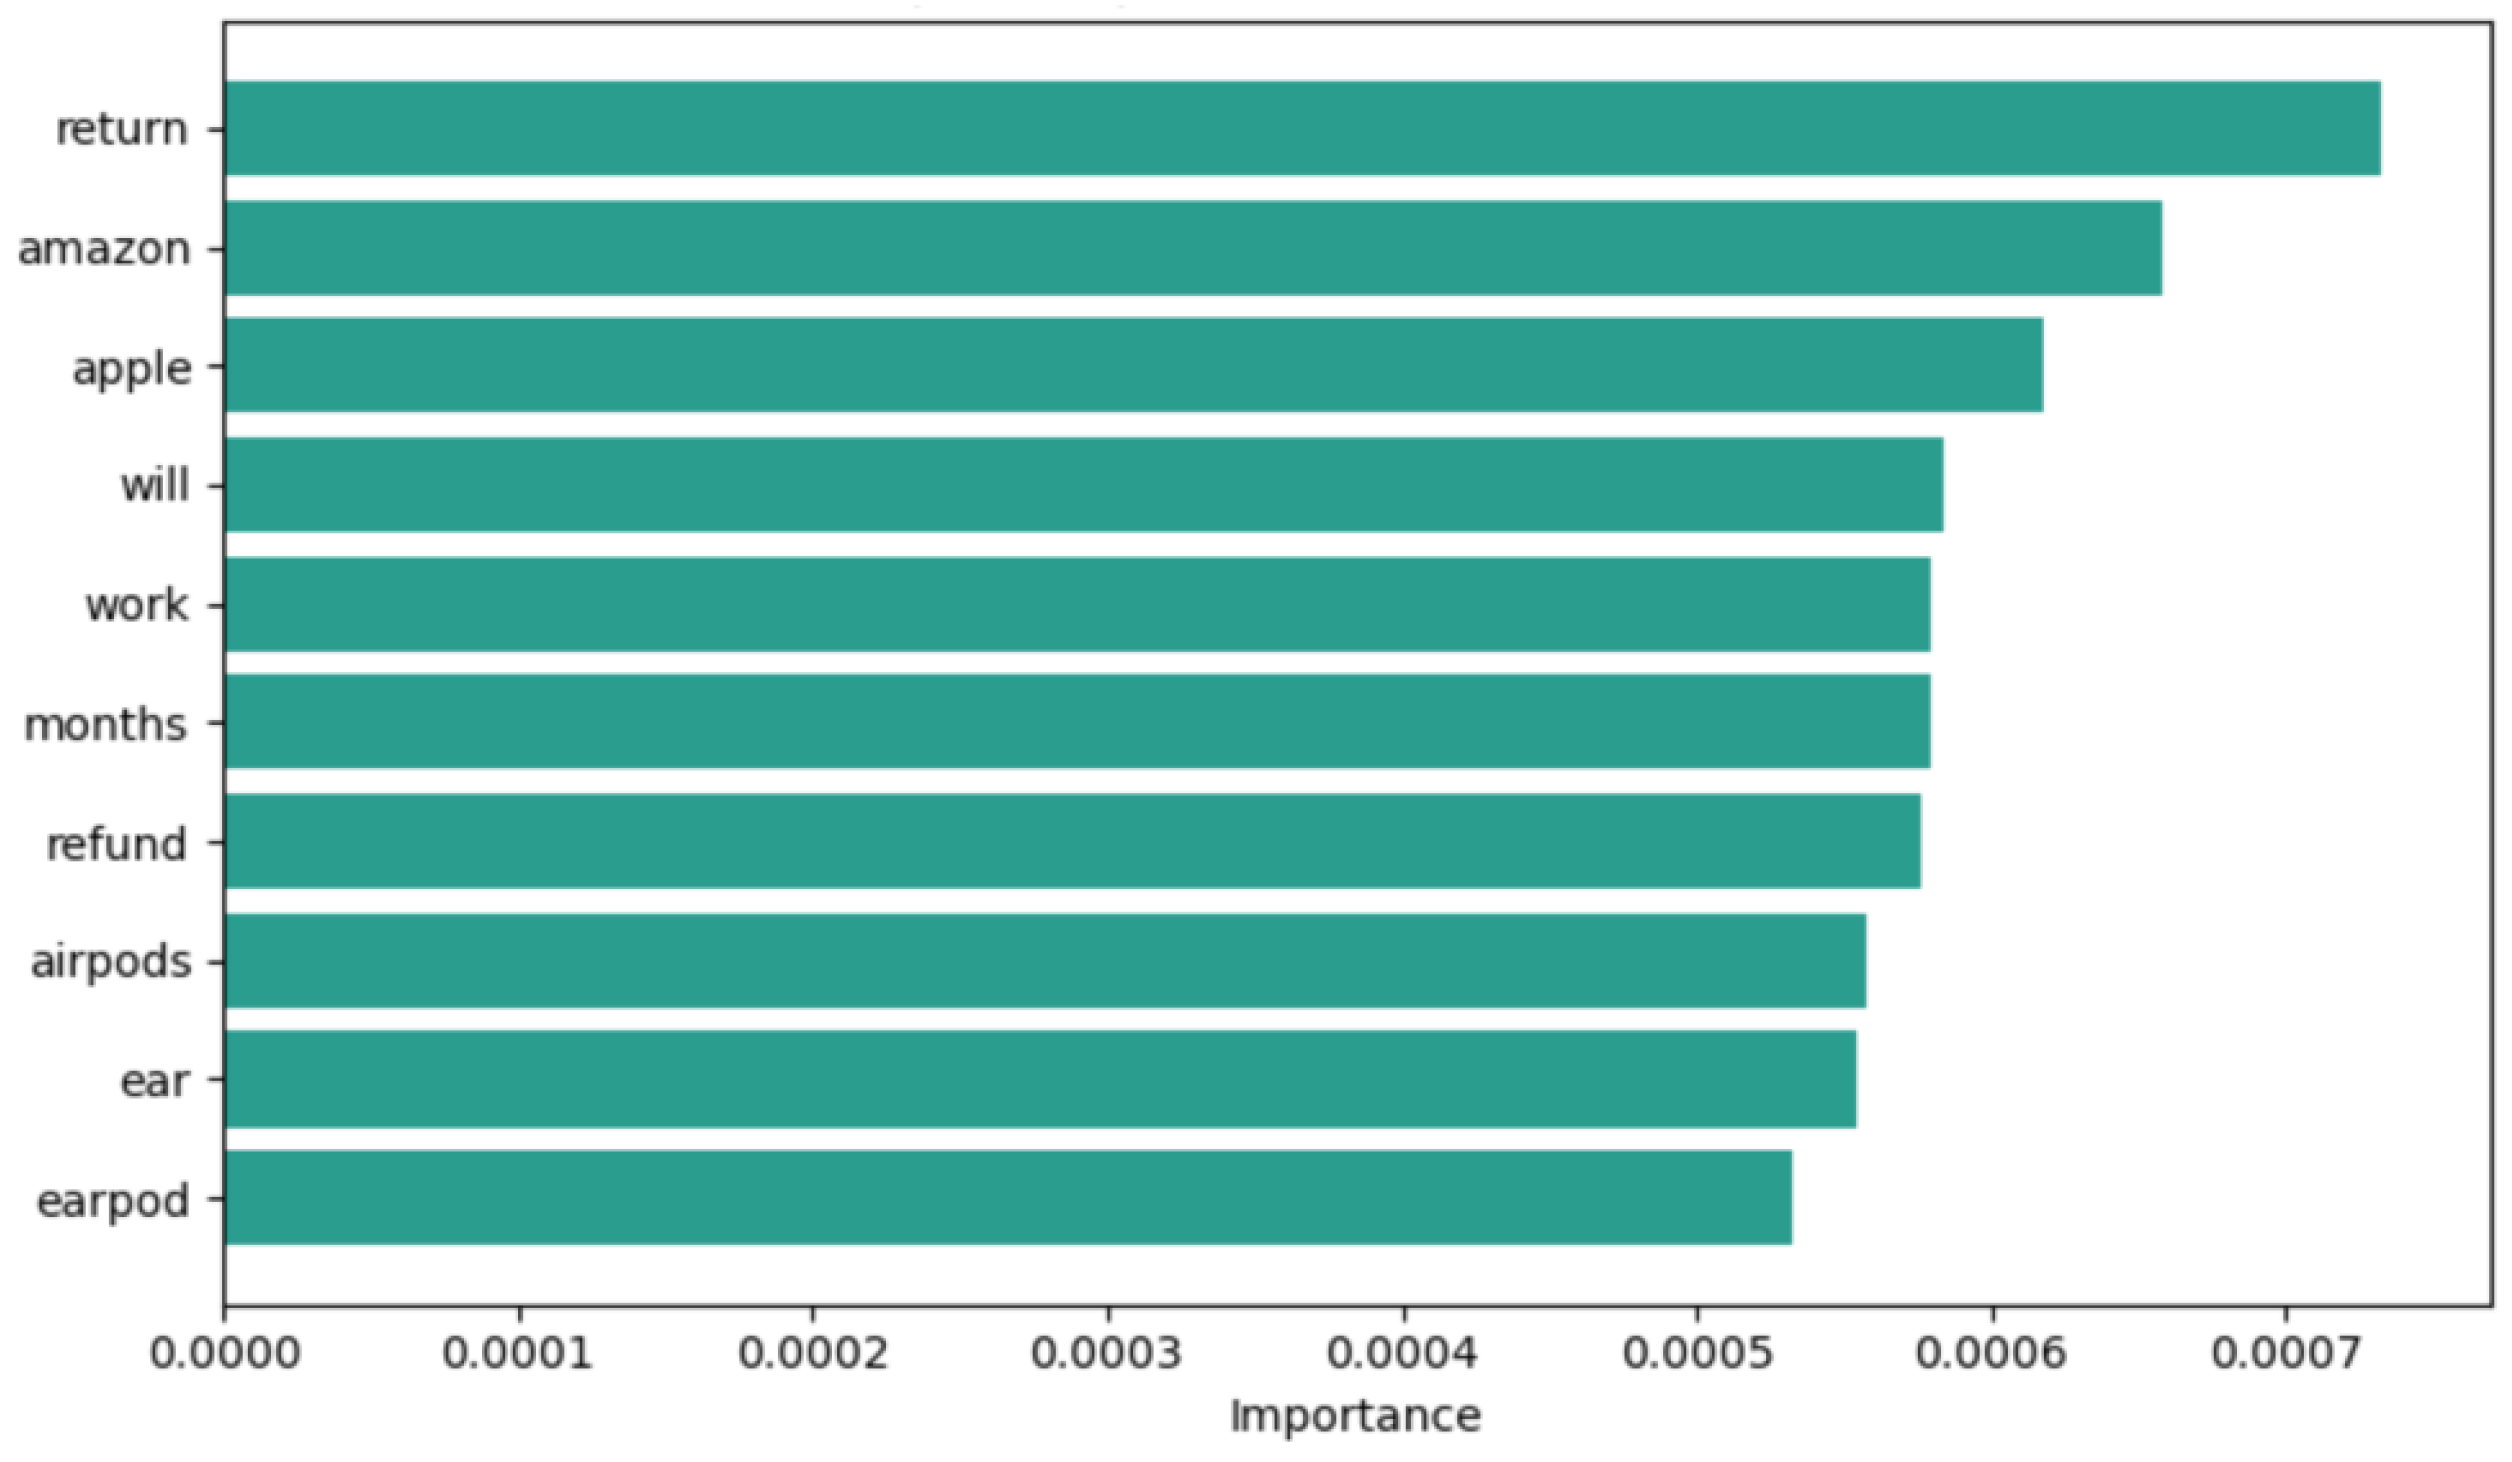
In
Figure 8, we examine the words that had the greatest influence on the polarity of negative reviews. In particular, the terms “return”, “refund”, and “amazon” suggest that most customers requested to return the product to the Amazon seller. Furthermore, the term “months” implies that this process is prolonged. The terms “airpods”, “ear”, and “earpod” are related to the issue that the product easily falls out of the ears.
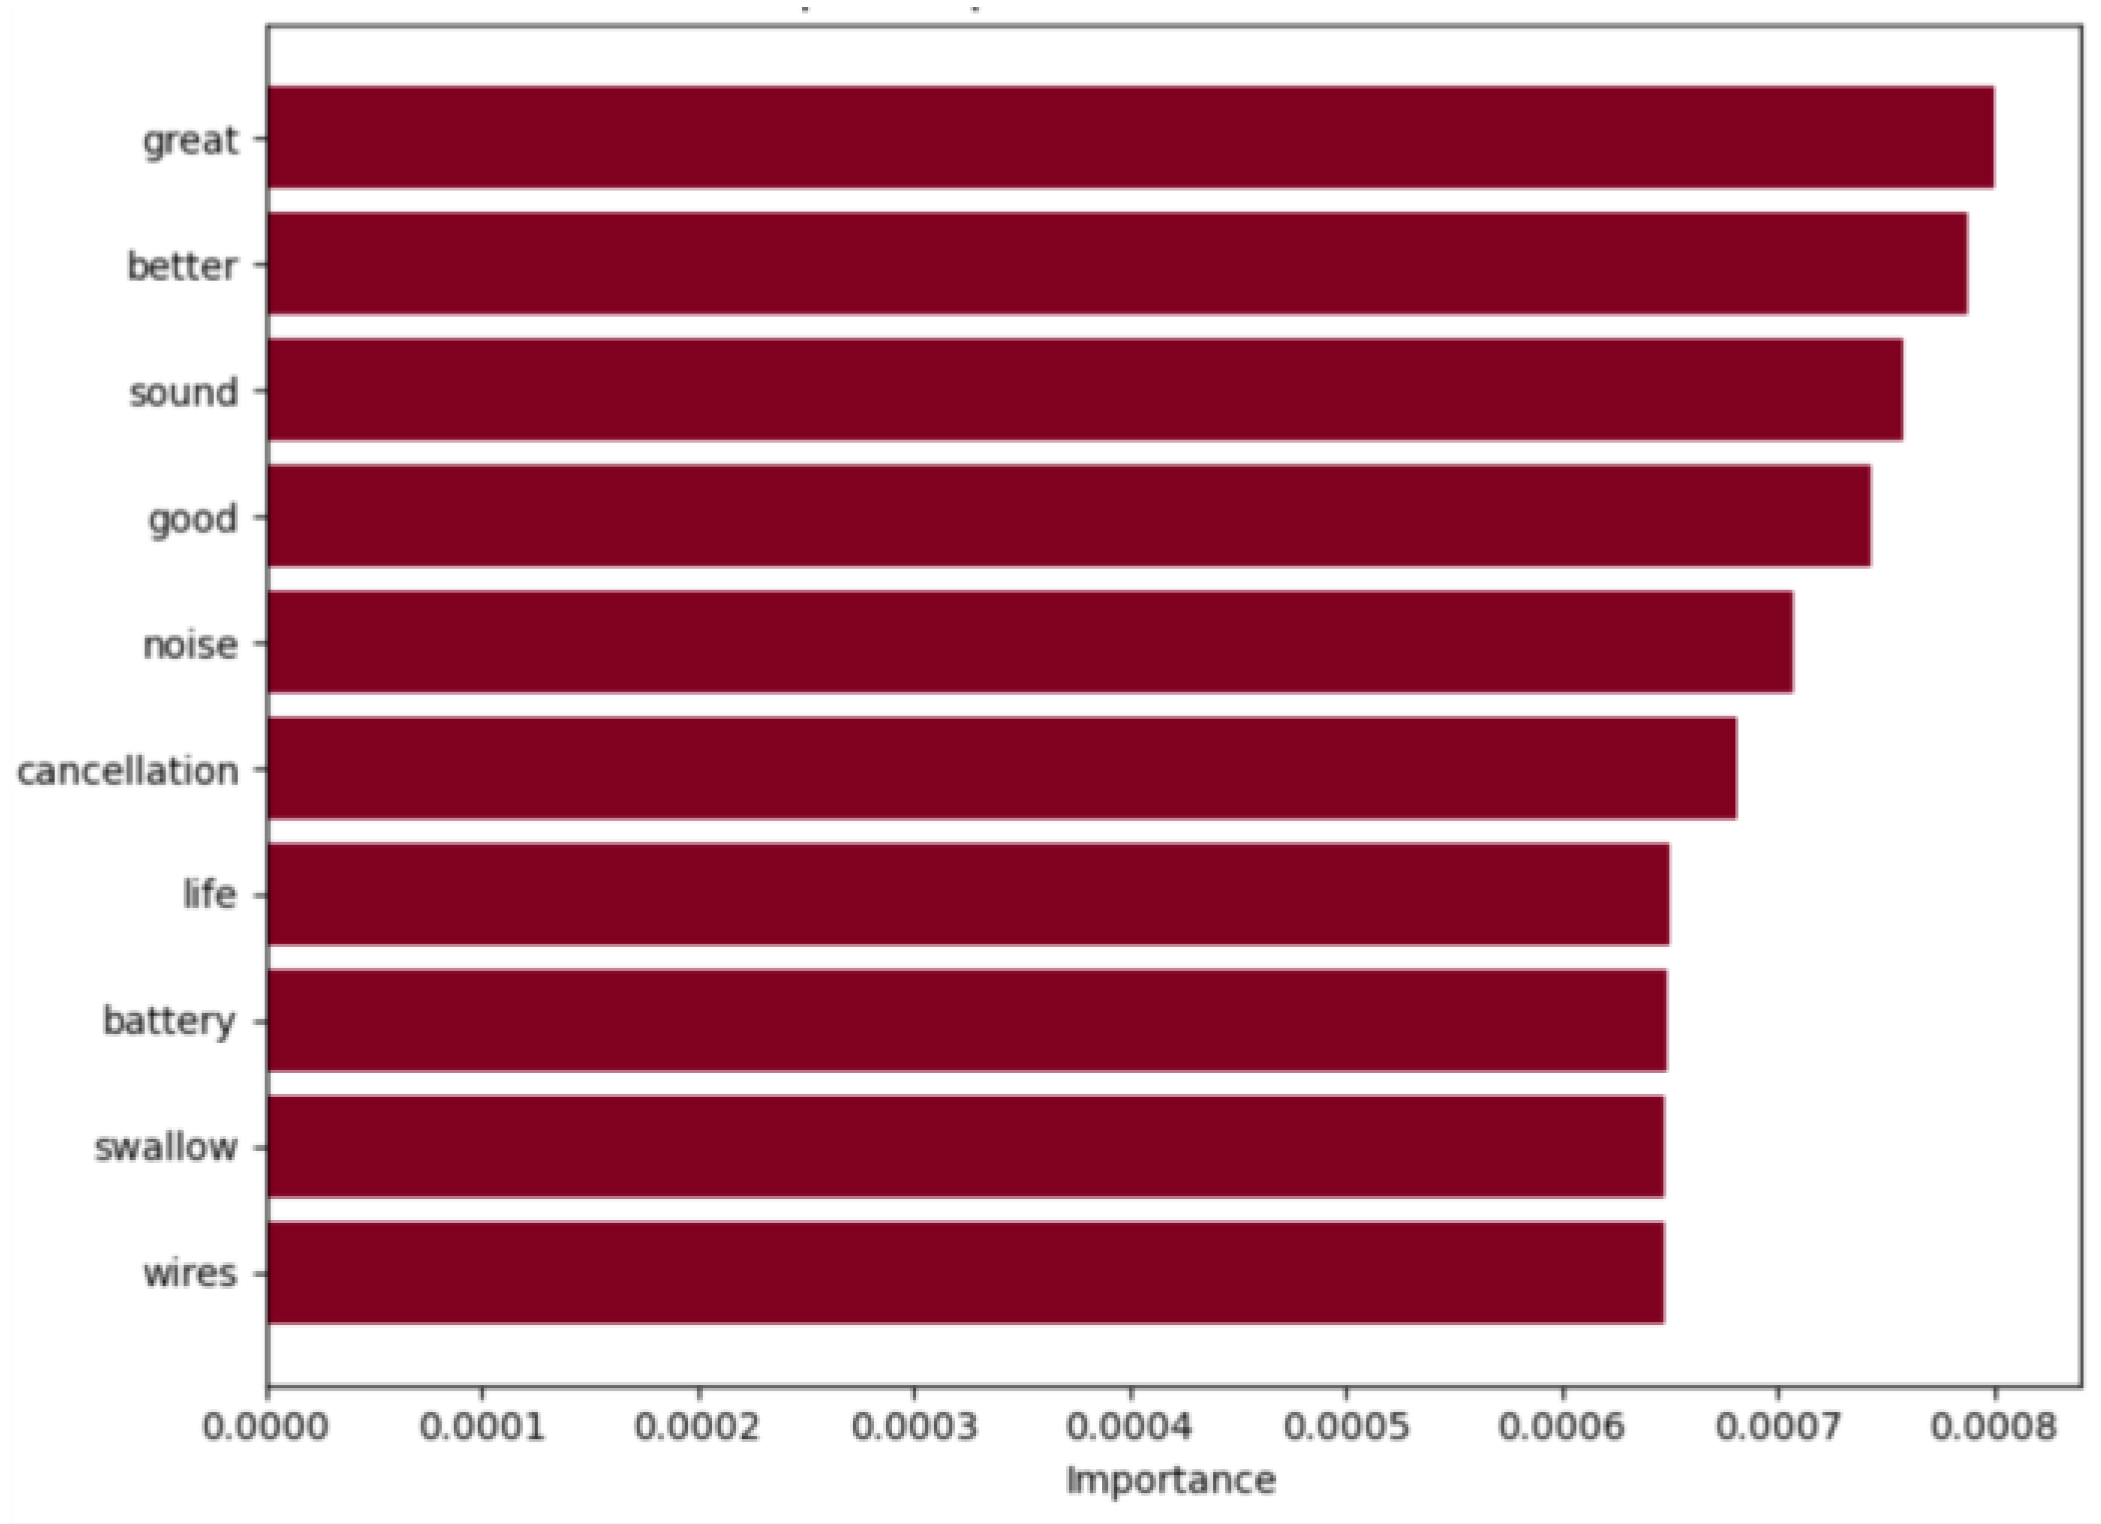
Among the terms with the most positive influence, in
Figure 9, “great”, “better”, “sound”, and “good” are noted, highlighting the quality of audio provided by these AirPods. Additionally, “noise” and “cancellation” positive reviews emphasized the high-quality noise cancellation.
The terms “life” and “battery” are significant aspects that meet customer needs. Users with positive experiences highlighted its reliability and longevity. The mention of “wires” further indicates customer satisfaction with the wireless design. Terms related to noise cancellation also play an important role that we will further explore to better understand the associated sentiment.
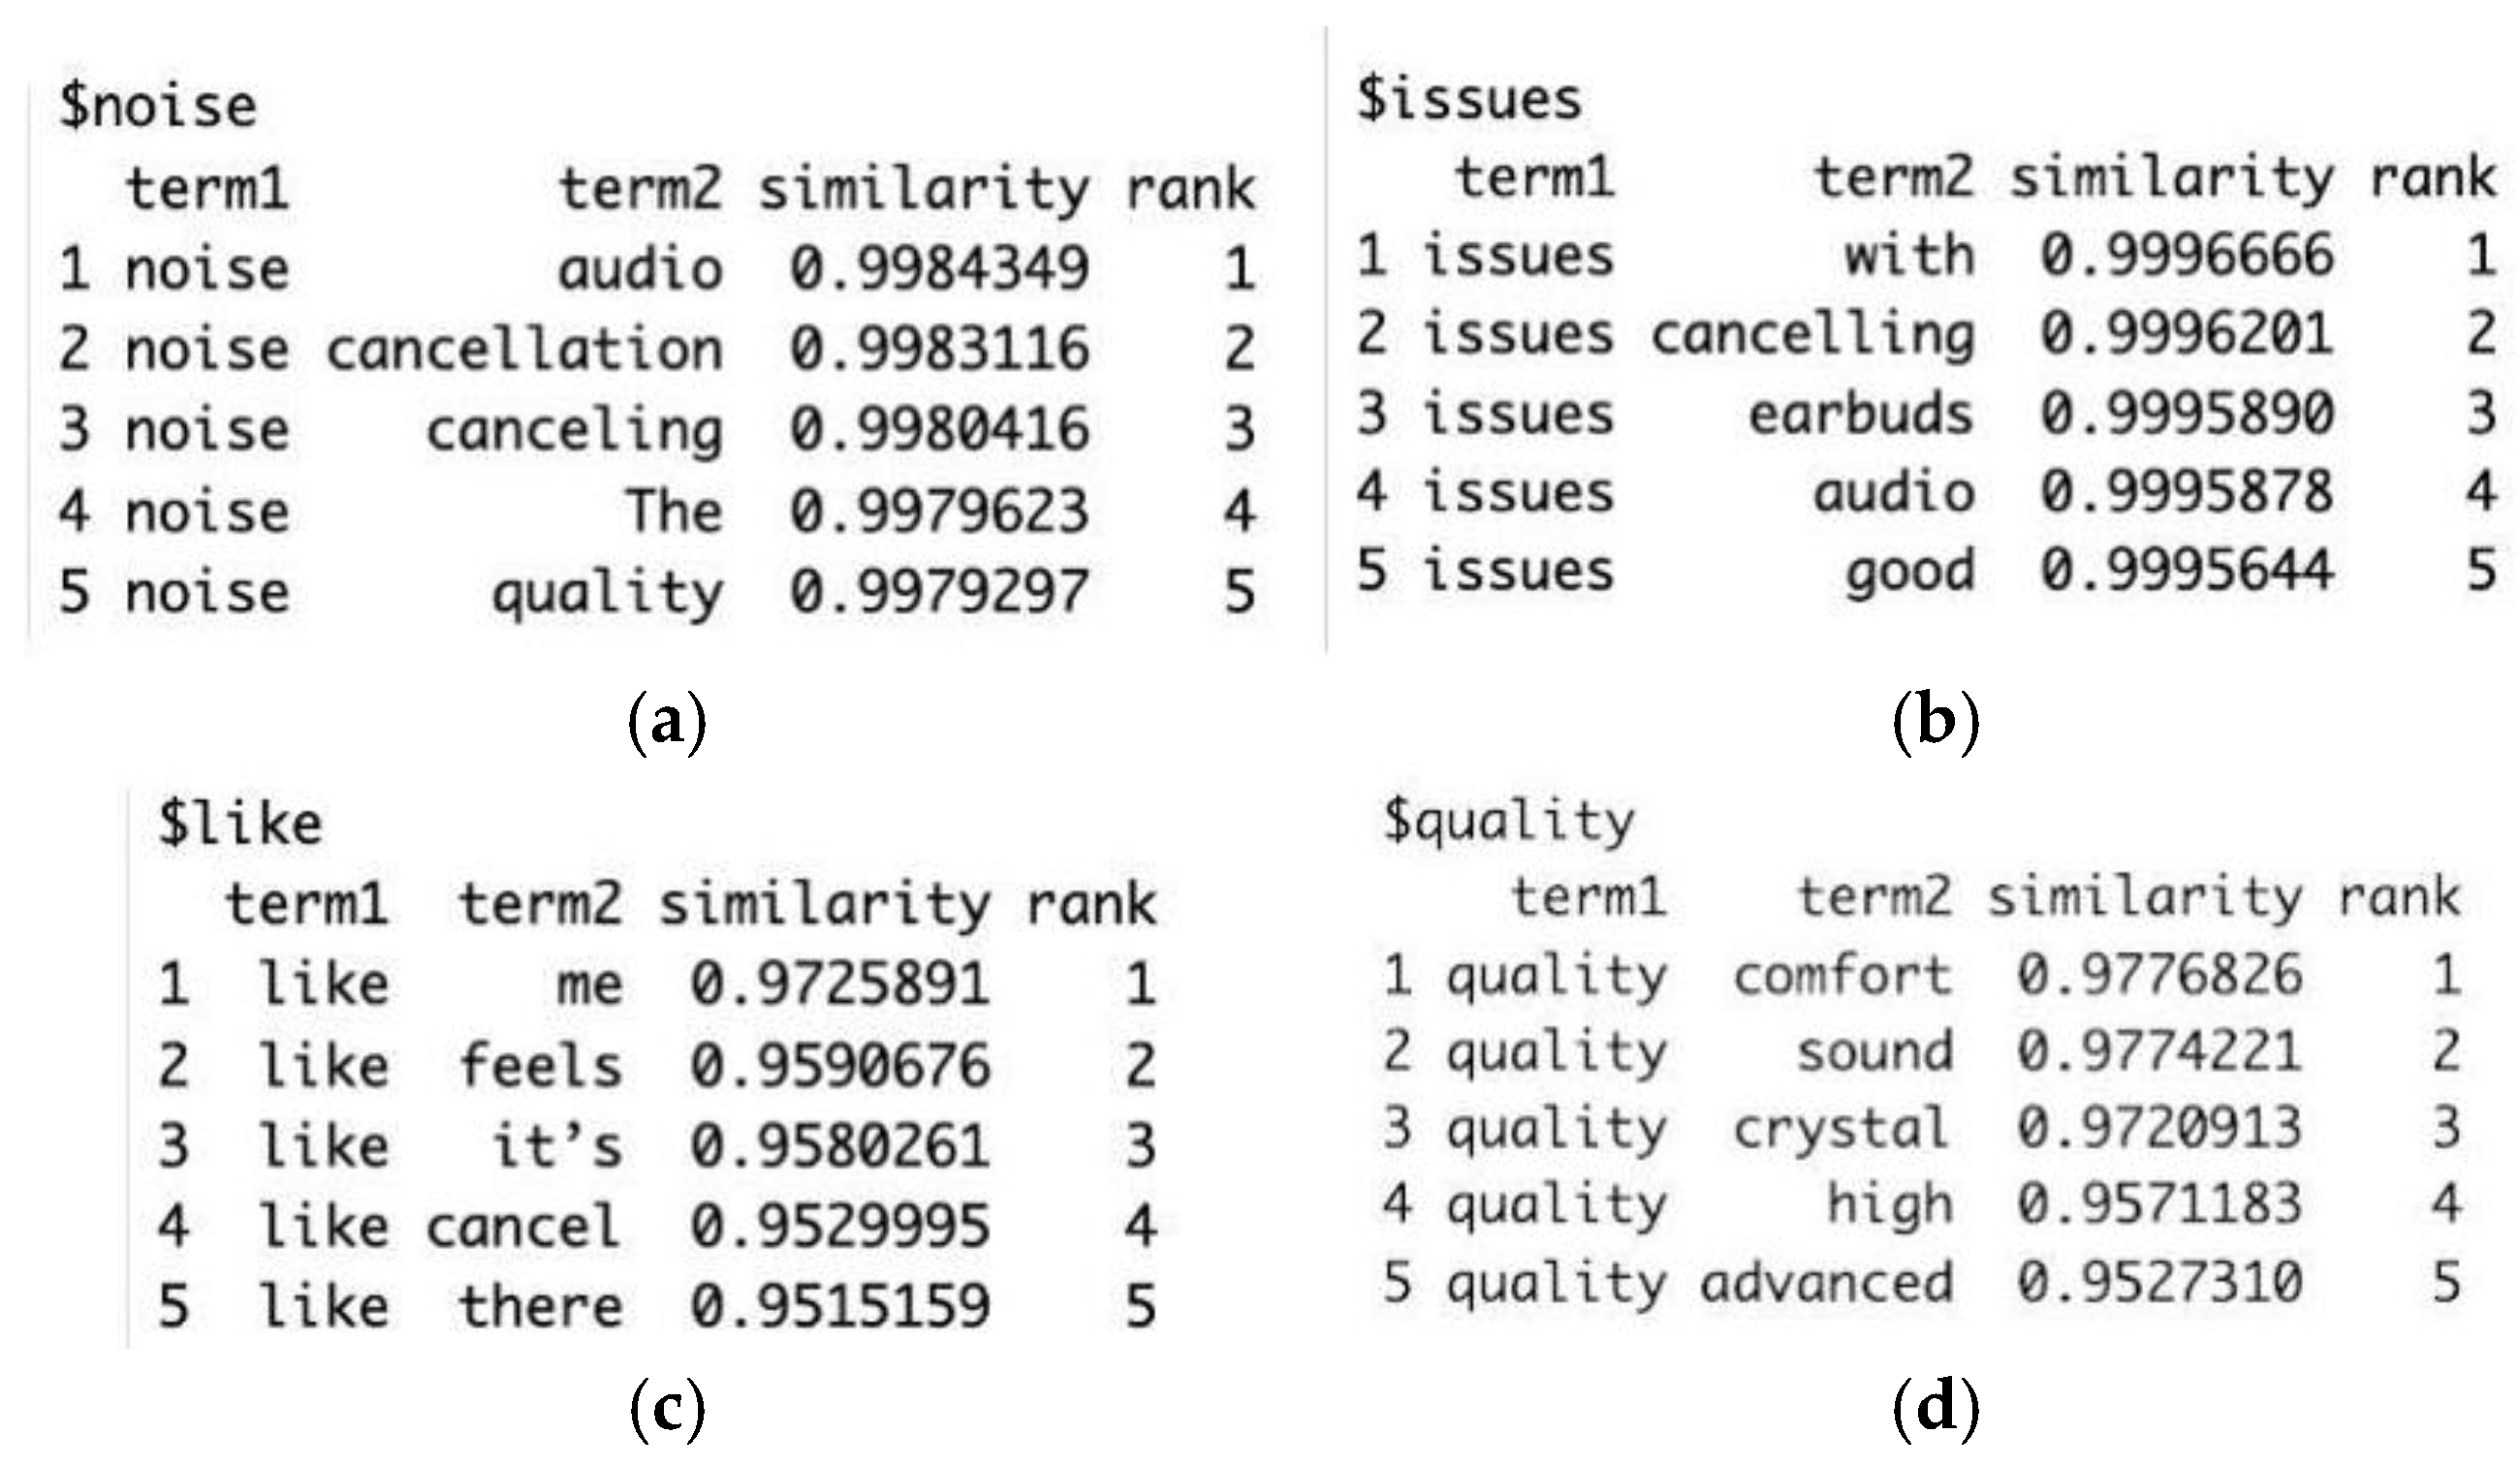
In
Figure 10, utilizing word embedding packages in R, we illustrate the words most frequently associated with the term “noise”, as extracted from the negative aspects identified in
Figure 6. It is evident that “noise” is predominantly linked to concepts such as audio and cancellation.
In
Figure 10b, we further confirm that the term “issue” is primarily associated with noise-canceling features of the earbuds.
Interestingly, what users most frequently “like” about the product relates to its feel and, potentially, its overall utility.
The perceived quality of these earbuds is strongly tied to attributes such as “comfort”, “sound”, “crystal”, “high”, and “advanced”, emphasizing the key aspects valued by consumers.
5. Discussion
The study analyzed the sentiment of Apple AirPods (2nd Generation) reviews on Amazon using machine learning and text mining techniques.
Amazon probably uses advanced NLP models such as BERT or GPT to analyze the sentiment of reviews, leveraging highly sophisticated DL models [
55,
56]. However, while Amazon uses such models to analyze millions of reviews on different products, this study focuses on a detailed analysis of specific AirPods characteristics (e.g., sound quality, noise cancellation, battery, and comfort).
This targeted approach helps identify and quantify specific issues that influence consumer perception.
The study demonstrates that it is possible to extract strategic information for product improvement through sentiment analysis on text reviews without having to access Amazon’s internal data.
It should be noted that Amazon does not disclose the functioning of its proprietary algorithms, while this study provides a transparent and reproducible workflow, allowing other researchers and companies to replicate the analysis with different data.
The ML proposed in this work is the naïve Bayes classifier as the most interpretable, efficient, and suitable solution for small datasets.
The performance of the naïve Bayes classifier model can be considered satisfactory:
The model achieves an average accuracy of 75% in classifying positive and negative reviews.
The AUC-ROC is 83%, which indicates a good ability to distinguish between positive and negative sentiment.
The average values of the model evaluation metrics are:
Sensitivity: 74%
Specificity: 76%
F1-score: 74%
An additional insight from this study was identified as the principal key sentiment drivers in negative or positive consumer reviews:
Noise cancellation: Negative reviews often mentioned issues with background noise not being effectively blocked, while positive reviews emphasized the high-quality noise cancellation. This divergence in opinion suggests that while the technology performs well for many users, there are still areas where improvements could be made, particularly in environments with high ambient noise levels.
Battery life: This was another major theme in customer feedback. Users with positive experiences highlighted its reliability and longevity, whereas negative reviews expressed concerns over battery degradation over time. This aligns with existing literature on consumer expectations in wireless audio devices, where battery performance plays a crucial role in overall satisfaction [
57].
Integration within the Apple ecosystem: This was identified as a key driver of positive sentiment. Many users praised the seamless connectivity between AirPods and other Apple devices, particularly the automatic switching feature. However, some critical reviews pointed out connectivity issues, such as occasional disconnections or difficulties pairing with non-Apple devices. These findings suggest that while Apple’s ecosystem integration is a strong selling point, expanding compatibility could enhance user satisfaction.
Amazon shopping experience: Some negative reviews are not about the product itself, but about problems with returns and refunds on Amazon.
Reviews are associated with specific emotions:
Positive reviews highlight emotions such as trust and satisfaction with keywords such as “quality”, “battery”, and “sound” (
Figure 8).
Negative reviews show emotions such as frustration, disappointment, and dissatisfaction, with keywords related to “refund”, “return”, and “issue” (
Figure 9).
An interesting fact is that despite the negative reviews, many users still express trust in the Apple brand and price is not a dominant concern. While some users acknowledged that AirPods are expensive, they justified the cost by highlighting the quality and brand reliability. This indicates that consumers perceive the product as a premium offering and are willing to pay for a high-end user experience.
Our results highlight areas of improvement for Apple such as:
Optimizing noise cancellation to make it more effective in noisy environments.
Improving the stability of AirPods in the ear to prevent them from falling out easily.
Strengthening the management of returns and refunds on Amazon to reduce negative reviews not related to product quality.
6. Conclusions
The findings of this study offer insights into how consumers perceive the quality of Apple AirPods based on sentiment analysis of Amazon reviews.
Unlike complex ML or DL models (such as BERT or GPT), which require high computational capabilities, the work proposes a naïve Bayes classifier as a more interpretable, efficient, and suitable solution for small datasets. This choice demonstrates that even less complex algorithms can achieve satisfactory results (AUC-ROC 83%) with much lower computational costs.
It provided important details about the specific electronics characteristics identified by customers for this product.
By examining how customers categorized their reviews into positive and negative sentiments, we identified key drivers influencing their choices, including factors such as noise cancellation, battery life, integration with other products, and comfort. Interestingly, negative reviews did not highlight price as a major concern but rather emphasized the need for improvement in noise-canceling performance.
This research provides a valuable framework for companies seeking to assess product quality. Using customer textual data is a helpful approach to identify technical aspects requiring improvement. Our study underscores the importance of employing data-driven approaches to extract insights from customer feedback, helping businesses navigate the online marketplace and expand their customer base effectively.
The study has some limitations that should be acknowledged. Firstly, the dataset was limited to Amazon reviews, which may not fully capture the diversity of consumer opinions across other platforms such as social media or tech forums. Additionally, aspect-based sentiment analysis could be applied to further dissect specific product features in greater detail.
Future research could focus on comparing AirPods with competing wireless earbuds to gain a broader perspective on consumer preferences in the wireless audio market.
Another possible avenue for research could be analyzing sentiment trends over time to understand how consumer perceptions evolve with software updates or new product releases.
Overall, this study underscores the importance of leveraging sentiment analysis in product evaluation. Companies can use this approach to identify recurring issues, enhance product development, and refine marketing strategies based on real customer feedback.


