1. Introduction
This section introduces the significance of real-time physiological monitoring in high-G environments for flight personnel, highlighting the limitations of existing methods, such as centrifuge-based testing and LBNP simulations. Despite advances in individual monitoring technologies, a significant gap remains in integrated, portable solutions that provide continuous, real-time analysis of physiological parameters in extreme conditions. This study addresses this gap by proposing a multi-sensor system that integrates various monitoring modules into a cohesive, portable platform.
Real-time physiological monitoring of flight personnel in high-G environments is essential for assessing fitness for duty and ensuring operational safety. Pilots performing complex maneuvers undergo simulations that replicate g-force conditions to evaluate their ability to withstand physical stress during flight [
1]. However, current assessment methods, including centrifuge-based testing and Lower Body Negative Pressure (LBNP) simulations, are costly, physically demanding, and lack portability [
2,
3]. Additionally, existing wearable physiological monitoring devices function as standalone modules rather than as integrated systems, limiting their ability to provide a comprehensive real-time analysis of cardiovascular and neuromuscular functions under extreme conditions.
The gap in current technologies lies in the lack of a portable integrated system capable of providing continuous, real-time data across multiple physiological parameters. This study addresses these limitations by developing an integrated, portable system for continuous physiological monitoring during high-G exposure. The system combines multiple measurement modules—including Doppler ultrasound for carotid artery blood flow, ECG for cardiac function, impedance cardiography (ICG) for stroke volume and cardiac output, EMG for muscle activity, and continuous non-invasive blood pressure monitoring—within an aircraft simulator equipped with LBNP technology. This approach enables a more accurate assessment of pilot susceptibility to g-forces while overcoming the limitations of existing standalone monitoring solutions. Key physiological systems affected during flight include the cardiovascular, respiratory, and musculoskeletal systems [
4]. The cardiovascular system experiences significant changes, such as reduced blood oxygen saturation, elevated heart rate, and fluid retention, while variations in cabin pressure impact respiratory function. Prolonged sitting may also increase the risk of deep vein thrombosis [
5]. Psychological factors like stress and fatigue further contribute to in-flight risks, with loss of consciousness being one of the most severe threats. Continuous cardiovascular monitoring is therefore recommended for long-term health assessment and early detection of dysfunction [
6,
7]. Various devices exist for measuring carotid artery blood flow, utilizing methods such as carotid Doppler ultrasonography, laser Doppler, and duplex Doppler [
8,
9,
10,
11,
12]. However, no portable solution has been developed for precise measurements in extreme environments. After evaluating the available techniques, Doppler ultrasonography was selected as the most suitable method due to its high precision and resistance to motion disturbances. This technique enables the analysis of dynamic changes in blood velocity and provides essential information on flow characteristics and vessel conditions. Our proposed system represents an advancement over current solutions by integrating multiple physiological monitoring capabilities into a single, compact, and user-friendly platform. It includes a mobile blood flow monitor, brain oxygenation and perfusion recorder, and medical monitoring terminal, all designed to meet regulatory requirements under Regulation (EU) 2017/745. Additionally, the system’s EMG module enhances diagnostic capabilities by assessing muscle activity during anti-G straining maneuvers (AGSM), thereby improving both safety and cost efficiency in extreme environments. This study aims to fill the gap in existing technology by developing a multi-sensor physiological monitoring system tailored for high-G environments, integrating Doppler ultrasound, ECG, ICG, EMG, and continuous blood pressure monitoring. The specific objectives are to validate the system’s ability to provide stable, real-time physiological measurements in high-motion conditions using LBNP simulations and flight-mimicking scenarios, and to compare the system’s effectiveness against centrifuge-based assessments to determine its reliability and diagnostic accuracy. The developed system is currently in the testing phase, with validation studies planned to assess its effectiveness compared to existing solutions. Individual technologies, such as the mobile EMG recorder and LBNP system, have been documented in the literature [
13,
14,
15,
16,
17,
18,
19,
20]. Future research will focus on integrating the system into operational training environments, optimizing its diagnostic modules, and refining its usability in aviation and other extreme activities.
2. Materials and Methods
This section outlines the methodology for developing the proposed system for real-time physiological monitoring. It presents an overview of the system architecture, design, and independent measurement modules used to monitor various physiological parameters.
The discussed solutions are the result of a project implemented by a scientific and industrial consortium, as defined in Article 2, Paragraph 12 of the Act of 30 April 2010, on the Principles of Financing Science (Journal of Laws 10.96.615). The consortium comprises the following entities: the Military Institute of Aviation Medicine in Warsaw (WIML) as the leader, the Łukasiewicz Research Network—Krakow Institute of Technology, the Institute of Biocybernetics and Biomedical Engineering of the Polish Academy of Sciences in Warsaw (IBIB PAN), the Polish Air Force Academy in Dęblin (LAW), and ETC-PZL Aerospace Industries Sp. z o.o. in Warsaw (ETC-PZL). The solutions discussed in this paper are the result of work conducted by the Łukasiewicz Research Network—Krakow Institute of Technology.
2.1. System Architecture
This section presents an overview of the design and structure of the physiological measurement system. This explains how the system ensures flexibility and reliability through the use of independent modules, wireless communication, and an integrated synchronization mechanism for accurate data collection.
All physiological measurement modules are designed as independent devices to ensure flexibility and efficiency. Each module is placed directly on the subject’s body and operates on its own battery power supply. Data transmission is enabled through Bluetooth 5.0 Low Energy technology, allowing the wireless transfer of recorded biological signals to the information system (computer software). To enhance reliability, each module is equipped with an integrated flash memory card. This feature ensures data recovery in the case of unstable wireless communication and allows physiological signals to be recorded directly in the target environment, such as onboard an aircraft, without requiring continuous radio communication with the system [
2].
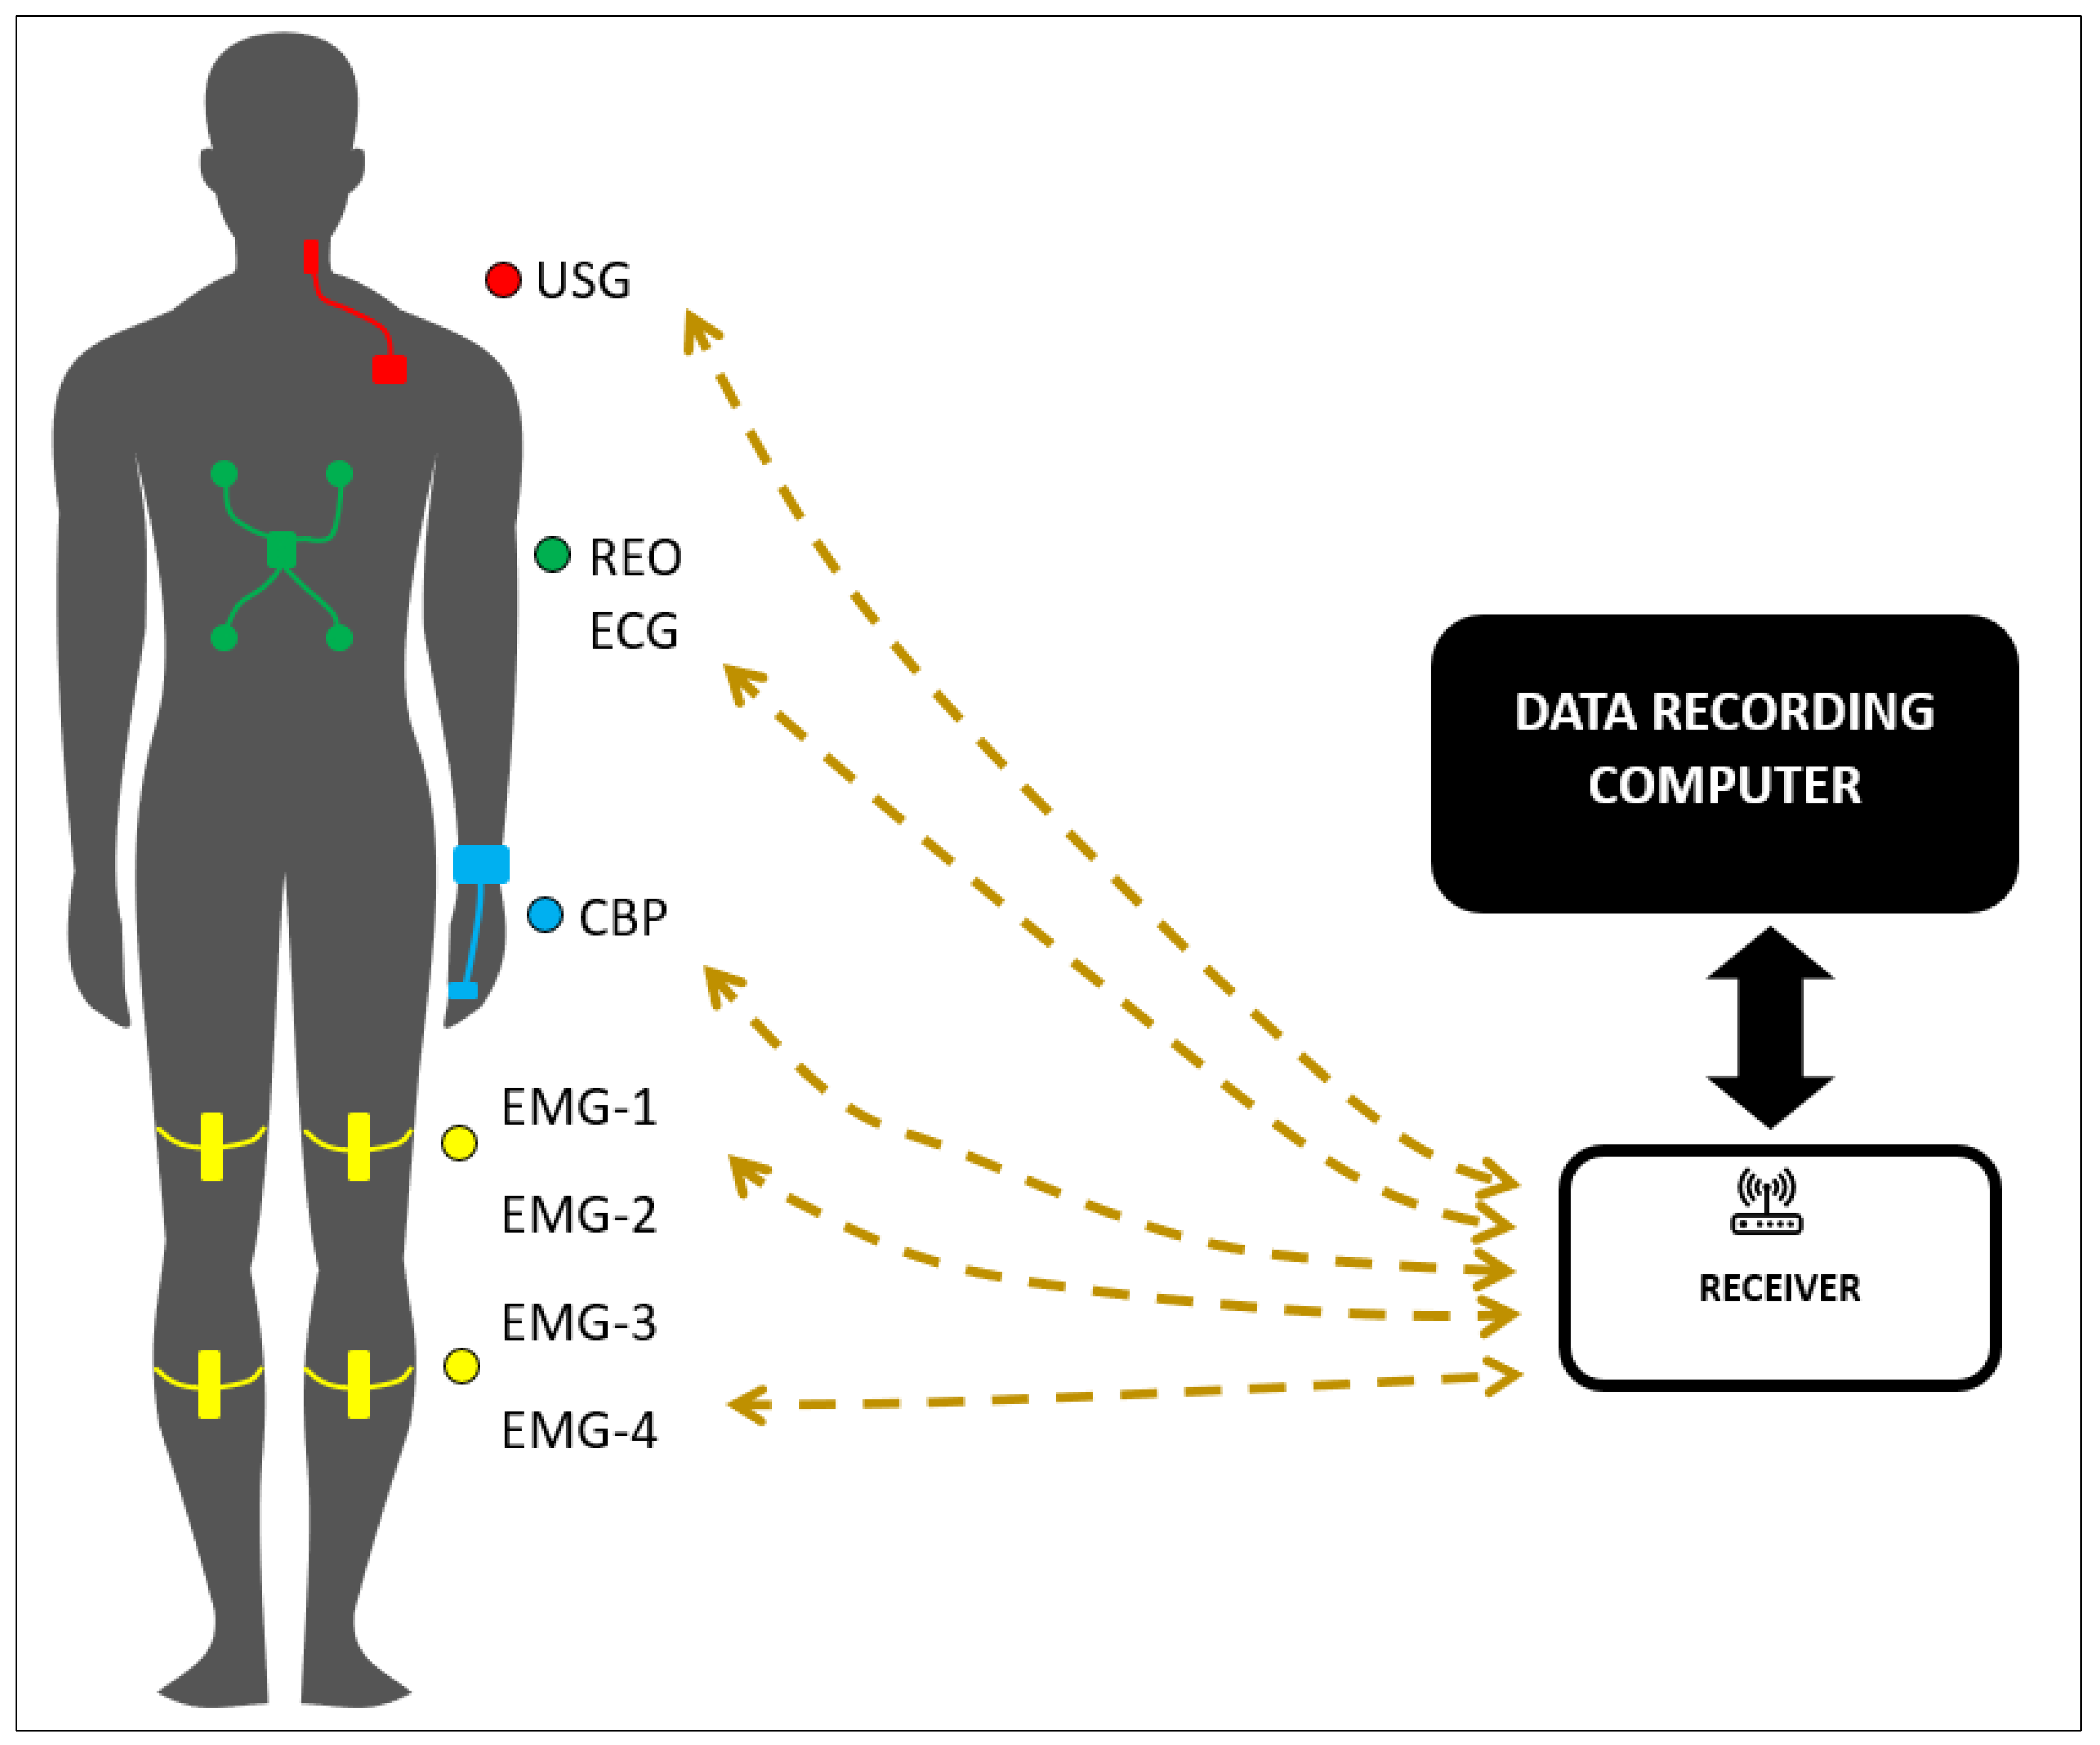
To address the challenge of synchronizing signals from different measurement sources, a dedicated synchronization mechanism has been developed. This feature is particularly important when combining signals from multiple modules, as variations in sampling frequency may occur due to differences in the clock circuits driving the analog-to-digital converters (ADCs). The system consists of independent modules, each equipped with its own power supply, sensors, and wireless communication capabilities. These modules measure the following physiological parameters (
Figure 1):
Carotid artery blood flow (Doppler ultrasound)
Electrocardiography (ECG)
Impedance cardiography (ICG, also referred to as REO)
Electromyography (EMG)
Blood pressure measured using the Continuous Non-invasive Arterial Pressure (CNAP) method.
For electromyographic (EMG) signal recording, measurements will be taken from two muscles in each leg (thigh and calf). Since each EMG module has a single differential input channel, four EMG modules will be used to capture signals from all four muscles. The placement of EMG electrodes on the lower limbs is carefully planned to assess muscle activation and coordination during specific tasks, such as anti-G straining maneuvers. This approach is used both in pilot candidate assessments and in analyzing muscle responses under dynamic physical conditions. An analysis of the design solutions for each measurement module revealed that they all consist of several identical functional blocks, including an analog-to-digital converter (ADC), a microcontroller with wireless transmission, flash memory, environmental sensors (atmospheric pressure sensor and accelerometer), a power supply, and an internal battery charging circuit. Consequently, a decision was made to design these functional blocks as a single standardized PCB, referred to as CORE-BLOCK, which can be used across all biomedical signal measurement modules.
As shown in
Figure 2, each measurement module incorporates an individual input block designed to process the physiological signal into a voltage output compatible with the ADC on the CORE-BLOCK. These input blocks, tailored to specific physiological signals, are implemented as dedicated PCBs and named according to the signal type (e.g., EMG-BLOCK, NIBP-BLOCK, ICG_EKG-BLOCK, and US_Doppler-BLOCK).
The EMG-BLOCK module records the muscle activity from two muscle groups in each leg.
The NIBP-BLOCK is used for continuous peripheral blood pressure waveform recording and analysis.
The ICG_EKG-BLOCK enables both ECG and ICG signal recording with defibrillation protection.
The US_Doppler-BLOCK captures blood flow in the carotid artery using Doppler ultrasound. The ultrasound probe is mounted on the patient’s neck and connected to the patient module for preliminary data processing and transmission.
For the ECG and ICG signal registration modules, the application parts must be resistant to defibrillator pulses and comply with requirements regarding their impact on defibrillation effectiveness. This applies to the application parts with patient connections directly exposed to the electric field generated by the defibrillation pulse. Additionally, defibrillator discharge must not cause unintended effects in other application parts in accordance with general standards, multifunctional monitoring device regulations, and specific requirements for relevant application parts. To satisfy the required protection level (BF) and ensure resistance to defibrillator pulses, each application part in electrical contact with the subject must be galvanically isolated. This separation is achieved using independent patient modules powered by built-in batteries and transmitting data wirelessly. The measurement modules are designed to operate under environmental conditions with temperatures ranging from 5 °C to 40 °C, humidity levels between 35% and 75%, and atmospheric pressure from 700 to 1060 hPa. Each module is equipped with a built-in, non-removable lithium-ion battery and is wirelessly charged using a commercial inductive charger. The expected battery life is approximately 20 h.
Calibration in extreme environments is critical for ensuring the accuracy and reliability of the measurement modules. A multi-stage calibration procedure tailored to extreme conditions will be implemented, including the following:
Laboratory calibration will be performed under controlled conditions using standard reference equipment to establish the baseline performance metrics. Each module was tested to ensure that it adheres to the specified accuracy standards. This includes verifying the signal amplitude, waveform shape, and measurement consistency under stable environmental conditions.
Field calibration will be used to assess the system performance in real-life conditions, accounting for temperature, humidity, and motion artifacts. This involves a series of tests that measure the module accuracy during G-force exposure, onboard aircraft simulations, or centrifuge environments.
Periodic recalibration will be performed once per year to address the measurement drift over time. A scheduled recalibration will be performed once per year to ensure that any drift in the measurements is corrected, and the system remains reliable over time. This process includes both laboratory and field procedures, as outlined above.
Self-diagnostic capabilities allow the system to monitor the sensor performance and detect anomalies, thereby triggering alerts when recalibration is required. Real-time diagnostics will monitor key parameters, such as signal noise levels and sensor drift, ensuring that the system remains operational during use.
Specific calibration techniques will be applied to the individual modules:
ECG module: calibrated using FLUKE Patient Simulators. This involves connecting the ECG module to the simulator, generating predefined signals, and verifying whether the ECG readings match the expected values.
REO impedance and EMG modules calibrated using a dedicated setup developed at Łukasiewicz-KIT. This includes ensuring the correct impedance measurement range for REO and the fidelity of muscle activity signals for EMG. A test subject will be used to simulate real muscle movements during calibration.
Blood flow measurement module: calibrated using a specialized flow path calibration system. This setup will simulate blood flow under different pressure conditions, ensuring that the Doppler ultrasound module accurately measures flow velocities.
If there are doubts regarding the accuracy of the measurement channels, a calibration check should be performed or requested from technical support. It is recommended to verify the ECG, EMG, NIBP, and ultrasound channels before each testing cycle. The check should include the following:
Checking modules, detachable parts, accessories, and labeling for any visible damage or wear.
Cable insulation inspection, including patient cables.
Functional performance testing will be performed using test signals and waveform analysis on the display to simulate real physiological signals. This may include the use of external devices or subject signals for verification.
Signals from the person conducting the check can also be used for verification. If a malfunction is detected, the device is reported for inspection or repair by the authorized service personnel. The system does not contain any user-repairable components. To mitigate artifacts such as motion interference and electrical noise, the system integrates advanced signal processing techniques, including adaptive filtering and real-time data cleaning algorithms. Noise reduction mechanisms in the sensors and measurement modules further minimize the electrical interference, thereby ensuring accuracy and reliability.
In addition to calibration, a comprehensive testing and validation approach ensures a reliable system operation under diverse conditions. Simulated test environments will assess the following:
Environmental resilience: Performance under temperature variations (5 °C to 40 °C), humidity fluctuations (35% to 75%), and motion artifacts (e.g., walking, running, abrupt shifts).
Measurement precision: Validation of ECG, REO impedance, EMG, and blood flow data against reference devices.
Battery endurance: Evaluating reliability under continuous, intensive use.
System latency: Ensuring real-time response in data acquisition and processing.
Statistical validation will further ensure reliability, with descriptive analyses summarizing performance metrics through mean, standard deviation, and confidence intervals, while inferential statistics, such as t-tests or ANOVA, will compare performance under simulated conditions. Regression models will analyze relationships between performance metrics and external factors, such as temperature, humidity, or motion intensity. By integrating rigorous calibration protocols with a detailed testing and validation approach, the system is designed to deliver reliable and precise performance across a variety of challenging environments.
2.2. Data Redundancy and Onboard Storage
This section discusses the system approach for preventing data loss through local storage solutions. It explains the use of onboard memory in each module to ensure reliable data recording and retrieval, even in environments where wireless communication is unreliable.
To prevent data loss caused by unstable wireless communication, each module is equipped with a built-in flash memory card for local storage. This feature ensures that data can be recorded and retrieved later if needed. Additionally, onboard memory allows the system to function in environments where wireless communication is impractical, such as high-G centrifuges or aircraft in flight.
2.3. Synchronization Mechanism
This section details the system synchronization process to ensure accurate data integration from multiple physiological measurement modules. It highlights the role of a dedicated synchronization signal and the approach to aligning data with different sampling frequencies across modules.
The synchronization of signals from multiple modules is essential, particularly when integrating data from sensors with different sampling frequencies. The system employs a precise synchronization mechanism that aligns the signals to a unified time reference, thereby ensuring accurate data integration and comprehensive physiological analysis.
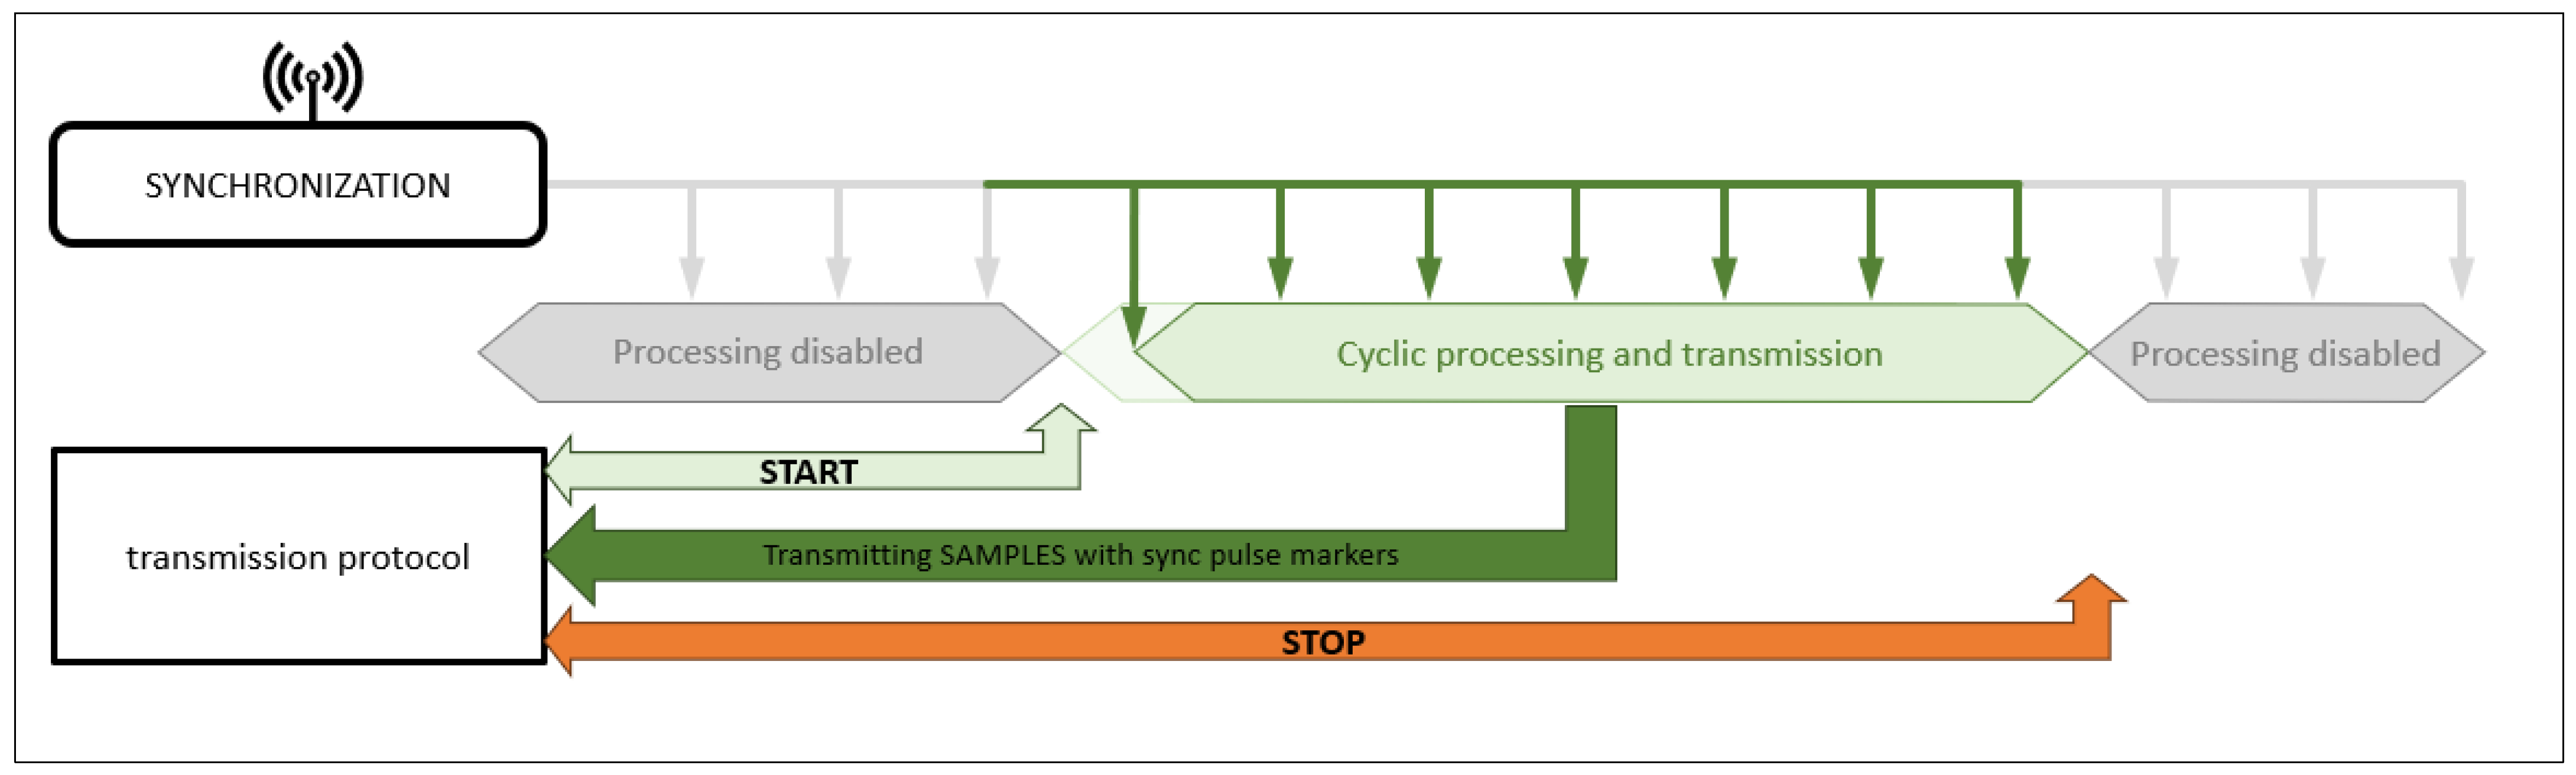
As shown in
Figure 3, synchronization begins with the START signal, which triggers simultaneous data acquisition across all modules. This step is crucial for maintaining the temporal alignment between the sensor outputs. A key aspect of this process is the use of uniform sampling frequencies for all recorded waveforms, ensuring data consistency and seamless integration.
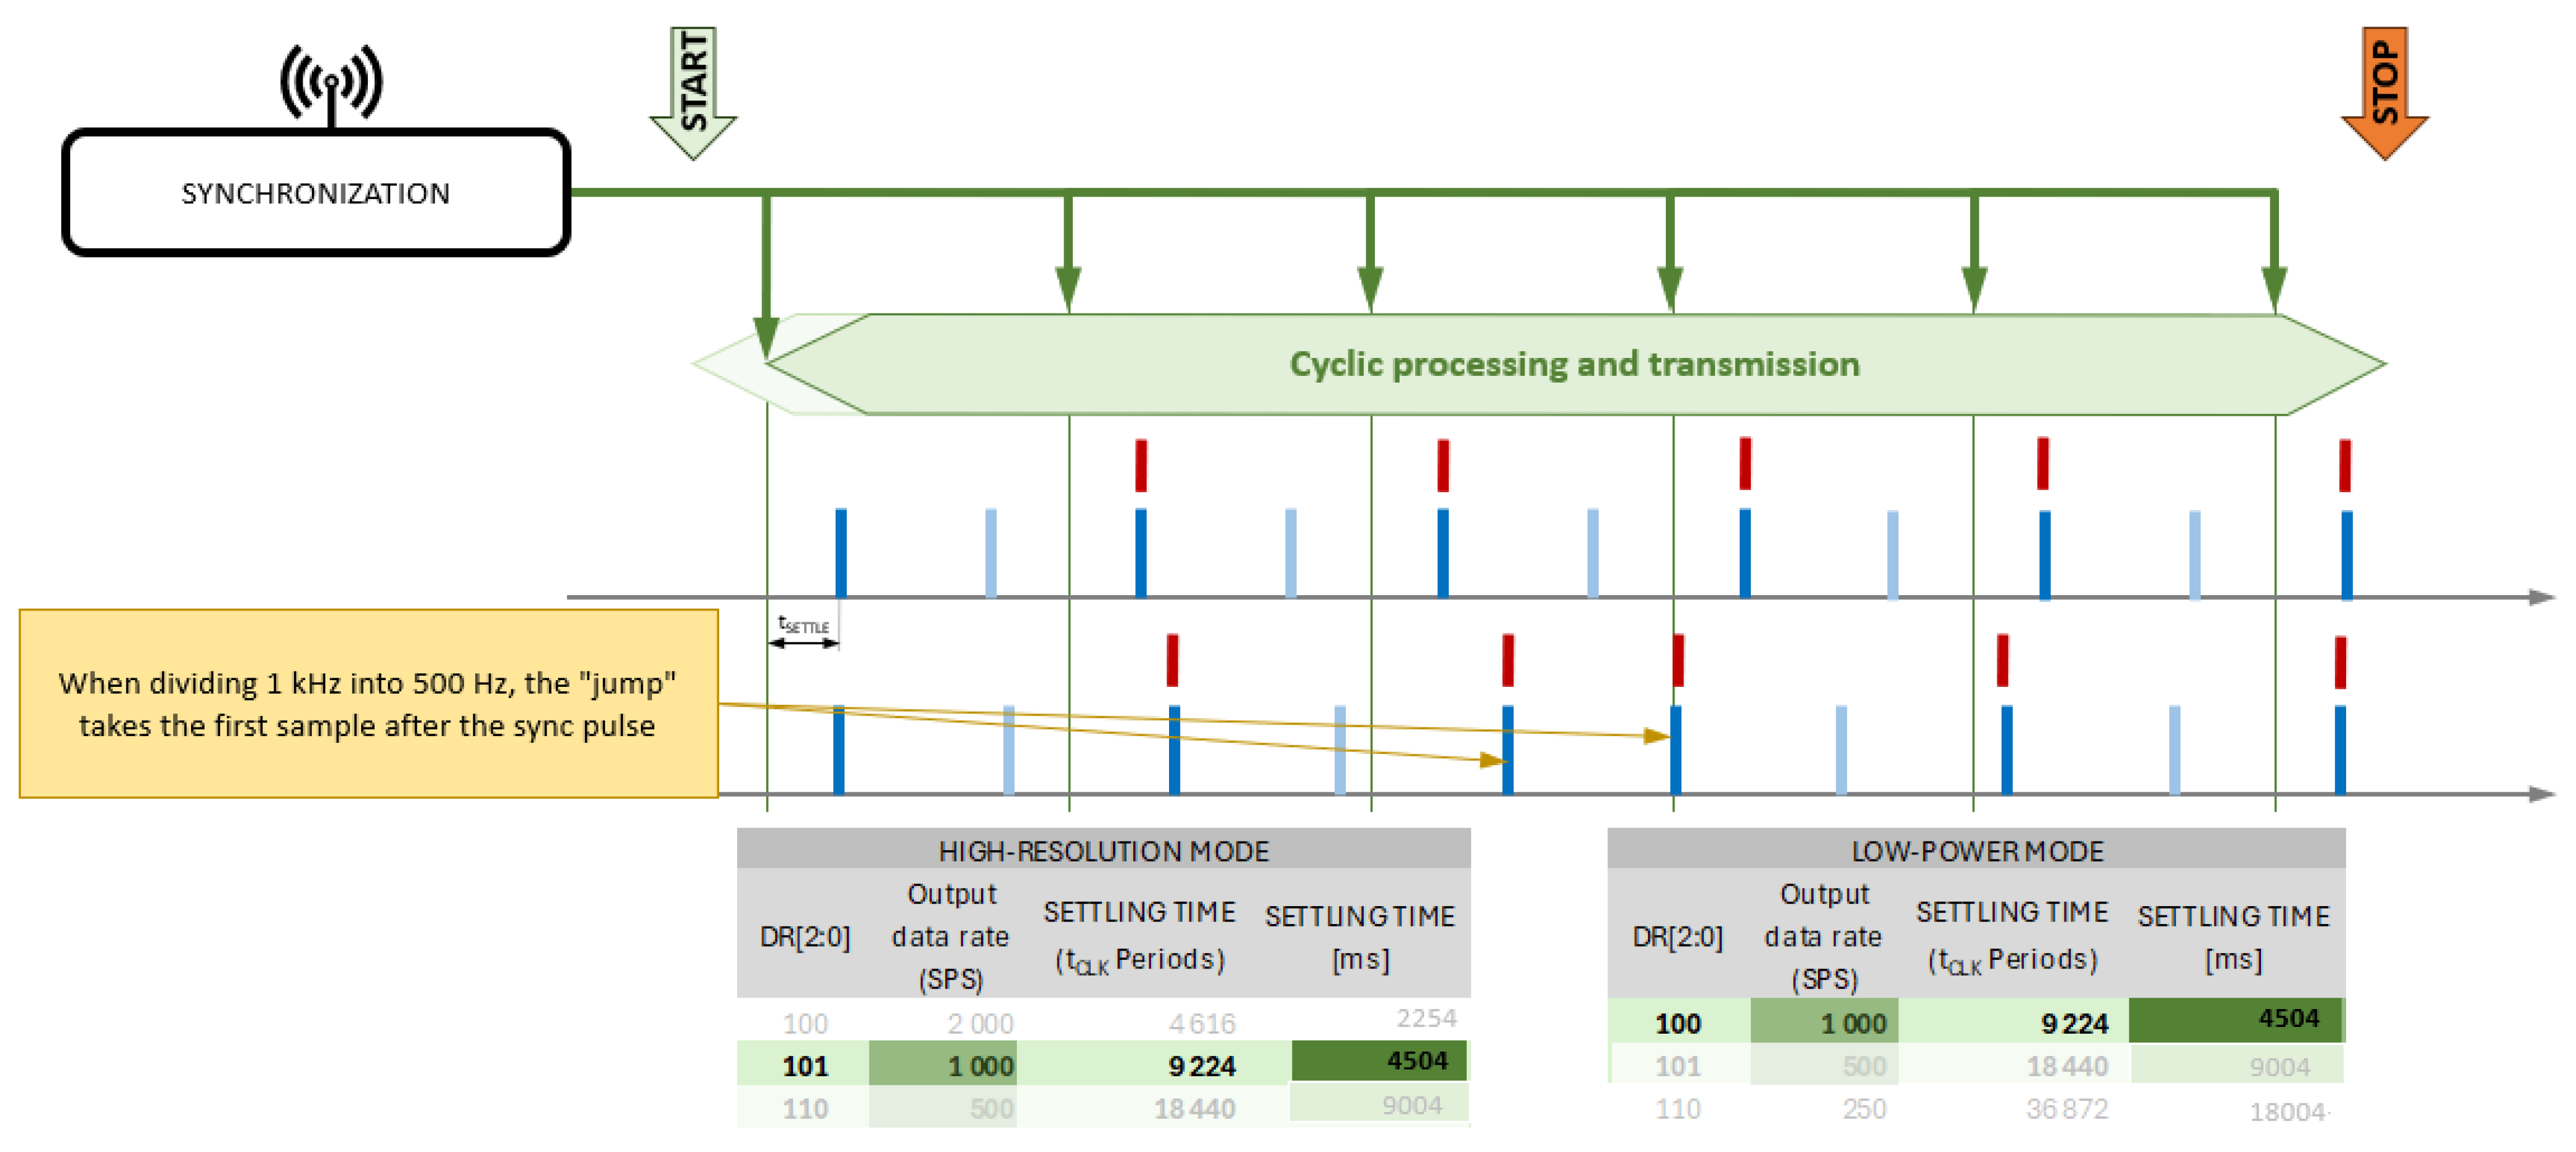
Figure 4 illustrates the impact of synchronization using the START signal, highlighting the variations in the delay of the first sample at different sampling rates. The diagram also depicts the role of the medical data receiver/terminal, which wirelessly receives data from the patient modules and retransmits them via a cable to the data-recording computer. Additionally, the receiver serves as the source of the wireless synchronization signal. Each patient module receives these synchronization pulses, ensuring a simultaneous recording start and equalizing the number of samples collected across all modules.
Each patient measurement module receives a synchronization signal that is transmitted wirelessly. The PPS (Pulse Per Second) synchronization signal is sent every second and ensures synchronized measurement initiation across modules. Additionally, data transmission helps align the sampling frequencies. The system architecture is based on autonomous measurement modules that wirelessly communicate with the IT system. This requires implementing a dedicated communication protocol to handle various data types, including signal samples, measured parameters, calibration data, and bit flags for module control and status updates (e.g., error notifications). The protocol also supports simultaneous data transmission from multiple modules and integrates the acquired data into a single transmission channel. To meet these requirements, a custom communication protocol called the DTP RA was developed. It is designed for scalability, accommodating different measurement channels and varying data volumes. The primary constraint of this system is the available transmission bandwidth. This approach ensures flexibility for future system expansion without imposing transmission-related limitations.
Data integration from multiple measurement modules is managed by a component called a data concentrator. The proposed solution includes a hardware-software data terminal that facilitates communication between the medical modules and the IT system. The data concentrator enables bidirectional data exchange between the input devices (measurement modules that acquire physiological waveforms) and a computer responsible for data recording and storage. Wireless bidirectional communication occurs independently between each input module and the concentrator, while a wired bidirectional connection links the concentrator to the data-recording computer.
3. Results
This section presents the outcomes of the development process of a portable system designed to measure key physiological parameters. These include blood flow in the carotid artery, cardiac output, ECG signals, EMG, and non-invasive blood pressure measurements. This section also discusses the design and testing of various modules, their enclosures, attachment methods, and the communication protocol necessary for system integration. The results highlight the verification of the communication protocol and the successful integration of all system components.
As part of this ongoing work, a concept was developed for a portable module to measure blood flow in the carotid artery, along with other modules for monitoring physiological parameters, including cardiac output measurement using impedance cardiography (ICG), ECG signal recording, EMG, and non-invasive blood pressure wave measurement. Various design and enclosure options were evaluated for all modules, along with different methods of attaching them to the patient’s body. This work resulted in the development and production of enclosure models and an attachment system. Additionally, a communication protocol was designed. To verify the communication protocol, informational models of the measurement modules were created and tested using software emulators. These emulators replicate the target communication protocol, enabling a convenient assessment of the integration between medical measurement modules and other system components, particularly the IT subsystem. This work also validated the correct implementation of the communication protocol between the measurement modules and the IT subsystem, as well as the software data terminal that consolidates data from individual medical measurement modules into a single data stream for the IT subsystem.
Furthermore, bidirectional communication between the IT subsystem and the medical measurement modules was verified, ensuring proper module control by the IT system and accurate reception of transmitted data.
3.1. Carotid Artery Blood Flow Measurement Module
The carotid artery blood flow measurement module uses the ultrasound Doppler method, which is a well-established technique for assessing the blood flow velocity and volume. The design incorporates piezoelectric ultrasound transducers, ensuring high sensitivity and reliability. The system operates at an ultrasound frequency of 5 MHz, enabling the use of miniaturized piezoelectric transducers with diameters of only a few millimeters.
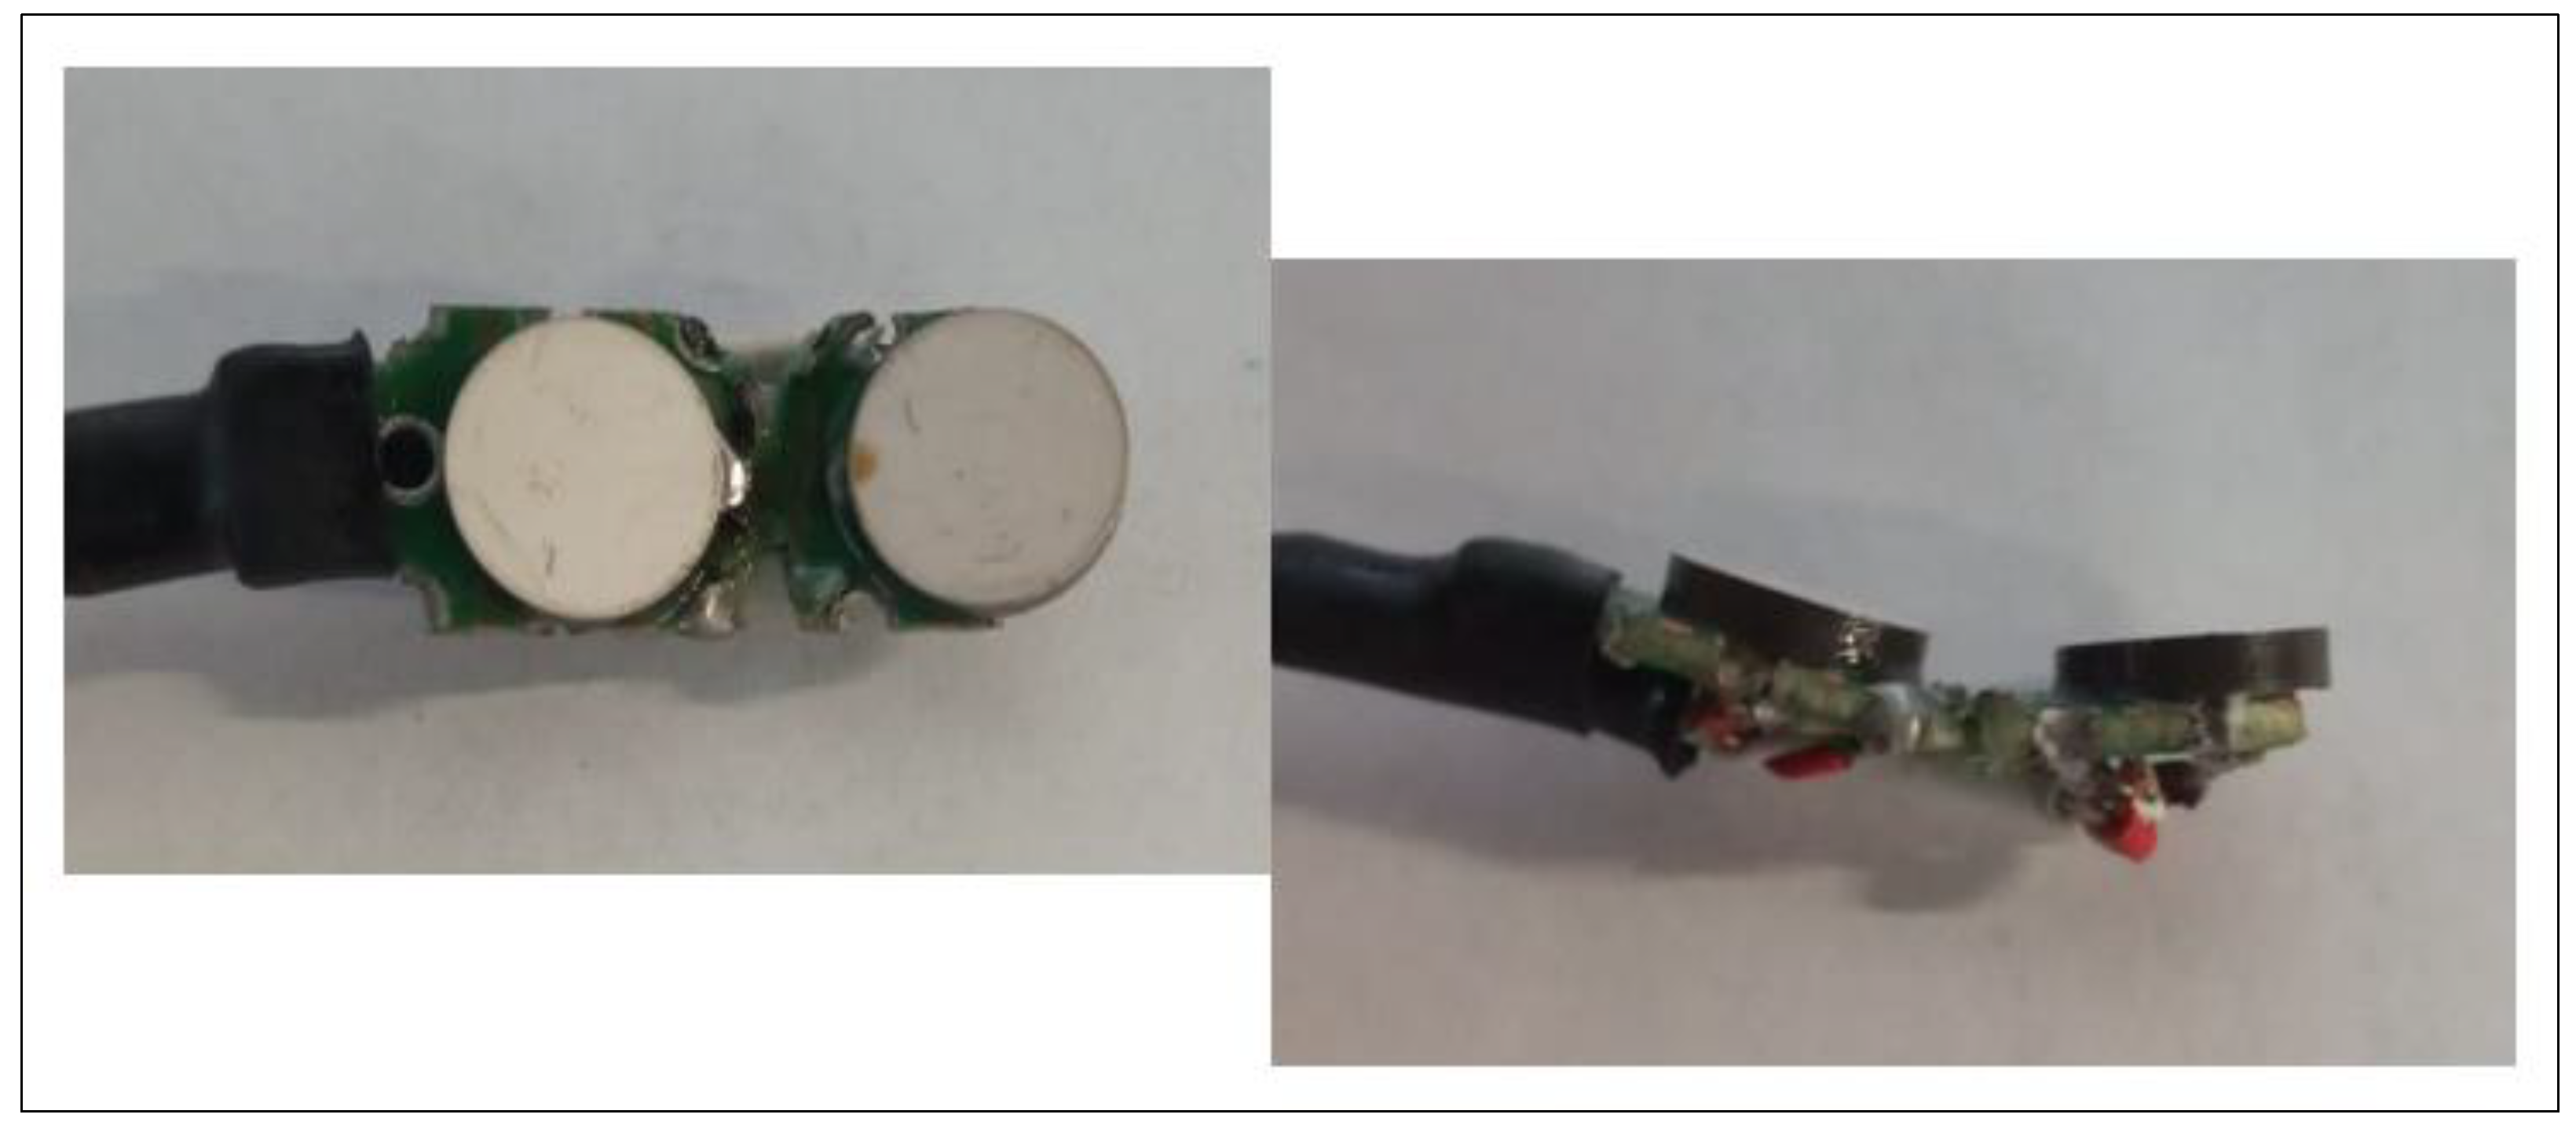
To enhance usability, the ultrasound probe features a single piezoelectric transducer as the transmitter and multiple receivers positioned at different angles.
Figure 5 illustrates this configuration, in which the transmitter and receivers are arranged to detect the reflected wave. This setup reduces the dependence of the output signal amplitude on the probe’s alignment with the carotid artery, ensuring consistent measurements despite slight positioning variations. The compact probe, which is placed on the subject’s neck, connects to the processing unit via a wired interface, ensuring ease of handling and portability. The mobile blood flow recorder module was designed with strict adherence to safety requirements for both the subject and operator. Preliminary testing confirmed that the system effectively mitigates motion artifacts, which are common in such measurements. Based on these results, the ultrasound probe design was refined to include one transmitting piezoelectric transducer and multiple receiving transducers positioned at various angles. This minimizes the sensitivity of the output signal amplitude to the probe alignment, thereby improving measurement consistency. The final system will operate at 5 MHz, allowing for a miniaturized ultrasound probe placed on the subject’s neck with a wired connection to the measurement module’s processing unit. Only the probe will be in direct contact with the subject. The system will use a sampling frequency of 500 Hz for the demodulated carotid blood flow signal, with a 16-bit resolution.
3.1.1. Preliminary Testing
The initial prototypes of the carotid artery blood flow measurement module underwent preliminary testing to evaluate their performance under conditions simulating aviation environments. Although formal reliability statistics have not yet been obtained, the results confirmed the following:
The measurement path demonstrated stable signal recording despite disturbances caused by artifacts inherent in the anticipated aviation application.
The ultrasound probe provided consistent output signals, thus minimizing the impact of the need for precise alignment with the carotid artery.
The required technical specifications identified during the engineering tests for the carotid artery blood flow measurement system are presented in
Table 1.
Although these initial results are promising, formal reliability testing, including statistical analysis of performance consistency, will be conducted in subsequent phases. These tests will include a larger sample size and more detailed measurements to validate the device’s reliability and establish confidence in its performance in real-world environments.
3.1.2. Comparison of USG Module with Existing Solutions
To evaluate the effectiveness and innovation of the proposed carotid artery blood flow measurement module, it is essential to compare its key parameters and performance with those of existing solutions in the literature and the market. This comparison highlights the advantages and potential improvements offered by the proposed system, particularly in terms of measurement accuracy, frequency range, power efficiency, and overall usability in aviation and other dynamic environments. By examining these factors, we aim to demonstrate how the proposed solution stands out in terms of both technical specifications and practical applications.
The following section provides a detailed comparison of the proposed system’s parameters with those reported in recent studies and commercial devices. A comparison is presented in
Table 2.
The parameters presented in
Table 2 show that the proposed solution aligns with the existing standards while introducing specific optimizations. The single-channel configuration simplifies the system architecture, reduces the size, and minimizes power consumption. While some existing solutions offer up to four channels, which may be beneficial for applications requiring multi-angle or multi-depth imaging, such configurations increase the system complexity and energy demands, making them less practical for portable applications like ours. The ultrasound frequency range of 2–8 MHz exceeds the narrower ranges of existing solutions (2–5 MHz or fixed at 5 MHz), providing greater adaptability. This flexibility enables both deeper tissue imaging and higher-resolution superficial measurements. However, supporting a broader frequency range presents design challenges, such as ensuring optimal signal processing and calibration across the entire range, which may require fine-tuning for specific applications. Regarding ultrasound power, the system operates at 1 MPa, which is within the typical range of existing solutions (0.5–2 MPa). This ensures reliable measurements while avoiding safety risks. However, some systems allow dynamic power adjustments to optimize performance under different conditions, which our fixed power design does not currently support. A sampling rate of 100–500 Hz strikes a balance between real-time data acquisition and power efficiency. While some existing systems support rates of up to 2000 Hz, such high frequencies impose increased processing and energy demands, making them more suitable for stationary or high-precision applications than portable, low-power systems. While our choice optimizes efficiency, it may limit the system’s ability to capture extremely rapid physiological changes. Overall, the proposed solution prioritizes portability, usability, and adaptability while maintaining high performance and safety. However, trade-offs were made to optimize these constraints, such as limiting the number of channels and using a fixed ultrasound power setting.
3.2. Electrocardiograph Module (ECG) with Impedance Cardiogram (ICG) Measurement Function
G-forces experienced during high-altitude maneuvers or in simulated environments, such as those created in centrifuges, can cause significant changes in cardiovascular parameters, including heart rate variability, QT and RT intervals, and stroke volume. Monitoring these changes is crucial for understanding an individual’s capacity to perform under stress and for detecting early signs of g-induced physiological strain, such as cerebral hypoxia. To enable this, we developed a module with both ECG and ICG measurement capabilities, as illustrated in
Figure 6. This figure provides a detailed view of the module’s PCB, showing both the bottom and top views of the design. The architecture integrates key components, including a control microcontroller, a multi-channel A/D converter, a power supply block, and a data acquisition system. The module also features both wired and wireless charging for the built-in battery, as well as wireless data transmission. The only distinction between the modules lies in the analog input section, which is tailored to the specific type of biomedical signal being recorded.
The ECG module is designed to measure a one-channel differential ECG signal recorded from two electrodes placed on the subject’s body. The ECG signal provides valuable information about the heart’s electrical activity, including the morphology of the signal and its variability over time. The effects of hypoxia and g-forces on cardiovascular function can be detected by analyzing the ECG signal, specifically by examining [
2]:
Heart Rate Variability (HRV): G-forces cause fluctuations in heart rate, which may either increase or decrease depending on the direction and intensity of the force.
QT and RT Interval Variations: Changes in the g-force vector lead to significant alterations in the QT and RT intervals of the ECG, reflecting the stress on the heart and autonomic nervous system during high-intensity maneuvers.
The module records the ECG signal at a sampling rate of 500 Hz with a 16-bit resolution, providing high-fidelity data for both real-time monitoring and post-test analysis. This ensures accurate detection of even minor changes in the heart’s electrical activity.
The impedance cardiogram measures the variable component of chest impedance, which changes with each heartbeat due to the contraction of the heart and blood movement within the thoracic cavity. By tracking these impedance variations, the module determines key hemodynamic parameters, such as stroke volume, cardiac output, and blood flow dynamics. The system also measures the baseline chest impedance, which is separated using advanced digital signal processing algorithms implemented in the microcontroller. This baseline is essential for distinguishing the dynamic components of impedance caused by heart activity from the static components that remain constant throughout the measurement period. The data acquired from ECG and impedance cardiography measurements can be used to assess an individual’s ability to tolerate g-forces by analyzing key physiological indicators. Specifically, bioimpedance measurements provide insights into stroke volume (SV), a critical indicator of cardiovascular performance under stress.
Two key indicators are used to classify individuals into low- and high-g-force tolerance groups [
25] [Błąd! Nie można odnaleźć źródła odwołania.]:
SV-LTI (Stroke Volume Long Time Interval): Determined from the blood pressure curve; this indicator reflects the body’s ability to maintain stable blood flow over time, despite varying g-forces.
SV-EBI (Stroke Volume Electrobioimpedance): Determined from impedance measurements, this indicator offers insight into the heart’s ability to adapt to changes in blood volume and circulation during g-force exposure.
Both SV-LTI and SV-EBI are sensitive to changes in g-forces and are used to group subjects based on their g-force tolerance thresholds. These measurements provide valuable information for classifying pilots and other individuals working under extreme conditions, such as high-altitude rescues or extreme operations, into categories of low or high risk for g-force-induced health issues.
Comparison of ECG and ICG Module with Existing Solutions
Table 3 and
Table 4 present a comparative analysis of the key parameters of the proposed ECG and ICG modules against existing solutions documented in the literature. The comparison focuses on critical performance metrics, such as sensitivity, hardware sampling rate, ECG track drive range, input impedance, common mode rejection, and the driving range for transferring useful ECG signals. This analysis aims to evaluate how the proposed modules align with current standards and identify areas where they offer potential advantages or limitations.
The ECG module in the proposed system exhibits technical parameters that align closely with existing solutions, while introducing optimizations for portable real-time monitoring in demanding environments. One of its key strengths is the common mode rejection ratio (CMRR) of 100 dB, which exceeds the 90 dB threshold found in existing solutions. A higher CMRR enhances noise rejection, particularly for power line interference and muscle artifacts, thereby ensuring accurate ECG signal acquisition in mobile or high-interference environments. Additionally, the system features an optimized input impedance of 10 MΩ. While existing solutions typically offer values greater than 10 MΩ, the proposed 10 MΩ input impedance is carefully chosen to ensure efficient signal acquisition without unnecessary complexity. Higher impedance values can further minimize signal loss due to electrode-skin impedance mismatches, but they may also increase susceptibility to external noise under certain conditions. The proposed value strikes a balance between signal integrity and hardware efficiency for portable applications.
The system also maintains a driving range of ±20 mV, which aligns with existing solutions, ensuring compatibility with standard ECG signal processing techniques and preventing signal clipping or distortion. Despite these advantages, some trade-offs exist. The proposed system has a slightly lower sensitivity (2.36 µV/LSB) compared to the benchmark of 2.44 µV/LSB. While a higher sensitivity can help capture very fine ECG variations, the difference is minimal and unlikely to significantly impact the diagnostic performance. This is compensated by effective noise filtering and signal conditioning techniques, which ensure reliable ECG detection, even in challenging environments.
The hardware sampling rate of 500 Hz matches that of the existing solutions and is sufficient to capture all key ECG waveform components, including the P-wave, QRS complex, and T-wave, without introducing unnecessary data redundancy. While some research-grade systems may utilize higher sampling rates (e.g., 1000 Hz or more) for advanced signal analysis, such an increase does not offer significant diagnostic advantages in standard clinical or field applications. Instead, it would lead to increased data processing and power consumption, which is not ideal for portable solutions.
The proposed solution demonstrates carefully optimized parameters that balance performance, portability, and usability in real-world applications. The single-channel configuration aligns with existing solutions and simplifies the system design. This reduces hardware complexity, power consumption, and cost, while still providing reliable data for typical impedance cardiography applications. For portable or field-deployed systems, maintaining simplicity ensures ease of use and robustness.
The proposed module ensures compatibility with standard safety and performance requirements by matching the amplitude of current applications in existing solutions. This amplitude is sufficient to generate reliable impedance measurements without causing discomfort or adverse effects to the patient, making it ideal for continuous monitoring in dynamic environments. The system uses a lower application current frequency (40 kHz) compared to the 100 kHz commonly found in existing systems. A frequency of 40 kHz strikes a balance between reducing electromagnetic interference and ensuring precise impedance measurements, which is especially advantageous for portable systems operating near other electronic equipment. The 500 Hz sampling rate, consistent with current solutions, is optimal for capturing detailed impedance changes during cardiac cycles without unnecessary data overhead. This frequency ensures that the system can accurately measure key parameters, such as stroke volume and cardiac output, in real-time applications. Maintaining this standard ensures compatibility with established clinical and research protocols.
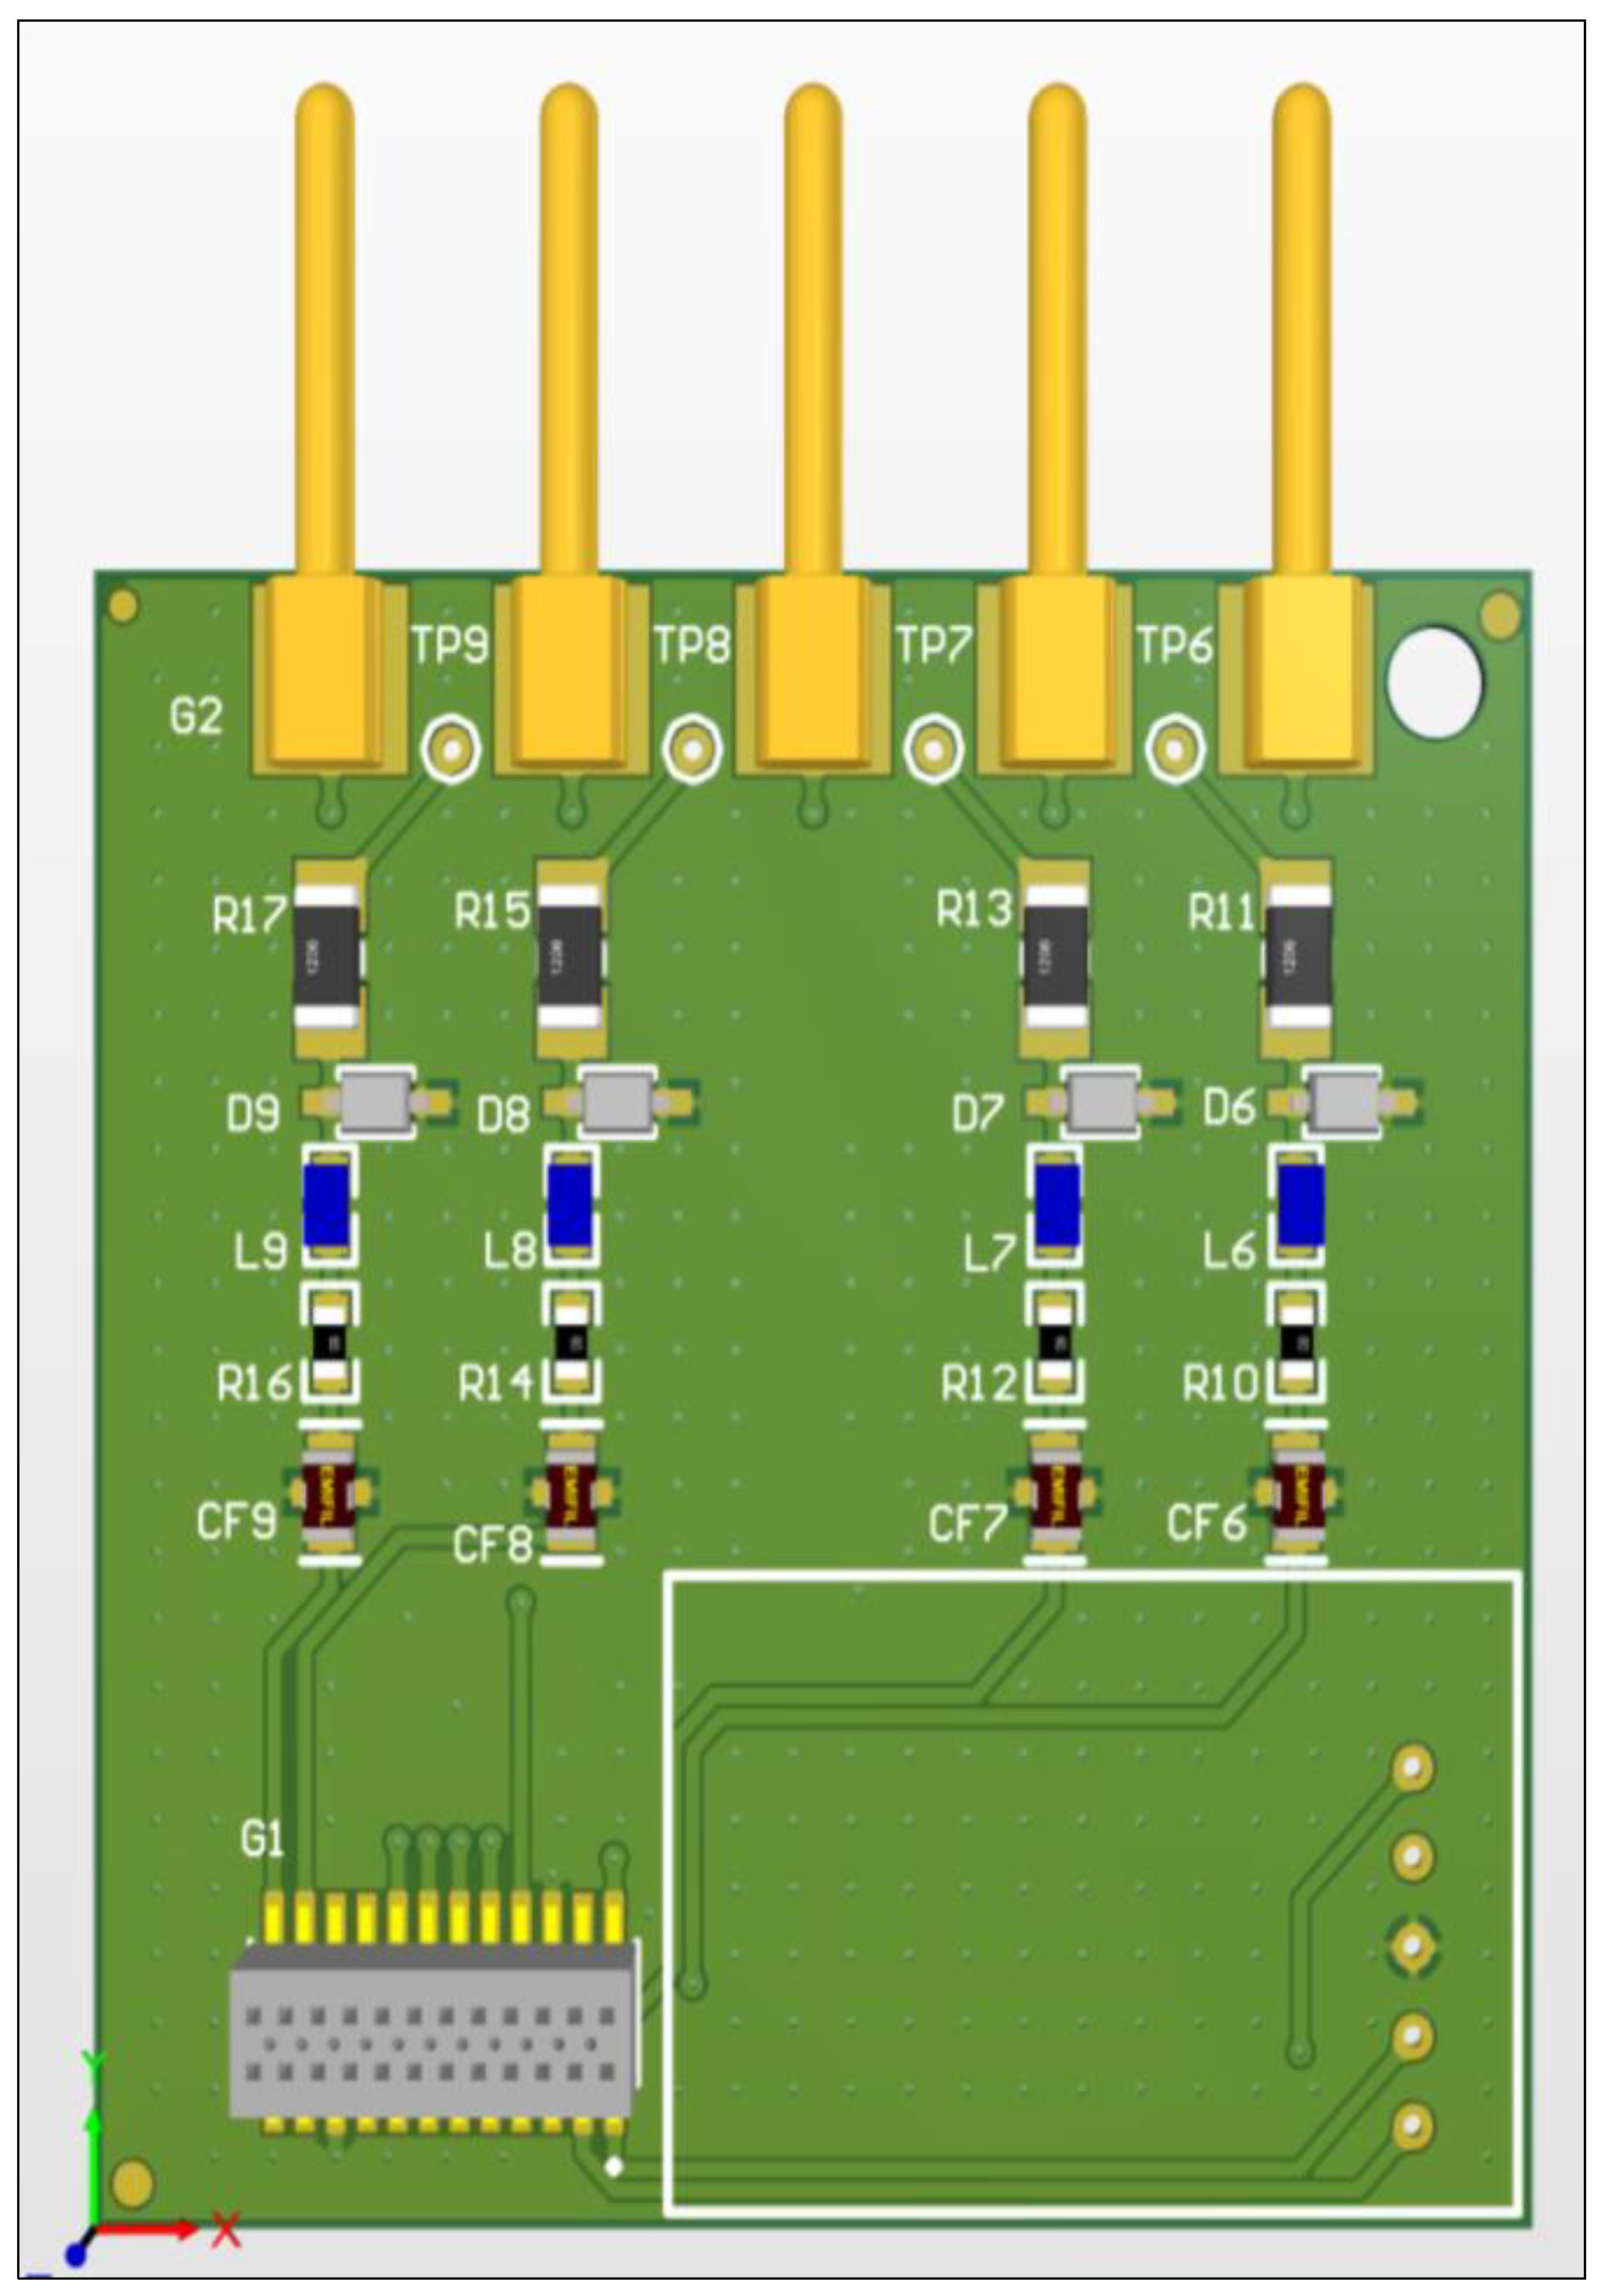
3.3. Muscle Activity Measurement Module (EMG)
Pilots are frequently exposed to high-g-forces during flight, particularly during maneuvers involving rapid acceleration or deceleration. These g-forces can reduce blood flow to the brain, potentially leading to cognitive impairment or loss of consciousness. To counteract this, pilots perform the Anti-G Straining Maneuver (AGSM), which involves specific muscle tension, primarily in the lower extremities, to maintain blood circulation in the upper body and the head. Monitoring muscle activity during these maneuvers is crucial for understanding how effectively pilots can counteract the physiological effects of g-forces and assess their overall fitness in high-g environments. To facilitate this, we developed a module with EMG measurement functionality, as shown in
Figure 7. This figure displays the PCB design of the muscle activity measurement module, including both the top and bottom views. The module features a unified architecture comprising a control microcontroller, a multi-channel A/D converter, a power supply block, a data acquisition system on an embedded memory card, and both wired and wireless charging for the built-in battery. The only difference between the modules is the analog input section, which is specifically designed based on the type of biomedical signal recorded.
The EMG measurement module is designed to assess the electrical activity of the muscles in the lower extremities, primarily focusing on the thigh and calf muscles during exposure to real or simulated g-forces. The EMG signals are used to evaluate the effectiveness of the AGSM, which is critical for counteracting gravitational pull and maintaining cerebral blood flow during high-g-force exposure. The system uses a differential input channel for each muscle being tested, ensuring precise recording of muscle activity with minimal interference from other body movements. This approach also allows flexibility in testing multiple muscle groups independently, which is essential for a detailed analysis of each muscle’s response during the AGSM. To ensure minimal discomfort for the individual being tested, the EMG modules are designed to be lightweight and compact. Instead of long electrode cables, each module is small enough to be attached directly to the body with measurement electrodes. For the lower extremities, two independent modules are placed on each leg—one for the thigh muscle and one for the calf muscle. This modular approach allows for optimal electrode placement and ensures that each muscle is monitored independently without the need for complex wiring. The EMG modules wirelessly transmit the recorded muscle activity signals to a computer system, where the data is processed and analyzed. The system records EMG signals at a high sampling rate of 1000 Hz with a 16-bit resolution, providing accurate and detailed information on muscle activity during the AGSM. The high resolution and sampling rate ensure that even small variations in muscle tension can be detected, enabling precise assessment of how effectively the individual performs the maneuver under g-force conditions.
Comparison of EMG Module with Existing Solutions
The comparison of the EMG (Electromyography) module with existing solutions presents key technical parameters essential for evaluating the system’s quality and functionality. The analysis in
Table 5 allows for an assessment of how the proposed solution performs relative to the current technological standards.
The EMG module of the proposed system integrates key technical parameters optimized for real-world performance, balancing precision, efficiency, and portability. The two-channel configuration is specifically chosen to monitor muscle activity in targeted areas, such as the lower limbs, during anti-G straining maneuvers. While some existing solutions offer up to eight channels, the additional channels often increase the complexity, size, and power requirements, which are impractical for portable applications. By limiting the number of channels to two, the proposed system reduces hardware demands and energy consumption while still providing essential performance metrics for specific tasks. This design makes the system portable and effective in both field applications and simulation environments. The high input impedance of the proposed system (10 MΩ) minimizes the impact of external noise, ensuring minimal distortion of the bioelectric signals. This is especially advantageous in environments prone to electrical interference, such as near aircraft or simulation equipment, where even minor noise can compromise data quality. The higher impedance enhances the fidelity of EMG recordings, enabling accurate monitoring of muscle activity in extreme or dynamic conditions. The bandwidth of the proposed system, set at 250 Hz, is optimized to cover the frequency range most relevant for muscle activity analysis. Human muscle activity typically falls within this range, making broader bandwidths unnecessary for practical applications. Existing solutions with bandwidths extending to 10 kHz often capture irrelevant frequencies that do not contribute to meaningful EMG analysis. By narrowing the bandwidth, the proposed system reduces the data volume, decreases the processing requirements, and improves the energy efficiency. This optimization is critical for real-time monitoring in portable systems, where extended battery life and lower computational overhead are essential.
3.4. Blood Pressure Measurement Module
Continuous measurement of blood pressure using the CNAP (Continuous Non-invasive Arterial Pressure) method allows for the correlation of g-force effects (real or simulated) with the autoregulatory response of the cardiovascular system, particularly in the baroreceptors [
5]. Baroreceptors are responsible for the dynamic regulation of blood pressure in the body. In response to g-forces, the cardiovascular system compensates for brain hypoxia caused by the redistribution of blood to the lower parts of the body by increasing peripheral blood pressure (vasoconstriction) and heart rate.
A commercial OEM module was used to build a measurement system for continuous blood pressure monitoring using the CNAP method [
33]. The finger mini-cuff, along with the controller, is connected by an electro-pneumatic cable to a CNAP measurement module attached to the wrist of the person being tested. The blood pressure waveform is transmitted digitally to the computer program via a Bluetooth wireless connection, with a sampling rate of 500 Hz and 16-bit resolution. Continuous monitoring can reveal the characteristic transient changes in blood pressure caused by a real g-force stimulus or one simulated using the LBNP method.
4. Discussion
The proposed system for monitoring physiological parameters represents a significant advancement in assessing the readiness of aviation personnel for air service. By integrating advanced components into a single tool—including a flight simulator with a Lower Body Negative Pressure (LBNP) system, blood flow recorders in the carotid arteries, and measurement modules for ECG, EMG, CBP, and ICG—this system offers a groundbreaking solution. It addresses the limitations of traditional evaluation methods, such as centrifuge systems, which are costly, safety-concerned, and lack portability.
In addition to its primary application in aviation, the system has the potential to expand to various other extreme environments. Space medicine, for example, could greatly benefit from this technology. By monitoring parameters such as blood pressure, blood flow in the carotid arteries, and brain oxygenation, the system would allow for assessing astronauts’ ability to function under microgravity and oxygen-limited conditions. In the future, the system could simulate space conditions, such as hypoxia, to help prepare astronauts for long-term missions. This system could also have significant implications for rescue operations and medical teams in high-risk scenarios. Autonomous health recorders that analyze key parameters can significantly aid rescuers and firefighters working in extreme conditions by providing continuous real-time health monitoring. This would enable quicker reactions to health threats, such as overheating, hypoxia, or stress-induced cardiovascular events. Moreover, the system could be invaluable in underwater operations, where it would assess physiological responses to pressure changes and hypoxia, which are conditions common in deep-sea diving. Monitoring parameters like carbon dioxide levels, decompression risks, and brain oxygenation would help improve driver safety. Additionally, professional sports could benefit from this system for monitoring athletes in extreme conditions, such as high-altitude climbing or ultramarathons, ensuring performance optimization and injury prevention.
While the system offers innovative solutions, several limitations must be addressed. Sensor drift, for instance, may affect the measurement accuracy over time, which requires the development of robust calibration and drift monitoring methods to ensure data stability and reliability throughout the system’s lifespan. Another key challenge is battery life, especially for mobile use. Long-term monitoring in extreme environments demands reliable power sources, and the system’s energy efficiency, advanced battery technologies, and improved charging methods need to be developed to meet these demands. Furthermore, real-world implementation poses challenges, as medical systems must function in extreme conditions, such as high/low temperatures, humidity, limited wireless connectivity, or fluctuating environmental factors. Adapting the system to these realities will require extensive testing and refinement of the algorithms to ensure reliability and robustness under such conditions.
Future research could focus on integrating artificial intelligence (AI) to enhance the system’s capability to detect abnormalities in real-time physiological data. AI-based algorithms can automatically identify early signs of health issues, such as hypoxia, changes in blood flow, or cardiac arrhythmias, enabling quicker and more accurate interventions. Additionally, advancements in wireless data transmission should focus on overcoming the challenges of connectivity in extreme environments, such as space, underwater, or during high-altitude activities. Improving wireless transmission quality will enable faster and more reliable data exchange between the monitoring system and central diagnostic centers, which is crucial for timely intervention during emergencies. Further development in these areas could expand the system’s applicability, not just in aviation but across a broader range of critical fields where real-time physiological monitoring is essential for safety and performance.
5. Conclusions
This study introduces an innovative modular system for real-time physiological monitoring designed to assess the response of flight personnel to g-forces in high-stress environments. By integrating multiple measurement modules, this system provides a comprehensive and portable solution that overcomes the limitations of traditional, costly, and physically demanding assessment methods. The real-time data acquisition and analysis capabilities allow for the early detection of potential health risks, enabling timely interventions and enhancing overall flight safety. Beyond aviation, the system has significant potential applications in various high-risk professions, including space exploration, deep-sea diving, and emergency response. In these fields, continuous health monitoring can help safeguard personnel by providing crucial insights into their physical conditions during extreme conditions. Furthermore, the system’s modularity and portability make it an ideal solution for mobile and remote health monitoring.
The key takeaways from this study include the system’s ability to offer continuous and accurate physiological measurements under extreme conditions, which improves safety, performance, and early detection of health risks. Future research will focus on expanding validation studies across diverse real-world environments, optimizing real-time data processing algorithms for more efficient health monitoring, and refining the system application for both pilot selection and long-term health monitoring.
Advancements in AI integration, sensor technology, and wireless communication are critical for improving the diagnostic accuracy and usability of the system. These developments are expected to further expand the system’s potential in diverse high-stress fields, contributing to better performance and safety outcomes in extreme operational environments.


 ,
, 


