Article

Designing a Remote Photoplethysmography-Based Heart Rate Estimation Algorithm During a Treadmill Exercise

1
Computer Engineering Department, Kwangwoon University, Seoul 01897, Republic of Korea
2
DRAXfit Co., Ltd., Anyang 14086, Republic of Korea
3
Emma Healthcare Co., Ltd., Seongnam 26329, Republic of Korea
*
Authors to whom correspondence should be addressed.
These authors contributed equally to this work.
Electronics 2025, 14(5), 890; https://doi.org/10.3390/electronics14050890
Submission received: 31 December 2024 / Revised: 19 February 2025 / Accepted: 19 February 2025 / Published: 24 February 2025

Abstract

Remote photoplethysmography is a technology that estimates heart rate by detecting changes in blood volume induced by heartbeats and the resulting changes in skin color through imaging. This technique is fundamental for the noncontact acquisition of physiological signals from the human body. Despite the notable progress in remote-photoplethysmography algorithms for estimating heart rate from facial videos, challenges remain in accurately assessing heart rate during cardiovascular exercises such as treadmill or elliptical workouts. To address these issues, research has been conducted in various fields. For example, an understanding of optics can help solve these issues. Careful design of video production is also crucial. Approaches in computer vision and deep learning with neural networks can also be applied. We focused on developing a practical approach to improve heart rate estimation algorithms under constrained conditions. To address the limitations of motion blur during high-motion activities, we introduced a novel motion-based algorithm. While existing methods like CHROM, LGI, OMIT, and POS incorporate correction processes, they have shown limited success in environments with significant motion. By analyzing treadmill data, we identified a relationship between motion changes and heart rate. With an initial heart rate provided, our algorithm achieved over a 15 bpm improvement in mean absolute error and root mean squared error compared to existing methods, along with more than double the Pearson correlation. We hope this research contributes to advancements in healthcare and monitoring.

1. Introduction

Heart rate (HR) is a crucial indicator of an individual’s health status [1]. HR can also be measured using contact-based devices that rely on physiological signals, such as electrocardiography (ECG) and photoplethysmography (PPG) [2,3]. However, remote photoplethysmography (rPPG) enables noncontact estimation based on the PPG signal [4]. Since its development, rPPG-based algorithms have occupied a prominent position in remote heart rate estimation [5]. However, accurately capturing heart rate during dynamic cardiovascular activities, such as treadmill running or elliptical training, remains a persistent challenge. These limitations could potentially be addressed by gaining a deeper understanding of the light spectrum [6], or investigating the overlap between computer vision/neural networks and health monitoring [7,8,9], or another sensor [10]. We aimed to explore methods for enhancing the performance of rPPG algorithms, particularly in environments with regular movement patterns, such as treadmill workouts. To achieve this, we also conducted an in-depth study of existing algorithms.
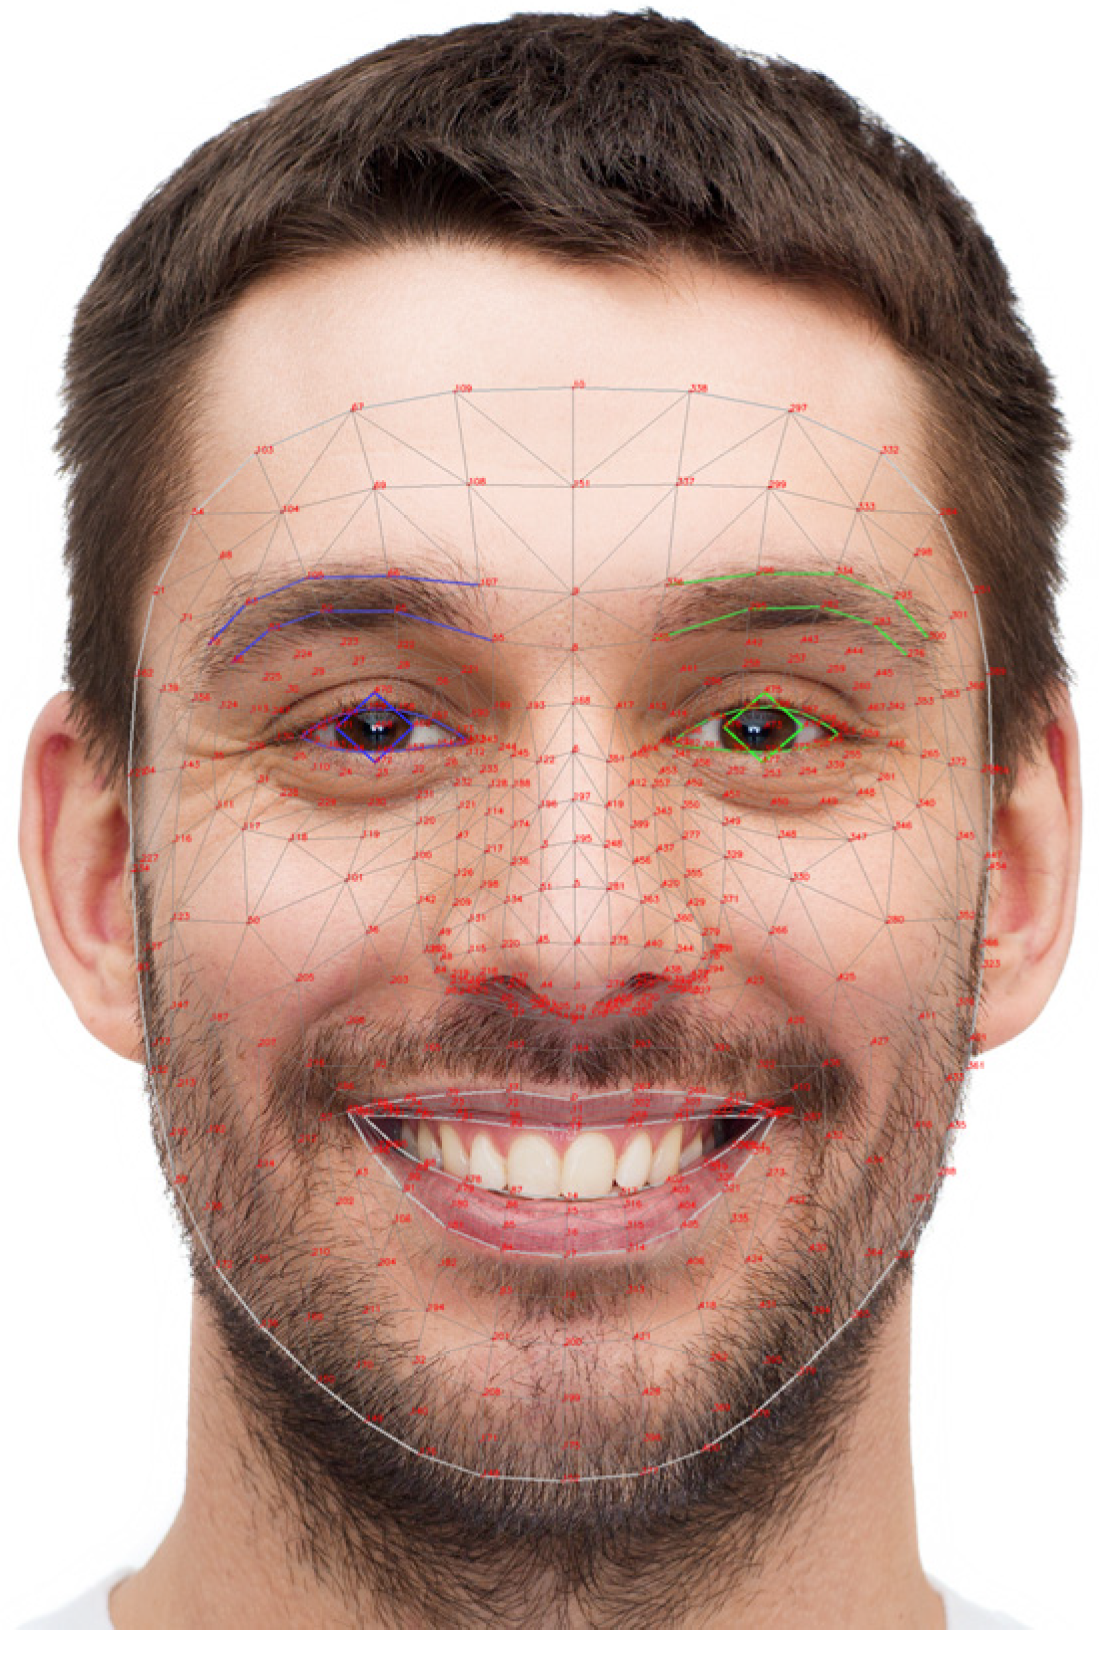
The rPPG-based algorithms primarily extract the blood volume pulse (BVP) from skin pixels in facial video frames for HR estimation [11,12,13,14,15]. The algorithm estimates heart rate based on changes in skin color caused by variations in capillary blood flow due to the heartbeat. To concretize this methodology, it is essential to model the light reflected from the skin. This reflected light can be mathematically represented as follows [5]:
C(t) = uc · I0 · c0 + uc · I0 · c0 · i(t) + us · I0 · s(t) + up · I0 · p(t)
In Equation (1), uc represents the unit vector of skin color. I0 denotes the stationary part, and i(t) denotes the time-varying part. The us represents the unit vector of the light spectrum, and s(t) denotes the component caused by motion. up is the unit vector of the pulse component in the RGB signal, and p(t) represents the pulse signal. The goal of rPPG algorithms is to separate and extract the pulse component (BVP) from the RGB signal in Equation (1).
Blind source separation (BSS) is an algorithm that can separate sources from mixed signals, and it could be used to isolate pulse components from RGB signals that consist of various types of light reflected from the skin. In particular, independent component analysis (ICA) is a representative example that can be used with RGB signals to extract heart rate [11]. If ICA separates the BVP in Equation (1), the GREEN algorithm assumes that the green channel of the RGB signal contains sufficient information to estimate the BVP and directly utilizes this channel for heart rate estimation. Research on the characteristics of the GREEN channel has shown that it has a higher signal-to-noise ratio compared to other channels and effectively captures subtle BVP variations while minimizing the impact of motion artifacts [4]. The local group invariance (LGI) algorithm maintains consistent signal extraction across various facial regions and lighting conditions by analyzing local pixel groups within predefined regions of interest (ROIs) [12]. This approach reduces the susceptibility of rPPG signals to external perturbations, ensuring reliable HR estimations even with changes in facial expressions or minor movements. The Orthogonal Matrix Image Transformation (OMIT) algorithm specifically addresses the challenge of motion-induced artifacts by employing adaptive filtering techniques that distinguish between genuine physiological signals and noise caused by subject movement [13]. Additionally, OMIT primarily employs a reduced QR decomposition algorithm that utilizes Householder reflections. Furthermore, the pulse blood volume (PBV) algorithm focuses on accurately capturing blood volume changes within the microvasculature of facial skin [14]. Analyzing temporal fluctuations across RGB channels and integrating spatial averaging techniques, PBV enhances signal quality and reliability even under challenging lighting and movement conditions. The CHROM algorithm leverages chrominance information to isolate physiological signals from common noise sources like lighting fluctuations and subject movement, thereby enhancing the stability and accuracy of HR measurements in dynamic environments [15]. Moreover, the up in Equation (1) is separated by projecting the chrominance signal onto a plane orthogonal to the standardized skin-tone vector. In other words, this process involves removing the specular reflection component. Following that, alpha tuning is carried out based on the intensity of the chrominance signal. This tuning is calculated using a scaling factor that is dynamically determined from the standard deviation of the signal after the specular reflection has been removed. Through this process, the us and up in Equation (1) are effectively separated. The plane-orthogonal-to-skin (POS) algorithm is a state-of-the-art approach that transforms the RGB color space to isolate pulsatile signals from ambient color variations [5]. POS decomposes up using a process similar to that of CHROM. However, in contrast to CHROM, POS first removes intensity before performing alpha tuning with the specular reflection component. Furthermore, it is regarded as a more robust algorithm than CHROM because it defines the projection axis based on physiological principles.
All of the aforementioned algorithms originate from the concept of extracting BVP from video by utilizing the subtle color variations in the skin caused by heartbeats and have been meticulously designed to be robust against motion-induced noise. Many studies have been conducted to test and improve the performance of rPPG-based algorithms under relatively static conditions, such as head movements or facial expression changes, compared to more dynamic exercise scenarios, such as walking [16]. However, in physical exercise applications, such as treadmill and stepping, these algorithms encounter a greater diversity and higher levels of movement-induced noise than in controlled laboratory environments. Furthermore, these exercise conditions adversely affect the performance of rPPG-based algorithms for remote heart rate estimation.
We specifically focused on running scenarios, such as running—which involves instances where both feet are simultaneously off the ground, inducing faster and more vigorous movements, unlike other activities such as cycling or stepping. These circumstances generate movement noise, which is more difficult to mitigate than that encountered in other testing environments [16]. We propose the following novel algorithm, which estimates heart rate by leveraging human motion to overcome these challenges.

2. Materials and Methods

2.1. Experimental Setup

Public datasets containing facial video and heart rate measurements collected during treadmill exercise are not publicly available. Although the dataset described in [17] provides photoplethysmography (PPG) signals and facial images of participants captured while they were walking, it is unsuitable for our research because the participants held the camera in their hands, introducing additional motion artifacts beyond their own movements in the video recordings. Furthermore, the existing rPPG datasets are typically captured under controlled lighting conditions, with subjects instructed to remain as still as possible. However, only a limited number of datasets provide motion-blurred facial footage in dynamic scenarios for a benchmark test of rPPG algorithms [16,17]; there are currently no publicly available datasets that include both treadmill exercise footage and the necessary PPG signals required for this study. Consequently, we acquired data through our experimental procedures.

2.1.1. Subject Condition

The participants recruited for the experiment were healthy adults, both males and females, aged 20–32 years. As the data collection process involved running on a treadmill for up to 10 min, the participants were instructed to obtain sufficient sleep the night before the experiment and to refrain from consuming caffeine or taking any medications that could influence heart rate within 24 h before the testing session. These precautions were implemented to ensure the accuracy and reliability of heart rate measurements during the experiment.

2.1.2. Experimental Design

All experiments were conducted on a treadmill fixed at a 0° inclination. The running protocol was structured into three distinct phases:
  • First, the participants began with a 30-s rest period, followed by running at speeds of 3 km/h, 5 km/h, and 7 km/h, each maintained for 1 min.
  • Second, after maintaining a stationary state for 30 s, participants ran at a speed of 9 km/h for 30 s. It took approximately 15 s for the treadmill to reach the speed of 9 km/h. Therefore, considering this time, the total duration of running after stopping becomes 45 s.
  • Third, this phase started with a 30-s rest, followed by a series of speed variations at 3 km/h, 5 km/h, 7 km/h, and 9 km/h, respectively. After that, participants proceeded at speeds of 7 km/h, 5 km/h, and 3 km/h. Running at each speed lasted for 1 min, and this session was finalized with a 1-min rest period.
This structured approach ensured consistent treadmill conditions while varying the running speeds and rest intervals. It allowed us to gather detailed data on participant’s physiological responses across different exercise intensities. This study has been approved by the Bioethics Committee of Kwangwoon University.

2.2. Methodology

2.2.1. Analysis Dataset

The FaceMesh module from the MediaPipe library [18] was applied to recognize human faces and extract facial landmarks (Figure 1). Specifically, Landmark 4 was used, which corresponds to the center point of the nose, as illustrated in the official FaceMesh documentation [19]. In addition, we focused on the y-coordinates of landmark 4 because vertical movements are more prominent on the screen compared with horizontal movements. This consideration is due to the inherent properties of treadmill usage and the biomechanics of human running, resulting in a more significant motion along the y-axis.
Using the coordinate information corresponding to the movement obtained through the aforementioned procedure, a spectrogram in the time-frequency domain was generated, as shown in Figure 2. In the spectrogram, the solid red line represents the frequency with the maximum amplitude for each instance. A comparison of heart rate label data for Figure 2 reveals a notable similarity between the estimation and true label. The Pearson correlation coefficient was calculated, yielding 0.74 overall to quantitatively assess this relationship. Although some variability exists across different instances and running speeds, the significant correlation demonstrates a strong positive relationship between the frequency component-based estimation and the true heart rates.
Table 1 presents the Pearson correlation between the maximum frequency and the labeled heart rate across the entire dataset. The “Full range” refers to a value recalculated over the entire speed range rather than the average of Pearson correlations calculated for individual speed segments. Consequently, Pearson correlations for shorter speed segments tend to be lower, as they are more sensitive to fluctuations in maximum frequency over short periods. Section 2.1.2 outlines three types of experiments. In the first and second datasets, treadmill speed and heart rate continuously increase until the end. In contrast, the third dataset shows an initial increase in speed and heart rate, which is then followed by a decrease. As a result, these datasets exhibit different trends in Pearson correlation values. In the first case, where both movement frequency and heart rate consistently increase, the correlation is close to 1 for the ‘Full range’, as shown in Table 2.
On the other hand, the second case includes segments where movement frequency and heart rate decrease, leading to a lower correlation of the full range compared to the first case, as shown in Table 3.
The analysis demonstrated that the facial movements of individuals during treadmill exercises could effectively estimate their heart rates. We developed an unsupervised learning algorithm that leverages the relationship between facial dynamics and heart rate. This algorithm uses facial landmark information to capture subtle movements associated with heart rate fluctuations, allowing for accurate estimation without requiring true heart rate labels.

2.2.2. Preprocessing

MediaPipe’s Face Mesh detects a total of 468 facial landmarks. Among these, we used landmark number 4, which represents the central point of the nose located at the center of the face. Each landmark provides 3D coordinates corresponding to the x, y, and z axes. The x-axis indicates left-to-right movement in the video, the y-axis represents up-and-down movement, and the z-axis captures movement toward or away from the camera. As analyzed in Section 2.2.1, we decided to use the y-axis among the three axes: x, y, and z. The coordinates extracted from each facial image frame were preprocessed using whitening and the calculation of the first derivatives. Whitening was applied to eliminate relationships among the data dimensions and standardize the feature set, thereby enhancing the effectiveness of subsequent analyses (Figure 3).

2.2.3. Proposed Model

The algorithm estimates heart rate while using a treadmill by leveraging motion data. To set the initial parameters, it requires the heart rate estimated by the rPPG algorithm during a stationary state or at a slow speed of 5 km/h or less. After this initial setup, the heart rate is further refined through filters. Before we discuss the specifics of our algorithm, there are a few key points to cover. A duration of around 6 s is commonly regarded as sufficient for extracting BVP in many rPPG-related studies [20,21,22]. For example, studies [21,22] implemented their pipelines using a 6-s time window. To enable a fair comparison with other rPPG algorithms, we set the time window of the proposed algorithm to 6 s and updated it frame by frame. Many rPPG algorithms utilize FFT to predict the final BPM [5,21]. Even though the proposed algorithm also empolys FFT, its goal differs from theirs, which directly yields the heart rate. Specifically, the proposed algorithm applies FFT to the facial landmark motion data to predict the heart rate.
Figure 4 demonstrates how the proposed algorithm estimates HR variance. First, the algorithm performs the fast Fourier Transform (FFT) on the data within the current window, identifying the dominant frequency, which corresponds to the frequency with the highest amplitude. The dominant frequency was calculated and stored for each final frame of the time window. This continuous updating process ensures real-time heart rate estimation based on the most recent facial movements. The accumulated frequency data exhibited reduced linearity and noise compared to the previously plotted spectrograms. We computed motion frequency for the most recent frame using an exponentially weighted average of over 30 frames (equivalent to 1 s) to mitigate this noise. Subsequently, this data underwent an additional moving average and smoothing process to determine the amplitude used for calculating the final heart rate change, as illustrated by the graph labeled “freq mv” in Figure 5. We calculated the first derivative of “freq mv” and applied a moving average to this derivative, resulting in “freq diff mv” to incorporate the directionality of heart rate change relative to the amount of movement, as shown in Figure 5. By multiplying “freq mv” and “freq diff mv” and applying a scaling factor of 0.3, we obtained the frame-by-frame heart rate change. The scaling factor of 0.3 is obtained by dividing the variance of the label by the HR variance. This value enables the proposed model to effectively estimate the heart rate corresponding to the dominant frequency. Finally, the HR variance is continuously added to the previous heart rate estimates to estimate the current heart rate.

3. Results and Discussion

To ensure a fair comparison, all tests were conducted under identical conditions. The code was implemented in Python 3.10 using the Spyder IDE. The computer used for testing was equipped with an AMD Ryzen 9 7950X CPU and 64 GB of memory. We utilized the rPPG-toolbox to conduct benchmark tests. This is a validated library that implements the rPPG algorithms we described earlier in the introduction [22]. By using this library, we were able to reduce the time required to create a pipeline for benchmarking and avoid potential errors in the implementation of existing rPPG algorithms that could lead to unreasonable performance degradation.

3.1. Total Comparison

Table 4, Table 5 and Table 6 present the overall results calculated using Mean Absolute Error (MAE), Root Mean Square Error (RMSE), and Pearson’s correlation coefficient. In the tables, the “Speed” column represents the speed ranges into which the data points were divided, and ‘Average’ denotes the overall mean. The “rPPG algorithm” indicates that the results listed from the row immediately below it to the row above ‘Proposed model’ correspond to the outcomes from rPPG-based algorithms. The specific rPPG algorithms used are listed immediately below the ‘rPPG algorithm’ row. Additionally, beneath the ‘Proposed model’ row, the names of the respective rPPG algorithms are listed, indicating that the initial heart rate for the proposed algorithm in this study was set to the estimated values from rPPG algorithms. In other words, when the treadmill began operating at 3 km/h, the heart rate estimated by the rPPG algorithm was designated as the initial value for the proposed algorithm presented in this paper. The accuracy for each velocity category was assessed based on speed labels. Our algorithm showed higher accuracy than the existing rPPG algorithms. However, the improvement was attributable to the proposed algorithm for determining the initial heart rate using a treadmill speed index starting at 3 km/h. In other words, we included cases where our algorithm established the initial heart rate when the rPPG algorithm estimates were less accurate. Since our algorithm estimates heart rate under conditions of significant motion when an initial value is provided, the accuracy can be improved by using the more precise heart rate values obtained from the rPPG algorithm during periods of minimal or no subject movement as the initial input for the proposed model. Therefore, to evaluate the accuracy of the proposed algorithm under optimal initialization conditions, rather than an arbitrary initial value determined at a treadmill speed of 3 km/h, it was necessary to utilize initial heart rate values obtained when the rPPG algorithm provided accurate estimations. The algorithm provides accurate estimates. The differences in results between these two scenarios are illustrated in Figure 5.

3.2. Improved Initialization

When the absolute difference between the output of the rPPG algorithm and the label is less than 10, please refer to Table 7, Table 8 and Table 9 for the performance tables detailing the initiation of heart rate estimation using the proposed algorithm. In this scenario, performance improved compared to starting the estimation immediately with the proposed algorithm for a treadmill speed of 3 km/h. Figure 6 illustrates the impact of changes in the initial value on the overall prediction results.
As shown in Figure 6, the overall appearance of the prediction graphs did not differ significantly from the previous ones. This finding is because the data used by the proposed algorithm consists solely of movement data collected from the facial coordinates of individuals in the video. Therefore, in Figure 6a,b, the frequency variations of the movement data corresponding to the start of the heart rate estimation by the proposed algorithm are uniformly applied as negative values. However, since Figure 6b lacks the values that should be smoothed together with the existing heart rate fluctuations, the predicted heart rate decreases with a steep downward slope from the initial value.
Figure 7 illustrates the residual distributions for each heart rate estimation algorithm. The proposed model demonstrates a median value closest to zero, with its interquartile range (IQR) also concentrated near zero, outperforming other rPPG algorithms in this regard. However, in the box of the proposed model, the lower bound and the Q1 value are farther from the median compared to the upper bound and the Q3 value. This contrasts with other rPPG algorithms, which exhibit a roughly symmetrical distribution around the median. We believe this result arises from the insufficient modeling of the time delay between changes in exercise and their impact on heart rate. In reality, heart rate does not respond immediately to changes in physical activity [23]. To account for this characteristic, we incorporated filters into the model, as described in Section 2.2.2. Nevertheless, it appears that this modeling was insufficient to fully capture the actual delay effects on heart rate. Future research could focus on better modeling the delay in heart rate changes caused by physical activity.

3.3. Hardware Usage

The proposed model’s resource usage was as follows: it ran as a single process, utilizing an average of 93.01% of one CPU core and consuming approximately 348.20 MB of memory. No GPU was utilized. Since the proposed model’s computations primarily involve FFT and a few filters, memory consumption remained minimal, except for the process of extracting RGB signals from skin pixels in the video.

4. Conclusions

This study demonstrated that the heart rate estimation algorithm based on an unsupervised learning approach achieved superior accuracy compared to the existing rPPG-based algorithms under conditions of significant motion-induced video blurring. However, these results are based on heart rate estimates from the traditional rPPG-based algorithm. Additionally, due to the sensitivity of the proposed algorithm to the initial values, the accuracy of the proposed algorithm increases in tandem with the accuracy of the existing rPPG-based algorithm. In conclusion, the proposed algorithm outperformed conventional rPPG-based algorithms for situations involving vigorous treadmill exercises— the intensity of movements increased. Therefore, by using the existing rPPG-based algorithm at lower speeds and switching to the proposed algorithm as the speed increased, a relatively accurate heart rate was provided, even when there was more motion noise than traditional methods during treadmill exercise.

Author Contributions

Conceptualization, Y.N., S.K., C.P. and R.S.; Methodology, Y.N., J.L. (Jihong Lee) and J.L. (Junghwan Lee); Software, Y.N., J.L. (Jihong Lee) and J.L. (Junghwan Lee); Validation, Y.N., J.L. (Jihong Lee) and J.L. (Junghwan Lee); Resources, J.L. (Jihong Lee), D.K., H.L. and M.Y.; Data curation, Y.N., J.L. (Jihong Lee), J.L. (Junghwan Lee), D.K. and M.Y.; Writing—original draft, Y.N., J.L. (Junghwan Lee) and H.L.; Writing—review & editing, Y.N., J.L. (Junghwan Lee) and J.L. (Jihong Lee); Visualization, J.L. (Junghwan Lee), J.L. (Jihong Lee) and M.Y.; Supervision, C.P. and R.S.; Funding acquisition, S.K. All authors have read and agreed to the published version of the manuscript.

Funding

This work was supported by the National Research Foundation of Korea (NRF) grant funded by the Korean government (MSIT) (No. RS-2022-00165231). This work was supported by the National Research Foundation of Korea (NRF) grant funded by the Korea government (MSIT) (No.RS-2023-00244176). And this research was supported by the MOTIE (Ministry of Trade, Industry, and Energy) in Korea, under the Fostering Global Talents for Innovative Growth Program (P0017308) supervised by the Korea Institute for Advancement of Technology (KIAT).

Institutional Review Board Statement

This experiment was conducted with the approval of Kwangwoon University’s Institutional Review Board (IRB No. 7001546-202400329-HR(SB)-003-01, 29 February 2024).

Informed Consent Statement

Informed consent was obtained from all subjects involved in the study.

Data Availability Statement

Data are contained within the article.

Acknowledgments

The authors express sincere gratitude to Professor Ivan V. Bajić for his invaluable mentorship during the visiting research period, which enhanced the image data analysis skills that contributed significantly to this work.

Conflicts of Interest

Authors Minsoo Yeo and Sayup Kim were employed by the company Draxfit Co., Ltd. Authors Ryanghee Sohn and Cheolsoo Park were employed by the company Emma Healthcare Co., Ltd. The remaining authors declare that the research was conducted in the absence of any commercial or financial relationships that could be construed as a potential conflict of interest.

Abbreviations

The following abbreviations are used in this manuscript:
PPGphotoplethysmography
rPPGremote photoplethysmography
ECGelectrocardiography
HRheart rate
BVPblood volume pulse
BSSblind source separation
ICAindependent component analysis
IQRinterquartile range
CHROMchrominance based rppg
LGIlocal group invariance
OMITorthogonal matrix image transformation
POSplane orthogonal to skin
MAEmean absolute error
RMSEroot mean squared error

References

  1. Cai, Y.; Wang, Z.; Zhang, W.; Kong, W.; Jiang, J.; Zhao, R.; Wang, D.; Feng, L.; Ni, G. Estimation of heart rate and energy expenditure using a smart bracelet during different exercise intensities: A reliability and validity study. Sensors 2022, 22, 4661. [Google Scholar] [CrossRef] [PubMed]
  2. Task Force of the European Society of Cardiology; The North American Society of Pacing and Electrophysiology. Heart rate variability: Standards of measurement, physiological interpretation, and clinical use. Circulation 1996, 93, 1043–1065. [Google Scholar] [CrossRef]
  3. Kim, J.-S.; Lee, K.-Y. A comparative study on the optimal model for abnormal detection event of heart rate time series data based on the correlation between PPG and ECG. J. Internet Comput. Serv. 2019, 20, 137–142. [Google Scholar]
  4. Verkruysse, W.; Svaasand, L.O.; Nelson, J.S. Remote plethysmographic imaging using ambient light. Opt. Express 2008, 16, 21434–21445. [Google Scholar] [CrossRef] [PubMed]
  5. Wang, W.; den Brinker, A.C.; Stuijk, S.; de Haan, G. Algorithmic principles of remote PPG. IEEE Trans. Biomed. Eng. 2016, 64, 1479–1491. [Google Scholar] [CrossRef] [PubMed]
  6. Ha, J.W.; Kim, J.O. Review of spatial and temporal color constancy. IEIE Trans. Smart Process. Comput. 2023, 12, 390–397. [Google Scholar] [CrossRef]
  7. Islam, M.; Nayan, N.M.; Islam, A.; Sikder, S.; Rashel, M.R.; Alam, M.Z. Recent advancements of computer vision in healthcare: A systematic review. IEIE Trans. Smart Process. Comput. 2024, 13, 562–571. [Google Scholar]
  8. Wei, S.; Wang, H. Moving image information-fusion-analysis algorithm based on multi-sensor. IEIE Trans. Smart Process. Comput. 2023, 12, 300–311. [Google Scholar] [CrossRef]
  9. Chakraborty, M. Rule extraction from convolutional neural networks for heart disease prediction. Biomed. Eng. Lett. 2024, 14, 649–661. [Google Scholar] [CrossRef] [PubMed]
  10. Wang, M.; Li, G.; Yang, Y.; Yang, Y.; Yongkang, F.; Yashuang, L.; Guoli, L.; Dongmei, H. Automated analysis of fetal heart rate baseline/acceleration/deceleration using MTU-Net3+ model. Biomed. Eng. Lett. 2024, 14, 1037–1048. [Google Scholar] [CrossRef] [PubMed]
  11. Poh, M.Z.; McDuff, D.J.; Picard, R.W. Advancements in noncontact, multiparameter physiological measurements using a webcam. IEEE Trans. Biomed. Eng. 2010, 58, 7–11. [Google Scholar] [CrossRef] [PubMed]
  12. Pilz, C.S.; Zauseder, S.; Krajewski, J. Local group invariance for heart rate estimation from facial videos in the wild. In Proceedings of the IEEE Conference on Computer Vision and Pattern Recognition Workshops, Salt Lake City, UT, USA, 18–22 June 2018; pp. 1254–1262. [Google Scholar]
  13. Casado, C.A.; López, M.B. Face2PPG: An unsupervised pipeline for blood volume pulse extraction from faces. IEEE J. Biomed. Health Inform. 2023, 27, 5530–5541. [Google Scholar] [CrossRef] [PubMed]
  14. De Haan, G.; Van Leest, A. Improved motion robustness of remote PPG using blood volume pulse signature. Physiol. Meas. 2014, 35, 1913. [Google Scholar] [CrossRef] [PubMed]
  15. De Haan, G.; Jeanne, V. Robust Pulse Rate From Chrominance-Based rPPG. IEEE Trans. Biomed. Eng. 2013, 60, 2878–2886. [Google Scholar] [CrossRef] [PubMed]
  16. Tang, J.; Chen, K.; Wang, Y.; Shi, Y.; Patel, S.; McDuff, D. Mmpd: Multi-domain mobile video physiology dataset. In Proceedings of the 2023 45th Annual International Conference of the IEEE Engineering in Medicine & Biology Society (EMBC), Sydney, Australia, 24–27 July 2023; pp. 1–5. [Google Scholar]
  17. Stricker, R.; Müller, S.; Gross, H.-M. Non-contact video-based pulse rate measurement on a mobile service robot. In Proceedings of the 23st IEEE Symposium on Robot and Human Interactive Communication, Edinburgh, UK, 25–29 August 2014. [Google Scholar]
  18. Lugaresi, C.; Tang, J.; Nash, H.; McClanahan, C.; Uboweja, E.; Hays, M.; Zhang, F.; Chang, C.-L.; Yong, M.; Lee, J.; et al. Mediapipe: A framework for perceiving and processing reality. In Proceedings of the Third Workshop on Computer Vision for AR/VR at IEEE Computer Vision and Pattern Recognition (CVPR), Long Beach, CA, USA, 17 June 2019. [Google Scholar]
  19. Face Landmarker|Google AI Edge. Available online: https://storage.googleapis.com/mediapipe-assets/documentation/mediapipe_face_landmark_fullsize.png (accessed on 31 December 2024).
  20. Park, S.; Kim, B.-K.; Dong, S.-Y. Self-supervised RGB-NIR Fusion video transformer framework for rPPG Estimations. IEEE Trans. Instrum. Meas. 2022, 71, 3217867. [Google Scholar] [CrossRef]
  21. Boccignone, G.; Conte, D.; Cuculo, V.; D’ Amelio, A.; Grossi, G.; Lanzarotti, R.; Mortara, E. pyVHR: A Python framework for remote photoplethymography. PeerJ Comput. Sci. 2022, 8, e929. [Google Scholar] [CrossRef] [PubMed]
  22. Liu, X.; Narayanswamy, G.; Paruchuri, A.; Zhang, X.; Tang, J.; Zhang, Y.; Sengupta, R.; Patel, S.; Wang, Y.; McDuff, D. rppg-toolbox: Deep remote PPG toolbox. In Proceedings of the Advances in Neural Information Processing Systems 36 (NeurIPS 2023), New Orleans, LA, USA, 10–16 December 2023. [Google Scholar]
  23. Javorka, M.; Zila, I.; Balharek, T.; Javorka, K. Heart rate recovery after exercise: Relations to heart rate variablility and complexity. Braz. J. Med. Biol. Res. 2002, 35, 991–1000. [Google Scholar] [CrossRef] [PubMed]
Figure 1. The official polygon structure of MediaPipe’s FaceMesh, which utilizes a detailed mesh of 468 points of 3D facial landmarks [19].
Electronics 14 00890 g001
Figure 2. (a) A figure displaying the STFT result for one of the data samples and the main frequency over time indicated by a red line labeled “Max Amplitude Frequency”. (b) This figure illustrates the similarity between the labeled heart rate and the maximum frequency over time. The red-colored graph represents the plot of the maximum amplitude frequency over time, which is directly taken from the maximum frequency identified in (a), and the red tick marks on the left denote the corresponding y-axis. The blue graph depicts the labeled heart rate, and its y-axis corresponds to the blue tick marks on the right.
Electronics 14 00890 g002
Figure 3. (a) Time-series facial coordinate data. (b) Preprocessed time-series facial coordinate data.
Electronics 14 00890 g003
Figure 4. A graph of residuals plotted as a box plot.
Electronics 14 00890 g004
Figure 5. A graph of the values of the internal variables of the proposed model. ‘freq mv’ was drawn at one-tenth of its actual size to be plotted alongside the other variables.
Electronics 14 00890 g005
Figure 6. (a) Heart rate prediction results of the proposed algorithm when the initial value is set to the rPPG algorithm’s heart rate estimate at a treadmill speed of 3 km/h. (b) When the initial value is set to rPPG estimates with an accuracy of MAE < 10. (a) Initialization with the heart rate at the point when the treadmill speed reaches 3 km/h. (b) Initialization of the proposed algorithm with the heart rate value when the predicted heart rate MAE of the rPPG algorithm is <10.
Electronics 14 00890 g006
Figure 7. The graph of residuals plotted as box plots.
Electronics 14 00890 g007
Table 1. Pearson correlation coefficient values between the main frequency components of facial coordinate movements and heart rate labels.
Pearson Correlation for Each Treadmill Speed of All Data Types
Speed3 km/h5 km/h7 km/h9 km/hFull range
Pearson correlation0.010.370.630.570.74
Table 2. The Pearson correlation for data where treadmill speed and heart rate consistently increase.
Pearson Correlation for Each Treadmill Speed of Data Types 1, 2
Speed3 km/h5 km/h7 km/h9 km/hFull range
Pearson correlation−0.040.320.600.480.84
Table 3. The Pearson correlation for data where treadmill speed and heart rate first increase and then decrease.
Pearson Correlation for Each Treadmill Speed of Data Type 3
Speed3 km/h5 km/h7 km/h9 km/hFull range
Pearson correlation0.040.490.690.650.32
Table 4. The table shows the heart rate estimates obtained using the rPPG algorithm’s heart rate estimate at a treadmill speed of 3 km/h as the initial value for the proposed algorithm to predict subsequent heart rates, along with the calculated MAE.
3 km/h Point Initialization MAE Table (bpm)
rPPG algorithm
SpeedCHROMGREENICALGIOMITPBVPOS
3 km/h40.1439.2740.4140.7141.8540.7239.93
5 km/h55.5755.5156.4356.7856.9556.3256.40
7 km/h68.3369.0569.6969.4569.1370.2569.76
9 km/h105.09104.39105.76105.86106.46105.37104.99
Average50.5151.9753.0352.8453.4152.9152.68
Proposed Model
SpeedCHROMGREENICALGIOMITPBVPOS
3 km/h30.5529.9331.8833.7030.5934.7429.77
5 km/h32.1731.6332.3934.9630.5534.5831.16
7 km/h43.6844.8345.8448.6346.2148.6343.43
9 km/h40.5040.5045.0949.7840.5049.7840.50
Average31.8631.7332.6534.8131.9335.2831.26
Table 5. The table shows the heart rate estimates obtained using the rPPG algorithm’s heart rate estimate at a treadmill speed of 3 km/h as the initial value for the proposed algorithm to predict subsequent heart rates, along with the calculated RMSE.
3 km/h Point Initialization RMSE Table (bpm)
rPPG algorithm
SpeedCHROMGREENICALGIOMITPBVPOS
3 km/h41.2940.0041.5542.2143.9042.4240.89
5 km/h56.1855.8957.2257.9958.5657.6757.03
7 km/h68.9169.4370.4370.7270.6871.4770.33
9 km/h105.39104.46105.94106.44107.06105.91105.28
Average53.2254.7956.1056.3257.0756.4055.60
Proposed Model
SpeedCHROMGREENICALGIOMITPBVPOS
3 km/h31.3830.8432.7434.5131.4335.5130.65
5 km/h32.7932.4633.2635.7431.3635.3131.98
7 km/h44.5045.8346.9349.6247.0649.6244.46
9 km/h42.6142.6146.6951.2342.4851.2342.61
Average33.7933.9934.8636.9234.2737.3433.53
Table 6. The table shows the heart rate estimates obtained using the rPPG algorithm’s heart rate estimate at a treadmill speed of 3 km/h as the initial value for the proposed algorithm to predict subsequent heart rates, along with the calculated Pearson correlation coefficient.
3 km/h Point Initialization Pearson Table (bpm)
rPPG algorithm
SpeedCHROMGREENICALGIOMITPBVPOS
3 km/h----0.00−0.02-
5 km/h-------
7 km/h----−0.01--
9 km/h−0.09-−0.03−0.050.04−0.06−0.08
Average--0.000.000.000.01-
Proposed Model
SpeedCHROMGREENICALGIOMITPBVPOS
3 km/h0.410.410.410.410.410.410.41
5 km/h0.690.710.710.710.710.710.71
7 km/h0.640.700.700.700.700.700.70
9 km/h0.360.360.360.360.360.360.36
Average0.890.900.900.900.900.900.90
Table 7. This table presents the MAE results of heart rate estimations based on the improved initial values, where the proposed algorithm is initialized using rPPG algorithm estimates with an MAE < 10.
rPPG bpm MAE < 10 Initialization MAE Table (bpm)
rPPG algorithm
SpeedCHROMGREENICALGIOMITPBVPOS
3 km/h40.5332.4141.9641.4241.7941.6338.73
5 km/h57.0554.2056.5656.9356.9454.8455.27
7 km/h72.8261.8372.0967.6467.2664.2376.72
9 km/h105.09110.38105.7697.00106.46101.65104.99
Average49.6545.0551.9353.4152.9351.2550.75
Proposed Model
SpeedCHROMGREENICALGIOMITPBVPOS
3 km/h12.7712.4017.2115.7919.0217.0415.25
5 km/h20.0321.1722.6119.7529.4316.8221.95
7 km/h24.8619.9529.4825.4723.3917.3428.15
9 km/h22.4211.5522.4822.2915.8921.7325.03
Average17.2118.5719.9519.9126.3918.7721.11
Table 8. This table presents the RMSE results of heart rate estimations based on the improved initial values, where the proposed algorithm is initialized using rPPG algorithm estimates with an MAE < 10.
rPPG bpm MAE < 10 Initialization RMSE Table (bpm)
rPPG algorithm
SpeedCHROMGREENICALGIOMITPBVPOS
3 km/h41.8533.5343.5143.1343.9243.5640.17
5 km/h57.7054.6557.3358.1458.5556.2955.94
7 km/h73.4262.2072.7468.9968.9265.4577.20
9 km/h105.39110.57105.9498.18107.06102.20105.28
Average52.5248.9554.8156.8056.5154.6553.72
Proposed Model
SpeedCHROMGREENICALGIOMITPBVPOS
3 km/h13.7613.5618.2916.7520.5518.4516.22
5 km/h20.8922.3923.5920.8330.4017.8922.99
7 km/h26.1121.1530.5226.6024.8018.8229.51
9 km/h24.2912.1724.5624.7818.2623.2826.98
Average19.4721.7222.3622.4229.1421.6123.77
Table 9. This table presents the Pearson correlation results of heart rate estimations based on the improved initial values, where the proposed algorithm is initialized using rPPG algorithm estimates with an MAE < 10.
rPPG bpm MAE < 10 Initialization Pearson Table
rPPG algorithm
SpeedCHROMGREENICALGIOMITPBVPOS
3 km/h-------
5 km/h−0.01-−0.060.02−0.04--
7 km/h-----0.01-
9 km/h--0.00-0.00−0.130.06
Average−0.09−0.15−0.03−0.060.04−0.04−0.08
Proposed Model
Speed-GREENICALGIOMITPBVPOS
3 km/h-------
5 km/h0.530.21-----
7 km/h0.790.610.570.710.670.670.79
9 km/h0.600.810.710.740.750.810.65
Average0.360.880.360.060.360.710.36
Disclaimer/Publisher’s Note: The statements, opinions and data contained in all publications are solely those of the individual author(s) and contributor(s) and not of MDPI and/or the editor(s). MDPI and/or the editor(s) disclaim responsibility for any injury to people or property resulting from any ideas, methods, instructions or products referred to in the content.

