Abstract
Synthetic aperture radar (SAR) systems, as wideband radar systems, are inherently susceptible to interference signals within their operational frequency band, which significantly affects SAR signal processing and image interpretation. Recent studies have demonstrated that semiparametric methods (e.g., the RPCA method) exhibit excellent performance in suppressing these interference signals. However, these methods predominantly focus on processing SAR’s raw echo data, which does not satisfy the sparsity requirements and entails extremely high computational complexity, complicating integration with imaging algorithms. This paper introduces an effective method for suppressing interference signals by leveraging the sparsity of the SAR image domain. It utilizes the sparsity of the interference signal in the two-dimensional frequency domain, following focusing processing, rather than relying on low-rank properties. This approach significantly reduces the computational complexity. Ultimately, the effectiveness and efficiency of the proposed algorithm are validated through experiments conducted with simulated and real SAR data.
1. Introduction
Synthetic aperture radar (SAR) has attracted considerable attention in recent decades due to its capabilities for all-weather, all-day operations and high-resolution imaging [1,2,3,4]. However, as a broadband radar system, SAR inevitably encounters interference signals within its operating band. This interference can significantly affect imaging processing, system synchronization [5], and various other aspects of performance. In SAR images, these interference signals often appear as a series of bright lines, which can significantly degrade the quality of the SAR imagery [6]. As a result, the suppression of interference signals in SAR has emerged as a critical area of current research.
SAR interference signals [7,8,9] can be broadly categorized into two types on the basis of their origin: internal interference signals and external interference signals. Internal interference signals in SAR primarily refer to those generated within the SAR system itself, which adversely affect the system’s performance. These signals may originate from various components of the system, such as the transmitter, receiver, or signal processing unit. In contrast, external interference signals mainly consist of unintended signals from the spatial environment. These signals may emanate from other electronic devices, communication systems, or environmental factors, thereby negatively impacting the normal operation of the SAR system.
Currently, researchers have conducted extensive observations of interference signals in space, noting the prevalence of these signals across nearly all frequency bands. In particular, radar systems operating in lower frequency bands, such as the L-band [10], are more susceptible to interference. However, as the field of electromagnetic waves continues to evolve, the range of interference signal frequency bands is expanding to include the C-band [11], X-band [12], and even the K-band [13]. Due to the broad spectrum of jamming signals, various types of spaceborne SAR systems, including Sentinel-1 [14], GF-3 [15], and TerraSAR-X [16], as well as airborne SAR systems [17], are likely to encounter significant amounts of interference. This interference can adversely affect the quality of SAR images and the overall performance of the systems.
Interference suppression methods for SAR can be classified into three categories: nonparametric, parametric, and semiparametric methods [18]. Nonparametric methods are the simplest among these, as they do not require the establishment of a parametric model. Instead, they leverage the characteristics of the interference signal in either the time domain or other transform domains for suppression. A typical example of this is the frequency domain notch filtering method (FNF) [19], which relies on a priori knowledge to identify the frequency of the interfering signal. It constructs a notch filter directly in the distance frequency domain, effectively filtering out the interfering signal along with the desired signal. Similarly, methods such as eigenspace projection (ESP) [20] and adaptive filtering [21] create notches at specific frequency points of the echo signal or within certain subspaces, facilitating the suppression of the interference signal. However, a significant drawback of these methods is that they may inadvertently filter out the effective SAR signal during the process of interference suppression, leading to a loss of SAR signal integrity and potentially raising the image noise floor.
In contrast, parametric methods utilize prior knowledge to model the interference signal, estimating the corresponding parameters through techniques such as the parametric maximum likelihood method (PML) [22] and the iterative adaptive method (IAA) [23]. Subsequently, these methods sequentially eliminate the interference. For instance, reference [24] proposes a radio frequency interference (RFI) suppression method that combines the IAA with orthogonal subspace projection (OSP). This approach first employs IAA for adaptive estimation of RFI and then applies the OSP method to suppress the interference signals. Nonetheless, the effectiveness of parametric methods is contingent upon the accuracy of the initial signal modeling, posing challenges in complex scenarios. Conversely, semiparametric interference suppression methods do not directly model the interference signal; rather, they iteratively solve the problem by establishing an optimization model aimed at interference suppression. This approach maximizes the retention of effective echo signals while eliminating interference, which has garnered significant attention in the field.
With the rise of compressed sensing, robust principal component analysis (RPCA) has emerged as a commonly used semiparametric method and has been widely applied in the field of SAR signal processing [25,26,27,28,29]. In comparison to synthetic aperture radar (SAR) signals, the spectrum of interference signals is notably narrow, rendering it sparse in the signal frequency domain. Furthermore, over a synthetic aperture time period, the interference signal exhibits slow changes or remains nearly unchanged relative to the SAR signal. Consequently, when the signals received by the SAR system are organized into a two-dimensional matrix, this matrix demonstrates both sparsity and low rank, thereby facilitating the suppression of interference signals. A prominent method in this context is RPCA [30,31,32,33], which safeguards the target echo by optimizing the low rank of the interference signal while incorporating a sparse regularization penalty term for the echo signal. In [34], the row sparsity property is leveraged to concurrently constrain the low rank and sparsity of narrowband interference signals. A reweighted scheme is subsequently employed to address the limitations associated with the nuclear norm minimization optimization problem [35]. To enhance the algorithm’s speed, matrix factorization techniques that provide effective interference suppression performance are utilized [36]. Additionally, for the non-bandwidth interference (NBI) suppression challenge, methods such as the atomic norm method [37], the block Bayes method [38], and the tensor recovery method [39] have been proposed. In [40], the first step involves the detection, localization, and extraction of interference signals. Furthermore, in [41], the frequency domain notch filter method’s results are used with the RPCA method to filter out the interfering signals by using the notch filter while protecting the effective signals by using the low-rank sparse optimization. Utilizing their low-rank and sparse characteristics, the interference signals are then separated. Subsequently, a secondary separation of the interference signals is performed, contingent upon the preservation of the effective signals. These methods aim to more accurately represent the low-rank characteristics of interfering signals, although they tend to incur a high computational burden.
With the gradual advancement of deep learning methods, intelligent signal processing has increasingly permeated various fields, and the application of deep learning techniques for SAR interference signal suppression has demonstrated unique advantages. In [42], a U-Net neural network was employed for the suppression of interference signals, resulting in improved suppression effectiveness. Subsequently, an ISEDnet-based interference suppression method was proposed, incorporating an image supervision mechanism to recover target features [43]. In [44], a multi-dimensional calibration and suppression network (MCSNet) was introduced to learn the characteristics of the interference signal, followed by supervised recovery of the original SAR image. In [45], the FuSINet network was proposed to suppress SAR interference signals; it first utilizes a convolutional neural network (CNN) for learning and segmenting the signals to mitigate their impact on the SAR image, followed by the application of a U-former network to restore the affected image regions. However, these methods rely on training and learning from large datasets, which inherently limits their interpretability and, consequently, their broader applicability.
The previous methods exhibit several limitations. For instance, nonparametric methods tend to lose effective signals, while parametric methods rely heavily on prior knowledge. Additionally, the existing semiparametric methods suffer from unreasonable assumptions and low computational efficiency, although they demonstrate relatively high algorithm performance and robustness. This paper aimed to enhance and optimize the semiparametric method by proposing an efficient, robust, and effective SAR jamming suppression technique that preserves the effective signal. The main contributions of the proposed method are as follows. (1) It utilizes the structural sparsity of the focused SAR image in the range-Doppler (RD) domain to replace the unreasonable sparsity of the echo signal, thereby further protecting the effective SAR echo signal and improving the quality of the SAR image’s post-interference suppression; (2) the optimization of the low rank of the interference signal typically necessitates matrix decomposition, which significantly increases the computational complexity. To address this, the proposed method leverages the sparsity of the interference signal in the two-dimensional frequency domain, effectively reducing the algorithm’s computational complexity. The proposed method can successfully restore SAR images across various signal-to-noise ratio (SINRs) and demonstrates significant advantages in terms of the root mean square error (RMSE), image entropy, and operational time.
The organization of this paper is structured as follows. Section 2 presents the SAR signal model with interference and analyzes the characteristics of both the interference signals and the SAR signals. Section 3 demonstrates the theoretical derivation and workflow of the proposed method. Section 4 discusses the processing results obtained from the proposed algorithm, applied to both simulated and measured data. Finally, Section 5 provides a summary of the entire paper.
2. Signal Model
The interference signals encountered in the SAR system primarily originate from unintentional signals present in the electromagnetic environment, as well as from interference generated internally within the system. For airborne equipment, the predominant sources of unintentional signals in the electromagnetic environment include ground radar, communication base stations, and other terrestrial sources, as illustrated in Figure 1. The airborne SAR system transmits wideband signals based on a predetermined pointing direction to observe the region of interest. These signals are subsequently reflected off the ground and received again by the SAR system, allowing for the extraction of the effective echo signals. Following the imaging process, SAR images of the region of interest are produced. Likewise, ground radar and communication base stations continuously emit electromagnetic waves into the atmosphere. These unintentional signals are captured by the SAR system as direct waves, merging with the effective signals to create an interfering signal, which in turn impacts the quality of the SAR images for the specified area.
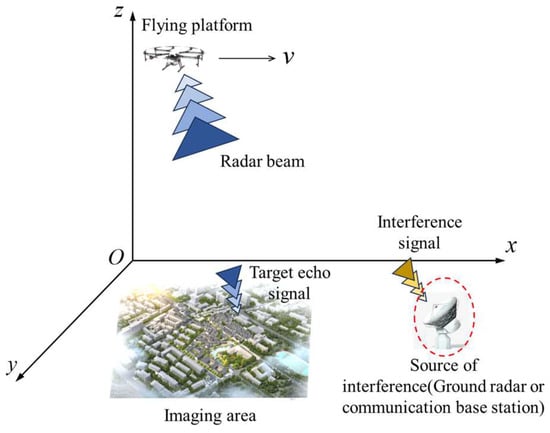
Figure 1.
Source and geometric diagram of interference signals.
Figure 1 illustrates the source of the interfering signals and their geometric relationship with the SAR system. A flying platform equipped with the SAR system travels along the x-axis at a specified altitude and speed, denoted as v. Throughout its flight, the platform continuously emits electromagnetic waves to illuminate the imaging area while also receiving electromagnetic waves from the surrounding environment. Given that ground interference sources are simultaneously transmitting signals, the SAR system captures both the target echo signal and the interference signal concurrently. Consequently, the final processed SAR image is compromised by the interference signal.
The SAR system emits a wide bandwidth signal into the environment, which is reflected by the target and subsequently returns to the radar receiver. The baseband signal can be derived by demodulating the echo. However, due to non-ideal factors within the system, the collected signal represents the aggregate of the target echo signal, interference signal, and noise signal, as illustrated in the following equation [18]
where represents distance time, also known as fast time; represents azimuth time, also known as slow time; and , , and represent the sampling of effective echoes, interference signals, and noise, respectively. Generally speaking, the bandwidth of interference signals is relatively narrow. From the frequency domain perspective, it manifests as some protrusions at certain frequency points or bands.
Interference signals typically include ground radar signals, communication signals, and similar types. In comparison with SAR signals, these interference signals have a significantly smaller bandwidth, often concentrated at a single frequency or a limited number of frequency points within the effective frequency band. Ground radar and communication signals are commonly phase-modulated, frequency-modulated, or multicarrier signals, which can be effectively represented by the following equation [40]
where is the number of external signals (including subcarrier signals, which are treated as an independent external signal here); , , and are the amplitude, envelope, and frequency of the q-th external signal, respectively; and contains the modulation information of external signals. The measured SAR data can be simply divided into two groups based on the bandwidth of the interference signal, namely narrowband interference signals and broadband interference signals. For narrowband interference signals, a simple sine wave signal can be used for modeling, as shown in Equation (2). For broadband interference signals, there are nothing but chirp modulation signals, sine modulation signals, and some communication signals. Figure 2 illustrates the narrowband and broadband interfering signals within the SAR signal spectrum. The red transparent box highlights the frequency domain characteristics of the narrowband interfering signal, while the blue transparent box delineates the spectrum of the broadband interfering signal. The remaining portion, represented by the blue curve not encompassed by the transparent boxes, corresponds to the normal SAR echo signal.
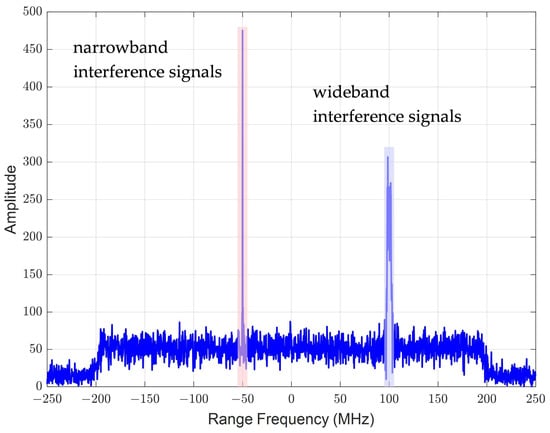
Figure 2.
Narrowband and broadband interference signals in the SAR echo spectrum.
To obtain SAR images for Earth observation, it is essential to perform imaging processing on the collected raw echo data. In SAR imaging processing [46], several key operations are performed, including distance-to-pulse compression, distance migration correction, and orientation compression. These operations primarily involve the echo signal and are executed using the fast Fourier transform (FFT), inverse fast Fourier transform (IFFT), and Hadamard product operations. The FFT and IFFT can be conceptualized as the product of the signal and the Fourier matrix. Furthermore, the Hadamard product operation is inherently linear, allowing us to approximate the imaging processing as linear. Consequently, as shown in Figure 3, after processing echo signals that contain interference, they can still be interpreted as the sum of genuine SAR images, the interference signals that have undergone imaging processing, and noise signals. Given the linear characteristics of imaging processing, the low rank and sparsity of the interference signals remain unaffected.
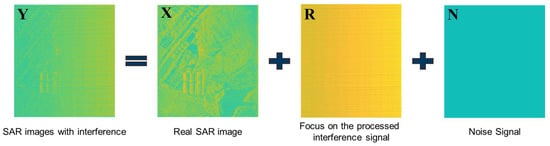
Figure 3.
Modeling diagram of SAR images with interference signals.
To reduce computational complexity while leveraging the relevant characteristics of the SAR image domain, interference suppression is directly applied to the SAR images following imaging processing. Given that imaging processing can be approximated as linear, interference signals maintain a low rank, allowing for the application of the robust principal component analysis (RPCA) method for their suppression. However, this approach inevitably involves matrix decomposition operations, such as singular value decomposition (SVD), which has a computational complexity approximately three times that of the matrix size [47]. Consequently, as the size of the SAR image increases, the practical application of this method becomes challenging. Fortunately, interference signals exhibit not only low rank in the time domain but also sparsity in both the distance and azimuth frequency domains (as shown in Figure 4a). The optimization solution for sparsity can be efficiently calculated using appropriate threshold functions, thereby significantly reducing computational complexity.
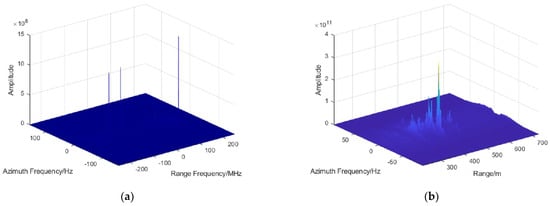
Figure 4.
(a) Two-dimensional spectrum with interference signals and (b) RD domain image not contaminated by interference signals.
Due to the inability of SAR echoes to meet the sparsity requirements, effective protection of the target echoes cannot be achieved during the optimization process. Consequently, it is essential to identify a specific domain exhibiting sparsity and to incorporate a regularization penalty term within this domain to ensure the protection of target echoes. Notably, the SAR image, after focusing, demonstrates greater sparsity compared with the original echo signal; however, this characteristic is less pronounced in complex detection areas, such as urban environments [48]. Nevertheless, the post-focusing SAR image exhibits significant structural sparsity in the RD domain. As shown in Figure 4b, following distance compression and migration correction, the energy of the target echo in the RD domain is concentrated in columns corresponding to the azimuth bandwidth, while the remainder of the Doppler region is zero. Therefore, optimizing the structural sparsity of the SAR image after focusing in the RD domain can effectively facilitate signal protection.
3. Method
According to the previous description, SAR images with interference can be regarded as the sum of real SAR images, interference signals processed by imaging, and noise signals, as follows
where is the two-dimensional complex image data, with M sampling points in the distance and azimuth directions, respectively. In N, each row is sampled data in the distance direction, and each column is sampled data in the azimuth direction; , , and , respectively, represent real SAR images, interference signals, and noise signals. On the basis of the matrix model above, equation constraints are constructed to optimize the correlation characteristics of the interference signal matrix and the real SAR image matrix in certain specific domains, in order to suppress the interference signals without losing the effective echo signals.
Interference signals, which are easy to obtain, exhibit a low rank in the two-dimensional frequency domain. Consequently, the suppression of these interference signals can be accomplished by optimizing their low rank within this domain, as illustrated in the following equation
where is the projection of the interference signal in the two-dimensional frequency domain, is the projection of the SAR image in the RD domain, is the energy of the noise signal, and is regularization parameter. If the Fourier matrices in the distance and azimuth directions are , , then
The Fourier matrix [49] can be expressed in the following form
where is the distance sampling rate and is the azimuthal sampling rate, which is the pulse repetition frequency.
Obviously, this is a bivariate optimization problem that can be solved using the alternating direction method of multipliers (ADMM) [50]. Its augmented Lagrangian function can be written as
where is the sparsity of the quadratic penalty term, which is used to enhance the satisfaction of the constraint conditions. In the iterative calculation of the ADMM, only one variable is updated at each step while fixing the other two variables, so as to alternately update and obtain the optimal solution of the problem. Firstly, we optimize variable as follows
where is the number of iterations, represents the result obtained from the k-th iteration, and the rest of the representations are the same. Finding a closed-form solution for the above equation directly proves to be challenging; therefore, a simplification is warranted. The most complex term in Equation (10) is the second term, which can be substituted with a representation for the memory of the matrix in that term, as illustrated in the following formula
It is then straightforward to simplify by Taylor expanding it at to obtain its Taylor expansion as follows
where is the matrix derivation operator and is the inner product of the matrix. According to the characteristics of the F-norm and Fourier matrix, a simplification can be applied to the expression, resulting in the following
Substituting Equation (14) into Equation (11) yields
where is the soft threshold function [51]. If a is a scalar, it can be calculated using the following equation
where is the sign function. For matrix , the soft threshold function shrinks each element of the matrix separately, defined as
Similarly, it can be calculated as [52]
Afterwards, the auxiliary variable can be iteratively updated
By deriving the optimization problem, we obtain the iterative formula for the method. It is evident that Equations (15), (18), and (19) involve numerous Fourier matrix multiplication operations, which present an opportunity for algorithmic optimization. To enhance the efficiency of the aforementioned method, we can instead utilize the fast Fourier transform (FFT). Therefore, the pseudo code of the proposed method can be written as follows (Algorithm 1).
| Algorithm 1. SAR interference suppression method based on the image domain |
| Input , , |
| User parameters , |
| Initialize , , |
| Repeat |
| Update by ; Update by ; Update by ; Until convergence |
| Output , |
4. Results
In this section, the effectiveness of the proposed method is validated using real SAR data that include interference. Additionally, the robustness of the proposed method is assessed by introducing interference signals with varying SINRs to the real SAR data through simulation.
4.1. Evaluation Criteria
In order to quantitatively evaluate the recovered SAR data or images, this paper selected two evaluation methods. One is used to estimate the RMSE [8,36] of the data, which is used to evaluate the deviation between the recovered SAR data and the real SAR data. Its definition is as follows
where is the real SAR image data and is the SAR image data estimated by the algorithm. Obviously, the smaller the RMSE, the higher the quality of image restoration. However, in practical applications, we cannot obtain SAR images of real scenes that are not affected by interference and pollution. Therefore, it is difficult to effectively evaluate the performance of the algorithm using RMSE. Therefore, it is necessary to introduce an evaluation method for the quality of SAR images themselves. This article uses image entropy [40,41], which is defined as follows
The smaller the image entropy, the more energy is concentrated in a small range of pixels, indicating that the residual interference signal is smaller. Consequently, this paper utilizes RMSE and IE as metrics to evaluate the effectiveness of interference suppression in SAR images.
4.2. Algorithm Effect
To better demonstrate the performance of the proposed method, we utilized a radar system to collect real SAR data. Radar system parameters are shown in Table 1.

Table 1.
Main parameters of radar system.
During the flight, the SAR radar primarily illuminates a rural area. Figure 5 presents both the optical image and the SAR image of the observation area.
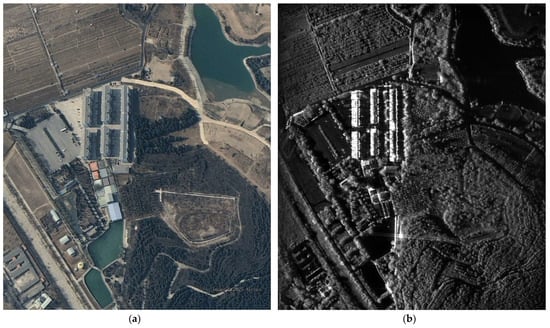
Figure 5.
(a) Optical image of the observation area and (b) SAR image of the observation area (uncontaminated by interference signals).
During data acquisition, an external interference source was simulated that continuously transmitted a single-frequency continuous wave signal at 6.644 GHz to emulate interference signals. However, due to experimental limitations, SAR data under multiple different SINR conditions were not collected. Instead, a series of SAR images with varying SINR levels were generated through semi-physical simulation during data processing to evaluate the algorithm.
Figure 6a–d illustrates the impact of the interference signal on the SAR image across varying SINRs. Notably, even at a SINR of 20 dB, significant streaks are evident in the SAR image. This interference severely hampers the image recognition capabilities, highlighting the urgent need for effective suppression of SAR interference signals. In conjunction with the comparison of the FNF, OSP filtering, and RPCA methods, this study further investigated the superiority of the proposed method. In Figure 6, several areas that require special attention are highlighted. The red box indicates the pond area, which is characterized by the presence of strong scatterers along the shore. The green box denotes the building and parking lot areas, while the yellow box also represents the pond area. However, in contrast to the red box, the yellow box encompasses a larger area and lacks strong scatterers in its vicinity. The comparison results are presented in Figure 6e–t, where Figure 6e–l illustrate the interference suppression effects of the FNF and OSP methods on SAR images with varying SINRs, respectively. It is evident that while both methods effectively filter out interference signals, they do not sufficiently protect the effective signal. This limitation leads to an increase in the image’s baseline noise to some extent and results in the presence of erroneous side flaps at strong scattering points. Additionally, Figure 6m–t depict the interference suppression effects of the RPCA method and the proposed method, respectively. Both methods demonstrate improved interference suppression; however, the proposed method further reduces the side flaps in the images.
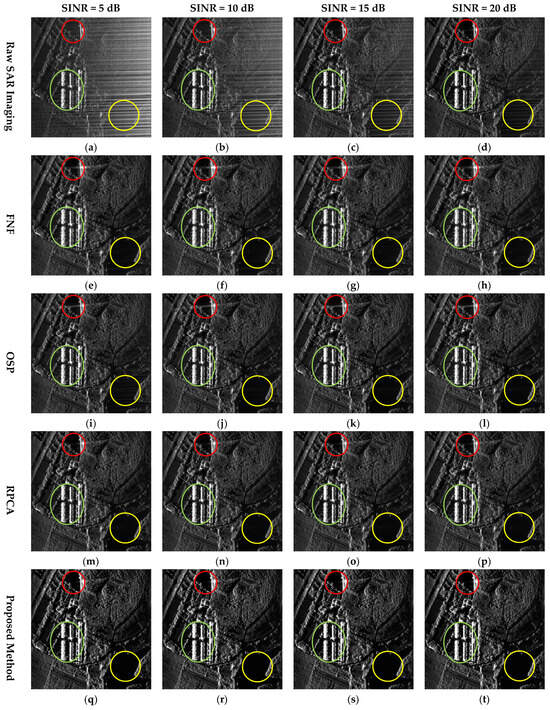
Figure 6.
The interference signal suppression effects of FNF, OSP, RPCA and the proposed method on SAR images with different SINRs. In addition, the areas requiring special attention are highlighted in the figure. The red circle indicates the pond and the nearby strong scatterers, while the green circle denotes the building and parking lot. The yellow circle also represents the pond. (a–t) The interference suppression effect of different methods.
To facilitate a more effective comparison of image quality, two regions of interest were selected for enlargement, as illustrated in Figure 7 and Figure 8. The results demonstrate that the proposed method effectively suppresses interference and restores SAR images across varying SINRs, with the restored image quality remaining largely consistent. In contrast, traditional FNF and OSP methods tend to suppress interference signals at the expense of filtering out effective echo signals, which leads to an increase in background noise and sidelobes in the restored images. This approach may even result in the generation of echoes from some strong targets.
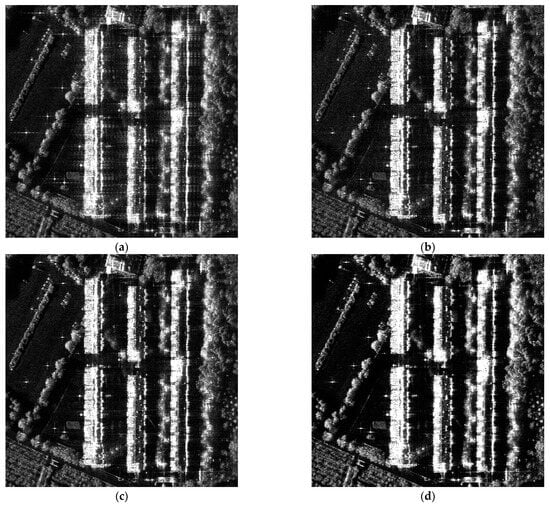
Figure 7.
Enlarged view of the building area. (a–d) The processing results of FNF, OSP, RPCA, and the proposed method on the same SAR image, respectively.
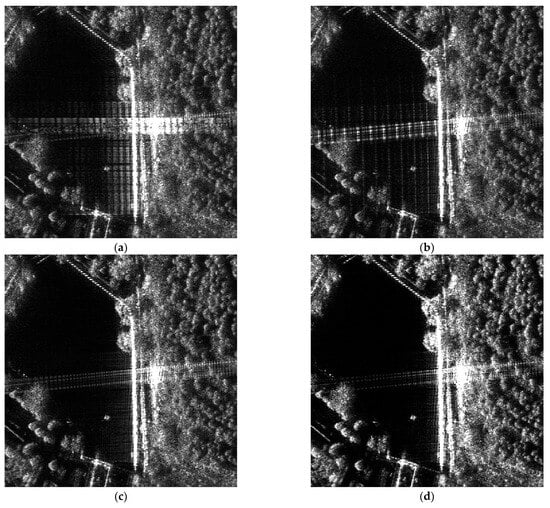
Figure 8.
Enlarged view of the riverbank area. (a–d) The processing results of FNF, OSP, RPCA, and the proposed method on the same SAR image, respectively.
In Figure 9, the azimuthal slice analysis of point targets within the image is presented, with the processing results of the FNF, OSP, and RPCA methods and the proposed method aligned within the same coordinate system to facilitate a comparative analysis of the performance characteristics of various interference suppression techniques. The figure clearly illustrates that the FNF method exhibits a high level of sidelobes, while the bottom noise levels of the OSP and RPCA methods are comparable, albeit still relatively elevated. To better highlight the differences in processing results among the various methods, Figure 9 also includes a zoomed-in view of the distal region in the azimuthal slice. This zoomed-in view more effectively demonstrates that the proposed method possesses superior capability in reducing sidelobes and enhancing the performance of interference suppression compared with the other techniques.
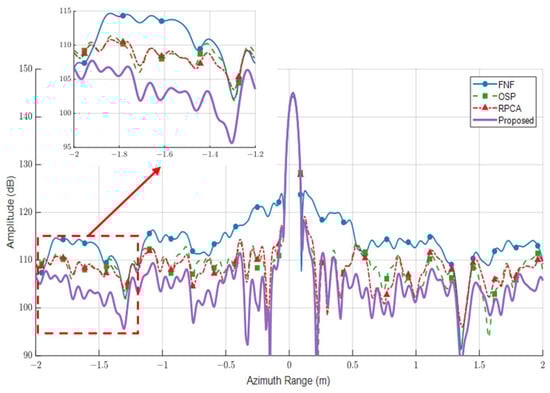
Figure 9.
The interference suppression effects of different methods for point target slicing.
The previous comparisons were qualitative; however, a quantitative comparison can more effectively highlight the differences among the algorithms. Therefore, we employed two selected evaluation metrics (RMSE and IE) to conduct a quantitative comparison between the proposed algorithm and FNF, OSP, and RPCA. The results of this comparison are presented in Table 2. In Table 2, four different SAR images were processed, all covering the same surveillance area (as shown in Figure 5), which includes typical scenes such as buildings, parking lots, ponds, farmland, and forests. Through semi-physical simulation, these four images were assigned varying SINR levels of 5, 10, 15, and 20 dB, respectively. Subsequently, FNF, OSP, RPCA, and the proposed method were applied to process these four images, and the RMSE, image entropy, and runtime of the processing results were recorded. The specific values are detailed in Table 2.
Table 2.
Evaluation metrics for the four methods in the different SINR cases.
The numerical results presented in Table 2 indicate that all four methods effectively suppress interference signals, thereby enhancing the quality of SAR images. The RMSE evaluation metric quantifies the degree of difference between the estimated results and the ground truth. A smaller RMSE signifies that the estimated results are closer to the ground truth, reflecting the superior performance of the method. Table 2 also clearly shows that the proposed method achieves the smallest RMSE, which remains largely consistent despite variations in the images’ SINRs. This further underscores the excellent performance and robustness of the proposed method. Additionally, image entropy reflects the randomness and uncertainty of energy distribution within the image. Specifically, a lower image entropy indicates a more concentrated energy distribution. For the same SAR image, it can be inferred that reduced image entropy corresponds to less noise or interference, resulting in higher image quality. Consequently, the image entropy results processed by different methods in Table 2 further confirm that the proposed method yields more significant and stable results.
Another critical metric of the method is computational complexity, which directly influences the method’s runtime. The core operation of the proposed algorithm involves the 2D Fourier transform of the SAR image, which can be optimized through the fast Fourier transform (FFT). Consequently, its computational complexity can be succinctly expressed as , where M and N represent the number of rows and columns of the input data, respectively. All methods were subsequently tested using MATLAB 2020a on a computer with the following specifications: an i9-10900 CPU operating at 2.80 GHz and equipped with 64.0 GB of RAM. The runtime for each method is detailed in the last row of Table 2.
It is evident that the RPCA method required the longest processing time, primarily due to the extensive number of matrix decomposition operations involved, which contributes to its higher computational complexity. Conversely, the FNF method was the quickest, as it only necessitated two distance-to-Fourier transforms and a single matrix multiplication. It is evident that the proposed method demonstrates significant advantages over both the OSP and RPCA methods; however, it is more time-consuming than the FNF method. Notably, the FNF method necessitates precise a priori knowledge of the frequency of the interfering signal. Additionally, the FNF method results in an elevation of the paraflap in the SAR image, which compromises image quality. In contrast, the proposed method operates with a processing time comparable with that of the FNF method while achieving superior interference suppression.
5. Conclusions
The existence of SAR interference signals significantly affects the accuracy of SAR signal processing and image interpretation. To address this issue, this paper proposes an innovative SAR interference suppression method that substantially reduces the impact of interference signals on actual SAR data, thereby improving the quality and availability of SAR images. The core contribution of this paper lies in extending the sparsity of the interference signal to the two-dimensional frequency domain, which avoids the limitations of traditional low-rank methods, greatly reduces the computational complexity of the algorithm, and significantly enhances the computational efficiency. Additionally, the introduction of sparse regularization techniques into the RD domain of the focused image effectively preserves the integrity of the real SAR data and prevents the loss of useful information. Through simulation experiments and validation with measured data, this method demonstrates significant advantages in interference suppression effectiveness, computational efficiency, and image quality improvement. However, this method still has certain limitations; for instance, it primarily suppresses narrowband interference signals, and its performance may be constrained in extremely complex interference environments. Furthermore, the real-time processing capability of the method for high-resolution SAR data requires further optimization. Future research can investigate the limitations of this method concerning bandwidth, the number of interference signals, and other influencing factors, with the aim of enhancing the robustness and adaptability of interference suppression. Concurrently, the implementation of algorithms based on hardware acceleration (such as GPU or FPGA) should be explored to meet the real-time processing requirements of high-resolution SAR data. This method has been validated by measured data, demonstrating its robustness in complex electromagnetic environments. It is expected that this will further promote its engineering and commercial applications in the future and provide substantial support for the advancement of SAR imaging technology.
Author Contributions
Conceptualization, X.L.; Methodology, X.B.; Software, X.G.; Validation, X.G. and H.L.; Formal analysis, Y.Z.; Investigation, Z.J. and X.B.; Writing—original draft, X.G.; Supervision, X.L. All authors have read and agreed to the published version of the manuscript.
Funding
This research received no external funding.
Data Availability Statement
All data are contained within the article.
Conflicts of Interest
The authors declare no conflicts of interest.
References
- Reigber, A.; Scheiber, R.; Jager, M.; Prats-Iraola, P.; Hajnsek, I.; Jagdhuber, T.; Papathanassiou, K.P.; Nannini, M.; Aguilera, E.; Baumgartner, S.; et al. Very-High-Resolution Airborne Synthetic Aperture Radar Imaging: Signal Processing and Applications. Proc. IEEE 2013, 101, 759–783. [Google Scholar] [CrossRef]
- Moreira, A.; Prats-Iraola, P.; Younis, M.; Krieger, G.; Hajnsek, I.; Papathanassiou, K.P. A Tutorial on Synthetic Aperture Radar. IEEE Geosci. Remote Sens. Mag. 2013, 1, 6–43. [Google Scholar] [CrossRef]
- Deng, Y.; Yu, W.; Zhang, H.; Wang, W.; Liu, D.; Wang, R. Forthcoming Spaceborne SAR Development. Radars 2020, 9, 1–33. [Google Scholar]
- Zhou, F.; Tao, M. Research on Methods for Narrow-Band Interference Suppression in Synthetic Aperture Radar Data. IEEE J. Sel. Top. Appl. Earth Obs. Remote Sens. 2015, 8, 3476–3485. [Google Scholar] [CrossRef]
- Cai, Y.; Li, J.; Yang, Q.; Liang, D.; Liu, K.; Zhang, H.; Lu, P.; Wang, R. First Demonstration of RFI Mitigation in the Phase Synchronization of LT-1 Bistatic SAR. IEEE Trans. Geosci. Remote Sens. 2023, 61, 3310613. [Google Scholar] [CrossRef]
- Tao, M.; Su, J.; Huang, Y.; Wang, L. Mitigation of Radio Frequency Interference in Synthetic Aperture Radar Data: Current Status and Future Trends. Remote Sens. 2019, 11, 2438. [Google Scholar] [CrossRef]
- Li, N.; Lv, Z.; Guo, Z. Observation and Mitigation of Mutual RFI Between SAR Satellites: A Case Study Between Chinese GaoFen-3 and European Sentinel-1A. IEEE Trans. Geosci. Remote Sens. 2022, 60, 3170363. [Google Scholar] [CrossRef]
- Li, N.; Lv, Z.; Guo, Z. Pulse RFI Mitigation in Synthetic Aperture Radar Data via a Three-Step Approach: Location, Notch, and Recovery. IEEE Trans. Geosci. Remote Sens. 2022, 60, 3161368. [Google Scholar] [CrossRef]
- Lv, Z.; Zhang, H.; Li, N.; Guo, Z. A Two-Step Approach for Pulse RFI Detection in SAR Data. In Proceedings of the 2021 IEEE Sensors, Sydney, Australia, 31 October 2021; IEEE: Piscataway, NJ, USA, 2021; pp. 1–4. [Google Scholar]
- Meyer, F.J.; Nicoll, J.B.; Doulgeris, A.P. Correction and Characterization of Radio Frequency Interference Signatures in L-Band Synthetic Aperture Radar Data. IEEE Trans. Geosci. Remote Sens. 2013, 51, 4961–4972. [Google Scholar] [CrossRef]
- Njoku, E.G.; Ashcroft, P.; Chan, T.K.; Li, L. Global Survey and Statistics of Radio-Frequency Interference in AMSR-E Land Observations. IEEE Trans. Geosci. Remote Sens. 2005, 43, 938–947. [Google Scholar] [CrossRef]
- Ellingson, S.W.; Johnson, J.T. A Polarimetric Survey of Radio-Frequency Interference in C- and X-Bands in the Continental United States Using WindSat Radiometry. IEEE Trans. Geosci. Remote Sens. 2006, 44, 540–548. [Google Scholar] [CrossRef]
- Draped, D.W.; De Matthaeis, P. Characteristics of 18.7 GHZ Reflected Radio Frequency Interference in Passive Radiometer Data. In Proceedings of the IGARSS 2019—2019 IEEE International Geoscience and Remote Sensing Symposium, Yokohama, Japan, 28 July–2 August 2019; IEEE: Piscataway, NJ, USA, 2019; pp. 4459–4462. [Google Scholar]
- Li, Y.; Monti Guarnieri, A.; Hu, C.; Rocca, F. Performance and Requirements of GEO SAR Systems in the Presence of Radio Frequency Interferences. Remote Sens. 2018, 10, 82. [Google Scholar] [CrossRef]
- Lv, Z.; Li, N.; Guo, Z.; Zhao, J. Detection and Mitigation of Mutual RFI in C-Band SAR: A Case Study of Chinese GaoFen-3. In Proceedings of the 2021 IEEE Radar Conference (RadarConf21), Atlanta, GA, USA, 7 May 2021; IEEE: Piscataway, NJ, USA, 2021; pp. 1–5. [Google Scholar]
- Nabil, H.; Chen, J.; Kamel, H.; Kuang, H. Bidirectional Notch Filter for Suppressing Pulse Modulated Radio-Frequency-Interference in SAR Data. In Proceedings of the 2014 IEEE Geoscience and Remote Sensing Symposium, Quebec City, QC, Canada, 13–18 July 2014; IEEE: Piscataway, NJ, USA, 2014; pp. 1136–1139. [Google Scholar]
- Tao, M.; Zhou, F.; Zhang, Z. Wideband Interference Mitigation in High-Resolution Airborne Synthetic Aperture Radar Data. IEEE Trans. Geosci. Remote Sens. 2016, 54, 74–87. [Google Scholar] [CrossRef]
- Huang, Y.; Zhao, B.; Tao, M.; Chen, Z.; Hong, W. Review of Synthetic Aperture Radar Interference Suppression. Radars 2020, 9, 86–106. [Google Scholar]
- Cazzaniga, G.; Monti Guarnieri, A. Removing RF Interferences from P-Band Airplane SAR Data. In Proceedings of the IGARSS ’96. 1996 International Geoscience and Remote Sensing Symposium, Lincoln, NE, USA, 27–31 May 1996; IEEE: Piscataway, NJ, USA, 1996; Volume 3, pp. 1845–1847. [Google Scholar]
- Zhou, F.; Wu, R.; Xing, M.; Bao, Z. Eigensubspace-Based Filtering With Application in Narrow-Band Interference Suppression for SAR. IEEE Geosci. Remote Sens. Lett. 2007, 4, 75–79. [Google Scholar] [CrossRef]
- Abend, K.; McCorkle, J.W. Radio and TV Interference Extraction for Ultrawideband Radar; Giglio, D.A., Ed.; SPIE: Orlando, FL, USA, 1995; pp. 119–129. [Google Scholar]
- Vu, V.T.; Sjogren, T.K.; Pettersson, M.I.; Hakansson, L.; Gustavsson, A.; Ulander, L.M.H. RFI Suppression in Ultrawideband SAR Using an Adaptive Line Enhancer. IEEE Geosci. Remote Sens. Lett. 2010, 7, 694–698. [Google Scholar] [CrossRef]
- Yardibi, T.; Li, J.; Stoica, P.; Xue, M.; Baggeroer, A.B. Source Localization and Sensing: A Nonparametric Iterative Adaptive Approach Based on Weighted Least Squares. IEEE Trans. Aerosp. Electron. Syst. 2010, 46, 425–443. [Google Scholar] [CrossRef]
- Liu, Z.; Liao, G.; Yang, Z. Time Variant RFI Suppression for SAR Using Iterative Adaptive Approach. IEEE Geosci. Remote Sens. Lett. 2013, 10, 1424–1428. [Google Scholar] [CrossRef]
- Guo, Y.; Liao, G.; Li, J.; Chen, X. A Novel Moving Target Detection Method Based on RPCA for SAR Systems. IEEE Trans. Geosci. Remote Sens. 2020, 58, 6677–6690. [Google Scholar] [CrossRef]
- Yang, D.; Yang, X.; Liao, G.; Zhu, S. Strong Clutter Suppression via RPCA in Multichannel SAR/GMTI System. IEEE Geosci. Remote Sens. Lett. 2015, 12, 2237–2241. [Google Scholar] [CrossRef]
- Guo, Y.; Liao, G.; Li, J.; Gu, T. A Clutter Suppression Method Based on NSS-RPCA in Heterogeneous Environments for SAR-GMTI. IEEE Trans. Geosci. Remote Sens. 2020, 58, 5880–5891. [Google Scholar] [CrossRef]
- Oveis, A.H.; Sebt, M.A. Dictionary-Based Principal Component Analysis for Ground Moving Target Indication by Synthetic Aperture Radar. IEEE Geosci. Remote Sens. Lett. 2017, 14, 1594–1598. [Google Scholar] [CrossRef]
- Leibovich, M.; Papanicolaou, G.; Tsogka, C. Low Rank Plus Sparse Decomposition of Synthetic Aperture Radar Data for Target Imaging. IEEE Trans. Comput. Imaging 2020, 6, 491–502. [Google Scholar] [CrossRef]
- Joy, S.; Nguyen, L.H.; Tran, T.D. Radio Frequency Interference Suppression in Ultra-Wideband Synthetic Aperture Radar Using Range-Azimuth Sparse and Low-Rank Model. In Proceedings of the 2016 IEEE Radar Conference (RadarConf), Philadelphia, PA, USA, 2–6 May 2016; IEEE: Piscataway, NJ, USA, 2016; pp. 1–4. [Google Scholar]
- Nguyen, L.H.; Dao, M.D.; Tran, T.D. Radio-Frequency Interference Separation and Suppression from Ultrawideband Radar Data via Low-Rank Modeling. In Proceedings of the 2014 IEEE International Conference on Image Processing (ICIP), Paris, France, 27–30 October 2014; IEEE: Piscataway, NJ, USA, 2014; pp. 116–120. [Google Scholar]
- Nguyen, L.H.; Tran, T.; Do, T. Sparse Models and Sparse Recovery for Ultra-Wideband SAR Applications. IEEE Trans. Aerosp. Electron. Syst. 2014, 50, 940–958. [Google Scholar] [CrossRef]
- Liu, H.; Li, D.; Zhou, Y.; Truong, T.-K. Joint Wideband Interference Suppression and SAR Signal Recovery Based on Sparse Representations. IEEE Geosci. Remote Sens. Lett. 2017, 14, 1542–1546. [Google Scholar] [CrossRef]
- Huang, Y.; Liao, G.; Li, J.; Xu, J. Narrowband RFI Suppression for SAR System via Fast Implementation of Joint Sparsity and Low-Rank Property. IEEE Trans. Geosci. Remote Sens. 2018, 56, 2748–2761. [Google Scholar] [CrossRef]
- Huang, Y.; Liao, G.; Xiang, Y.; Zhang, Z.; Li, J.; Nehorai, A. Reweighted Nuclear Norm and Reweighted Frobenius Norm Minimizations for Narrowband RFI Suppression on SAR System. IEEE Trans. Geosci. Remote Sens. 2019, 57, 5949–5962. [Google Scholar] [CrossRef]
- Huang, Y.; Liao, G.; Zhang, Z.; Xiang, Y.; Li, J.; Nehorai, A. Fast Narrowband RFI Suppression Algorithms for SAR Systems via Matrix-Factorization Techniques. IEEE Trans. Geosci. Remote Sens. 2019, 57, 250–262. [Google Scholar] [CrossRef]
- Liu, H.; Gan, L.; Li, D.; Truong, T.-K. RFI Suppression Based on Atomic Norm Minimization in SAR Signal Recovery. In Proceedings of the 2019 IEEE International Conference on Image Processing (ICIP), Taipei, Taiwan, 22–25 September 2019; IEEE: Piscataway, NJ, USA, 2019; pp. 2040–2044. [Google Scholar]
- Lu, X.; Su, W.; Yang, J.; Gu, H.; Zhang, H.; Yu, W.; Yeo, T.S. Radio Frequency Interference Suppression for SAR via Block Sparse Bayesian Learning. IEEE J. Sel. Top. Appl. Earth Obs. Remote Sens. 2018, 11, 4835–4847. [Google Scholar] [CrossRef]
- Huang, Y.; Zhang, L.; Li, J.; Chen, Z.; Yang, X. Reweighted Tensor Factorization Method for SAR Narrowband and Wideband Interference Mitigation Using Smoothing Multiview Tensor Model. IEEE Trans. Geosci. Remote Sens. 2020, 58, 3298–3313. [Google Scholar] [CrossRef]
- Zhang, H.; Min, L.; Lu, J.; Chang, J.; Guo, Z.; Li, N. An Improved RFI Mitigation Approach for SAR Based on Low-Rank Sparse Decomposition: From the Perspective of Useful Signal Protection. Remote Sens. 2022, 14, 3278. [Google Scholar] [CrossRef]
- Fu, Z.; Zhang, H.; Zhao, J.; Li, N.; Zheng, F. A Modified 2-D Notch Filter Based on Image Segmentation for RFI Mitigation in Synthetic Aperture Radar. Remote Sens. 2023, 15, 846. [Google Scholar] [CrossRef]
- Akeret, J.; Chang, C.; Lucchi, A.; Refregier, A. Radio Frequency Interference Mitigation Using Deep Convolutional Neural Networks. Astron. Comput. 2017, 18, 35–39. [Google Scholar] [CrossRef]
- Zhang, H.; Wei, S.; Zhou, Z.; Shi, J.; Zhang, X. Interference Suppression For Sar Image Based On Joint Supervision En-Decoder Network. In Proceedings of the IGARSS 2022—2022 IEEE International Geoscience and Remote Sensing Symposium, Kuala Lumpur, Malaysia, 17 July 2022; IEEE: Piscataway, NJ, USA, 2022; pp. 3416–3419. [Google Scholar]
- Li, X.; Ran, J.; Zhang, H.; Wei, S. MCSNet: A Radio Frequency Interference Suppression Network for Spaceborne SAR Images via Multi-Dimensional Feature Transform. Remote Sens. 2022, 14, 6337. [Google Scholar] [CrossRef]
- Fang, F.; Tian, Y.; Dai, D.; Xing, S. Synthetic Aperture Radar Radio Frequency Interference Suppression Method Based on Fusing Segmentation and Inpainting Networks. Remote Sens. 2024, 16, 1013. [Google Scholar] [CrossRef]
- Shouye, L.V. Long Teng Study on the Airborne SAR Real-Time Imaging System. In Proceedings of the 7th International Conference on Signal Processing, ICSP ’04. 2004, Beijing, China, 31 August–4 September 2004; IEEE: Piscataway, NJ, USA, 2004; Volume 3, pp. 2163–2166. [Google Scholar]
- Brand, M. Fast Low-Rank Modifications of the Thin Singular Value Decomposition. Linear Algebra Its Appl. 2006, 415, 20–30. [Google Scholar] [CrossRef]
- Huang, Y.; Chen, Z.; Wen, C.; Li, J.; Xia, X.-G.; Hong, W. An Efficient Radio Frequency Interference Mitigation Algorithm in Real Synthetic Aperture Radar Data. IEEE Trans. Geosci. Remote Sens. 2022, 60, 3155068. [Google Scholar] [CrossRef]
- Cooley, J.W.; Tukey, J.W. An Algorithm for the Machine Calculation of Complex Fourier Series. Math. Comp. 1965, 19, 297–301. [Google Scholar] [CrossRef]
- Glowinski, R.; Marrocco, A. Sur l’approximation Paréléments Finis d’ordre Un et La Résolution Par Pénalisation-Dualité d’une Classe de Problémes de Dirichlet Non Linéaires. Rev. Française Autom. Inf. Rech. Opér. 1975, 9, 41–76. [Google Scholar]
- Boyd, S. Distributed Optimization and Statistical Learning via the Alternating Direction Method of Multipliers. FNT Mach. Learn. 2010, 3, 1–122. [Google Scholar] [CrossRef]
- Parikh, N. Proximal Algorithms. FNT Optim. 2014, 1, 127–239. [Google Scholar] [CrossRef]
Disclaimer/Publisher’s Note: The statements, opinions and data contained in all publications are solely those of the individual author(s) and contributor(s) and not of MDPI and/or the editor(s). MDPI and/or the editor(s) disclaim responsibility for any injury to people or property resulting from any ideas, methods, instructions or products referred to in the content. |
© 2025 by the authors. Licensee MDPI, Basel, Switzerland. This article is an open access article distributed under the terms and conditions of the Creative Commons Attribution (CC BY) license (https://creativecommons.org/licenses/by/4.0/).