1. Introduction
As the world population ages, people are seeking a better quality of life with greater convenience. Consequently, research on personal service robots is rapidly advancing. These robots operate primarily by receiving user commands and fulfilling user requests.
One of the most critical tasks of these robots is to accurately identify the user’s position to respond effectively to their commands. In this process, the robot determines the user’s location based on sound waves and executes the command. This procedure, known as sound source localization (SSL), enhances the perceptual capabilities of the robot [
1] and significantly strengthens human–robot interaction (HRI) [
2]. SSL is also essential for communicating with the surrounding environment [
3]. SSL has emerged as a key research area in robot audition [
4]. Generalized cross-correlation with phase transform (GCC-PHAT) [
5], multiple signal classifier (MUSIC) [
6], and steered response power with phase transform (SRP-PHAT) [
7] are common traditional SSL methods based on signal processing. Although these methods have demonstrated robust performance in controlled simulated environments, their effectiveness diminishes under real-world conditions.
Real-time SSL for robotic applications encounters numerous challenges. For example, in home environments, ambient noise from sources such as fans or air conditioners causes reverberation. Because SSL systems in robots are generally designed for real-time operations, these environmental factors must be mitigated to accurately localize sound sources. However, traditional SSL methods presented above are vulnerable to noise and reverberation [
8]. To address these challenges, deep learning, which can model nonlinear patterns, has been introduced as a complementary solution.
In contrast to single microphones, robots use microphone arrays to capture sound through multiple channels. In this setup, the sound source’s position is typically estimated by calculating the time difference of arrival (TDOA) across the microphones. A common approach to this calculation is cross-correlation using GCC-PHAT, which is now widely used in SSL research. There are some examples using GCC-PHAT in SSL tasks: Liu et al. [
9] performed SSL using the multi-dimensional matrix GCC-PHAT in an environment with noise and reverberation. Gelderblom et al. [
10] used GCC-PHAT to verify the performance of SSL in various RIRs. Peng and Niu [
11] used GCC-PHAT as the model’s input to perform SSL at various noise levels. Wang et al. [
12] performed SSL using a speech mask extracted form of GCC-PHAT in a robotic environment. Hu et al. [
13] used GCC-PHAT and Mel-spectrogram extracted from sound sources to track the location of sound sources in a residual network using a channel attention mechanism. Before deep learning, studies extracted excitation source information (ESI) from raw sound signals to estimate the azimuth of the source. ESI captures the essential features of sound while reducing noise and reverberation. Research has shown that azimuth estimates based on time differences derived from ESI are more accurate than those calculated directly from raw signals [
14]. SSL research aims to minimize the impacts of noise and reverberation to achieve accurate localization. This study focused on developing a robust SSL system by extracting the ESI, applying the GCC-PHAT algorithm, and using a single-channel multi-input convolutional neural network (CNN) to learn the unique features of each signal. The input sound signal from the microphone array was subjected to linear prediction filtering to separate the linear components. Subsequently, the residual signal, which represents the difference between the raw signal and its linear prediction, was extracted. The GCC-PHAT method was used to calculate the TDOA for each microphone pair based on the residual signals. The results were used as inputs for a single-channel multi-input CNN that estimated the azimuth of the sound source.
The remainder of this paper is organized as follows:
Section 2 reviews related works using cross-correlation signal features and other various signal features.
Section 3 details the methods for extracting ESI, generating cross-correlation signals using GCC-PHAT, and implementing the proposed CNN architecture, and then explains how to perform SSL using the methods detailed above.
Section 4 examines the ETRI-SSL database used in the experiments and validates the system performance through the experimental results. Finally,
Section 5 discusses the findings and concludes this study.
2. Related Works
In this section, we review the literature on SSL.
Section 2.1 introduces research on SSL based on cross-correlation signal features, and
Section 2.2 discusses SSL based on signal features.
2.1. Sound Source Localization Based on Cross-Correlation Signal Feature
The cross-correlation signal is the time difference characteristic between each sound source that has been used for tracking the sound source in the past. In a study on tracking the source location using this method in various forms, Liu et al. [
9] proposed a method that used multiple cross-correlation fusion features as inputs to a CNN to estimate the time delay values in environments with noise and reverberation. To achieve this, cross-correlation features were extracted, calculated using multiple weighting functions, converted into multidimensional matrices, and, finally, used as inputs for the CNN. These experiments revealed the superior performance of the method compared to methods such as GCC-PHAT. Gelderblom et al. [
10] attempted to verify the performances of different room impulse response (RIR) methods for synthesizing training data for the deep neural network (DNN)-based direction of arrival (DOA) estimation of speech in reverberant rooms. They used a simulation tool to generate omnidirectional and directional RIR data, extracted GCC-PHAT data, and estimated the location of the sound source using a multiperception neural network. They discovered that the directional sound source performed better than the omnidirectional sound source because it reflected the actual environment more realistically. Peng and Niu [
11] proposed a CNN-based sound source location-tracking algorithm to estimate the location of a sound source in a real environment with noise and reverberation. For this, they calculated the GCC-PHAT between each voice and used it as the input for the CNN using the LeNet-5 structure. Various signal-to-noise ratios (SNRs) were applied, and their performances were evaluated in terms of the reverberation time. This study confirmed that the cross-correlation signal obtained using the PHAT weight was robust to noise and reverberation.
Pak and Jong [
15] proposed a training mechanism that was robust to background noise and reverberation, which are detrimental to traditional SSL algorithms. To this end, the phase difference statistics between each microphone were improved based on a DNN, and the
k-means clustering method was used to estimate the location of the voice frame-by-frame. The experiment confirmed that the proposed method performed better than traditional signal-processing methods. Wang et al. [
12] proposed a method using GCC-PHAT and speech masking for SSL in a robotic environment with noise and reverberation. They used GCC-PHAT to extract a speech mask that was learned based on a CNN. The angle of the sound source was tracked using a multiperceptron and an SNN classifier. The experiment demonstrated the superior performance of the method compared with the method using only GCC-PHAT. Cordourier et al. [
16] used the Task3 database of DCASE 2019 to track and detect the location of sound events. They extracted GCC-PHAT from speech and used a GCC-gram, which is a two-dimensional (2D) feature extracted from this signal, as the input to a convolutional recurrent neural network (CRNN). This experiment confirmed that the proposed method performed better than other methods. Huang et al. [
17] proposed SSELDnet for sound event location estimation and detection using the Task3 database of DCASE 2019. They used a raw signal as the input to the network without extracting any special features from the speech. SSELDnet combines SE-ResNet and conformer blocks with an existing CNN. The experiment confirmed that the proposed network performed better than existing networks. Hu et al. [
13] proposed a method for tracking the location of sound sources using residual networks and channel attention methods to address the challenges of extant CRNN-based models. To this end, log-mel spectrograms and GCC-PHAT features were extracted from speech, combined, and used as inputs to the proposed network. Experiments confirmed that the combination of residual networks and channel attention mechanisms produced better results than existing methods.
Kwak et al. [
14] proposed a method for tracking the locations of sound sources using ESI in a robotic environment. To this end, ESI was extracted from the sound source using the linear prediction (LP) residual and Hilbert envelope. The extracted ESI was used to calculate the time delay value. The geometric features of the ESI were used to estimate the location of the sound source. The experiment confirmed that the tracking method performed better than GCC-PHAT and GCC-only methods.
2.2. Sound Source Localization Based on Signal Features
Recently, several studies have estimated the location of sound sources using signal characteristics other than cross-correlation signals. Bologni et al. [
18] proposed one such track method by predicting the possibility of a reflective surface when the indoor impulse response was unknown. To this end, they used a one-dimensional (1D) raw speech signal as network input and extracted features using a fully convolutional network, which is a supervised learning method. The method estimated voice location with high accuracy in a real environment. Vera-Diaz et al. [
19] proposed an approach for tracking the location of a sound source in an indoor environment using a CNN. However, this study did not extract features from the voice; rather, it used the raw voice as a multi-channel input to the CNN. In addition, to supplement the small volume of real data, the network was trained on semi-synthetic data. Subsequently, the data were adjusted using a small amount of real data. The method performed better than SRP-PHAT and CRNN.
Pujol et al. [
20] proposed a method that combines beamforming and deep learning for multi-channel sound source-location tracking. To this end, they simplified the preprocessing step by stacking raw signals as a multi-channel input to the network. The proposed beamforming method has advantages: it is insensitive to problems such as the structure or noise of the microphone array and has applications in both classification and regression tasks. The method exhibited better estimation performance than the MUSIC and SRP-PHAT methods. Sun et al. [
21] proposed a method to supplement the insufficient feature learning of the existing SELD-Net. To this end, the adaptive hybrid convolution (AHConv) mechanism and a multirange feature extractor were used, with a log-mel spectrogram and normalized sound intensity vector as inputs. They used an asymmetric convolutional network instead of a traditional neural network. In addition, an adaptive attention block was used to minimize the interference between channels and time and frequency. The method performed better than SELD-Net.
An et al. [
22] proposed a learning method that could be applied to various microphone array environments. The method consisted of a two-stage training process. In the first stage, SSLR, DCASE 2021, and TUT-CA databases and a variety of microphone array data were used to learn the features of each microphone pair. In the second stage, in addition to these features, geometric features were also learned, which were ultimately used to estimate the location. The method estimated the location with high performance without being affected by the microphone array structure. Tan et al. [
23] proposed a method using a CNN and regression model (CNN-R) to track sound source location. To this end, simulation data were generated using the pyroomacoustics package and used with real data, and 2D and interaural phase difference features were extracted from the voice signal and used as inputs for the CNN-R model. The experiment confirmed that the regression-based method was more accurate than the classification-based method in tracking the sound source location. Zhu et al. [
24] proposed a method for tracking the location of a sound source in an environment with reverberations and noise. To this end, a three-dimensional spiral sound source containing azimuth and elevation information was used, and the RIR was extracted from the corresponding voice and used as input to a CNN. The experiment confirmed that the method performed markedly better than methods such as SRP-PHAT.
Table 1 summarizes the input, network, and database of each related work. Most studies tracked location using various or complicated signal features, which helped increase detection accuracy; however, this approach is not sufficiently fast for robotic environments where real-time performance is important. This study used only one feature, the time-delay information, as the input to a deep learning model. Previous studies mainly stacked each feature in multiple channels and used it as input, which can accelerate the learning speed; however, one incorrect input value can affect other input values in the stack. Moreover, it may emphasize only specific features, making it difficult to extract them distinctly. To address this issue, we propose the use of a single-channel multi-input CNN that can learn each feature independently. In addition, previous studies attempted to track the exact location of an indoor robot environment using noise and echoes. To simplify this approach, this study proposes the use of GCC-PHAT, which extracts the ESI containing the original component of the voice through linear prediction and extracts the time-delay information of each microphone pair from the phase information that is robust to noise.
3. Sound Source Localization Using Excitation Source Information
This section describes the sound source preprocessing method and the SSL network.
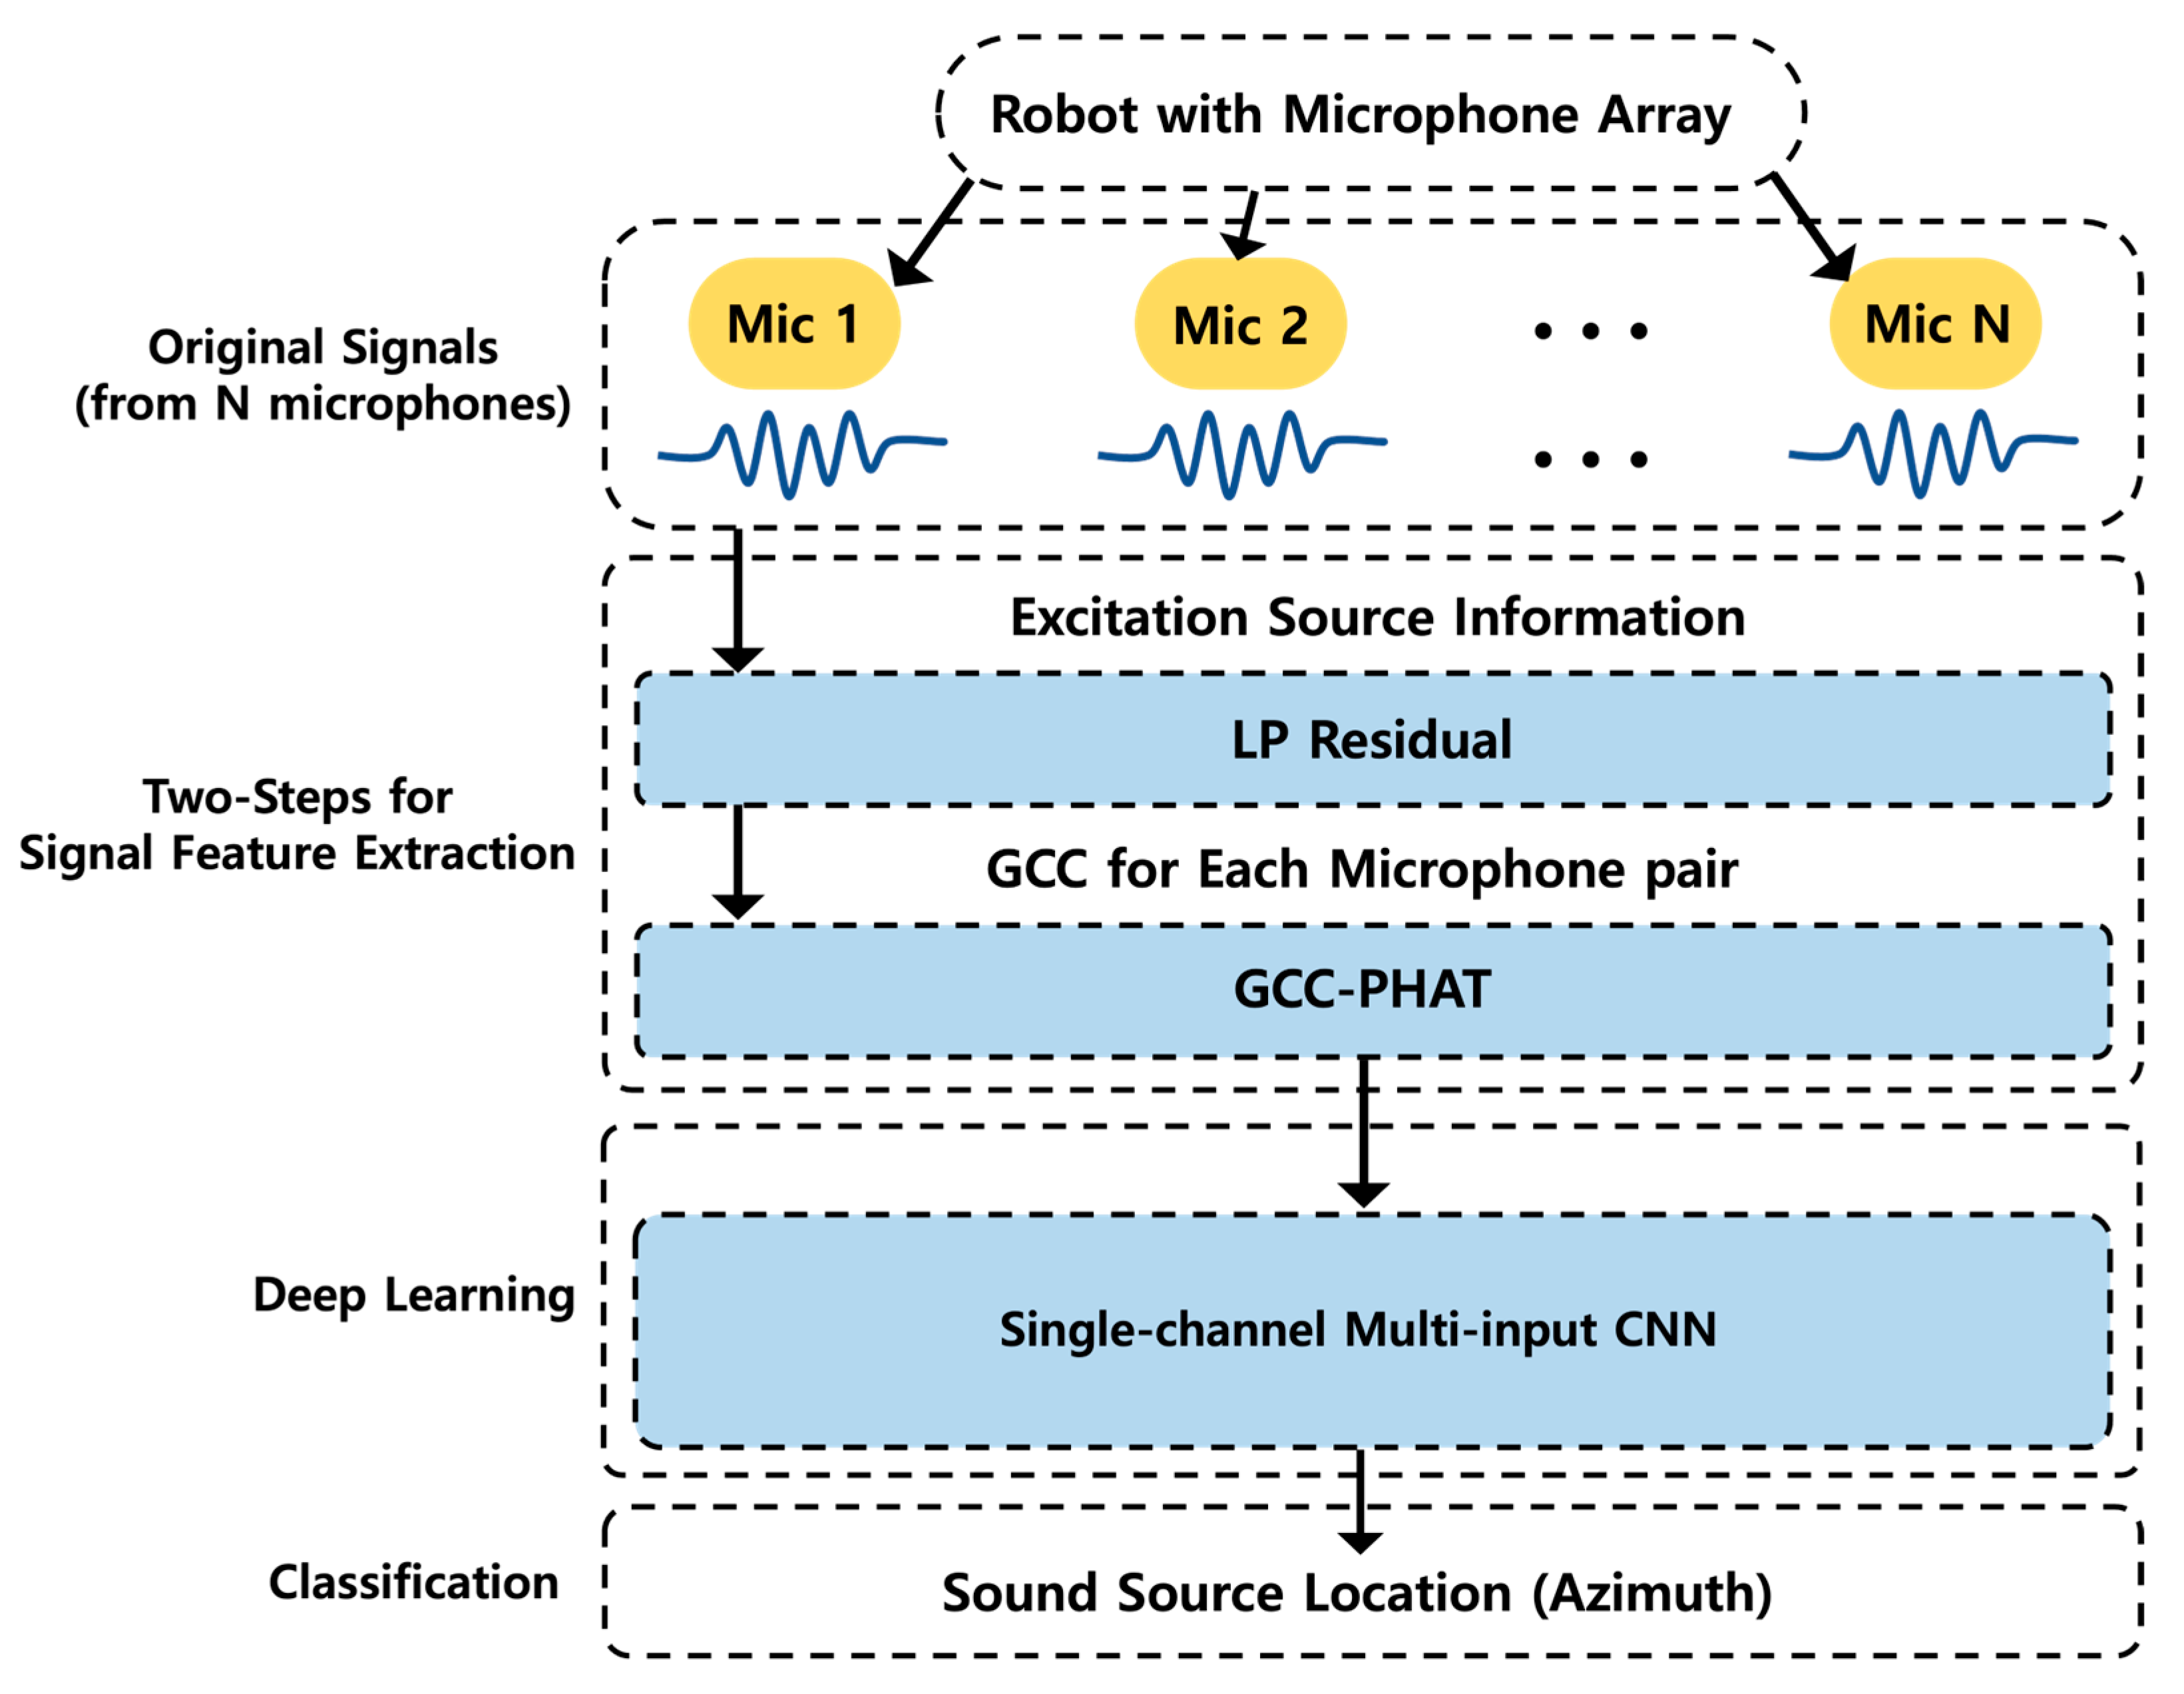
Figure 1 illustrates the SSL process of the proposed method in a robotic environment.
The sound signal was obtained from a microphone array, and a two-step localization process was performed to extract only the original information of the sound signal. First, the original signal was linearly predicted to obtain the LP residual, which is the difference between the original and linearly predicted signals. The cross-correlation signal of each microphone pair was calculated using GCC-PHAT. The cross-correlation signal was used as the input of a single-channel multi-input CNN to classify the azimuth of the location.
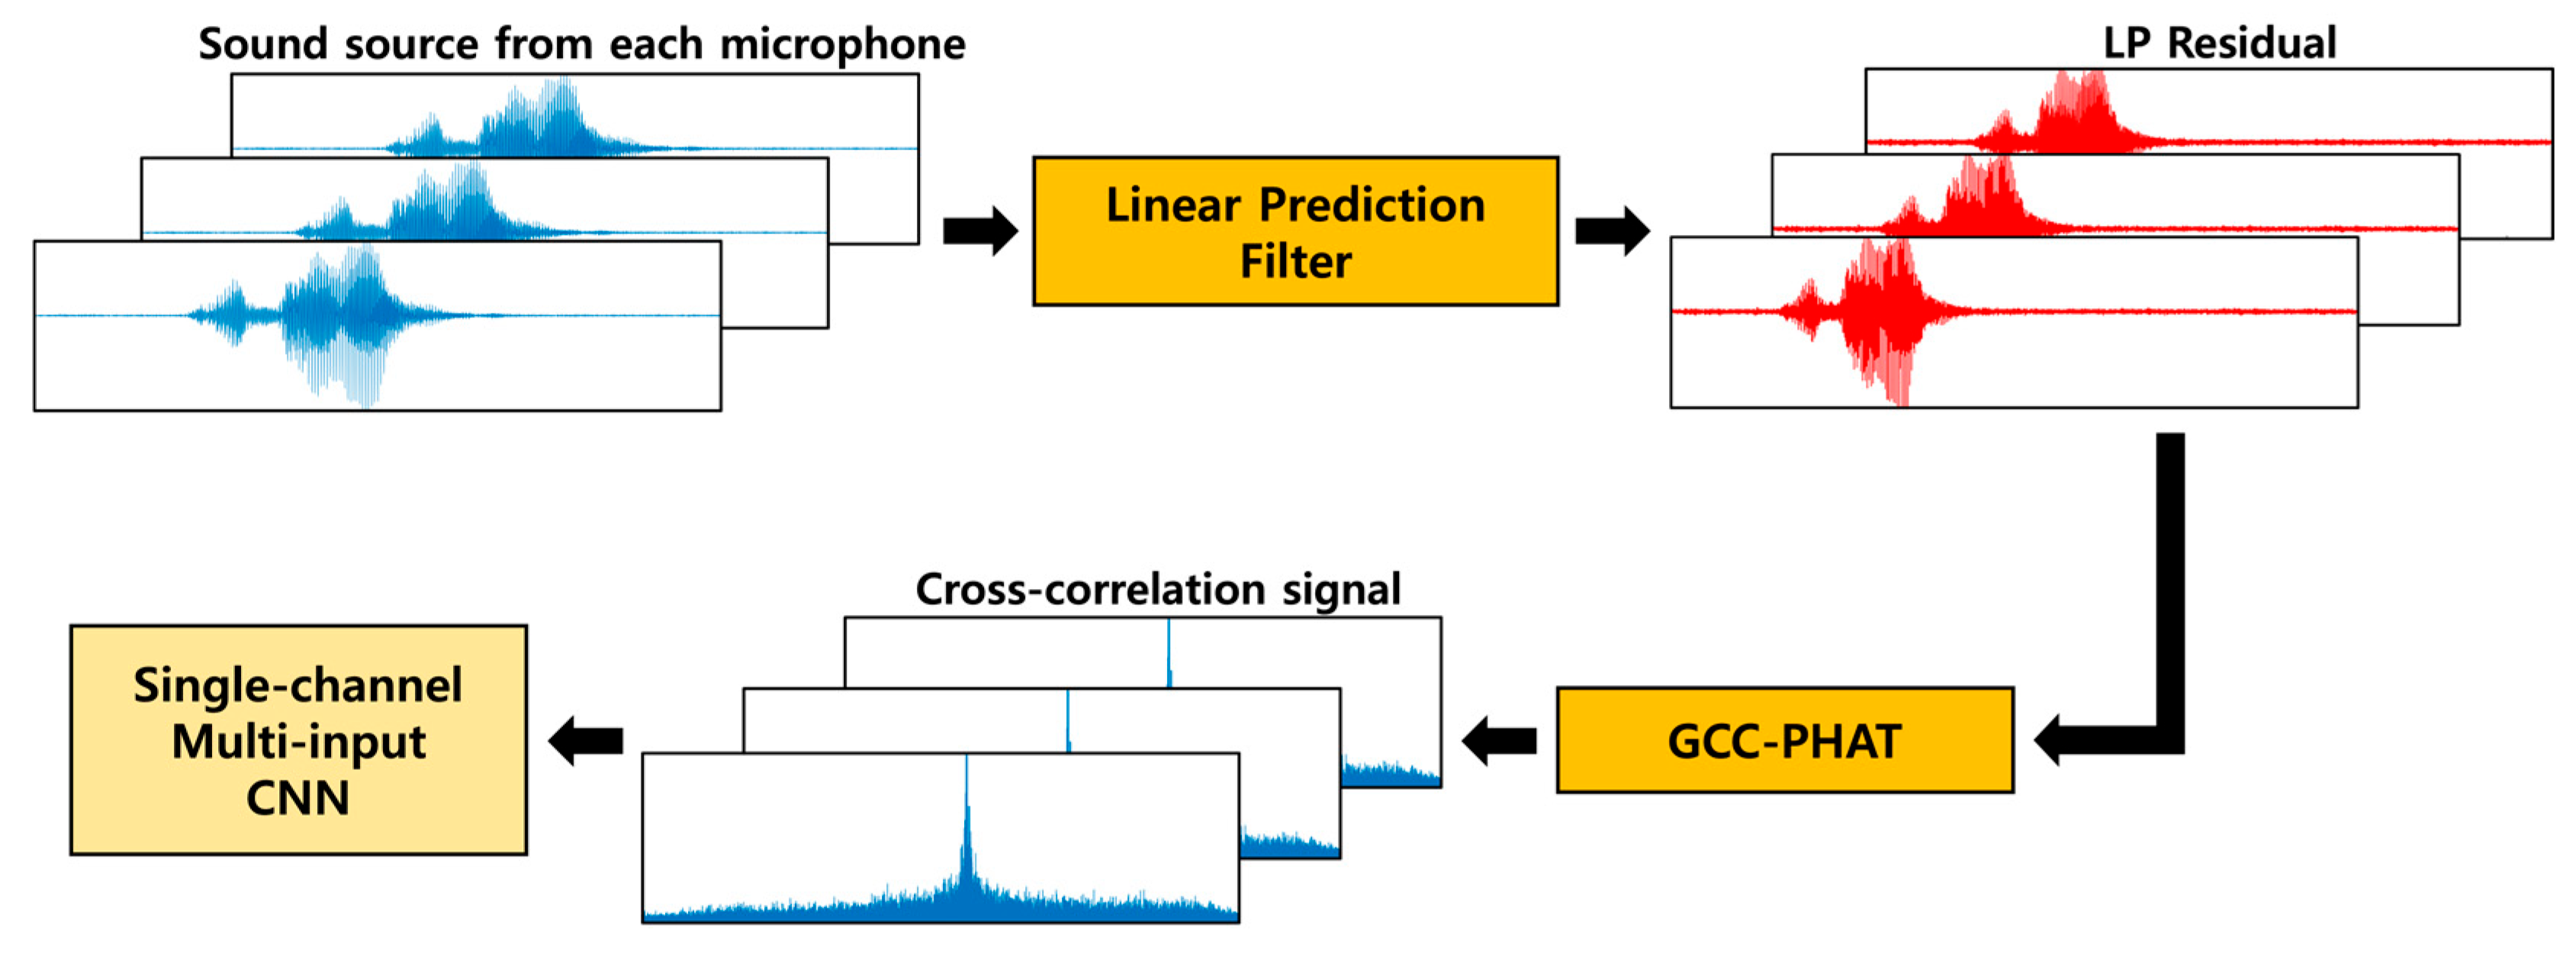
Figure 2 depicts the progress of the SSL experiment. The ESI was extracted from the original signal, and the cross-correlation signals were extracted from the above features using GCC-PHAT. Subsequently, 2D features were extracted from the cross-correlation signals of each microphone pair using a short-time Fourier transform (STFT) to compare the appropriate type of input method. The two features were trained on the proposed network to confirm the effective input form and validate the proposed method. In this section, we explain the sound source feature extraction method and design of the proposed network.
3.1. Sound Source Feature Extraction
A robotic environment has several components that affect sound, such as noise and reverberation. These components influence SSL tasks, where time information is critical. To address this issue, we propose a two-step preprocessing method, as outlined in
Figure 3, to extract the original components of the sound with the least influence.
In the first step, the original elements of the sound source are extracted. The sound signals from multiple channels pass through the linear prediction filter and yield the linearly predicted signal. The difference between the original and linearly predicted signals is then calculated to extract the LP residual, which is used as the ESI containing the original components of the sound source. The LP residual only contains the original sound source that is caused by people vocalizing. Therefore, it is possible to minimize the impact of components such as noise and reverberation. In the second step, the cross-correlation signal of each adjacent microphone pair is extracted using GCC-PHAT in the LP residual. GCC-PHAT is an algorithm that utilizes phase information that is less affected by noise and reverberation; thus, it can obtain a clear cross-correlation signal from each microphone pair. Finally, it is used as the input for the CNN in the proposed structure. Through noise-minimizing two-step sound source feature extraction, the inherent properties of the sound signal are retained adequately, which can increase the prediction accuracy. Subsequently, a single-channel multi-input CNN is used to learn the extracted features.
3.1.1. Excitation Source Information Extraction Using Linear Prediction
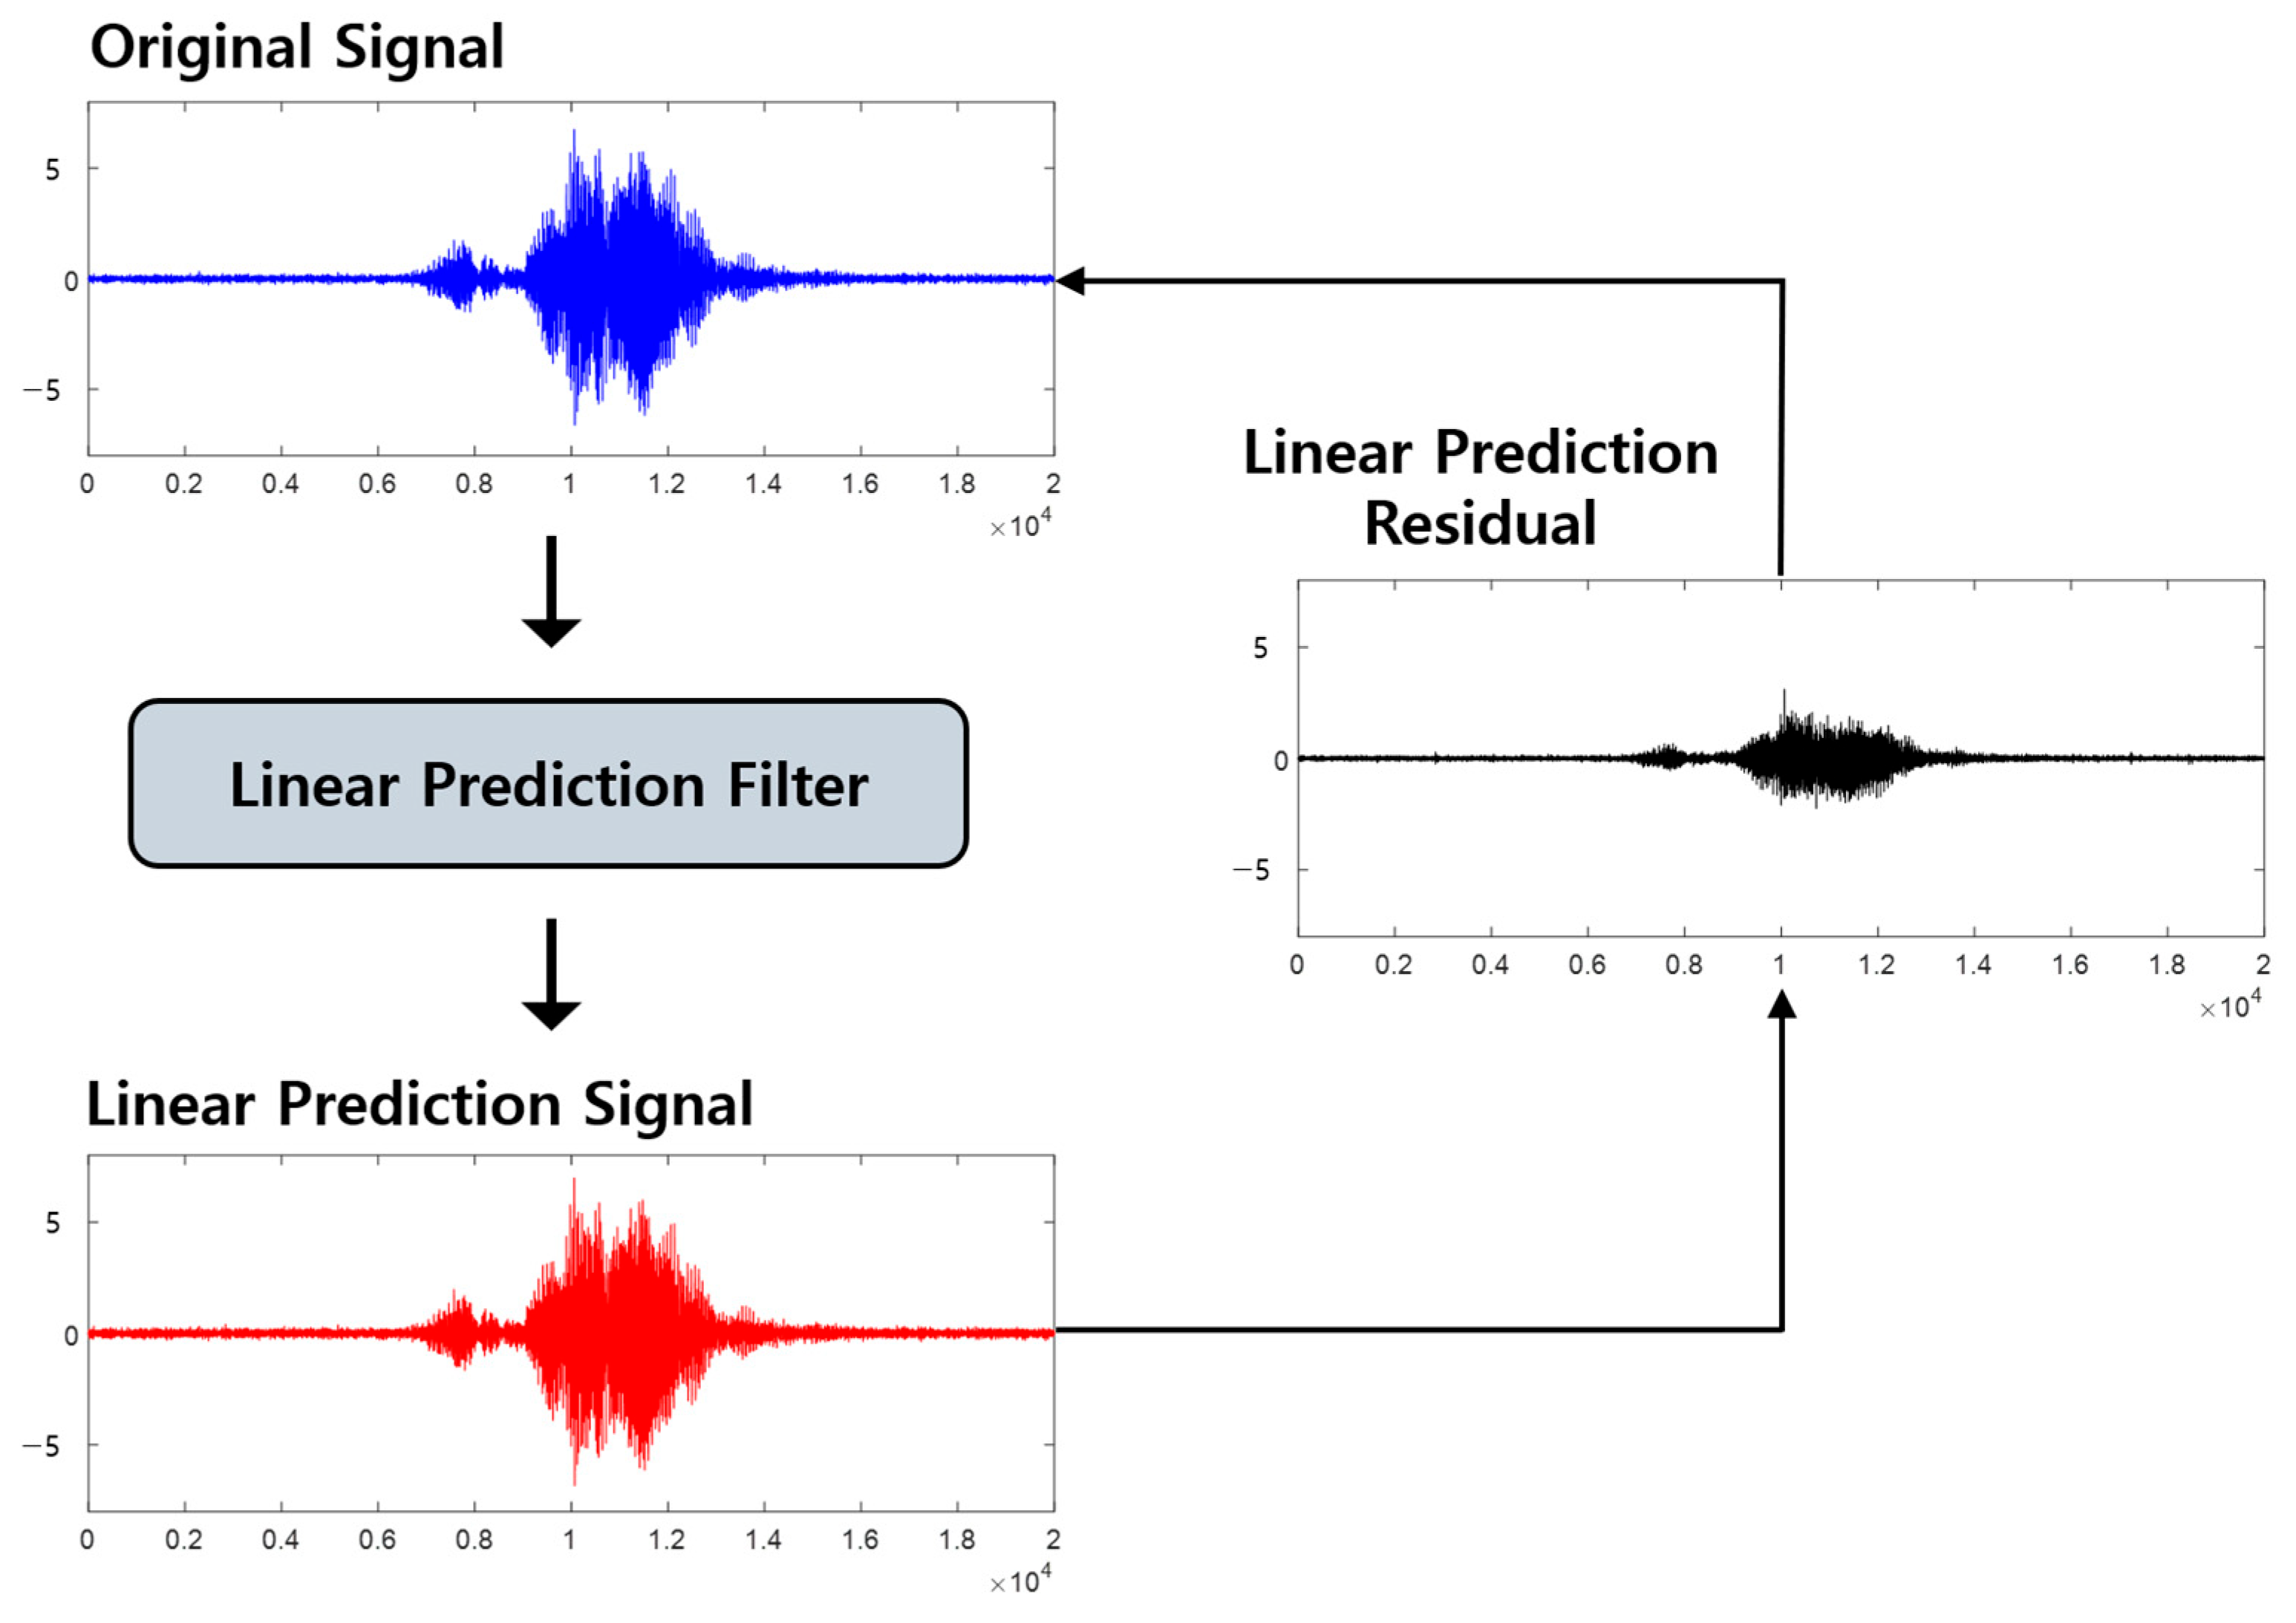
Elements such as living noise and reverberation affect the time information of sound sources, making it difficult to track the exact location in an indoor robotic environment. To address these challenges, we propose the use of ESI, which contains the original components of the sound source. The voice contains components such as voiced sound, which is the vibration of the vocal cords when a person speaks, and unvoiced sound, which is generated owing to the friction of the vocal cords with the air. Thus, noise other than sound signals can be attenuated. Among the various methods, LP residual, which is the most appropriate experimental method, was used as the ESI. Linear prediction is the process of predicting the original sound signal using a linear filter and extracting the linear components. When the linearly predicted signal is isolated from the original signal, only aperiodic components remain. Aperiodic components of the voice represent vocal cord vibrations or the strong energy of a specific voice. These are the original components of the voice and can be used as ESI. In other words, the signal is attenuated by reverberation and noise. The LP residual extraction process is illustrated in
Figure 4.
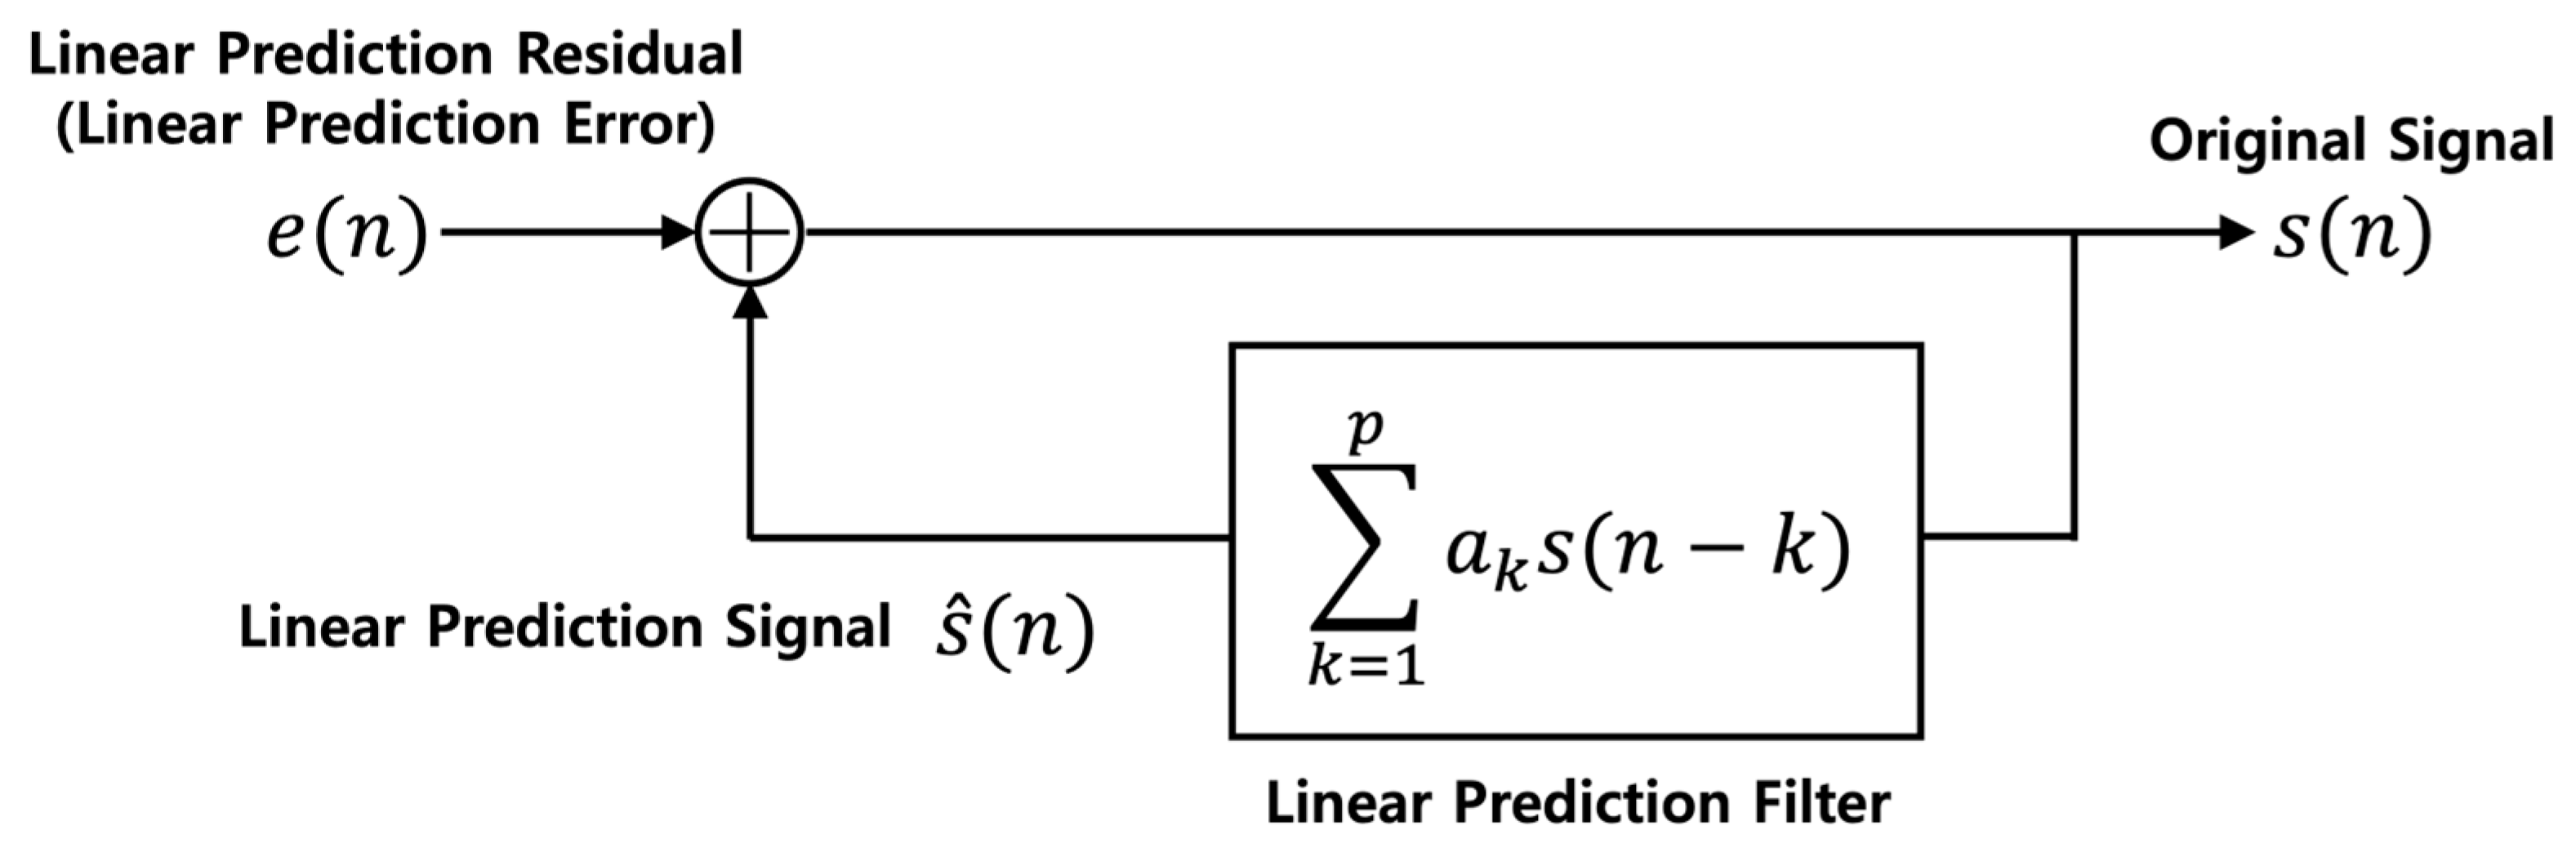
The LP residual extraction process is expressed in Equations (1) and (2). Equation (1) is used to obtain the linearly predicted signal. Past values are substituted into the linear prediction filter to obtain the current linearly predicted signal
.
is the linear prediction coefficient that is mathematically determined based on the signal.
is the linear prediction order. This parameter determines the number of previous signal values used to predict the current value. A larger value indicates that more of the previous signal values are used. If an inadequate number of past values are used, the current signal cannot be predicted accurately; conversely, if excess values are used, the algorithm also predicts noise, creating spurious signals. To determine the most suitable value, we changed the order of determination.
where
represents the LP residual. This can be obtained as the difference between the predicted and original sound signals. The linearly predicted signal contains the linear values of the original signal. Therefore, this difference contains nonlinear components, which include the strong energy of a specific voice that occurs when the vocal cords vibrate or speak.
Figure 5 shows the relationship between the signal values.
3.1.2. Cross-Correlation Signal Extraction Using GCC-PHAT Algorithm
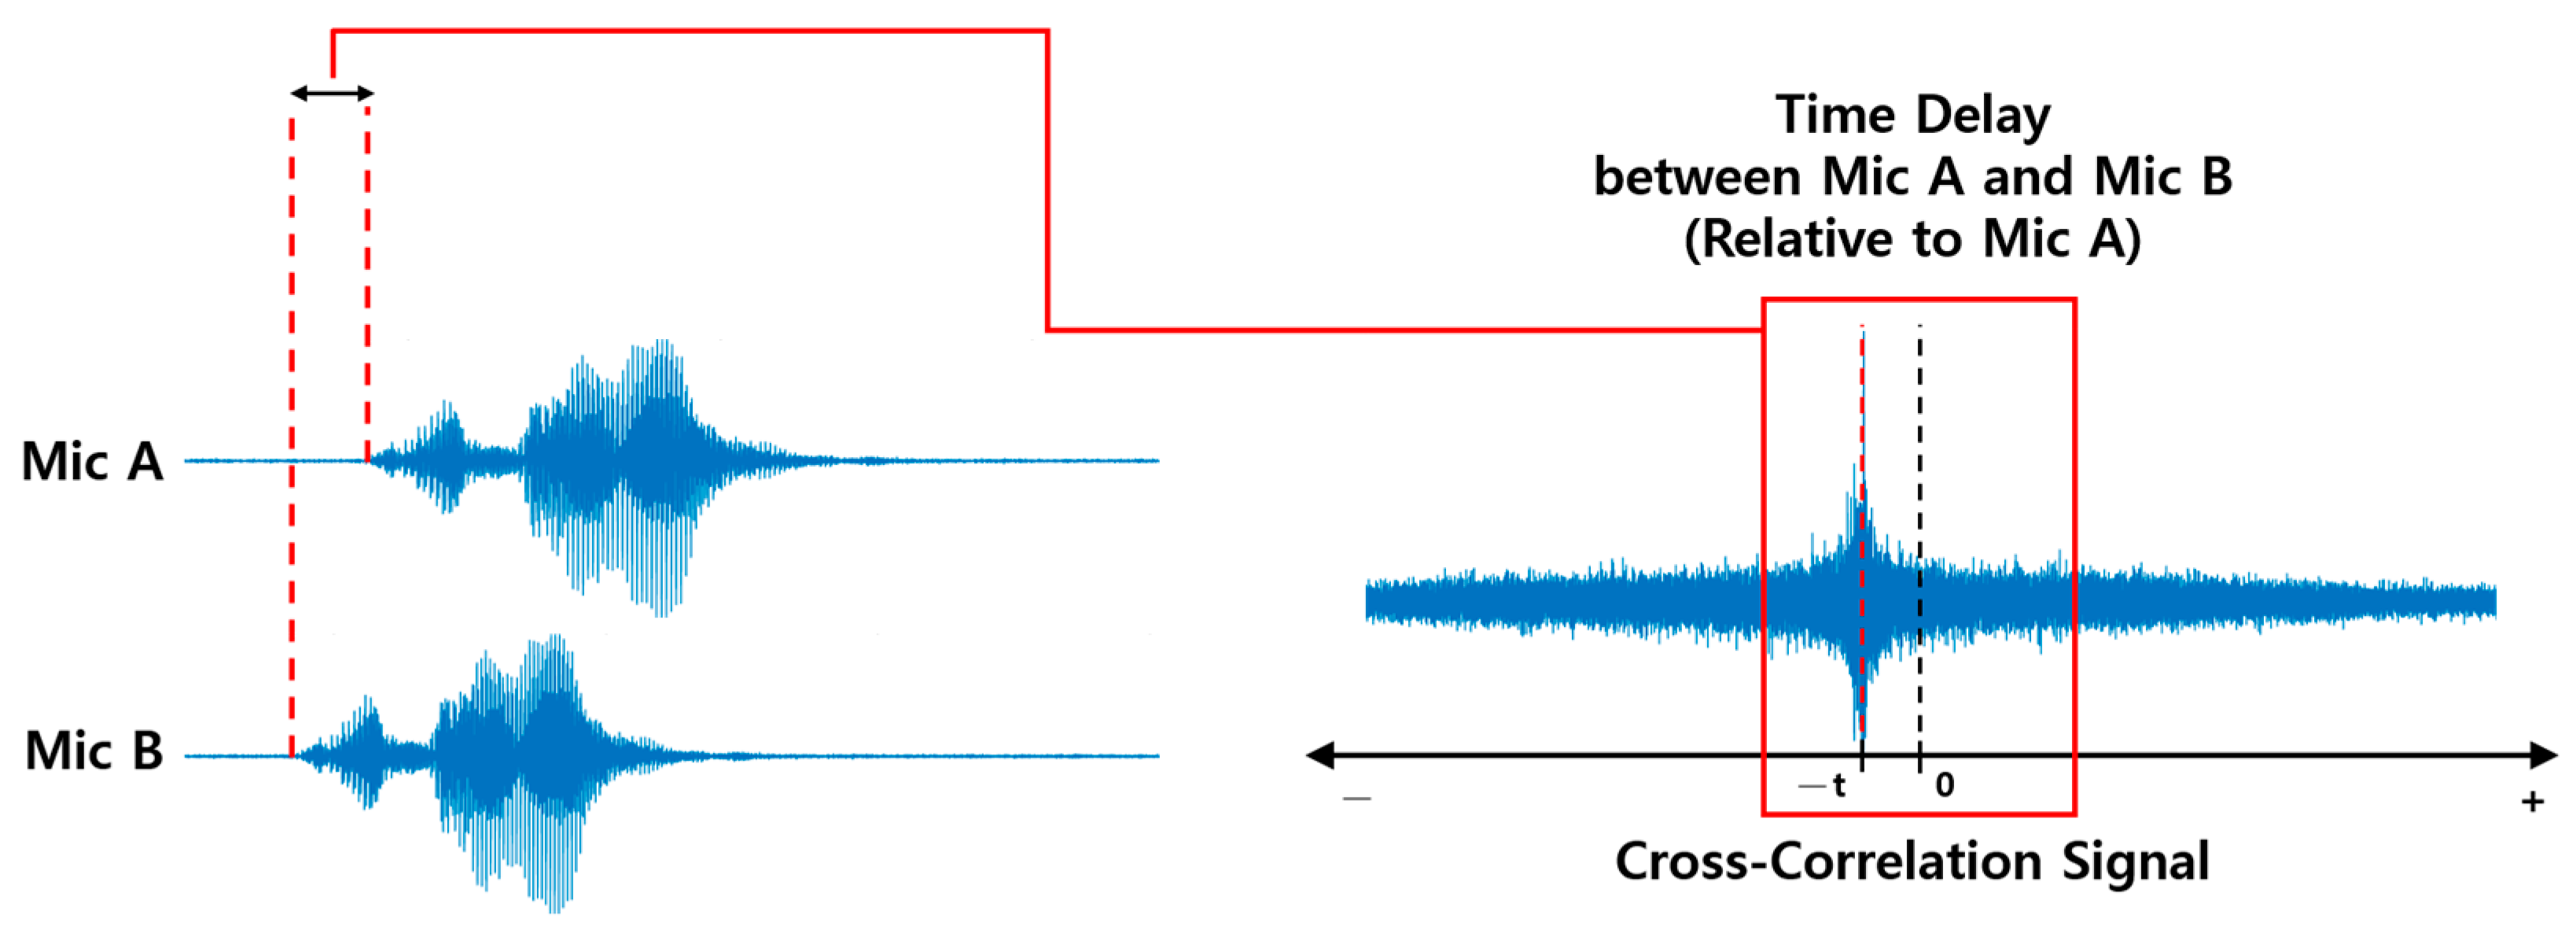
GCC-PHAT, a frequency-domain analysis method, is used to extract the correlation between the sound signals from each microphone. GCC-PHAT is a signal-correlation extraction method that applies PHAT weighting to GCC. Unlike general cross-correlation signal extraction methods, this method calculates the time delay value using phase information. Using the PHAT weight, all the amplitude components vulnerable to noise are normalized to 1 to emphasize the phase information. Subsequently, the cross-correlation signal is extracted using the phase value. Phase information is robust to noise and reverberation. Therefore, GCC-PHAT is frequently used to obtain correlations between sound signals in SSL. Equations (3) and (4) illustrate the signal-correlation extraction method using GCC-PHAT.
where
and
are the Fourier-transformed signals of voice signals input from two microphones to utilize the phase information.
is the signal correlation value between two sound signals.
is a frequency weighting function called PHAT, and its magnitude is normalized to 1. This weight emphasizes the frequency component for estimating time delay. The cross-correlation signals are illustrated in
Figure 6 and
Figure 7. As shown in
Figure 7, a sound source at a specific location is input from two microphones.
The sound source was input to microphones A and B at times T + t and T, respectively. Their cross-correlation signal is illustrated in
Figure 7. This signal is the difference between the sound signals input to microphones A and B. The x-value of the part where the y-axis shows the maximum value, with 0 as the standard on the x-axis, indicates the time delay of the two sound signals. The x- and y-axes represent the time delay and correlation value of the two signals, respectively. The time delay of the two signals based on microphone A is −t. The cross-correlation signal extracted using GCC-PHAT is output as a signal containing complex values. To use this signal as an input to the network, we applied the absolute value to the above signal.
3.2. Design of CNN Based on Single-Channel Multi-Input
Accuracy and efficiency are important in tracking the locations of sound sources in a robotic environment. Therefore, tracking accuracy and task processing speed must be considered. Moreover, the model size of the network, learning time, and computational load are also important. We used a CNN to balance the accuracy and efficiency of tracking. In addition, we used a multi-input method to learn the characteristics of each input. The single-channel, multi-input method extracts features independently from each correlation signal and classifies the signals by combining these features. Previous related works mainly input each input value into the network in a multi-channel method. This method has the advantage of a short learning time because it accumulates multiple input values and learns them simultaneously, and it has the advantage of learning the association between each channel well. However, in the case of SSL, where the time information of each microphone pair is important, if multi-channel input is used, the information of each input value may be mixed up, and it may be difficult to find the location of the sound source. To solve the above problems, this study proposes a single-channel, multi-input method. The single-channel, multi-input method extracts features independently from each correlation signal and classifies the signals by combining these features. This allows each cross-correlation signal to learn the time delay information more accurately without mixing and enables each input value to work complementarily.
Figure 8 depicts the form of a 1D single-channel, multi-input CNN and the structure of a 1D convolution block in the network. A dropout layer added in the middle of the convolution block prevents overfitting. The 1D convolution block first learns the temporal relationship between the cross-correlation signals through the 1D convolution layer and then performs batch normalization. Subsequently, the rectified linear unit (ReLU) activation function is implemented to better understand the nonlinear characteristics of each signal. Finally, the Max pooling layer extracts and learns only the important features.
Algorithm 1 illustrates the pseudocode for the SSL process used by the proposed CNN structure.
| Algorithm 1 Single-channel, multi-input convolutional neural network |
- 1:
Data: sound sources from microphones (N microphones) - 2:
Preprocessing: LP residual (ESI) → GCC-PHAT - 3:
Input: Each microphone pair ESI + GCC-PHAT signals (N microphones) - 4:
Output: Azimuth of sound source - 5:
initialize(net) - 6:
for epoch = 1, …, K - 7:
signal 1, … signal N → input from each CNN branch - 8:
each trained feature → concat from FC layer - 9:
classification at Softmax layer - 10:
end for
|
4. Database and Results Analysis
In this section, we introduce the SSL database in a robotic environment. Subsequently, we describe the experimental setup, followed by a presentation of the results.
4.1. Sound Source Localization Database in a Robotic Environment
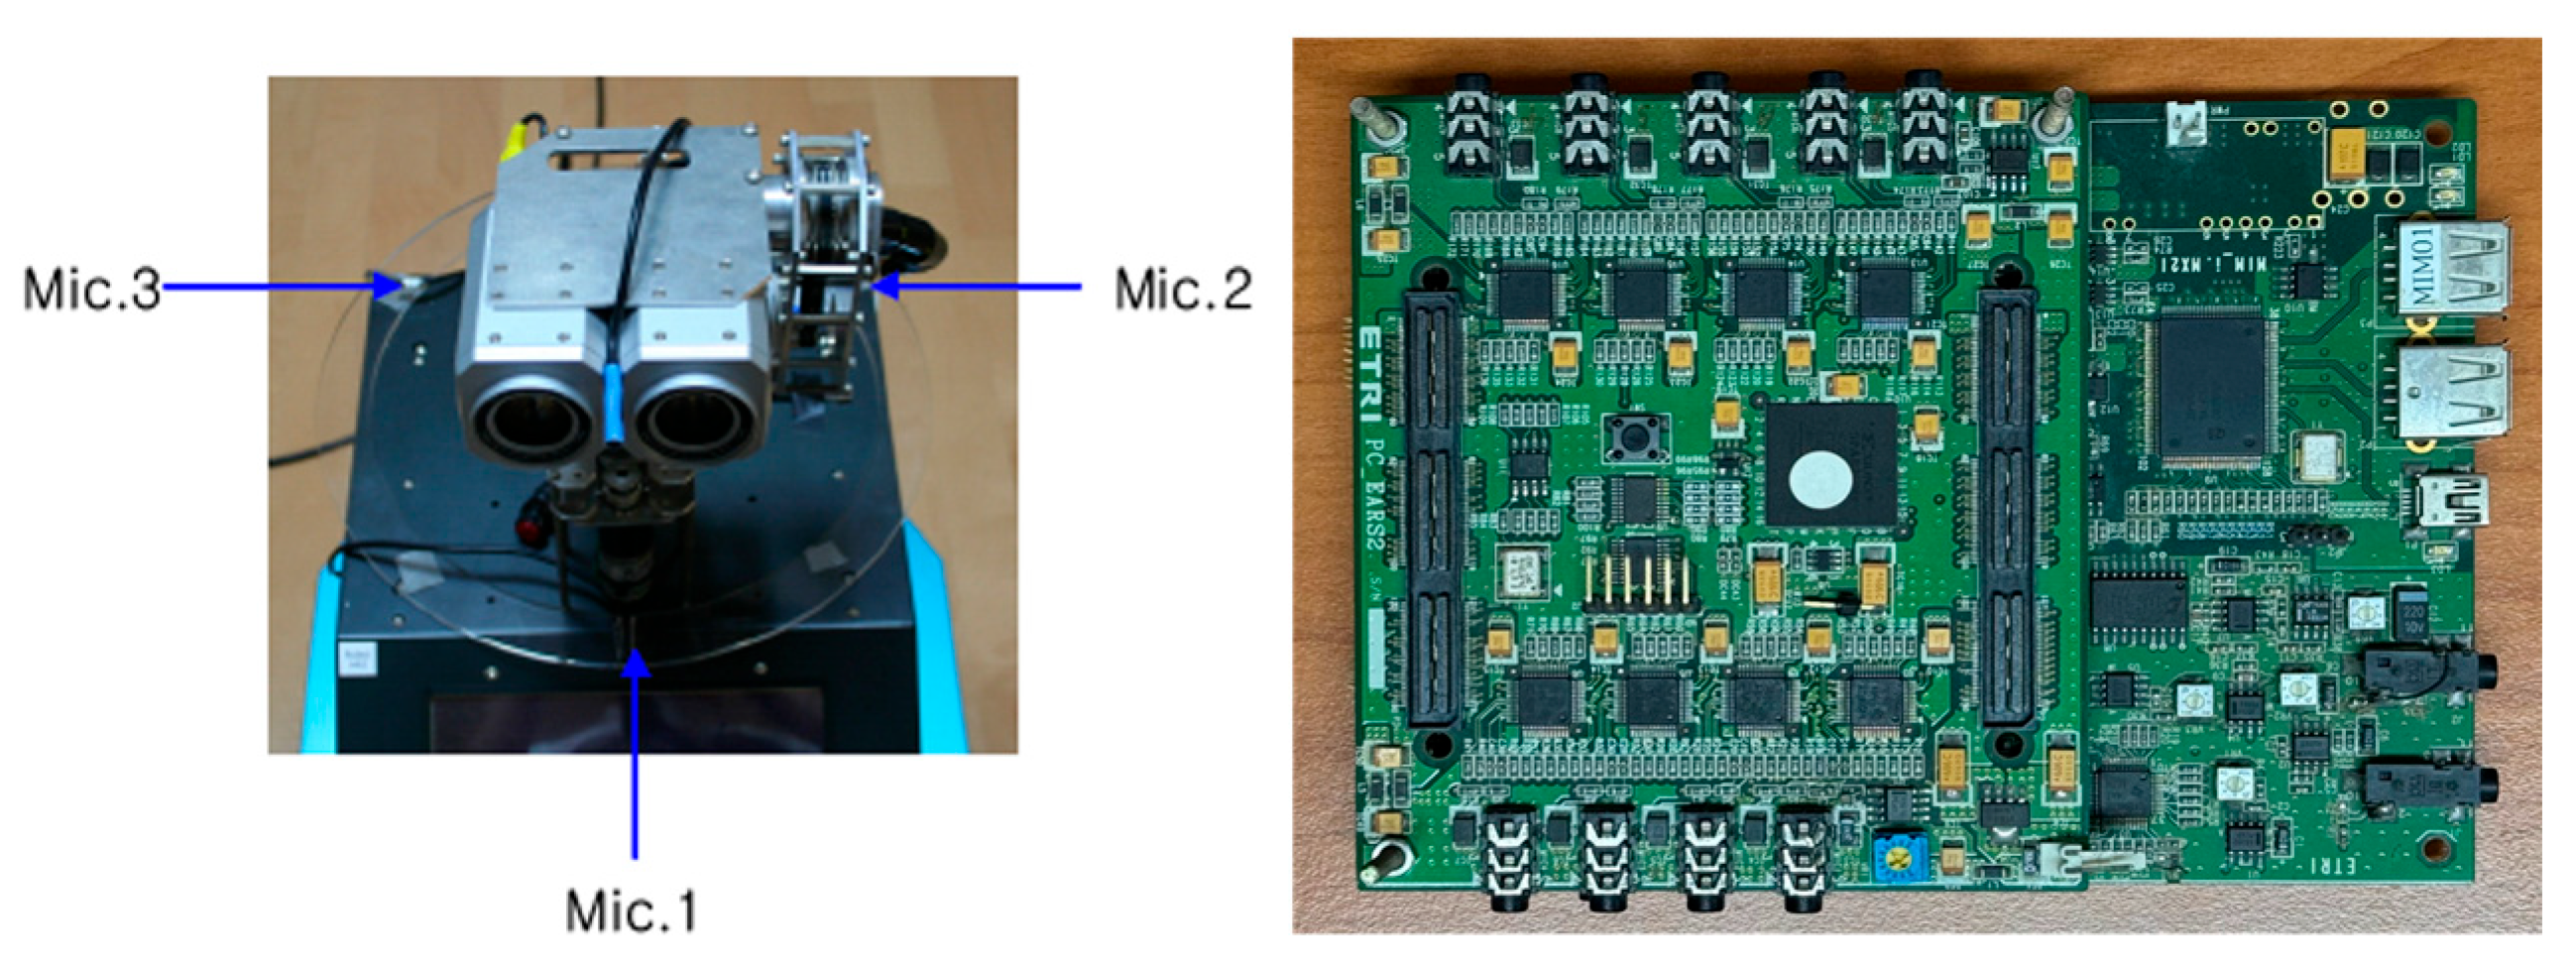
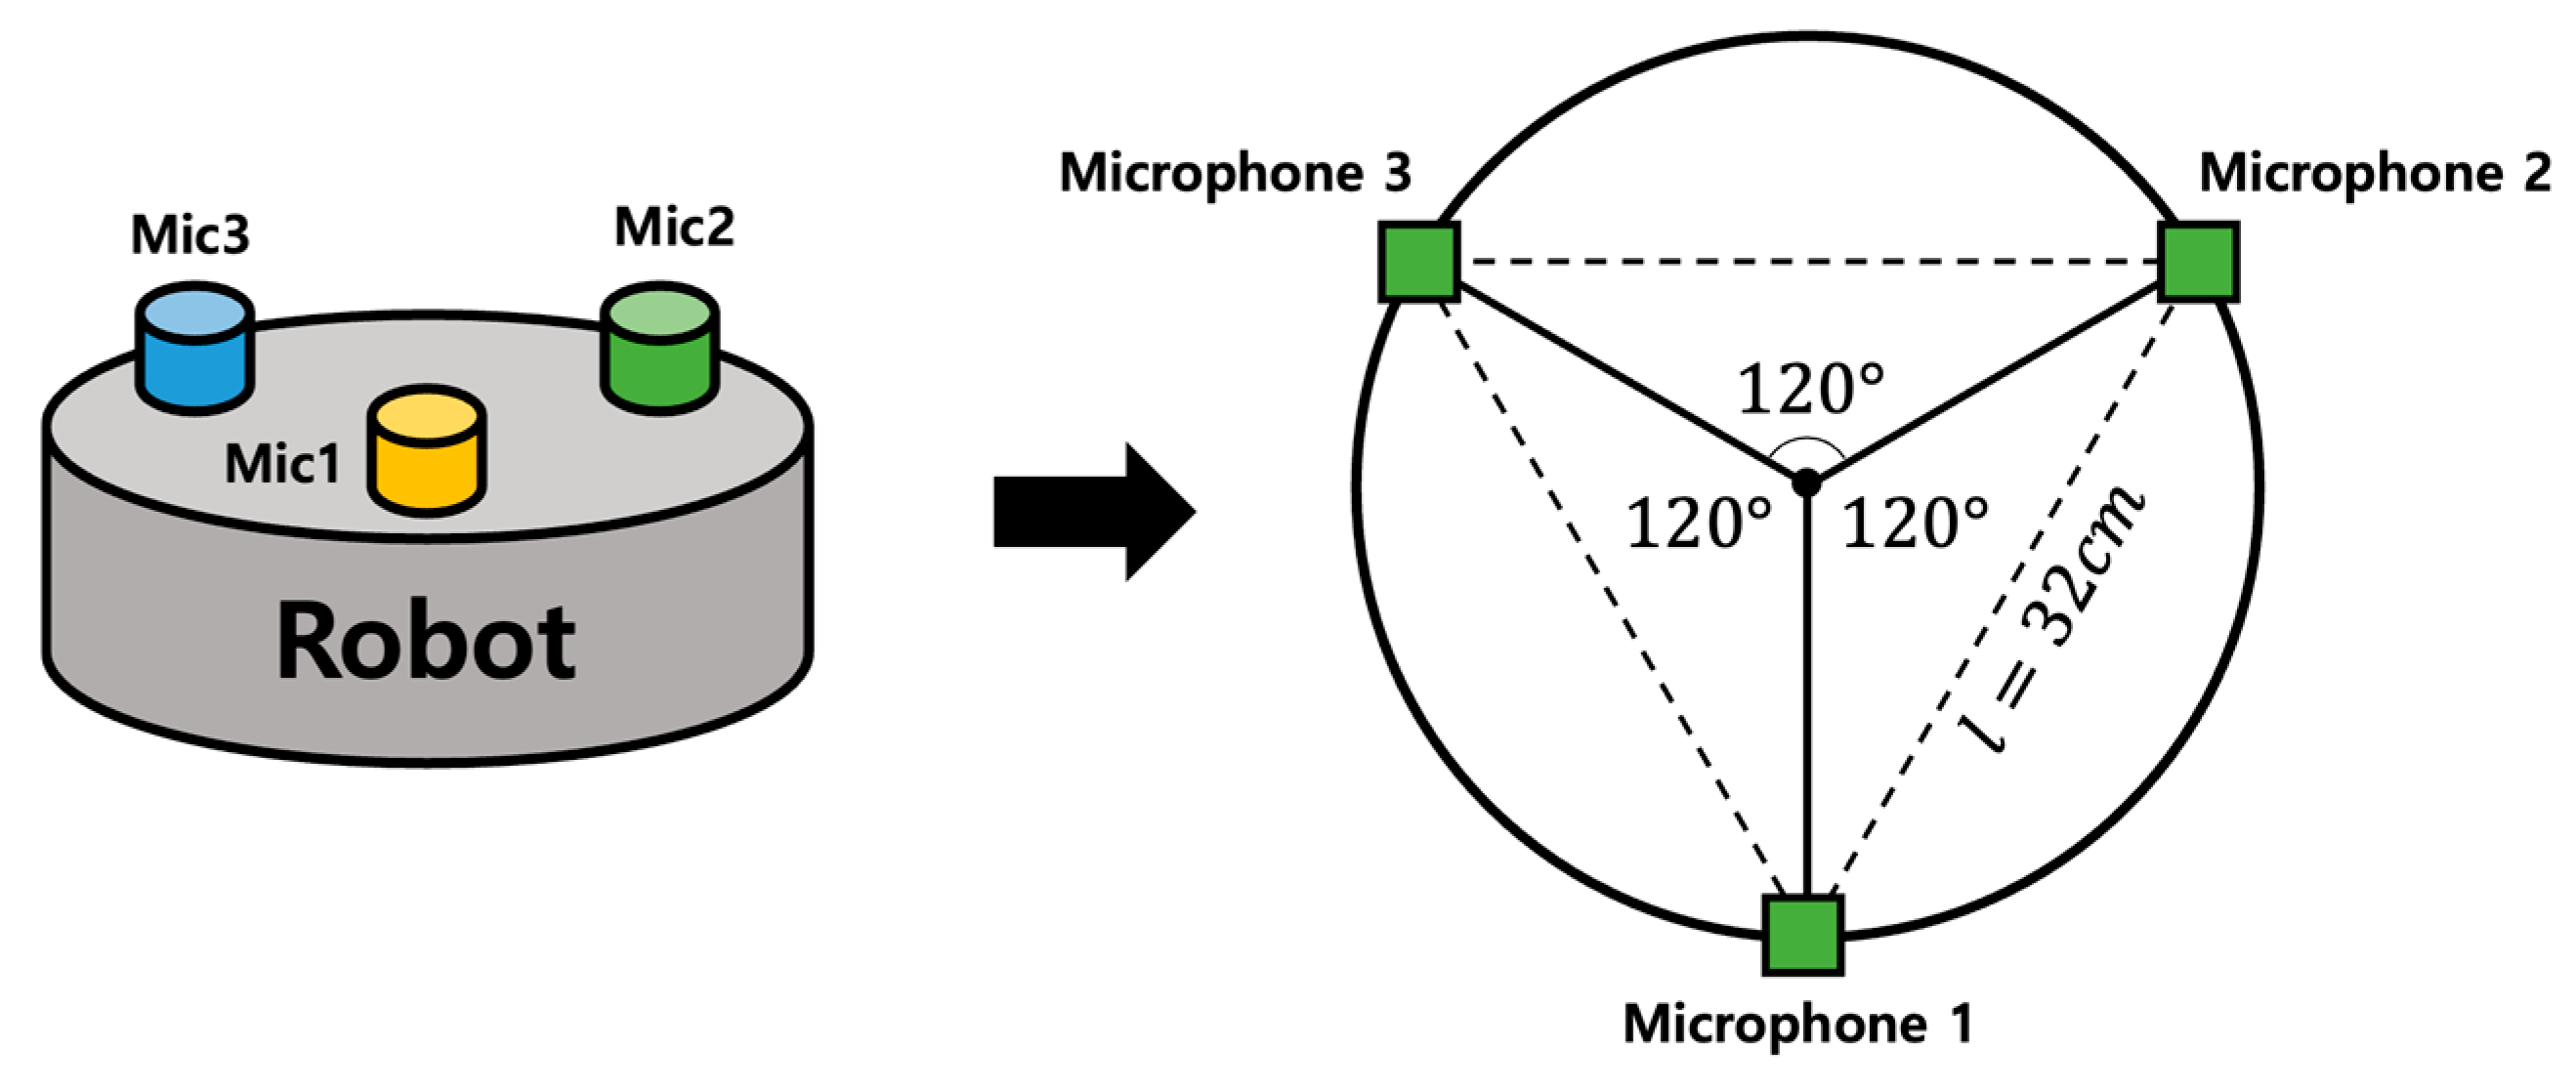
In this study, the ETRI-SSL database acquired from the Electronics and Telecommunications Research Institute (ETRI) was used for the SSL tasks in the robotic environment. The audio data detailed thus far were acquired from hardware connected to a multi-channel board with three omnidirectional microphones attached to the robot, as shown in
Figure 9. The microphones were arranged in an array to form the vertices of an equilateral triangle, with an azimuth of 120° and a distance of 32 cm between each vertex (microphone), as shown in
Figure 10.
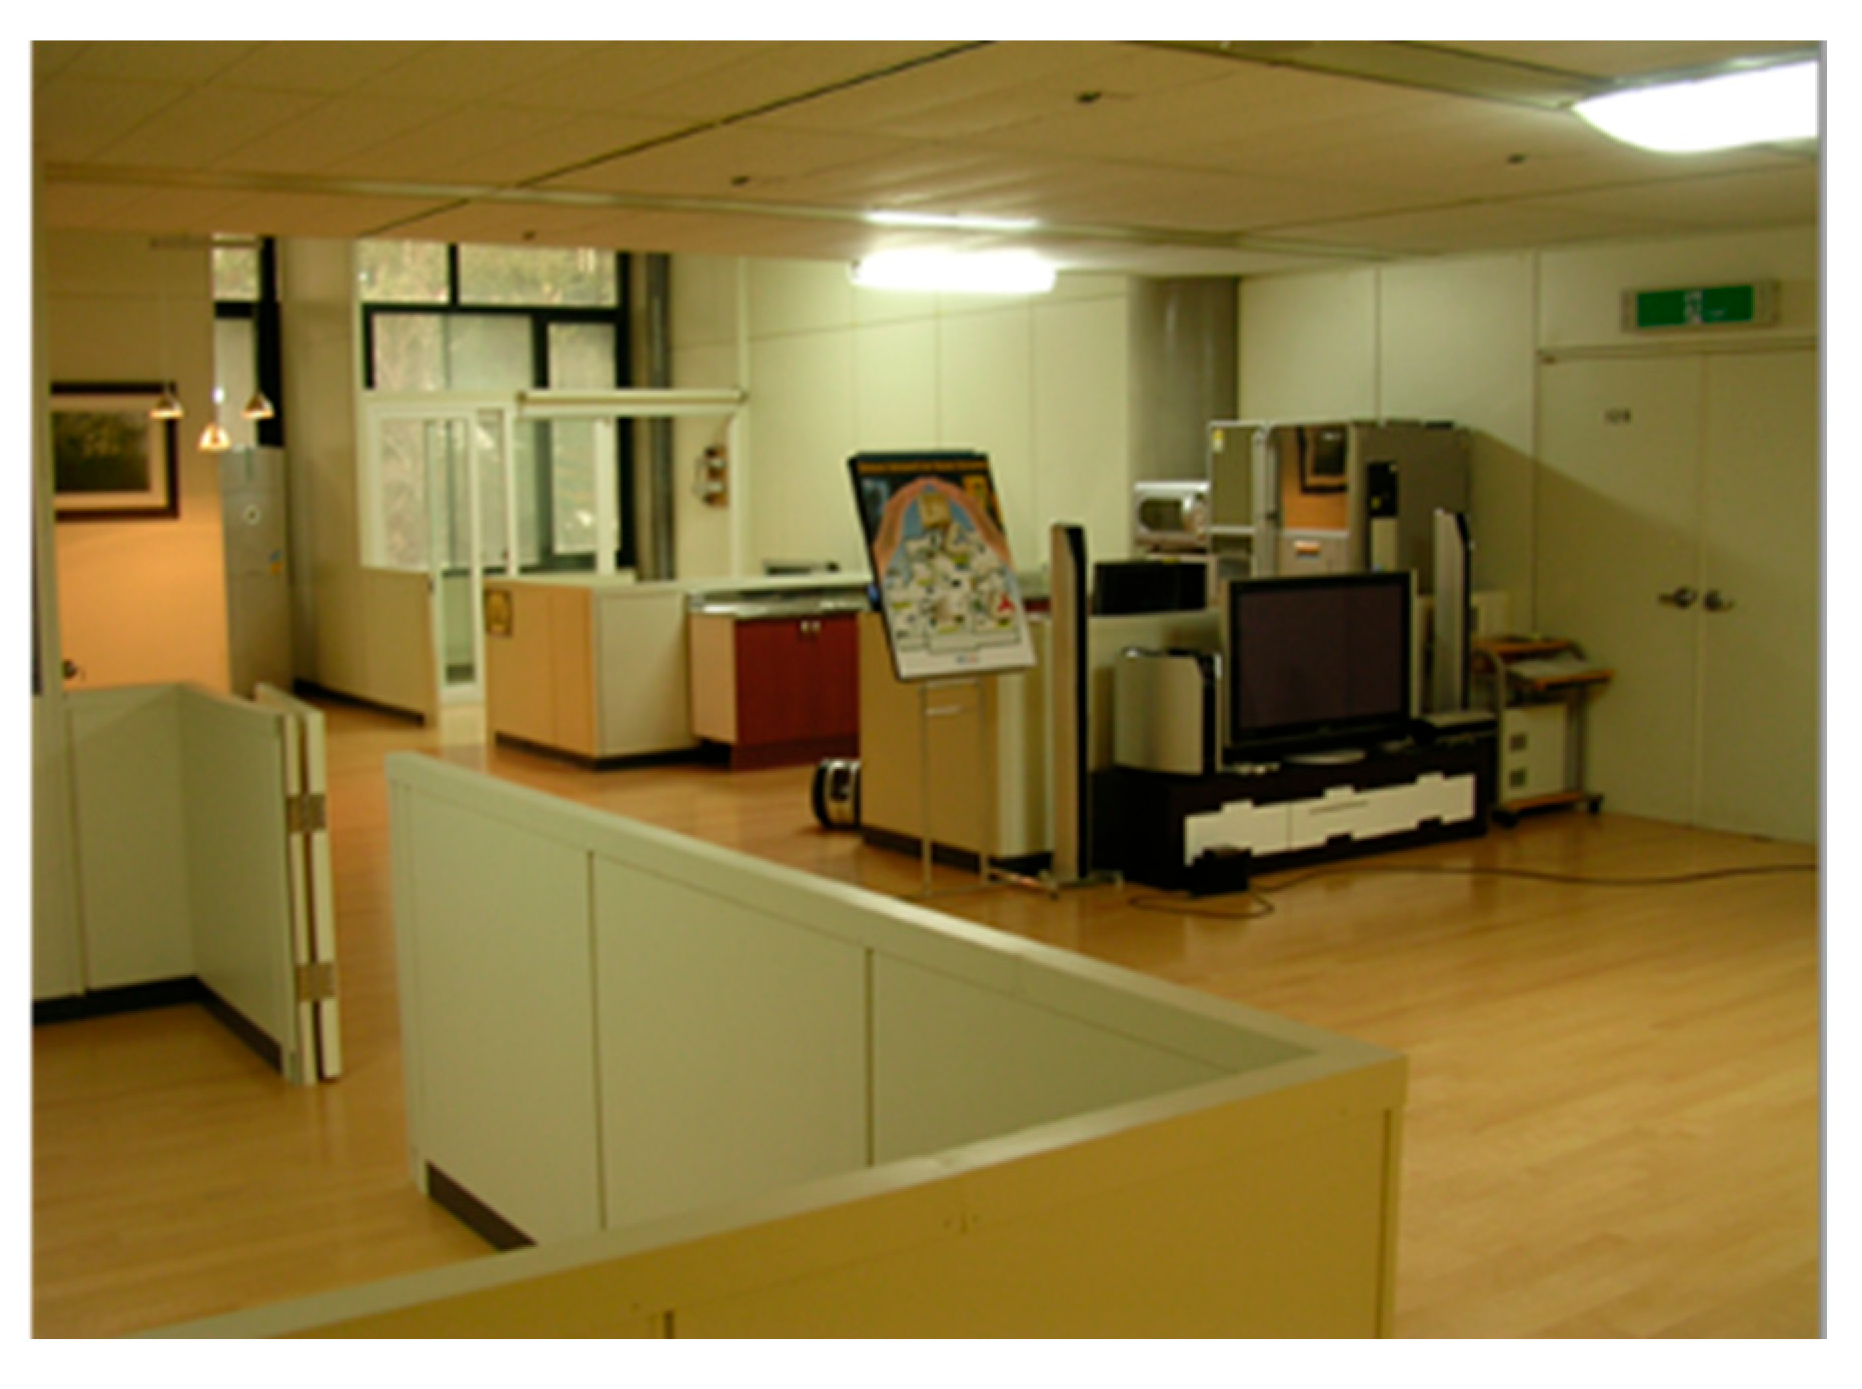
In addition, the images were acquired in an indoor environment, as indicated in
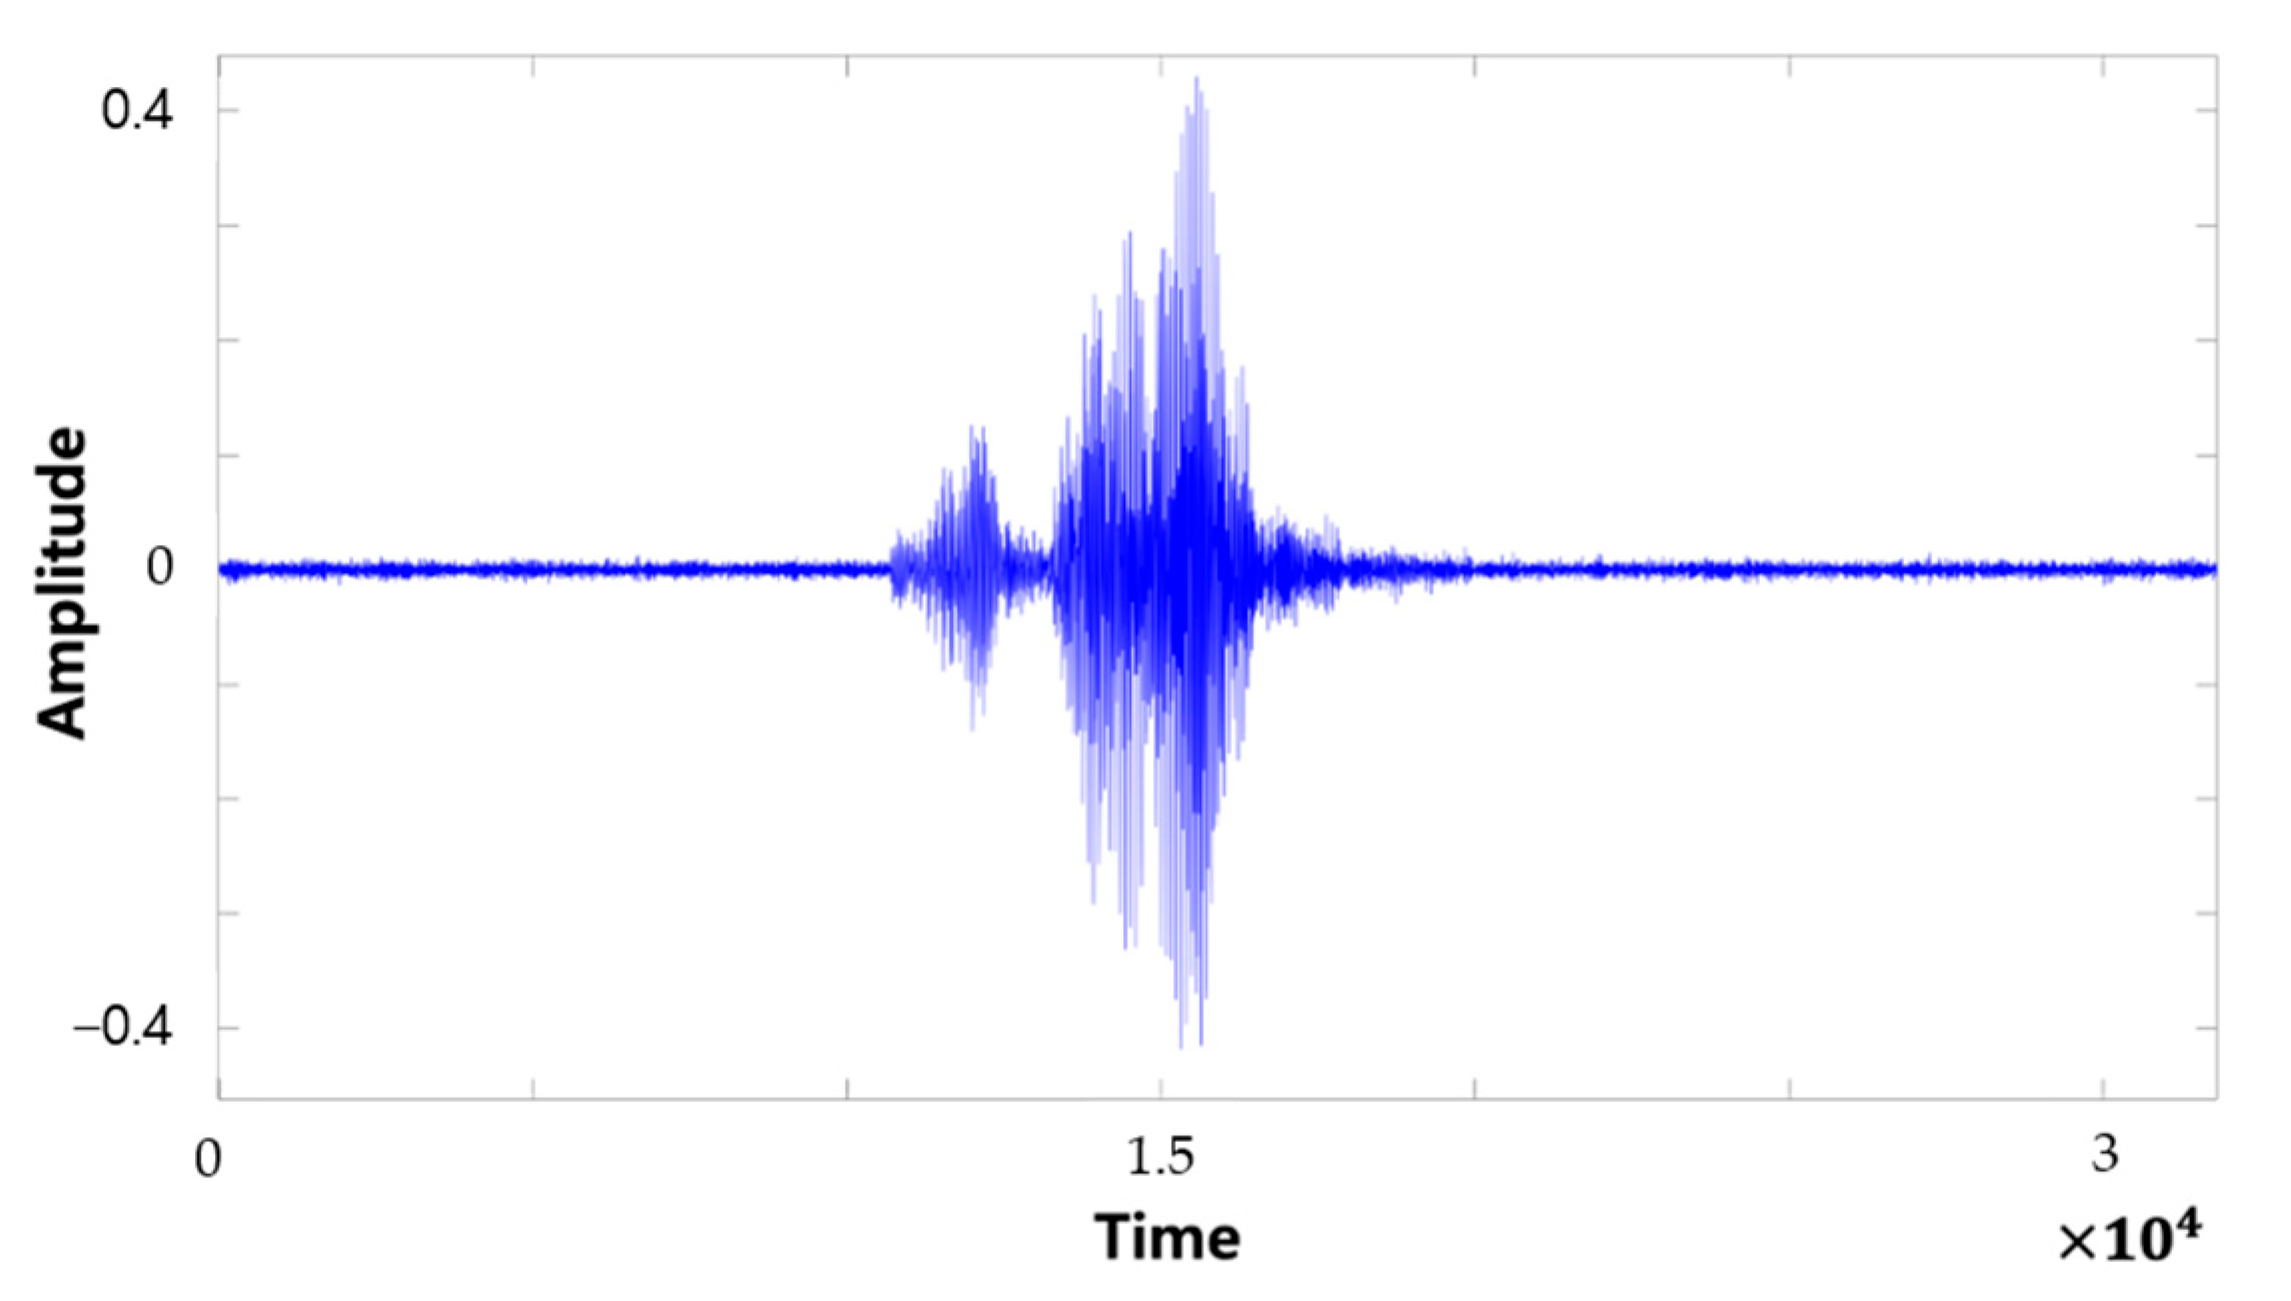
Figure 11. Each piece of data contains a voice calling out the robot by its name, “Weber”, and is in the form of a .wav file with a duration of approximately 2 s. Each sound source was acquired from the same location at 45° intervals from 0° to 180° and recorded at 1 m intervals from 1–5 m at each location, as shown in
Figure 12. Moreover, three sounds were made at each location. The form of each sound signal is shown in
Figure 13. The composition of the entire dataset is presented in
Table 2.
4.2. Sound Source Augmentation
The ETRI-SSL database consists of 120 sound signals per channel, which is a small number for training a deep-learning model. The data were augmented to prevent modeling errors such as overfitting. Because the SSL task uses time information when the sound is input to each microphone to track the location, the time information of the sound source should not change even if augmented. We used the pitch–tone shift method, which can create different types of sound signals without changing the time information. Previous studies have demonstrated the performance of this augmentation method when used as an input to a CNN for sound source classification tasks [
25]. This method changes the pitch of the sound by assigning weights to the frequency domain, excluding the time domain of the sound signal. The unit of change was set to a semitone, and the weight was modified to determine the frequency value that yielded the best performance without significantly altering the sound source. Finally, the weights were set to change the pitch in the range of [0.5, 2], which created a sound signal that was the most similar to the original despite the differences. The pitch–tone shift augmentation method is expressed in Equations (5)–(7).
The original sound signal
was converted into the time–frequency domain using STFT. Subsequently, the pitch change rate
was applied to the frequency value, as in Equation (6), to modulate the pitch. Next, the signal in the time–frequency domain with the converted pitch was reconverted into the time domain through the inverse STFT to extract the 1D sound signal with the converted pitch. The difference between the augmented and original data is highlighted in
Figure 14. As explained previously, the time information in the figure has not changed, and only the amplitude component has changed.
For data augmentation, we divided them evenly into 40 training data points and 80 validation data points for each class. Subsequently, the pitch–tone shift method was used to augment the training data seven times, which resulted in 280 data points. To verify the generalization performance of the network and prevent overfitting, we did not augment the validation data and used only the original sound signal. Finally, the total training data points was 320 per channel, while the total validation data remained 80 per channel.
4.3. Experimental Results
The SSL performance of the examined methods was analyzed using the ETRI-SSL database.
Table 3 and
Table 4 summarize the training environment and parameters.
The classification performance for the classes [0, 45, 90, 135, 180, −45, −90, −135] in the ETRI-SSL database was evaluated. In each experiment, the performance was analyzed through five performance evaluation indices: accuracy, confusion matrix, recall, precision, and F1 score. First, the experimental performance with the ETRI-SSL database is presented.
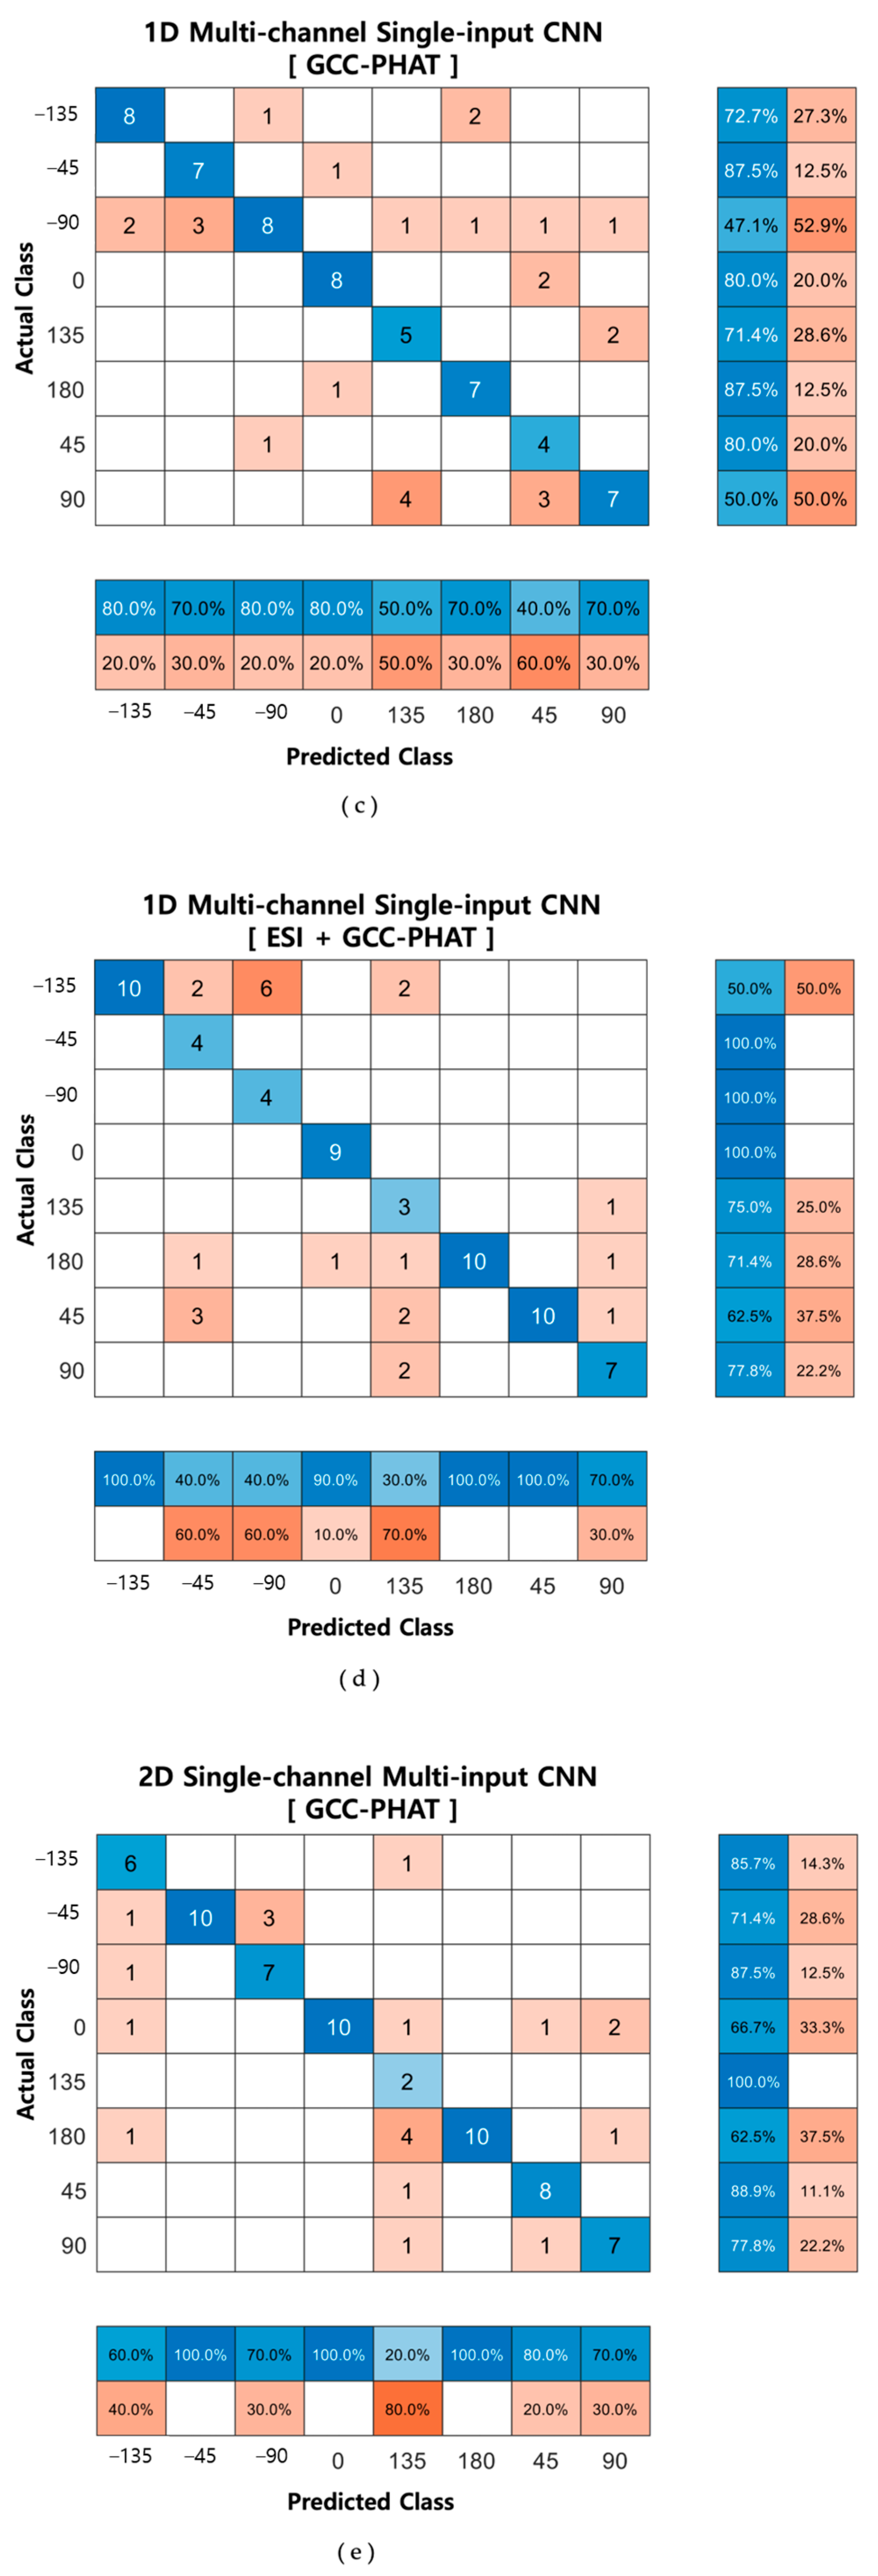
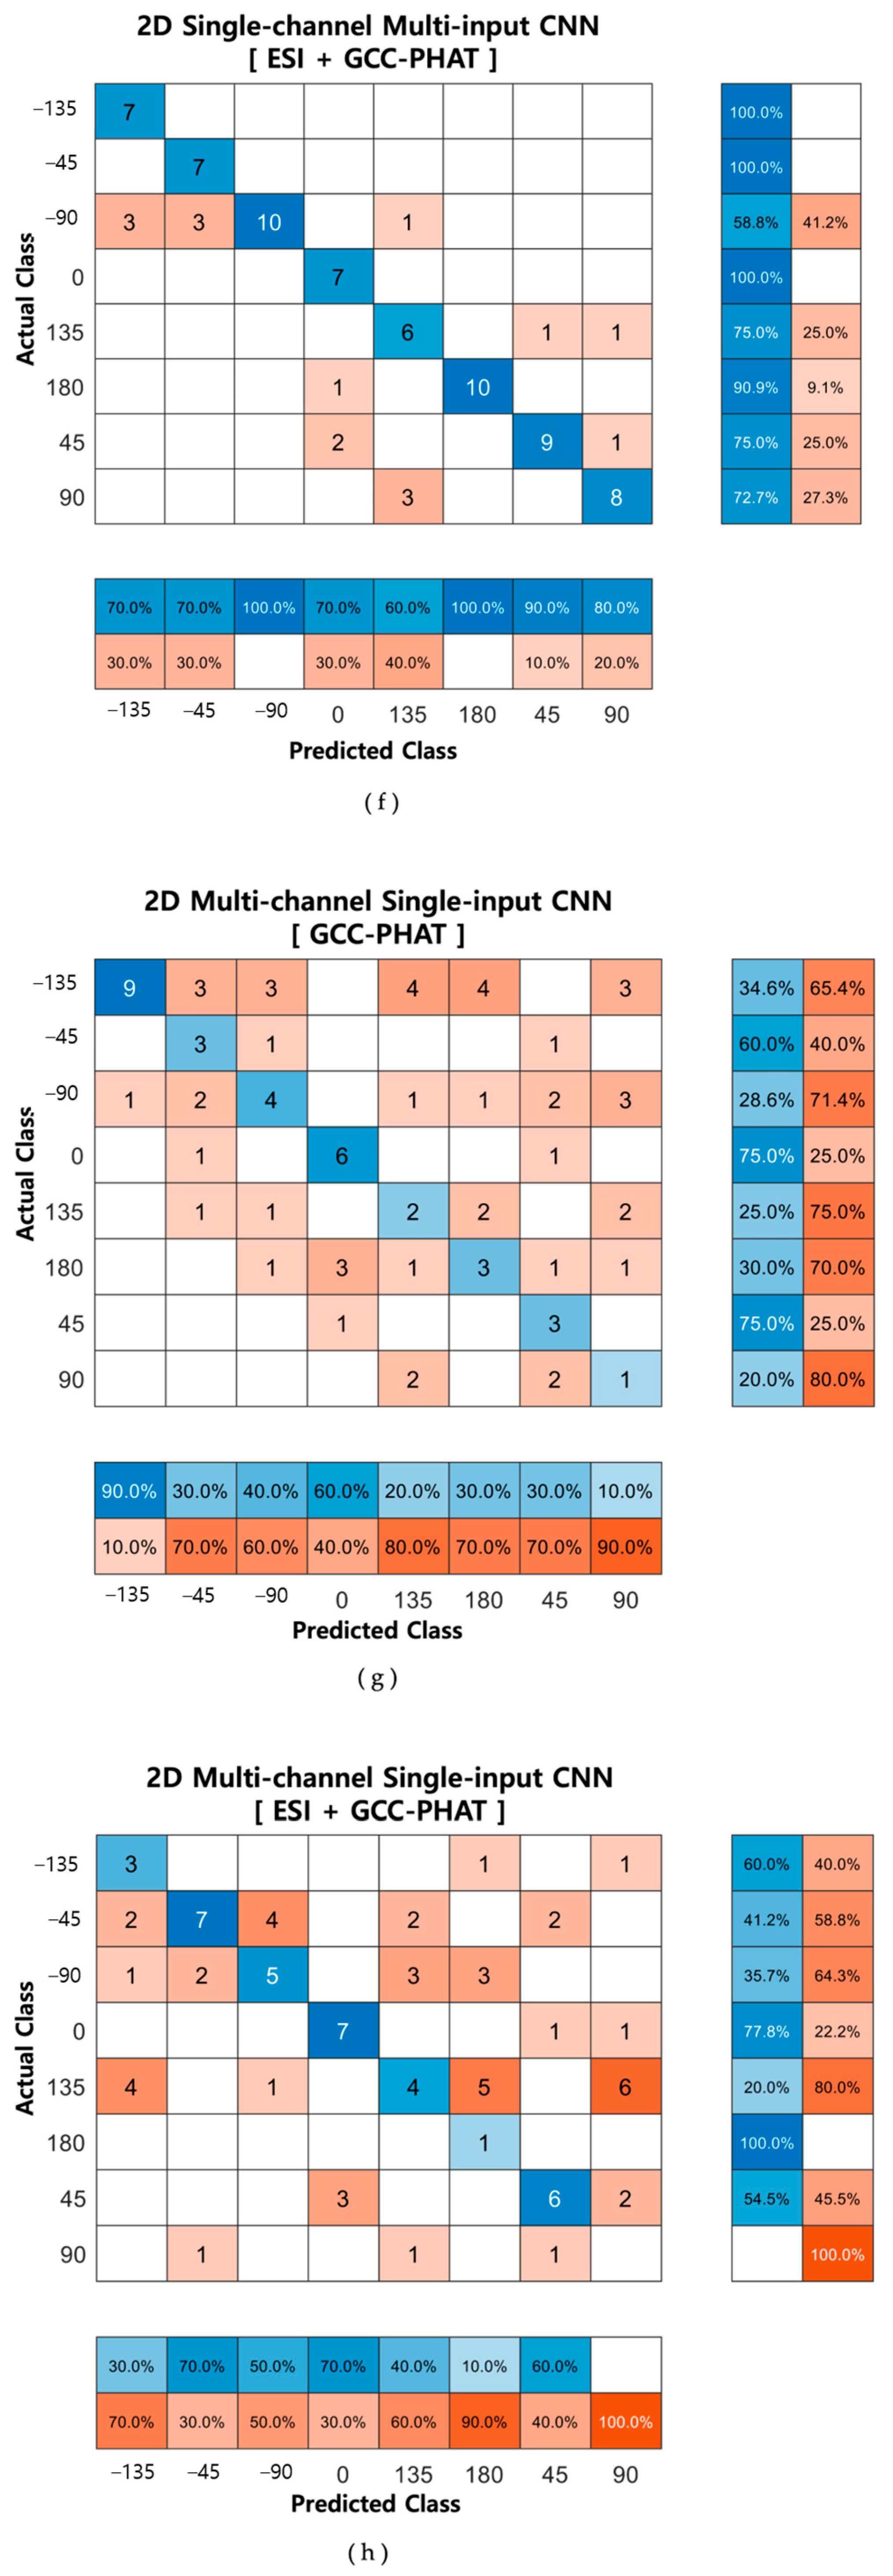
Figure 15 shows the confusion matrices of the proposed method and a method similar to an existing approach.
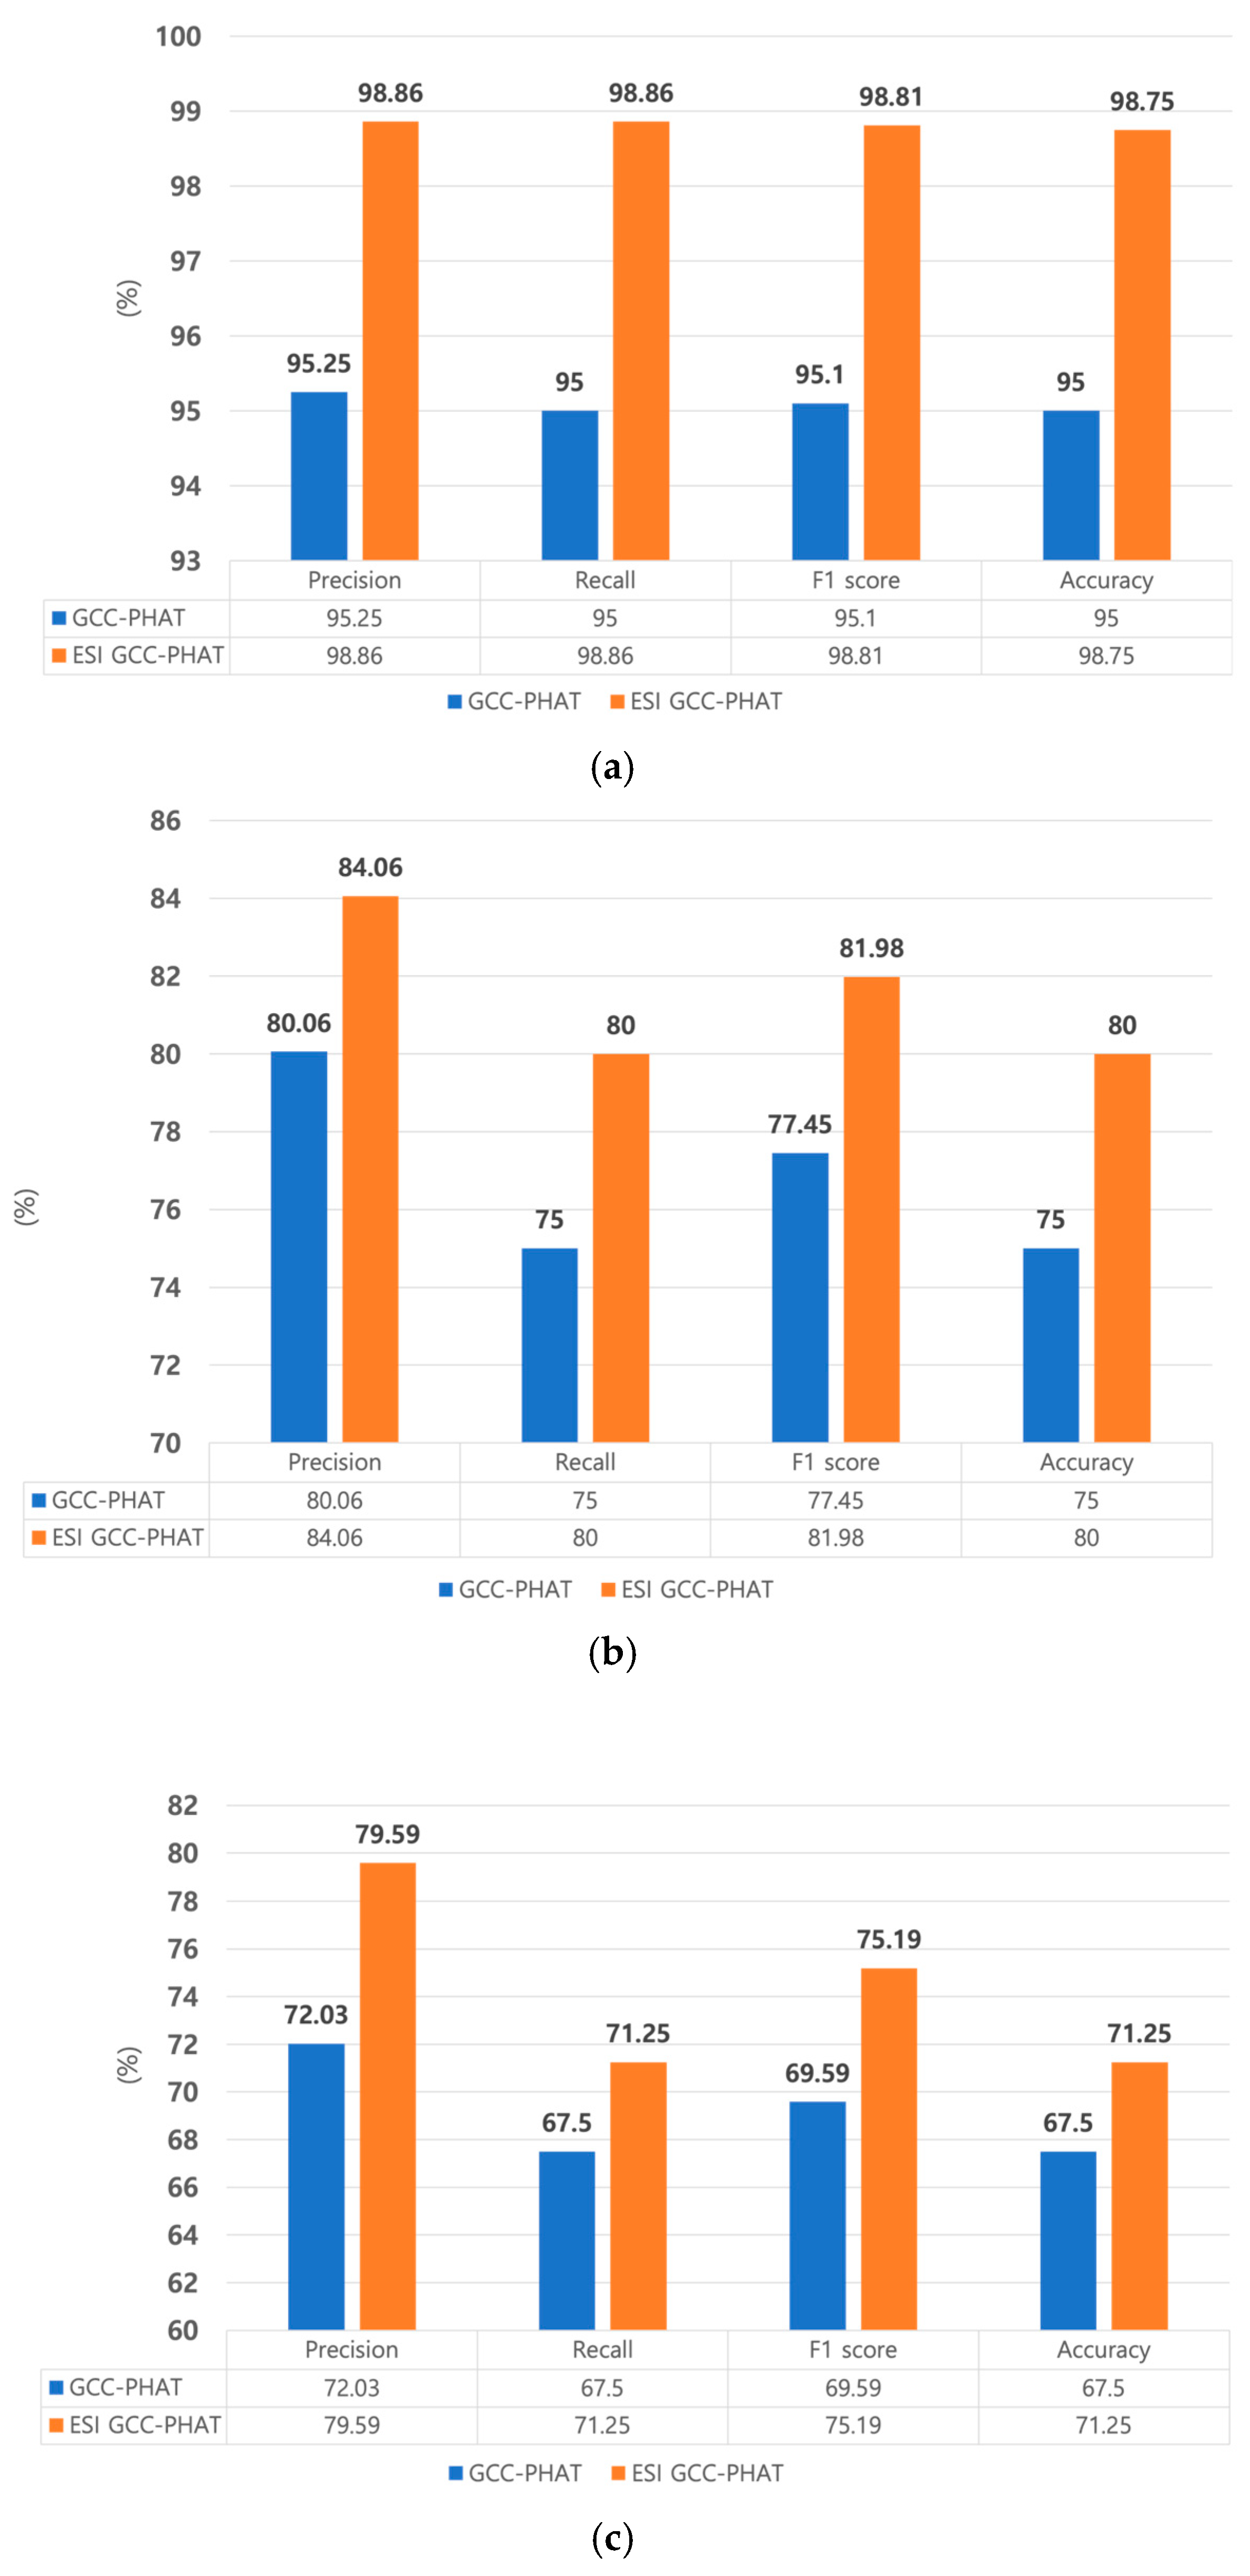
Figure 16 compares the recall, precision, and F1 scores of the different methods.
Table 5 also compares and analyzes their accuracies.
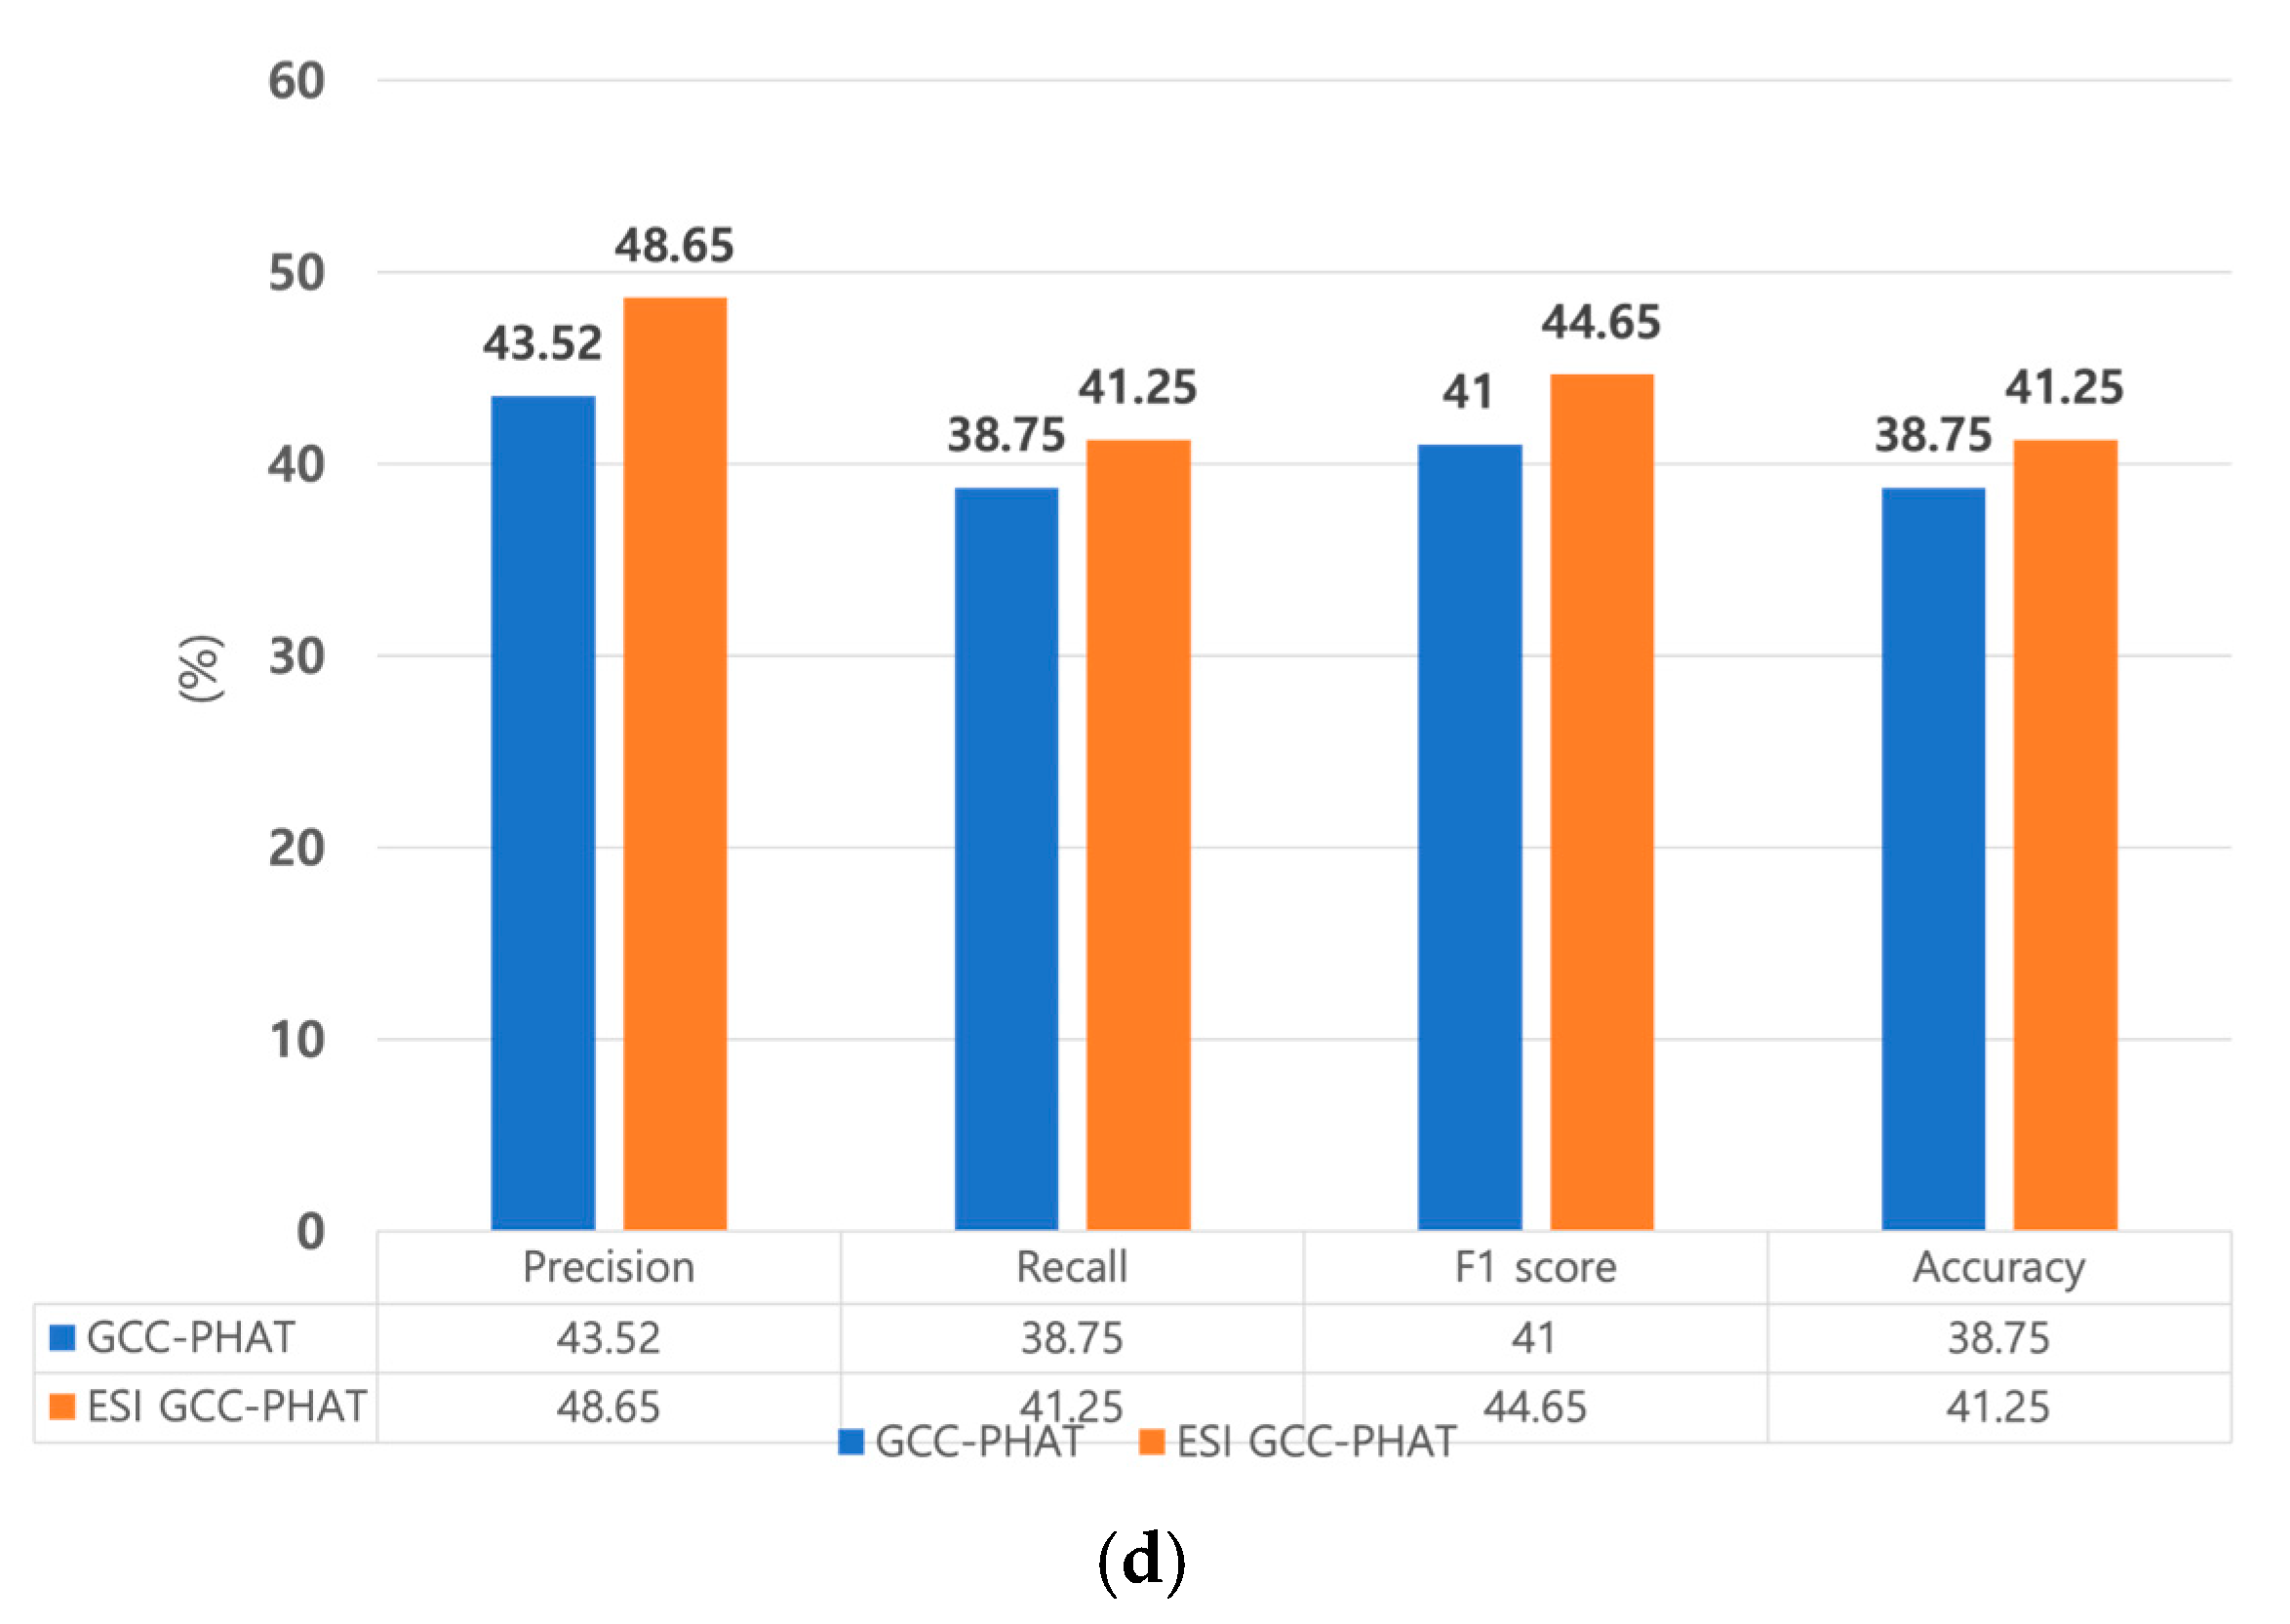
By comparing the confusion matrix for various methods, we confirmed that the highest accuracies were estimated when GCC-PHAT was extracted from the original signal and when it was extracted from the ESI and used as input to the 1D multi-channel input CNN. In addition, when comparing the two methods, the proposed method classified the location more accurately than the existing method. As indicated in
Table 5 and
Figure 16, extracting GCC-PHAT from the ESI and using it as input to the two networks led to better performance than extracting only GCC-PHAT from the original speech and using it as the input, in terms of accuracy, precision, recall, and F1 score. These results also indicate that ESI extraction is an essential step in sound source location tracking. In addition, of the two types of networks, the one using 1D input showed higher accuracies of 98.75% and 71.25% with a shorter learning time, and the proposed single-channel input CNN showed high accuracy regardless of the dimension of the input signal. In conclusion, we proved that the ESI GCC-PHAT method with the ID single-channel multi-input CNN network is the most suitable method. Also, to check whether the difference between the accuracy values of the one-dimensional, single-channel multi-input method and multi-channel single-input method models based on the ESI + GCC-PHAT input values is significant, we performed a
t-test. The
p-value is significant with a value of
p < 0.001.
Table 6 compares the results of this study, which used the ETRI-SSL database to apply the ESI and GCC-PHAT algorithms for deep learning-based SSL, with those of the SSL method based on the geometric information of the microphone array by extracting the GCC in the ESI using the ETRI-SSL database proposed by Kwak et al. [
14]. The performance of the geometric method was considered accurate if the estimated angle was within an error of ±15°; this method is called the localization success rate (LSR), and it is similar to categorical classification accuracy. The performance of the method using only GCC was 71.76%. The performance of the method using only GCC-PHAT was 69.40%. The method that extracted GCC from the ESI exhibited an accuracy of 90.25%. The proposed method, which extracted GCC-PHAT from the ESI, performed the best at an accuracy of 98.75%. This confirms that the proposed method using ESI and GCC-PHAT is most suitable for SSL.
Table 7 presents a comparison of the training times for the four input methods. The multi-channel input method had the shortest training time but low accuracy. Therefore, the multi-channel input method is not as suitable as the single-channel input method.
5. Conclusions
This study proposed an SSL system for a robotic environment with interferences such as noise and reverberation. In robots, SSL is an essential task for HRI. A crucial aspect of HRI is the robot’s ability to mimic a human. When a robot receives a command from the user, it identifies the location of the user by voice, moves its body to the corresponding location, and, finally, identifies the user and executes the command. For a robot to interact with a human and execute the command, the first step is to identify the user’s location. This process must resemble human behavior, i.e., it must identify the location through auditory information and not just visual data. Therefore, the most important task in HRI is to identify the location of the sound source. If the location is clearly identified, the user needs can be addressed more accurately. However, because tracking is generally performed indoors in a robotic environment, it may be perturbed by reverberations and environmental noise. These factors interfere with the input time information from the human voice, causing errors in the identification task.
To address this issue, the proposed scheme includes two steps: sound signal processing to minimize noise and developing a single-channel input CNN to learn the detailed temporal information of the sound source. The first step extracts the ESI, which suppresses the noise from the original signal. To achieve this, the speech signal from the robot’s microphone array is passed through a linear prediction filter, extracting a linearly predicted signal. Finally, the LP residual, which is the difference between the original and linearly predicted signals, is calculated. In the second step, GCC-PHAT, which is robust to noise, is applied to the LP residual signal to extract the cross-correlation signal of each adjacent microphone pair, thereby obtaining information on the location. The cross-correlation signal extracted by suppressing the noise is input to a single-channel input CNN, which learns more comprehensive and precise time information between each microphone pair, enabling the classification of the location of the sound source.
To verify the proposed method, we conducted experiments using the ETRI-SSL database acquired from the robotic environment at ETRI. As evident in the experimental results, the proposed method, which involves extracting the ESI and cross-correlation signals and training a single-channel input CNN, exhibited the highest accuracy. In addition, we confirm that the method using 1D signals as input showed higher accuracy for 2D signals and that the CNN learned the information in a shorter time. This also confirms that the method is suitable for SSL. In addition, we determined the extent to which noise and reverberation affect the voice signals during tracking.
This study was conducted only in a database acquired in a specific environment and from a robot with a specific type of microphone array. Since the database was acquired in a testbed set up to represent a typical home environment in a defined size room, it contains only typical environmental noise. Therefore, in the future, we will study additional noise sources that may be encountered in real-time robotic environments, as well as different reverberation effects, so that the database can be used in different indoor environments. We will also cover learning speed and resource consumption for real-time problems. As mentioned above, this study is limited to three microphones and a specific type of array, which are commonly attached to robots. The difficulty is that, if the placement or number of microphones changes, a new database must be acquired. Therefore, in future research, we plan to generalize the system so that it can be used universally in various situations without the above limitations. Also, this study was conducted in a single-sound source environment. However, in a real-world environment, there is a possibility of multiple voices. Tracking the location of a sound source in a multi-source environment is a complex task that requires additional techniques, such as sound source separation. Therefore, we plan to study multi-source environments by combining the proposed system with sound source separation techniques in the future.
Author Contributions
Conceptualization, H.-M.J. and K.-C.K.; methodology, H.-M.J. and T.-W.K.; software, H.-M.J. and T.-W.K.; validation, H.-M.J. and K.-C.K.; formal analysis, H.-M.J. and T.-W.K.; investigation, H.-M.J. and T.-W.K.; resources, H.-M.J. and T.-W.K.; data curation, H.-M.J. and T.-W.K.; writing—original draft preparation, H.-M.J.; writing—review and editing, H.-M.J. and K.-C.K.; visualization, H.-M.J. and K.-C.K.; supervision, K.-C.K.; project administration K.-C.K.; funding acquisition, K.-C.K. All authors have read and agreed to the published version of the manuscript.
Funding
This study was supported by research fund from Chosun University, 2024.
Institutional Review Board Statement
Not applicable.
Informed Consent Statement
Not applicable.
Data Availability Statement
Data are contained within the article [
14].
Conflicts of Interest
The authors declare no conflicts of interest.
References
- Okuno, H.G.; Nakadai, K. Robot audition: Its rise and perspectives. In Proceedings of the 2015 IEEE International Conference on Acoustics, Speech and Signal Processing (ICASSP), South Brisbane, QLD, Australia, 19–24 April 2015; pp. 5610–5614. [Google Scholar]
- Chen, H.; Leu, M.C.; Yin, Z. Real-time multi-modal human–robot collaboration using gestures and speech. J. Manuf. Sci. Eng. 2022, 144, 101007. [Google Scholar] [CrossRef]
- Tourbabin, V.; Rafaely, B. Theoretical Framework for the Optimization of Microphone Array Configuration for Humanoid Robot Audition. IEEE/ACM Trans. Audio Speech Lang. Process. 2014, 22, 1803–1814. [Google Scholar] [CrossRef]
- Rascon, C.; Meza, I. Localization of sound sources in robotics: A review. Robot. Auton. Syst. 2017, 96, 184–210. [Google Scholar] [CrossRef]
- Brutti, A.; Omologo, M.; Svaizer, P. Comparison Between Different Sound Source Localization Techniques Based on a Real Data Collection. In Proceedings of the 2008 Hands-Free Speech Communication and Microphone Arrays, Trento, Italy, 6–8 May 2008; pp. 69–72. [Google Scholar]
- Tang, H. DOA Estimation Based on MUSIC Algorithm. Bachelor’s Thesis, Linnaeus University, Småland, Sweden, 2014. [Google Scholar]
- Traa, J.; Wingate, D.; Stein, N.D.; Smaragdis, P. Robust Source Localization and Enhancement with a Probabilistic Steered Response Power Model. IEEE/ACM Trans. Audio Speech Lang. Process. 2016, 24, 493–503. [Google Scholar] [CrossRef]
- Zhao, X.; Zhou, L.; Tong, Y.; Qi, Y.; Shi, J. Robust Sound Source Localization Using Convolutional Neural Network Based on Microphone Array. Intell. Autom. Soft Comput. 2021, 30, 361–371. [Google Scholar] [CrossRef]
- Liu, H.; Zhang, X.; Li, P.; Yao, Y.; Zhang, S.; Xiao, Q. Time Delay Estimation for Sound Source Localization Using CNN-Based Multi-GCC Feature Fusion. IEEE Access 2023, 11, 140789–140800. [Google Scholar] [CrossRef]
- Gelderblom, F.B.; Liu, Y.; Kvam, J.; Myrvoll, T.A. Synthetic Data For Dnn-Based Doa Estimation of Indoor Speech. In Proceedings of the ICASSP 2021—2021 IEEE International Conference on Acoustics, Speech and Signal Processing (ICASSP), Toronto, ON, Canada, 6–11 June 2021; pp. 4390–4394. [Google Scholar]
- Peng, C.; Changliu, N. Sound Source Localization Based on Convolutional Neural Network. In Proceedings of the 2022 IEEE 5th International Conference on Computer and Communication Engineering Technology (CCET), Beijing, China, 19–21 August 2022; pp. 229–232. [Google Scholar]
- Wang, J.; Qian, X.; Pan, Z.; Zhang, M.; Li, H. GCC-PHAT with Speech-oriented Attention for Robotic Sound Source Localization. In Proceedings of the 2021 IEEE International Conference on Robotics and Automation (ICRA), Xi’an, China, 30 May–5 June 2021; pp. 5876–5883. [Google Scholar]
- Hu, F.; Song, X.; He, R.; Yu, Y. Sound source localization based on residual network and channel attention module. Sci. Rep. 2023, 13, 5443. [Google Scholar] [CrossRef] [PubMed]
- Kwak, K.-C.; Kim, S.-S. Sound source localization with the aid of excitation source information in home robot environments. IEEE Trans. Consum. Electron. 2008, 54, 852–856. [Google Scholar] [CrossRef]
- Pak, J.; Shin, J.W. Sound Localization Based on Phase Difference Enhancement Using Deep Neural Networks. IEEE/ACM Trans. Audio Speech Lang. Process. 2019, 27, 1335–1345. [Google Scholar] [CrossRef]
- Cordourier, H.; Meyer, P.; Huang, J.; Ontiveros, J.; Lu, H. GCC-PHAT Cross-Correlation Audio Features for Simultaneous Sound Event Localization and Detection (SELD) on Multiple Rooms. In Proceedings of the Detection and Classification of Acoustic Scenes and Events 2019 Workshop (DCASE2019), New York, NY, USA, 25–26 October 2019; pp. 55–58. [Google Scholar]
- Huang, D.L.; Perez, R.F. Sseldnet: A fully end-to-end sample-level framework for sound event localization and detection. In Proceedings of the Detection and Classification of Acoustic Scenes and Events (DCASE), Online, 15–19 November 2021. [Google Scholar]
- Bologni, G.; Heusdens, R.; Martinez, J. Acoustic Reflectors Localization from Stereo Recordings Using Neural Networks. In Proceedings of the ICASSP 2021—2021 IEEE International Conference on Acoustics, Speech and Signal Processing (ICASSP), Toronto, ON, Canada, 6–11 June 2021; pp. 1–5. [Google Scholar]
- Vera-Diaz, J.M.; Pizarro, D.; Macias-Guarasa, J. Towards End-to-End Acoustic Localization Using Deep Learning: From Audio Signals to Source Position Coordinates. Sensors 2018, 18, 3418. [Google Scholar] [CrossRef]
- Pujol, H.; Bavu, É.; Garcia, A. BeamLearning: An end-to-end deep learning approach for the angular localization of sound sources using raw multichannel acoustic pressure data. J. Acoust. Soc. Am. 2021, 149, 4248–4263. [Google Scholar] [CrossRef]
- Sun, X.; Hu, Y.; Zhu, X.; He, L. Sound event localization and detection based on adaptive hybrid convolution and multi-scale feature extractor. In Proceedings of the 2021 Detection and Classification of Acoustic Scenes and Events (DCASE), Online, 15–19 November 2021. [Google Scholar]
- An, I.; An, G.; Kim, T.; Yoon, S.-E. Microphone Pair Training for Robust Sound Source Localization with Diverse Array Configurations. IEEE Robot. Autom. Lett. 2024, 9, 319–326. [Google Scholar] [CrossRef]
- Tan, T.-H.; Lin, Y.-T.; Chang, Y.-L.; Alkhaleefah, M. Sound Source Localization Using a Convolutional Neural Network and Regression Model. Sensors 2021, 21, 8031. [Google Scholar] [CrossRef] [PubMed]
- Zhu, H.; Wan, H. Single Sound Source Localization Using Convolutional Neural Networks Trained with Spiral Source. In Proceedings of the 2020 5th International Conference on Automation, Control and Robotics Engineering (CACRE), Dalian, China, 19–20 September 2020; pp. 720–724. [Google Scholar]
- Salamon, J.; Bello, J.P. Deep Convolutional Neural Networks and Data Augmentation for Environmental Sound Classification. IEEE Signal Process. Lett. 2017, 24, 279–283. [Google Scholar] [CrossRef]
Figure 1.
SSL process diagram in robotic environment.
Figure 1.
SSL process diagram in robotic environment.
Figure 2.
SSL experiment process.
Figure 2.
SSL experiment process.
Figure 3.
Two-step sound source feature-extraction process.
Figure 3.
Two-step sound source feature-extraction process.
Figure 4.
LP residual extraction process.
Figure 4.
LP residual extraction process.
Figure 8.
Single-channel, multi-input CNN structure.
Figure 8.
Single-channel, multi-input CNN structure.
Figure 5.
Linear prediction.
Figure 5.
Linear prediction.
Figure 6.
Sound source time of arrival difference.
Figure 6.
Sound source time of arrival difference.
Figure 7.
Cross-correlation signal.
Figure 7.
Cross-correlation signal.
Figure 9.
Robot and multi-channel board.
Figure 9.
Robot and multi-channel board.
Figure 10.
Microphone array.
Figure 10.
Microphone array.
Figure 11.
Data acquisition environment.
Figure 11.
Data acquisition environment.
Figure 12.
Sound source location.
Figure 12.
Sound source location.
Figure 13.
ETRI-SSL database sound signal.
Figure 13.
ETRI-SSL database sound signal.
Figure 14.
Pitch–tone shift example.
Figure 14.
Pitch–tone shift example.
Figure 15.
Confusion matrices of each method: (a) input: GCC-PHAT, Network: 1D single-channel multi-input CNN; (b) input: ESI + GCC-PHAT, Network: 1D single-channel multi-input CNN; (c) input: GCC-PHAT, Network: 1D multi-channel single-input CNN; (d) input: ESI + GCC-PHAT, Network: 1D multi-channel single-input CNN; (e) input: GCC-PHAT, Network: 2D single-channel multi-input CNN; (f) input: ESI + GCC-PHAT, Network: 2D single-channel multi-input CNN; (g) input: GCC-PHAT, Network: 2D multi-channel single-input CNN; (h) input: ESI + GCC-PHAT, Network: 2D multi-channel single-input CNN.
Figure 16.
Comparison of precision, recall, f1 score, and accuracy of each method: (a) 1D single-channel multi-input (proposed); (b) 2D single-channel multi-input; (c) 1D multi-channel single-input; (d) 2D multi-channel single-input.
Figure 16.
Comparison of precision, recall, f1 score, and accuracy of each method: (a) 1D single-channel multi-input (proposed); (b) 2D single-channel multi-input; (c) 1D multi-channel single-input; (d) 2D multi-channel single-input.
Table 1.
Recent SSL research.
Table 1.
Recent SSL research.
| Autor | Input | Network | Database |
|---|
| An et al. [22] | STFT | MLFB + HiFTA-net | SSLR + DCASE2021 + TUT-CA |
| Hu et al. [13] | Log-mel spectrogram + GCC-PHAT | CNN + RNN | Public SSL database |
| Liu et al. [9] | Multi-GCC | CNN | Simulated database |
| Peng et al. [11] | GCC-PHAT spectrogram | LeNet-5 based CNN | Simulated database |
| Huang et al. [17] | Raw signal | CNN + Conformer | TAU-NIGENS |
| Wang et al. [12] | GCC-PHAT-SM | CNN based filter + SNN | SSLR |
| Gelderblom et al. [10] | GCC-PHAT vector | MLP | Simulated database |
| Bologni et al. [18] | Raw signal | FCN | Simulated database |
| Pujol et al. [20] | Raw signal | End to End CNN | Simulated database |
| Sun et al. [21] | Log-mel spectrogram + Intensity vector | Adaptive Hybrid CNN | TAU-NIGENS |
| Tan et al. [23] | IPD | CNN + Regression | Simulated database |
| Zhu et al. [24] | CGG-PHAT | CNN | Simulated database |
| Pak et al. [15] | IPD | DNN | Simulated database |
| Cordourier et al. [16] | Magnitude spectrogram + Phase spectrogram | CNN | DCASE 2019 Task 3 |
| Vera-Diaz et al. [19] | Raw signal | CNN | Simulated database |
| Kwak et al. [14] | ESI + GCC | Geometric Method | ETRI-SSL |
Table 2.
Data composition.
Table 2.
Data composition.
| Angle (°) | 0 | 45 | 90 | 135 | 180 | −45 | −90 | −135 |
| Distance | 1–5 m (per angle) |
| Trials | 3 (per angle) |
| Total Data | 120 (per angle 15) |
Table 3.
Training environment.
Table 3.
Training environment.
| GPU | RAM | CPU | Software |
|---|
NVIDIA
GeForce 4060 Ti | 64.0 GB | Intel(R) Core(TM)
i7-14700F | MATLAB
R2024b |
Table 4.
Training parameters.
Table 4.
Training parameters.
| Optimization Function | Learning Rate | Loss | Epoch | Mini Batch |
|---|
| Adam | 0.001 | Cross entropy | 300 | 32 |
Table 5.
Accuracy comparison.
Table 5.
Accuracy comparison.
| | GCC-PHAT | ESI + GCC-PHAT
(Proposed Preprocessing) |
|---|
2D multi-channel
single-input | 38.75% | 41.25% |
1D multi-channel
single-input | 67.50% | 71.25% |
2D single-channel
multi-input | 75.00% | 80.00% |
1D single-channel
multi-input
(Proposed Network) | 95.00% | 98.75% |
Table 6.
Comparison of SSL performance with previous study.
Table 6.
Comparison of SSL performance with previous study.
| Method | Feature | Performance |
|---|
Geometric Method [14]
LSR (%) *
(FOA = ±15°) | GCC | 71.76% |
| GCC-PHAT | 69.40% |
| ESI + GCC | 90.25% |
Deep Learning
Accuracy (%) | ESI + GCC-PHAT | 98.75% |
Table 7.
Training time comparison for each method.
Table 7.
Training time comparison for each method.
| | 1D Single-Channel
Multi-Input | 2D Single-Channel
Multi-Input | 1D Multi-Channel
Single-Input | 2D Multi-Channel
Single-Input |
|---|
Training
Time (min) | 16 | 31 | 7 | 12 |
| Disclaimer/Publisher’s Note: The statements, opinions and data contained in all publications are solely those of the individual author(s) and contributor(s) and not of MDPI and/or the editor(s). MDPI and/or the editor(s) disclaim responsibility for any injury to people or property resulting from any ideas, methods, instructions or products referred to in the content. |
© 2025 by the authors. Licensee MDPI, Basel, Switzerland. This article is an open access article distributed under the terms and conditions of the Creative Commons Attribution (CC BY) license (https://creativecommons.org/licenses/by/4.0/).


