Article

Mechanoreceptor-Inspired Tactile Sensor Topological Configurations for Hardness Classification in Robotic Grippers

Wolfson School of Mechanical, Electrical, and Manufacturing Engineering, Loughborough University, Loughborough LE11 3TU, UK
*
Author to whom correspondence should be addressed.
Electronics 2025, 14(4), 674; https://doi.org/10.3390/electronics14040674
Submission received: 3 January 2025 / Revised: 29 January 2025 / Accepted: 30 January 2025 / Published: 9 February 2025

Abstract

:
Human hands have the unique ability to classify material properties, such as hardness, using mechanoreceptors and tactile information. Previous studies have demonstrated hardness classification using Commercial Off-The-Shelf (COTS) sensors but lacked robotic integration considerations. This study explores the integration of multiple COTS sensors, inspired by mechanoreceptors, for classifying material hardness. The sensors were used to classify objects into three categories—hard, soft, and flexible—based on the qualitative Shore hardness scale. The aim was to identify the optimal sensor topology configuration that delivers high accuracy, using machine learning algorithms provided in the literature. The results suggest that the Random Forest Classifier is the most suitable algorithm, showcasing accuracies ranging from 90% to 98.7%, across various sensor topologies. The ‘PFV’ topology, comprising a potentiometer (P), force sensor (F), and vibration sensor (V), achieved the highest accuracy of 98.7%, while the ‘FPV’ and ‘FVP’ recorded accuracies between 96% and 97.5%. The topology of FPV and FVP have the most closely related configuration to that of mechanoreceptors; however, the results show that PFV outperforms this configuration. While the PFV topology marginally outperforms the mechanoreceptor-inspired configurations, the results demonstrate that bio-inspired sensor arrangements provide a robust solution for hardness classification in robotics. The PFV topology performs better than FPV in terms of prediction speed, with an average prediction time of 8.31 ms (millisecond) for PFV versus 13.93 ms for FPV. PFV and FPV achieved 12 and 13 correct predictions, respectively, out of 18 objects. The faster prediction times of PFV make it particularly advantageous for applications requiring quick and accurate decision-making for robotic applications.

1. Introduction

Human hands have the unique ability to sense and classify material properties through advanced tactile receptors known as mechanoreceptors. This natural ability inspires the development of tactile sensors for industrial robotics applications for advanced manipulation [1]. In industrial robotics, replicating this tactile sensitivity is essential for tasks like material handling and object manipulation, but current systems often lack the ability to accurately classify material properties, particularly hardness [2,3,4,5,6,7]. To address this challenge, different types of tactile sensors have been reported for material classification in the literature [3,4,5,6,7,8,9,10]. Additionally, customized sensors have been tested in several material classification cases to enhance the accuracy of machine learning (ML) algorithms [3,4,6,7]. Although these sensors demonstrated comparable accuracy, they did not achieve optimal levels in the case of hardness classification beyond binary classification [8,9,10,11,12,13,14,15]. Moreover, they can be costly, time-consuming to produce, and not readily available, limiting their deployment within existing robotic grippers. This highlights the need for readily available tactile sensors that are agile and flexible, for integration into robotics applications to obtain optimum accuracy.
To enhance material classification, research has explored the use of multiple tactile sensors to gather distinct tactile information during grasping [2,3,16,17]. Although this multi-sensor approach can improve accuracy, it has other challenges, like integration complexity, shape variability, and size. The sensors are often highly customized, expensive, and typically available only on demand. Previous studies have also investigated single-sensor solutions using COTS sensors, noting that combining sensor data as features from multiple sensors can boost ML (Machine learning) accuracy [7,8]. Despite these findings, hardness classification using single sensors remains low and impractical for real-time application. Additionally, attempts to emulate the human mechanoreceptor system by layering customized sensors to capture various tactile signals have resulted in improvements in advanced sensor and classification models [9]. However, these layered sensor systems are often too complex, fragile, or impractical for many robotic grippers, due to factors such as limited lifespan, challenging integration requirements, and the complexities of installation and maintenance [18,19,20,21,22,23].
This study extends the work of a previous investigation [7] that addressed the challenges associated with utilizing single-sensor data for hardness classification across multiple classes. This work established that aggregating COTS sensors’ data as three features can improve the hardness classification accuracy, but the overall process takes a longer time. Inspired by the layered architecture of human mechanoreceptors [10], this study explores the integration of multiple COTS sensors in different topological configurations to collect diverse tactile information during robotic grasping. Human mechanoreceptors, which detect a wide range of stimuli, from light touch to deep pressure, provide a biological blueprint for arranging sensors in layers to mimic this functionality. By applying this bio-inspired approach, this aims to improve the accuracy and responsiveness of robotic systems for hardness classification. Previous research [7] primarily evaluated the performance of individual sensors within a robotic gripper, but the process of collecting and integrating data from a single sensor was not efficient, especially when testing multiple objects. Each test required a separate run for every object and sensor, making the process time-consuming and impractical for real-time applications or larger datasets. This limitation hindered the scalability and adaptability of the system for more complex tasks, such as multi-object or material classification.
Moreover, as the number of classes increased from binary (two-class) to ternary (three-class) and quaternary (four-class) scenarios, a notable decline in classification accuracy was observed. This drop in accuracy is attributed to the growing complexity of distinguishing between additional classes with a single-sensor setup, which struggles to capture distinctions in tactile information required for more diverse classification tasks. The difficulty increases with each additional class, making it challenging to maintain high accuracy. This paper aims to investigate whether bio-inspired sensor topology configurations from COTS sensors, where tactile information can be collected simultaneously during a grasping action, can be utilized to improve ML outcomes. A multiple topological configuration approach will be employed to identify the optimal topology, which can then be validated through real-time testing. This real-time testing will be conducted using unknown cube-shaped objects within a robotic gripper. The results will assess whether the optimal topologies can accurately classify material properties, showcasing prediction, latency, and accuracy. This will present the use case of COTS tactile sensors topologies in robotic systems for precise material classification and prediction.
This paper is organized into several sections, each detailing the necessary tools, methods, and adaptations required to execute machine learning on the collected data. The sections are structured as follows: Section 2 provides a detailed review of background literature on the use of COTS sensors in hardness classification, discusses the architecture of mechanoreceptors, and identifies relevant COTS sensors from previous research and exploration of layered sensors/topology configuration in material classification tasks. Section 3 outlines the methodology for selecting COTS sensors based on prior research and arranging them in topologies inspired by mechanoreceptors. It details the process of determining the optimal sensor topology from different configurations, the explanation of expanding the Shore scale to four classes for scalability testing, and the future testing scenario. It also presents the machine learning approach applied for hardness classification, which is showcased in testing and training scenarios on data. Section 4 describes the experimental setup of the robotic gripper, including its control mechanisms and how data were collected from the sensor topologies. It lists the objects used in the experiments and explains steps involved with multiple machine learning algorithms to analyze the collected data. Section 5 presents the analysis outcomes from various machine learning algorithms employed for hardness classification. It identifies the optimal topology from multiple configurations (FVP, FPV, PVF, PFV, VFP, VPF) and extends the analysis to a four-class scenario to determine whether the optimal topology is effective across multiple classification tasks. Additionally, this section includes retesting outcomes, discussing the accuracy of the model when applied to new objects, and its suitability for real-time robotic applications.

2. Background

Tactile sensing refers to the ability of systems, such as robotic grippers or prosthetic hands, to detect and respond to physical touch, pressure, or the tactile properties of objects. It involves the use of sensors that measure various attributes, including force, texture, temperature, and slip, to mimic the human sense of touch. Understanding the tactile or physical properties of objects is crucial in robotics, as it enables robots to recognize and distinguish properties such as texture, hardness, and stiffness. This capability allows robots to perform tasks like hardness classification or material property identification, making them more intelligent and adaptable in interacting with objects.
The natural tactile abilities of human hands, driven by mechanoreceptors, provide crucial inspiration for improving robotic perception. Mechanoreceptors are specialized tactile receptors, located within the human skin, that are capable of detecting various stimuli, including pressure, force, and vibration [24]. These receptors play a critical role in our ability to perceive and interact with our environment. Understanding the mechanisms by which mechanoreceptors detect hardness is crucial for advancements in robotics research. By utilizing sensors similar to these receptors in robotic systems, it is possible to provide robots with the ability to perceive and interpret tactile information during tasks such as grasping [2,15,17,24,25,26,27]. This capability may allow robots to more accurately understand object properties and execute tasks that require sensitivity to hardness classification [9,11,15,18,28,29,30]. The architecture of mechanoreceptors involves a layered arrangement, where different types of receptors are distributed at various depths within the skin, each responding to specific stimuli [24]. Inspired by this layered architecture, sensors from existing research [7] can be arranged in a stacked configuration to mimic the mechanoreceptor structure. Sensor arrangement in such topologies can enhance the tactile sensing capabilities of robots, enabling them to perform more precise and nuanced object classification and handling. By adopting this bio-inspired approach, robotic systems can achieve an advanced level of tactile perception and functionality.

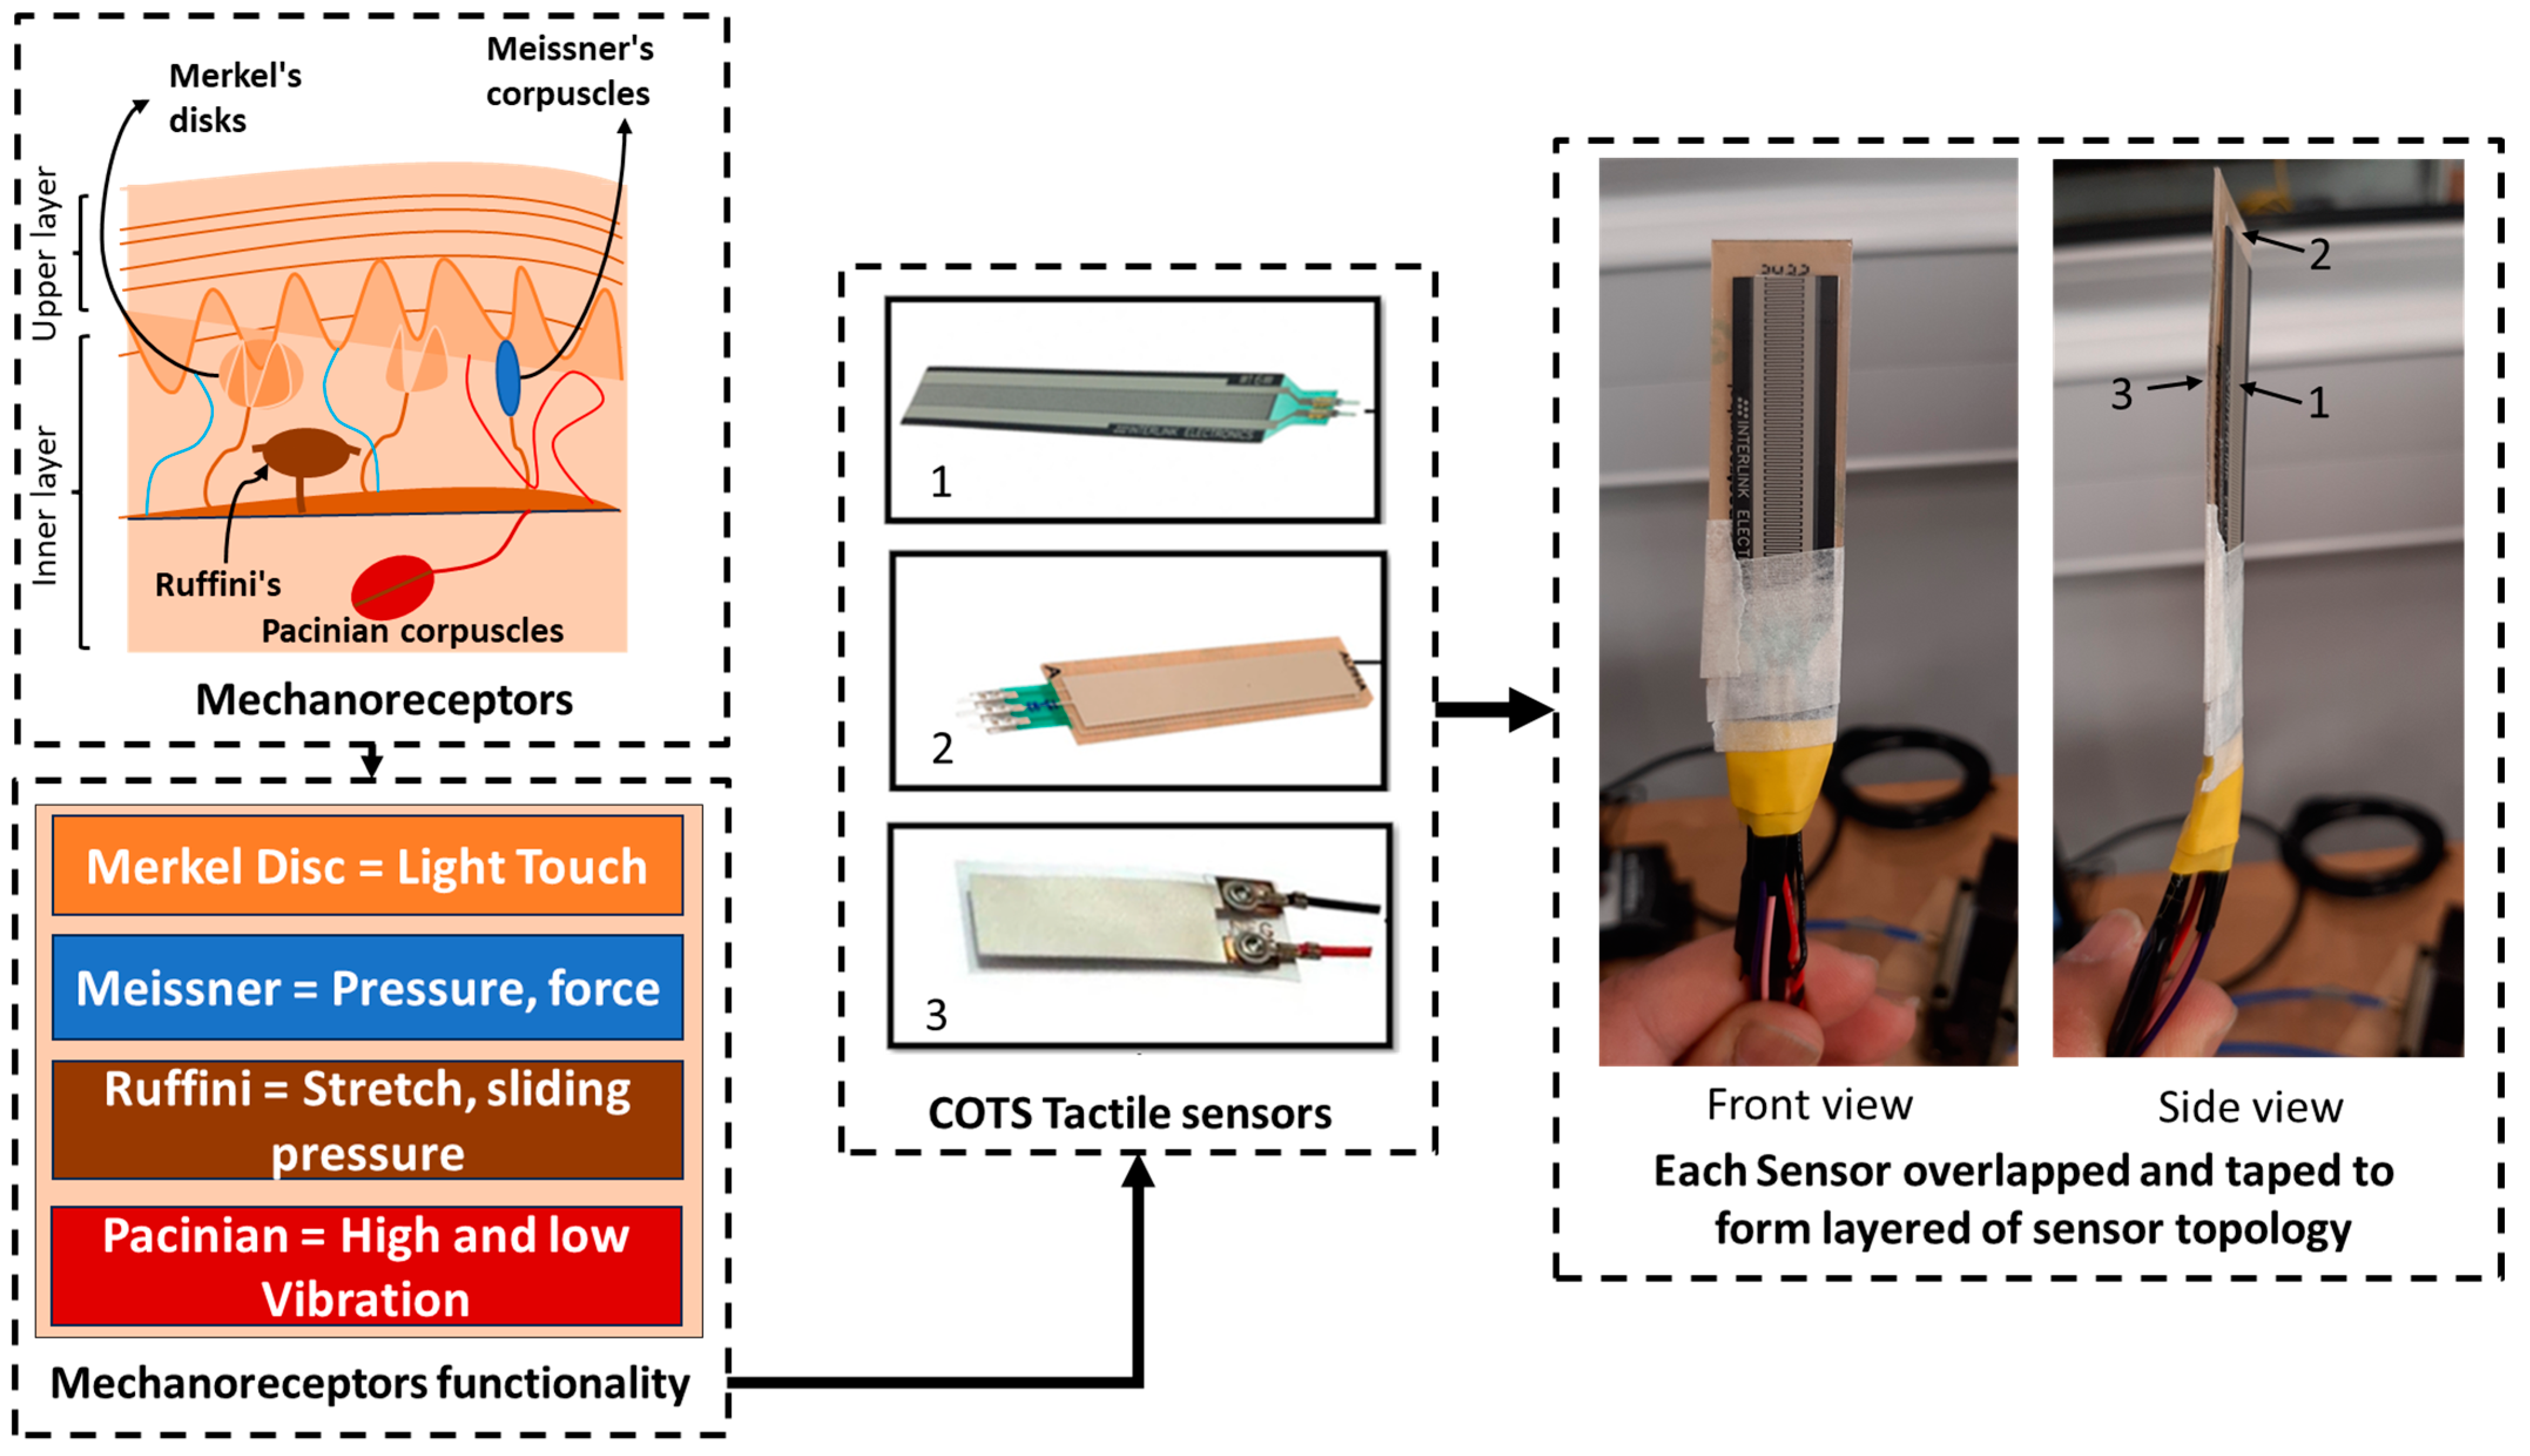
2.1. Mechanoreceptor Architecture

Mechanoreceptors are cells within the human skin that detect different types of tactile information to determine the properties of any material. Firstly, when humans grasp or touch an object, the properties they detect are its hardness or texture. Mechanoreceptors have four important receptors, which are Meissner’s corpuscles, Pacinian corpuscles, Merkel’s discs, and Ruffini’s corpuscles [24]. Each have their own properties for detecting touch, pressure, and vibration. Each of them is located next to each other at small distances, according to the literature [7,19,24,26,27,28]. Merkel’s discs and Meissner’s corpuscles are located on the upper layers and can precisely localize even gentle touch. The large mechanoreceptors—Pacinian corpuscles and Ruffini endings—are located in the lower layers, and respond to intense pressure and touch, as illustrated in Figure 1. Previously, based on their functionality, COTS tactile sensors were identified, which were used in performing hardness classification [7,17,24]. In this case, identifying the location of receptors within the architecture of mechanoreceptors was important as a further step in exploring the topology of COTS sensors as mechanoreceptors.

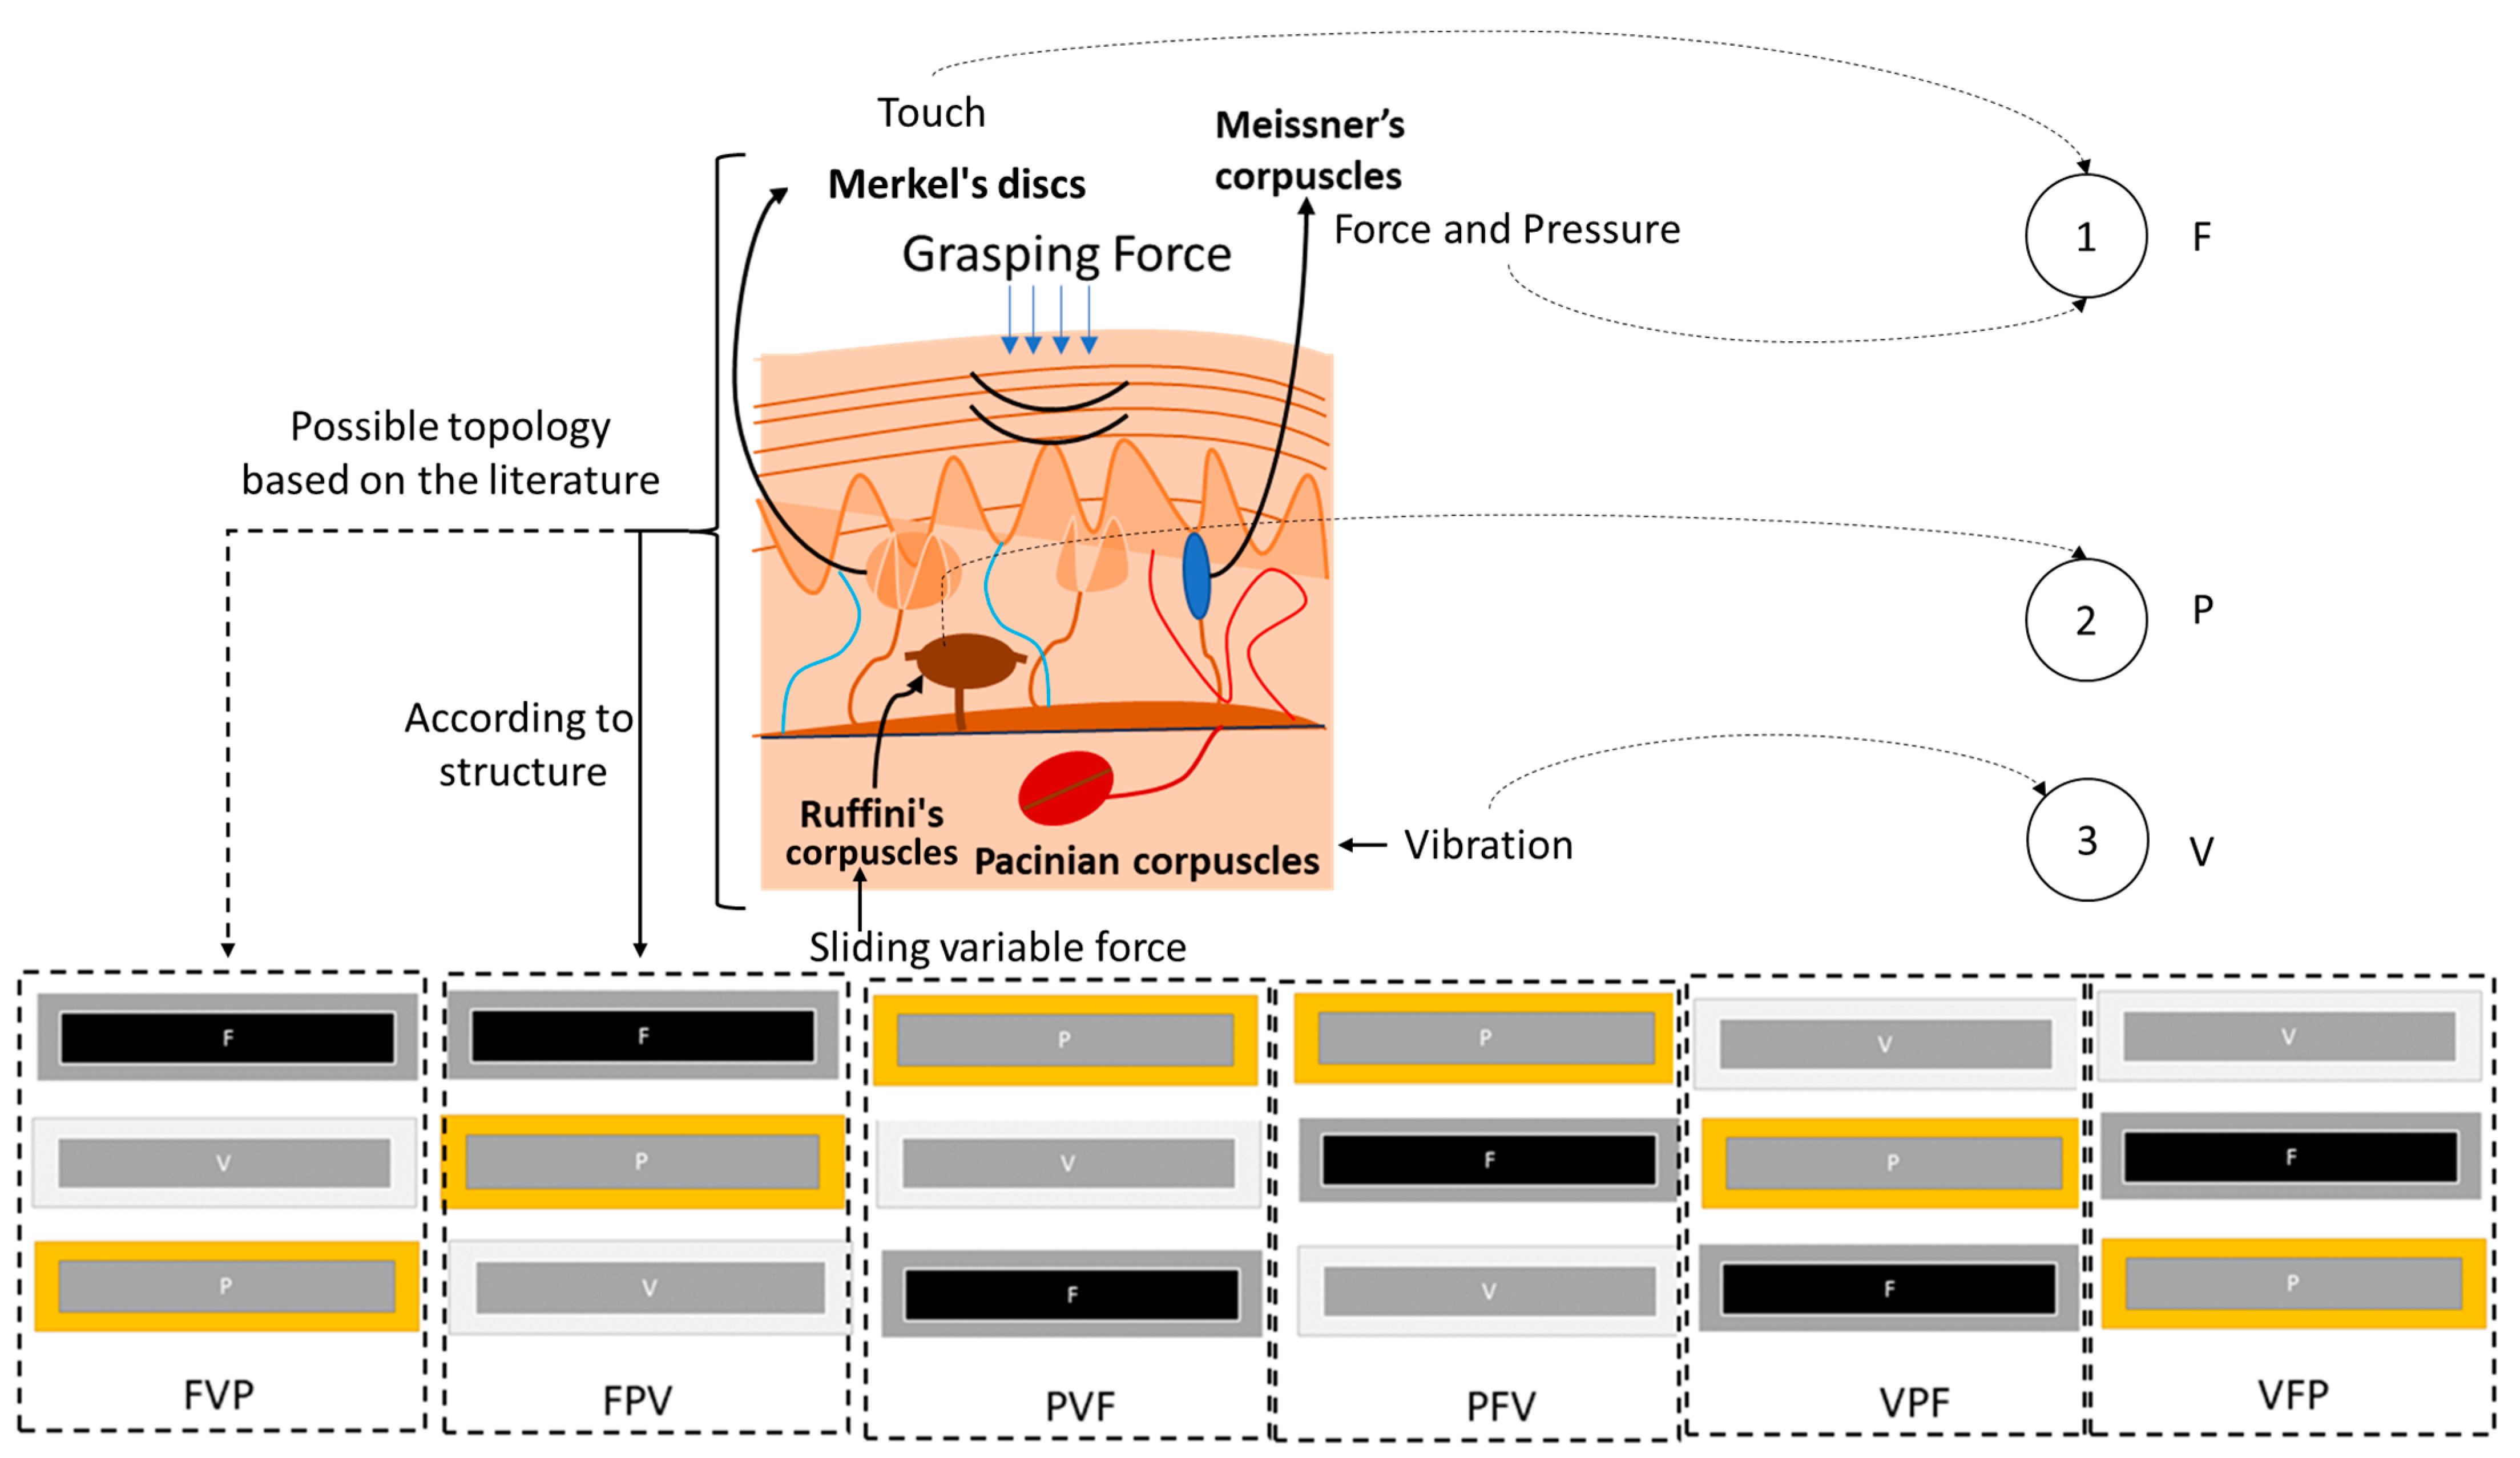
2.2. Identification of Tactile Sensors

From a previous research paper [7], COTS tactile sensors were categorized based on their functional similarity to human mechanoreceptors. Force-sensing resistors (FSRs) were assigned as the primary (first) layer to detect force, while potentiometer sensors functioned as the secondary (second) layer to measure position, displacement, or deformation. Lastly, vibration sensors were placed as the tertiary (third) layer to detect vibrations, as illustrated in Figure 1. These sensors are standard, widely used components in various applications, and they have a thin film. They are commercially available and documented, including the FSR [31], vibration sensor [32], and potentiometer membrane [33]. In this study, these sensors were further examined in a multilayer topology to analyze performance in hardness classification. This aimed to compare accuracy between single-sensor configurations and multilayered sensor configurations. Additionally, the sensors were arranged in topological configurations to mimic mechanoreceptor structures, allowing the investigation of the effects of varying topological factors on classification accuracy in hardness classification.

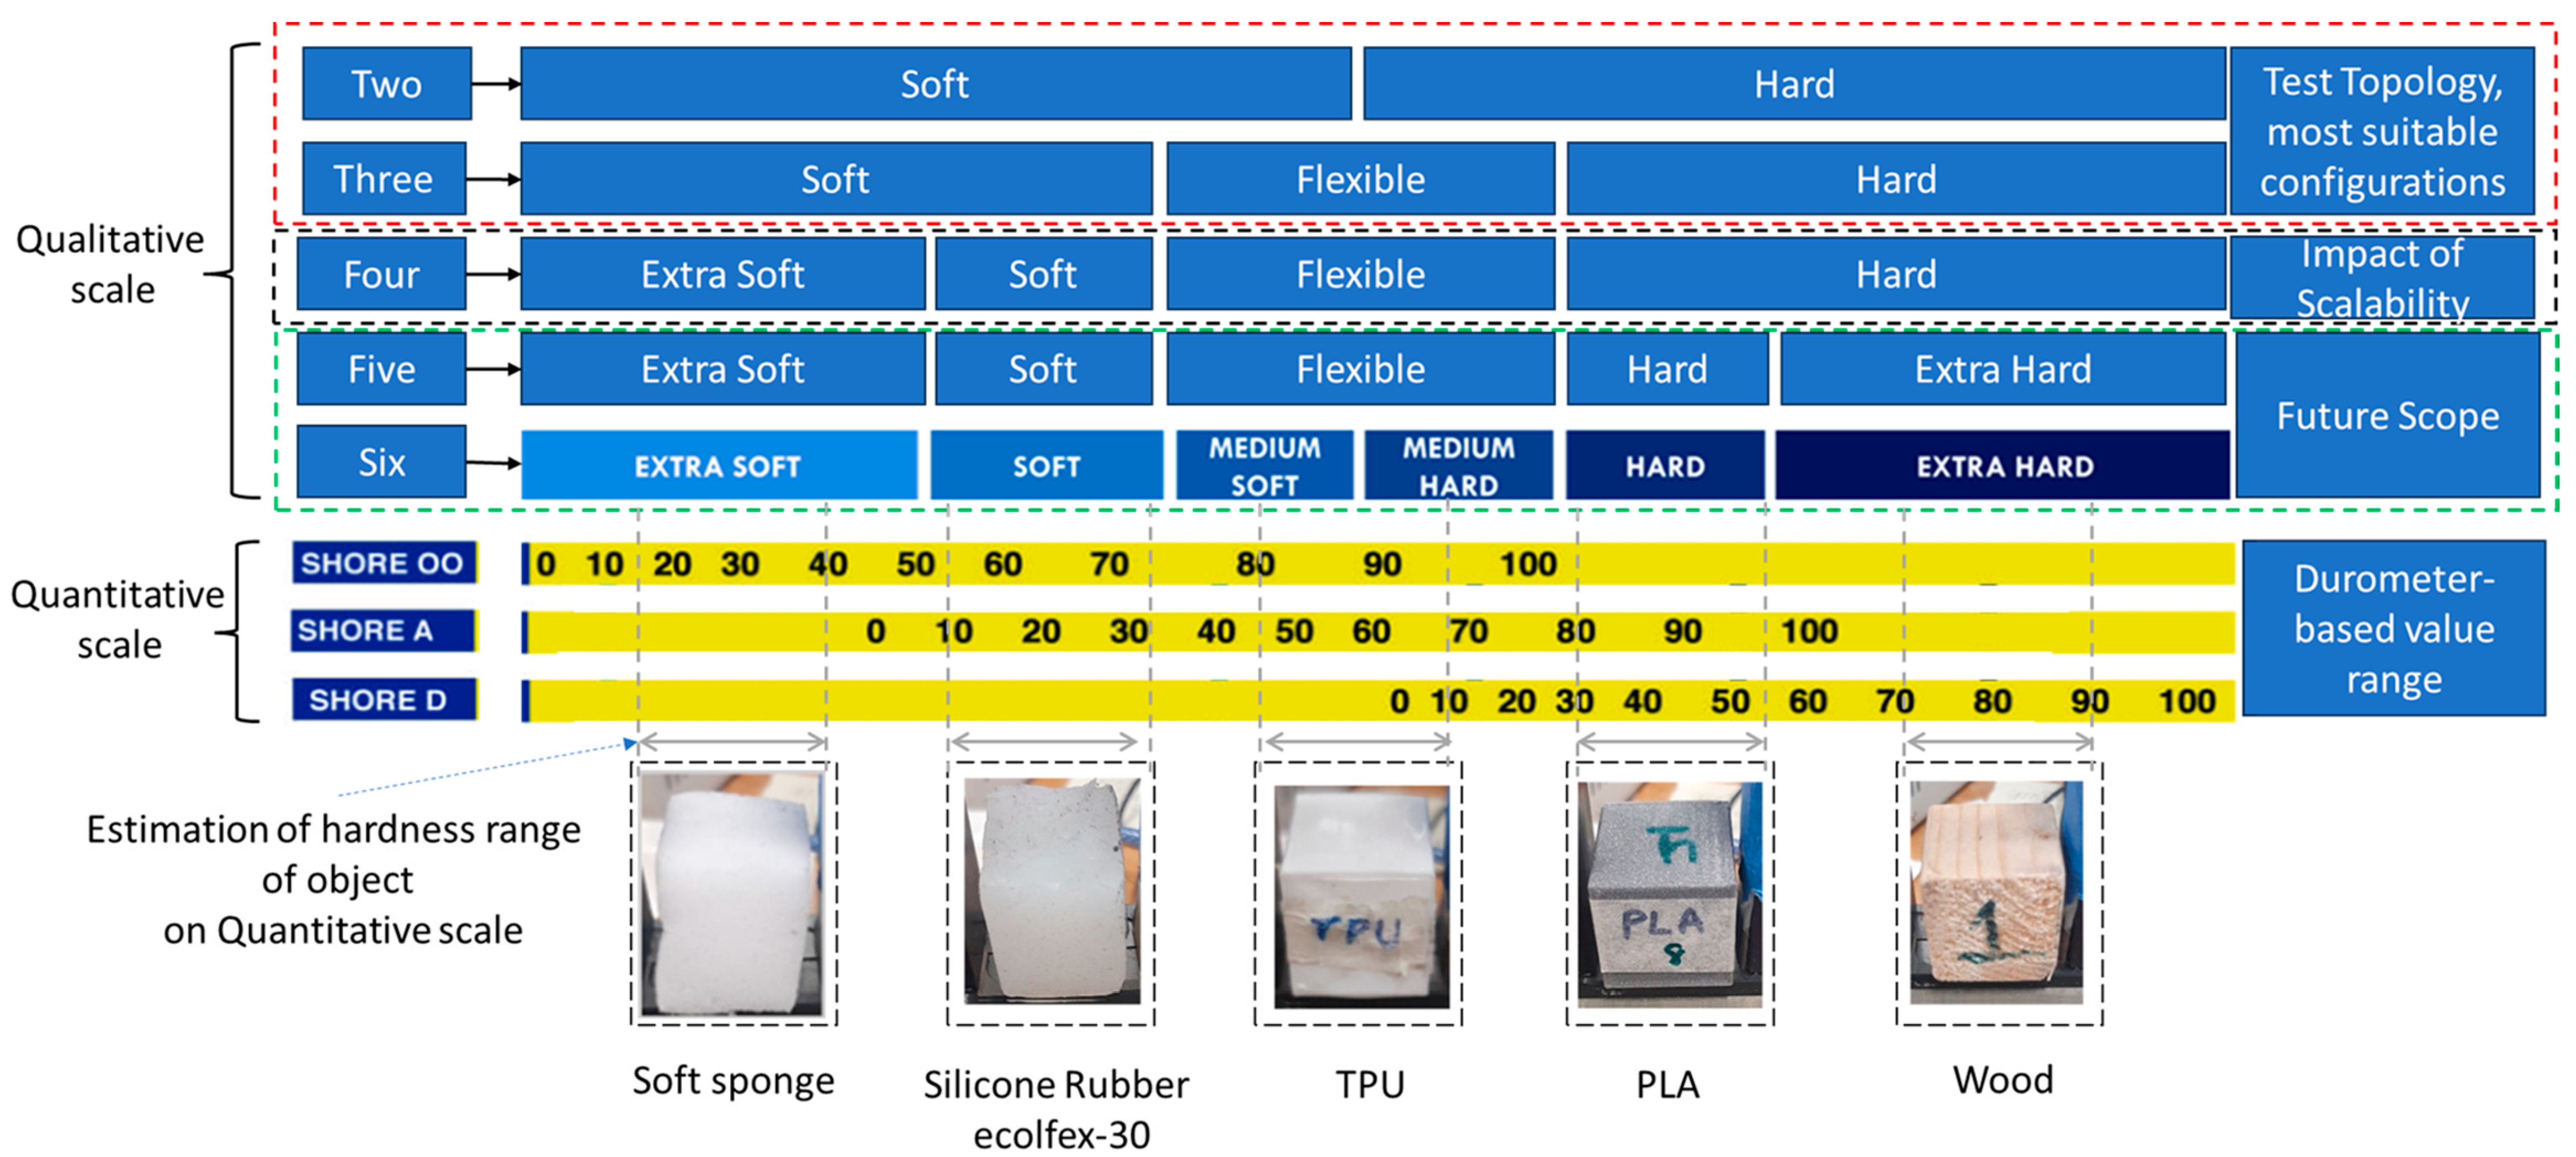
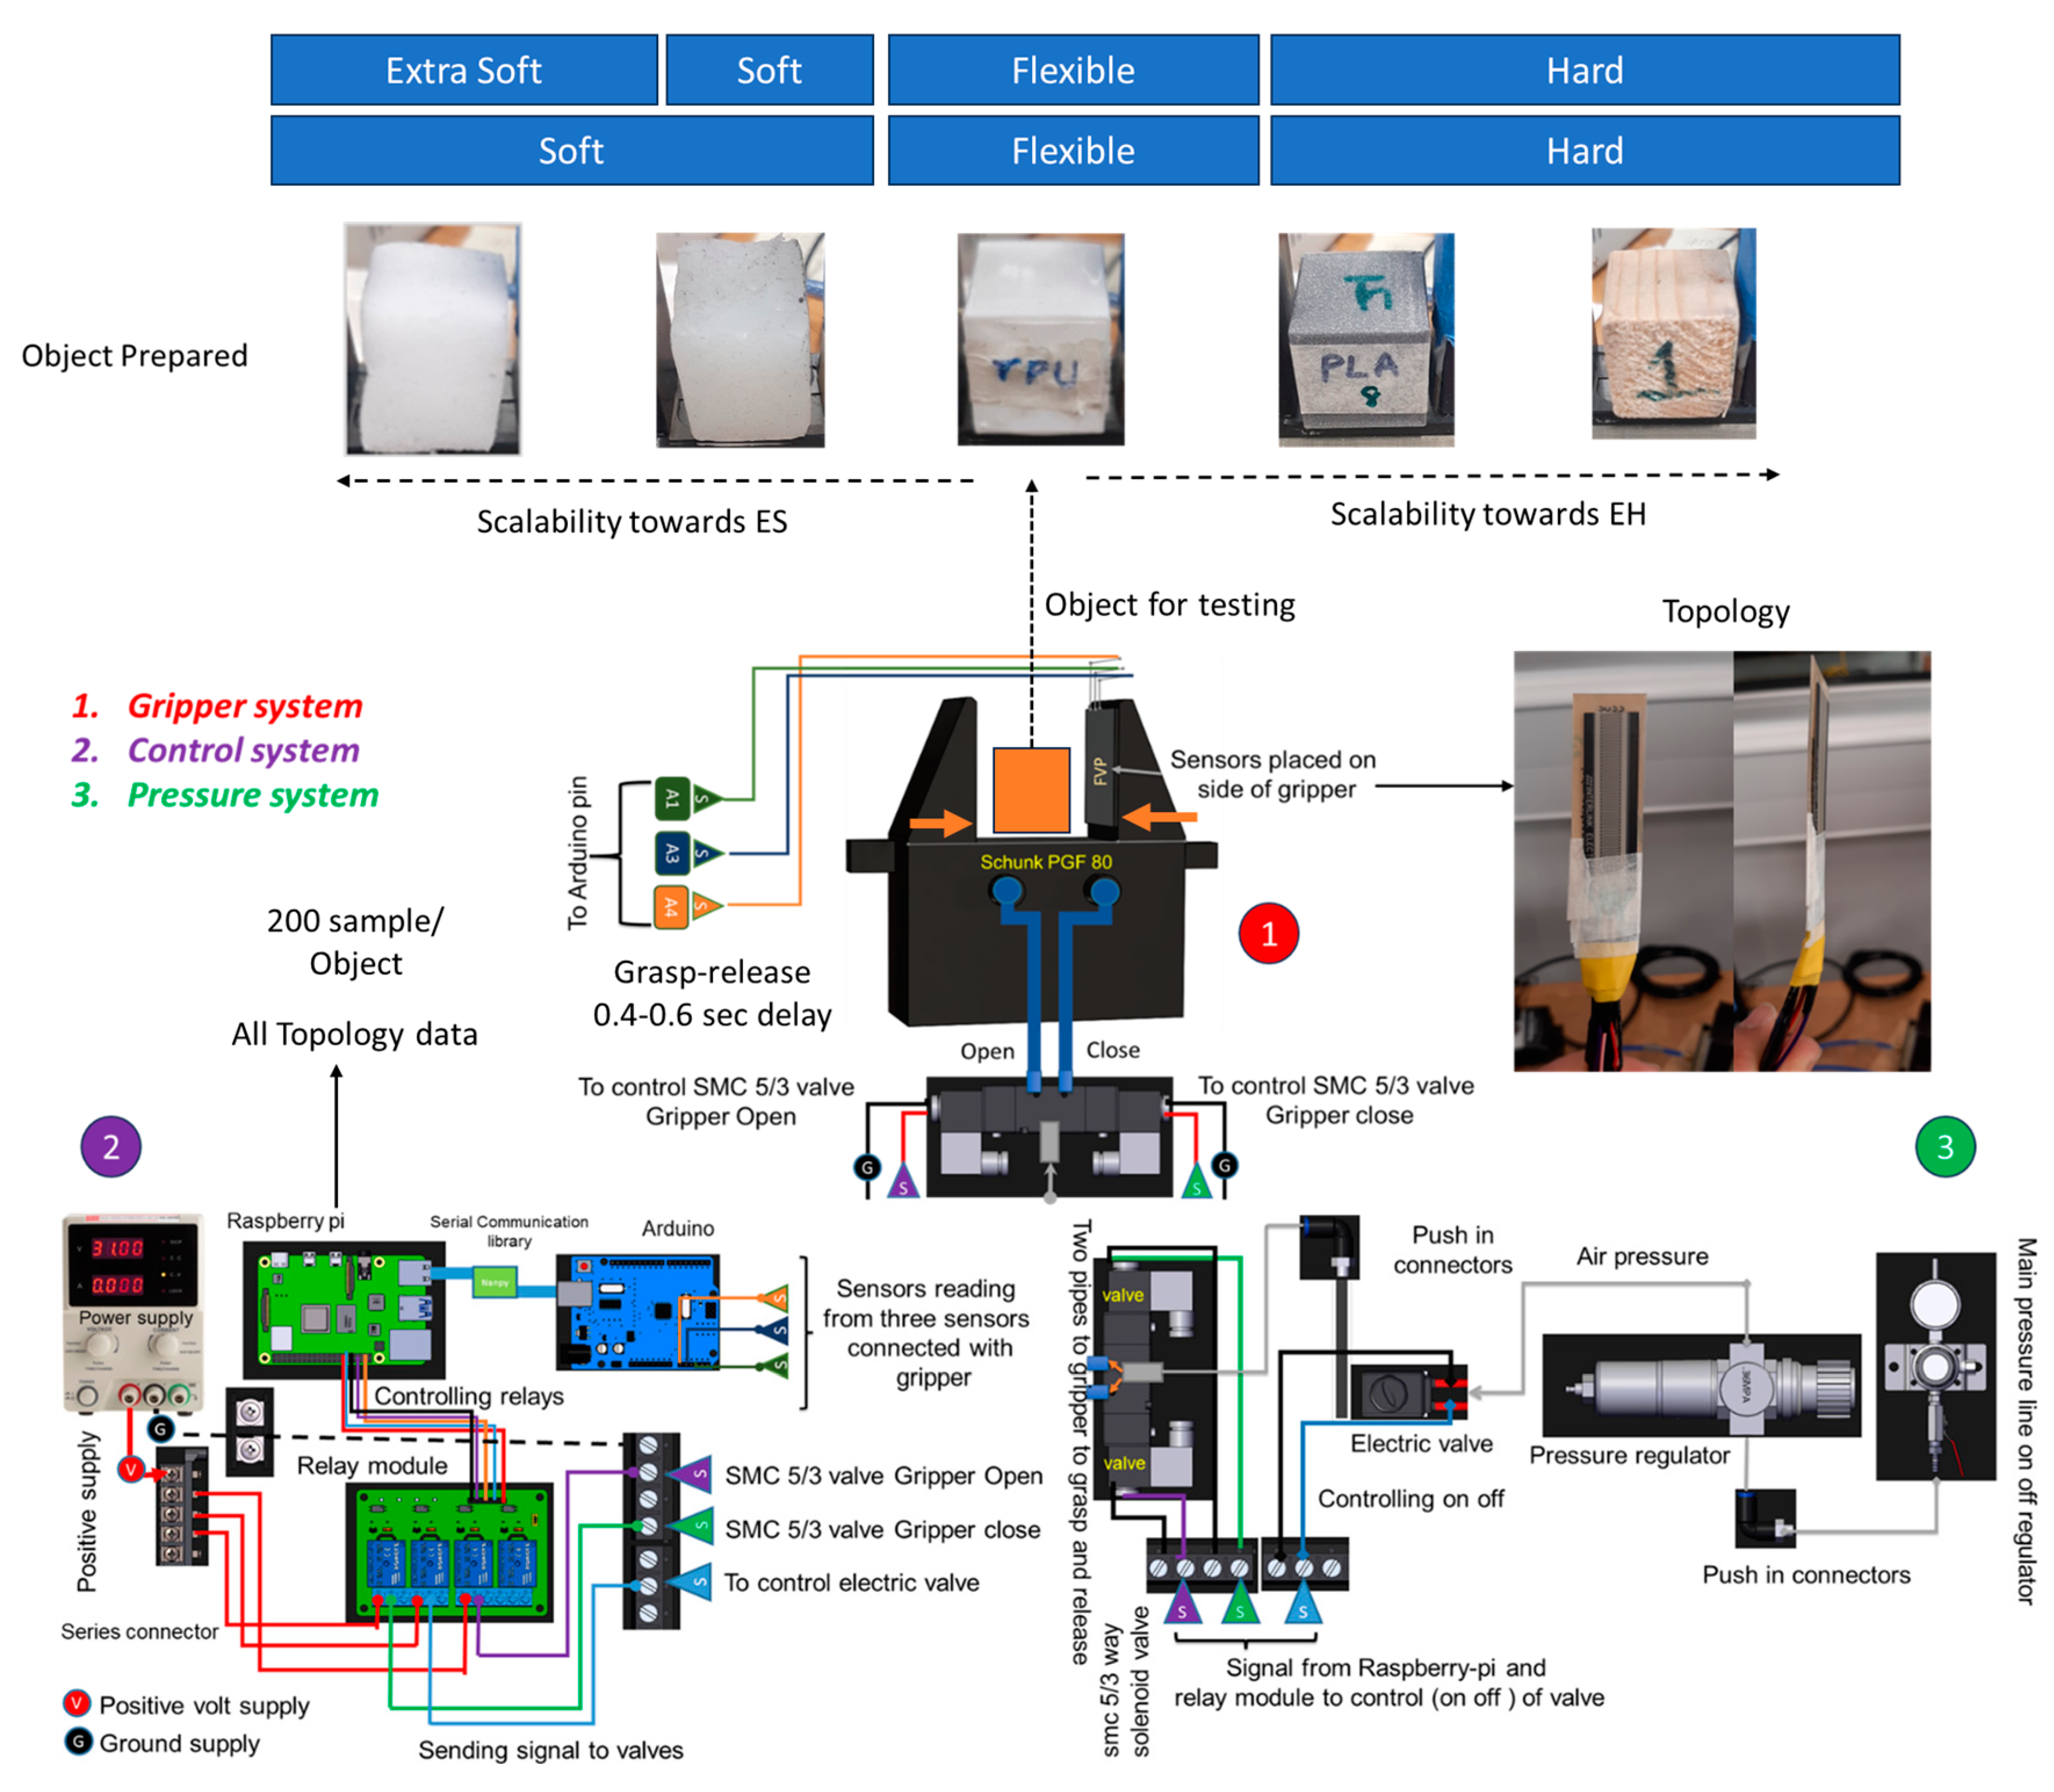
2.3. Shore Hardness Scale

Previous literature has demonstrated that the Shore hardness scale plays a crucial role in selecting objects for testing or experimentation [7]. The Shore hardness scale, which includes two different types (Shore A and Shore D), helps users to determine the appropriate scale for various objects based on their material properties. The previous study utilized a qualitative Shore hardness scale to categorize objects into six different categories, facilitating the selection of objects for hardness classification experiments [7]. This approach allowed for a more nuanced understanding of how objects can be grouped according to their Shore hardness qualitative scale, which could include extra-soft (ES), soft (S), medium-soft (MS), medium-hard (MH), hard (H) and extra-hard (EH); this is further described in Section 3.2. Consequently, a Shore hardness scale based on qualitative criteria was adopted in this study, following methodologies outlined in previous research [4,5,6,7].

2.4. Layered Tactile Sensors in Hardness Classification

Layered tactile sensors have been previously explored and mentioned in object-material classification across different studies demonstrating their effectiveness and complexity [18,19,20,21,22,23,27,28,29,30,34]. These sensors are typically composed of diverse chemical structures and developed using intricate fabrication processes, often featuring grid-type configurations. Despite their potential, these sensors are not yet commercially available. Research has demonstrated the integration of quadruple tactile sensors on a robotic hand [18], enabling precise object recognition through advanced tactile information processing. The layered approach in this study allowed the detection of different object properties and showed the potential of enhancing the robot’s ability to classify materials based on hardness. This methodology underscores the effectiveness of multilayered sensors in replicating the nuanced sensing capabilities of human skin. Similarly, a study on multi-parameter electronic skin (e-skin) explored the use of biomimetic mechanoreceptors and stress field sensing to achieve high-fidelity material classification [28,34]. This e-skin incorporated various sensing layers that worked together simultaneously to emulate the depth and responsiveness of human mechanoreceptors, facilitating accurate hardness classification. Moreover, previous research [7] investigated the use of COTS sensors inspired by human mechanoreceptors for hardness classification.
Research has shown that aggregating data from multiple sensors can significantly enhance classification accuracy, achieving results comparable to those of customized sensors. This study will highlight the advantages of using readily available COTS sensors in a layered configuration for multiclass hardness classification and introduce one case of their use in real-time robotics applications. By utilizing bio-inspired sensors based on human mechanoreceptors, the outcomes of this research will demonstrate how COTS sensors can be arranged in stacks, emulating the functionality of receptors. It will also explore how different sensor configurations form topologies, and how these can be compared to assess the accuracy of material hardness classification outcomes.

2.5. Summary

In different studies, multilayered custom sensors have been used in robotic applications for texture and material classification [25,28]. However, these layered sensors are not easily available, and their development is complex, making them difficult to install and integrate into existing gripper systems. Additionally, general sensors like COTS sensors have not been fully explored in terms of topological configuration and integration for different cases of use in robotic applications. While inspiration from mechanoreceptor architecture has led to the development of sensors with useful capabilities, COTS-based topologies inspired by human mechanoreceptors have not been systematically studied. This gap in the research prompts the exploration of how multiple topological configurations, inspired by mechanoreceptors and different arrangements of COTS sensors, can improve hardness classification accuracy based on the Shore hardness scale. This approach may provide a cost-effective solution for readily available industrial robotic applications. The study will use general machine learning methods and minimal data to identify the optimal topology that can achieve high accuracy across the different classes addressed in the previous paper [7]. However, challenges have been noted in different studies, particularly regarding different configurations of the layered sensor [25,26,27,28]. Further investigation will show how the sensors identified were arranged in different topologies, and how they were integrated on one side of robotic gripper to perform hardness classification.

3. Methodology for Evaluating Optimal Topological Configuration of Sensor for Hardness Classification

3.1. COTS Topological Configurations

Figure 2 presents the different sensor topological configurations that were tested for hardness classification. These topologies were constructed using COTS. The earlier study [7] and the literature propose that the sensor topologies can be layered to mimic the architecture and functionality of mechanoreceptors in human skin. According to previous studies [22,26,27,28] and the biological structure [24], the first layer typically consists of force sensors, which replicate the mechanoreceptors responsible for detecting touch and pressure. The second layer could consist of potentiometers, capable of detecting sliding pressure, while the third layer typically consists of vibration sensors, placed at the bottom to detect vibrations during grasping. This layered arrangement forms the FPV topology (force–potentiometer–vibration).
The goal of these configurations is to explore how different sensor arrangements affect tactile sensing during robotic grasping tasks. In these topologies, the sensors are stacked without additional materials like silicone or porous elements [17]. Each configuration will be tested to assess its performance, while using the accuracy score from ML algorithms, specifically looking at how well they can classify the hardness of various objects. Studies [20,21,22,23] suggest that such receptor-based or artificial mechanoreceptor sensors can enhance the development of tactile sensing systems in robotics. This research aims to determine whether the bio-inspired FPV topology can outperform other sensor arrangements, or whether other topologies, such as FVP (force–vibration–potentiometer), might yield better results in real-time applications, using online testing or offline testing (with collected data for training and testing).
The configurations shown in Figure 2 provide insights into how layered sensor topologies, inspired by mechanoreceptor architecture, can be used for hardness classification in robotic applications. The FPV (force–potentiometer–vibration) and FVP (force–vibration–potentiometer) topologies demonstrated the ability to closely replicate the functionality of human tactile receptors, capturing touch, pressure, and vibration data. By layering these sensors in specific configurations, the system may provide a more accurate outcome than previous results [7] in real-time testing applications. The impact of this approach may be useful for real-time robotic applications, particularly in scenarios where sensitive tactile feedback is necessary, such as material handling, medical procedures, or object sorting. By mimicking the biological structure of human mechanoreceptors, the proposed topologies have the potential to improve the performance of robotic grippers, making them more adaptable to complex, dynamic environments. This approach also opens up new possibilities for further research into optimizing these sensor configurations for other tasks, such as texture recognition or object shape detection. The overall outcome from these results will show which topology is suitable for real-time applications in terms of accuracy and latency.

3.2. Shore Hardness Scale and Classification Categories

In the literature on material classification, binary classification (hard and soft) or random multiple objects of different sizes and dimensions are often explored [2,5,7,11,15]. This study focuses on investigating objects of similar shape, based on the Shore qualitative scale, adopted from the literature [7] and illustrated in Figure 3, to explore the effects of COTS tactile sensor topologies on hardness classification performance. The previous study [7] showed that using COTS tactile sensors for hardness classification achieved an accuracy of 81% for three classes (hard, soft, and flexible) and 92% for two classes (hard and soft). This suggests that expanding the number of classes can reduce accuracy, making hardness classification more challenging. In this study, three classes based on the Shore scale (qualitative) were used to evaluate whether topology-based COTS tactile sensors can improve the accuracy of hardness classification. Although a durometer provides a quantitative scale for hardness and could offer more precise measurements, it was not used in this study, due to the time-intensive nature and the destructive testing required to obtain readings for each object. The primary aim here is to understand the object-material classification assumptions and explore how the qualitative Shore scale can be useful in a faster and more scalable context. Additionally, the aim is to expand the classification to four (H, S, ES, F) or five (H, S, ES, F, EH) classes, to determine if the optimal topology can maintain high accuracy with an increased number of classes, as illustrated in Figure 3. This approach will help in understanding the influence of COTS sensor topology on classification performance, and its scalability to more complex classification tasks.

3.3. Data Collection from Topology for Hardness Classification

To collect data from the proposed topology configurations, the approach illustrated in Figure 4 was partially adopted from previous work [7]. The COTS tactile sensor topologies selected for this study include six configurations: FVP, FPV, PVF, PFV, VFP, and VPF. These sensors were integrated into a two-sided Schunk robotic gripper, with one side accommodating the sensor topology configuration inspired by a mechanoreceptor stack found in human skin. Mechanical resistance was applied to simulate force impact during object grasping, allowing the sensors to collect relevant data. The objects used were categorized based on the Shore hardness qualitative scale into hard, soft, and flexible types (see Figure 3 and Figure 4). Each object underwent mechanical grasping within the robotic gripper, and the sensors recorded analogue voltage values, ranging from 0 to 5 volts, based on their tactile readings. These voltage values varied across objects, and the recorded data were stored on a Raspberry Pi for further analysis. The collected data include key parameters, such as the object type, the voltage values from each sensor configuration, and the corresponding hardness type. The data form the basis for testing hardness classification, which involves measuring the sensor response to different hardness levels. The collected data from each topology will be used to evaluate the effectiveness of each configuration in classifying hardness, enabling the analysis for determining optimal topologies for real-time applications. For training the ML model, 200 samples were collected from each object for each topology. For offline testing, 20 samples from each new object were collected and stored, whereas for online testing, a median value of 5 to 9 samples were directly fed into the trained model. For additional information, refer to the Supplementary Information.

3.4. Machine Learning Approach for Hardness Classification

Machine learning (ML) involves enabling computers to learn patterns from data to make predictions or decisions, without explicit programming for each task [35]. In the context of hardness classification, sensor data measuring material properties as analogue values or voltages are collected and pre-processed to ensure that they are clean and ready for training ML models. This process involves preparing the data to capture the relationship between sensor readings and material types, as shown in Figure 4. In this study, the process begins with data collection from COTS sensors configured in topologies such as FPV (force, potentiometer, vibration) and others (PFV, PVF, VPF, FVP, and VFP). These topologies were chosen for their ability to simultaneously collect multiple tactile data types. These sensors measure material properties during grasping of different objects categorized as hard, soft, or flexible (H, S, F). Data pre-processing includes cleaning, standard scaling of sensor values, and label encoding to convert categories (H, S, F) into numeric values (0, 1, 2). The dataset, represented by features X = (F, V, P) and labels Y = (Material type), was split into training (80%) and testing (20%) subsets. The ML models were implemented, trained on labelled data, and evaluated using a separate test set, as illustrated in Figure 4. The models’ predictions were assessed based on an accuracy metric, which was compared with results from the existing study [7]. Accuracy was chosen as the evaluation metric because it is a commonly used approach for assessing the performance of machine learning models. It provides a clear and straightforward measure of how well the models’ predictions align with the true labels. Accuracy is defined as the proportion of correctly predicted instances out of the total number of instances, making it an effective way to quantify the models’ predictive capabilities. New testing values (F, V, P) from multiple topologies and different material types were used to evaluate the models’ abilities to predict unseen data, assessing their robustness across various configurations.
Once validated, the models could be used to classify the hardness of materials based on their sensor measurements. The previous study [7] employed various machine learning (ML) algorithms, including Support Vector Classifier (SVC) with RBF (Radial Basis Function) and Linear kernel functions, Random Forest Classifier (RFC), Decision Tree (DT), Logistic Regression (LR), K-Nearest neighbours (KNN), and Multilayer Perceptron (MLP). Standard ML classifier models [35] with default parameter settings were used to establish a performance baseline and to compare the results with the earlier study [7]. Classification accuracy in the previous study ranged from 81% to 87%. By aggregating sensor data into a three-feature set (F, V, P), accuracy improved to approximately 90% for the binary classification (H, S). However, for the ternary classification (H, S, F), accuracy remained below 90%. These studies predominantly used single-sensor setups, focusing on ternary classification (hard, soft, flexible) with an additional category for extra-soft (ES).
The approach also explores the scalability of material type in classification, where object materials are labelled and encoded into numerical representations. This supports expansion of the material classification into four categories (hard = 0, soft = 1, flexible = 2, extra-soft = 3) or five categories (hard = 0, soft = 1, flexible = 2, extra-soft = 3, extra-hard = 4). To assess the effectiveness of each topology and identify the optimal configuration for hardness classification, models were validated using accuracy scores by comparing predicted outcomes with test data for multiclass. This was further validated using online and offline testing. Offline testing refers to evaluating the model’s performance using a pre-collected dataset, where the model is tested on static data that were not used during training. It provides insights into the model’s ability to generalize to unseen data before deployment. Online testing involves assessing the model’s performance in real time, where it processes live data as they become available. This method evaluates how well the model adapts and makes predictions in dynamic, operational environments.

3.5. Approach Overview

The approach described in Figure 5a showcases the steps involved in this study, involving evaluating various sensor topology configurations, inspired by mechanoreceptors, to find the optimal topology for hardness classification using a robotic gripper. The process began with the configuration of COTS sensors in different topologies (FVP, FPV, PVF, PFV, VFP, VPF), attached to one side of the gripper. These topologies were aligned together to mimic the tactile sensing capabilities (functionality) of human mechanoreceptors, allowing the gripper to collect different tactile information, such as force, pressure, and vibration, at once. Each configuration was tested by grasping objects (with different material types) categorized according to their qualitative Shore hardness scale category, with data collected through an Arduino and Raspberry Pi system (Pi 3 Model B+). Data collected from each sensor were in volt as an analogue value. The collected data were then processed using multiple machine learning classifiers, to determine the accuracy of hardness classification across three-class (hard, soft, flexible) scenarios, to make comparisons with previous outcomes [2,3,4,5,7,9,12,15], and four-class (hard, soft, flexible, extra-soft) scenarios, to scale the topology for consistency in accuracy, and to identify the optimum configuration for real-time testing. This would also reveal whether layered sensors caused any loss of information or noise interference due to their arrangement, which might be reflected in the ML outcomes. Figure 5b illustrates scalability testing, where the optimal topology was further evaluated by introducing new material classes, specifically ES (extra-soft). This test aimed to assess whether the classification accuracy remained stable or degraded when scaling to additional classes. Offline testing was conducted using unseen data from 18 objects (material types: H, S, F), with 20 samples from each. This approach aimed to validate the consistency of the topologies and identify the optimal one for further testing with a robotic gripper in real-time applications. Once the optimal topology was determined, it was evaluated using new, unseen objects to simulate real-world scenarios.
Online testing (real-time testing): Sensor values from each topology were recorded during the grasping of each object for 5–10 s, with 10 samples collected per object. The median value was chosen for processing in predictive models due to its robustness against outliers, ensuring that more reliable values of sensor behaviour were captured, with the aim of passing only a single array of values in testing, to check the reliability of the topology in terms of prediction. These values were then utilized in predictive testing involving an ensemble approach, as shown in Figure 5c. Predictions from machine learning algorithms such as SVC, KNN, MLP, RFC, DT, and LR were combined to determine the most likely classification for each object. This approach evaluated the performance of various sensor topologies and validated their practical applicability in robotic hardness classification tasks. By reducing the complexity and duration of testing and data collection, while leveraging the accuracy matrix from ML, this method may enhance classification performance and mimic the sensory integration of human mechanoreceptors.

4. Experimental Setup

4.1. Setup Description

The experimental setup represents three states of operation, designed to operate the gripper, collect data from topology sensors, and analyze the data. This setup was inspired by a previous research paper [7], which focused on single-sensor data collection. The gripper system included a Schunk gripper, which was pneumatically controlled, with pressure applied from one side to grasp, and released from the other side. The grasping impact was maintained at a 0.4 MPa scale rate through a pressure system pipeline within the lab. This pressure system consisted of a pressure regulator, an electric valve, a push connector, and a solenoid valve set at 0.4 MPa. Parts of the pressure system were electrically controlled from a control system, comprising a Raspberry Pi, a circuit to operate the electric valve, and series connectors to operate different relays for three valves. Commands from the Raspberry Pi switched the valves on and off, allowing pressure to pass to the solenoid valve, with side switches controlled by Python commands. Through these Python(ver3.8) commands, pressure was regulated, objects were grasped, and sensor data were collected via the gripper system represented in Figure 6. The data were then collected by Arduino ports and saved in the Raspberry Pi through serial communication, as carried out previously in [7]. The COTS tactile sensors’ topologies were combined by taping them together, and they were adhered to one side of the gripper. Each sensor was connected to an Arduino port to collect analogue values during the impact, illustrated in Figure 6. In further steps, this will also be useful in performing multiple retesting for predicting new object-material properties, saving time in comparison to single-sensor testing and results.

4.2. Data Collection and Processing

During the experiment, as illustrated in Figure 6, different sets of data were collected, which were crucial for the further analysis of topology based on hardness classification accuracy. Three sensors’ data were recorded, in voltage, from the Arduino port on a Raspberry Pi. Each object was placed between the robotic gripper to be grasped at a certain impact, and the integrated sensor topology values collected were saved in CSV format on the Raspberry Pi. The data collection was performed for each object within an impact duration ranging from 0.4 to 0.6 s, as specified by Python code. The collected data included three columns, named F-volt for the force sensor, P-volt for the potentiometer sensor, and V-volt for the vibration sensor. For each object, there were around 200 data rows, totalling 800 rows for four objects. Additional columns indicated the object name, based on the Shore hardness scale, with names such as SR for silicone rubber as soft (S), TPU for thermoplastic polyurethane as flexible (F), PLA for polylactic acid as hard (H), and wood for hard objects. Another column categorized the object type as H (hard), S (soft), or F (flexible) based on Shore hardness scale.
Data were collected for each object across three material classes—SR (S), TPU (F), PLA (H), and Wood (H)—for every topology configuration (FVP, FPV, PVF, PFV, VFP, VPF). Each dataset comprised approximately 800 rows and five columns, including features such as object name, material type, and three sensor values (FVP) for the three classes. Additional columns represented object names and their classification symbols (H, F, S). These topology-based datasets were used to train models using multiple algorithms, including SVC, RFC, DT, LR, KNN, and MLP. The performance of each algorithm and topology in hardness classification was measured using accuracy scores, providing insights into the effectiveness of each approach. Once the score was achieved, the optimum topology was decided by performing four-class classification to see if the results or accuracy were maintained with increasing classes. This procedure, inspired by mechanoreceptor topology, aimed to yield optimal results. The outcomes were compared to identify the efficient configuration for multiple tests, involving different unknown values and objects, for testing the optimum results for hardness classification and prediction with multiple objects, described in Figure 7 in the application of robotics grippers. Test data from the 18 objects, as described in the next section, were collected using the same grasping techniques, with up to 20 samples per object from the optimal topology. In online testing, the data were fed directly into the trained model.

4.3. Multiple Objects for Real-Time Testing Applications

The multiple objects illustrated in Figure 7 were essential for real-time testing in robotic applications, due to their ability to represent a diverse range of material properties that exist in real-world applications. Each object shows different characteristics when it comes under pressure and manipulation, allowing the examination of the capability of the optimum topology for real-time prediction. Robotic grippers must handle various objects in complex environments, and testing with a wide range of materials can help systems to classify and manage different levels of hardness, improving the robotics tactile sensing system. In practical scenarios, real-time interaction is vital, as the gripper needs to instantly adjust its grip based on the hardness classification of an object, especially when handling deformable materials such as sponge or rubber. This real-time capability can enhance safety by preventing damage to sensitive objects, but also improves operational efficiency, reducing errors in tasks such as sorting and packaging of different objects or material types at the same time. The objects used in testing may be more practical than everyday random items, because they represent materials from a different range of materials based on Shore scale, which can be used in different domains, like fruit sorting, in industrial, medical, or packaging contexts.
These specific objects, such as 3D-printed parts, flexible polymers, and thermoplastics, present a wide variety of material complexity, providing more rigorous and relevant challenges for the gripper with optimum topology to perform real-time hardness classification and prediction.

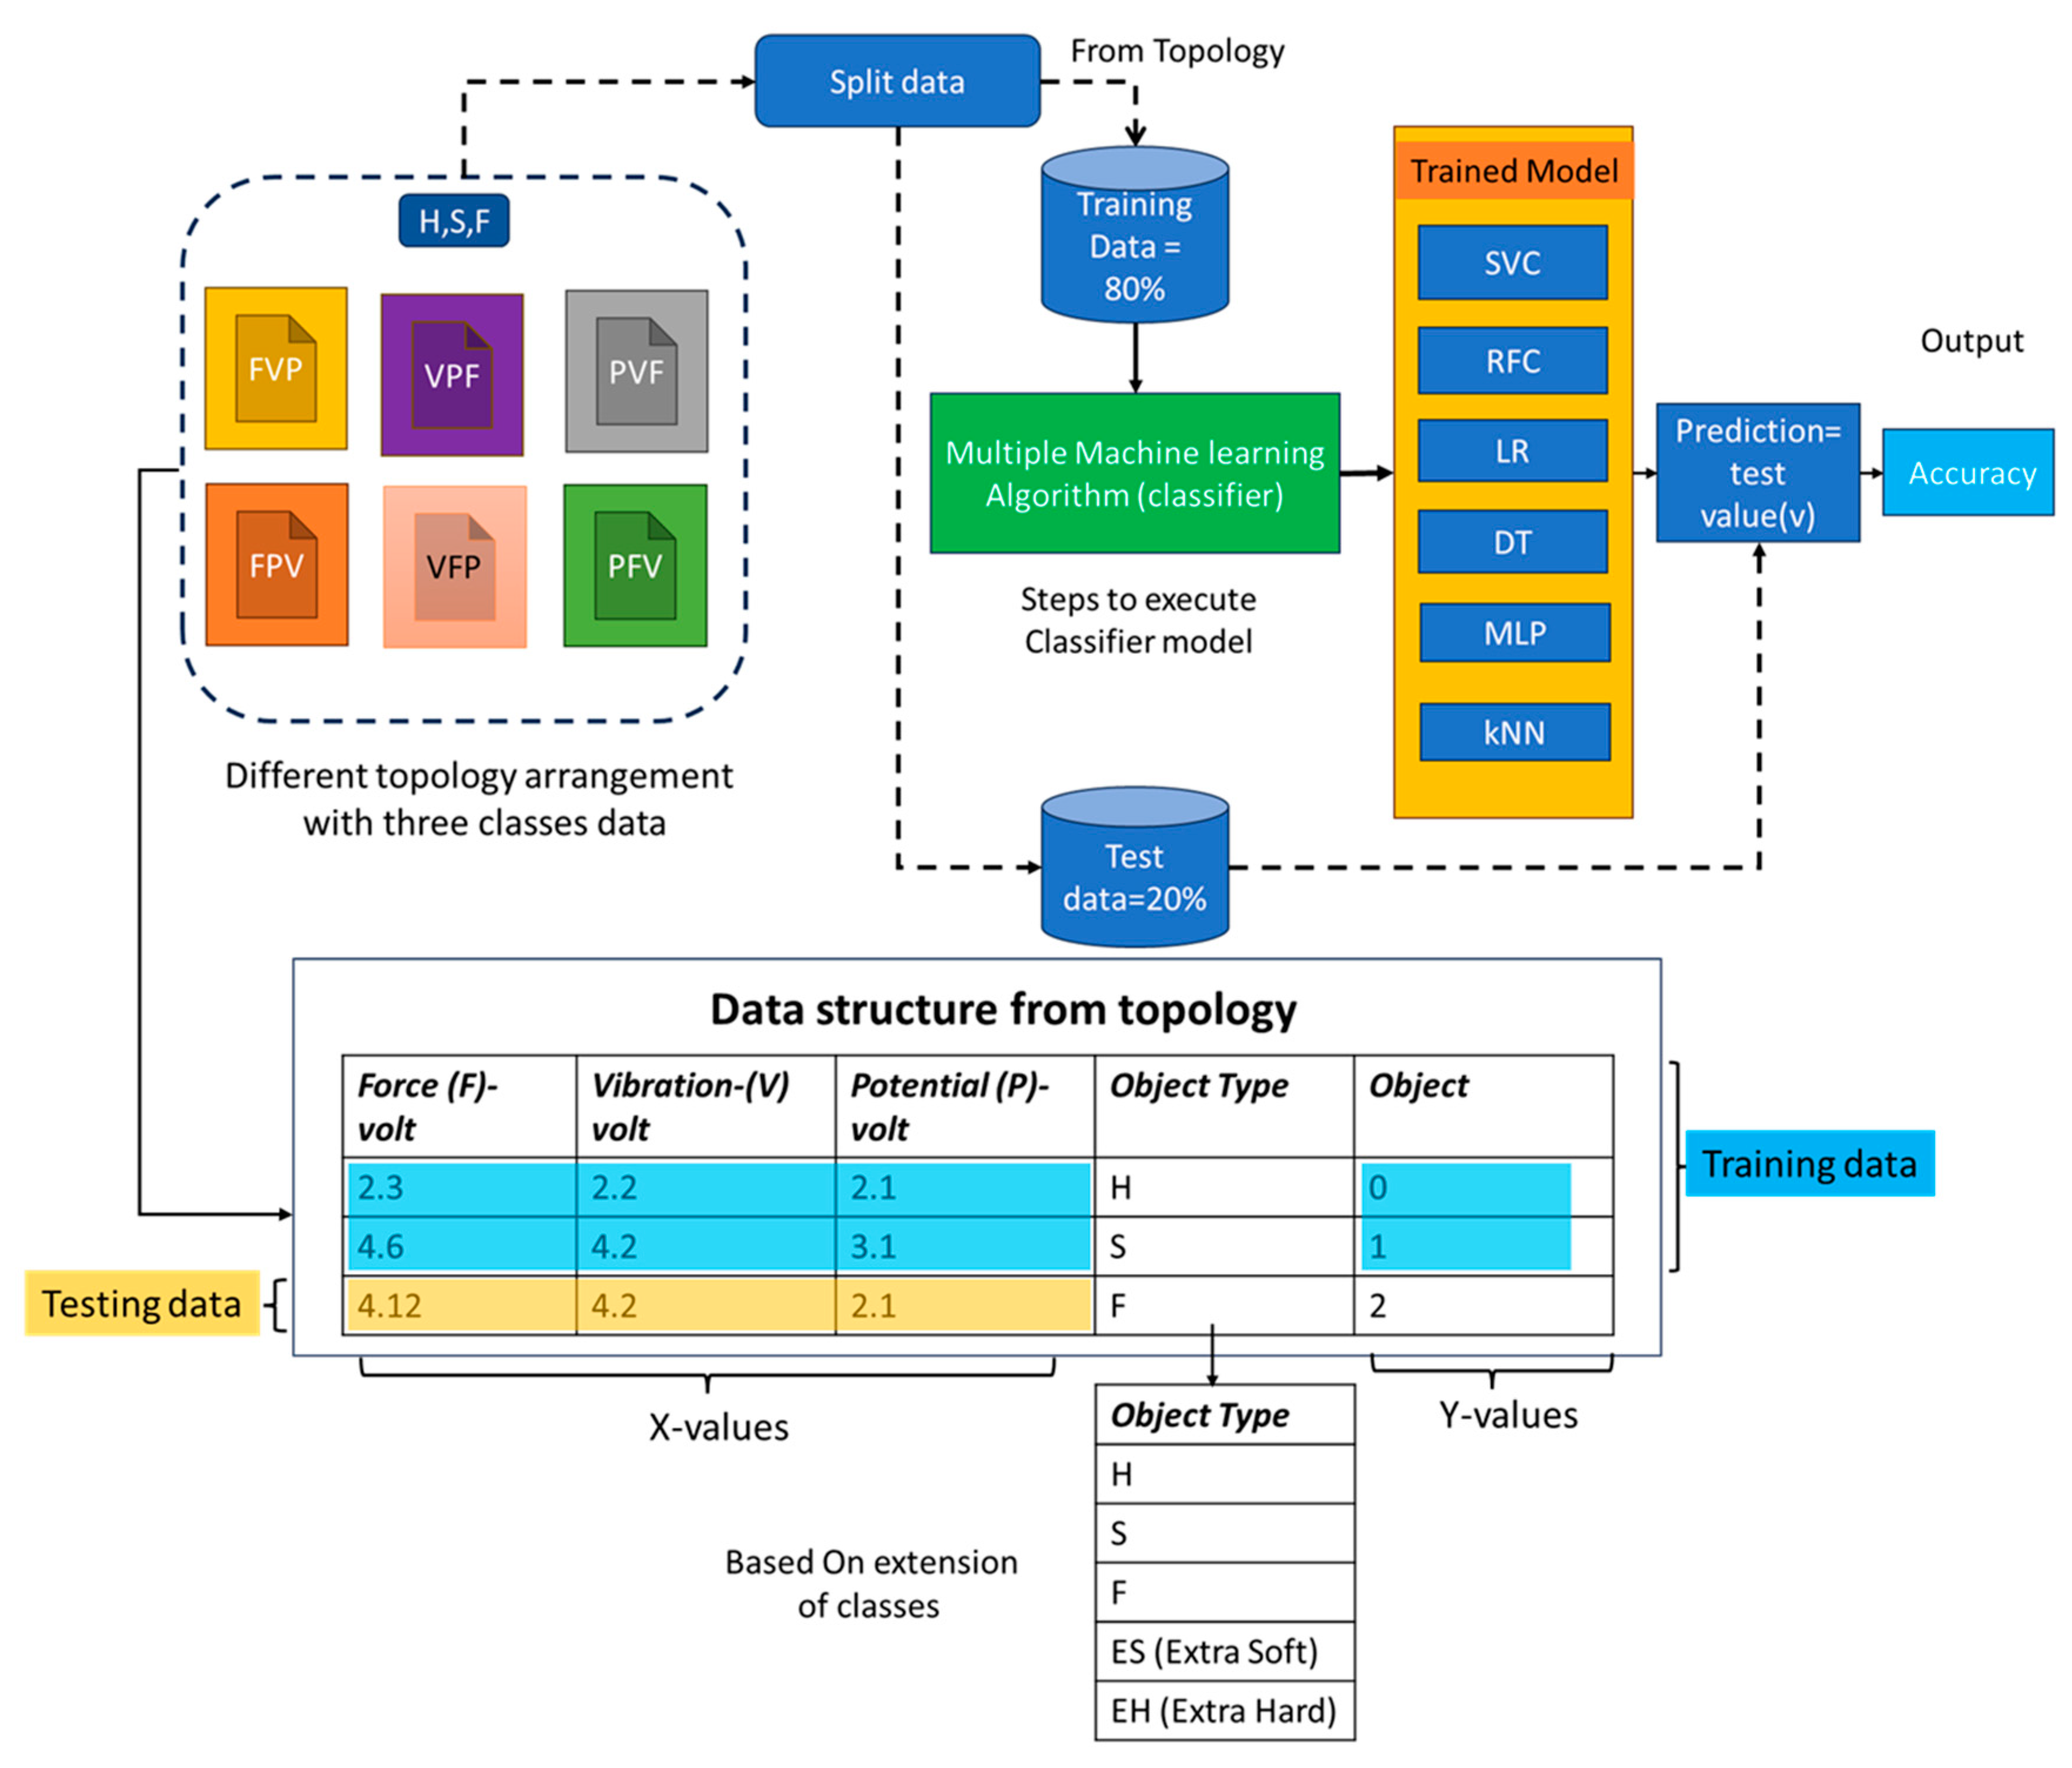
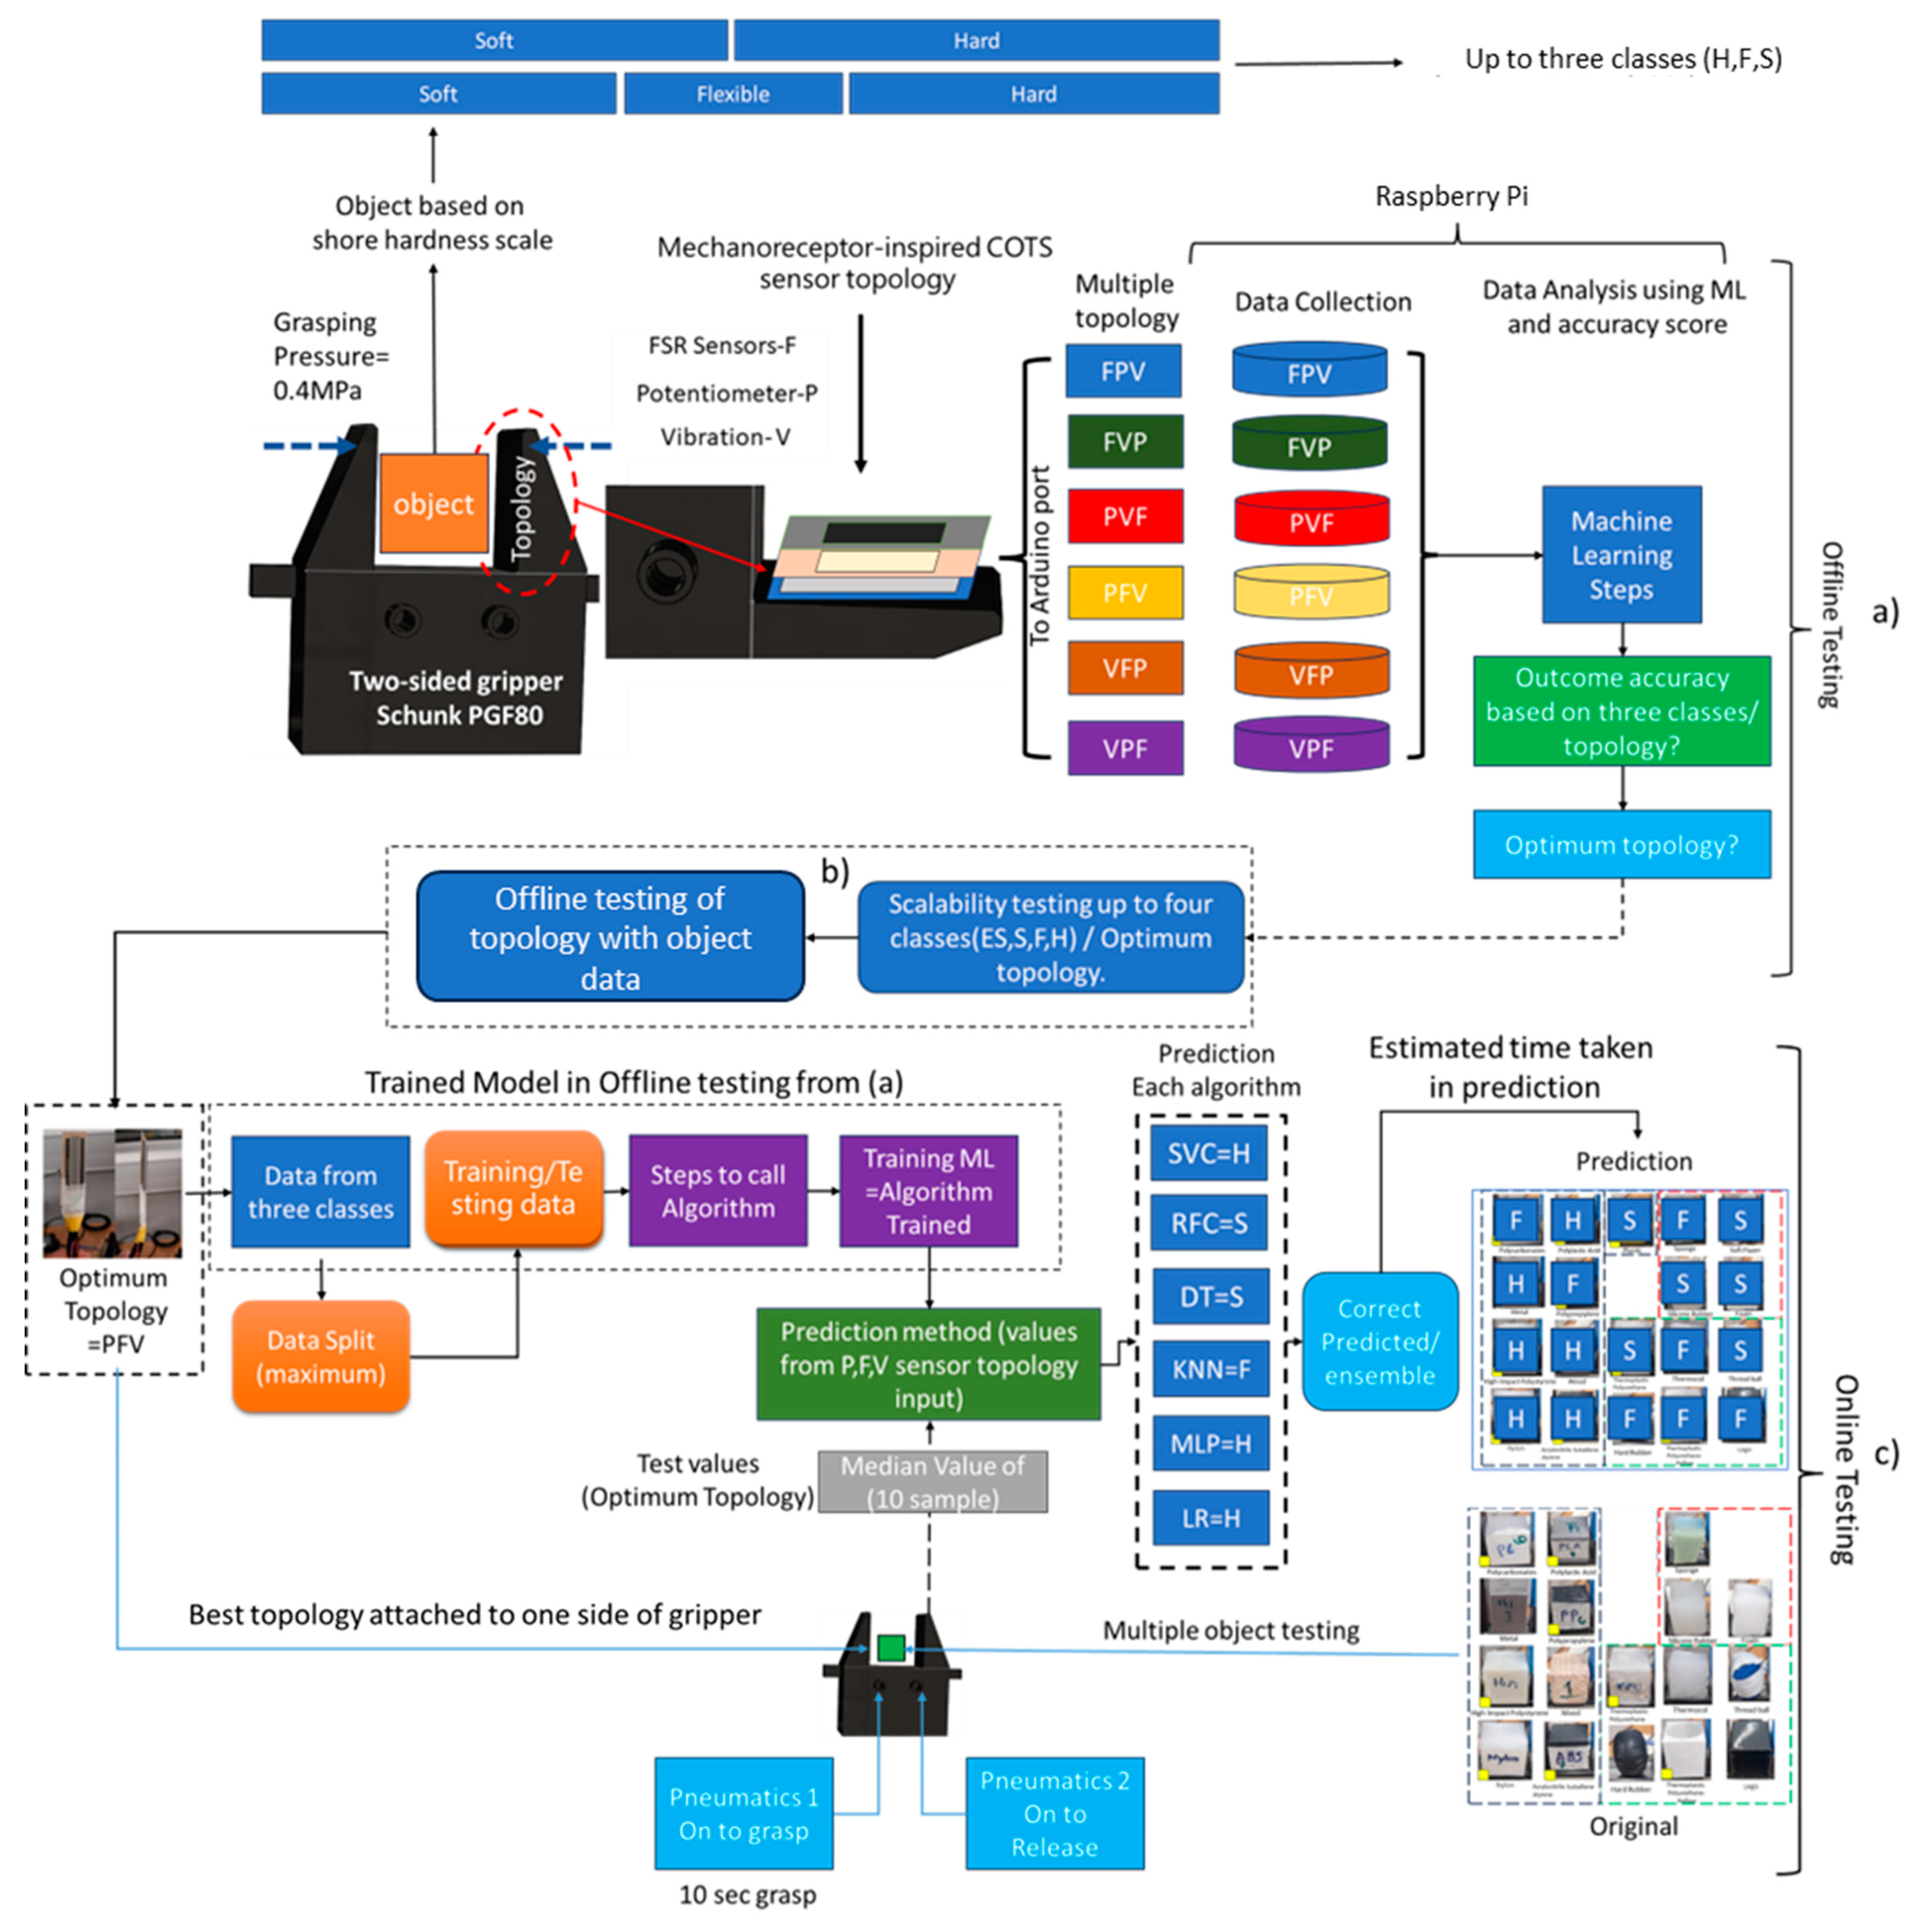
5. Results and Analysis

5.1. Identification of Optimal Topologies by Accuracy

Figure 8 illustrates the performance of different topologies and machine learning algorithms used for material hardness classification across three categories: hard, soft, and flexible. The analysis aims to identify the optimal combination of topology and machine learning model for analyzing the data and providing reliable, thoroughly tested results. The accuracy results for each topology and algorithm are compared to a benchmark from a previous study, where the aggregation of data from individual sensors—force (F), potentiometer (P), and vibration (V)—achieved an accuracy of approximately 81%. This baseline is shown in Figure 8 by a red dashed line, with the green region representing the benchmark for comparison.
Performance Analysis of Machine Learning Models: Figure 8 highlights the performance trends of various ML models in terms of accuracy. Accuracy was chosen as the primary evaluation metric to assess the performance of the classification models in predicting material categories. Default settings were applied to all machine learning models to establish a consistent baseline for comparison, and to incorporate a larger number of classes in further exploration. The parameters described in [35,36,37,38] provide a clear basis for comparing model performance, and align well with the actual data patterns, offering a reliable means to evaluate the models against existing results [2,3,4,5,6,7,8,9,10,11,12,13,14,15]. Among all the machine learning models, RFC achieved optimal accuracy, while the accuracy was 98.7% in PFV, 97.5% in FVP, 96.25% in FPV, 95.62% in VPF, 93.75% in VPF, and 90% in PVF. RFC achieved high accuracy, likely due to its ability to capture different material patterns across the three classes in the tactile feature dataset. After RFC, the trends show that models like DT, KNN, and ANN-MLP achieved accuracies between 94% and 96% for FPV, PFV, and FVP. However, for VFP, VPF, and PVF, a decline in accuracy was observed, with values falling below 90%, but staying above 85%. Additionally, it is crucial to assess whether RFC experiences any overfitting issues in subsequent tests. SVC with the linear kernel achieved an accuracy of 86%, while SVC with the RBF kernel performed better, at 95%. The difference in performance between the two models could be attributed to their ability to capture data relationships; the linear kernel assumes a simpler, linear relationship, while the RBF kernel is suited for handling non-linear relationships, making it more effective for the complex patterns in the sensor data [35,36,37,38]. Across all topologies, both LR and SVC with a linear kernel achieved accuracies ranging from 55% to 84%. This indicates that linear models struggle to capture the complexity of the material tactile data, particularly for hardness classification. Hyperparameter optimization could be explored in future studies to improve the performance of ML models where accuracy drops below 90%. In conclusion, RFC was used at this stage to identify the optimal topologies, which were PFV, FVP, and FPV.
Performance Analysis of Sensor Topologies: Based on the analysis, the topologies PFV, FVP, and FPV were identified as optimal for three-class material classification. Among these, two bio-inspired topologies, FPV and FVP, demonstrated effective performance, achieving accuracies of 96.25% and 97.5%, respectively. These configurations, where the top layer consisted of force sensors, likely contributed to their effectiveness. The highest accuracy of 97.5%, achieved by FVP, supports the hypothesis that bio-inspired topologies can perform optimally in material classification. However, this hypothesis was not fully validated, as the alternative topology, PFV, outperformed all others, with the highest accuracy of 98.75%. In PFV, the P sensor was positioned at the top, which may have been a critical factor in its better performance. In contrast, PVF, which also had the P sensor at the top, achieved an accuracy of 93%, the second-lowest among all topologies. In configurations where the vibration sensor was placed on top, such as VFP and VPF, accuracies dropped further to 90% and 95%, respectively. This decline may be due to the vibration sensor’s position on top, which could interfere with capturing accurate force values and essential tactile information. Notably, in VPF, when the P sensor was moved from the last to the second layer, accuracy improved, as observed in PFV. Additionally, in topologies like PVF, VFP, and VPF, which achieved accuracies of 93%, 90%, and 95%, respectively, the arrangement and placement of sensors significantly influenced the machine learning outcomes. Overall, PFV emerged as the most effective configuration, achieving the highest accuracy of 98.75%. These findings highlight the critical role of topology design in optimizing tactile information capture, emphasizing the importance of sensor arrangement in achieving accurate material classification. Further testing of optimal topologies such as FPV, FVP, and PFV in both offline and online cases was conducted in the next step to assess the stability of the outcomes for multiclass hardness classification.

5.2. Performance of Optimal Topologies Across Multiclass Scenarios

To assess the scalability of the optimal topologies, FVP, FPV, and PFV configurations were evaluated with expanded material classes, including four-class and five-class classifications. The fourth class introduced an extra-soft (ES) material, such as sponge, while the fifth class added an extra-hard (EH) material, such as wood. Each topology was trained using datasets that incorporated these new materials, following the same methodology as in earlier tests.
For the fourth and fifth classes, the FVP topology experienced a slight decline in accuracy, dropping from 89.38% to 88% (Table 1). In contrast, the PFV and FPV topologies, which feature vibration sensors in the last layer, maintained consistently high accuracy. PFV achieved 98.0% and 97.5%, while FPV recorded 95.6% and 96% accuracy for the fourth and fifth classes, respectively. These findings indicate that placing vibration sensors in the last layer enhances the ability to capture tactile features, contributing to improved classification performance as the complexity of the task increases.
However, the difficulty in distinguishing overlapping material types, such as ES, S, and F, likely contributed to the decline in accuracy observed across the topologies. Additionally, misclassifications may have been influenced by the uneven distribution of objects in the dataset (2-H, 2-S, 1-F). To explore these challenges further, offline and online testing were conducted to evaluate the scalability and robustness of the FPV and PFV topologies. These tests provide valuable insights into how these configurations perform under varying testing conditions.

5.3. Offline Validation of PFV Topology: Accuracy with New and Unseen Data

Offline validation or testing involved evaluating the performance of the ML model, utilizing data from a topology previously identified as optimal—PFV or FPV—against new and unseen data from objects of different material types. This process used a trained model and prediction methods, where newly collected values from the PFV topology were fed into the model to predict material types. In this study, offline validation was crucial for assessing the generalization capabilities of the PFV topology, recognized earlier as optimal for hardness classification. Previously, RFC maintained consistent accuracy, which was utilized in offline testing scenarios to validate the results. Initially, RFC was applied to evaluate the PFV topology using new object data, collected from 20 samples for each material type. These samples were then input into the trained model to predict the material type, as shown in Table 2. While RFC exhibited relatively high accuracy overall, it correctly predicted only 6 out of the 15 material types. This highlights the limitation of RFC in generalizing to unseen data, with over 50% of predictions being incorrect. Variability in the new object data likely made it difficult for a single classifier to capture complex features, and overfitting may have further contributed to its inability to generalize effectively, leading to this underperformance.
To address these challenges, an Ensemble approach was implemented. This method integrated multiple algorithms—RFC, SVC, LR, DT, MLP, and KNN—to collaboratively predict material types. By aggregating predictions from these diverse models, the ensemble approach provided a more robust and accurate prediction mechanism. Consequently, the ensemble correctly predicted 13 out of 15 material types, as shown in Table 2, with and accuracy range from 60 to 100%. The enhanced performance of the ensemble approach underlines its ability to mitigate the limitations of individual RFC classifiers by leveraging their collective prediction, making it a more reliable approach for material classification in diverse and unseen datasets. In the next step, online testing was conducted using real-time data to evaluate the capability of the trained model with the ensemble approach.

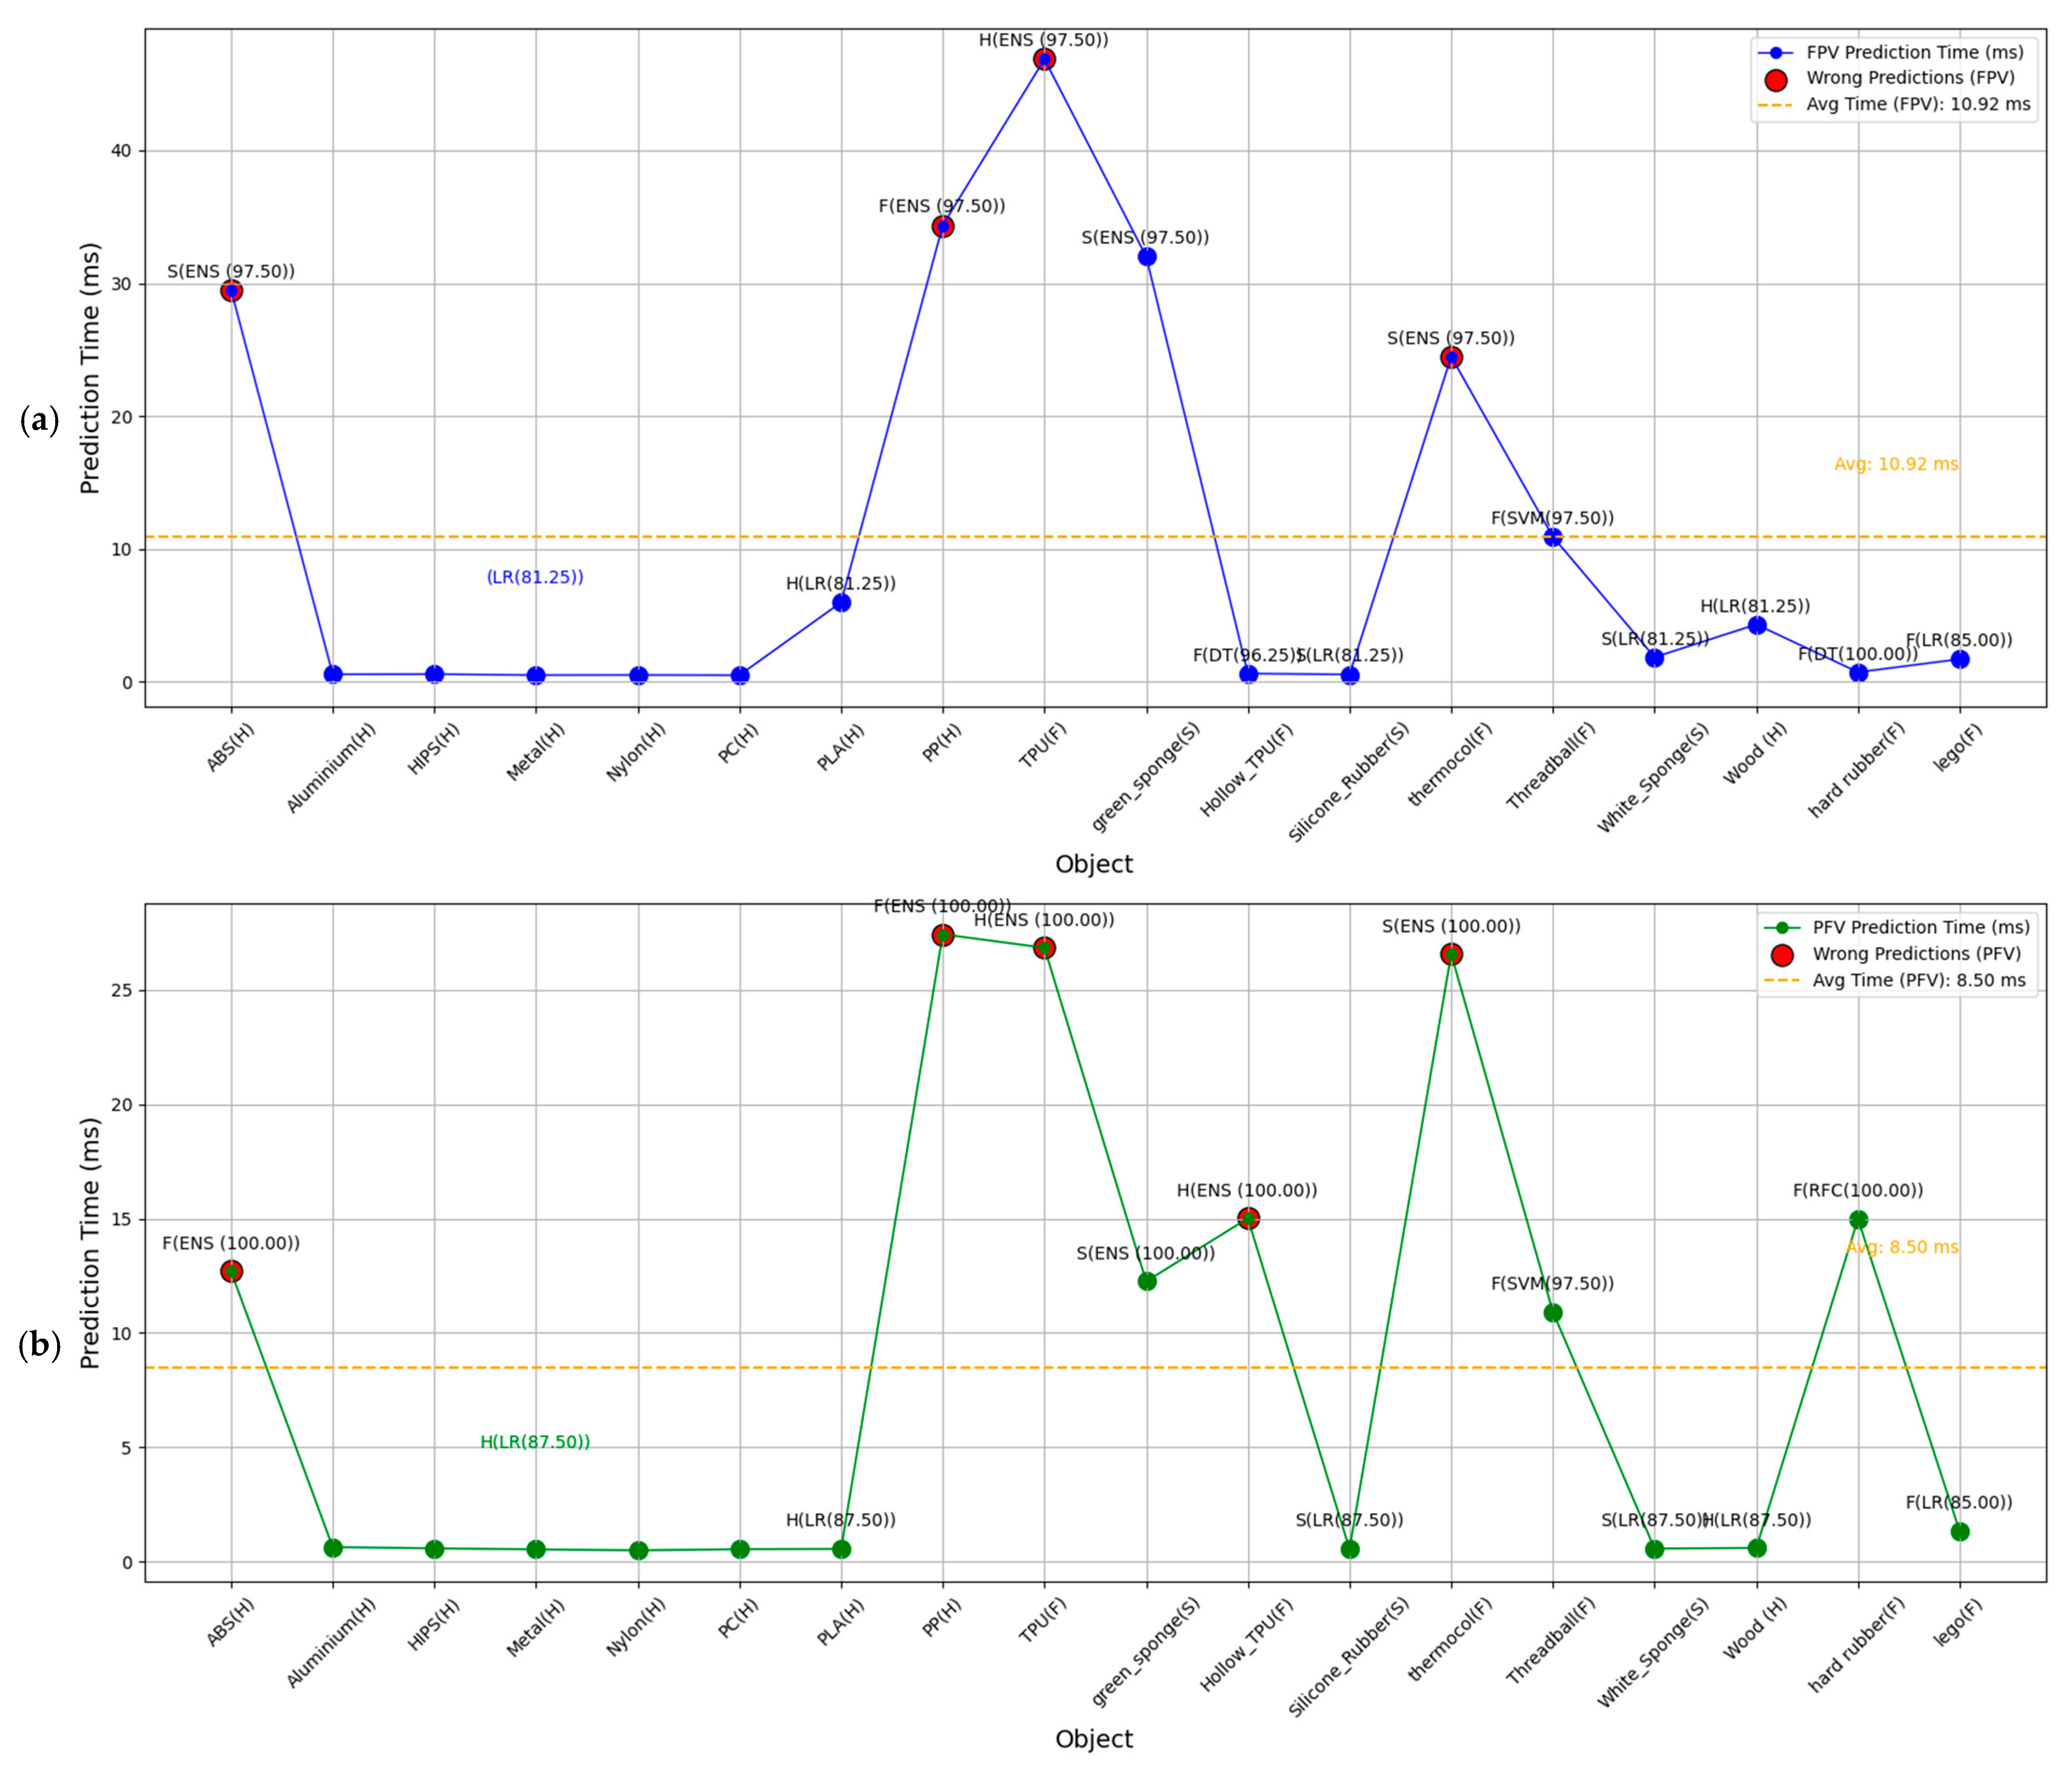
5.4. Online Testing: Validation of Optimum Topology in Real-Time Robotic Application

For real-time application in robotic systems, 18 objects were tested using a robotic gripper, which grasped each object for 10 s while collecting sensor data. The median values from these data were input into a pre-trained model that included data from three classes (H, S, F). The model utilized trained algorithms and new objects to predict material properties, with accuracy results shown in the accompanying plot in Figure 9. This comparison between the two topologies, PFV and FPV, as illustrated in Figure 9, highlights that 12 out of 18 for PFV and 13 out of 18 for FPV objects were correctly predicted, detailing prediction times for each object with accuracy. The following is also described in Table 3: overall, PFV has an average prediction time of approximately 8.31 milliseconds, making it faster compared to FPV, which has an average prediction time of around 10 to 13.3 milliseconds. In terms of prediction speed, the data indicate that PFV topology outperforms FPV for most materials. For hard materials, PFV achieves an average prediction time of 4.35 milliseconds, compared to 7.2 milliseconds for FPV. For soft materials, PFV maintains a faster average prediction time of 4.46 milliseconds, while FPV requires 11.47 milliseconds. However, for flexible materials, PFV has an average prediction time of 16.13 milliseconds, which is slower compared to FPV’s 21.50 milliseconds. The faster response time of PFV makes it suitable for real-time robotic automation tasks, such as industrial material sorting, automated packaging, or assembly lines or medical robotic applications, where quick decision-making is crucial. Also, PFV and FPV take less time in prediction, in comparison to the 43 milliseconds described in [18]. In contrast, FPV, with its longer latency, may be more suitable for less time-sensitive tasks, or scenarios where precision can outweigh speed. Specifically, PFV’s speed and accuracy for hard, soft, and flexible materials make it more ideal than FPV for industries needing fast, precise, three-class classification of objects. Real-time robotic systems using FPV might face delays, making them less suitable for tasks requiring high throughput or rapid adaptation to object property changes. Overall, PFV emerges as the faster and more adaptable topology for most materials, though FPV can be valuable in applications where tactile precision is essential.

6. Results and Discussion

The hypothesis that mechanoreceptor-inspired topologies can effectively perform multiclass classification highlights the importance of bio-inspired designs in improving hardness classification accuracy. This approach highlights the critical role of biomimetic principles in enhancing the performance and reliability of tactile sensing systems. The results obtained from each topology configuration further validate this hypothesis, with all configurations achieving accuracies above 90%, and reaching up to 98%. Particularly, the PFV topology emerged as the optimum in terms of faster prediction time, achieving an accuracy of 98.8%. FPV topology also performed well in terms of the number of correct predictions, achieving accuracies of 97.2% and 96.2%, indicating its suitability for optimal hardness classification. These findings highlight the capability of these topologies in hardness classification tasks and suggest that sensor topologies can realistically perform hardness classification for multiple classes using machine learning models. In comparison to existing approaches, the performance of the FPV and PFV topologies in this study demonstrates competitive accuracy, with FPV achieving 98.75% for two-class classification, 96.25% for three-class classification, and 95.6% for four-class classification. PFV topology shows higher results, reaching 99.5% for two-class, 98.75% for three-class, and 98.0% for four-class classification. These results, in some cases, surpass or match the performance reported in prior studies, such as [2] (93–98%), [3] (98%), [4] (90.03% and 94.27%), [5] (64–94%), [7] (92%), [9] (54–98%), [11] (85.4 ± 7.9%), [12] (97.3%), and [15] (93%), highlighting the effectiveness of the COTS topologies. Additionally, when retested in offline mode with new object values from different material types, the sensor topology, along with the Ensemble algorithms, achieved accuracy ranging from 60% to 100%. Among the various topologies, the bio-inspired configurations, particularly FPV modelled on mechanoreceptor architecture, showed the potential for optimal performance in hardness classification. Also, in terms of real-time prediction, the PFV topology demonstrated faster prediction speed, while maintaining high accuracy. FPV achieved 13 correct predictions out of 18, which means it can be well suited for real-time applications requiring precision, as its timing was 13 ms. PFV, on the other hand achieved 12 correct predictions out of 18, and may be more suited for applications requiring a faster prediction time-8.5 ms. Also, the ensemble approach and the outcomes from the multiple ML algorithms and RFC and DT classifiers highlight their effectiveness in prediction accuracy for material classification at the testing stage.

7. Conclusions and Future Work

Based on the results, it is concluded that topology configurations based on mechanoreceptor architectures can improve accuracy in hardness classification across various Shore hardness scales. The findings confirm that mechanoreceptor-based COTS topology configurations enhance classification accuracy when compared to previous studies [7] and a single-sensor approach. Furthermore, the research highlights that some topologies, including mechanoreceptor-based configurations (FPV), can achieve optimal accuracy and deliver real-time predictions with lower latency, comparably to existing customized sensors [18]. Additionally, other configurations, like PFV, demonstrate even lower latency than FPV, indicating future potential for testing with multiple objects and materials to understand further class testing. These results suggest potential for further applications in robotic systems and other real-time scenarios. Topology-based approaches hold promise for obtaining optimum accuracy at lower cost (using COTS), which could be useful for medical applications like prosthetics, enhancing sensor configurations to enable faster predictions and reduced latency for improved real-time responsiveness. In robotics, they can support precise object manipulation and adaptive decision-making, increasing efficiency and versatility.
However, certain limitations were identified in this investigation. The limited sample size of four to five objects may have constrained the generalizability of the results. Increasing the number of data points or replicates per material object could improve accuracy and robustness. Future work will address this limitation by expanding the dataset and exploring the impact of sample size on performance. The rationale for the current sample size was based on practical constraints, but a larger dataset will be considered in future studies. During offline testing, RFC showed high accuracy, but its performance dropped during online testing. This issue was addressed by using an ensemble approach, which combined predictions from multiple algorithms to improve accuracy and reliability, but in online testing, these dropped. Additionally, this study primarily focused on hardness classification, and other material properties (texture) were not extensively explored. The current study focuses on lab-based testing, with limitations in real-world applications. The current setup also lacks environmental variability, which is critical for assessing the practical applicability of the sensors in dynamic and uncontrolled settings. Future work will involve deploying models in such environments, including the UR10 robot or others, to evaluate scalability and performance.
Currently, the use of only a single gripper limits the broader applicability of the approach, highlighting the need for further exploration in this area. Future investigations will include a broader range of objects to further validate the findings and improve the robustness of the models. Additionally, exploring sensors compatible with industrial robotics, particularly those used with three-finger grippers, could unlock new potential. Multidimensional grippers incorporating topologies such as PFV, VPF, and FVP would enable simultaneous assessment of texture, hardness, and slip, enhancing the system’s capability to adapt to diverse and intricate real-world scenarios.
Future work can explore deep learning models and hyperparameter optimization to see if they improve the performance of a specific topology or enhance other topologies and algorithms that did not achieve optimal results. A comparison of these improvements could provide further insights. Expanding the dataset to include various materials with different properties can help in understanding the broader applicability of the sensor topologies. Specifically, testing should be conducted on materials with varying textures, elasticity, and thermal properties to evaluate the sensors’ versatility in classifying different material attributes. Real-time testing with uncertain objects is also a next step. Deploying these sensor topologies in real-world scenarios with unknown objects (bottle, uneven objects) will provide valuable insights into their practical performance and reliability. This includes integrating the sensors into robotic systems and testing their ability to classify materials on-the-fly during robotic operations. Also, a single type of robotic gripper was deployed; there is scope for future exploration based on different robotic grippers and different classifications. These topologies may also help to improve prosthetics’ sensing capabilities, enhancing sensor configurations to enable faster predictions and reduced latency for improved real-time responsiveness. In robotics, they can support precise object manipulation and adaptive decision-making, increasing efficiency and versatility. Sensor topology might also play a crucial role in fruit handling and classification, by optimizing sensor placement for the accurate detection of properties such as texture and firmness, enabling precise grip control, real-time feedback, and efficient classification across diverse fruit types, while minimizing damage during handling.
Another area of interest is the development of miniaturized and more robust COTS sensors that can withstand harsh environments and continuous use in industrial settings. Furthermore, further studies should explore other bio-inspired topologies and configurations to discover new possibilities for optimizing tactile sensing and material classification. By addressing these limitations and exploring these future research directions, the field of tactile sensing and material classification using COTS sensors can be suggestively advanced, leading to more reliable and versatile applications in robotics.
Silicone rubber could be added between the sensors to emulate the complete architecture of the mechanoreceptor-skin. Accuracy scores for retesting outcomes can showcase, in parallel, a prediction set, which may help to identify real-time prediction scenarios if used in the future and may improve latency. For further development, a feedback loop can be set, based on sensors which may be able to control pressure and perform the self-adjustment task of handling sensitive objects, alongside prediction.
Untested topology can be explored in terms of different applications. VPF or VFP can be used in texture detection, based on vibration as the top layer; PFV or PVF for slip detection, with the potentiometer as the top layer; and FPV or FVP in general touch, force, and pressure understanding. For future testing, different topologies, such as VPFV and other four-sensor combinations, can be explored to gather more tactile information for hardness classification and beyond. Furthermore, single- (FFF, VVV, PPP) or dual-functionality (FFVV, VVPP, FFPP) sensor topologies and other combinations can also form part of future exploration. In addition, temperature-based sensors can also be integrated to create a TFPV topology, along with other configurations, to further explore and analyze the behaviour and functionality of these topologies in sensing and classification tasks using COTS sensors for robotic applications. Also, classes could be extended to include up to five to six classes ((ES, S, F, H, EH) or (ES, S, MS, MH, H, EH)), MS (medium-soft), or MH (medium-hard). Additionally, building on a previous study on spike patterns [15], these patterns could be aggregated as new features to explore whether the sensor topology behaves similarly, or if a fully developed artificial mechanoreceptor configuration can further enhance real-time prediction accuracy. This could broaden the study of COTS sensor topologies in classification tasks, providing deeper insights into their potential applications. Also, temperature sensors can be used as thermoreceptors to make complete artificial mechanoreceptor sub-layers and test different combinations of topologies, and can be used in-real time prediction, considering temperature among the material properties.

Supplementary Materials

The following supporting information can be downloaded at: https://www.mdpi.com/article/10.3390/electronics14040674/s1, Figure S1: (Pg1–3) Plot of each topology with objects(materials) on a scale of 0 to 5V. Figure S2: Topology setup and steps involved in stacking them and placing them in the robotic gripper. Figure S3: Confusion matrix to support topology finding for PFV topology (multiclass). Figure S4: Confusion matrix to support topology finding for FPV topology (multiclass). Table S1: Accuracy and Confidence Intervals for PFV and FPV Datasets. Table S2: Data Collection Sample Size.

Author Contributions

Conceptualization, Y.S. and P.F.; methodology, Y.S. and P.F.; software, Y.S.; validation, Y.S. and P.F.; formal analysis, Y.S. and P.F.; investigation, Y.S.; resources, Y.S.; data curation, Y.S.; writing—original draft preparation, Y.S.; writing—review and editing, Y.S., P.F., C.G. and M.B., visualization, Y.S.; supervision, P.F., C.G. and L.J.; project administration, Y.S. and P.F. All authors have read and agreed to the published version of the manuscript.

Funding

This research received no external funding.

Data Availability Statement

The original data presented in the study are openly available at: https://github.com/Yash9808/MDPI-Electronics-paper-Data-for-Topology-.git (accessed on 1 December 2024).

Acknowledgments

The authors sincerely acknowledge the lab support provided by Daniel Lake, Senior Technical Experimental Officer, and the resources made available by the Intelligent Automation Centre, Loughborough University.

Conflicts of Interest

The authors declare no conflict of interest.

References

  1. Yang, J.C.; Mun, J.; Kwon, S.Y.; Park, S.; Bao, Z.; Park, S. Electronic Skin: Recent Progress and Future Prospects for Skin-Attachable Devices for Health Monitoring, Robotics, and Prosthetics. Adv. Mater. 2019, 31, 1904765. [Google Scholar] [CrossRef] [PubMed]
  2. Song, Y.; Lv, S.; Wang, F.; Li, M. Hardness-and-Type Recognition of Different Objects Based on a Novel Porous Graphene Flexible Tactile Sensor Array. Micromachines 2023, 14, 217. [Google Scholar] [CrossRef]
  3. Amin, Y.; Gianoglio, C.; Valle, M. Embedded Real-Time Objects’ Hardness Classification for Robotic Grippers. Future Gener. Comput. Syst. 2023, 148, 211–224. [Google Scholar] [CrossRef]
  4. Zhang, Z.; Zhou, J.; Yan, Z.; Wang, K.; Mao, J.; Jiang, Z. Hardness Recognition of Fruits and Vegetables Based on Tactile Array Information of Manipulator. Comput. Electron. Agric. 2021, 181, 105959. [Google Scholar] [CrossRef]
  5. Qian, X.; Li, E.; Zhang, J.; Zhao, S.-N.; Wu, Q.-E.; Zhang, H.; Wang, W.; Wu, Y. Hardness Recognition of Robotic Forearm Based on Semi-Supervised Generative Adversarial Networks. Front. Neurorobot. 2019, 13, 73. [Google Scholar] [CrossRef]
  6. Shimizu, T.; Shikida, M.; Sato, K.; Itoigawa, K. A new type of tactile sensor detecting contact force and hardness of an object. In Proceedings of the MEMS 2002 IEEE International Conference, Fifteenth IEEE International Conference on Micro Electro Mechanical Systems (Cat. No. 02CH37266), Las Vegas, NV, USA, 20–24 January 2002; pp. 344–347. [Google Scholar] [CrossRef]
  7. Sharma, Y.; Ferreira, P.; Justham, L. Hardness Classification Using Cost-Effective Off-the-Shelf Tactile Sensors Inspired by Mechanoreceptors. Electronics 2024, 13, 2450. [Google Scholar] [CrossRef]
  8. Kerr, E.; McGinnity, T.; Coleman, S. Material Recognition Using Tactile Sensing. Expert. Syst. Appl. 2018, 94, 94–111. [Google Scholar] [CrossRef]
  9. Gómez Eguíluz, A.; Rañó, I.; Coleman, S.A.; McGinnity, T.M. Multimodal Material Identification through Recursive Tactile Sensing. Rob. Auton. Syst. 2018, 106, 130–139. [Google Scholar] [CrossRef]
  10. Jamali, N.; Sammut, C. Material Classification by Tactile Sensing Using Surface Textures. In Proceedings of the 2010 IEEE International Conference on Robotics and Automation, Anchorage, AK, USA, 3–7 May 2010; pp. 2336–2341. [Google Scholar] [CrossRef]
  11. Dai, K.; Wang, X.; Rojas, A.M.; Harber, E.; Tian, Y.; Paiva, N.; Gnehm, J.; Schindewolf, E.; Choset, H.; Webster-Wood, V.A.; et al. Design of a Biomimetic Tactile Sensor for Material Classification. arXiv 2022, arXiv:2203.15941. [Google Scholar]
  12. Bouhamed, S.A.; Chakroun, M.; Kallel, I.K.; Derbel, H. Haralick Feature Selection for Material Rigidity Recognition Using Ultrasound Echo. In Proceedings of the 2018 4th International Conference on Advanced Technologies for Signal and Image Processing (ATSIP, Sousse, Tunisia, 21–24 March 2018; pp. 1–6. [Google Scholar] [CrossRef]
  13. Kerr, E.; McGinnity, T.M.; Coleman, S. Material Classification Based on Thermal Properties–A Robot and Human Evaluation. In Proceedings of the 2013 IEEE International Conference on Robotics and Biomimetics (ROBIO), Shenzhen, China, 12–14 December 2013; pp. 1048–1053. [Google Scholar] [CrossRef]
  14. Chung, J.; Lim, H.; Lim, M.; Cha, Y. Object Classification Based on Piezoelectric Actuator-Sensor Pair on Robot Hand Using Neural Network. Smart Mater. Struct. 2020, 29, 105020. [Google Scholar] [CrossRef]
  15. Sharma, Y.; Ferreira, P.; Justham, L.; Beatty, M. Investigating the Use of Low-Cost Tactile Sensor in Emulating Mechanoreceptor Patterns and in Hardness-Based Classification. In Proceedings of the 2024 10th International Conference on Control, Automation and Robotics (ICCAR), Orchard District, Singapore, 27–29 April 2024; pp. 39–46. [Google Scholar] [CrossRef]
  16. Wei, Y.; Cai, L.; Fang, H.; Chen, H. Fruit Recognition and Classification Based on Tactile Information of Flexible Hand. Sens. Actuators A Phys. 2024, 370, 115224. [Google Scholar] [CrossRef]
  17. Li, F.; Wang, R.; Song, C.; Zhao, M.; Ren, H.; Wang, S.; Liang, K.; Li, D.; Ma, X.; Zhu, B.; et al. A Skin-Inspired Artificial Mechanoreceptor for Tactile Enhancement and Integration. ACS Nano 2021, 15, 16422–16431. [Google Scholar] [CrossRef] [PubMed]
  18. Li, G.; Liu, S.; Wang, L.; Zhu, R. Skin-Inspired Quadruple Tactile Sensors Integrated on a Robot Hand Enable Object Recognition. Sci. Robot. 2020, 5, eabc8134. [Google Scholar] [CrossRef] [PubMed]
  19. Deflorio, D.; Di Luca, M.; Wing, A.M. Skin and Mechanoreceptor Contribution to Tactile Input for Perception: A Review of Simulation Models. Front. Hum. Neurosci. 2022, 16, 862344. [Google Scholar] [CrossRef]
  20. Kalita, H.; Krishnaprasad, A.; Choudhary, N.; Das, S.; Dev, D.; Ding, Y.; Tetard, L.; Chung, H.-S.; Jung, Y.; Roy, T. Artificial Neuron Using Vertical MoS2/Graphene Threshold Switching Memristors. Sci. Rep. 2019, 9, 53. [Google Scholar] [CrossRef]
  21. Chun, S.; Kim, J.-S.; Yoo, Y.; Choi, Y.; Jung, S.J.; Jang, D.; Lee, G.; Song, K.-I.; Nam, K.S.; Youn, I.; et al. An Artificial Neural Tactile Sensing System. Nat. Electron. 2021, 4, 429–438. [Google Scholar] [CrossRef]
  22. Chun, K.; Son, Y.J.; Jeon, E.; Lee, S.; Han, C. A Self-Powered Sensor Mimicking Slow- and Fast-Adapting Cutaneous Mechanoreceptors. Adv. Mater. 2018, 30, 1706299. [Google Scholar] [CrossRef] [PubMed]
  23. Liu, F.; Deswal, S.; Christou, A.; Sandamirskaya, Y.; Kaboli, M.; Dahiya, R. Neuro-Inspired Electronic Skin for Robots. Sci. Robot. 2022, 7, eabl7344. [Google Scholar] [CrossRef]
  24. Iheanacho, F.; Vellipuram, A.R. Physiology, Mechanoreceptors; StatPearls Publishing. 2023. Available online: https://www.ncbi.nlm.nih.gov/books/NBK541068/ (accessed on 17 November 2024).
  25. Man, J.; Chen, G.; Chen, J. Recent Progress of Biomimetic Tactile Sensing Technology Based on Magnetic Sensors. Biosensors 2022, 12, 1054. [Google Scholar] [CrossRef] [PubMed]
  26. Madrigal, D.; Torres, G.; Ramos, F.; Vega, L. Cutaneous Mechanoreceptor Simulator. In Proceedings of the 2012 IEEE 3rd International Conference on Cognitive Info communications (Cog Infocom), Kosice, Slovakia, 2–5 December 2012; pp. 781–786. [Google Scholar] [CrossRef]
  27. Tee, B.C.-K.; Chortos, A.; Berndt, A.; Nguyen, A.K.; Tom, A.; McGuire, A.; Lin, Z.C.; Tien, K.; Bae, W.-G.; Wang, H.; et al. A Skin-Inspired Organic Digital Mechanoreceptor. Science 2015, 350, 313–316. [Google Scholar] [CrossRef] [PubMed]
  28. Shang, C.; Xu, Q.; Liang, N.; Zhang, J.; Li, L.; Peng, Z. Multi-Parameter e-Skin Based on Biomimetic Mechanoreceptors and Stress Field Sensing. npj Flex. Electron. 2023, 7, 19. [Google Scholar] [CrossRef]
  29. Kim, E.K.; Gerling, G.J.; Wellnitz, S.A.; Lumpkin, E.A. Using Force Sensors and Neural Models to Encode Tactile Stimuli as Spike-Based Responses. In Proceedings of the 2010 IEEE Haptics Symposium, Waltham, MA, USA, 25–26 March 2010; pp. 195–198. [Google Scholar] [CrossRef]
  30. Song, Z.; Yin, J.; Wang, Z.; Lu, C.; Yang, Z.; Zhao, Z.; Lin, Z.; Wang, J.; Wu, C.; Cheng, J.; et al. A Flexible Triboelectric Tactile Sensor for Simultaneous Material and Texture Recognition. Nano Energy 2022, 93, 106798. [Google Scholar] [CrossRef]
  31. FSR Sensor, Force Sensing Resistor|Interlink Electronics. Available online: https://www.interlinkelectronics.com/force-sensing-resistor (accessed on 4 February 2025).
  32. 1-1002908-0|TE Connectivity Vibration Sensor, 0 °C→+70 °C|RS. Available online: https://uk.rs-online.com/web/p/vibration-sensors/8937301 (accessed on 4 February 2025).
  33. Soft Membrane Linear Potentiometers|SoftPot. Available online: https://www.spectrasymbol.com/linear-position-sensors/soft-membrane-linear-pots-softpot (accessed on 4 February 2025).
  34. Xiong, Y.; Han, J.; Wang, Y.; Wang, Z.L.; Sun, Q. Emerging Iontronic Sensing: Materials, Mechanisms, and Applications. Research 2022, 2022, 9867378. [Google Scholar] [CrossRef]
  35. França, R.P.; Borges Monteiro, A.C.; Arthur, R.; Iano, Y. An Overview of Deep Learning in Big Data, Image, and Signal Processing in the Modern Digital Age. In Trends in Deep Learning Methodologies; Elsevier: Amsterdam, The Netherlands, 2021; pp. 63–87. [Google Scholar] [CrossRef]
  36. API Reference—Scikit-Learn 1.6.1 Documentation. Available online: https://scikit-learn.org/stable/api/index.html (accessed on 4 February 2025).
  37. Kaur, A.; Kaur, I. An Empirical Evaluation of Classification Algorithms for Fault Prediction in Open-Source Projects. J. King Saud Univ.—Comput. Inf. Sci. 2018, 30, 2–17. [Google Scholar] [CrossRef]
  38. Ali, S.; Smith, K.A. On Learning Algorithm Selection for Classification. Appl. Soft Comput. 2006, 6, 119–138. [Google Scholar] [CrossRef]
Figure 1. Illustrates the architecture of mechanoreceptors and their corresponding receptors with their functionality, demonstrating how COTS sensors are aligned based on their functionality, inspired by previous research [7]. The figure also highlights the primary topology as FPV (1. force sensors, 2. potentiometer, 3. vibration), which is inspired by the structure and arrangement of mechanoreceptors from the previous research paper [7].
Electronics 14 00674 g001
Figure 2. Illustrates the various topologies of the three COTS tactile sensors (1-F (Force sensor), 2-P(Potentiometer), 3-V (Vibration sensor)), arrangement of sensors shows configurations such as FVP, FPV, PVF, PFV, VFP, and VPF, will embed on one side of robotic gripper one by one for hardness classification. Among these, FPV represents the arrangement that most closely resembles the architecture inspired by mechanoreceptors, from functionality indications related to sensors. On the other hand, FVP could possibly be a viable topology if analyzed from a 3D spatial perspective. The figure is inspired by previous research [7].
Electronics 14 00674 g002
Figure 3. Illustrate both qualitative and quantitative scales, with the focus of this study being on the qualitative scale. The figure also shows the expansion of the qualitative Shore hardness scale, which was implemented to transform a binary classification to a six-class system. The topology tests were conducted in stages, starting with two classes, then expanding to three, and finally to four classes. This progression was aimed at assessing the scalability of a three-class setup, to determine the optimal results from the topology configuration. The figure also describes the objects used in the investigation, categorizing them based on their squeezability (resistance to deform). Additionally, it indicates the estimated material type ranges of the objects, according to the quantitative scale. The quantitative scale was not adopted in this study, as it requires a durometer to measure the value of each object. The object placed under the scale is assessed using a qualitative scale, providing a rough estimation of its value range in relation to the quantitative Shore hardness scale.
Electronics 14 00674 g003
Figure 4. Illustrate machine learning approach applied across multiple algorithms, primarily focused on classifying three distinct classes to determine the optimal topology. It outlines the steps involved in splitting the data into an 80/20 ratio for training and testing. Additionally, it details the data structure used to train the algorithm, comprising three values collected from force (F), vibration (V), and potentiometer sensors (P), which were recorded as analogue values, ranging from 0 to 5 volts, via Arduino. The data structure showcases the variables used for training the machine learning algorithms and highlights the extension of the Shore scale object classifications, such as ES or EH, in cases where four to five classes were tested. The outcome is evaluated based on accuracy, to identify the optimal topology from configurations like FVP, FPV, VFP, VPF, PVF, and PFV.
Electronics 14 00674 g004
Figure 5. Illustrates (a) An overview of the approach for testing different COTS sensor topologies attached to one side of the robotic gripper. Data were collected from objects categorized by Shore hardness values during grasping, and each topology (FVP, FPV, PVF, PFV, VFP, VPF) was analyzed using machine learning classifiers to identify the optimum configuration. Results were produced for two-class (hard (H), soft (S)) scenarios, extended to three-class (H, S, Flexible (F)) scenarios, and scalability was tested for up to four-class (H, S, F, ES) scenarios. Sensor topologies were connected to an Arduino and Raspberry Pi for data collection and analysis. (b) Scalability testing for the optimum topology was conducted across four hardness classes to assess whether accuracy was maintained or dropped, validating the results from part (a). (c) The real-time testing approach with the optimum topology. Data were collected during grasping, fed into the trained model, and predictions were made. The final prediction was determined through an ensemble method, with the time taken from data input to the prediction outcome calculated. The method/approach is inspired by previous research [7].
Electronics 14 00674 g005
Figure 6. This figure primarily illustrates the selectivity of objects based on the Shore hardness scale, indicating how objects can be chosen to extend the classification up to four classes, (ES), (S), (F), and (H). The training phase initially involved three classes (PLA, wood, silicone rubber, TPU), which were later extended to include ES with white sponge. The figure provides an overview of the experimental setup, demonstrating the interconnections among the key tools used in developing the prototype. It presents three distinct systems: the gripper system, control system, and pressure system. Additionally, COTS tactile sensor topologies were embedded on the side of the gripper to collect data from various objects, selected based on the Shore hardness scale. The collected data were saved in CSV format on a Raspberry Pi, with around 200 samples for each sensor–object combination. This experimental setup was inspired by previous research [7].
Electronics 14 00674 g006
Figure 7. This figure represents various objects that were customized or structured into three assumed classes: hard, soft, and flexible. The yellow dots indicate objects that were custom-made using 3D printing, with approximate dimensions of 3 cm × 3 cm × 3 cm. Additionally, some non-symmetrical objects, such as a thread ball, were also included in the testing process. These objects were evaluated using trained models to predict their material properties based on the hardness classification.
Electronics 14 00674 g007
Figure 8. This figure shows the accuracy achieved by various algorithms in hardness classification across different topologies, highlighting that the Random Forest Classifier (RFC) consistently outperforms other algorithms, with the PFV topology being the optimum among all the tested configurations. Additionally, the results are compared with findings from previous studies for three classes achieving 81% accuracy [7] from aggregation of data from the three sensors (F, V, P), particularly in the context of three-class classification (H, S, F). Results marked in green were used to highlight the performance of the COTS topology against the benchmark from the previous paper [7]. Also, dashed boxes show the bio-inspired topology of the FPV performance region and the optimal topology of the PFV performance region.
Electronics 14 00674 g008
Figure 9. Illustrates testing results of multiple objects using optimal topologies, based on scalability result: (a) FPV shows average time of all predictions, and indicates number of correct predictions, with wrong predictions indicated in red; 13 are correct out of 18, with average prediction timing around 10.92–13.3 ms. Similarly, for (b) PFV, 12 are correct out of 18, with average time around 8.5 ms, which is faster than FPV. This showcases each material’s property predictions and analyzed results, based on all algorithms showcasing accuracy and predictions in relation to original objects-material, assumed based on Shore hardness scale.
Electronics 14 00674 g009
Table 1. This table summarizes the accuracy of various topologies in hardness classification across two, three, four, and five classes. PFV achieved the highest accuracy in two-class (99.5%) and three-class (98.75%) scenarios, while FVP performed well, but declined in accuracy for four-class (89.38%) and five-class (88%) classifications. FPV and PFV topologies maintained stable performance in complex tasks, with FPV achieving 96% in five-class scenarios. PVF, VFP, and VPF were not tested for four- and five-class cases due to limited scalability. The table highlights increasing classification challenges with additional material classes.
TopologyTwo-Class
(S, H)
Three-Class
(S, F, H)
Four-Class
(ES, S, F, H)
Five-Class
(ES, S, F, H, EH)
(FPV)98.7596.2595.696
(FVP)98.7597.589.3888
(PFV)99.598.7598.097.5
(PVF)95.693.75XX
(VFP)93.990.0XX
(VPF)95.095.62XX
Table 2. Comparison of RFC and Ensemble predictions for new object data: this table presents the predictions and accuracy achieved by the RFC and Ensemble methods for 15 objects and 3 material types (S, F, H) using the PFV topology, highlighting the number of correct predictions by each approach.
Material (Type)RFC
Prediction
Ensemble
Prediction
Ensemble
Accuracy (%)
TPU (F)SF78.50
Wood (H)FH99.75
PLA (H)SH99.50
SR (S)SS98.25
Green Sponge (S)SS66.75
White Sponge (S)FS92.74
Thread ball (F)FF100.00
Thermocol (F)SF90.13
Hollow TPU (F)FF64.02
ABS (H)SS95.97
Aluminum (H)HH66.13
Metal (H)HH92.74
Nylon (H)SH85.48
PC (H)SH98.89
PP (H)FS78.23
Correct Prediction=6/1513/15
Table 3. This table displays the average prediction time (in milliseconds) and accuracy (%) for PFV and FPV topologies across three material types: hard, soft, and flexible. The PFV topology shows an overall faster prediction time (8.31 ms) compared to FPV topology (13.3 ms), while both topologies achieve high accuracy (97.1% for PFV and 96.6% for FPV). For hard materials, PFV outperforms FPV in both prediction time (4.35 ms vs. 7.20 ms) and accuracy (97.05% vs. 96.25%). For soft materials, both topologies yield similar accuracy (96.67%), but with a notable difference in prediction times, with PFV being faster (4.46 ms vs. 11.47 ms). For flexible materials, PFV maintains a slight edge in accuracy (97.75%) compared to FPV (97.00%), but requires significantly more time (16.13 ms vs. 21.50 ms). These results suggest that PFV may offer better performance in terms of speed and consistency across material types, particularly for hard and soft materials.
Material TypePFV Avg. Time (ms)PFV Avg. Accuracy (%)FPV Avg. Time (ms)FPV Avg. Accuracy (%)
Overall8.3197.113.396.6
9-Hard4.3597.057.2096.25
3-Soft4.4696.6711.4796.67
6-Flexible16.1397.7521.5097.00
Disclaimer/Publisher’s Note: The statements, opinions and data contained in all publications are solely those of the individual author(s) and contributor(s) and not of MDPI and/or the editor(s). MDPI and/or the editor(s) disclaim responsibility for any injury to people or property resulting from any ideas, methods, instructions or products referred to in the content.

