Article

Influence of Multi-Source Electromagnetic Coupling on NVH in Automotive PMSMs

Department of Transportation, School of Automotive Engineering, Shandong Jiaotong University, Jinan 250300, China
*
Author to whom correspondence should be addressed.
Electronics 2025, 14(23), 4652; https://doi.org/10.3390/electronics14234652
Submission received: 29 October 2025 / Revised: 16 November 2025 / Accepted: 21 November 2025 / Published: 26 November 2025

Abstract

Persistent discrepancies remain in the perceived far-field noise of automotive permanent-magnet synchronous motors (PMSMs) and the predictions of conventional NVH simulations. To bridge this gap, a Tri-source Electromagnetic Coupling NVH Integrated Framework (Tri-ECNVH) is developed, in which air-gap electromagnetic force harmonics, torque ripple, and cogging torque are treated as a coupled excitation system rather than as independent sources. Traditional workflows usually superpose their responses in the power domain, which tends to underestimate the radiating contribution of torque-related excitations and neglect their phase and order coupling with radial electromagnetic forces. In the proposed Tri-ECNVH framework, the three sources are mapped into the order domain, aligned by spatial order, and applied to the stator with phase consistency, so that inter-source coupling and cross terms are explicitly retained along a unified electromagnetic–structural–acoustic chain. Acoustic radiation is evaluated by prescribing the normal velocity on the stator outer surface as a Neumann boundary condition and computing the far-field A-weighted sound pressure level (SPL) using a boundary element method (BEM) model. Numerical results reveal pronounced cooperative amplification of the three sources at critical orders and within perceptually sensitive frequency bands; relative to independent-source modeling with power-domain summation, Tri-ECNVH predicts peak levels that are typically 5–10 dB higher and reproduces the spectral envelope and peak–valley evolution more faithfully. The framework therefore offers a practical, radiation-oriented basis for multi-source noise mitigation in traction PMSMs and helps narrow the gap between simulation and perceived sound quality in automotive applications.

1. Introduction

With the rapid growth of new-energy vehicles, PMSMs have become the dominant option for electric drivetrains owing to their high efficiency, high power density, and excellent dynamic response [1,2]. Compared with conventional automotive induction motors, PMSMs typically achieve higher efficiency and power density in the low-to-medium speed range, enabling more compact drivetrains and more accurate low-speed torque control [3]. Relative to switched reluctance motors, which were once regarded as potential traction candidates, PMSMs also exhibit markedly lower torque ripple and electromagnetic noise and therefore offer superior NVH behavior and a smoother driving feel [4]. Nevertheless, despite their favorable efficiency and power characteristics, NVH issues in practical PMSM operation remain non-negligible and have become critical bottlenecks for ride comfort, overall reliability, and the market competitiveness of new-energy vehicles [5]. Under high-speed and complex operating conditions, electromagnetic excitations can easily trigger structural resonances, which substantially amplify NVH responses and, in severe cases, may even disturb sensor accuracy and the system stability of autonomous vehicles [6,7]. Moreover, the actual NVH impact of PMSMs in the vehicle’s external acoustic field is often observed to exceed that predicted by conventional A-weighted SPL calculations [8]. These observations highlight the need for a comprehensive mechanism study and contribution assessment of the three main electromagnetic excitations—radial electromagnetic forces, torque ripple, and cogging torque—to identify their dominant spatial orders and sensitive frequency bands, thereby providing a theoretical basis for subsequent vehicle-level NVH optimization.
For new-energy vehicles, motor noise is typically decomposed into mechanical, electromagnetic, and aerodynamic components. Among these, electromagnetic noise originates from the interaction between electromagnetic force waves and the structural natural frequencies of the motor, which drives vibration and sound radiation. It often emerges as the dominant noise source in pure electric vehicles and directly influences overall NVH performance and perceived acoustic comfort [9]. The electromagnetic excitation of a PMSM mainly stems from air-gap electromagnetic force harmonics, torque ripples during operation, and cogging-torque-related structural effects [10,11]. These excitations act on the stator, rotor, and housing through an electromagnetic–structural–acoustic coupling pathway. Air-gap force harmonics readily trigger structural resonances at specific frequencies, thereby amplifying both vibration responses and radiated sound [12]. During operation, torque ripple induces periodic variations in electromagnetic torque and associated force components, which excite low-frequency vibration and noise [13,14]. Cogging torque generates periodic reluctance torque fluctuations, particularly under low-speed and start–stop conditions, and can likewise lead to resonance phenomena [15]. It is therefore essential to systematically analyze the composition and mechanisms of electromagnetic noise to clearly identify its primary excitation sources.
Regarding the NVH mechanisms of PMSMs, previous studies have systematically examined the respective contributions of air-gap electromagnetic force harmonics, torque ripple, and cogging torque to acoustic noise generation. Based on Maxwell stress analysis, Ma et al. [16] showed that the radial force component predominantly governs electromagnetic vibration and sound radiation. Consistently, Dai et al. [17] reported through noise-reduction experiments on a high-speed magnetically suspended motor that mitigating the air-gap radial electromagnetic force can lead to substantial NVH improvements. In an optimization-oriented inverse analysis of electromagnetic noise, Soresini et al. [18] developed an electromagnetic–structural–acoustic multiphysics finite element model with harmonic current injection and demonstrated that appropriate optimization of injected current harmonics effectively suppresses air-gap force harmonics and reduces radiated noise under high-speed operating conditions, indirectly confirming the dominant role of the radial component. Lenz et al. [19] employed finite element analysis both to reduce torque ripples and to compare the performance of n-phase and multiple three-phase PMSMs; their results indicated that air-gap electromagnetic force harmonics are the primary cause of NVH degradation under open-phase fault conditions, highlighting their critical influence on vibration and acoustic behavior. With respect to torque ripple, under low-speed, start–stop, regenerative braking, and sudden load-change conditions, periodic torque fluctuations can significantly amplify torsional vibrations and give rise to pronounced low-frequency NVH issues inside the vehicle [20]. For example, torsional–electromagnetic coupling models of electric drivetrains have shown that torque ripple can markedly affect driveline torsional vibration and aggravate low-frequency NVH behavior; when the torsional mode of the drivetrain coincides with the fundamental torque frequency, even small torque ripples may be strongly amplified [21]. The correlation between torque ripples and cogging torque has also attracted considerable attention. Ref. [22] reported that, by optimizing the current waveform, attenuating specific air-gap force harmonics can simultaneously reduce torque ripple, vibration, and radiated noise. At low speeds, cogging torque itself should not be neglected, because the torque ripple it induces can lead to speed fluctuations, mechanical vibration, and undesirable acoustic noise [23]. Furthermore, Ref. [24] investigated the coupling between torque ripples and cogging torque under low-speed conditions using an analytical multiphysics approach and revealed that the interaction between tangential force harmonics and tooth modulation can substantially amplify vibration and acoustic responses within specific frequency bands, demonstrating the notable impact of this coupling on NVH performance. However, most existing NVH studies on electric machines still focus on a single electromagnetic excitation source and treat the three sources as independent or only weakly correlated, which makes it difficult to fully capture their coupling under complex operating conditions. To address this limitation, the authors of [25] applied the translation theorem of forces to convert tangential tooth forces into an equivalent radial moment pair acting on the stator yoke; their verification showed that the tangential force can be equivalently represented as a radial force couple, indicating that tangential excitation is not negligible. In studies of fractional-slot concentrated winding PMSMs (FSCW-PMSMs), it has been observed that phase coupling between the lowest-order radial and tangential forces and tooth modulation can significantly enhance radial vibration at the pole–pair frequency, further emphasizing the importance of three-source coupling in NVH behavior [26]. Nevertheless, when three-source coupling is considered in traction applications, factors such as cooling configuration, PWM and sideband harmonics, lightweight structural design, and in-cabin sound-quality constraints introduce substantial differences between the NVH mechanisms of automotive traction motors and those of industrial machines. Therefore, there is strong motivation to develop a comprehensive multi-source coupling strategy that consistently integrates electromagnetic, structural, and acoustic domains [27]. Analytical frameworks linking electromagnetic forces, stator-ring vibration, and acoustic radiation can rapidly predict dominant orders and peak frequencies; yet, owing to the combined effects of control harmonics, tooth modulation, and structural/acoustic boundary conditions, models relying on single-source excitation or overly simplified assumptions often deviate from experimental observations and exhibit limited fidelity [28,29]. Even in conventional coupling studies, such as [30], where an integrated electromagnetic–structural–acoustic chain is constructed and applied to noise-reduction optimization, simple power-spectrum superposition has proved insufficient to accurately reproduce the characteristics of the radiated acoustic field.
To overcome the above limitations, this paper develops an integrated three-source coupling framework, as schematically shown in Figure 1. Using a 6-pole 36-slot PMSM as the study object, the framework combines two-dimensional electromagnetic finite-element modeling, vibro-acoustic coupling, and BEM-based acoustic prediction to form a multiphysics collaborative analysis chain. Within this chain, the air-gap radial electromagnetic force harmonics, torque ripple (tangential force), and cogging torque (slot-induced radial force) are consistently mapped into the order domain, and their complex amplitudes are synthesized with strict order alignment and phase coherence. The A-weighted SPL is adopted as a unified acoustic metric, enabling quantitative comparison of the relative contributions of the three excitation sources on a common scale.
Compared with conventional workflows that treat each electromagnetic excitation source independently and simply superpose their responses in the power domain, the proposed framework explicitly retains the coupling and synergistic amplification among the sources, thereby clarifying the underlying interaction mechanisms. It also provides a structured basis for subsequent studies on electromagnetic noise in traction motors and for modeling and parameter optimization of multi-source coupling effects. In summary, the main contributions of this work are as follows:
  • A Tri-ECNVH integrated three-source coupling framework is proposed, in which radial electromagnetic force harmonics, torque ripple (tangential force), and cogging torque are uniformly mapped into the order domain and synthesized at the complex-amplitude level on a same-order basis.
  • An integrated computational chain combining electromagnetic FEA, structural vibro-acoustic coupling, and BEM acoustic analysis is established for a 6-pole 36-slot PMSM; using A-weighted SPL as a unified metric, it enables quantitative assessment of the coupled contributions of the three excitation sources on a consistent scale.
The remainder of this paper is organized as follows. Section 2 introduces the study object and modeling fundamentals, including the main parameters and the two-dimensional finite-element model of the 6-pole 36-slot PMSM. Section 3 maps the radial force harmonics, torque ripple (tangential force), and cogging torque into the order domain and performs same-order alignment and phase-consistent loading in the complex-amplitude domain. Section 4 uses the stator outer-surface normal velocity as the radiation boundary in a BEM framework to compare the proposed three-source coupling with direct power-spectrum superposition and a single-source radial-force full-link (SSRF) method, thereby quantifying differences in amplitude, peak frequency, and band energy within sensitive regions. Finally, Section 5 summarizes the main findings of the study.

2. Motor Electromagnetic Noise Analysis

2.1. Motor Parameters

Following mainstream EV traction-motor specifications, an interior 6-pole/36-slot PMSM was designed; its main parameters are listed in Table 1.

2.2. Two-Dimensional Finite Element Model of the PMSM

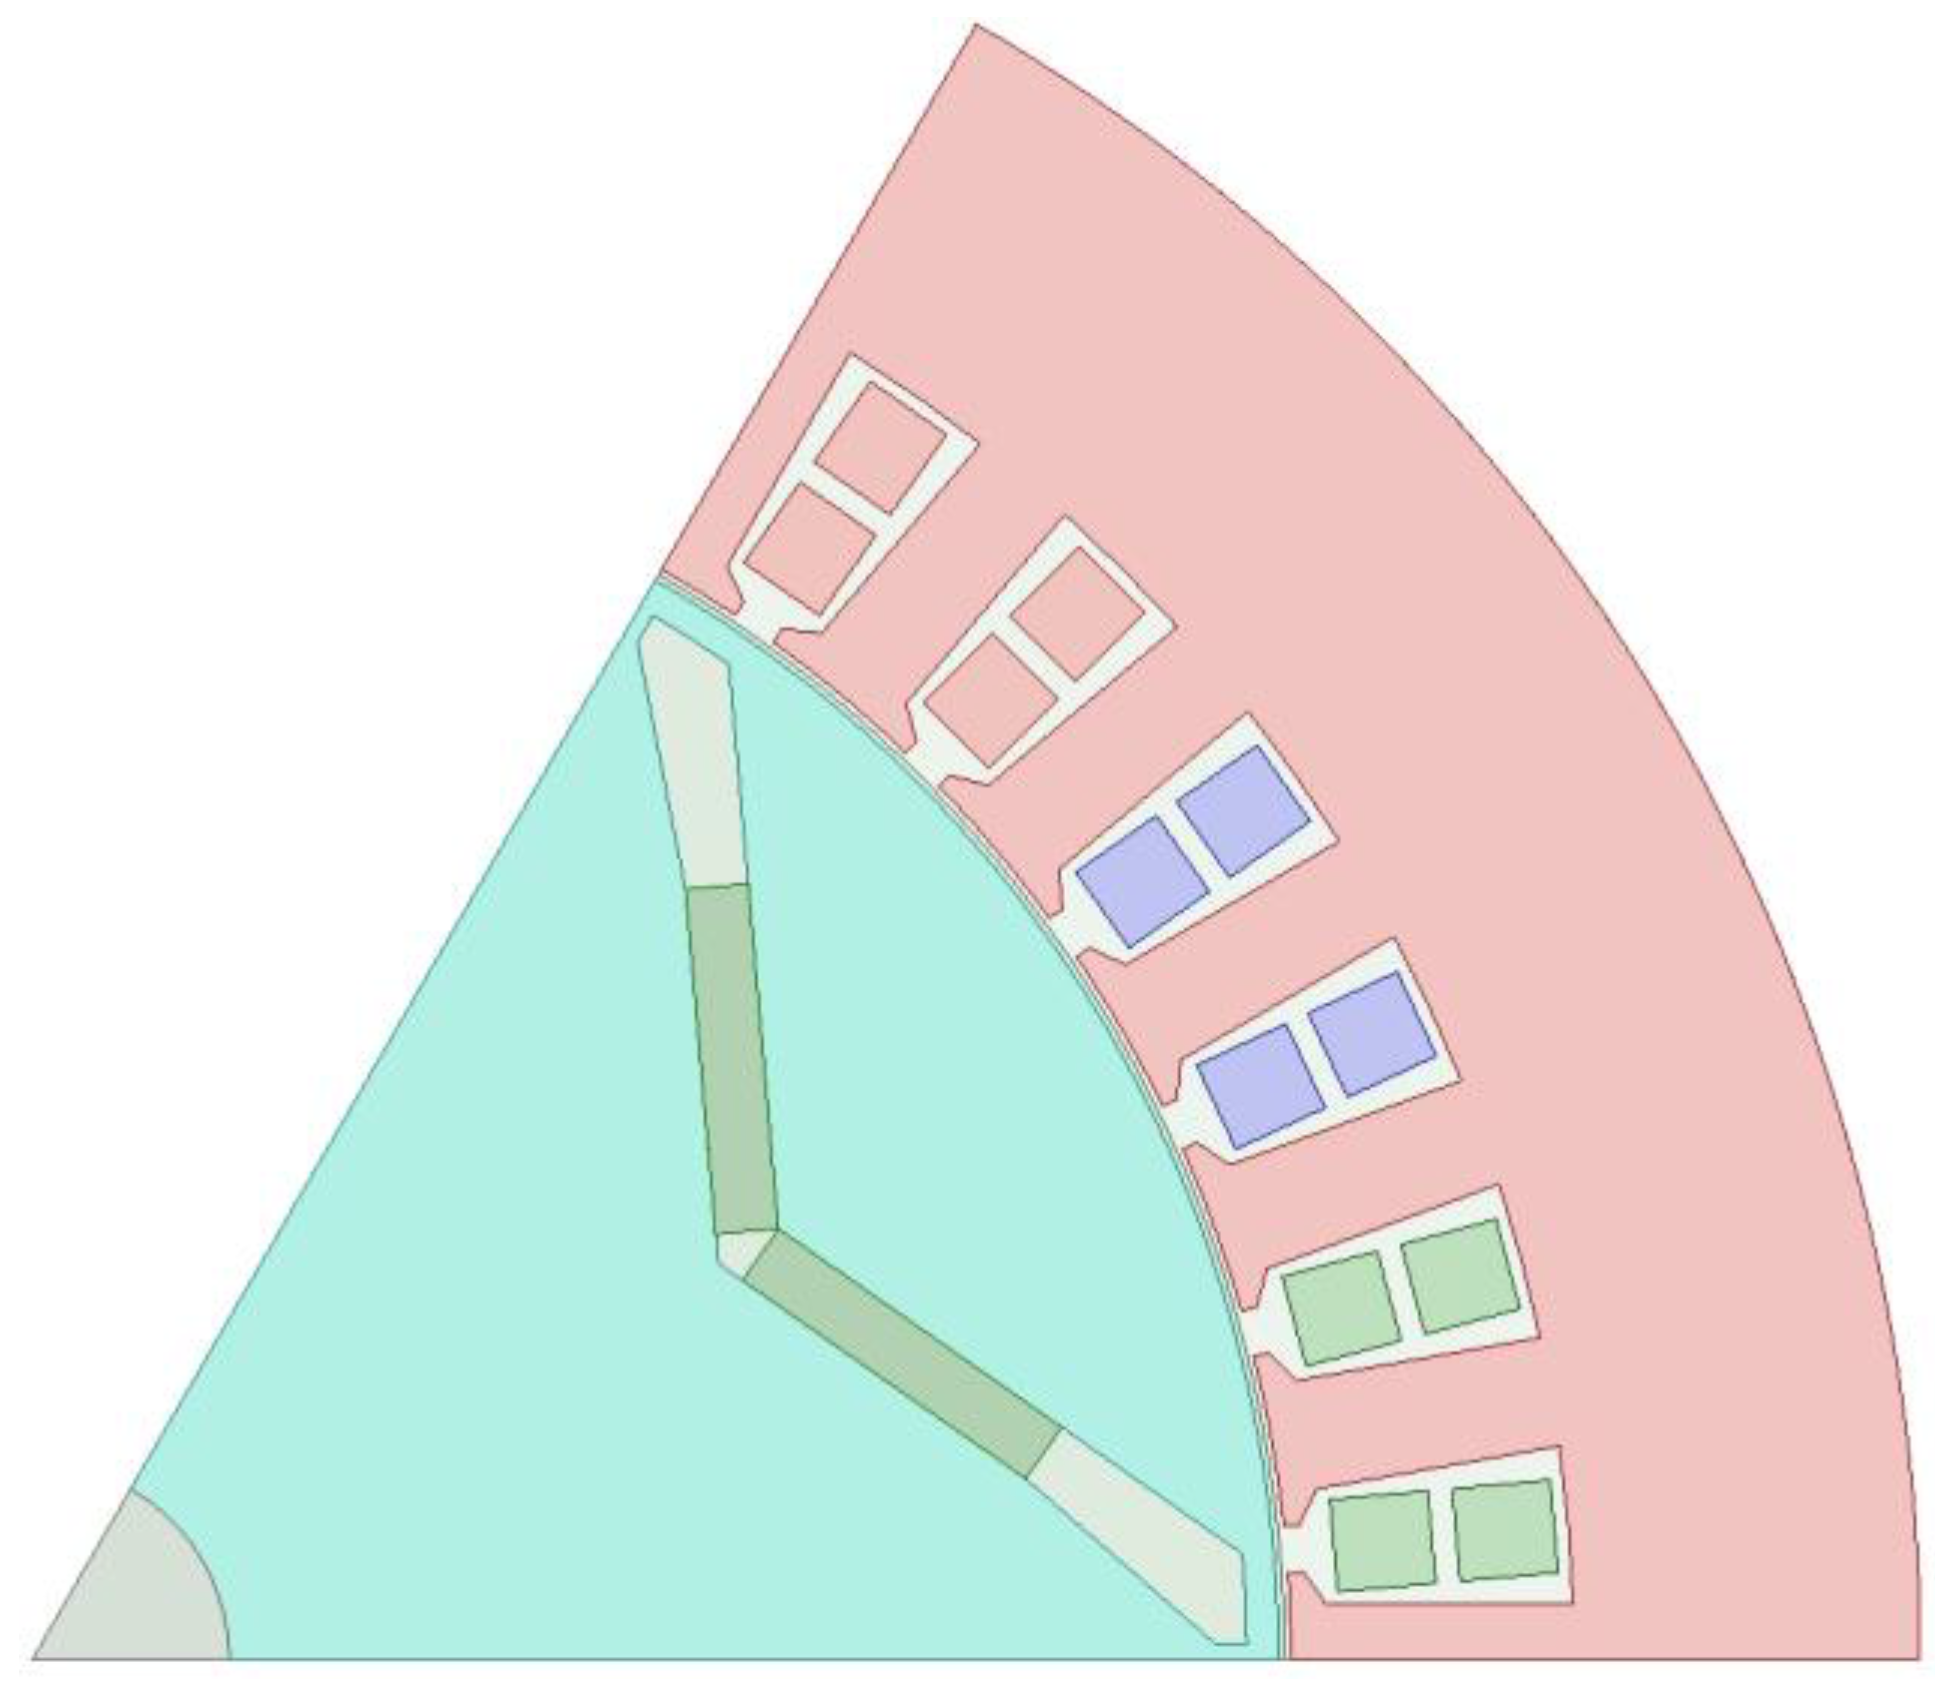
A two-dimensional finite element model of the PMSM was established using ANSYS Maxwell 2025 R2 and Motor-CAD v2025.1.1. To reduce computational complexity and simulation steps, a 1/6 motor model was adopted, as illustrated in Figure 2.
For the electromagnetic analysis, a two-dimensional finite element model of one-sixth of the machine is established in ANSYS Maxwell 2D. The model is constructed on a mid-plane cross-section of the laminated core and exploits the six-pole, 36-slot symmetry, such that only a 60° sector is retained. Accordingly, the air-gap flux density in the central region of the stack is assumed to be approximately uniform along the axial direction, and winding end effects near the overhang are neglected. The laminated stator and rotor cores are modeled using the electrical steel M350-50A at 20 °C with its nonlinear B–H curve, the interior permanent magnets are represented by the high-temperature NdFeB grade N42UH at 120 °C, the stator windings are defined as pure copper at 120 °C, and the surrounding region is treated as vacuum (μr = 1). The space–time harmonics of the air-gap radial electromagnetic force obtained from this 2D model are later used to define equivalent radial pressure loads in the 3D structural FE model of the stator–housing assembly.
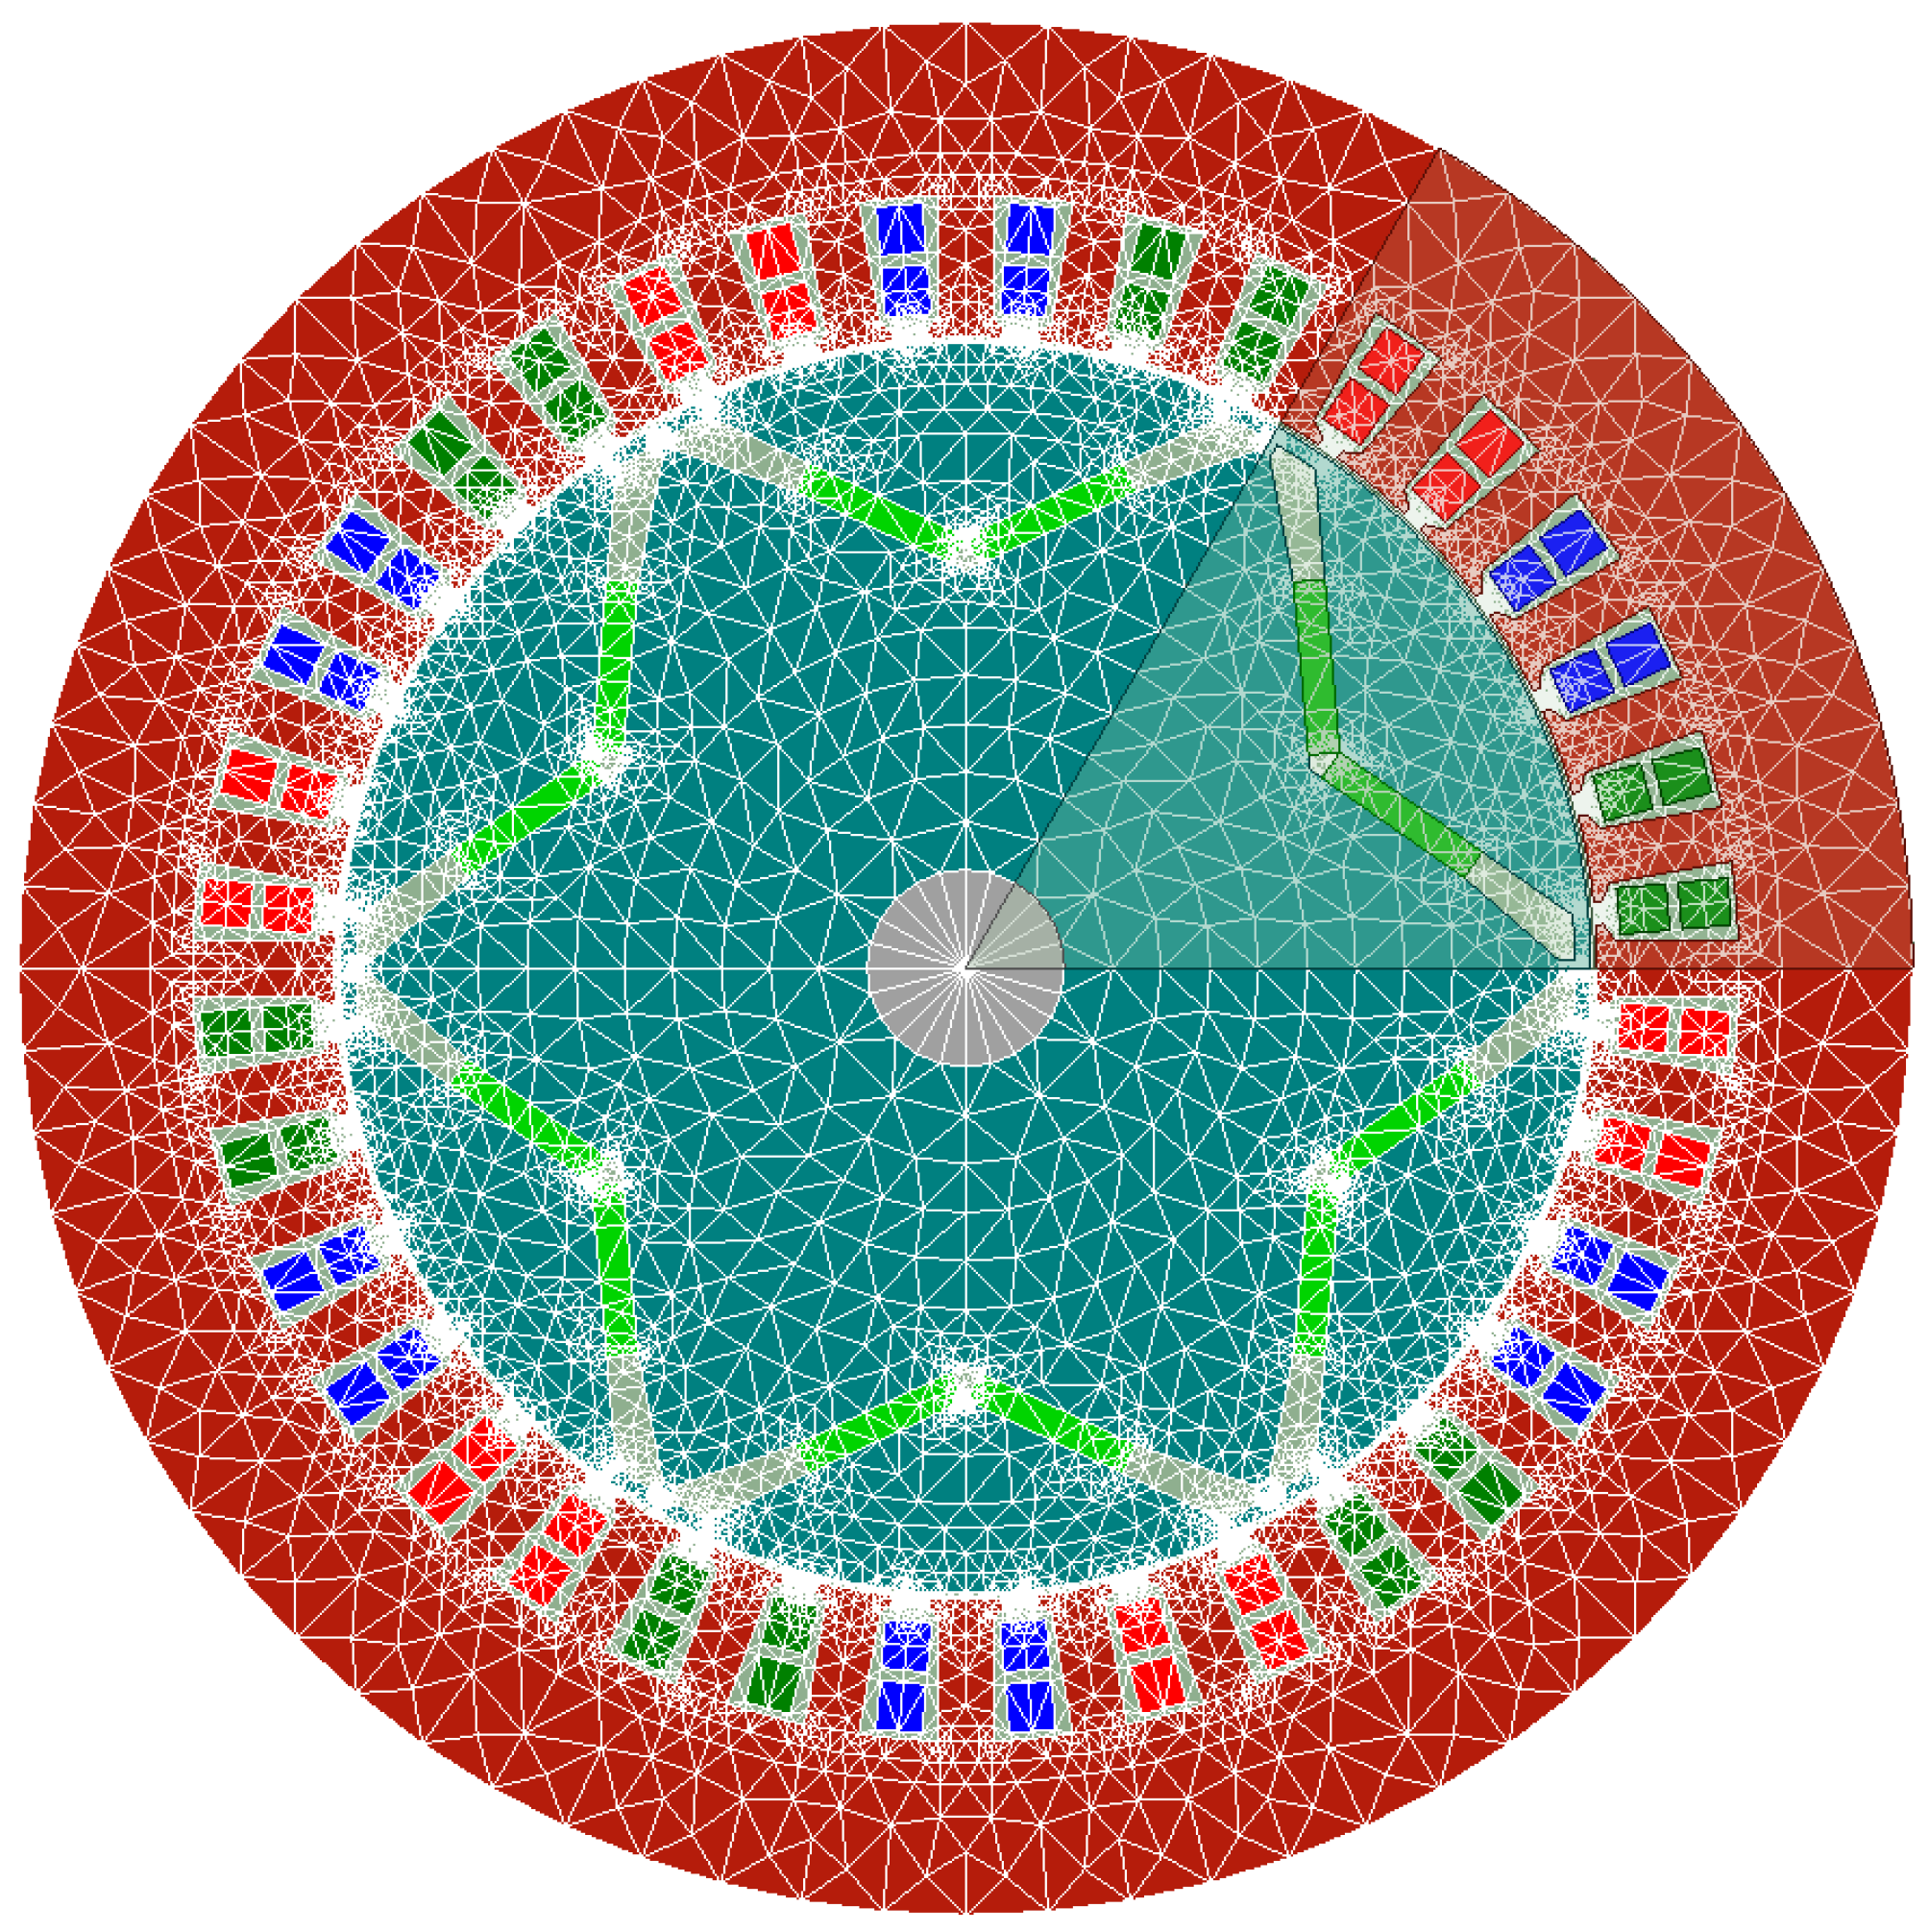
An adaptive mesh refinement strategy is employed. First-order triangular edge elements are used with local refinement in the air-gap, magnet, and tooth-root regions, and the resulting finite-element mesh is shown in Figure 3. The maximum number of adaptive passes is set to 15, with 20% refinement per pass, and the target energy error and delta-energy error are both specified as 1%. In the present simulation, convergence is achieved after 10 adaptive passes, yielding a final mesh with approximately 5.2 × 10 3 elements and energy-related errors below 1%.
Regarding the boundary conditions, a rotating-band region is introduced in the air- gap to represent the relative motion between rotor and stator. The two radial sides of the 60° sector are assigned as an independent/dependent pair to enforce cyclic periodic boundary conditions, and a zero-vector potential is applied on the outer circular boundary, effectively acting as a magnetic insulation boundary. The machine is excited by balanced three-phase sinusoidal currents corresponding to the investigated operating points, and the nonlinear magnetic solution is computed with a residual tolerance of 1 × 10 4 .
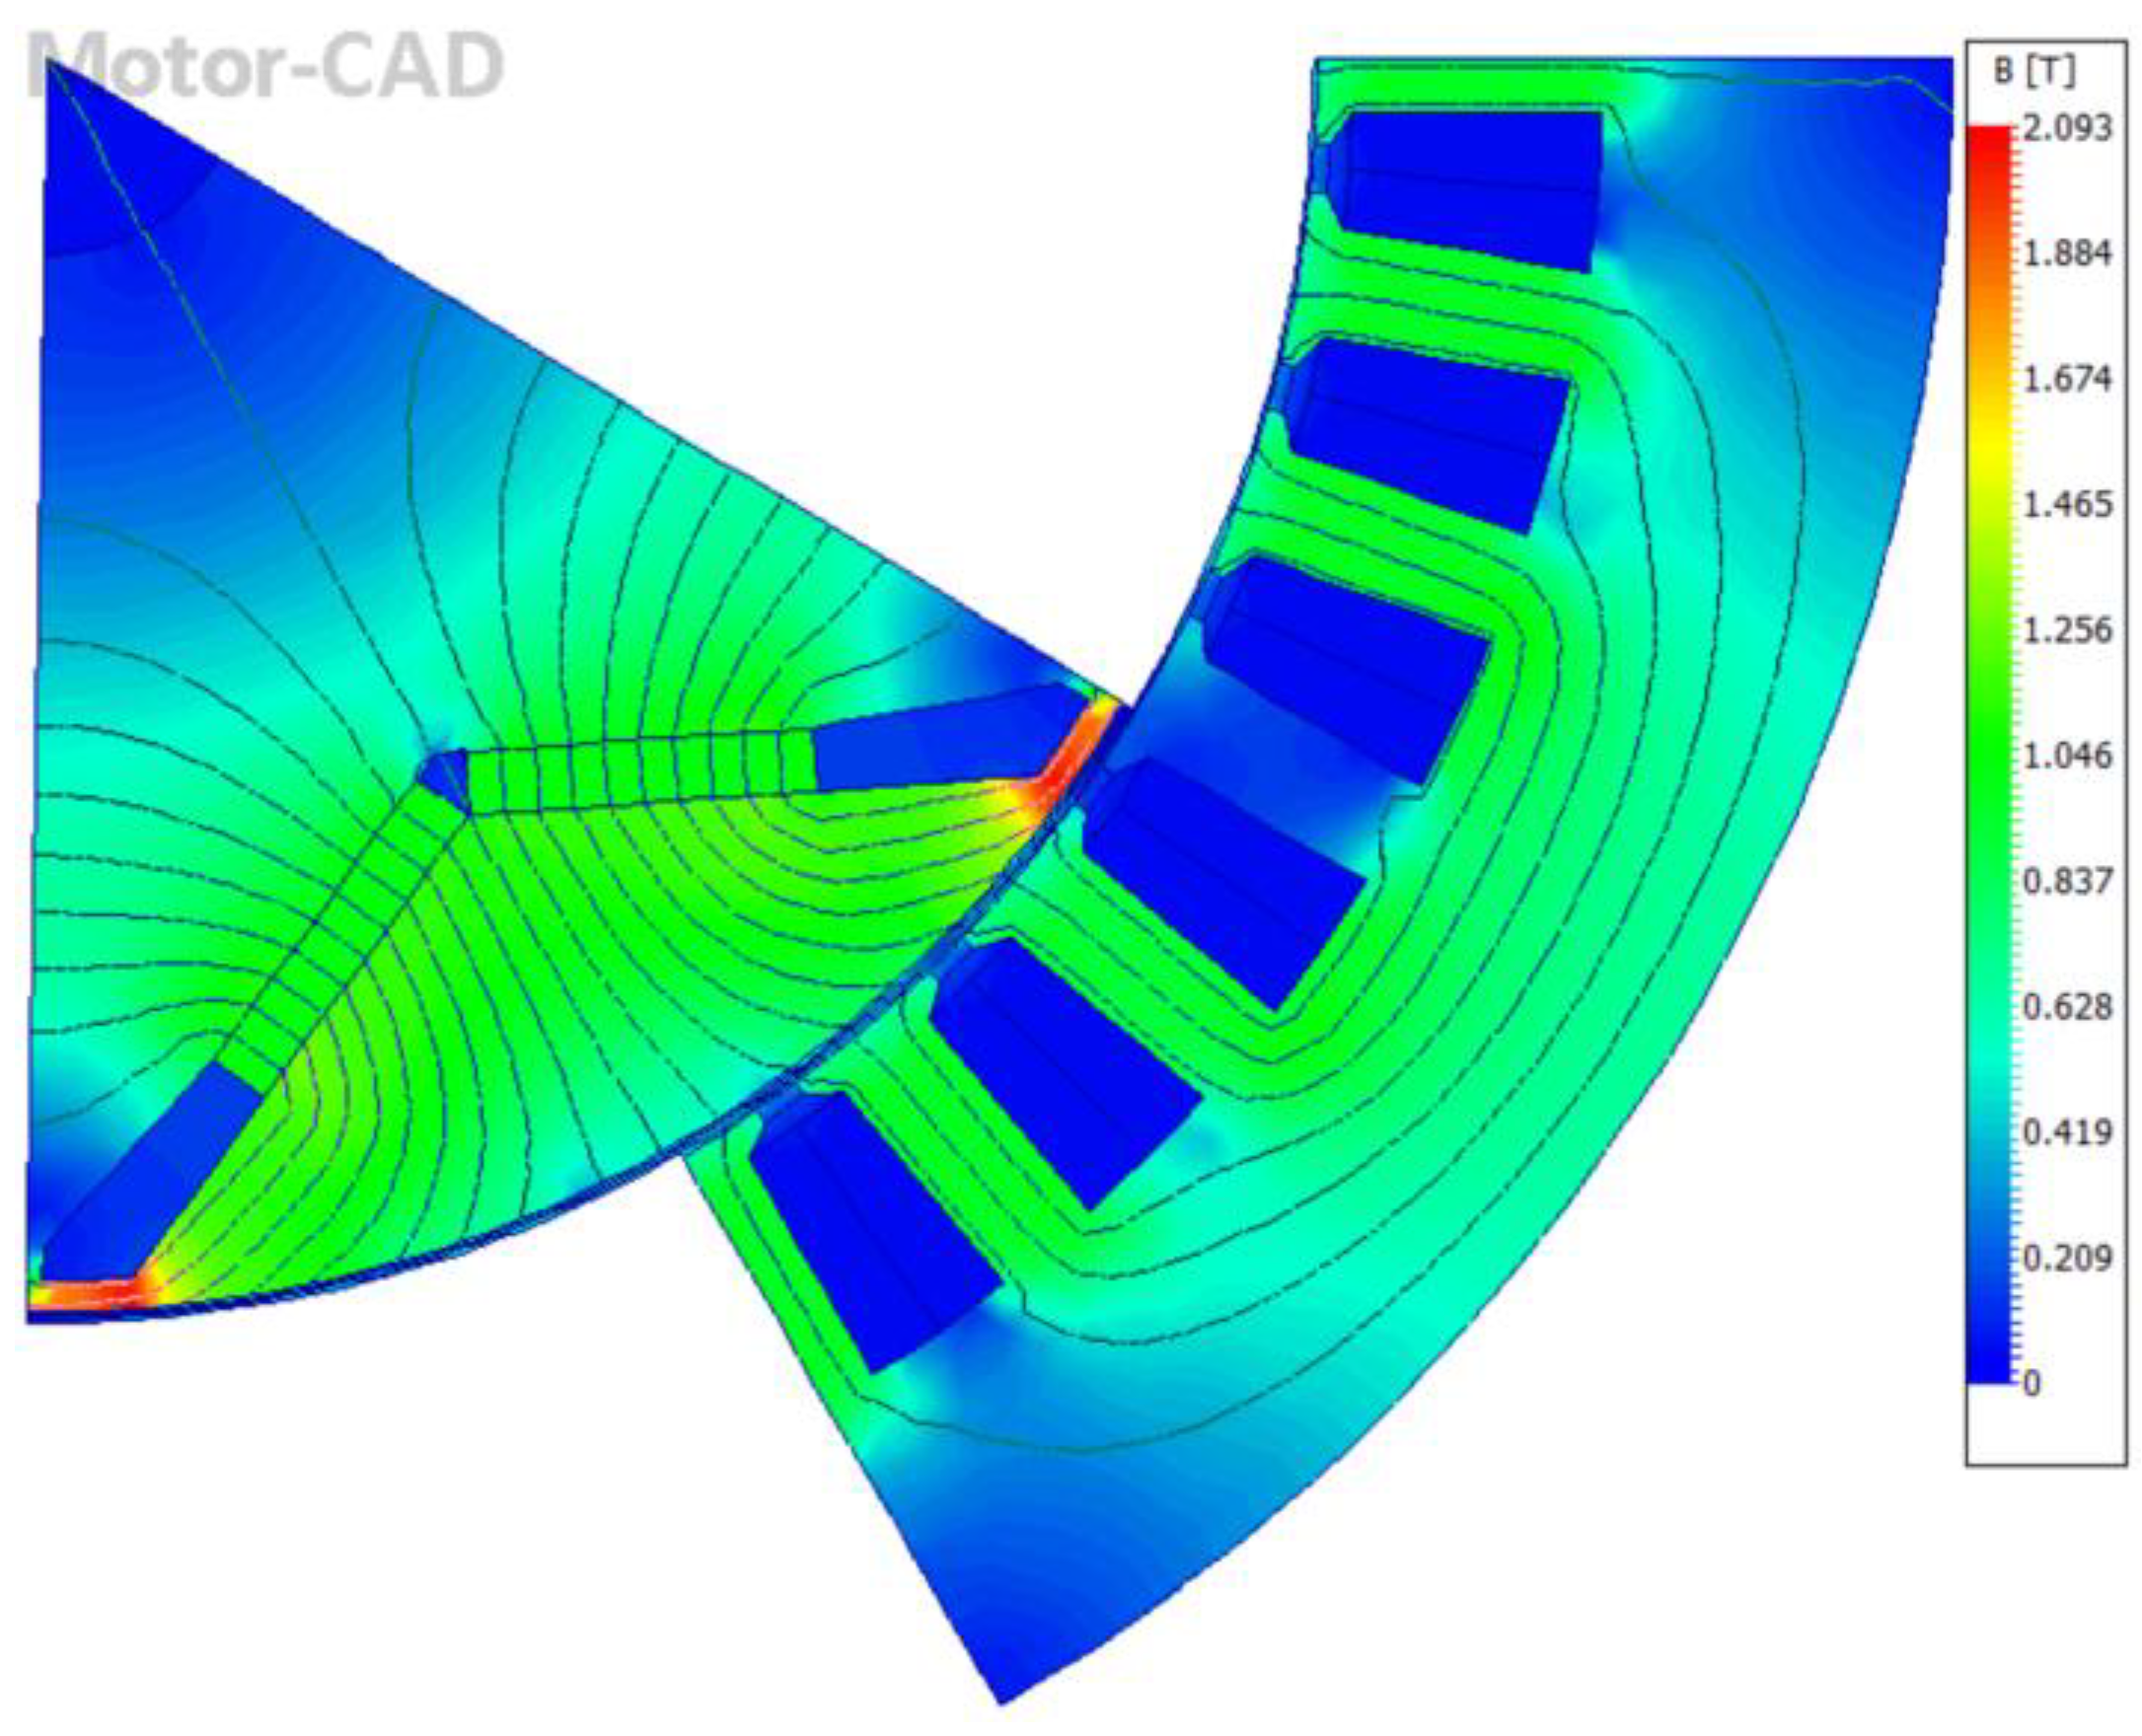
Figure 4 shows the simulated air-gap flux-density distribution of the designed PMSM under steady-state operation. The magnetic flux density attains its highest value at the stator tooth tips and rotor pole shoes. Apart from a few localized hotspots near the tooth tips, bridge regions, and magnet corners, most of the stator and rotor yokes, as well as the tooth bodies, maintain flux levels of approximately 0.7–1.6 T, which lies within the normal operating range of conventional automotive silicon steel and approaches the onset of core saturation.
Some extreme hotspots could be alleviated by adjusting the air-gap length; however, their volume fraction is below 2% and they do not intersect the main magnetic path, so the associated loss and temperature rise remain within acceptable limits. The model can therefore be regarded as sufficiently accurate for subsequent analyses.

3. Electromagnetic Noise Analysis of Three Excitation Sources

3.1. Electromagnetic Force Analysis

The electromagnetic force acting on the stator teeth is a primary source of electromagnetic vibration and noise in PMSMs. This force arises from the interaction of the air-gap magnetic field between the stator and rotor, making analysis of the air-gap field essential. Under the combined influence of the rotor permanent magnets and the stator armature reaction, a magnetic field that varies with both time and spatial position is established in the air-gap. The electromagnetic force generated by this air-gap field can be expressed as follows:
d r ( θ ,   t ) = B r 2 ( θ ,   t ) B t 2 ( θ ,   t ) 2 μ 0 d t ( θ ,   t ) = B r ( θ ,   t ) B t ( θ ,   t ) μ 0
where B r ( θ , t ) and B t ( θ , t ) denote the radial and tangential air-gap flux densities, respectively; d r ( θ , t ) and d t ( θ , t ) represent the corresponding radial and tangential electromagnetic force densities; μ 0 is the permeability of free space ( 4 π × 10 7 H / m ) ; θ is the mechanical angle in the rotor reference frame; and t is time.
In evaluating the effect of electromagnetic forces on electromagnetic noise, the tangential air-gap flux density can be neglected in the radial pressure calculation because it is much smaller than the radial component [31]. However, in the analysis of torque ripple, tangential stress should be treated as an independent excitation source, and its contribution is introduced via a proportional factor. The resulting electromagnetic force can therefore be written as follows:
d 0 ( θ ,   t ) = B r 2 ( θ ,   t ) 2 μ 0
the air-gap magnetomotive force F   ( θ ,   t ) is composed of the magnetic motive forces generated by both the stator winding and the rotor permanent magnets acting in the air- gap. The corresponding air-gap permeance C ( θ ,   t ) is the sum of the average air-gap permeance and the slotting-induced permeance harmonics. Their product determines the radial air-gap flux density B r ( θ ,   t ) . Therefore, the radial electromagnetic force F r can be expressed as
F r = 1 2 μ 0 1 2 π 0 2 π 1 T 0 T B r 2 ( θ ,   t )   d t   d θ = 1 2 μ 0 1 2 π 0 2 π 1 T 0 T ν = 1 , 5 , ,   6 k + 1 F ν cos   ( ν p θ ω t φ ν ) + μ = 1 , 3 , , 2 k + 1 F μ cos   ( μ θ ω μ t φ μ ) × C 0 + γ = 1 , , k C γ cos ( γ Z s θ ) 2 2
where ν and μ denote the harmonic orders of the stator current and rotor permanent-magnet magnetomotive forces, respectively; F ν and F μ are their corresponding harmonic amplitudes; p is the number of pole pairs; ω is the electrical angular velocity; φ ν and φ μ represent the initial phase angles of the ν -th and μ -th harmonic magnetomotive forces, respectively; C 0 is the average air-gap permeance; C γ is the amplitude of the slotting-induced radial permeance component; γ is the order of the radial permeance harmonic; and Z s is the number of stator slots; t n denotes the n -th sampling instant in the discretized time domain at which the instantaneous electromagnetic torque is evaluated.
After integral averaging, the result retaining only the fundamental frequency component can be expressed as:
F r = 1 2 μ 0 C 0 2 ν F ν 2 cos 2 ( ν p θ ω t φ ν ) + C 0 2 μ F μ 2 cos 2 ( μ θ ω μ t φ μ ) + 2 C 0 2 ν μ F ν F μ cos ( ν p θ ω t φ ν ) cos ( μ θ ω μ t φ μ )
where ν p θ ω t and μ θ ω μ t represents the harmonic terms of the stator and rotor magnetomotive forces, respectively.
To further analyze the harmonic components of the electromagnetic force, the trigonometric identity cos 2 ( x ) = 1 2 + 1 2 cos ( 2 x ) is applied to expand the quadratic terms, and the product term is expressed using the identity cos A cos B = 1 2 [ cos ( A B ) + cos ( A + B ) ] , yielding the final expression of the air-gap force.
cos ( v p θ ω t φ v ) cos ( μ θ ω μ t φ μ ) = cos ( ( v p μ ) θ ( ω ω μ ) t ( φ v φ μ ) ) + cos ( ( v p + μ ) θ ( ω + ω μ ) t ( φ v + φ μ ) )
after Fourier expansion and spectral convolution, only those air-gap force harmonics whose spatial orders match the stator modes, whose temporal frequencies lie within the target bandwidth, and whose amplitudes are non-negligible are retained, while higher-order or insignificant components are discarded to construct the order-source table (Table 2).
Based on the air-gap data obtained from the electromagnetic model, the principal harmonic orders of the motor magnetic field were determined according to the harmonic order table (Table 2), and the resulting dominant components are summarized in Table 3.
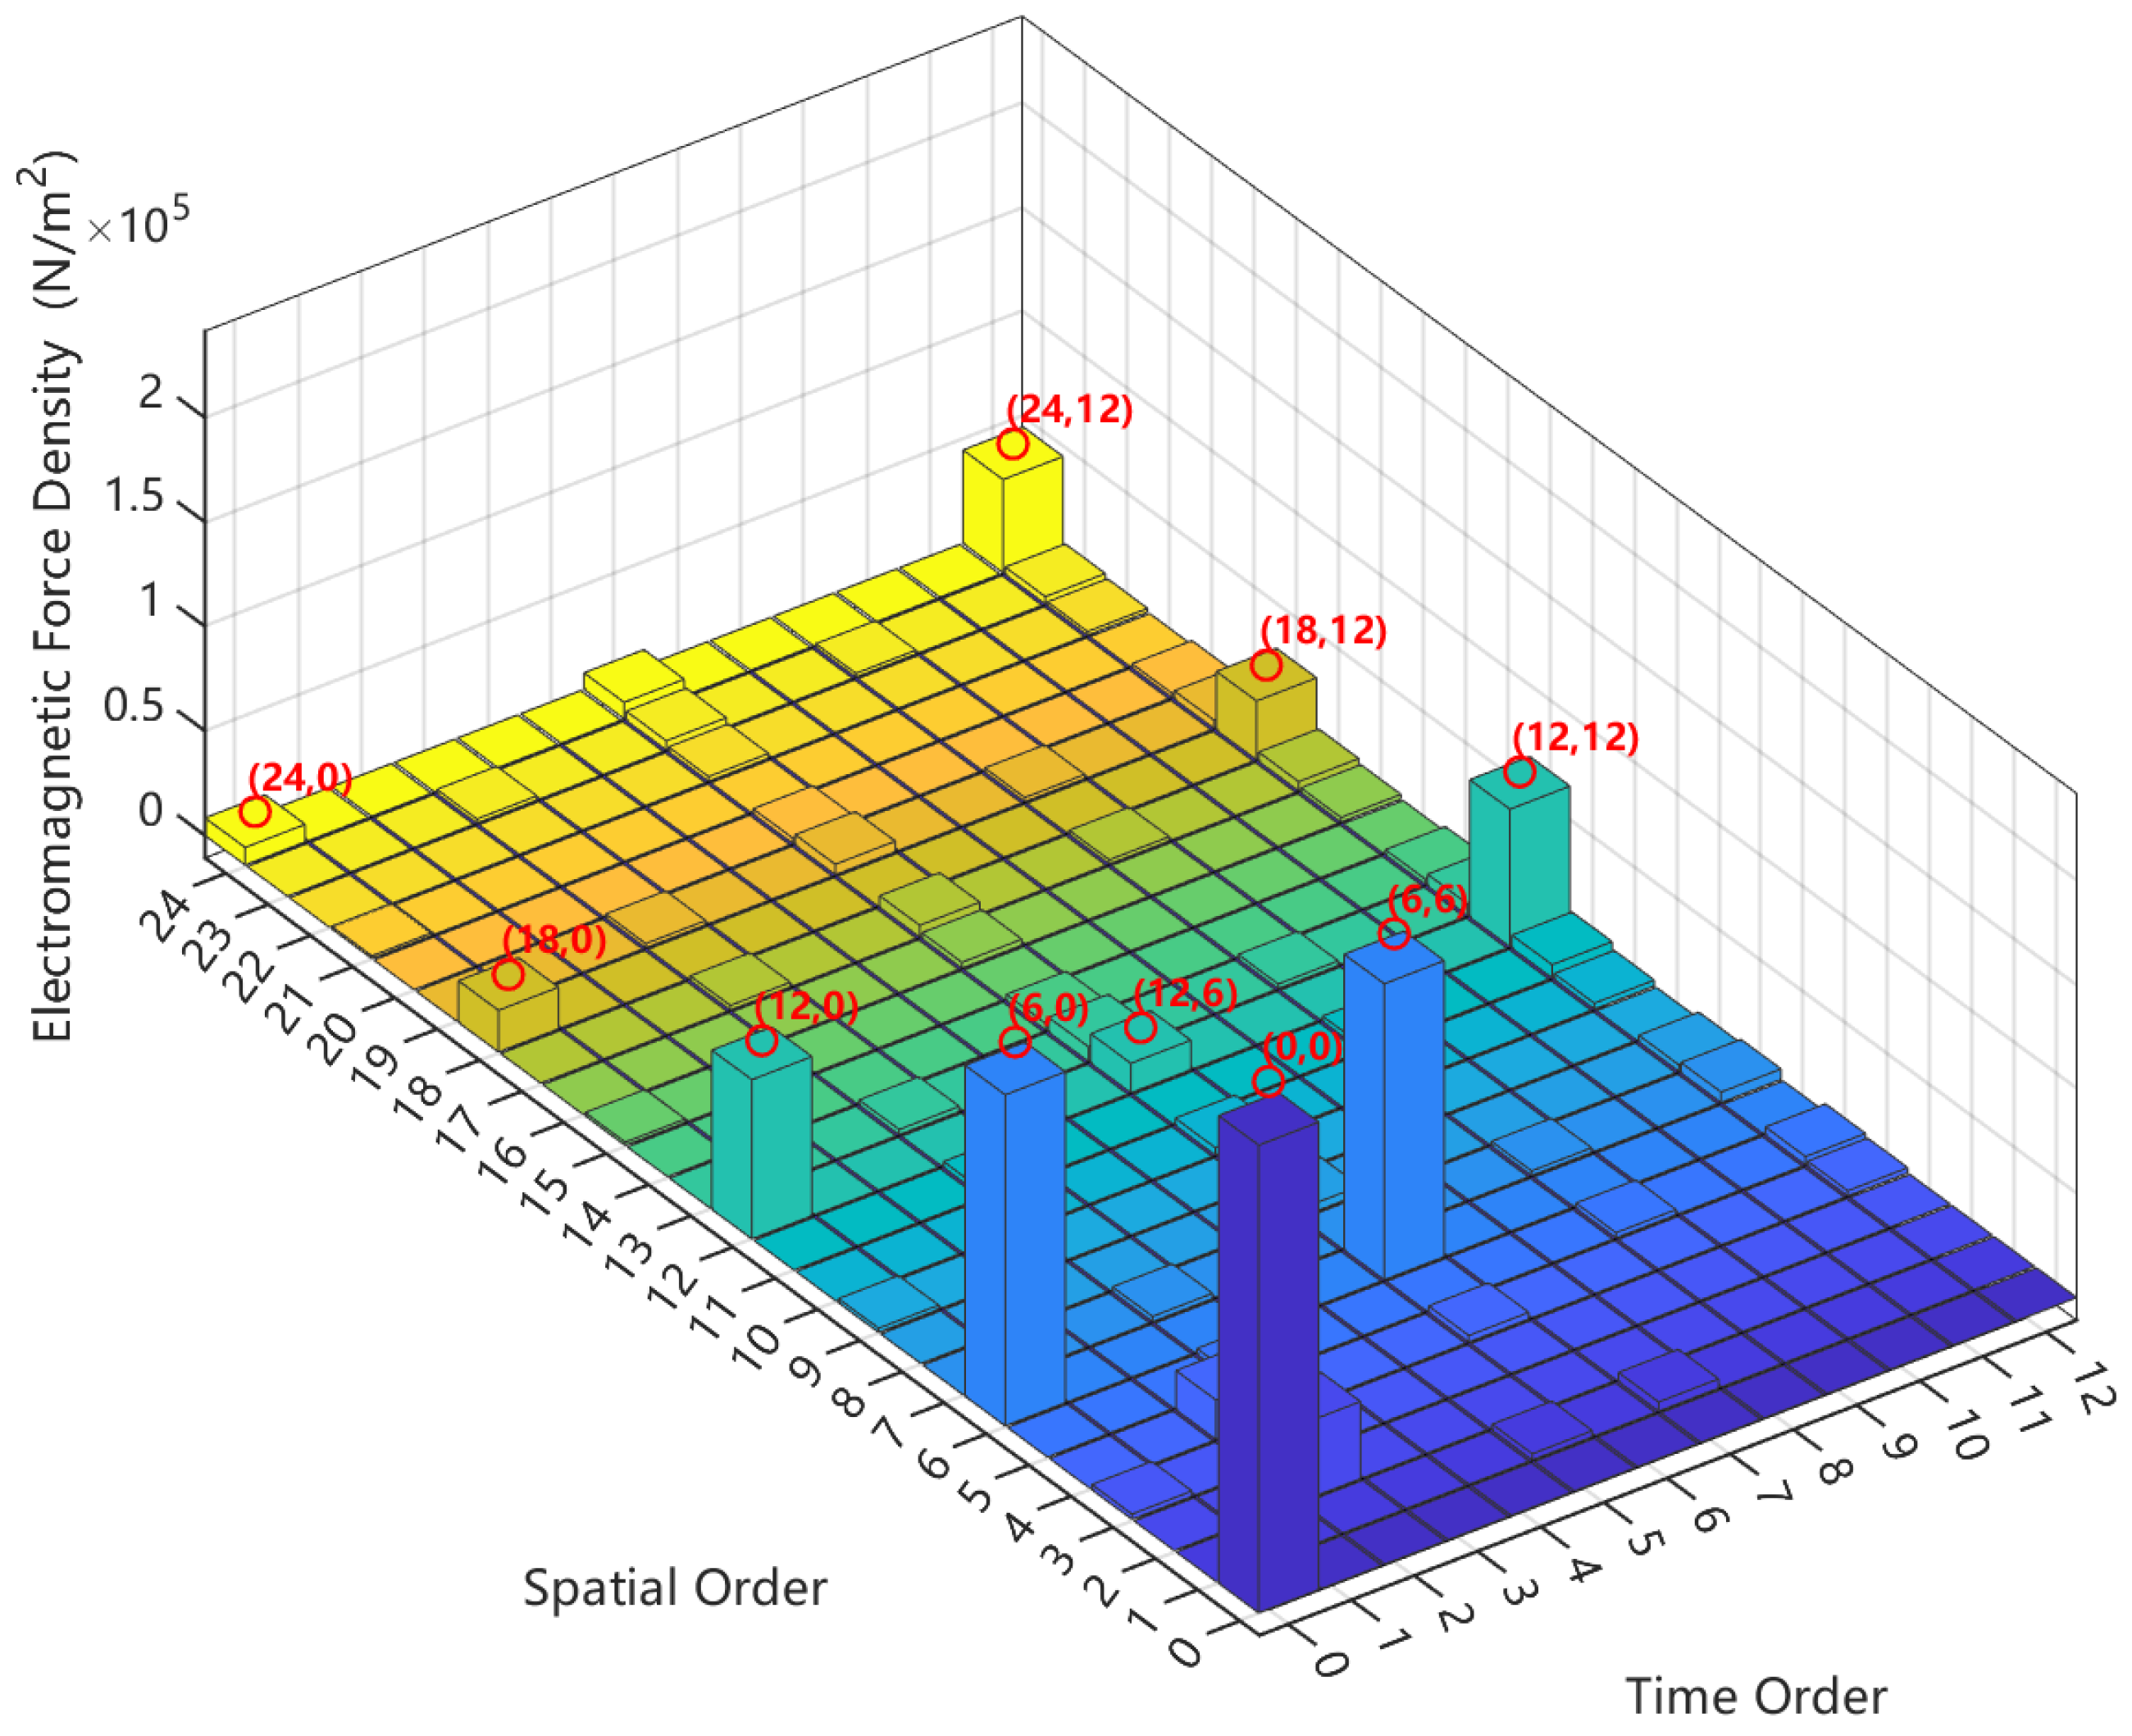
The space–time harmonic spectrum of the radial electromagnetic force obtained from the FFT decomposition in Ansys Maxwell is shown in Figure 5. The dominant components are mainly located at (0, 0), (6, 0), (6, 6), (12, 0), (18, 0), (18, 12), and (24, 12), which are consistent with the main harmonic orders listed in Table 3. Among these, the (0, 0) term corresponds to a circumferentially uniform mean pressure that does not contribute to vibration or sound radiation; it is therefore removed by mean–value processing and excluded from the subsequent NVH analysis.

3.2. Torque Ripple Analysis

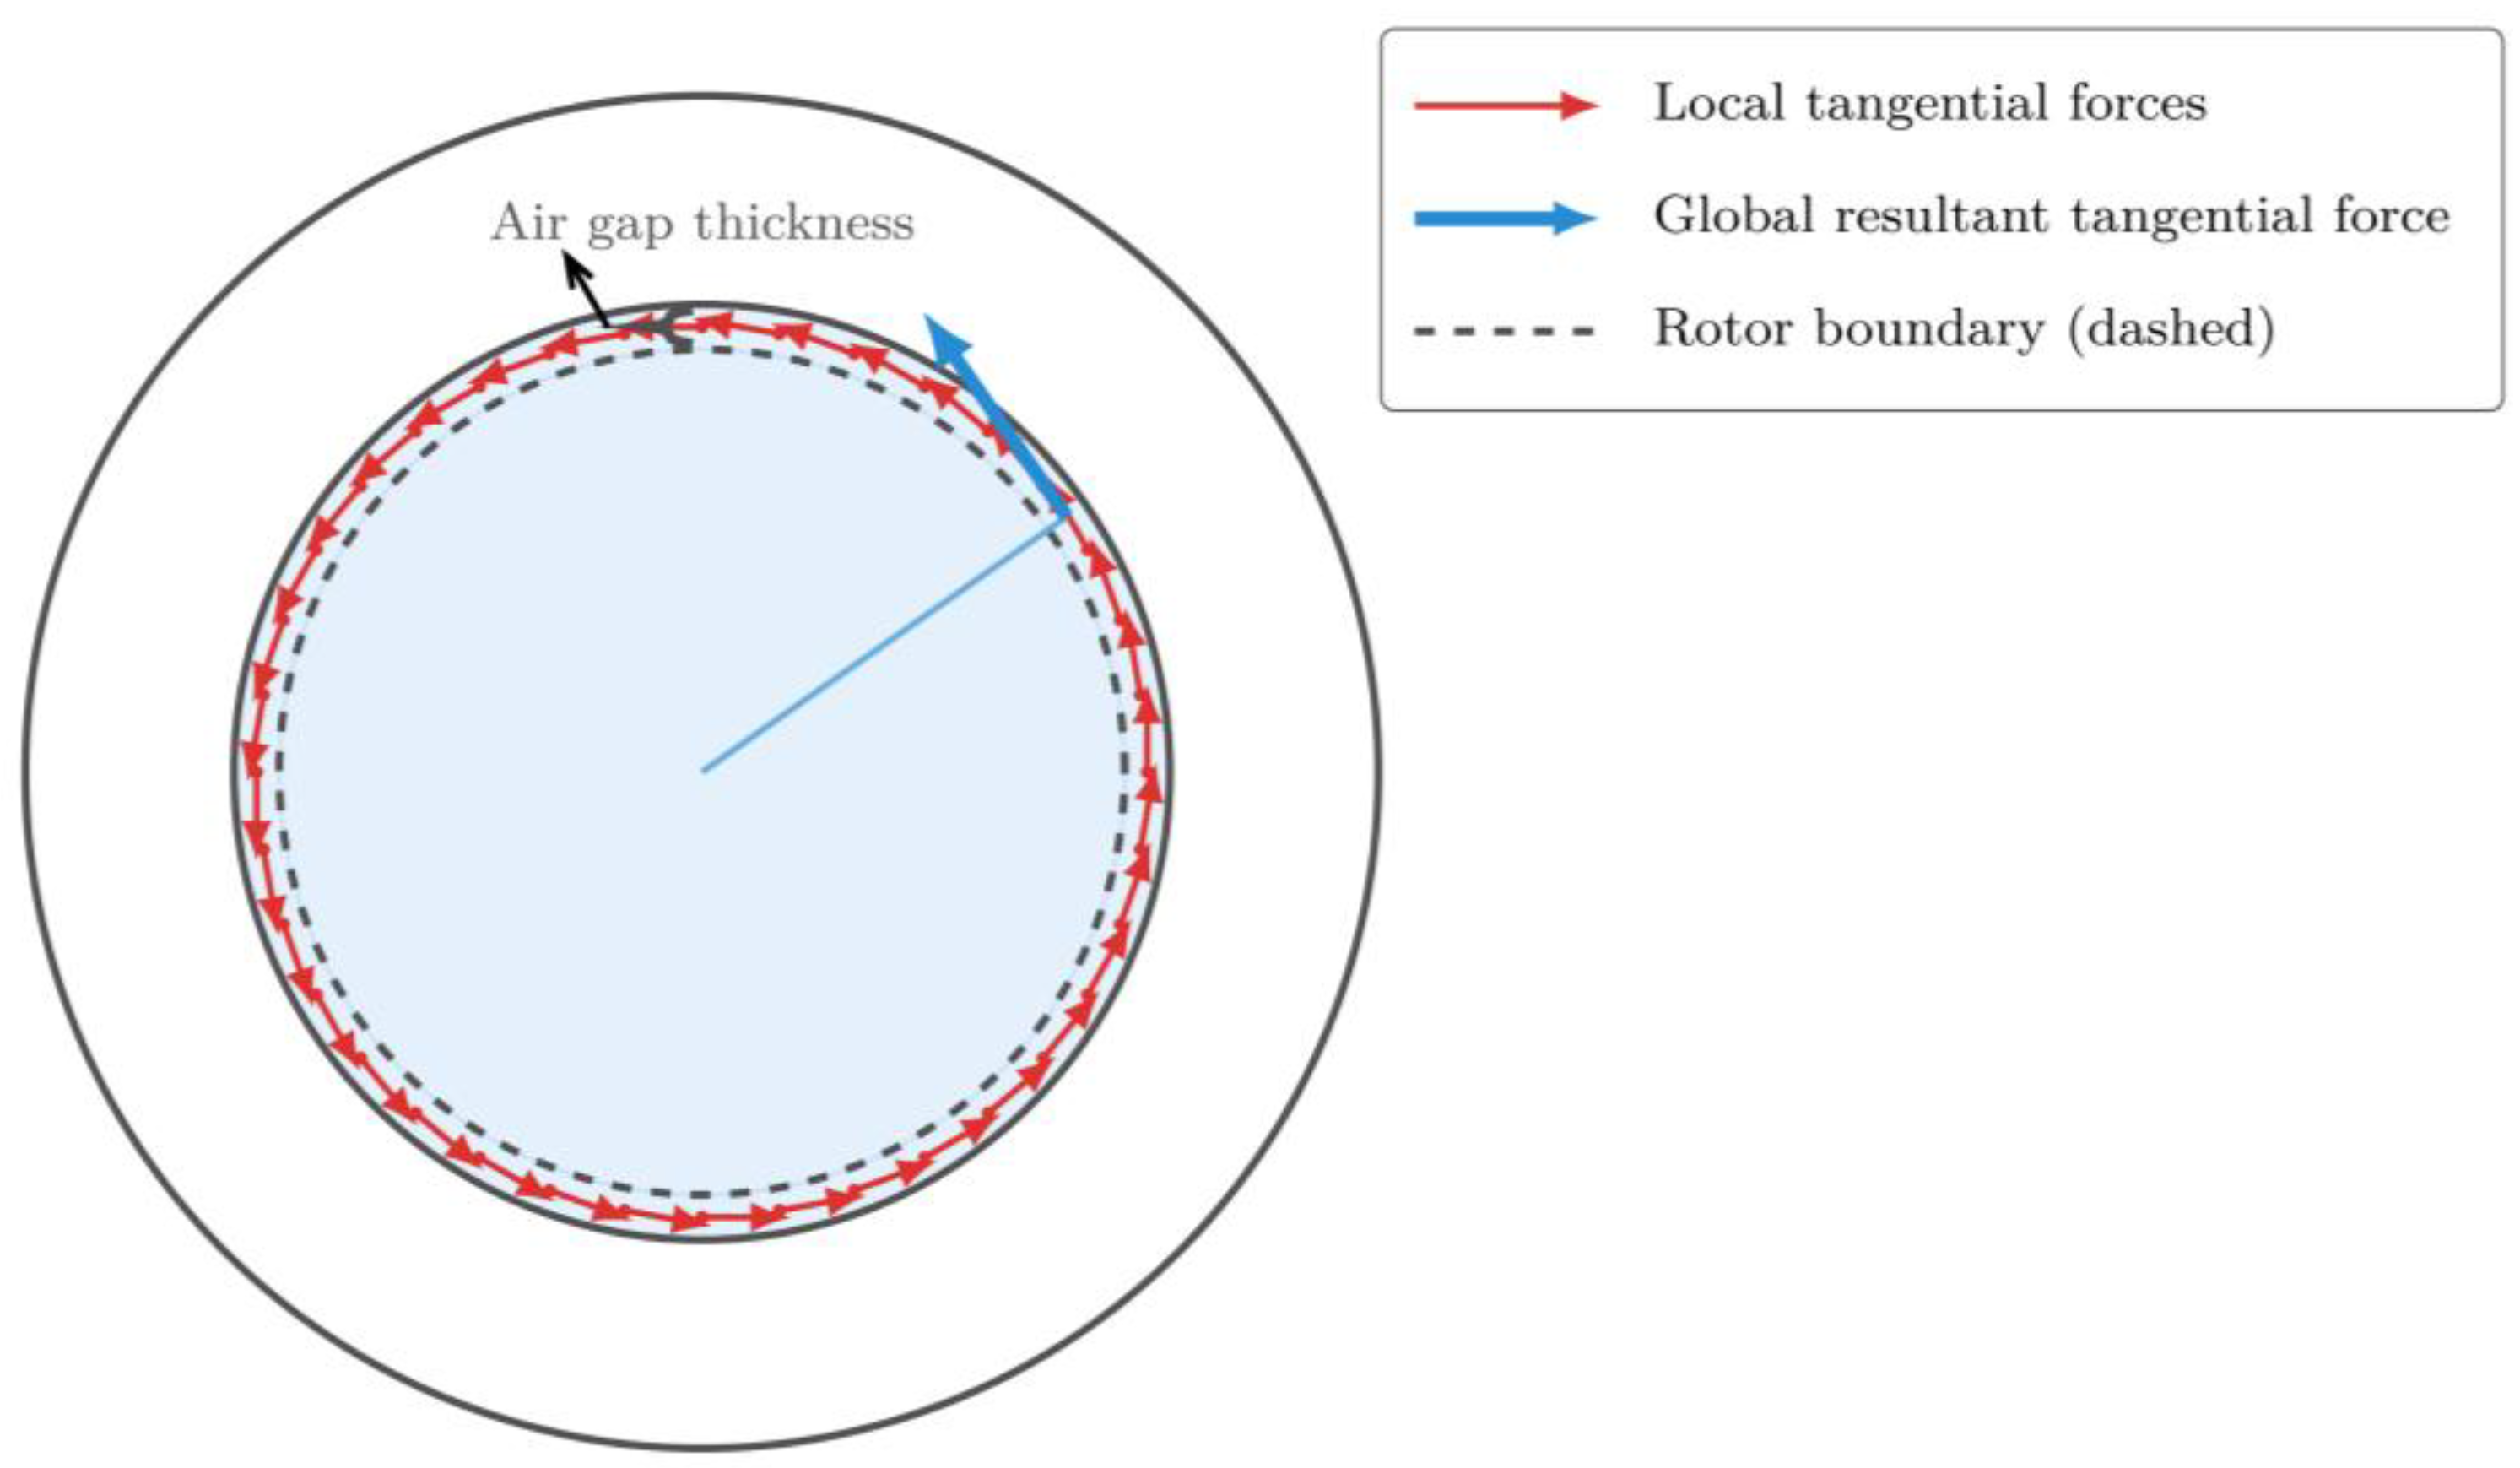
The torque ripple of an interior permanent-magnet synchronous motor (IPMSM) arises from the tangential Maxwell shear stress in the air-gap, which synthesizes into a tangential electromagnetic force distributed along the circumferential direction [32,33]. To analyze the periodic fluctuation of shaft torque, the air-gap on the stator or rotor side is discretized into vectorial segments along the entire circumference so that the local tangential force distribution and its resultant torque can be distinguished, as illustrated in Figure 6.
In this model, the air-gap between the stator and rotor is partitioned into a series of circumferential sectors, each associated with a local tangential force vector. These local forces are obtained by integrating the tangential Maxwell shear stress over the corresponding air-gap sector and are directed along the stator circumference. On this basis, comparative simulations and harmonic analyses are carried out. The tangential component of the Maxwell shear stress is given by [34]
σ r t ( θ ,   t ;   α ) = α B r ( θ ,   t ) B t ( θ ,   t ) μ 0 , α [ 0 , 1 ]
In the equation, α is an introduced scaling factor used to characterize the contribution of the tangential force to torque ripple. Its value follows the approach described in [35] and is calibrated against the reference torque obtained from finite element analysis. Based on this, the electromagnetic torque derived from tangential stress can be expressed as:
T ( t ) = R s 2 L μ 0 0 2 π B r ( θ ,   t )   B t ( θ ,   t ) d θ
where R s is the inner radius of the stator, and L is the effective axial length of the motor core.
Building on the above parameter definitions and incorporating the tangential-force scaling factor, the instantaneous electromagnetic torque at each time is derived from the Maxwell stress tensor and can be written in discrete form as
T ( α , t n ) α R s 2 L μ 0 k = 1 N θ B r ( θ k ,   t n ) B t ( θ k ,   t n ) d θ
where N θ is the number of discretized nodes along the circumferential direction of the air-gap; θ k denotes the k -th discrete angular position; and Δ θ represents the angular discretization step, approximately equal to 2 π / N θ .
To more intuitively illustrate the influence of the tangential force on torque fluctuation, the torque ripple ratio (TRR) and the R T peak-to-valley method are introduced for evaluation [36]. In the same equation, the mean torque T ¯ ( α ) , standard deviation σ T   ( α ) , normalized root mean square ratio RRMS   ( α ) , and peak-to-valley ratio R T   ( α ) are defined as follows:
T ¯ ( α ) = 1 T m 0 T m T ( α ,   t ) d t σ T ( α ) = 1 T m 0 T m [ T   ( α ,   t ) T ¯   ( α ) ] 2 d t R R M S ( α ) = σ T   ( α ) T ( α ) R T   ( α ) = T m a x   ( α ) T m i n ( α ) 2 T   ( α )
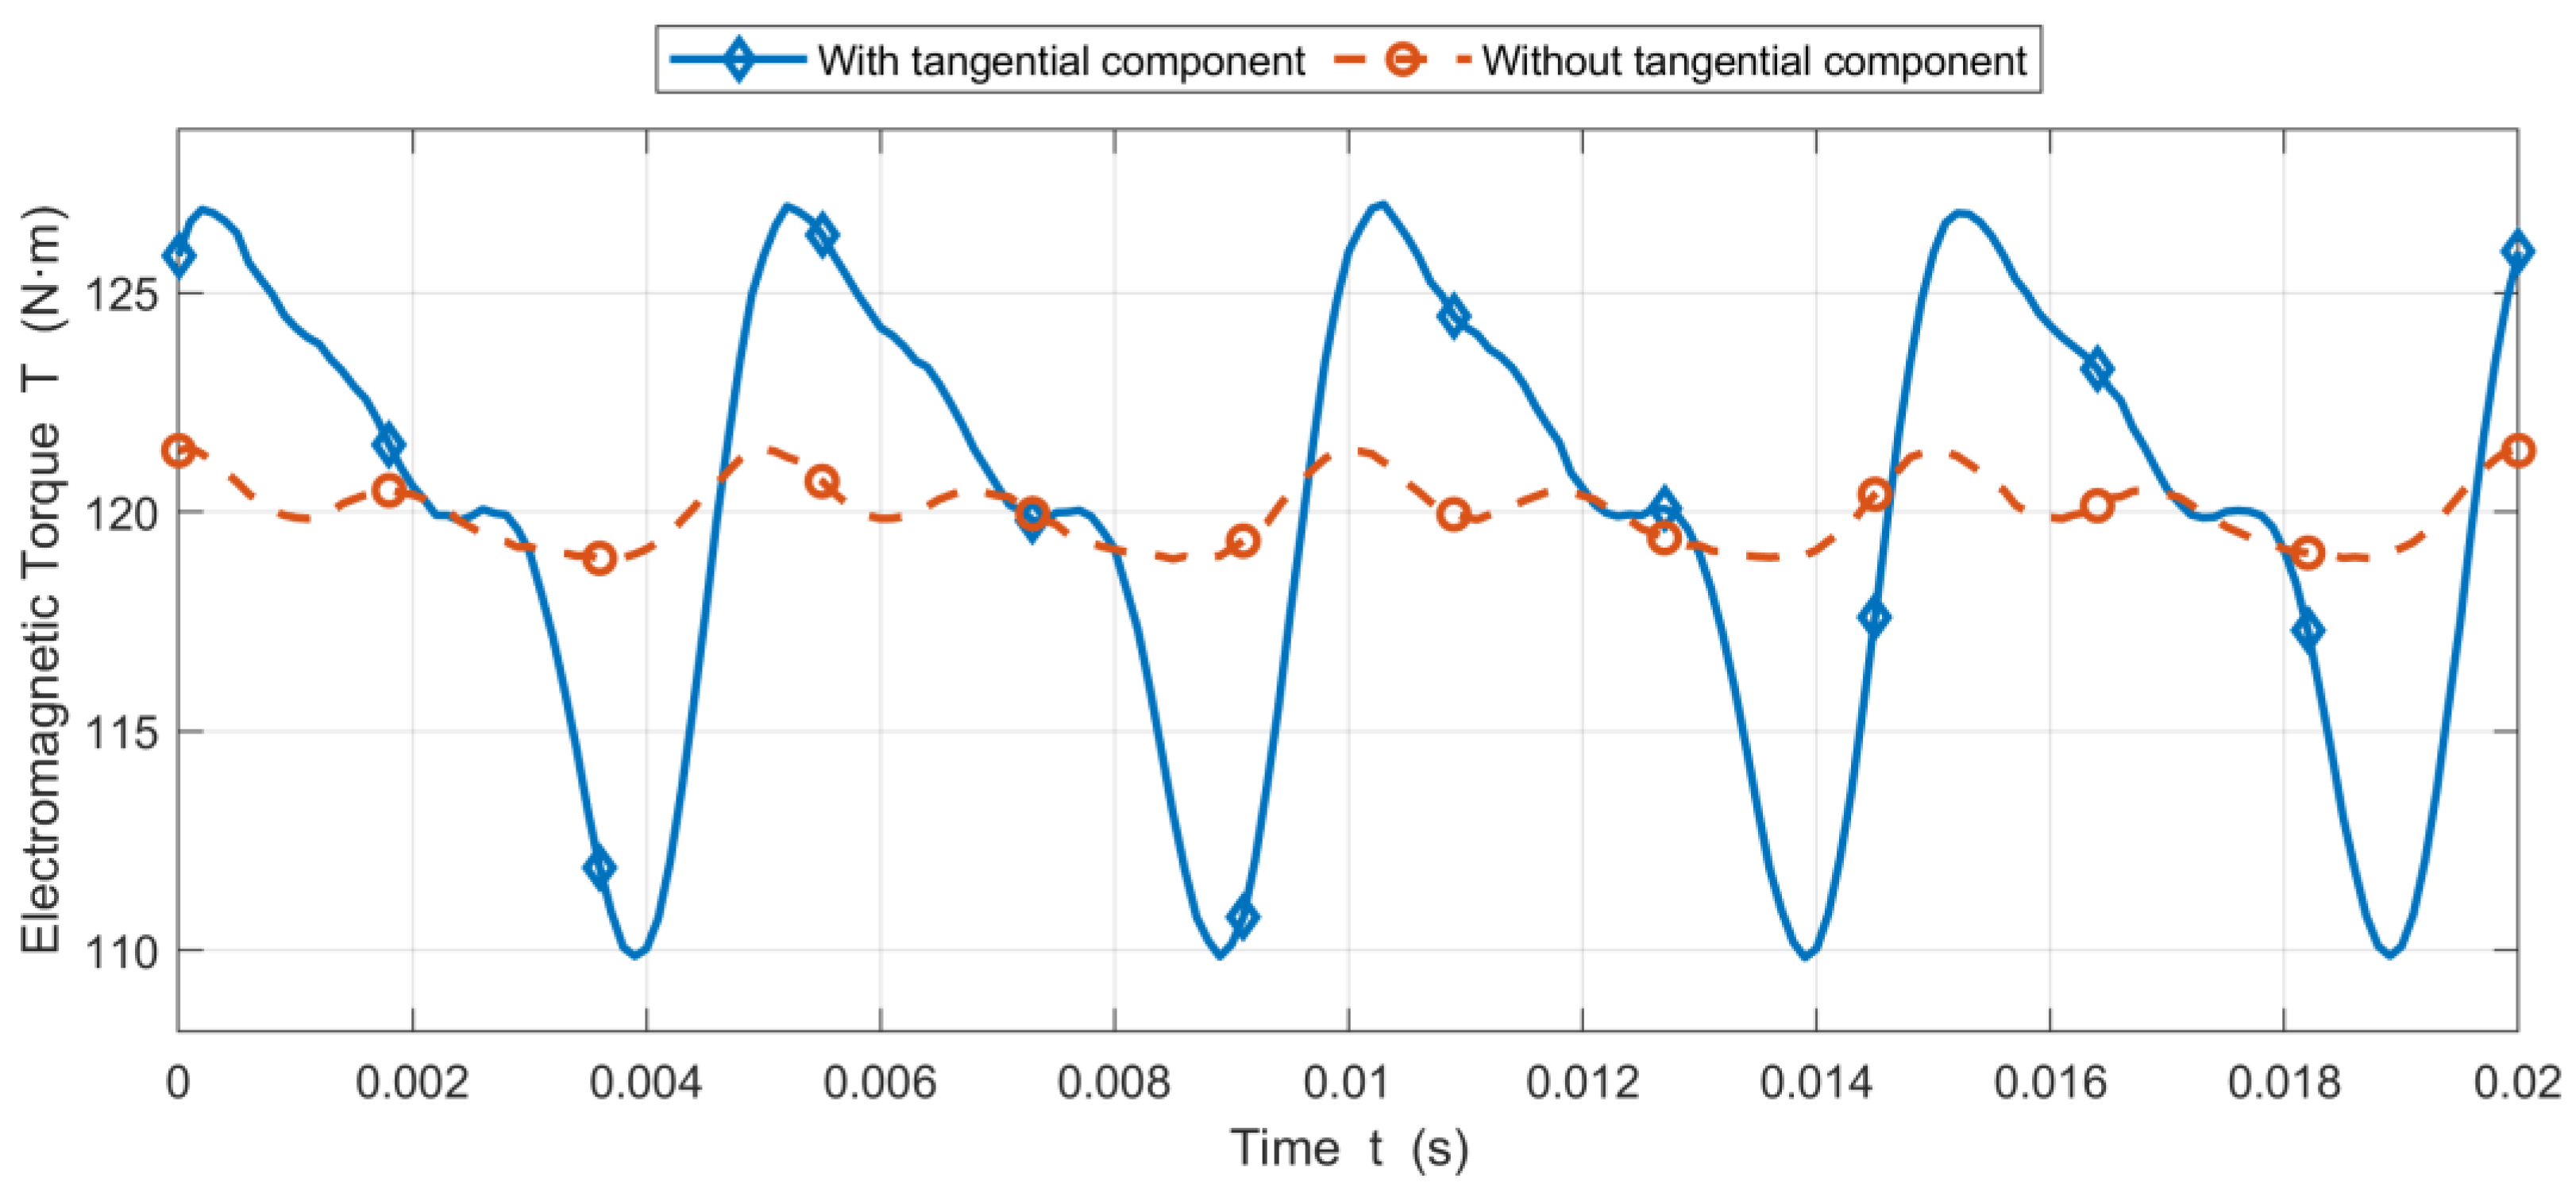
the average torque and TRR in this study are evaluated over an integer number of mechanical periods T m , with the integration interval defined as t 0 , t 0 + K T m and K = 10 . As shown in Figure 7, for a common mean torque level of 120 N·m, inclusion of the tangential electromagnetic force produces pronounced multi-frequency modulated ripples in the instantaneous torque, with a peak-to-valley ratio R T of approximately 9–10% and RRMS of 5–6%. When the tangential component is neglected, the fluctuations are markedly reduced, with R T around 1–2% and RRMS about 0.8–1.0%, i.e., lower by roughly a factor of 5–7 in both indices. In conjunction with the harmonic spectrum, this indicates that the modulation is mainly concentrated at the mechanical fundamental and its multiples, implying that the tangential stress couples with the air-gap field in space and time and substantially enhances the contribution of low-order harmonics to torque ripple. The tangential electromagnetic force; therefore, must not be neglected in torque-ripple and NVH analyses.
Substituting the peak and valley values of the torque ripple amplitude obtained in Figure 7 into the single-sided ripple equation (Equation (10)), the resulting single-sided torque ripple amplitude is 7.08%, and the corresponding peak-to-peak relative value is 14.17%.
R s i n g l e = Δ T 2 T
For high-performance automotive PMSMs, the torque ripple amplitude is typically controlled within 5–10%, as values exceeding 10% can markedly deteriorate NVH performance. When the tangential electromagnetic force is considered, the single-sided torque ripple ratio reaches 7.16%, which lies within the target window and indicates a controllable yet non-negligible NVH risk. At the same time, a peak-to-peak relative value of 14.32% implies a moderate bidirectional oscillation of the instantaneous torque about its mean, leaving scope for further optimization. In the 8-pole/48-slot PMSM study by Liang et al. [37], tangential electromagnetic harmonics were shown to be strongly correlated with torque ripple and acoustic peak amplitudes, with slotting modulation generating pronounced noise peaks near the 48th-order band. Analogously, in the present motor, slotting modulation reflects the tangential-force harmonics around the 36th spatial order, which can induce secondary enhancement and peak amplification within the 30–36 order range.

3.3. Cogging Torque Analysis

Cogging torque is an inherent torque ripple that persists in PMSMs even under no-current conditions. It arises from the interaction between the permanent-magnet field and the stator slotting. Physically, cogging torque appears as a tangential component acting on the rotor; however, unlike load-related torque ripple, its magnitude is entirely independent of the armature current. Instead, it is governed by the relative alignment of rotor position, pole–pair number, and stator slot count, and reflects the modulation of air-gap permeance imposed by machine geometry. To quantify this mechanism, an analytical expression for cogging torque is derived using an energy-based approach. In addition, the sensitivity to key structural parameters is examined, and the associated spatial orders are discussed in detail.
The cogging torque is defined as the negative derivative of the magnetic field energy with respect to the rotor position under no-current conditions:
E   ( θ ) R s L 2 μ 0 1 2 π 0 2 π C ( φ ) Φ ( φ θ ) 2 d φ T c o g   ( θ ) = d E ( θ ) d θ
where E ( θ ) denotes the magnetic field energy of the system under no-current conditions; C ( φ ) represents the relative permeance variation caused by stator slotting; φ is the circumferential spatial coordinate on the stator; and Φ denotes the intrinsic air-gap flux-density distribution produced by the rotor magnets. The squared permeance term C 2 gives rise to slotting-induced permeance harmonics with slot wave number q Z s , whereas Φ 2 generates pole-related harmonic components with pole wave number 2 l idx p (where l idx = 1 , 2 , is a positive integer index). The interaction between these components forms the principal frequency contributions to the cogging torque.
To derive the selection rules and fundamental orders of cogging torque, the air-gap flux density is decomposed into the intrinsic permanent-magnet field and the slotting-induced permeance modulation. The intrinsic field Φ ξ varies periodically with the pole pitch, whereas the relative permeance C φ varies periodically with the slot pitch. Because cogging torque depends on the relative phase alignment between these two periodic quantities, the rotor–stator relative angle is defined as ξ = φ θ [38].
Φ   ( ξ ) = m > 0 A m cos ( m p ξ + φ m ) C   ( φ ) = C 0 + q > 1 C q cos ( q Z s φ + ρ q )
where A m is the amplitude of the m -th harmonic component, C q is the amplitude of the q -th slotting harmonic, and ρ q is its corresponding phase angle.
A cogging-torque component is generated only when the slotting and pole harmonics satisfy the matching condition q Z s = 2 l idx p , for which n = m N 0 ; under this condition, the fundamental order of the cogging torque is given by:
N 0 = LCM ( 2 p ,   Z s ) = 2 p Z s GCD ( 2 p ,   Z s )
in the equation, LCM (a, b) denotes the Least Common Multiple, and GCD (a, b) denotes the Greatest Common Divisor.
By expanding the above energy integral, applying Fourier decomposition and regrouping identical terms, the cogging torque can be written as a sum of harmonic components that satisfy the selection rule, whose general form is given by:
T c o g ( θ ) = q Q T q ^ sin   ( q Z s θ + ϕ q ) ,     Q = { q 1 q Z s = 2 l p } T q ^ = R g L s μ 0 ( q Z s ) C 0 C q S q ,     S q = 1 2 | Φ 2 | k = q Z s
where T ^ q and φ q are the amplitude and phase of the q -th cogging-torque harmonic; Q denotes the set of harmonic orders that satisfy the selection rule; and S q represents the spectral amplitude of the intrinsic PM field at the spatial wave number k = q Z s . When the spatial harmonics of C 2 and Φ 2 coincide, a cogging-torque component is generated, and the corresponding mechanical order equals q Z s . The fundamental order N 0 is determined by the motor configuration and is equal to 36.
Given that the amplitudes of higher-order harmonics decay rapidly with increasing order and that engineering evaluations are primarily sensitive to the fundamental and first higher-order components, the contributions of the 108th, 144th, and higher orders were verified to be below 5%. Accordingly, a minimal yet sufficient model comprising only the 36th and 72nd orders is adopted to approximate the cogging torque and can be written as
T c o g   ( θ ) T ^ 36 sin   ( 36 θ + ϕ 36 ) + T ^ 72 sin   ( 72 θ + ϕ 72 )
The magnitude of the cogging torque is governed by the interaction between the slotting-induced permeance harmonics and the spectral components of the squared intrinsic permanent-magnet field at the same spatial wave number. As a result, it is highly sensitive to geometric parameters such as the air-gap length g , slot-opening width b and magnet thickness t . For consistency, cogging torque, torque ripple, and electromagnetic force are therefore compared under identical reference conditions.
In this study, the electromagnetic force component is quantified by integrating the force–spectrum energy to obtain a percentage-based index linked to the electromagnetic output capability [39]. This energy measure is then normalized by the average output torque to yield the Radial Electromagnetic Force Index (RFI), which expresses the relative strength of the excitation with respect to the mechanical output in percentage form.
E F = m M f m Δ f 2 f m + Δ f 2 | F r ( m ,   F ) | d f R F I = R g T a v g E F × 100 %
where E F denotes the band-limited force integral; F r m , f is the radial electromagnetic-force spectrum at spatial order m ; M is the set of dominant orders extracted from the 2D spectrum (6, 12, 18); f m is the center frequency of the order m , with the integration performed over [ f m Δ f / 2 , f m + Δ f / 2 ] ; R g is the effective air-gap radius; and T a v g denotes the average electromagnetic torque.
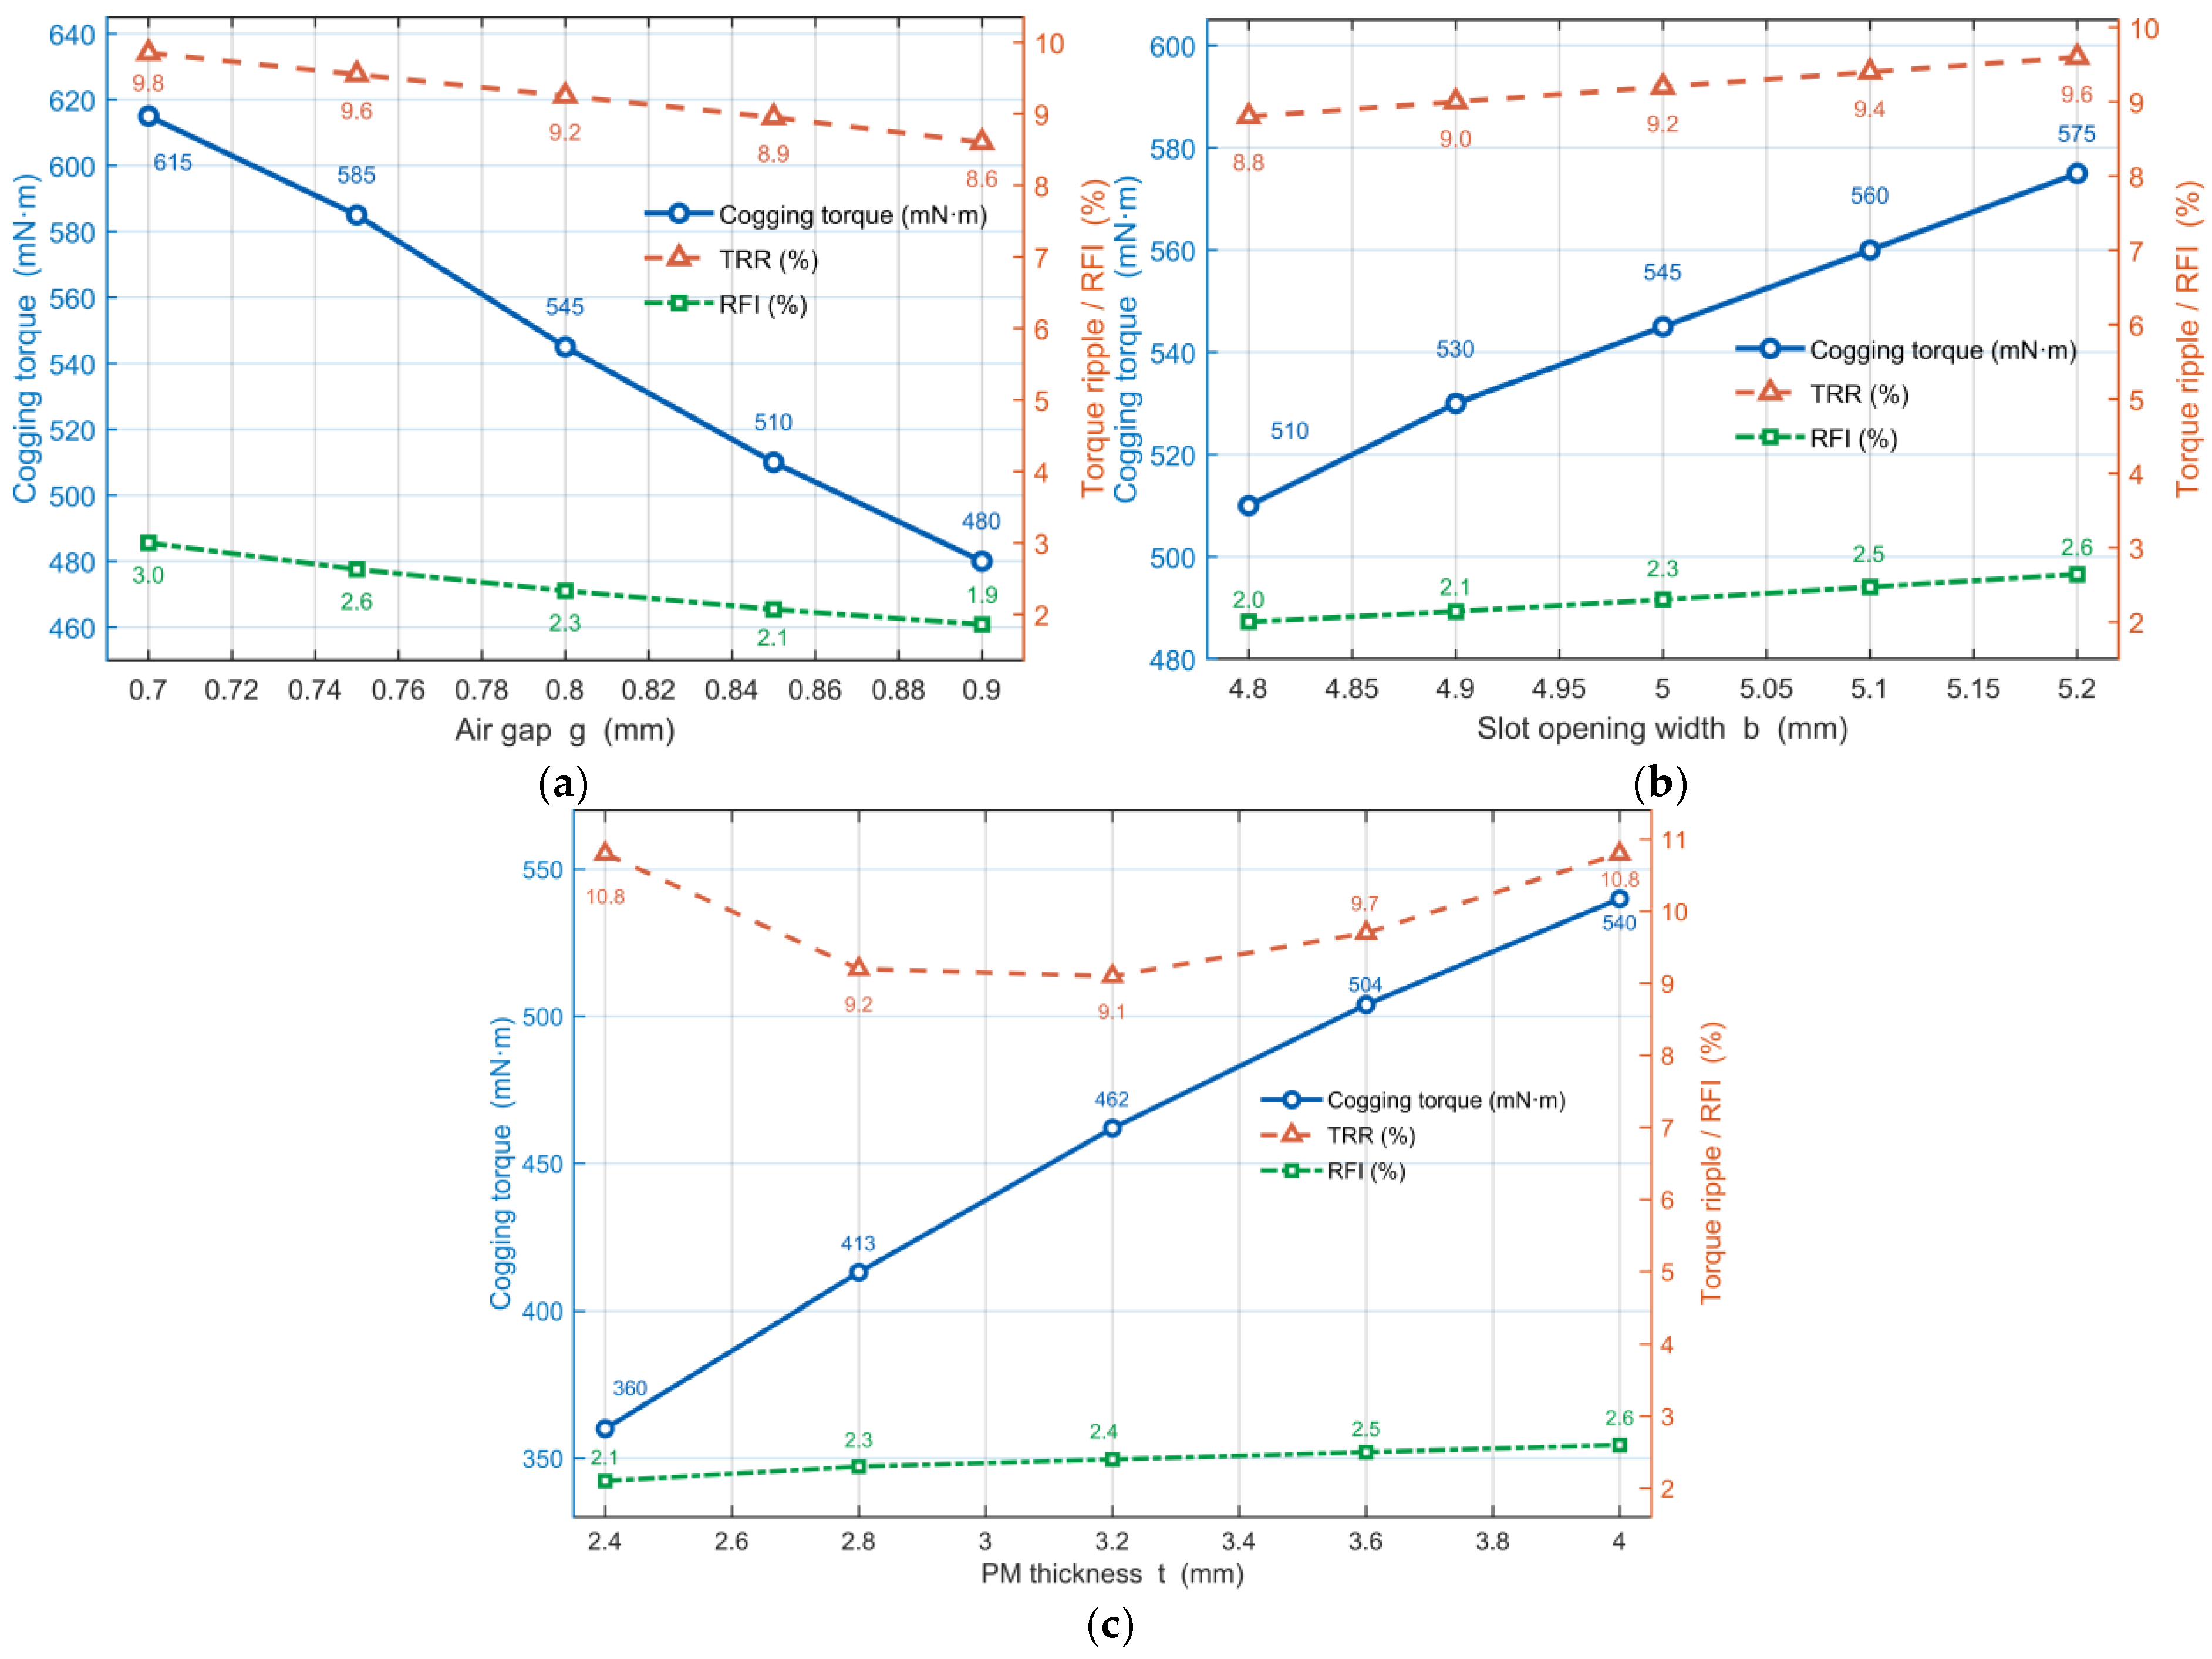
As shown in Figure 8a–c, cogging torque remains strongly correlated with the NVH indicators under different geometric perturbations. With increasing air-gap length, cogging torque decreases rapidly; in parallel, TRR falls from 9.8% to 8.6% and RFI from 3.0% to 1.9%, indicating an approximately linear positive correlation among the three quantities. Conversely, when the slot opening widens, cogging torque increases and TRR rises from 8.8% to 9.6%, while RFI grows from 2.0% to 2.6%, reflecting cooperative growth as the slotting effect is strengthened. The influence of magnet thickness in the range 2.4–4.0 mm is more nuanced; cogging torque and RFI both increase (from 2.1% to 2.6%), whereas TRR exhibits a U-shaped trend, reaching a minimum at intermediate thicknesses and increasing again when the magnet is too thin or too thick. Overall, cogging torque is tightly coupled with torque ripple and radial electromagnetic force through air-gap permeance modulation and shows high sensitivity to geometric parameters. Via slotting-induced spectral folding and order alignment, its dominant impact is projected onto critical spatial orders such as the 36th, supporting the feasibility of three-source coupling. Cogging torque can therefore be regarded as a sensitivity anchor for NVH evaluation, particularly because of its pronounced response in the 36th-order band.

4. Structural Analysis and Vibro-Acoustic Prediction

4.1. Structural Analytical Model and Order Alignment Verification

The preceding section has identified the dominant orders and mutual correlations of the three electromagnetic sources. To further verify the structural consistency of these relationships, an analytical shell model is introduced. This model offers compact derivation, broad applicability, and direct correspondence with electromagnetic orders, enabling rapid identification of overlap between electromagnetic orders and structural modes and resonance-prone frequency bands [40,41]. As the primary load-bearing and radiating component, the stator displacement can be expanded in circumferential orders to establish a one-to-one correspondence with electromagnetic orders and to formulate order-coupling criteria. Although the radial component is generally dominant, the tangential component and cogging torque can also exert significant influence via modal coupling at specific orders and frequency bands. The stator; therefore,, therefore, serves as an effective integrated carrier for analyzing the combined action of the three excitation sources, and on this basis, analytical expressions for its natural frequencies are derived to construct a modal corridor aligned with the previously identified spatial orders.
After slot-harmonic modulation and field coupling, the three excitation sources are ultimately manifested as radial pressure components acting on the inner surface of the stator, which appear in the spatial order–frequency spectrum of the resulting radial force. Accordingly, the radial equivalent-pressure spectrum on the stator inner surface is adopted as a unified representation of the excitation, while the stator is approximated as a two-dimensional cylindrical shell. The parameters used in the thin-shell model are listed in Table 4.
The ring thickness is expressed as a dimensionless parameter, representing the influence of the relative shell thickness on the natural frequency [42]
κ 2 = H C 2 3 D C 2
where H C the yoke height, and D C represents the equivalent mean diameter of the cylindrical shell.
Let the dimensionless natural frequency be defined as ω - r , m = ω r , m ρ C h R 4 D = Ω m , where D is the bending stiffness given by D = E C h 3 12 ( 1 ν C 2 ) .Then, we have
Ω 0 = 1 Ω m 1 = 1 2 ( 1 + m 2 + κ 2 m 4 ) ± ( 1 + m 2 + κ 2 m 4 ) 2 4 κ 2 m 6
restoring the dimensional frequency:
ω r , m = Ω m D ρ C h R 4 f m = ω m 2 π
therefore, a modal analysis is carried out to determine the natural (resonant) frequencies and mode shapes of the stator core. When a spatial order present in the air-gap radial equivalent-pressure spectrum coincides with the circumferential order of the structure and its frequency component lies within a narrow modal corridor centered on the modal frequency f m , strong coupling and resonance are deemed to occur at that order. Based on the above considerations, a three-dimensional structural finite element model of the stator–housing assembly is established to verify the analytical results, and the corresponding 2nd–5th circumferential mode shapes are shown in Figure 9.
From Table 5, for orders n = 2 4 , the relative errors between the analytical frequencies and the FE results remain within 5%, confirming the validity of the equivalent model for the stators’ in-plane circumferential modes. At n = 5 , the discrepancy increases, mainly because slotting further reduces the effective stiffness of the yoke. Order-aligned comparison between the modal corridor and the dominant peaks in the 2D radial-force spectrum shows that the principal electromagnetic harmonics of the three sources are folded by slotting and effectively projected onto low-order modes, giving rise to coupling and radiation peaks within the 1–5 kHz sensitive band.

4.2. BEM Modeling and A-Weighted SPL Prediction

After modal verification, the subsequent acoustic analysis uses the aligned spectral peaks as the primary excitation sources. The normal displacement or velocity response on the stator outer surface is obtained via modal superposition and adopted as the boundary input for acoustic radiation calculation. In this step, the acoustic field is treated as an unbounded exterior domain filled with homogeneous, quiescent air. A direct BEM based on the free-space Green’s function of the Helmholtz equation is employed, which satisfies the Sommerfeld radiation condition and thus ensures that the radiated sound propagates to infinity without reflection from artificial outer boundaries. Based on this structural boundary response, the BEM converts the modal responses into SPL indicators, yielding far-field acoustic outputs under consistent frequency bands and operating conditions. A-weighting is then applied to obtain an equivalent perceived-noise index, enabling comparative evaluation under both single-source and three-source coupled excitations [43].
Given that the powertrain structure is primarily concerned with exterior acoustic radiation, a direct BEM formulation is adopted for the acoustic system equations [44,45]. If the exterior field satisfies the Helmholtz equation and uses a time dependence of e i ω t , collocation on the equivalent shell boundary leads to the following frequency-domain direct BEM system:
A p s = ( i ρ ω ) B v A = C + H B = G
where p s is the complex acoustic-pressure amplitude at the boundary nodes, v is the normal particle velocity at the boundary, A is the system matrix assembled from the diagonal solid-angle matrix C and the double-layer kernel integral matrix H , and B is the single-layer kernel integral matrix G . i is the imaginary unit associated with harmonic time dependence e i ω t .
A Neumann boundary condition is imposed on the stator’s outer surface as:
p n = i ρ ω ν n v n = v n
where v n is the normal component of the boundary velocity and n denotes the outward unit normal. Accordingly, the velocity vector v is prescribed as the boundary input, while the nodal acoustic-pressure vector p s is treated as the unknown to be solved.
Based on the modal corridors aligned in the previous section, the shell model surface displacement field u   ( x ,   ω ) is obtained. The normal velocity is then computed as:
v n ( x ,   ω ) = i ω   u n ( x ,   ω ) = i ω   u ( x ,   ω ) · n ( x )
u ( x ,   ω ) denotes the displacement vector at a surface point x on the stator at frequency ω ;   n ( x ) is the outward unit normal at that point. Their dot product gives the projection of the displacement in the normal direction.
To convert the velocity spectrum into the acceleration spectrum, the following relation is applied
| v n ( f ) | = | a n ( f ) | 2 π f
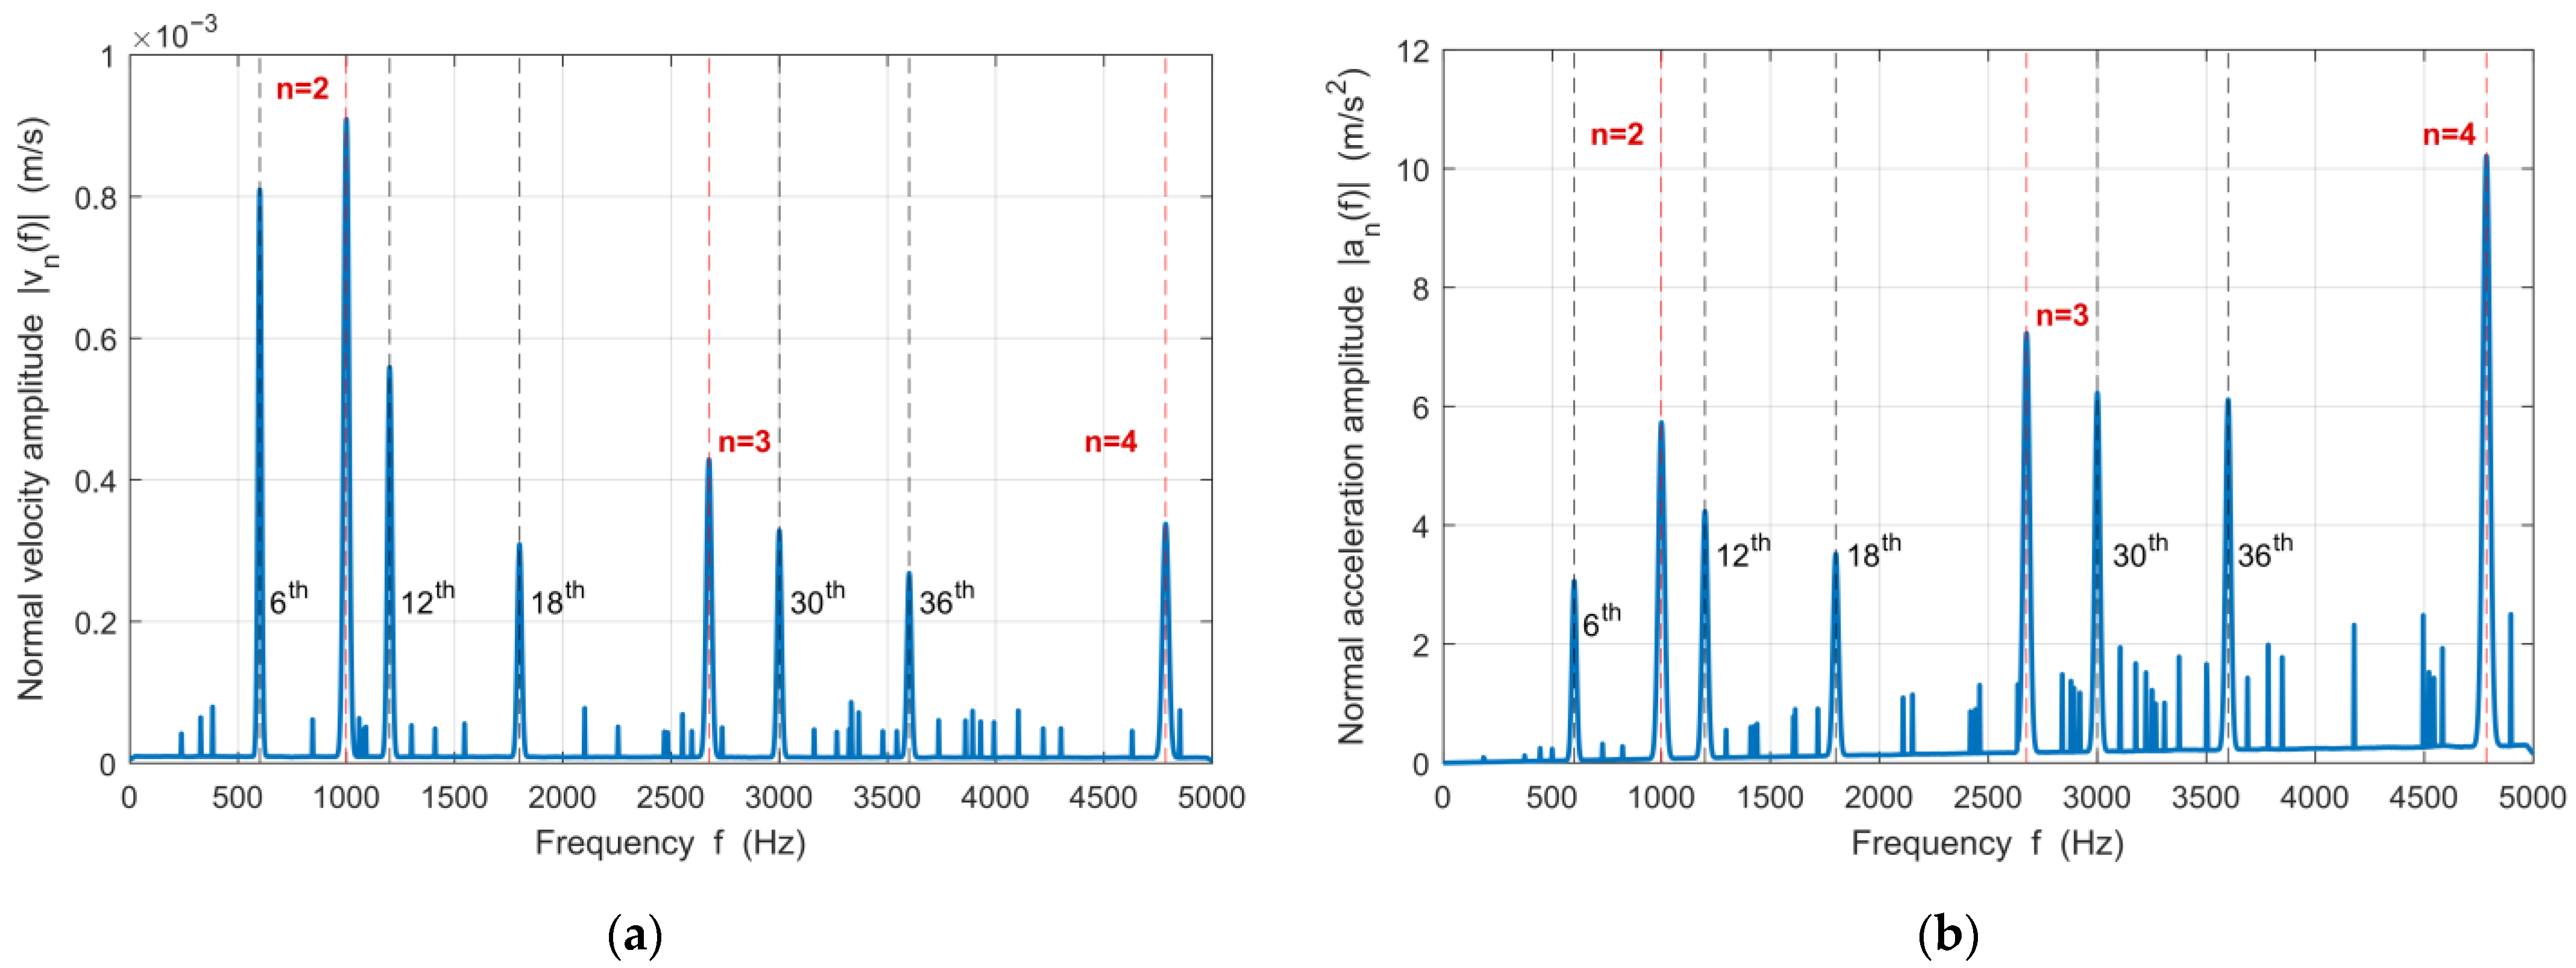
the normal velocity and acceleration spectrum of the stator outer surface are shown in Figure 10.
As shown in Figure 10a,b, the normal-velocity and acceleration spectra on the stator outer surface exhibit pronounced peaks at the main electromagnetic harmonic orders, with the strongest responses occurring within the modal bands n = 2 , 3 , and 4. The acceleration spectrum shows additional amplification at higher frequencies, indicating that higher-order harmonics are significantly magnified through modal coupling.
The acoustic pressure p is solved based on the established Neumann boundary condition as follows:
( C + H ) p = ( i ρ ω ) G v
to ensure sufficient numerical accuracy of the boundary element method at the maximum frequency of interest, the acoustic boundary mesh is designed according to the wavelength relation λ = c / f m a x . The characteristic element size is constrained to h λ / 6 for linear elements and between λ / 4 and λ / 5 for quadratic elements. Under these conditions, the acoustic pressure at a field point p s can be written as:
p ( x ,   ω ) = H x p i ρ ω G x v
in the equation, the field point matrices G x and H x are obtained from the Green’s function and its boundary integral discretization, respectively.
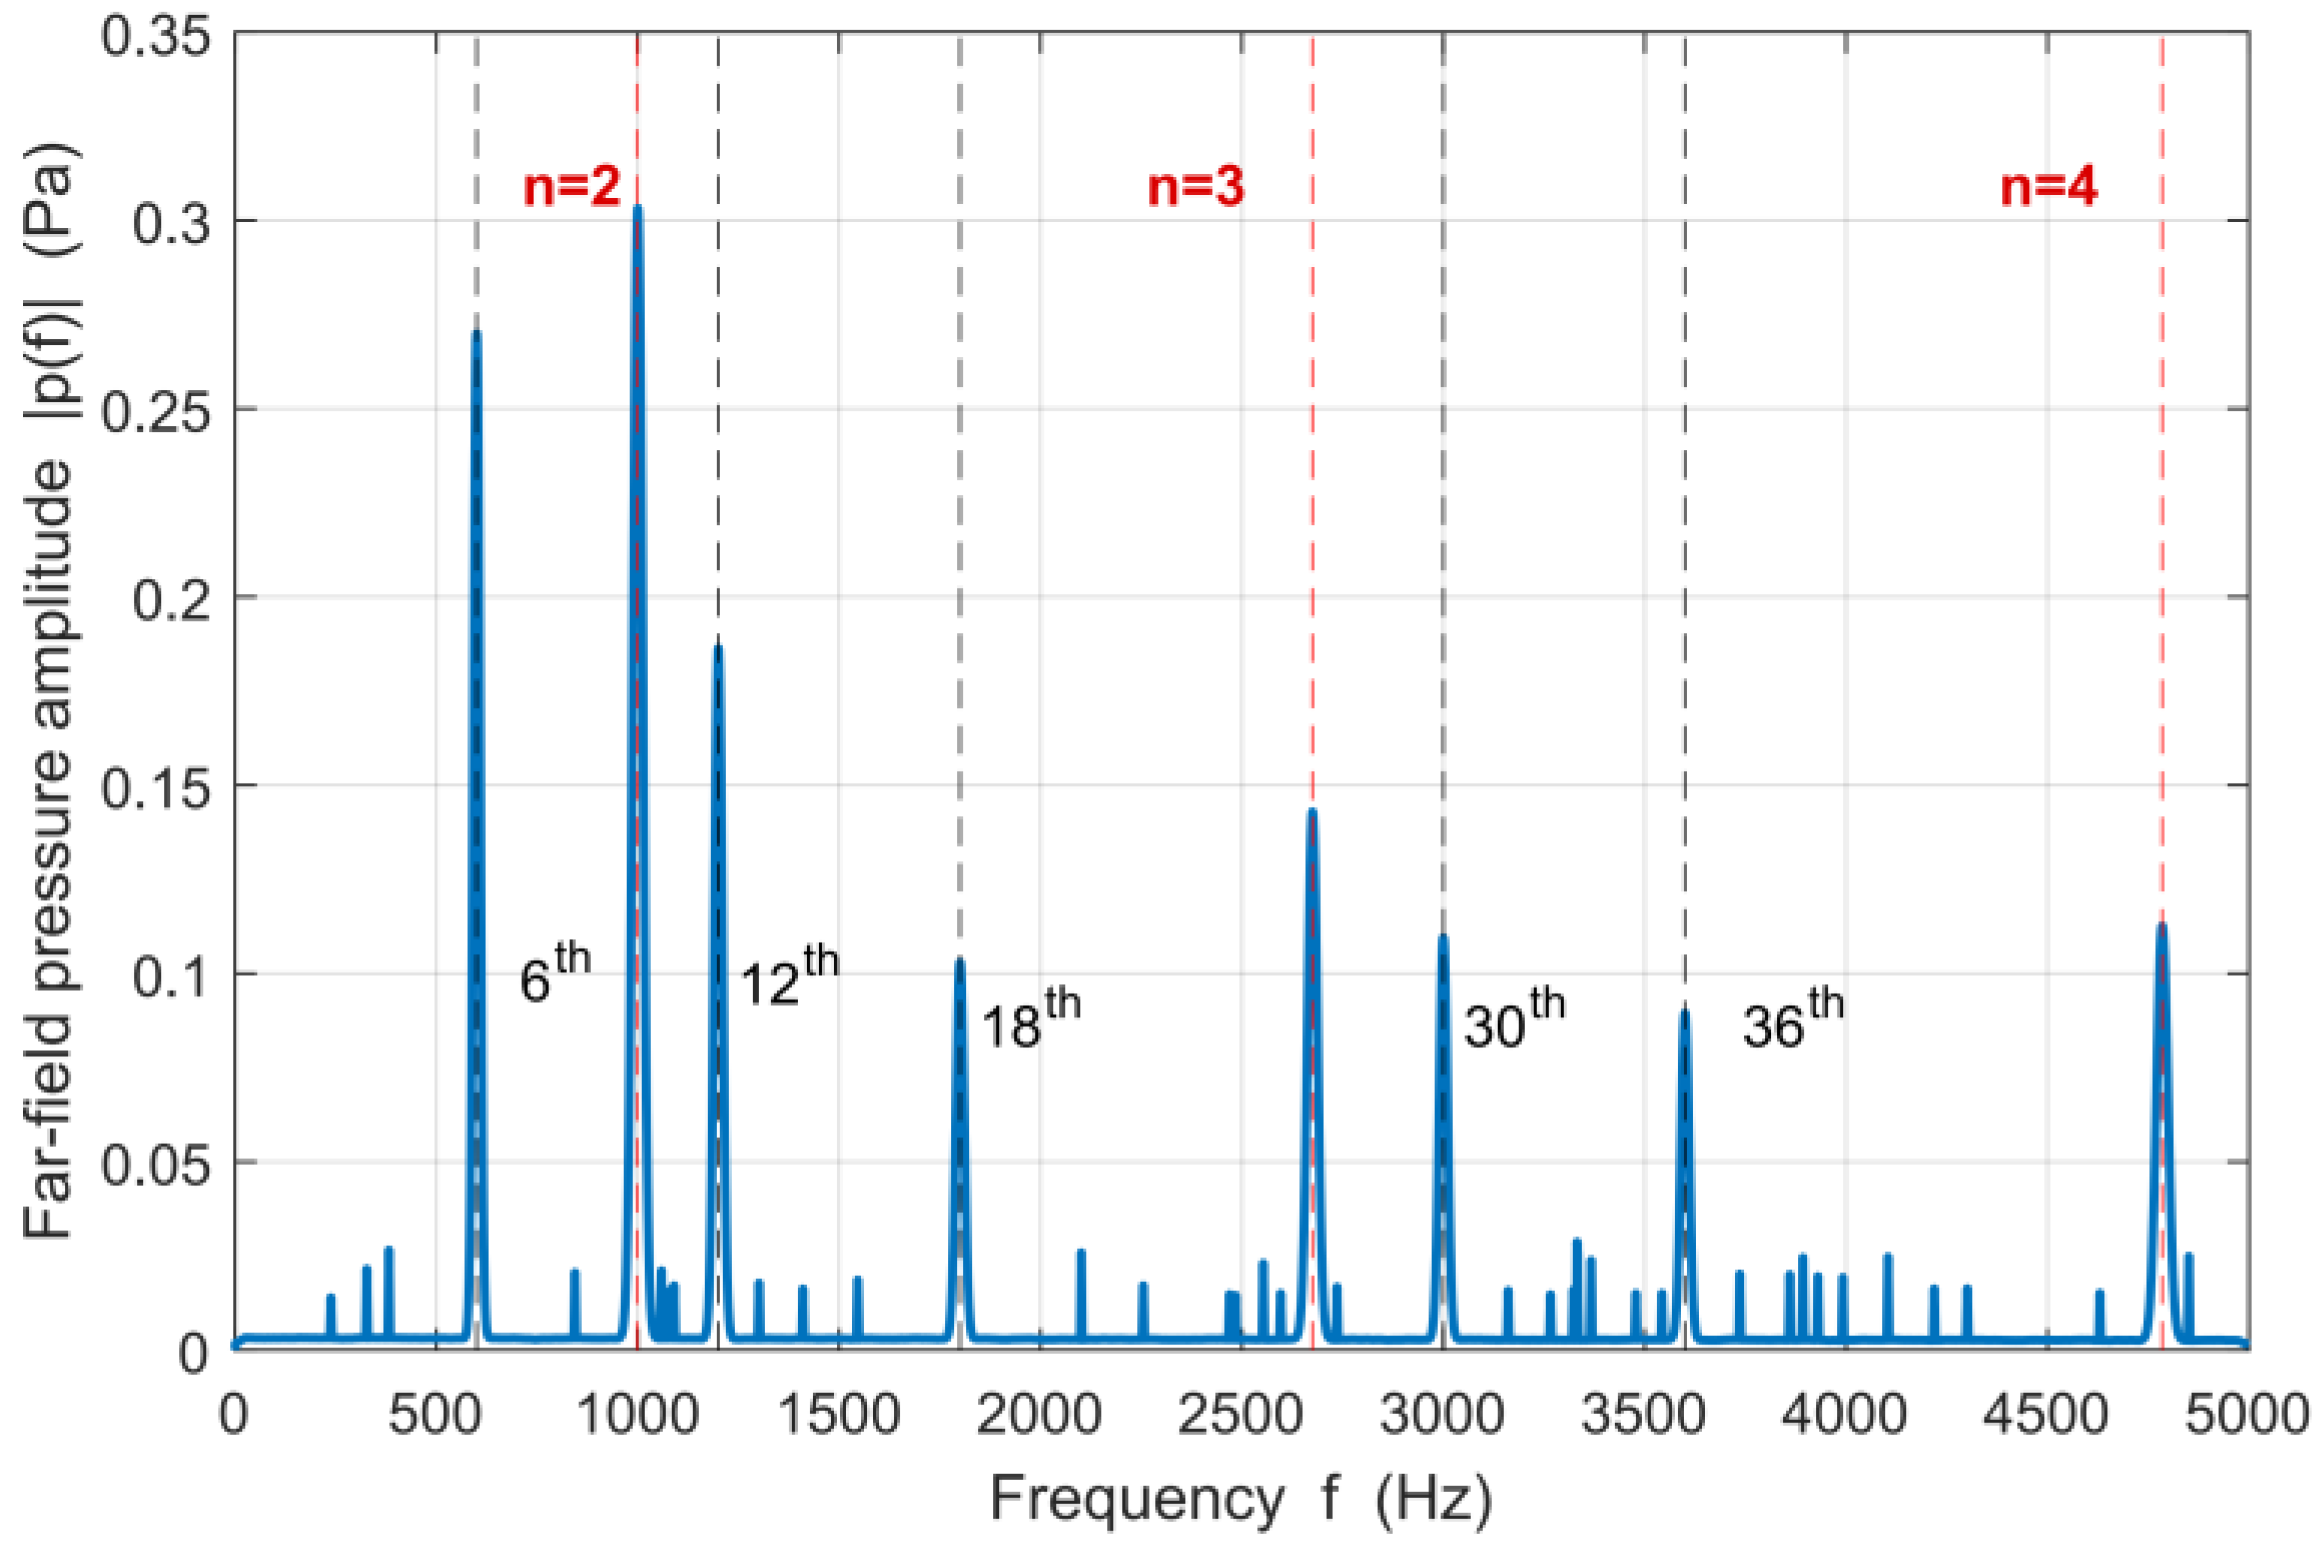
As shown in Figure 11, the far-field pressure spectrum at a distance of 1 m exhibits pronounced peaks at the 6th, 12th, 18th, 30th, and 36th electromagnetic harmonics, which align closely with the peaks of the stator-surface normal-velocity spectrum and with the modal corridors for n = 2 , 3 , and 4. This consistency indicates that these harmonics are amplified via coupling between characteristic spatial orders and structural modes and are efficiently converted into far-field sound, thereby closing the loop from boundary velocity to acoustic radiation.
Based on the computed sound-pressure amplitudes, an A-weighted SPL measure is introduced alongside the unweighted narrowband SPL to provide a complementary and perceptually relevant assessment of the three-source coupling effects on the motor’s NVH characteristics. The SPL is calculated as follows:
L p ( f ) = 20   log 10 | p   ( f ) | p 0
where p 0 is the reference sound pressure, taken as 20 µPa in air, and the A-weighting correction is applied in accordance with IEC 61672 [46].
L A ( f ) = L p ( f ) + A ( f )
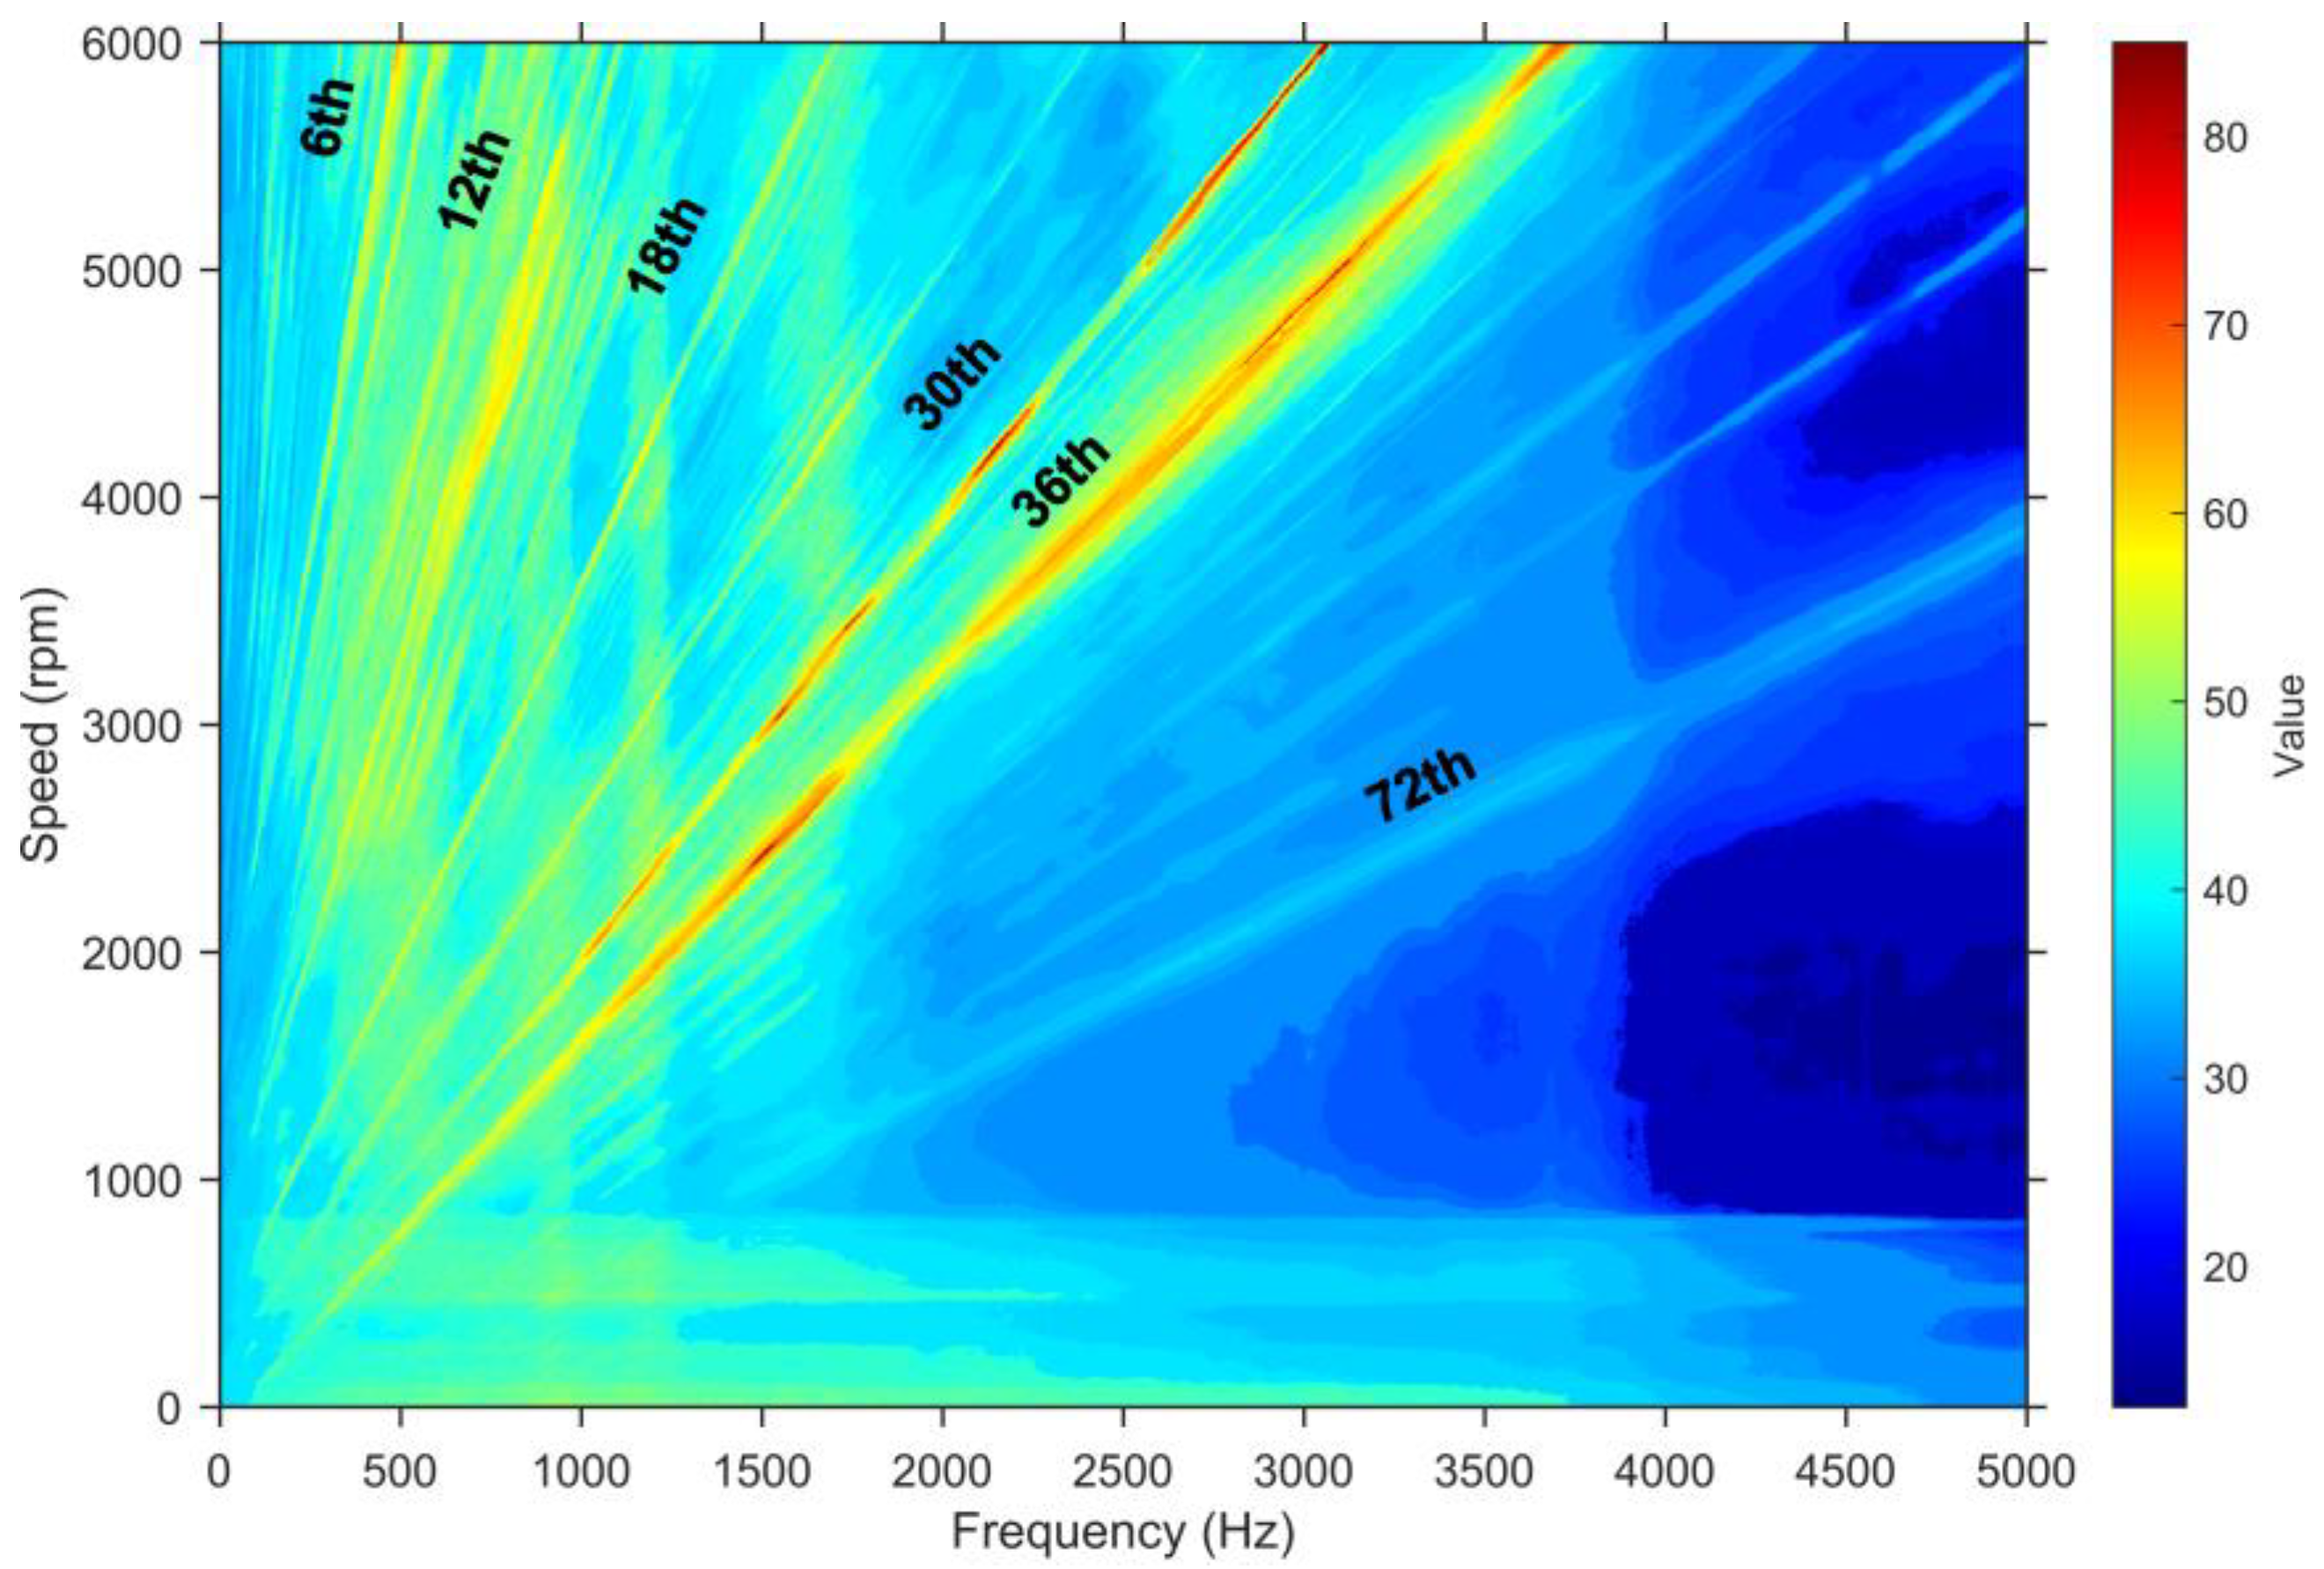
Therefore, the frequency range 0–5 kHz—covering both the region of high human auditory sensitivity and the dense modal band—is selected. For a speed ramp from 0 to 6000 rpm, an A-weighted Campbell diagram is then constructed to identify the dominant harmonic orders contributing to NVH and to provide a basis for subsequent analysis of multi-source coupling effects, as shown in Figure 12.
As shown in Figure 12, the dominant acoustic radiation follows both the order–frequency trajectories and the underlying space–time harmonic pattern. Orders below 36 are mainly governed by the radial electromagnetic force, with the 6th, 12th, and 18th orders being the most prominent. The 30th–36th orders display the strongest activity, whereas the 72nd order remains relatively weak. Within this range, the 30th order is reinforced by coupling between the radial force and torque ripple (tangential component), while the 36th order stays highly sensitive to speed variations over 4000–5500 rpm, indicating a synergistic amplification among the radial force, tangential force, and cogging torque. Consequently, the 1–4 kHz band, which lies in a region of heightened human auditory sensitivity, emerges as the main subjective noise hotspot of the analyzed PMSM.

4.3. Coupling Mechanism of Three Electromagnetic Excitations and NVH Correlation

Through the BEM modeling and A-weighted SPL computation described above, the analysis of three-source electromagnetic excitation coupling is focused on the 6th, 12th, 18th, and 30th–36th modal corridors within the 1–4 kHz band. To verify the reliability of the proposed three-source collaborative analysis method, the A-weighted coupled SPL spectrum is compared with both the traditionally superposed acoustic spectrum and a single-source radial-force full-chain approach, thereby highlighting differences in computational accuracy, auditory relevance, and physical interpretability.
In conventional approaches that neglect inter-source correlation, the three acoustic excitation sources are typically assumed to be independent and only weakly related. Their time-domain signals under identical operating conditions are first transformed individually into the frequency domain to obtain separate acoustic response spectra, which are then linearly combined in the power-spectral domain. The total sound-pressure-level spectrum is subsequently obtained by applying A-weighting, enabling direct comparison on a common perceptual scale.
S s u m ( f ) = S 1 ( f ) + S 2 ( f ) + S 3 ( f )
the introduction of A-weighting is expressed as:
S P L A , s u m ( f ) = 10   log 10 | H A ( f ) | 2 S s u m ( f ) S 0
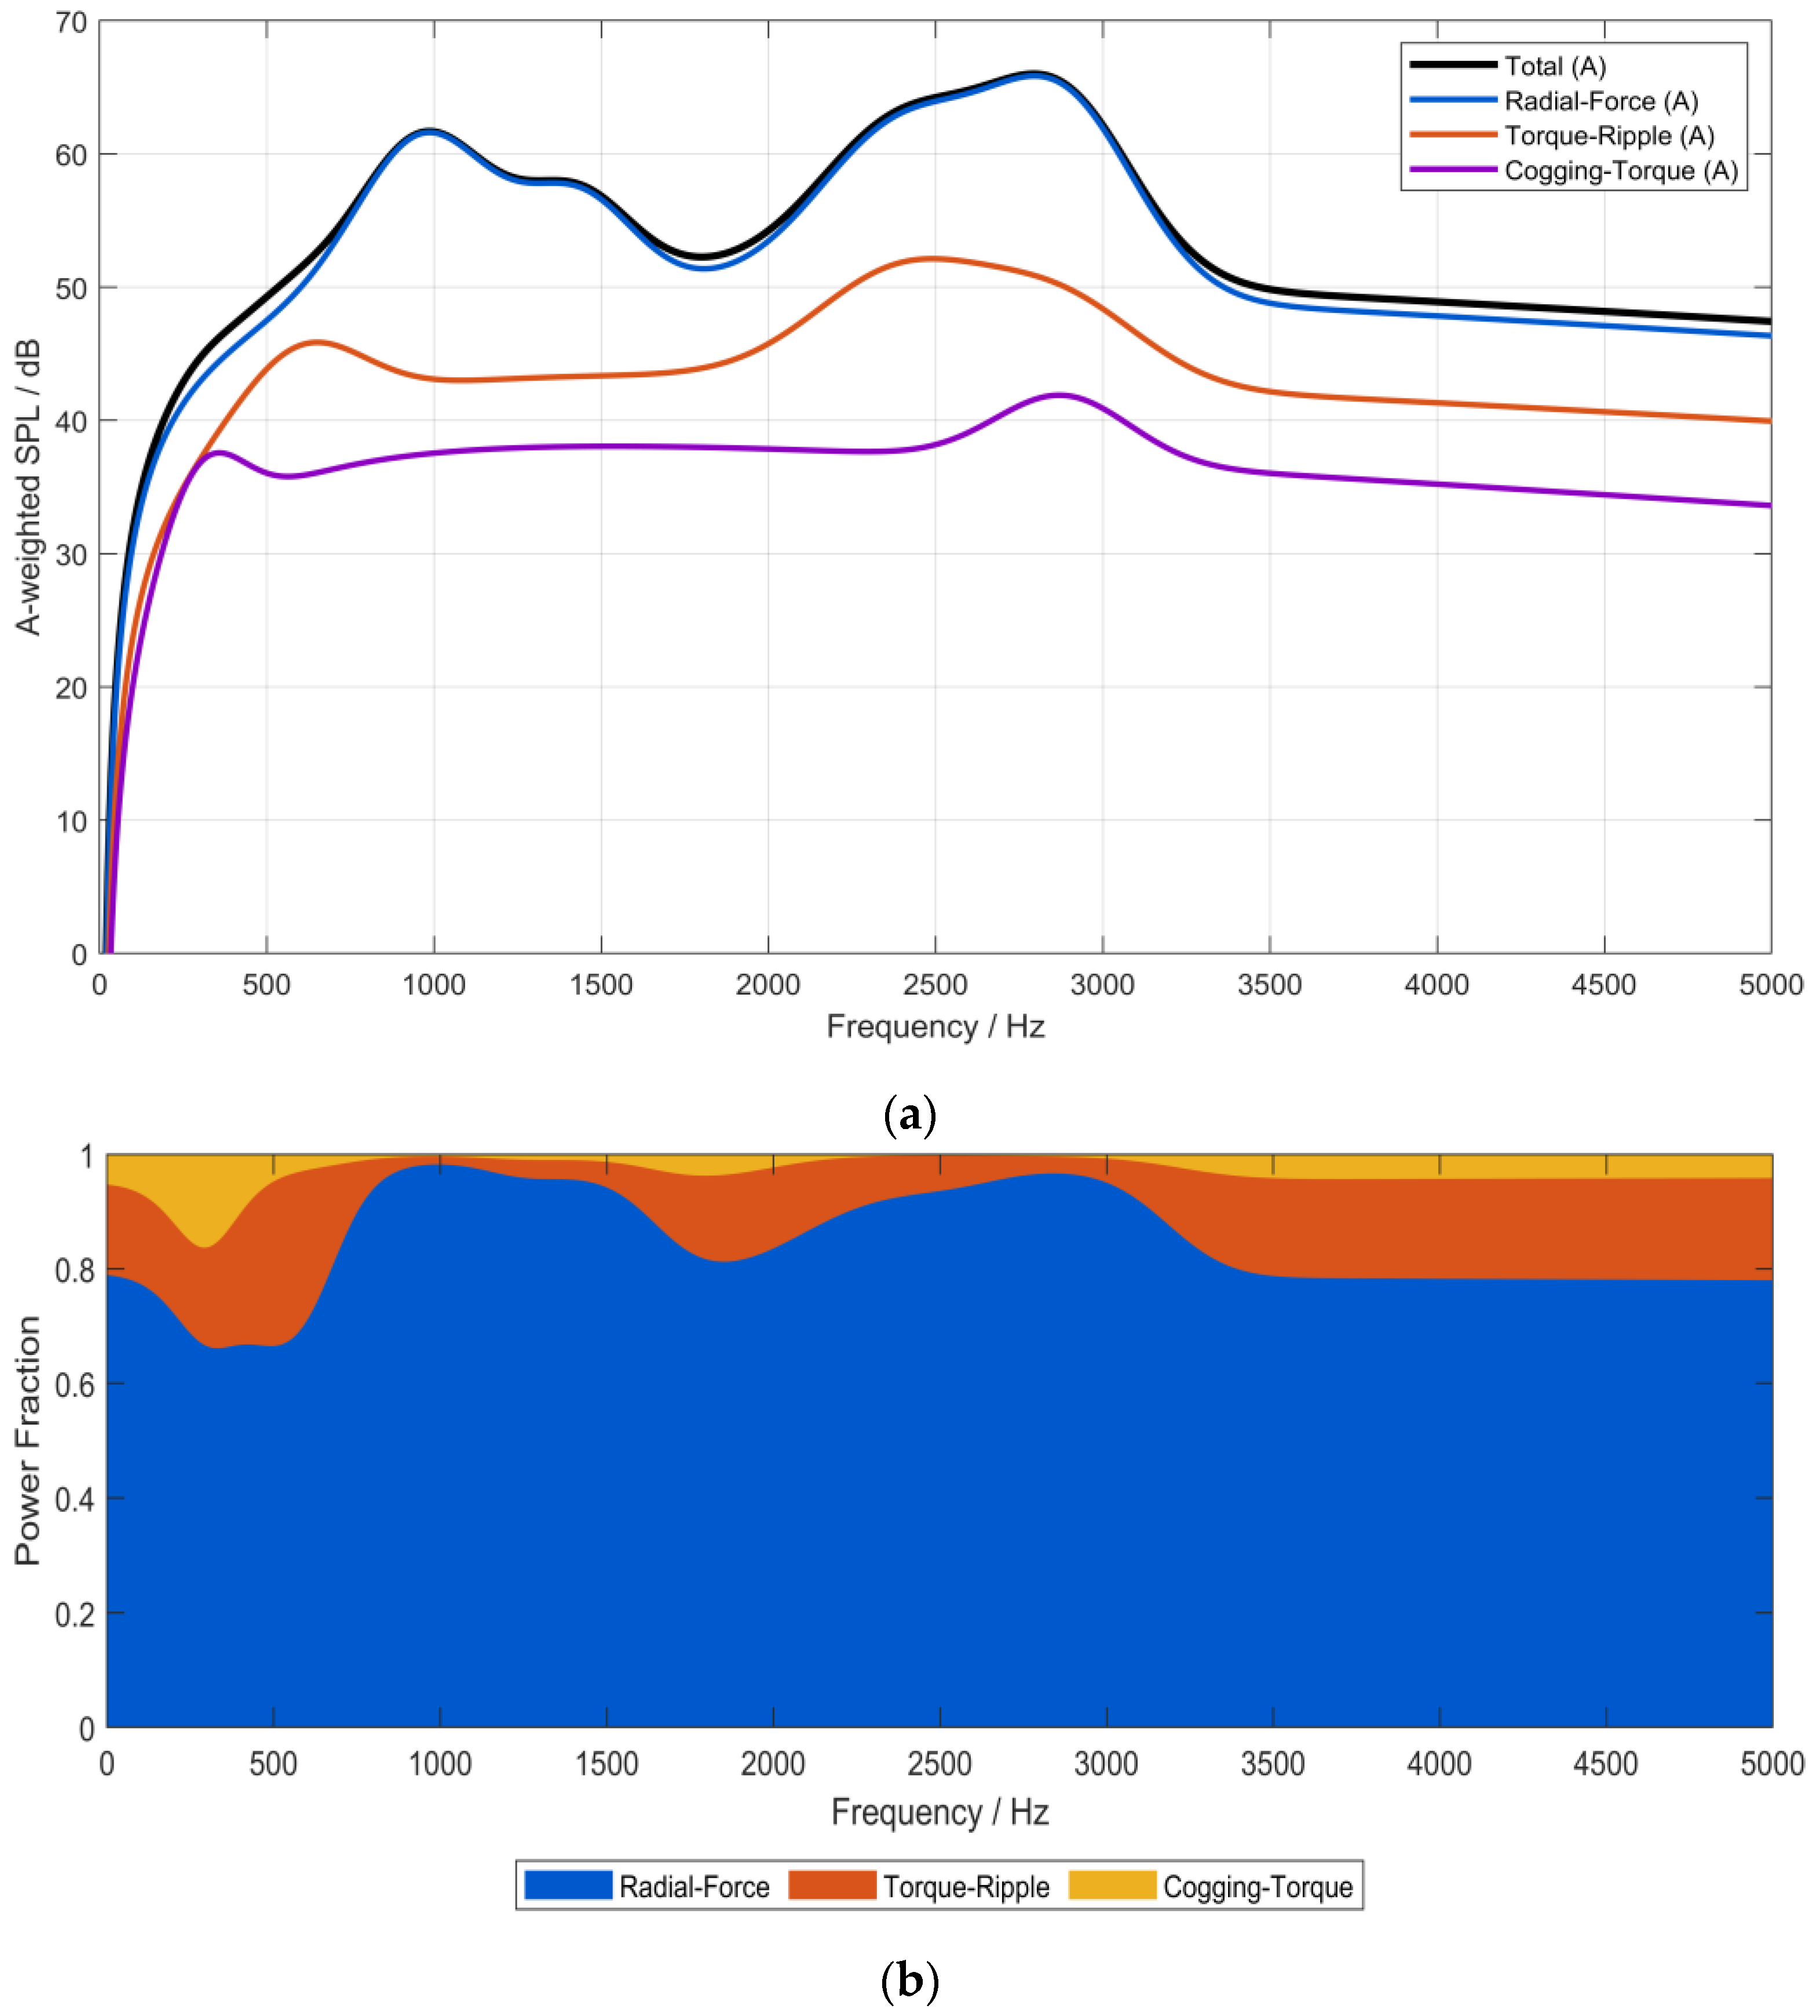
the A-weighted Campbell diagram indicates that three-source coupling is most sensitive in the 4000–5500 rpm range. To maintain analytical consistency, 4500 rpm is selected as a representative operating condition, with the observation point located 1 m from the motor. Under identical boundary conditions, the frequency-domain responses of the three sources are computed separately. Their spectra are then linearly superposed in the power domain and subjected to A-weighting, yielding the A-weighted SPL spectrum and the corresponding A-weighted power contributions of the three sources, as shown in Figure 13.
As shown in Figure 13, in the 500–3000 Hz range, which corresponds to the region of high auditory sensitivity, the total spectrum nearly matches the profile of the radial electromagnetic force curve, with a maximum deviation of about 3 dB. The influence of torque ripple and cogging torque on the overall spectral distribution is comparatively minor. This indicates that under the assumption of mutual incoherence, the traditional power-domain direct superposition method simply adds energy without accounting for cross terms between sources. Consequently, the same-order coupling and structural–modal synergy among the three excitations is not fully captured, leading to a certain degree of underestimation in both peak magnitude and band energy.
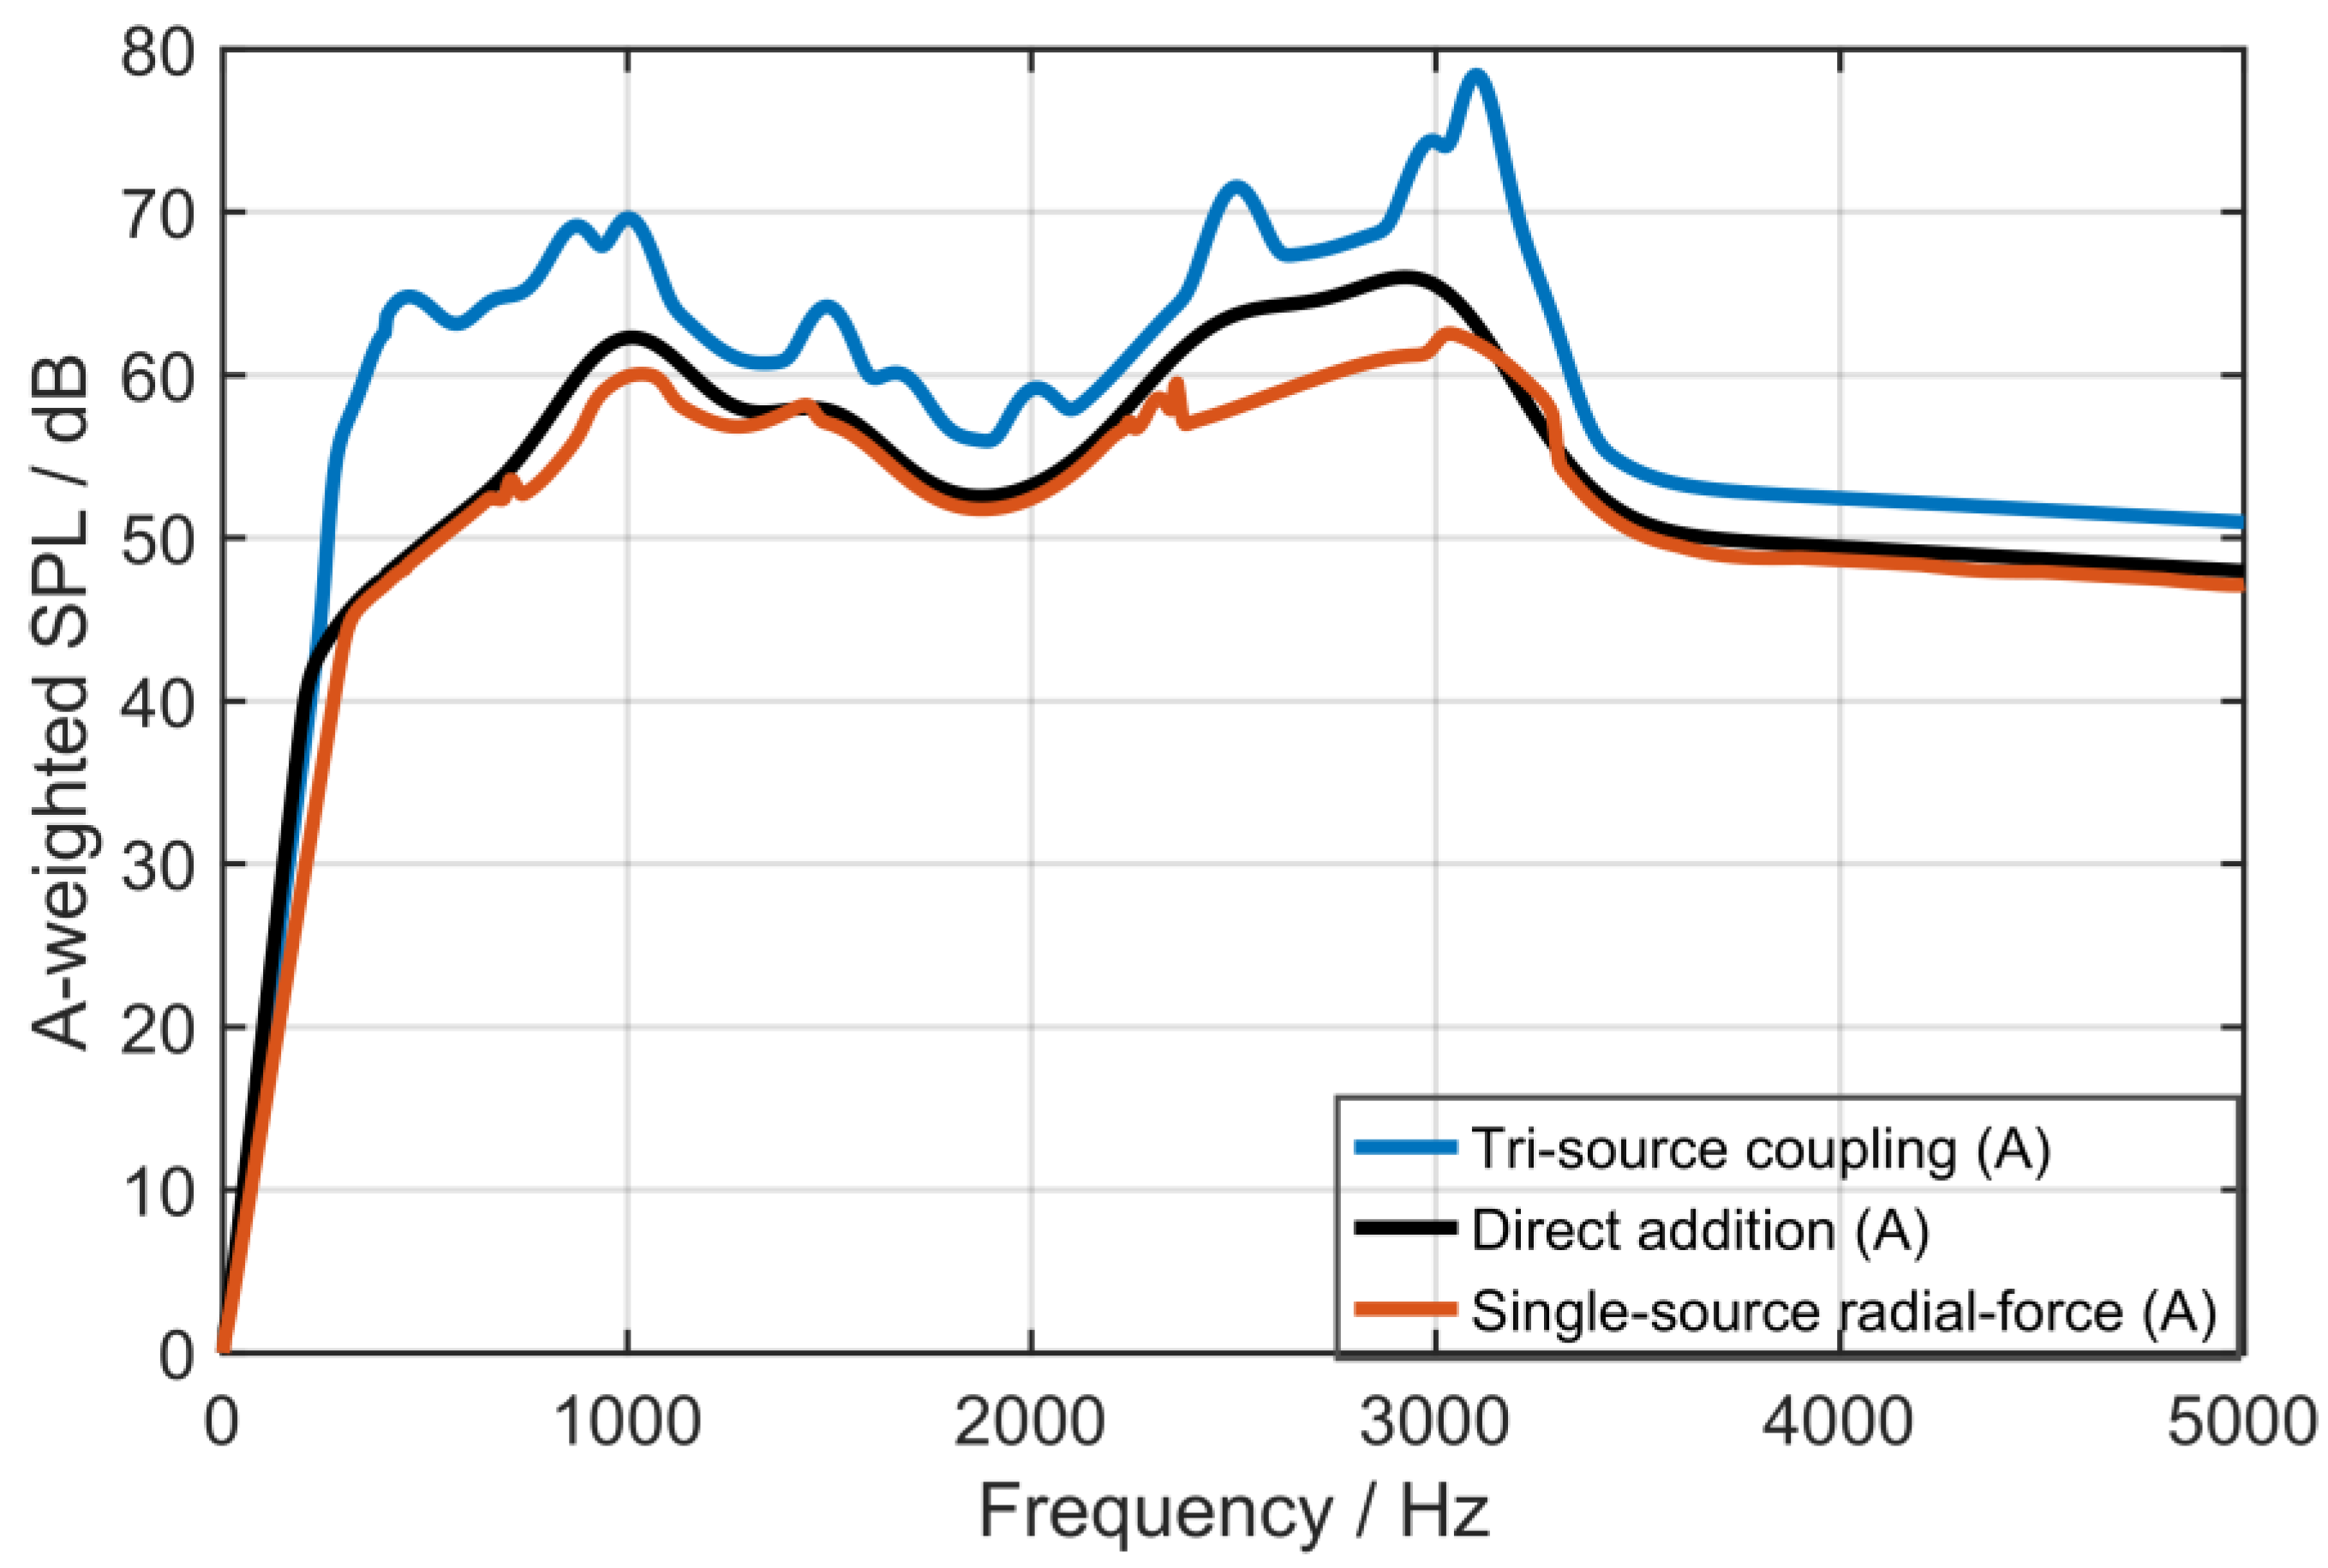
In contrast, the proposed coupled-analysis scheme simultaneously applies the complex amplitudes and phases of all three sources within a unified model and performs superposition in the complex domain prior to energy evaluation and A-weighting. In this way, cross terms arising from the same order coupling and modal synergy are explicitly preserved, enabling clearer identification of critical frequency bands and dominant harmonic orders, as expressed in (30). Figure 14 compares the results of the proposed coupling method with those of traditional direct superposition and a single-source radial-force full-chain approach under identical operating conditions.
| P t r i ( f ) | 2 = | P 1 ( f ) + P 2 ( f ) + P 3 ( f ) | 2 = | P 1 ( f ) | 2 + | P 2 ( f ) | 2 + | P 3 ( f ) | 2 + 2 R { P 1 ( f ) P 2 * ( f ) + P 1 ( f ) P 3 * ( f ) + P 2 ( f ) P 3 * ( f ) }
Denoting by P i ( f ) ( i = 1 , 2 , 3 ) the complex A-weighted sound-pressure contributions of the air-gap radial force, torque ripple, and cogging torque at frequency f , the tri-source result can be written as:
Where P T r i ( f ) is the total complex A-weighted sound pressure, R { } denotes the real part operator, and ( ) * denotes complex conjugation. The first line on the right-hand side contains the self-terms corresponding to the incoherent power summation in (28)–(29); whereas, the second line collects the three cross terms between sources, which account for the cooperative amplification due to same-order coupling.
As evidenced by the comparative results, the three-source coupling predicts an average increase of approximately 6 dB over the entire frequency range relative to direct power-spectrum superposition, with gains exceeding 10 dB in the vicinity of the dominant harmonic orders 6, 12, 30, and 36. Below 228 Hz, the directly superposed spectrum appears slightly higher owing to low-speed start-up effects combined with strong A-weighting attenuation; however, as speed increases, the discrepancy between the two approaches widens, and the synergy gain of the three-source model becomes more pronounced. In certain narrow bands, the single-source radial-force full-link result marginally surpasses the directly superposed curve, mainly because this method incorporates control and inverter nonlinearities on top of the conventional Maxwell-stress formulation. When the injected force harmonics coincide with structural modes or high-radiation-efficiency bands, higher instantaneous narrowband peaks are observed. Overall, the proposed three-source coupling strategy provides quantitative evidence and a methodological benchmark for assessing the synergistic influence of multi-source electromagnetic excitations on the NVH performance of PMSMs. Nevertheless, the coupled spectrum still exhibits localized fluctuations and limited smoothness, which may be further improved in future work through control-strategy optimization and modal-adaptive spectral smoothing. It should also be noted that the present study is purely numerical and does not yet include dedicated NVH bench or anechoic-chamber measurements for this specific motor, which is a limitation. Even so, the electromagnetic–structural–acoustic chain and the A-weighted SPL metric follow modeling practices that have been experimentally validated in previous PMSM and traction-drive studies, and future work will carry out controlled NVH measurements in a semi-anechoic environment under standardized test conditions to further validate and refine the proposed tri-source coupling framework.

5. Conclusions

This study investigates the NVH behavior of an automotive 6-pole 36-slot PMSM subjected to three electromagnetic excitations—air-gap radial force waves, torque ripple (tangential force), and cogging torque—by constructing an end-to-end electromagnetic–structural–acoustic chain and evaluating all responses under a unified A-weighted SPL metric. The main conclusions are as follows:
(1)
By mapping the three excitations into the order domain and applying phase-consistent loading, pronounced same-order coupling is observed at the 6th, 12th, 18th, 30th, and 36th spatial orders, with the 36th order remaining highly sensitive over 4000–5500 rpm. Radial electromagnetic force dominates the 6th, 12th, and 18th orders, torque ripple mainly contributes near the 30th order, and cogging torque, driven by slotting modulation, governs the 36th-order band.
(2)
A ring-type structural analytical model and a vibro-acoustic FE/BEM chain demonstrate that these dominant electromagnetic orders efficiently excite low-order stator modes and are converted into radiated sound. Using the stator outer-surface normal velocity as a unified Neumann boundary and far-field A-weighted SPL as the response index establishes a consistent link from source excitation to acoustic output.
(3)
Within the proposed three-source NVH framework for the 6-pole 36-slot PMSM, the A-weighted Campbell analysis shows that acoustic energy is concentrated in the 30th–36th orders. Under identical conditions, three-source complex-domain coupling yields markedly higher peaks and broader in-band A-weighted SPL around these orders than both traditional power-domain summation and a single-source radial-force chain. This confirms three-source synergy as a principal cause of noise deterioration in the sensitive band of the studied motor and provides a quantitative basis for subsequent co-optimization of motor structure and current-control strategies.

Author Contributions

Conceptualization, T.D. and J.W.; methodology, W.Z.; software, W.L.; validation, J.W., W.Z. and W.L.; formal analysis, T.D.; investigation, W.L.; resources, W.L.; data curation, W.L.; writing—original draft preparation, W.L.; writing—review and editing, W.Z.; visualization, T.D.; supervision, T.D.; project administration, W.L.; funding acquisition, T.D. All authors have read and agreed to the published version of the manuscript.

Funding

This research was funded by Research and Industrialization of Key Technologies for Unmanned Intelligent Sanitation Vehicles Based on Data Fusion, grant number 2025TSGCCZZB0653.

Data Availability Statement

The original contributions presented in the study are included in the article; further inquiries can be directed to the corresponding author.

Conflicts of Interest

The authors declare no conflicts of interest.

Abbreviations

The following abbreviations are used in this manuscript:
PMSMPermanent-Magnet Synchronous Motor
FSCW-PMSMsFractional Slot Concentrated Winding Permanent Magnet Synchronous Motors
Tri-ECNVHTri-source Electromagnetic Coupling NVH Integrated Framework
SPLSound Pressure Level
RFIRadial Force Index
SSRFSingle-Source Radial-Force
IPMSMInterior Permanent Magnet Synchronous Motor
TRRTorque Ripple Ratio
LCMLeast Common Multiple
GCDGreatest Common Divisor

References

  1. Yang, Y.; He, Q.; Fu, C.; Liao, S.; Tan, P. Efficiency improvement of permanent magnet synchronous motor for electric vehicles. Energy 2020, 213, 118859. [Google Scholar] [CrossRef]
  2. An, Q.; Lu, Y.; Zhao, M. Review of key technologies of the high-speed permanent magnet motor drive. Energies 2024, 17, 5252. [Google Scholar] [CrossRef]
  3. Gobbi, M.; Sattar, A.; Palazzetti, R.; Mastinu, G. Traction motors for electric vehicles: Maximization of mechanical efficiency—A review. Appl. Energy 2024, 357, 122496. [Google Scholar] [CrossRef]
  4. Abdel-Aziz, A.; Elgenedy, M.; Williams, B.W. Review of switched reluctance motor converters and torque ripple minimisation techniques for electric vehicle applications. Energies 2024, 17, 3263. [Google Scholar] [CrossRef]
  5. Masri, J.; Amer, M.; Salman, S.; Ismail, M.; Elsisi, M. A survey of modern vehicle noise, vibration, and harshness: A state-of-the-art. Ain Shams Eng. J. 2024, 15, 102957. [Google Scholar] [CrossRef]
  6. Król, E.; Maciążek, M. Identification and analysis of noise sources of permanent magnet synchronous traction motor with interior permanent magnet. Energies 2023, 16, 6018. [Google Scholar] [CrossRef]
  7. Cao, J.; Cheng, X.; Shang, J.; He, Y. Analysis of the effect of vibration on vehicle LIDAR system. Opt. Eng. 2020, 59, 114101. [Google Scholar] [CrossRef]
  8. Hots, J.; Oberfeld, D.; Verhey, J.L. Spatial weights in loudness judgements. Acta Acust. 2024, 8, 36. [Google Scholar] [CrossRef]
  9. Gonzalez, P.; Buigues, G.; Mazon, A.J. Noise in electric motors: A comprehensive review. Energies 2023, 16, 5311. [Google Scholar] [CrossRef]
  10. Bassani, M.; Pinardi, D.; Toscani, A.; Manconi, E.; Concari, C. Active vibration control via current injection in electric motors. Electronics 2024, 13, 3442. [Google Scholar] [CrossRef]
  11. Dai, Y.; Lee, H.-J. Torque ripple and electromagnetic vibration suppression of fractional slot distributed winding ISG motors by rotor notching and skewing. Energies 2024, 17, 4964. [Google Scholar] [CrossRef]
  12. Lee, S.-H.; Song, S.-W.; Yang, I.-J.; Lee, J.; Kim, W.-H. Optimal rotor design for reducing electromagnetic vibration in traction motors based on numerical analysis. Energies 2024, 17, 6206. [Google Scholar] [CrossRef]
  13. Yi, P.; Zheng, W.; Li, X. Overview of torque ripple minimization methods for permanent magnet synchronous motors based on harmonic injection. Chin. J. Electr. Eng. 2024, 10, 16–29. [Google Scholar] [CrossRef]
  14. Lee, S.; Yun, G.; Lukman, G.F.; Lee, C. Trade-off between torque ripple and vibration in an IPMSM by examining the temporal and spatial harmonics of flux density. AIP Adv. 2024, 14, 035201. [Google Scholar] [CrossRef]
  15. Zhang, X.; Wang, Z.; Bai, C.; Zhang, S. A novel approach to ripple cancellation for low-speed direct-drive servo in aerospace applications. Aerospace 2024, 11, 834. [Google Scholar] [CrossRef]
  16. Ma, C.; Wang, Y.; Chen, H.; Hong, J.; Wang, Y. Analysis of electromagnetic vibration in permanent magnet motors based on random PWM technology. Machines 2025, 13, 259. [Google Scholar] [CrossRef]
  17. Dai, M.; Zhang, Z.W.; Dorjoy, M.M.H.; Zeng, L. Analysis and optimization of vibration and noise of high-speed magnetic suspension motor. J. Low Freq. Noise Vib. Act. Control. 2022, 41, 625–636. [Google Scholar] [CrossRef]
  18. Soresini, F.; Barri, D.; Ballo, F.; Gobbi, M. Numerical Modeling of PMSM Noise Reduction by Harmonic Current Injection. IEEE Access 2025, 13, 60245–60257. [Google Scholar] [CrossRef]
  19. Lenz, R.; Deutschmann-Olek, A.; Kugi, A.; Kemmetmüller, W. Optimal fault-tolerant control with radial force compensation for multiple open-circuit faults in multiphase PMSMs—A comparison of n-phase and multiple three-phase systems. Control. Eng. Pract. 2024, 147, 105924. [Google Scholar] [CrossRef]
  20. Rafaq, M.S.; Midgley, W.; Steffen, T. A review of the state of the art of torque ripple minimization techniques for permanent magnet synchronous motors. IEEE Trans. Ind. Inform. 2024, 20, 1019–1031. [Google Scholar] [CrossRef]
  21. Li, H.; Liang, J.; Zhang, J. Analysis and comparison of performance of permanent magnet servo motors after stator shifting combination. J. Eng. 2020, 2020, 282–291. [Google Scholar] [CrossRef]
  22. Ciceo, S.; Chauvicourt, F.; Gyselinck, J.; Martis, C. PMSM current shaping for minimum Joule losses while reducing torque ripple and vibrations. IEEE Access 2021, 9, 114705–114714. [Google Scholar] [CrossRef]
  23. Ebrahimi, H.; Torkaman, H.; Javadi, H. Simultaneous improvement of cogging torque and torque density in axial flux-switching permanent magnet motor. IET Electr. Power Appl. 2024, 18, 312–324. [Google Scholar] [CrossRef]
  24. Andreou, P.; Hajjaj, A.Z.; Mohammadpour, M.; Theodossiades, S. Analytical multiphysics methodology to predict vibroacoustics in PMSMs combining tangential electromagnetic excitation and tooth modulation effects. IEEE Trans. Transp. Electrif. 2023, 10, 5997–6009. [Google Scholar] [CrossRef]
  25. Hong, J.; Gui, L.; Cao, J. Analysis and experimental verification of the tangential force effect on electromagnetic vibration of PM motor. IEEE Trans. Energy Convers. 2023, 38, 1893–1902. [Google Scholar] [CrossRef]
  26. Kim, J.-H.; Won, Y.-J.; Lim, M.-S. Analysis and reduction of radial vibration of FSCW PMSM considering the phase of radial, tangential forces and tooth modulation effect. IEEE Trans. Transp. Electrif. 2024, 11, 2976–2987. [Google Scholar] [CrossRef]
  27. Król, E.; Maciążek, M.; Wolnik, T. Review of vibroacoustic analysis methods of electric vehicles motors. Energies 2023, 16, 2041. [Google Scholar] [CrossRef]
  28. Ballo, F.; Gobbi, M.; Mastinu, G.; Palazzetti, R. Noise and vibration of permanent magnet synchronous electric motors: A simplified analytical model. IEEE Trans. Transp. Electrif. 2022, 9, 2486–2496. [Google Scholar] [CrossRef]
  29. Soresini, F.; Barri, D.; Ballo, F.; Gobbi, M.; Mastinu, G. Noise and vibration modeling of permanent magnet synchronous motors: A review. IEEE Trans. Transp. Electrif. 2024, 10, 8728–8745. [Google Scholar] [CrossRef]
  30. Hou, P.; Ge, B.; Tao, D.; Wang, Y.; Pan, B. Coupling analysis of electromagnetic vibration and noise of FeCo-based permanent-magnet synchronous motor. Energies 2022, 15, 3888. [Google Scholar] [CrossRef]
  31. Gómez, I.; García, G.; McCloskey, A.; Almandoz, G. Analytical Model to Calculate Radial Forces in Permanent-Magnet Synchronous Machines. Appl. Sci. 2021, 11, 10865. [Google Scholar] [CrossRef]
  32. Wang, J.; Wang, Y. Electromagnetic Torque Analysis and Structure Optimization of Interior Permanent Magnet Synchronous Machine with Air-Gap Eccentricity. Energies 2023, 16, 1665. [Google Scholar] [CrossRef]
  33. Jeong, K.-I.; Heidari, R.; Kang, D.-H.; Ahn, T.-J.; Park, G.S.; Ahn, J.-W.; Lukman, G.F. Magnetic Screen Effects on Torque Ripple and Efficiency of Dual Air-Gap Surface Permanent Magnet Synchronous Motor. Energies 2023, 16, 6969. [Google Scholar] [CrossRef]
  34. Pyrhönen, J.; Jokinen, T.; Hrabovcová, V. Design of Rotating Electrical Machines, 2nd ed.; John Wiley & Sons: Chichester, UK, 2013. [Google Scholar]
  35. Kim, Y.-S.; Lee, H.-K.; Yang, J.-W.; Jung, W.-S.; Choi, Y.-T.; Jang, J.-H.; Kim, Y.-J.; Shin, K.-H.; Choi, J.-Y. Electromagnetic Noise and Vibration Analyses in PMSMs: Considering Stator Tooth Modulation and Magnetic Force. Electronics 2025, 14, 2882. [Google Scholar] [CrossRef]
  36. Jędryczka, C.; Danielczyk, D.; Szeląg, W. Torque Ripple Minimization of the Permanent Magnet Synchronous Machine by Modulation of the Phase Currents. Sensors 2020, 20, 2406. [Google Scholar] [CrossRef] [PubMed]
  37. Liang, W.; Wang, J.; Luk, P.C.K.; Fei, W. Analytical Study of Stator Tooth Modulation on Electromagnetic Radial Force in Permanent Magnet Synchronous Machines. IEEE Trans. Ind. Electron. 2020, 68, 11731–11739. [Google Scholar] [CrossRef]
  38. Sunil Kumar, S. Cogging Torque and Torque Ripple Analysis of Permanent Magnet Synchronous Machines. Master’s Thesis, Politecnico di Milano, Milan, Italy, 2019. [Google Scholar]
  39. Xu, Z.; Shi, D.; Gu, D.; Liu, Z.; Chen, G.; Hu, C.; Sun, X.; Sun, P.; Zhu, B. Innovative Approach to Mitigating Vibration and Noise in an External Rotor Permanent Magnet Synchronous Motor. J. Vib. Control. 2024. [Google Scholar] [CrossRef]
  40. Zhao, G.; Sun, L.; Niu, N.; Wang, X.; Xing, Z. Analysis of Vibration Characteristics of Stators of Electrical Machines under Actual Boundary. Mech. Syst. Signal Process. 2023, 185, 109778. [Google Scholar] [CrossRef]
  41. Song, G. Research on Estimation and Control Methods of Natural Frequency of Irregular Building Structure Vibration. J. Vibroeng. 2024, 26, 629–642. [Google Scholar] [CrossRef]
  42. Sarrazin, M.; Fodorean, D.; Gillijns, S.; Peeters, B.; Van der Auweraer, H.; Martis, C. Multiphysical Analysis of a Three-Phase PWM-Supplied PMSM for Light Vehicle Applications. In Proceedings of the ISMA 2014—International Conference on Noise and Vibration Engineering & USD 2014—International Conference on Uncertainty in Structural Dynamics, Leuven, Belgium, 15–17 September 2014; pp. 1401–1414, ISBN 978-9-0738-0291-9. [Google Scholar]
  43. Horváth, K.; Zelei, A. Simulating Noise, Vibration, and Harshness Advances in Electric Vehicle Powertrains: Strategies and Challenges. World Electr. Veh. J. 2024, 15, 367. [Google Scholar] [CrossRef]
  44. Xie, X.; Zuo, Q.; Chen, H.; Lian, H.; Natarajan, S.; Zhao, W.; Chen, X.; Bordas, S.P.-A. A Non-Intrusive Model Order Reduction Boundary Element Method for Frequency Sweeps of 2D Acoustics. J. Sound Vib. 2023, 544, 117396. [Google Scholar] [CrossRef]
  45. Sathyan, S.; Aydin, U.; Belahcen, A. Acoustic Noise Computation of Electrical Motors Using the Boundary Element Method. Energies 2020, 13, 245. [Google Scholar] [CrossRef]
  46. IEC 61672-1:2013; Electroacoustics—Sound Level Meters—Part 1: Specifications. International Electrotechnical Commission (IEC): Geneva, Switzerland, 2013.
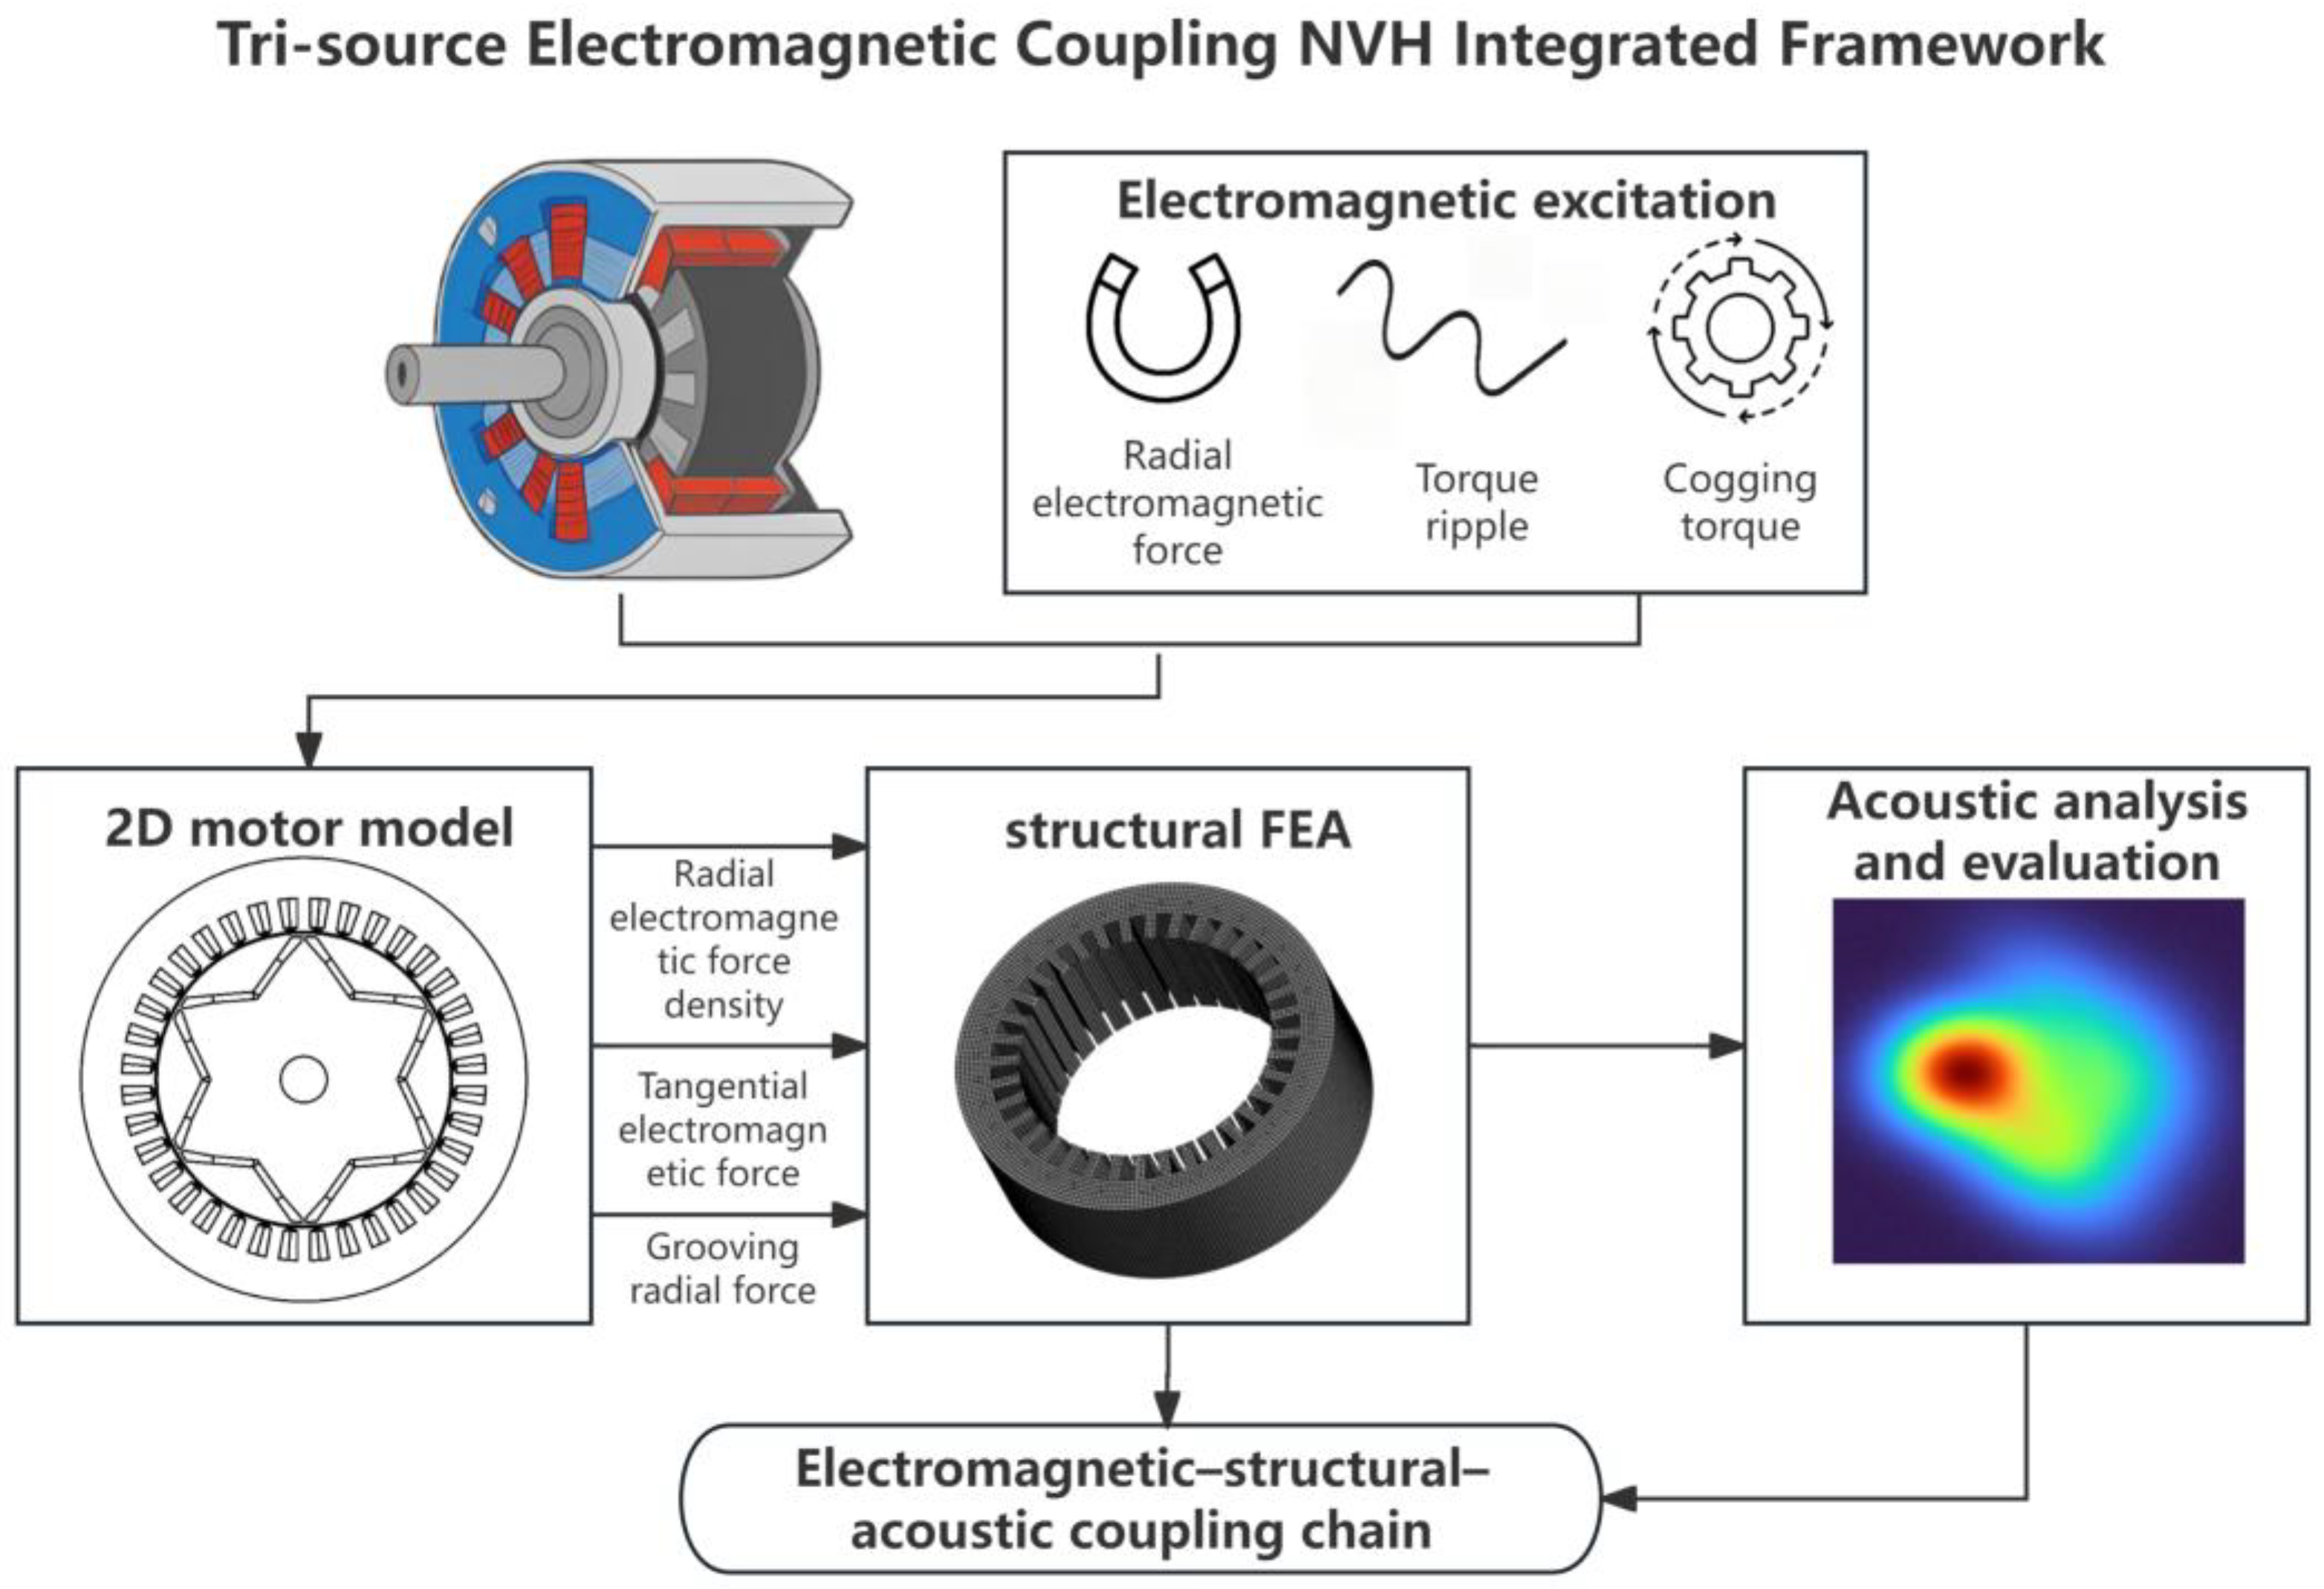
Figure 1. Tri-source coupling framework for electromagnetic noise.
Electronics 14 04652 g001
Figure 2. 1/6 fractional motor model.
Electronics 14 04652 g002
Figure 3. Mesh division of the motor model.
Electronics 14 04652 g003
Figure 4. Air-Gap flux density distribution.
Electronics 14 04652 g004
Figure 5. Space–Time harmonic spectrum of radial electromagnetic force.
Electronics 14 04652 g005
Figure 6. Synthesis of the global tangential force.
Electronics 14 04652 g006
Figure 7. Comparative analysis of the instantaneous torque ripple with and without the tangential force component.
Electronics 14 04652 g007
Figure 8. (a) Air-gap length scale; (b) slot opening width scale; (c) description of what is contained in the first panel; permanent magnet thickness scale.
Electronics 14 04652 g008
Figure 9. (a) 2nd mode shape; (b) 3rd mode shape; (c) 4th mode shape; (d) 5th mode shape.
Electronics 14 04652 g009
Figure 10. (a) Normal velocity spectrum on the stator outer surface; (b) normal acceleration spectrum on the stator outer surface.
Electronics 14 04652 g010
Figure 11. Far-field sound pressure amplitude.
Electronics 14 04652 g011
Figure 12. A-weighted Campbell Diagram of the Motor NVH Response.
Electronics 14 04652 g012
Figure 13. (a) directly superimposed spectrum; (b) power contribution under direct superposition.
Electronics 14 04652 g013
Figure 14. A-Weighted SPL under Three Modeling Approaches.
Electronics 14 04652 g014
Table 1. Permanent magnet synchronous motor parameter table.
ParameterValueParameterValue
Stator slots36Peak power220 kW
Rotor poles6Rated speed6000 rpm
Motor length200 mmStator outer diameter240 mm
Permanent magnet width1.75 mmStator inner diameter160 mm
Rated torque250 N·mAir-gap length0.8 mm
Magnet thickness3.2 mmCore length180 mm
Rated power150 kWSlot opening width5 mm
Table 2. Harmonic order sources of radial electromagnetic forces in PMSMs.
TypeSpatial OrderTemporal Order
Stator 2 v p 2 ω
Permanent magnet 2 μ 2 ω μ
Interaction term v p ± μ ω ± ω μ
Table 3. Main harmonic orders of radial electromagnetic force waves.
Harmonic Orders of Rotor Permanent-Magnet Field
135791113
Harmonic Orders
of
Armature Reaction Field
36/412/824/2630/2030/2036/2442/28
0/06/418/1224/1624/1630/2036/24
1518/1224/1630/2036/2442/4848/3254/36
12/86/40/06/412/818/1224/12
2124/1630/2036/2442/2848/3254/3660/40
18/1212/86/40/06/412/818/12
3336/2442/2848/3254/3660/4066/4472/48
30/2024/1618/1212/86/40/06/4
3942/2848/3254/3660/4066/4472/4878/52
36/2430/2024/1618/1212/86/40/0
Table 4. Thin cylindrical shell parameters.
SymbolParameterValue
R Stator Radius100 mm
h Equivalent Thickness15 mm
H C Yoke Height15 mm
E Elastic Modulus200 GPa
v C Poisson’s Ratio 0.29
ρ C Density7700 kg · m 3
Table 5. Stator natural frequencies.
Resultn = 2n = 3n = 4n = 5
Model
Analytical Frequency (Hz)978.52662.34991.87986.8
Finite Element (Hz)998.42675.14784.87042.3
Relative Error (%)+1.02%+0.5%−4.1%−11.8%
Disclaimer/Publisher’s Note: The statements, opinions and data contained in all publications are solely those of the individual author(s) and contributor(s) and not of MDPI and/or the editor(s). MDPI and/or the editor(s) disclaim responsibility for any injury to people or property resulting from any ideas, methods, instructions or products referred to in the content.