1. Introduction
In the fast-evolving landscape of contemporary wireless communication, characterized by the ever-increasing demands spurred by 5G and its successive iterations, HetNets emerge as an enticing prospect. HetNets, marked by their integration of diminutive Base Stations (BSs) within the traditional cellular framework, hold forth the tantalizing promise of substantially augmented spectral efficiency and concomitantly reduced energy consumption, thus heralding a pivotal juncture in the evolutionary trajectory of wireless networks.
However, within this pursuit of crafting communication infrastructure that is both more efficient and sustainable, the intricate topology intrinsic to HetNets introduces a multifaceted set of novel challenges. Among these, the issue of user association looms large as a central and particularly complex concern. It is precisely at this nexus of opportunity and challenge that the innovative Downlink/Uplink Decoupling (DUDe) methodology enters the stage, offering a transformative shift in the paradigm governing the utilization of HetNets with a view to optimizing energy efficiency. In doing so, DUDe holds the potential to redefine the very landscape of network performance enhancement.
This article distinguishes itself by offering an in-depth exploration of how DUDe can fundamentally reshape the energy profile of heterogeneous 5G networks. While much of the existing literature treats decoupling primarily as a theoretical performance enhancement, this work demonstrates through rigorous modeling and large-scale simulations that DUDe has a direct and measurable impact on network sustainability. The novelty of our approach lies in its dual focus: not only does it quantify energy savings at the level of individual base stations—most notably at the energy-intensive Macro BS tier—but it also examines how DUDe enables a more balanced distribution of users across heterogeneous infrastructures, thereby preventing network overload and reducing system-wide inefficiencies.
Prior DUDe studies have primarily addressed coverage at the cell edge, user association rules, or analytical performance bounds, often under stylized traffic and topology assumptions. In contrast, this study: (i) quantifies tier-wise energy consumption with explicit Macro/Micro/Pico separation under a common 3GPP propagation framework; (ii) evaluates user-load redistribution effects that DUDe induces across tiers and relates these to the energy footprint; and (iii) reports simulation-based evidence across urban and rural layouts under strictly controlled, identical conditions for DUCo vs. DUDe. This combination provides operator-oriented guidance on when DUDe reduces macro-tier power and frees spectrum capacity [
1,
2,
3,
4,
5].
Also, there is a considerable amount of ongoing scientific research focused on enhancing the performance of 5G networks through the utilization of DUDe technology. The research work in paper [
6] compares the performance of two resource allocation strategies, namely Downlink/Uplink Coupling (DUCo) and Downlink/Uplink Decoupling (DUDe), in a 5G HetNets (Heterogeneous Networks) network. The objective is to achieve Energy Efficiency (EE) and maximize data flow in the network.
In paper [
7], the authors address the optimization of resource distribution in a network by combining downlink/uplink operations with a dynamic Time Division Duplexing (TDD) system. The objective is to ensure a more balanced allocation of resources throughout the network. The anticipated 5G standard for HetNets by the 3rd Generation Partnership Project (3GPP) includes the incorporation of Small Cell Base Stations (SCBSs) operating at high mmWave frequencies to enhance network throughput and capacity.
In some studies, researchers consider the resource allocation problem in LTE-U networks using DUDe, formulating the problem as a game theoretic model incorporating user association, spectrum allocation and load balancing, for which they propose a decentralized expected Q-learning algorithm to solve [
8]. Another paper [
9] proposes an UL and DL Supplementary UL (SUL) decoupling technology and an UL enhancement technology to coordinate New Radio Time Division Duplexing (NR TDD) and New Radio Frequency Division Duplexing (NR FDD). The goal is to improve the UL coverage performance of the 5G network so that the UL data is transmitted in the SUL spectrum or the NR FDD spectrum by time division of the UL data. This significantly increases the available UL time-frequency resources for 5G User Equipment (UE). Lastly, several researchers study the concept of DUDe where DL BS association is based on received power DL, while UL is based on path loss [
10,
11].
However, another paper [
12], proposes a DUDe model where Macro-BS selection for DL is based on received power (as usual), but Micro, Pico and femto-BSs selection for UL is not based solely on path loss (link quality), but on a combination of parameters such as: link quality, BS load and BS backhaul capacity.
Authors in [
13] focus on how to use DUDe technology to improve the distribution of network resources based on user distribution. The study found that by considering the capacity limitations of each type of BS, the DUDe technology results in a more even distribution of users within the network. This contrasts with different Downlink/Uplink Coupling (DUCo) scenarios and BS have capacity limits, and if exceed this limit can lead to inefficiencies and communication problems. The paper states that the capacity limits for Macro BSs are 2000+ UEs, Micro BSs have a maximum capacity of 200 users, and Pico BSs have a maximum capacity of 46 UEs.
Paper [
14], the authors investigate the optimization of resource allocation in 5G networks through DUDe. The study introduces a simulation-based methodology to evaluate the impact of DUDe on coverage, capacity, latency, and energy efficiency. The findings indicate that using an additional lower frequency signal on the uplink can rebalance performance at the cell edge and significantly enhance overall network performance, particularly in scenarios with high data transmission. Evaluations across three cases demonstrate that decoupled access not only yields higher network performance and increased bandwidth but also results in lower outage rates for networks with high minimal throughput requirements. These insights offer valuable guidance for researchers and network operators in designing efficient resource allocation strategies for 5G systems while acknowledging the continuously evolving nature of technology.
Other recent work [
15,
16], has explored hierarchical resource allocation under UL/DL decoupling in NOMA-HetNets, demonstrating substantial energy-efficiency gains under decoupled association and optimized UE/BS matching. In parallel, fully decoupled RAN architectures combining UL/DL separation with flexible base station sleeping and cooperative resource sharing have been studied, showing promising reductions in network-level operational energy [
17]. In contrast, the present study focuses on tier-wise energy consumption under strict transmit-power caps and identical traffic/propagation assumptions in Macro/Micro/Pico layers, isolating the pure association effect of DUDe vs. DUCo.
Authors in [
18], the authors examine the performance of heterogeneous networks (HetNets) by using DUDe combined with random Discontinuous Transmission (DTX) at the UE. They apply stochastic geometry to derive closed-form approximations for the mean local delay and Energy Efficiency (EE) of the system. The results show that there is an optimal EE at a specific mute probability under a finite local delay constraint, and that DUDe can achieve higher EE compared to DUCo when maintaining the same delay conditions.
The rest of this journal is organized as follows.
Section 2 presents a review of DUDe technology.
Section 3 presents the mathematical model which we used in our simulation environment.
Section 4 outlines the algorithms employed in implementing our scenarios.
Section 5 presents the simulation setup and methodology used to evaluate the energy consumption of DUDe.
Section 6 presents the results of the simulation and provides a detailed analysis of the findings for energy consumption of DUDe.
Section 7 presents the simulation results and offers a comprehensive analysis regarding energy consumption of DUDe vs. DUCo.
Section 8 presents the conclusion of our research. Finally,
Section 9 provides suggestions for future research.
2. DUDe Overview and Features
Energy efficiency has become a cornerstone objective in modern wireless networks, primarily due to the growing demand for high data rates and the parallel necessity to reduce energy consumption and carbon emissions. The increasing density of 5G heterogeneous networks (HetNets) integrating Macro, Micro, and Pico base stations (BSs)—has intensified the challenge of maintaining sustainable operation while meeting stringent performance requirements. In this context, Downlink/Uplink Decoupling (DUDe) has emerged as a promising strategy for improving both spectral and energy efficiency in 5G and beyond systems.
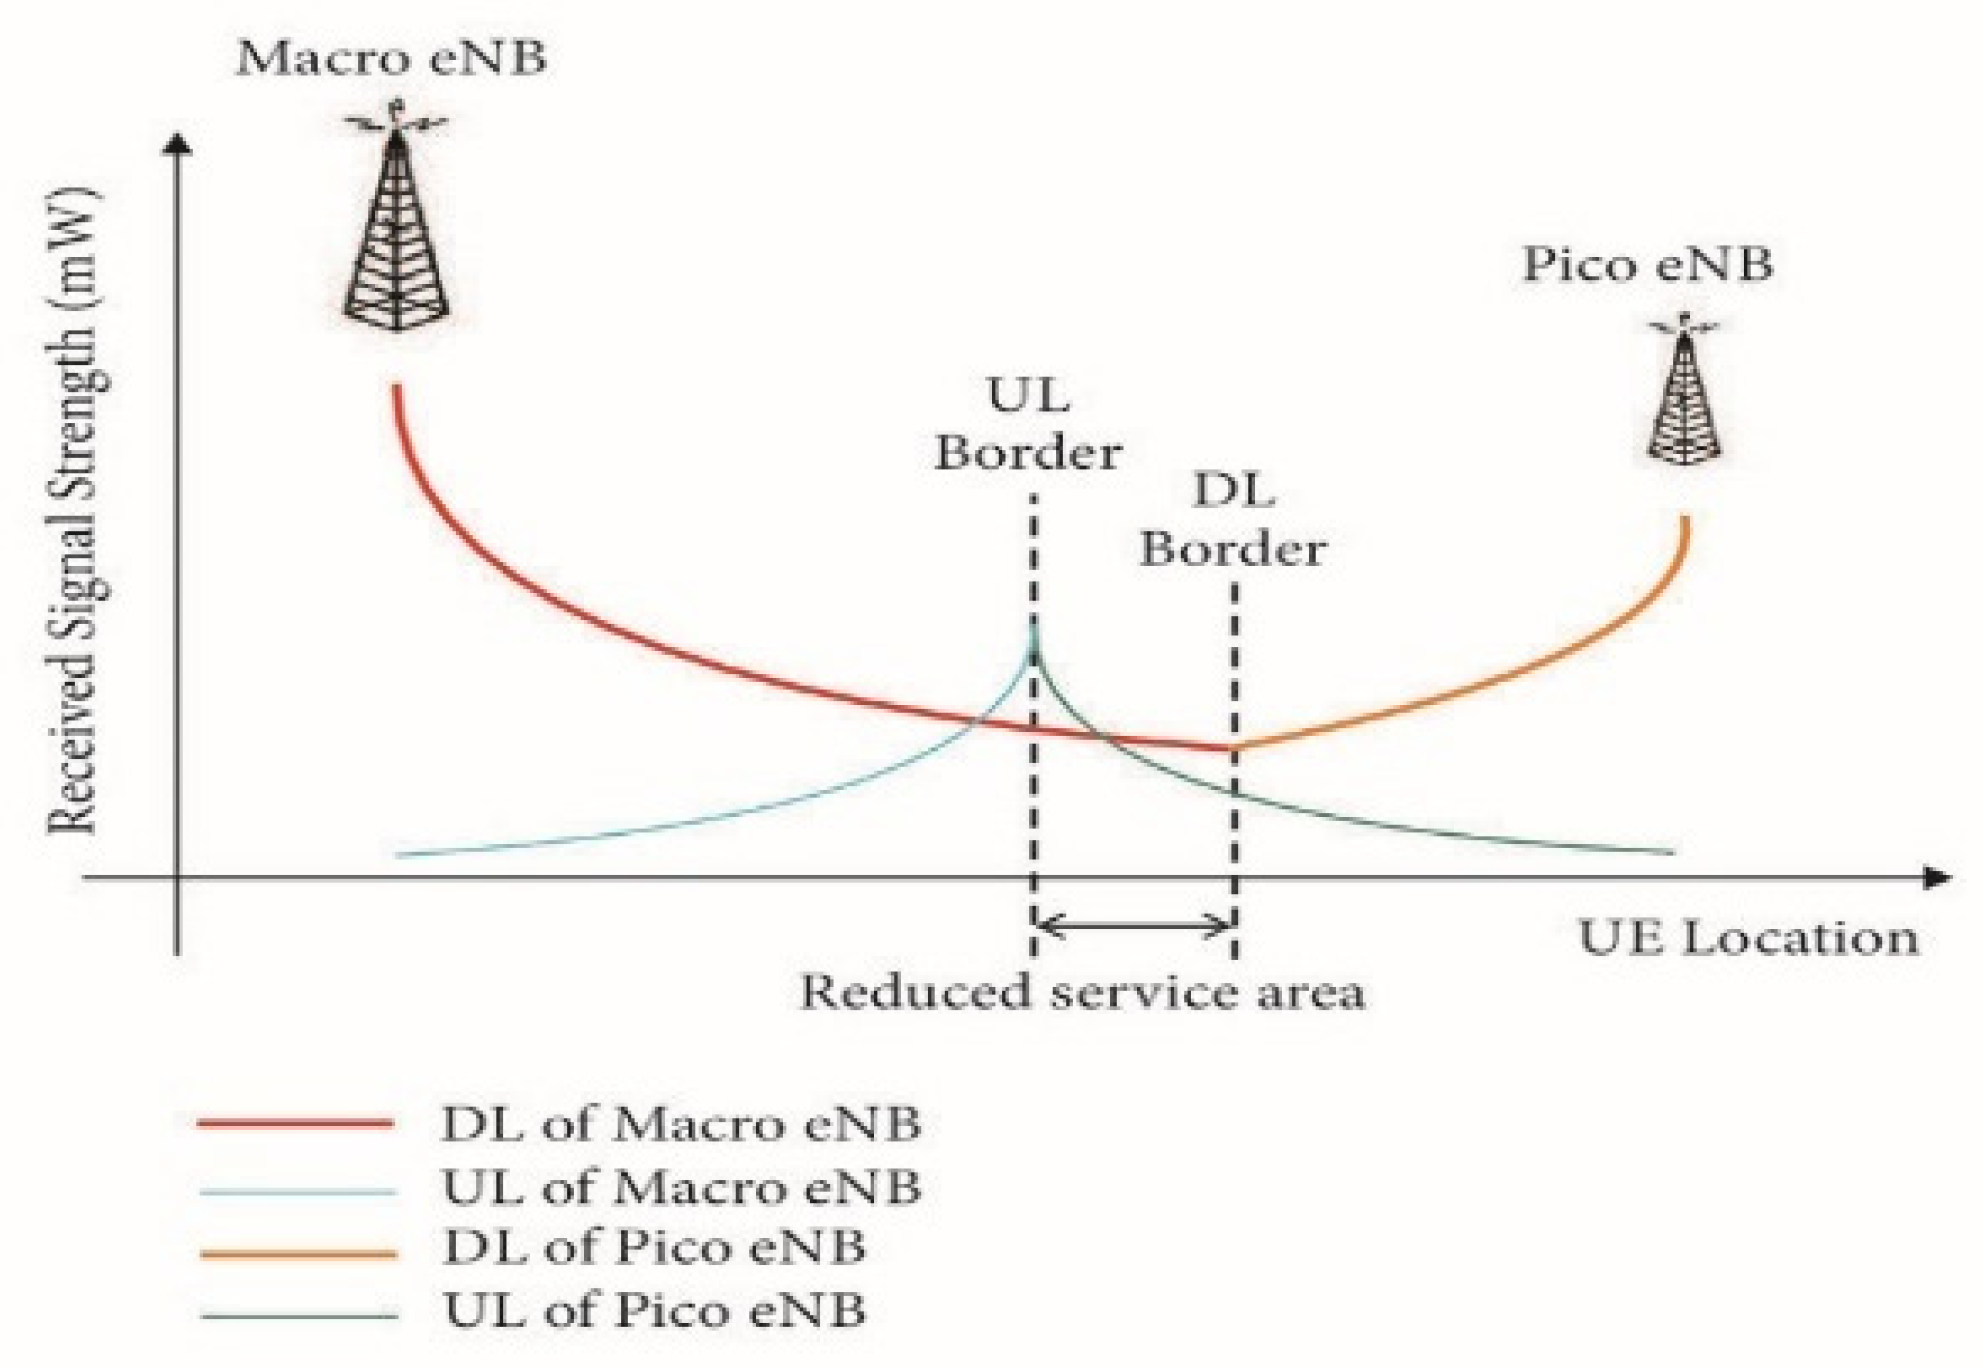
DUDe enables a user equipment (UE) to connect to different BSs for the uplink (UL) and downlink (DL), departing from the conventional coupled association model where the same BS handles both directions. This flexibility allows the UE to associate with the BS that provides the best DL signal quality while transmitting through the BS that minimizes uplink transmission power. As a result, DUDe can significantly reduce the average UE transmit power, enhance UL signal quality, and alleviate congestion on the macro layer—ultimately contributing to lower network-wide energy consumption and improved resource utilization [
19,
20,
21].
The DUDe paradigm incorporates a data-driven and system-aware perspective on energy optimization. By analyzing UL and DL channel conditions, path loss, and SNR distributions, the system can dynamically identify the optimal BS pair for each UE, balancing energy expenditure and throughput efficiency. Advanced analytical and optimization techniques, such as machine learning (ML) and artificial intelligence (AI), have been increasingly integrated into DUDe-based association schemes to manage large datasets and predict optimal user–BS mappings under changing traffic and mobility patterns. These intelligent association frameworks not only improve link reliability but also reduce redundant transmissions and energy wastage, leading to substantial overall efficiency gains [
22,
23].
A comprehensive understanding of network topology and power dynamics remains essential for maximizing DUDe’s energy benefits. Studies employing simulation-based evaluations and analytical modeling demonstrate that DUDe effectively redistributes traffic from heavily loaded macro cells toward underutilized small cells, thereby decreasing both UE transmit energy and base station operational load. This redistribution also enhances network fairness and user experience while maintaining balanced spectral utilization. Through methods such as power audits, performance profiling, and cross-layer modeling, network operators can further fine-tune DUDe parameters to achieve optimal trade-offs between energy savings and system throughput.
In summary, the DUDe framework offers an integrated, energy-conscious approach to user association in 5G HetNets. It merges the analytical rigor of energy-efficient system design with real-time adaptability and intelligent decision-making. By enabling flexible UL/DL connections and leveraging modern data-driven tools, DUDe supports the transition toward greener, more sustainable wireless infrastructures, providing tangible energy reductions without compromising quality of service [
24,
25].
3. Mathematical Model
In order to determine the minimum distance between each user and the antennas of the various BSs the mathematical model defined in 3GPP TR 38.901 Section 7.4.1 [
26] is used (the analysis of the above mathematical model is out of the scope of this journal):
After determining the minimum distance from each type of antenna for every user, we proceed to calculate the Signal-to-Noise Ratio (SNR) to identify the antenna type that is closest in proximity to establishing a connection. The mathematical expression for SNR is as follows:
where P is the average power. It is essential that both quantities are measured at the same point—or at equivalent points—within the system and across the same bandwidth to ensure a valid comparison. The SNR serves as a critical metric in communication systems, quantifying the clarity of the received signal relative to the background noise, and is directly related to system performance parameters such as data throughput, error rates, and overall signal integrity.
In the next step, we proceed to transform SNR values, typically expressed in decibel milliwatts (dBm), into mW. This conversion is necessary to evaluate the energy consumption of DUDe and DUCo technologies, considering the distance and user distribution. The mathematical equation used for this conversion is as follows:
In the above equation, dBm represents the signal strength in decibels relative to one milliwatt, a common metric in wireless communications. However, while dBm is widely used to evaluate signal levels, it does not directly reflect the actual power consumption of a device or system. Conversely, watts (W) offer an absolute and physically interpretable measure of power, indicating the real amount of energy consumed or delivered by a device.
It is important to note that while there is a correlation between dB and watts in the context of 5G networks, they serve different purposes within the system. dBm primarily represents signal strength, whereas watts are a direct measure of power consumption. This method is applied in the experiments outlined in
Section 7. In addition, this research starts by using a well-established mathematical model to find the closest antenna to each user. This step is key for accurately calculating the SNR, which in turn shows the quality of the connection by comparing the signal power to the noise level. Furthermore, by converting the SNR from dBm to mW, the work makes it possible to directly relate signal measurements to energy consumption. This approach allows for a clear comparison of the energy efficiency of technologies such as DUDe and DUCo. Overall, the study provides a straightforward method for assessing network performance in terms of both signal quality and power usage, laying the groundwork for further experiments in the field. Finally,
Appendix A presents mathematical derivations regarding this section.
4. Algorithm Analysis
This section delineates two algorithms (Algorithms 1 and 2) crafted for the scrutiny of energy consumption and user allocation within a wireless communication system, characterized by the presence of diverse BS types (Macro, Micro, and Pico) and a multitude of UE. The overarching objective is to discern the most efficient strategy for linking users to BS, a decision contingent on variables such as path loss, SNR and the classification of BS. The algorithms’ comparative analysis of total energy consumption between decoupling and coupling approaches seeks to unveil which method optimally balances user allocation and energy efficiency.
4.1. Algorithm 1
In its initial phase, Algorithm 1 generates randomized positions for each UE. Subsequently, it employs the model detailed in 3GPP TR 38.901 Section 7.4.1 [
26] (implemented via the MATLAB R2022a nrPathLoss function). This model considers parameters like geographical scenario (e.g., urban microcellular environment), building height, street width, frequency, line-of-sight data, and the precise locations of both BS and UEs. These calculations yield path loss values, offering an estimate of the signal attenuation between BS antennas and UEs. The algorithm then computes the received power from each BS antenna, factoring in aspects like antenna gains, UE gains, UE’s transmitting power, and path loss. By considering the received power and network noise, the algorithm determines the SNR, which serves as a metric for the quality of the received signal. For further analysis, this SNR is converted from the logarithmic dBm scale to mW.
In addition to this, the algorithm calculates energy consumption associated with both downlink/uplink decoupling and coupling approaches. It systematically traverses the UEs and distinct scenarios, assessing the SNR disparities among Macro, Micro, and Pico BS. These SNR assessments inform the algorithm’s energy allocation adjustments, potentially involving the deduction of energy consumption linked to the chosen BS. The algorithm then proceeds to compare the aggregate energy consumption for both decoupling and coupling. Should the cumulative energy consumption for decoupling surpass that of coupling, the algorithm deduces that downlink/uplink decoupling achieves superior user allocation and energy efficiency. Conversely, if the overall energy consumption for coupling is less, it implies that downlink/uplink coupling represents the more efficacious strategy.
For consistency, the maximum uplink transmit-power constraint (20 dBm or 30 dBm) is also applied in the conventional DUCo association, even though it is not explicitly included in the algorithm steps. This ensures a fair baseline for comparison with DUDe in Algorithm 2.
| Algorithm 1: Algorithm for comparison energy consumption for DUCo and DUDe scenarios.
|
|
Step 1: Initialization |
| The simulator initializes the number of UEs, the number of BSs, the simulation duration, and the number of snapshots. It loads the BS coordinates, carrier frequency, bandwidth, and noise figure. A fixed random seed ensures that the results can be reproduced. |
|
Step 2: UE Placement and Channel Generation |
| At each snapshot, every UE is randomly positioned within the service area. Line-of-sight conditions are assigned according to the 3GPP TR 38.901 probability model. Using the MATLAB nrPathLoss function with the configured scenario parameters (urban macro, building height, street width, frequency), the path loss for each BS–UE pair is calculated. The received power is then obtained from the UE transmit power, BS antenna gain, UE gain, and path loss. |
|
Step 3: SNR Computation |
| Noise power is calculated from the bandwidth and receiver noise figure. For each BS–UE link, the SNR in dB is computed as the difference between received power and noise power. When necessary, the SNR is converted to a linear scale. |
|
Step 4: Coupled Association (DUCo) |
| Each UE selects the BS that provides the highest SNR and uses the same BS for both uplink and downlink. The energy consumption is determined by summing the transmit power and downlink power contributions. This process is repeated for all UEs and snapshots to obtain the total energy for the DUCo scenario. |
|
Step 5: Decoupled Association (DUDe) |
| Each UE selects one BS for downlink the BS that provides the highest downlink SNR and another BS for uplink based on the minimum path loss (equivalently, the maximum received uplink signal power). Since the UE transmit power is capped, minimizing the path loss is equivalent to achieving the highest possible uplink SNR. Energy consumption is computed in the same manner as in DUCo, with the difference that uplink and downlink associations may correspond to different BSs. For fairness, the uplink transmit power is constrained by the same maximum cap of 20 dBm or 30 dBm applied uniformly across all simulations. The total DUDe energy is obtained by aggregating the results across all UEs and snapshots. |
|
Step 6: Performance Comparison |
| At the end of all snapshots, the aggregate energy consumption of DUCo and DUDe is compared. The scenario with the lower total energy consumption is considered more energy efficient. |
|
Step 7: Complexity |
| The computational cost grows proportionally with the number of BSs (B), number of UEs (N), and number of snapshots (S), i.e., O(B × N × S). |
4.2. Algorithm 2
In Algorithm 2, we embark on the evaluation of two distinct UE distribution scenarios within the network: the DUCo scenario and the DUDe scenario. The algorithm initiates by initializing essential variables, encompassing the count of Macro, Micro, and Pico cells, the number of UEs, and the number of snapshots employed in the simulation. Subsequently, for each UE and for every snapshot under consideration, the algorithm proceeds to compute the SNR for each UE within the network. These SNR values are systematically stored in a dedicated matrix.
Moving forward, Algorithm 2 calculates the standard SNR value for each UE in every snapshot by determining the mean SNR value across all snapshots. These computed standard SNR values are meticulously recorded within a matrix aptly named “standard SNR.” After this, the algorithm delves into the computation of transmitting power values for each UE in each snapshot, systematically capturing these values within a matrix named “transmit power”.
The pivotal element of this algorithm centers on the formulation of both the DUCo and DUDe scenarios, realized through a strategic dispersion of UE across the network. In the context of the DUCo scenario, the algorithm prescribes the transmission power for each individual UE. This prescription leans towards adopting the last recorded value in the transmit power matrix pertaining to that particular UE. However, in scenarios where this value surpasses a predetermined threshold (typically specified at 20 or 30 dBm in our simulation setup), the algorithm steps in to restrict the transmit power to adhere to the pre-established threshold.
It is worth underscoring that, for the DUCo scenario, the algorithm undertakes the calculation of transmit power for each UE based on the typical SNR values. This calculation unfolds over multiple snapshots; a practice often observed in our simulations (typically numbering 1000 snapshots). This repeated simulation serves the purpose of attenuating the potential influence of stochastic variations or uncertainties, as comprehensively detailed in Algorithm 2.
Final builds the implementation of two scenarios with meticulous attention to SNR and transmit power considerations, thus enhancing our understanding of the network’s performance in different user allocation scenarios.
| Algorithm 2: Algorithm for 20 dbm or 30 dbm Transmit Power.
|
|
Step 1: Initialization |
| The simulation defines the number of UEs, the number of BSs, and the number of snapshots. Two transmit power thresholds (20 dBm and 30 dBm) are set as limits. The simulator allocates memory for storing SNR, transmitting power, and energy values. |
|
Step 2: Snapshot Processing |
| For each snapshot, SNR values for every UE–BS pair are computed using the same procedure as in Algorithm 1. These values are stored to allow averaging across snapshots. |
|
Step 3: Average SNR Computation |
| For each UE, the average SNR with respect to each BS is calculated over all snapshots. These average values provide a stable estimate of link quality for power allocation. |
|
Step 4: Coupled Scenario (DUCo) |
| Each UE selects the BS with the highest average SNR for both uplink and downlink. The required transmitting power is derived from the link budget. If the required transmit power exceeds the chosen threshold (20 or 30 dBm), it is capped at that level. The resulting power values are summed up to obtain the total DUCo energy consumption. |
|
Step 5: Decoupled Scenario (DUDe) |
Each UE selects one BS for the downlink—the BS offering the highest downlink SNR—and another BS for the uplink based on the lowest required UE transmit power (equivalently, the highest uplink SNR). The transmitting power is computed in the same manner as in DUCo and is capped at the defined threshold (20 dBm or 30 dBm) for fairness.
The capped power values from all UEs and snapshots are then aggregated to obtain the total DUDe energy consumption. |
|
Step 6: Comparative Evaluation |
| At the end of all snapshots, the total energy consumption of DUCo and DUDe is compared. The scenario with the lower total consumption is reported as the most energy efficient. |
|
Step 7: Impact of Power Limits |
| Running the algorithm with both 20 dBm and 30 dBm caps shows how transmitting power restrictions influence the relative efficiency of DUDe and DUCo. |
Given a fixed number of base station types and sites (2 macro, 4 micro, 8 pico), the implementation scales linearly with the number of users N and snapshots S. Per snapshot, the path-loss stage evaluates O(BN) links, and the subsequent UL/DL SNR and target-power passes perform several additional O(BN) sweeps. Aggregated over all snapshots, the total runtime is therefore Θ(cBNS), where c is a modest constant reflecting the multiple passes for DUCo/DUDe and bandwidth generation. The memory footprint is dominated by storing per-link histories, giving Θ(BNS) space. For the parameters used here this amounts to tens of millions of double-precision entries across arrays, i.e., multiple gigabytes in aggregate, so streaming or per-snapshot reduction can markedly reduce peak memory without changing asymptotic time.
5. Simulation Environment
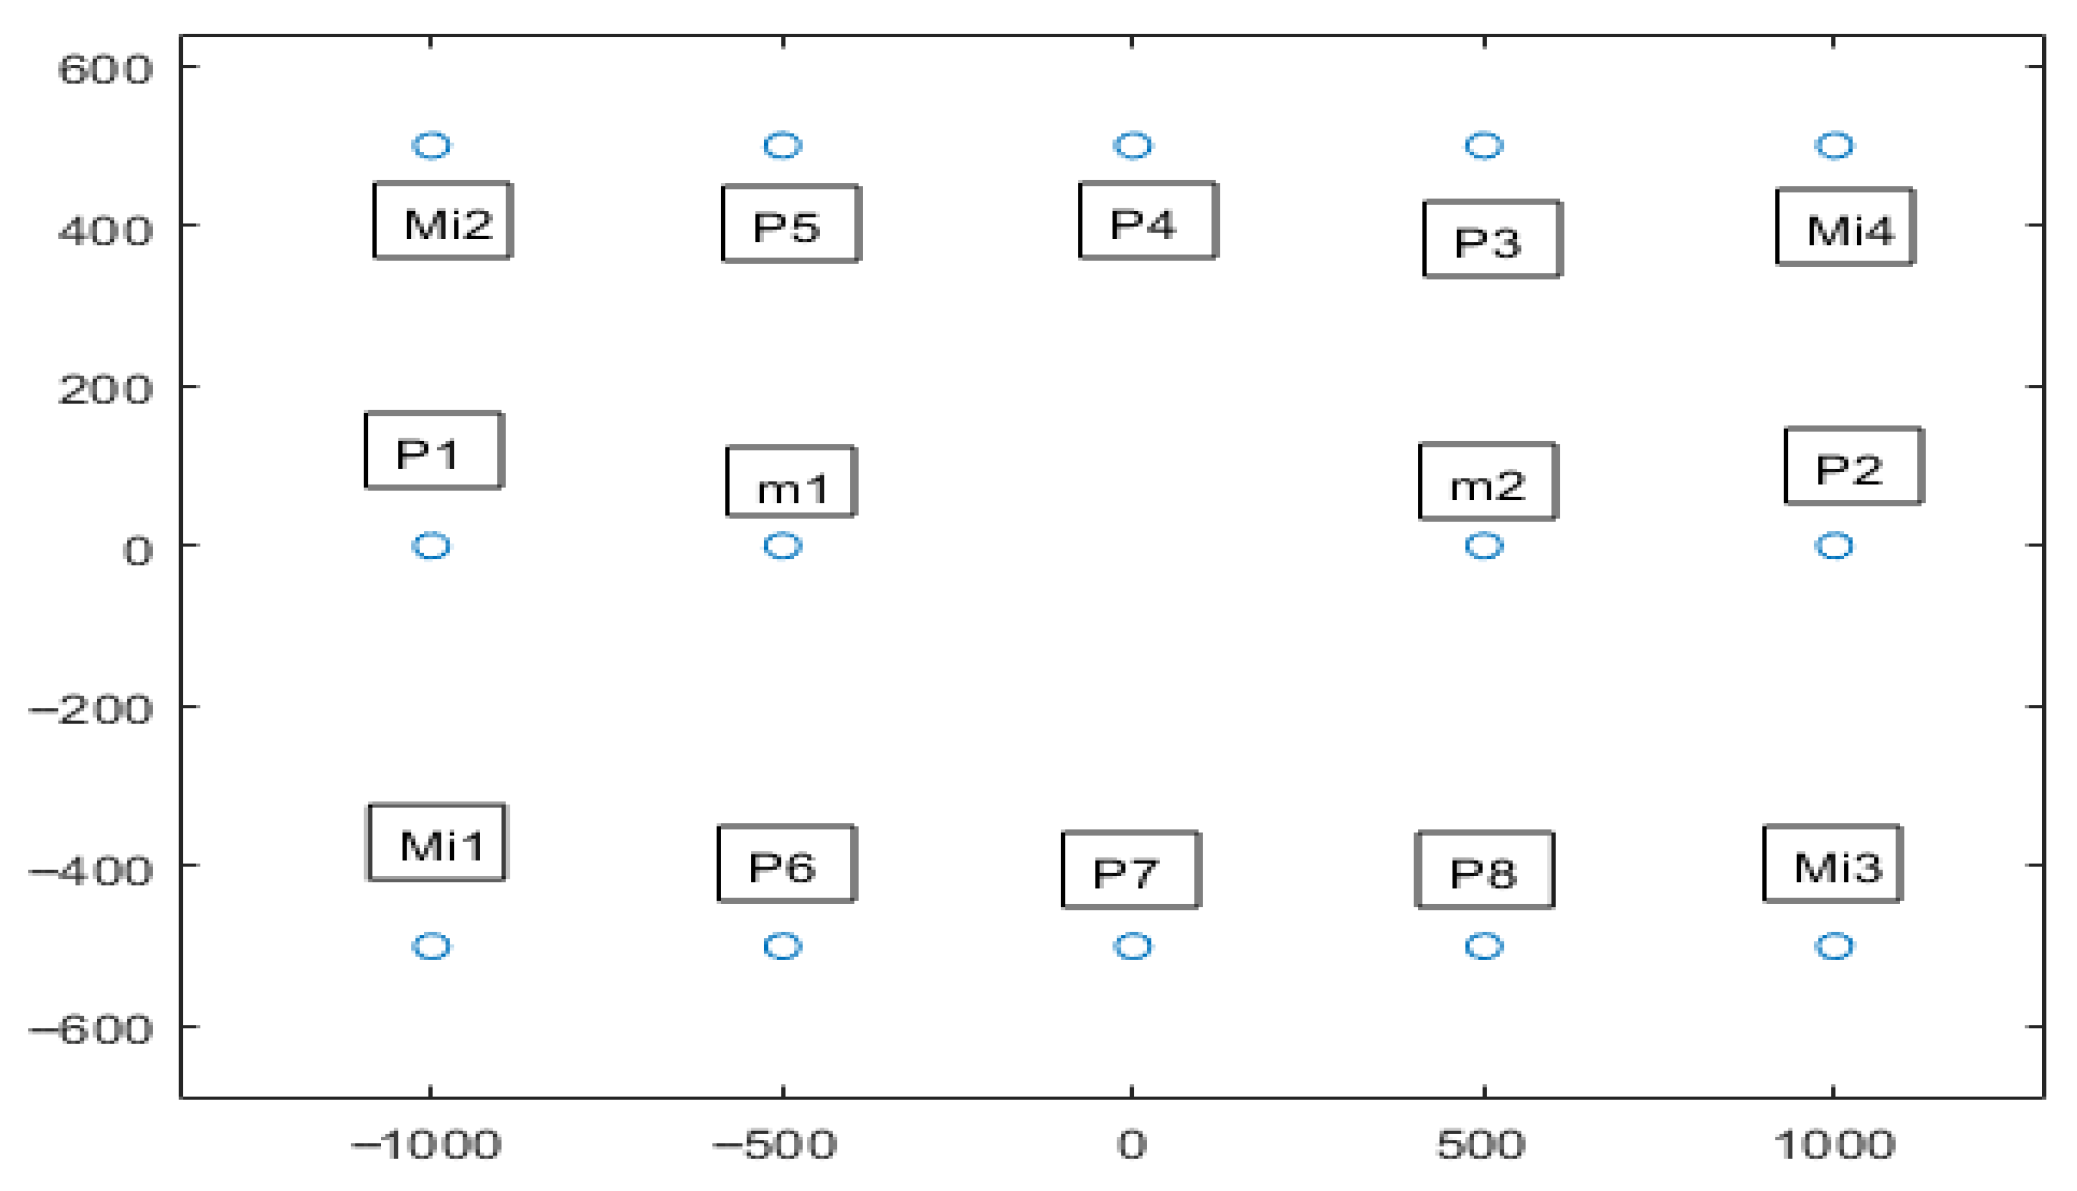
We have established a 5G heterogeneous network to facilitate our simulation endeavors, encompassing a 2 × 2 km urban square area. Within this network, we have integrated three distinct types of BSs: Macro BS, Micro BS, and Pico BS. This diversity in BS types is pivotal for optimizing coverage and capacity across the urban landscape (more information in
Figure 1. In our network configuration, two strategically positioned Macro BSs reign at a height of 30 m. These Macro BSs exhibit robust transmission power at 45 dBm and a gain of 21 dBi. Their role is to provide expansive coverage over larger urban areas, typically serving wide area needs in urban environments. Additionally, we have deployed four Micro BSs within the network, situated at a height of 10 m. These Micro BSs operate at a slightly lower transmission power of 33 dBm and offer a gain of 10 dBi. Their purpose is to cater to smaller, high-density areas, often found in settings like shopping centers or office complexes. Furthermore, our network incorporates eight Pico BSs, strategically located at a height of 5 m. Pico BSs operate with the lowest transmission power among the three BS types, set at 24 dBm, and provide a gain of 5 dBi. Their primary role is to ensure localized coverage and address coverage gaps in areas with high user demand, such as indoor environments or bustling streets. This heterogeneous amalgamation of BSs, varying in heights, transmission powers, and gains, is designed to optimize coverage and capacity for users across different zones of the urban square. This setup enhances the efficiency of resource distribution, facilitating effective wireless communication services in diverse scenarios within the network. The selected path loss model is configured for RMa scenario and UMa for Urban scenario, assuming an average building height of 7 m and a street width of 25 m. We employ a carrier frequency of 3.5 GHz to capture realistic mid-band 5G propagation characteristics and UEs randomly distributed throughout the region.
To guarantee reliable communication, users are placed randomly throughout the network area, keeping a small separation of about 1 or 2 m between them. This spacing helps avoid unrealistic overlap and reduces the risk of interference between closely positioned users. The setting assumes that all users are outdoors in an urban environment, rather than inside buildings. This placement of users is achieved with the nrPathLoss function, as explained in the algorithm analysis section. Matlab nrPathLoss function ensures a realist urban simulation environment. For a visual representation of our network layout,
Figure 2 provides a spatial illustration of the BS arrangement. Macro BSs are strategically centralized, while the smaller Micro BSs and Pico BSs encircle them. This strategic layout ensures comprehensive coverage through Macro BSs, while the Micro BSs and Pico BSs address the needs of smaller, localized areas.
Table 1 offers a concise summary of the principal parameters defining our heterogeneous network. It provides an overview of the BS types, their respective heights, transmission powers, and gains. These parameters are pivotal in shaping the coverage range, signal strength, and overall performance of each BS type within the network. To avoid any potential confusion, it is important to highlight that we have maintained consistency by employing the same topology and network parameters as in our previous research. However, it is essential to underscore that despite these similarities, we are indeed discussing a distinct approach and methodology for conducting our current experiments.
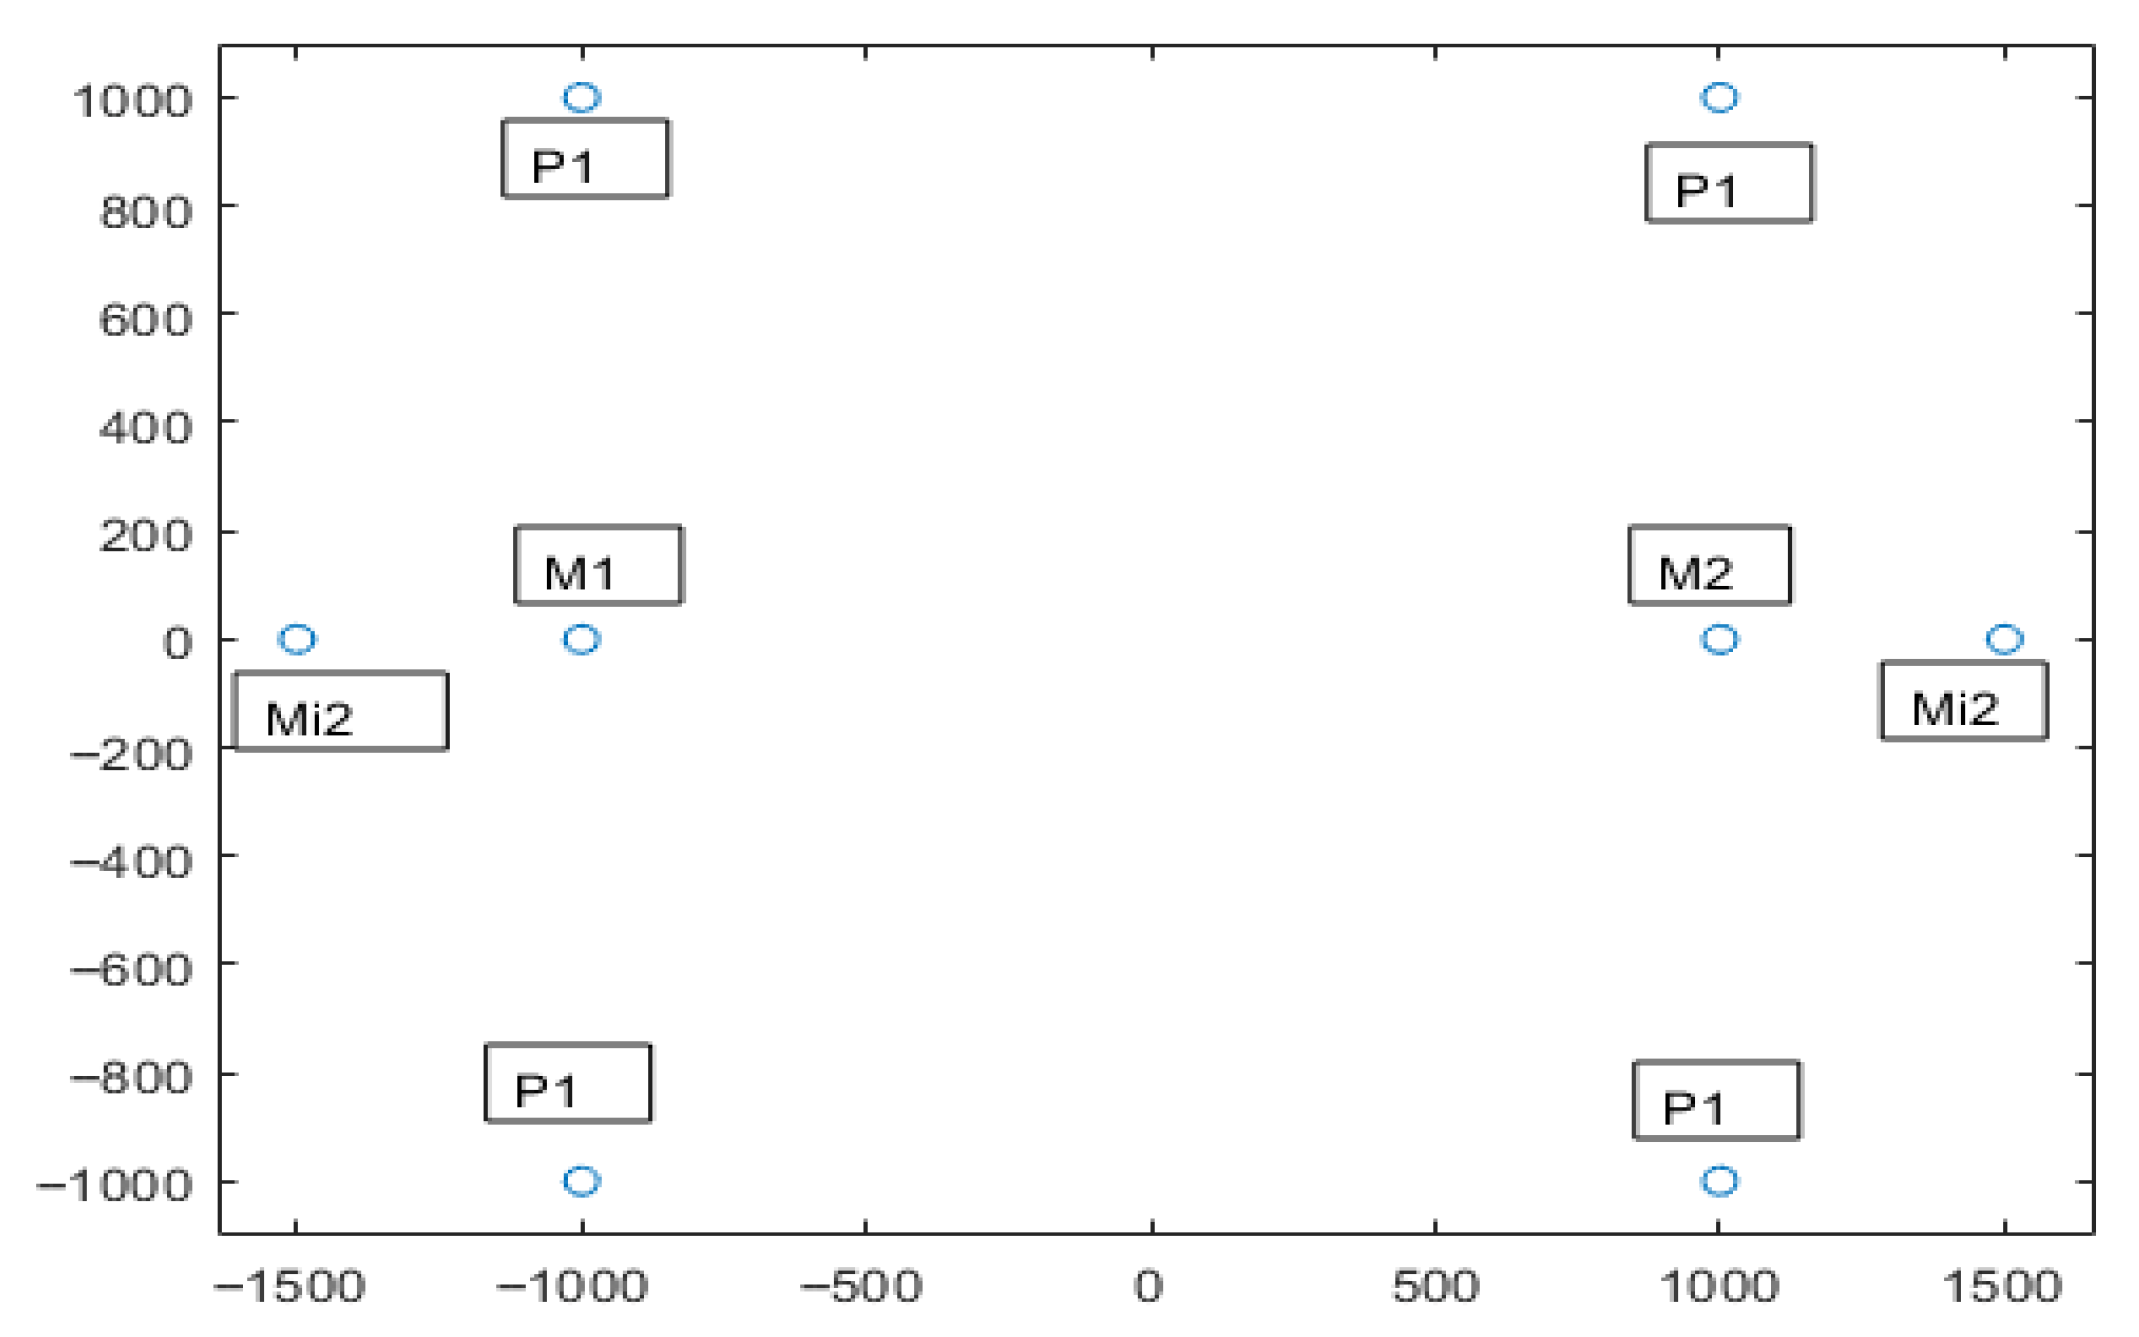
Now, transitioning to a rural context, we have designed a 4 × 4 provincial area with a distinct topology, as visually depicted in
Figure 3. This topology was configured with adjustments, involving a reduction in the number of antennas, resulting in 2 macro-BSs, 2 micro BSs, and 4 pico BSs.
This particular topology is tailored to a rural landscape, created deliberately to serve as a basis for comparative analysis alongside our previous scenarios set in urban areas. The primary aim here is to conduct experiments that juxtapose the DUDe and DUCo technologies when transitioning from an urban to a rural setting. These experiments are instrumental in shedding light on potential disparities in the performance and efficacy of these technologies across diverse environmental contexts.
To facilitate a meaningful comparison between DUDe and DUCo technologies, it is imperative to ensure the constancy of network parameters pertaining to antennas and UE within this new topology. These parameters, together with those from our initial urban setup, are comprehensively detailed in
Table 1. The goal is to present a side-by-side evaluation of DUDe and DUCo technologies in two contrasting geographical areas, while upholding uniformity in antenna and UE parameters.
The simulator converts per-link received power and noise into SNR under TR 38.901 channel settings. For energy comparisons, it aggregates UE transmit-related power and downlink reception contributions across tiers to obtain relative energy deltas between DUCo and DUDe under identical topology, traffic, and power-cap conditions. The journal does not include a full base station operational model (e.g., base/idle power, load-dependent PA efficiency) in the reported numbers; instead, this limitation is discussed in
Section 8 which outlines how to integrate such models in future work. This choice isolates the association effect of DUDe versus DUCo without conflating it with hardware-specific constants.
It is worth mentioning that we use fixed uplink UE power caps of 20 dBm and 30 dBm to probe two representative regimes (moderate vs. high UE power budgets) while keeping all other parameters identical across DUCo and DUDe. Fixed caps eliminate confounding due to per-UE power adaptation and allow us to attribute energy differences to the association policy alone. Adaptive UL power control is important in practice, but it introduces feedback between link conditions and power that can mask the pure association effect we seek to measure in this article.
6. Evaluation Regarding Energy Consumption with Specific UE-SNR Values
In this section, the evaluation of energy consumption with respect to a specific UE-SNR value in Rural and Urban areas is presented. Understanding the intricacies of power usage in relation to varying UE-SNR values is critical for optimizing resource allocation and network performance. By analyzing the energy consumption patterns corresponding to different UE-SNR levels, the study aims to compare and ultimately highlight the superior technology between DUDe and DUCo.
6.1. Evaluation and Analysis for SNR = 20 dBm
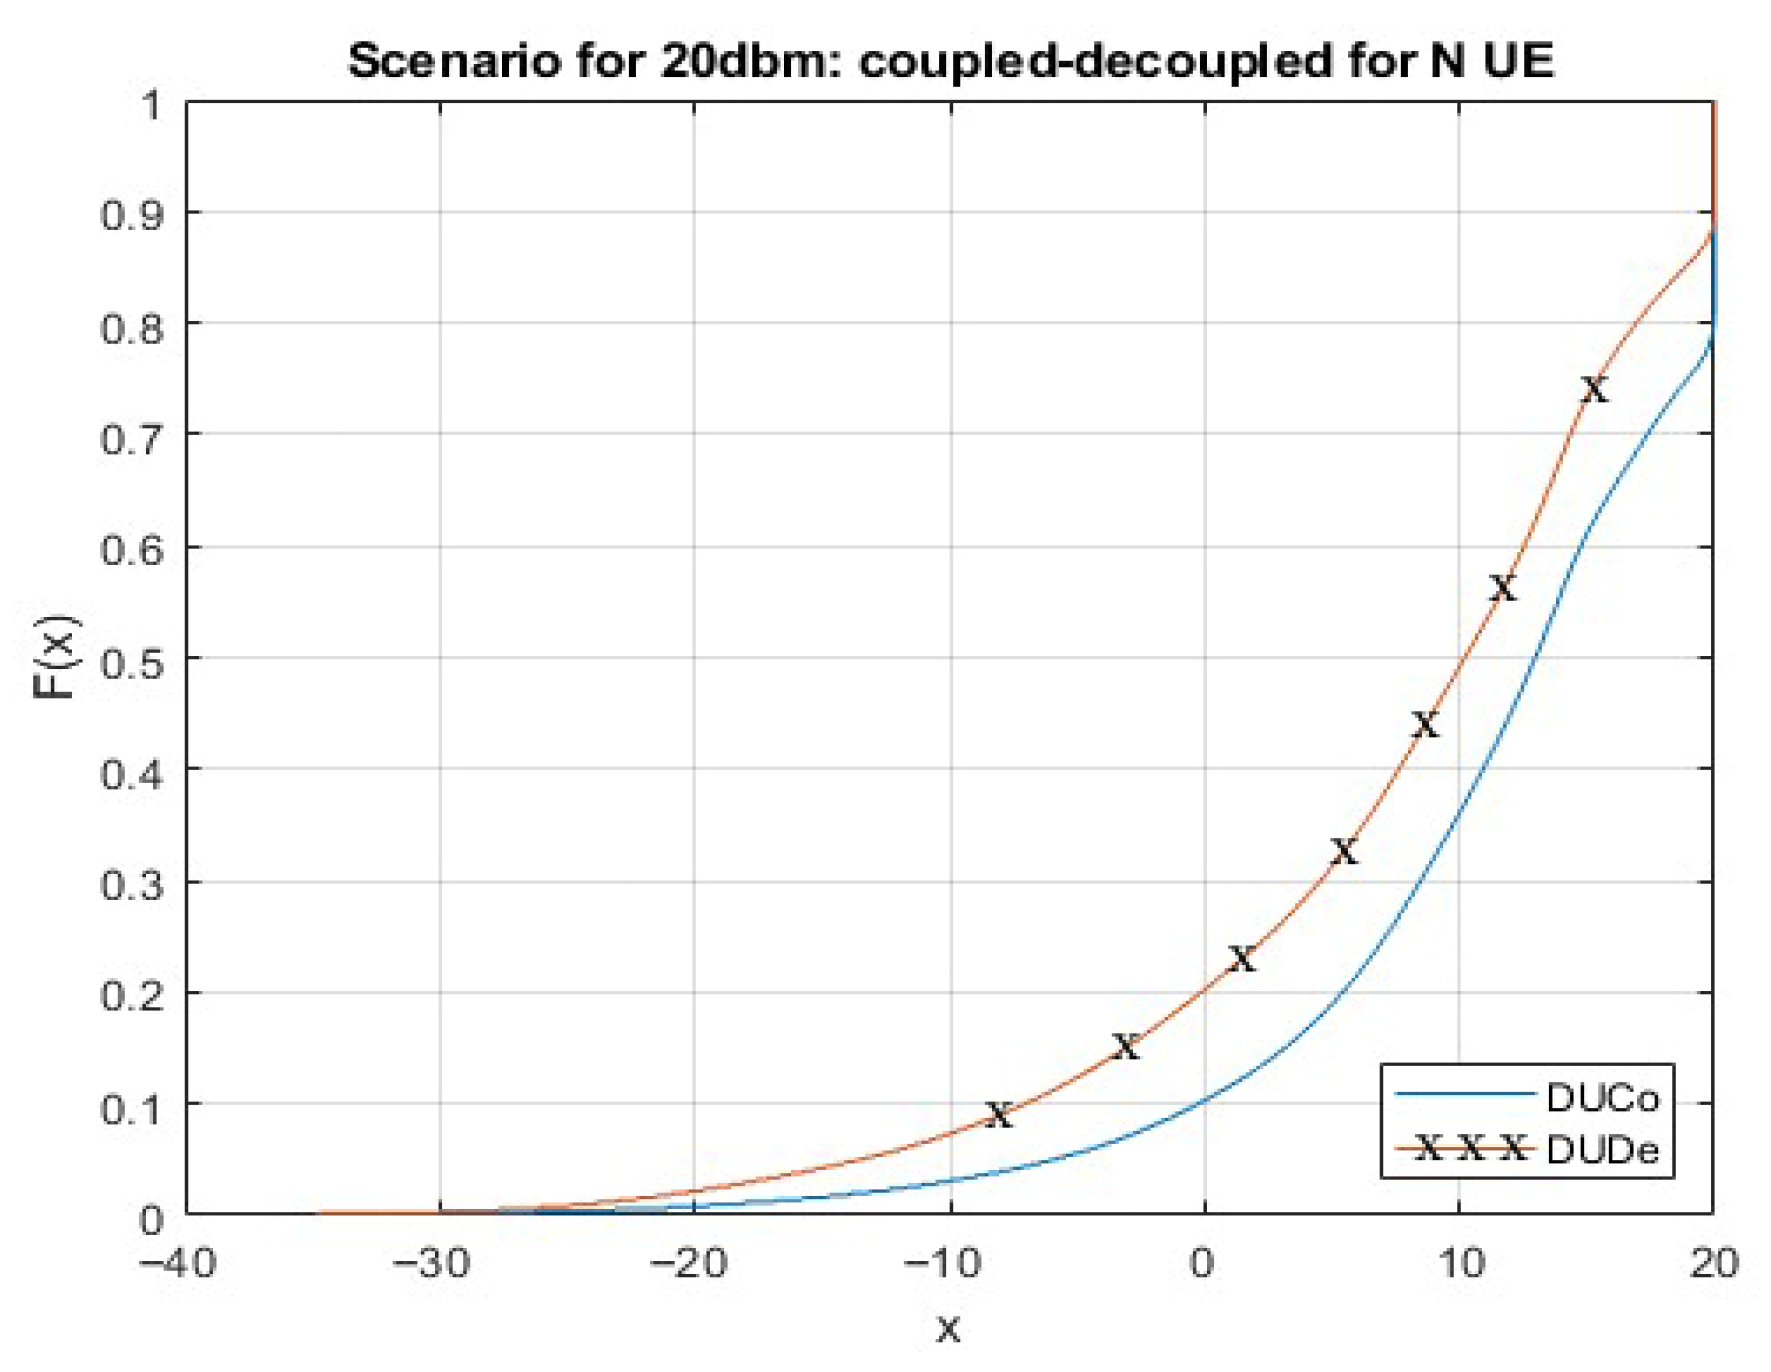
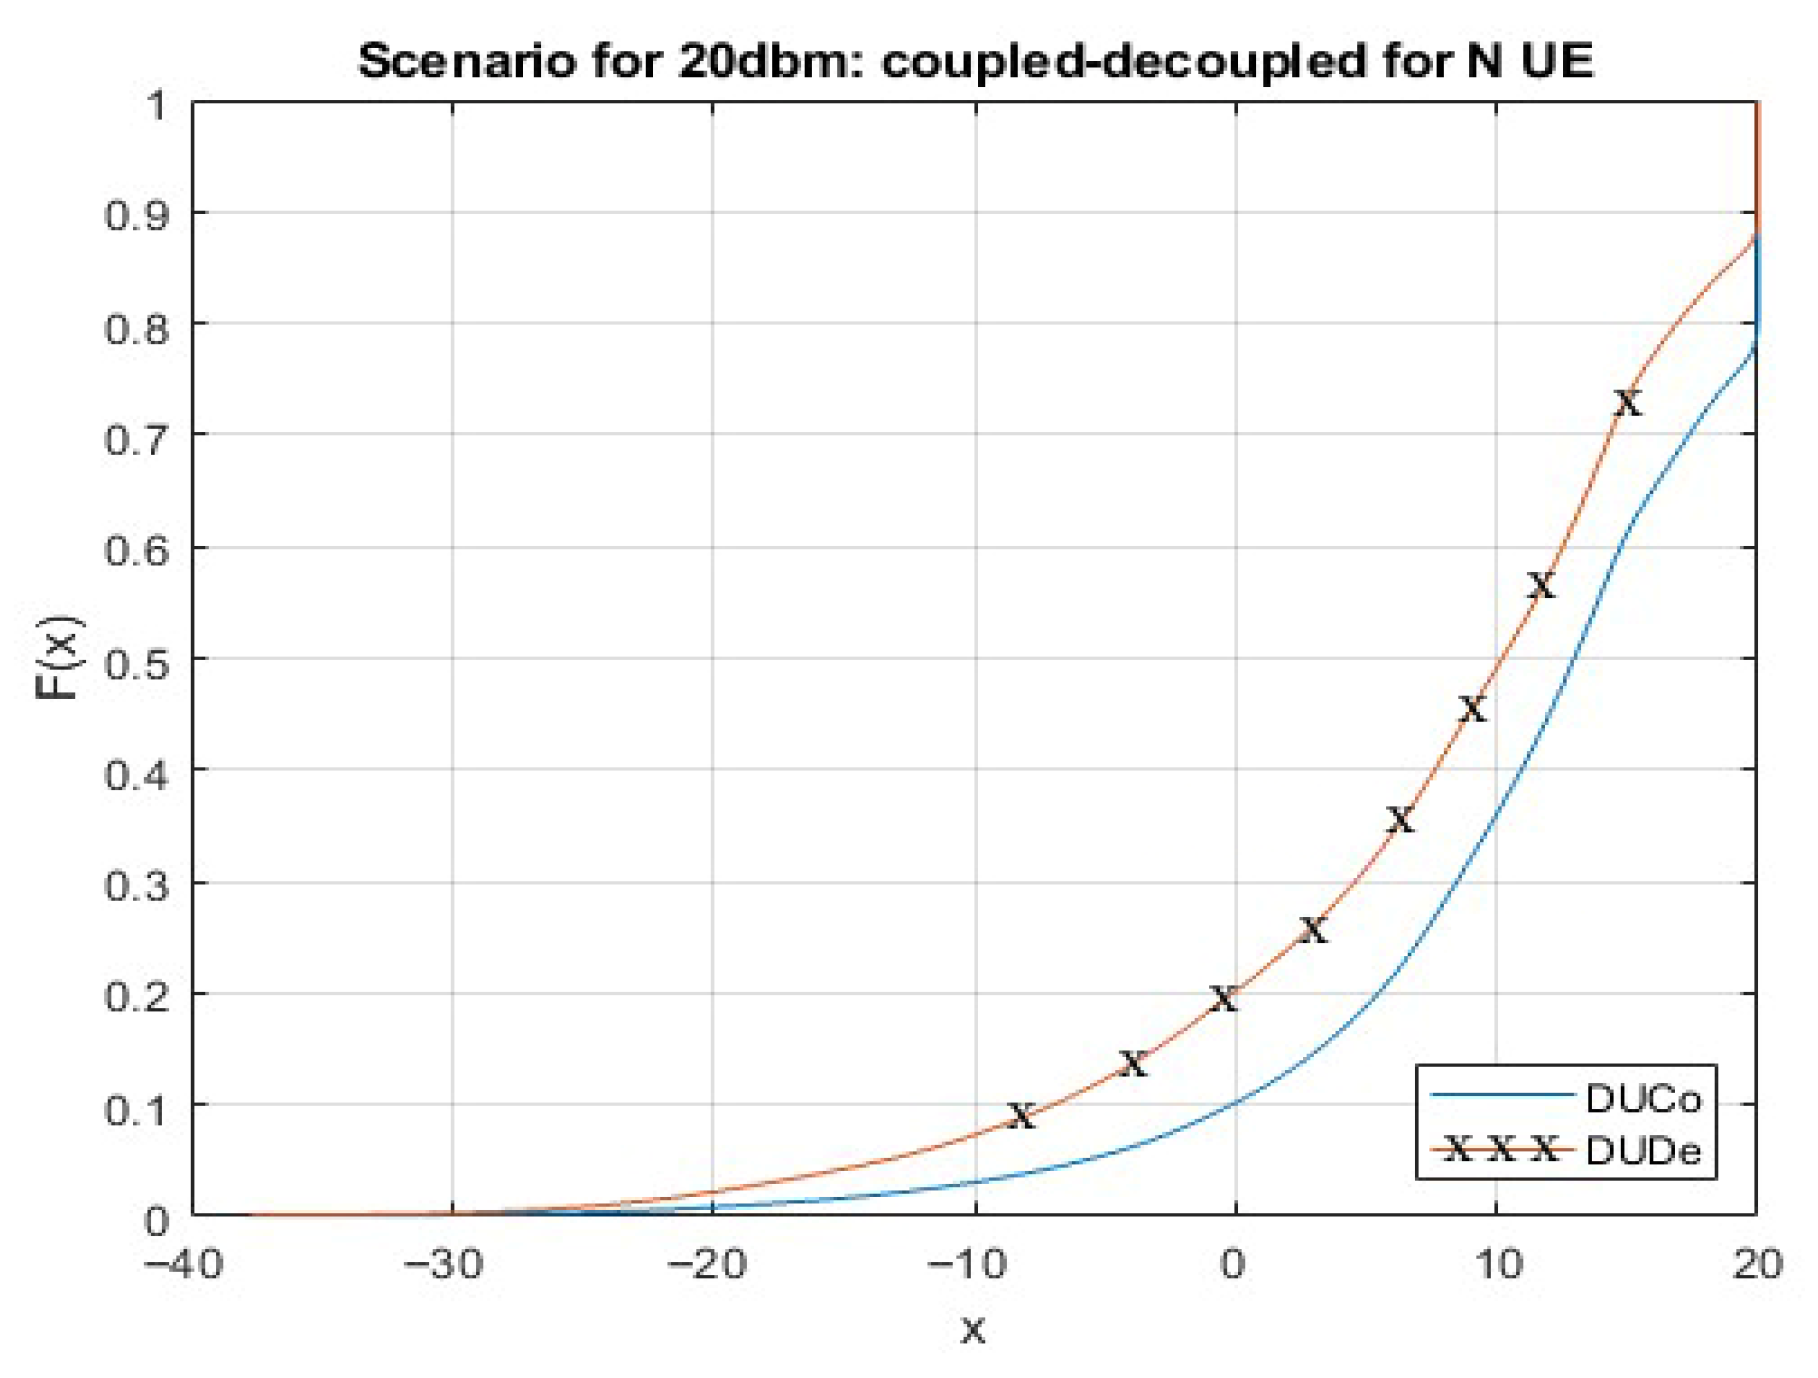
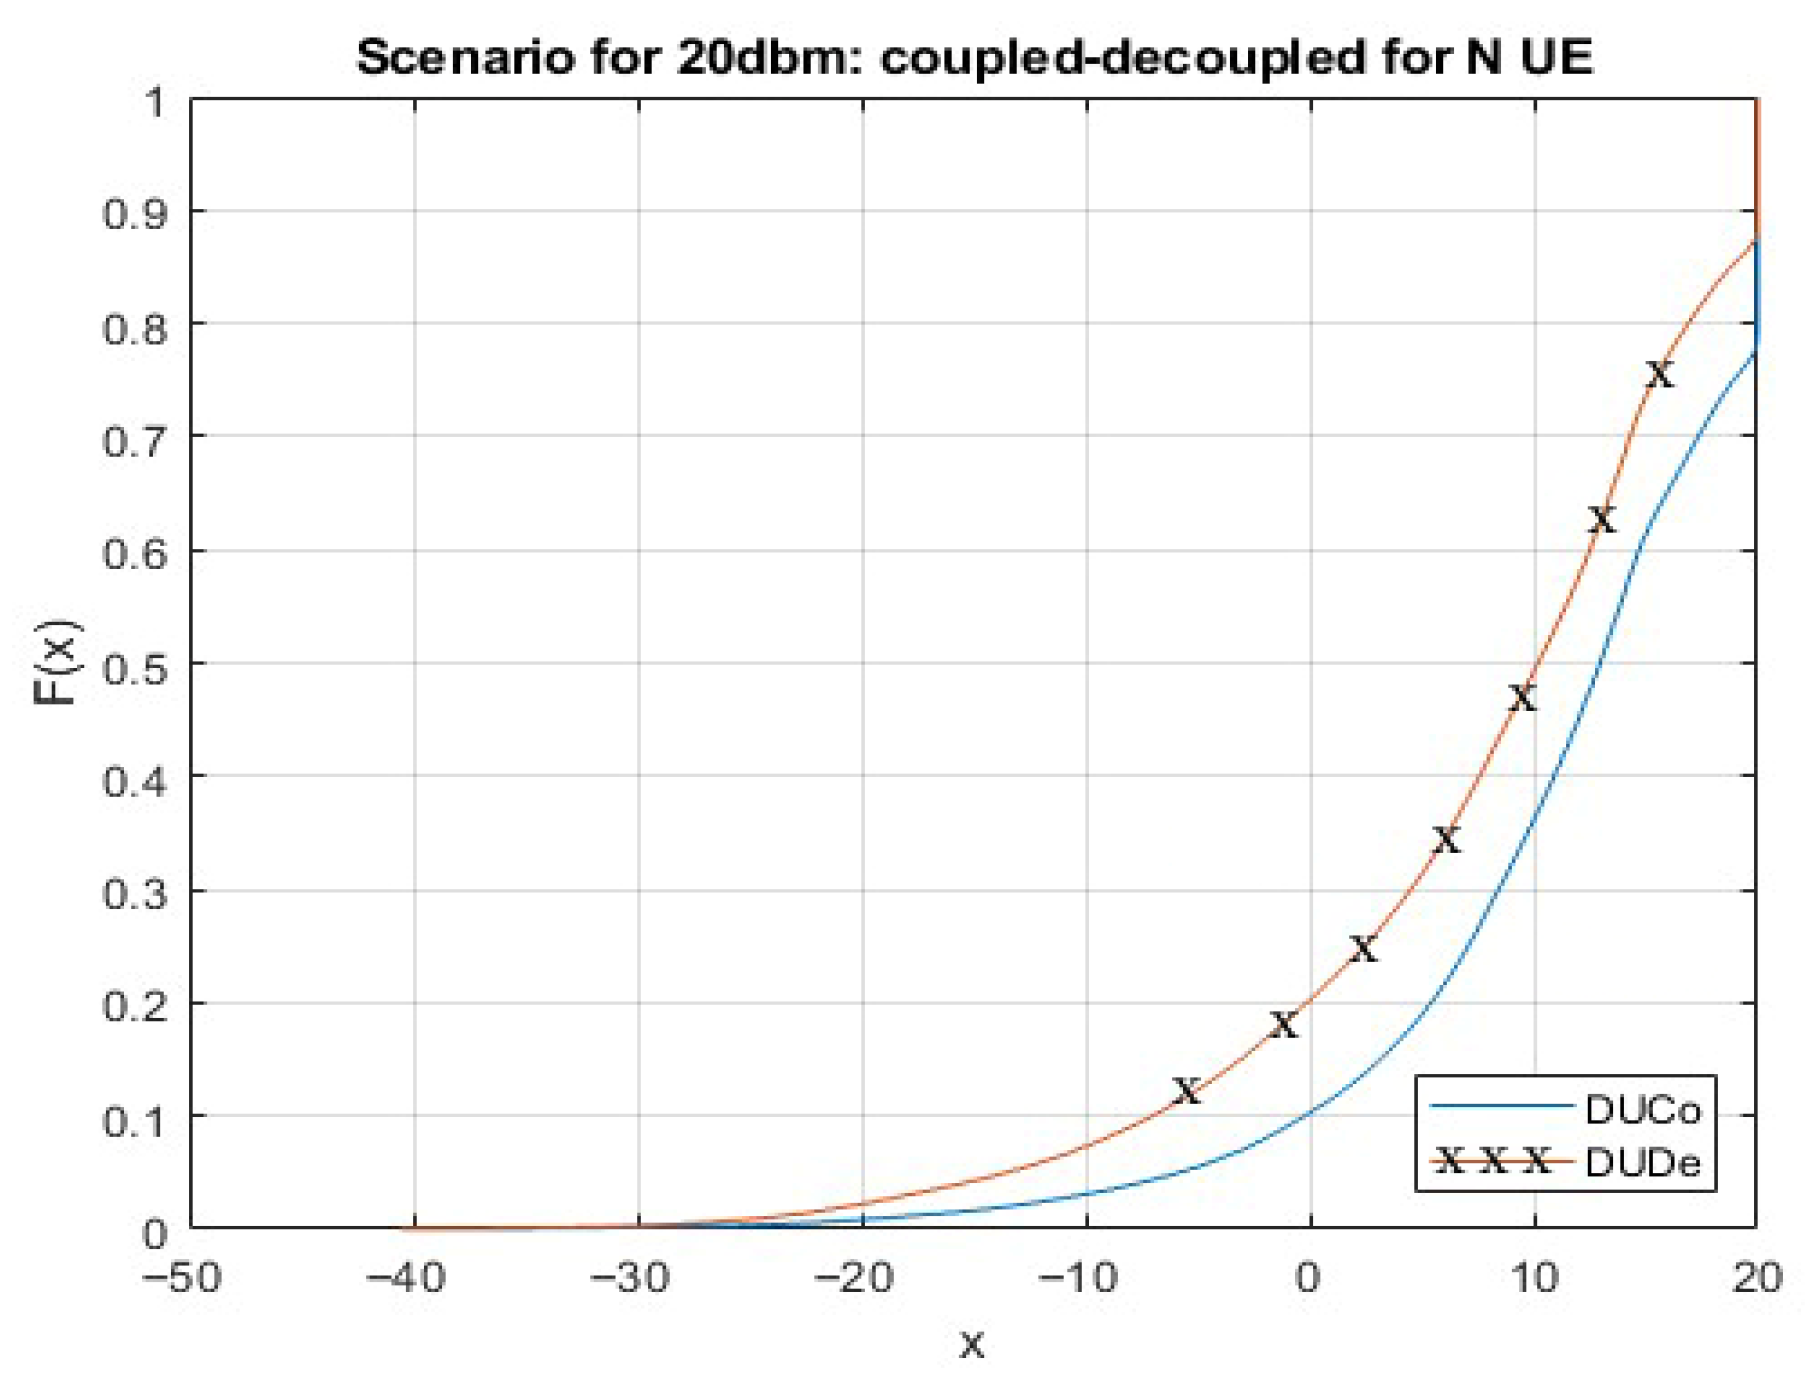
Within the framework of this evaluative scenario, a comparative analysis between the DUDe and DUCo methodologies is conducted, with a specific focus on energy efficiency. This analysis is carried out while maintaining the UE transmission power constant at 20 dBm. The results obtained from these evaluations are graphically presented in a series of illustrative figures, namely
Figure 4,
Figure 5 and
Figure 6.
In these graphical representations, the x-axis serves as the axis of variation, portraying the average transmission power of UE in decibels (dB). On the orthogonal y-axis, we observe the probability distribution signifying the success rates of the DUDe and DUCo scenarios. Our carefully orchestrated scenario successfully attains a noteworthy objective: achieving equivalent outcomes while consuming less transmission power, a feat of utmost significance within the intricate domain of mobile telecommunications.
Upon a comprehensive review of the graphical insights, it becomes readily apparent that the DUDe methodology consistently outperforms its DUCo counterpart in terms of the likelihood of establishing successful connections. An illustrative case presents itself with UE transmit power set at 10 dB, wherein the DUDe method attains a 50% success rate, whereas the DUCo method, across three simulations encompassing 500, 1000, and 2000 users, records success rates that fall below the 40% threshold. This granular analysis underscores the persistent trend of DUDe technology maintaining a consistent advantage of no less than 20% in terms of successful connections compared to the DUCo approach, a phenomenon that substantiates the notion of DUDe’s superior reliability and enhanced user connectivity.
Furthermore, it is plausible to assume that the journal accompanying this analysis includes probability diagrams that intricately depict the probabilities of successful connections for both DUDe and DUCo technologies. These illustrative representations serve to underscore the demonstrable prowess of DUDe, further solidifying the case for its superiority in terms of performance. It is imperative to emphasize that a higher rate of successful connections achieved through DUDe technology inherently translates into a reduction in energy consumption. This is attributed to the inherent efficiency of successful connections, requiring fewer retransmissions and consuming fewer resources in energy-intensive signaling processes. Collectively, these attributes contribute to a noticeable reduction in the overall energy footprint. Considering the specific context of an SNR of 15 dB, the probability diagram meticulously elucidates the favorable characteristics of the DUDe method, boasting an 80% likelihood of low power consumption, in stark contrast to the primary DUCo technology, which lags at 62%. This discernible 29% difference serves as a potent testament to the DUDe methodology’s undeniable prowess in curbing power consumption while upholding consistent performance levels. Collectively, these findings offer compelling evidence in support of the proposition that DUDe, with its superior energy efficiency, stands as a formidable contender, aligning with the overarching goal of cultivating sustainable and ecologically conscious 5G network solutions a noble pursuit within the broader spectrum of technologically advanced research and development.
6.2. Evaluation and Analysis for SNR = 30 dBm
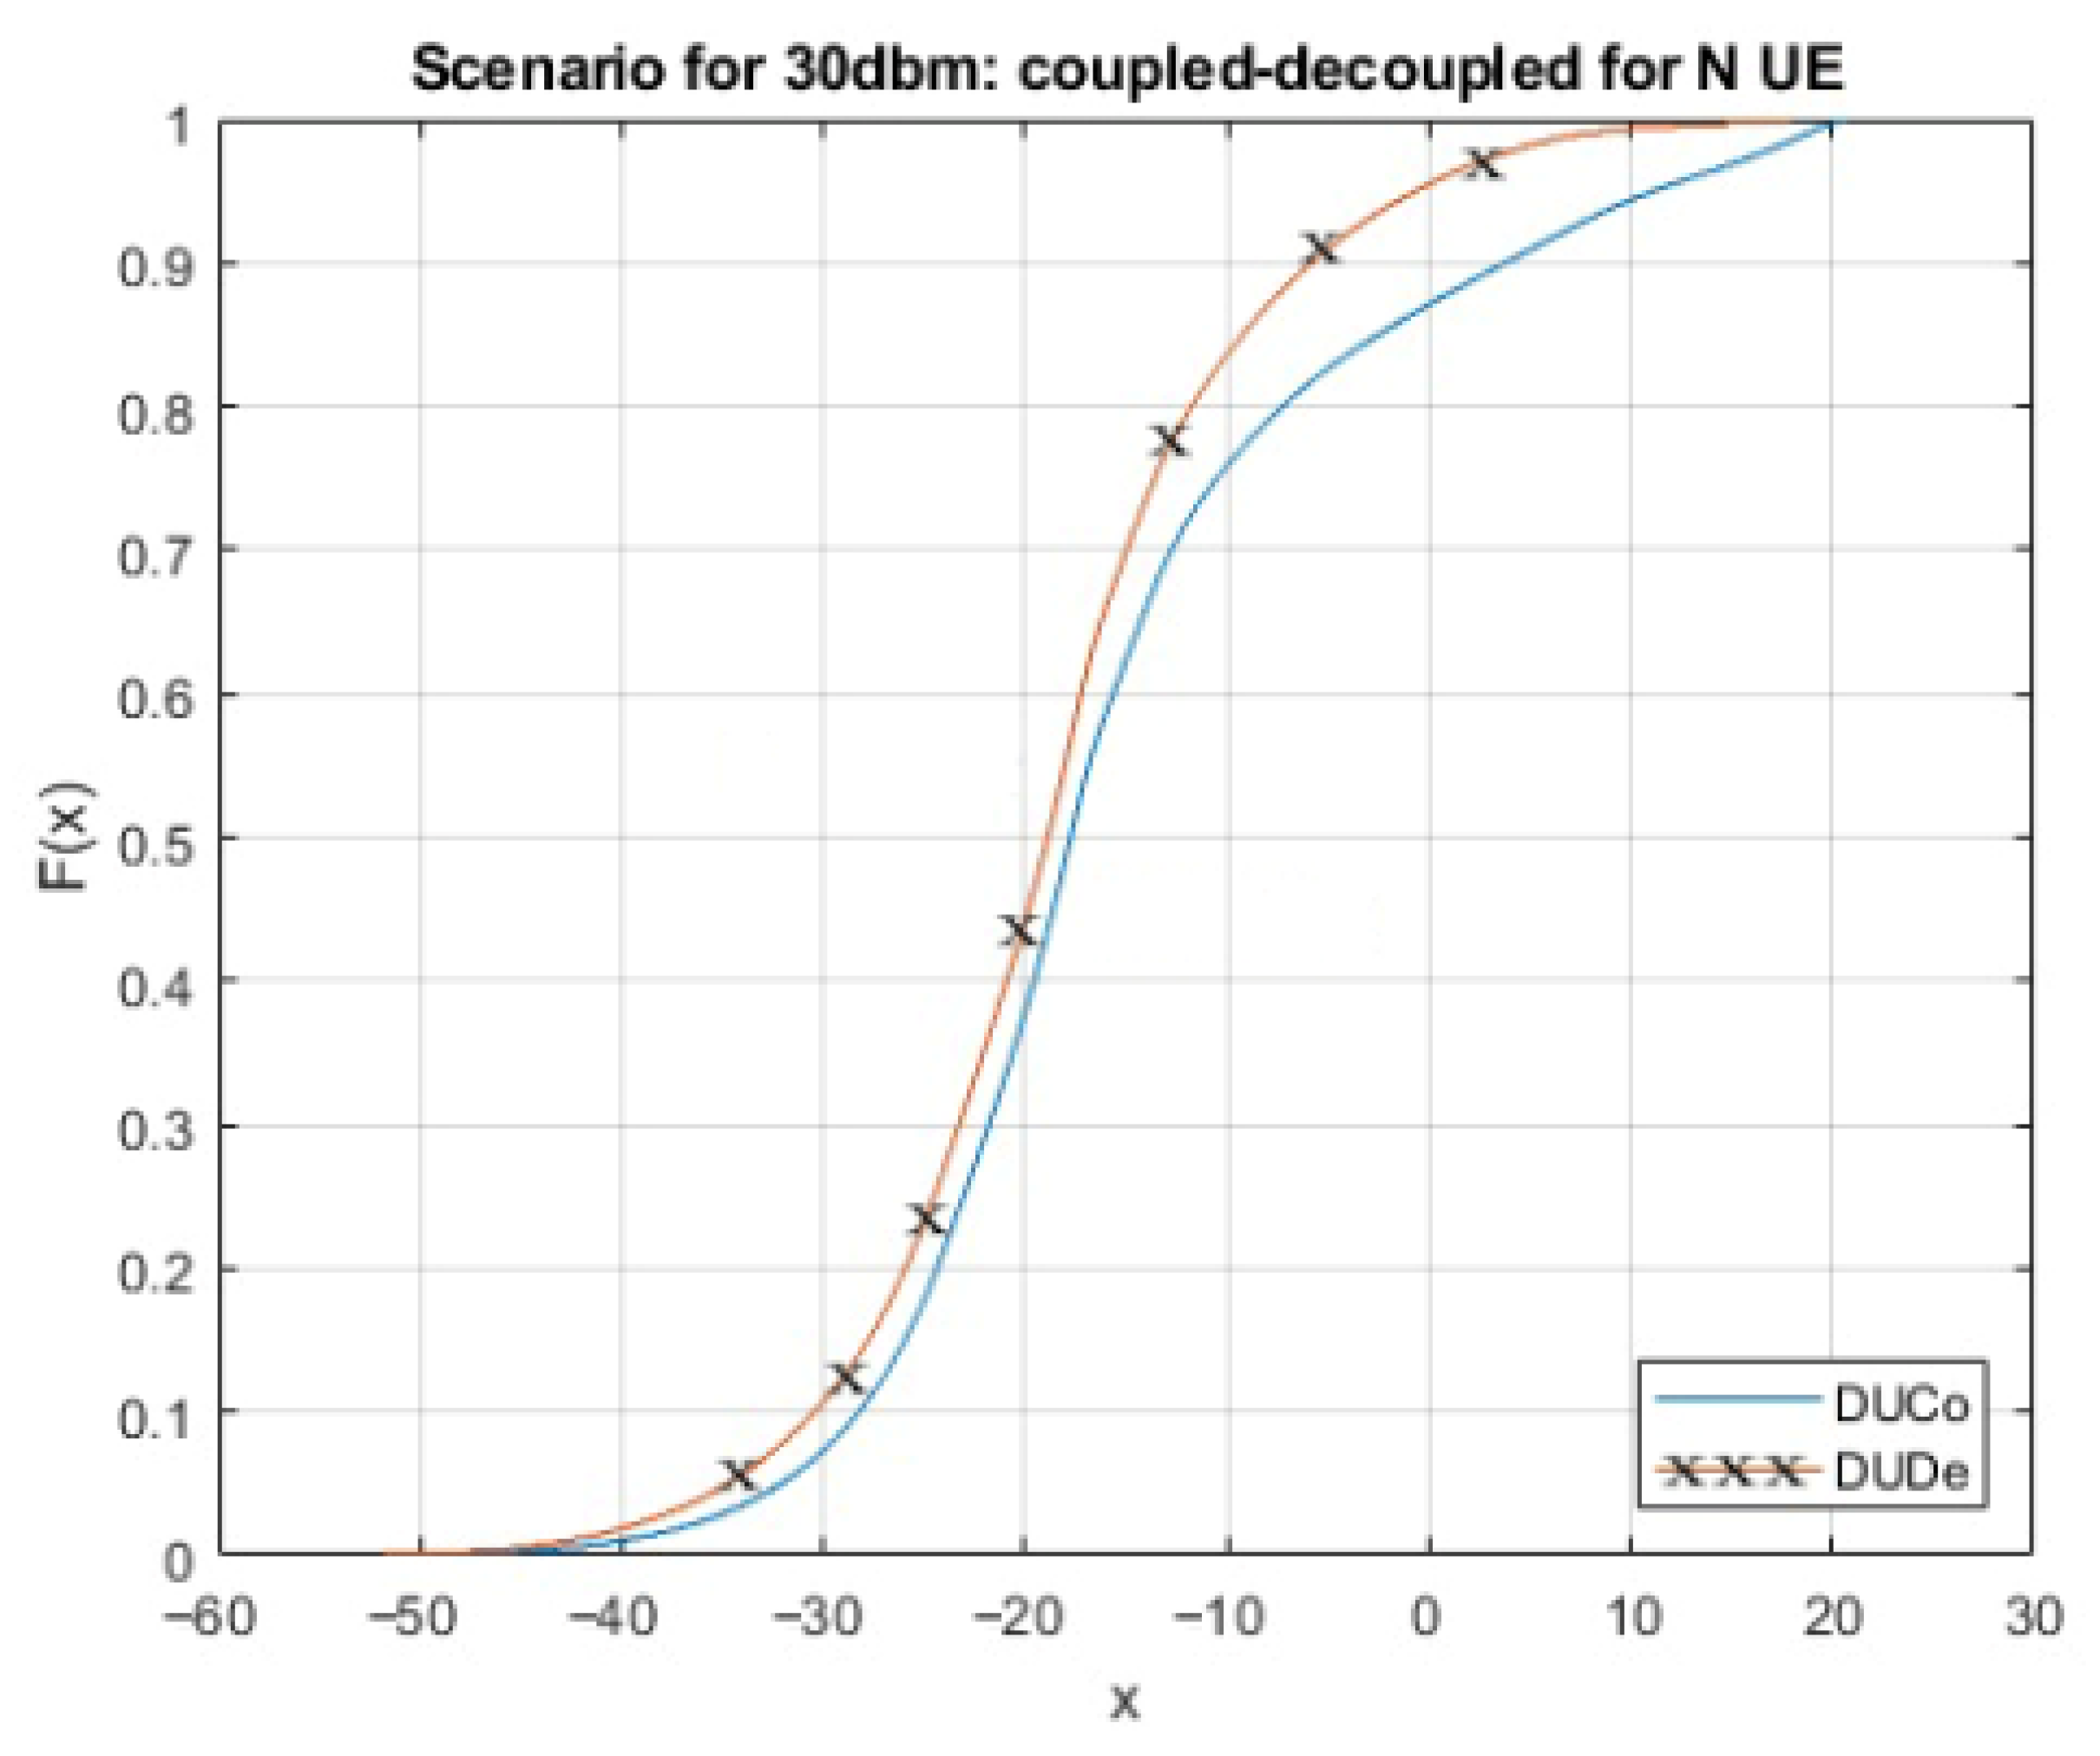
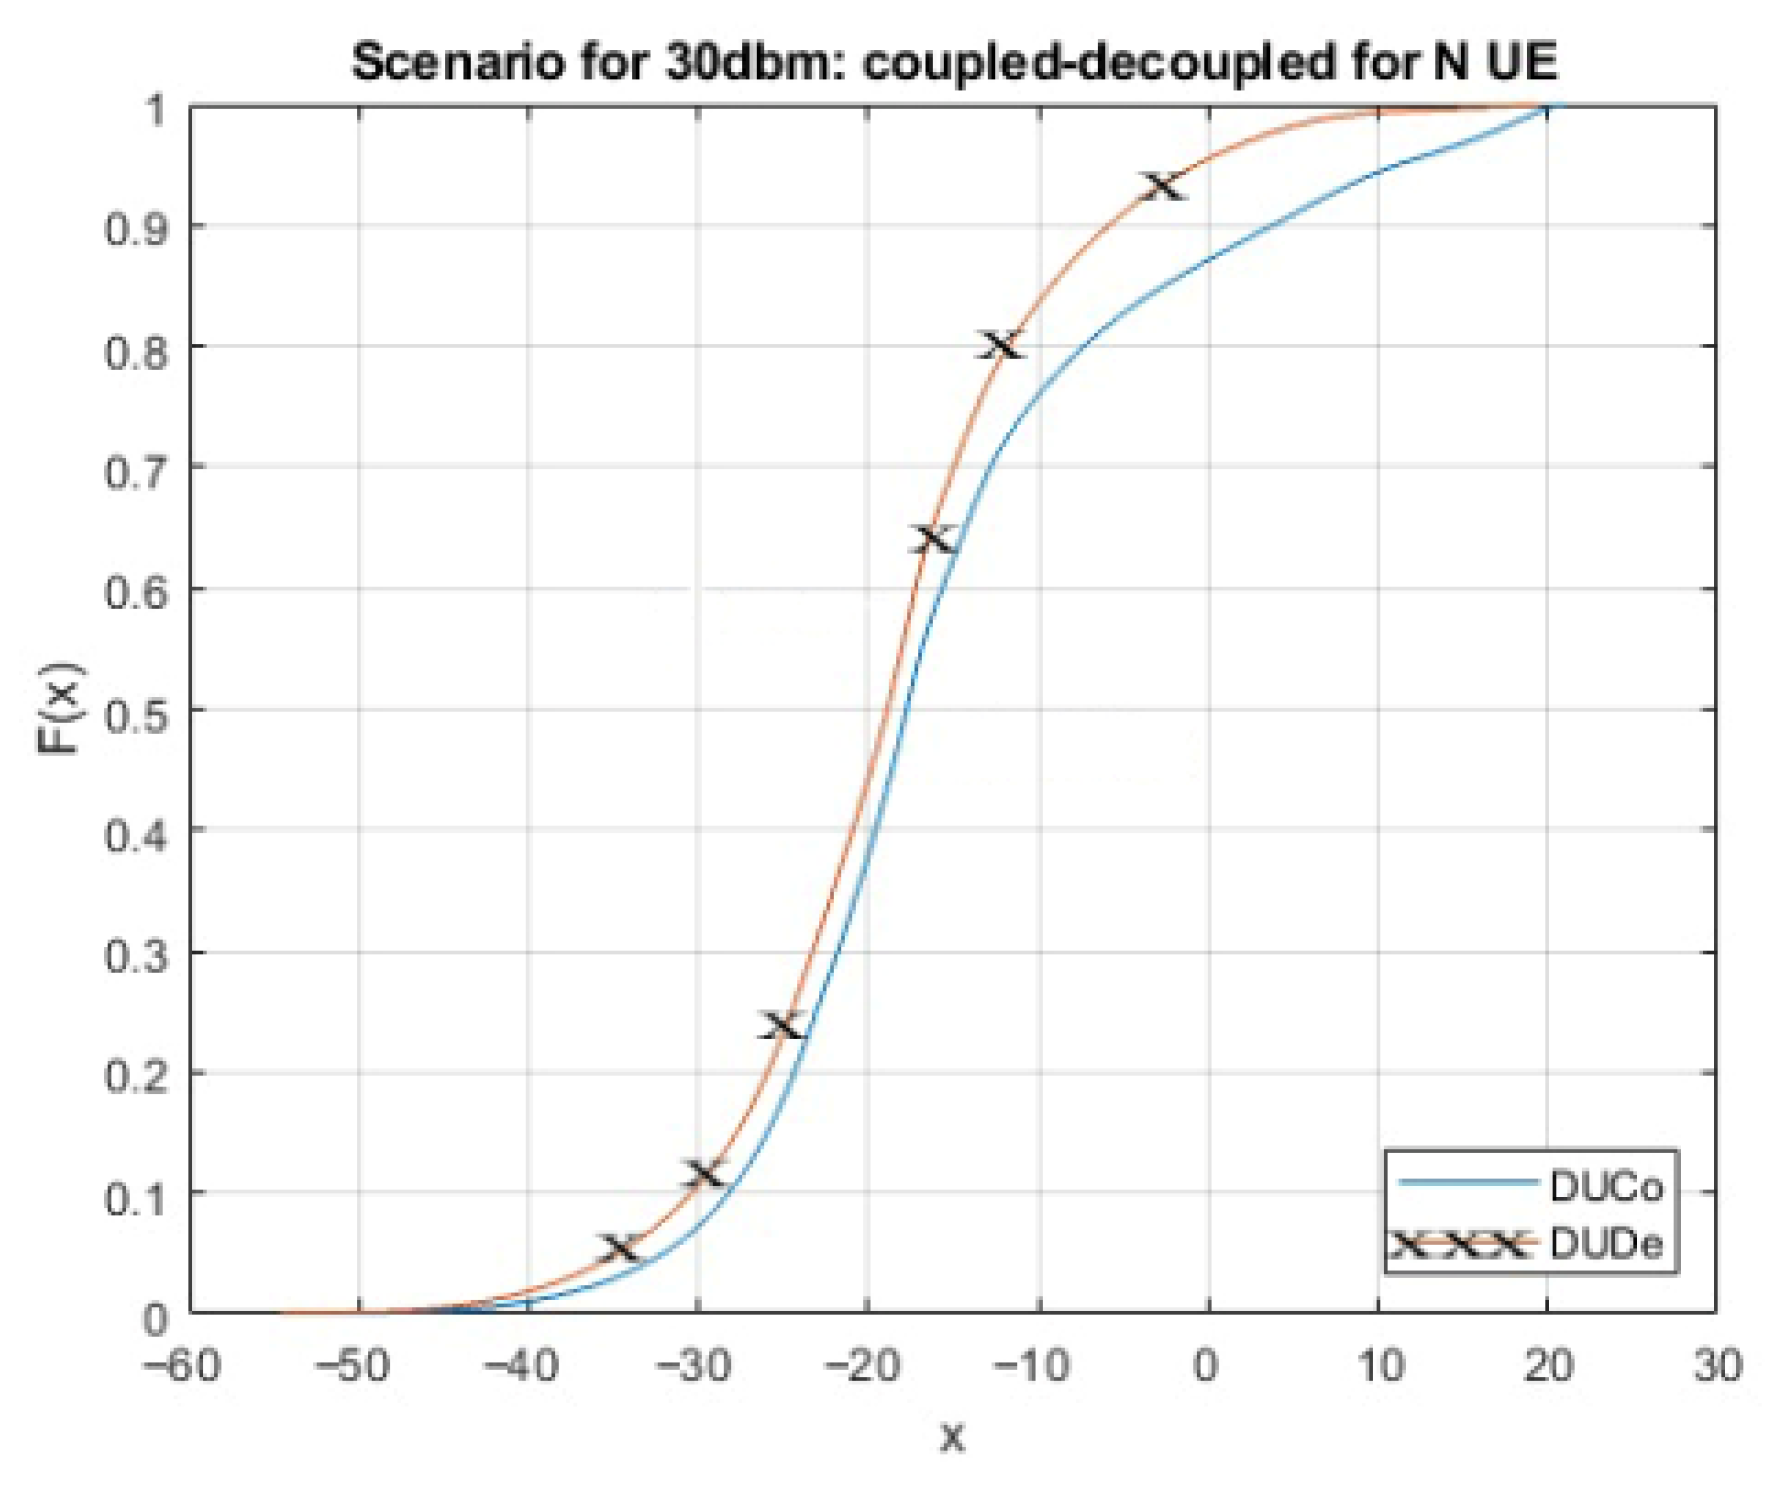
In this examination of energy efficiency, a meticulous comparative analysis between the DUDe and DUCo methodologies is conducted. The primary focus is on energy efficiency, while ensuring that the UE transmission power is consistently maintained at the specified 30 dBm level. The insights and outcomes derived from these assessments are systematically presented through the illustrative representations shown from
Figure 7,
Figure 8 and
Figure 9.
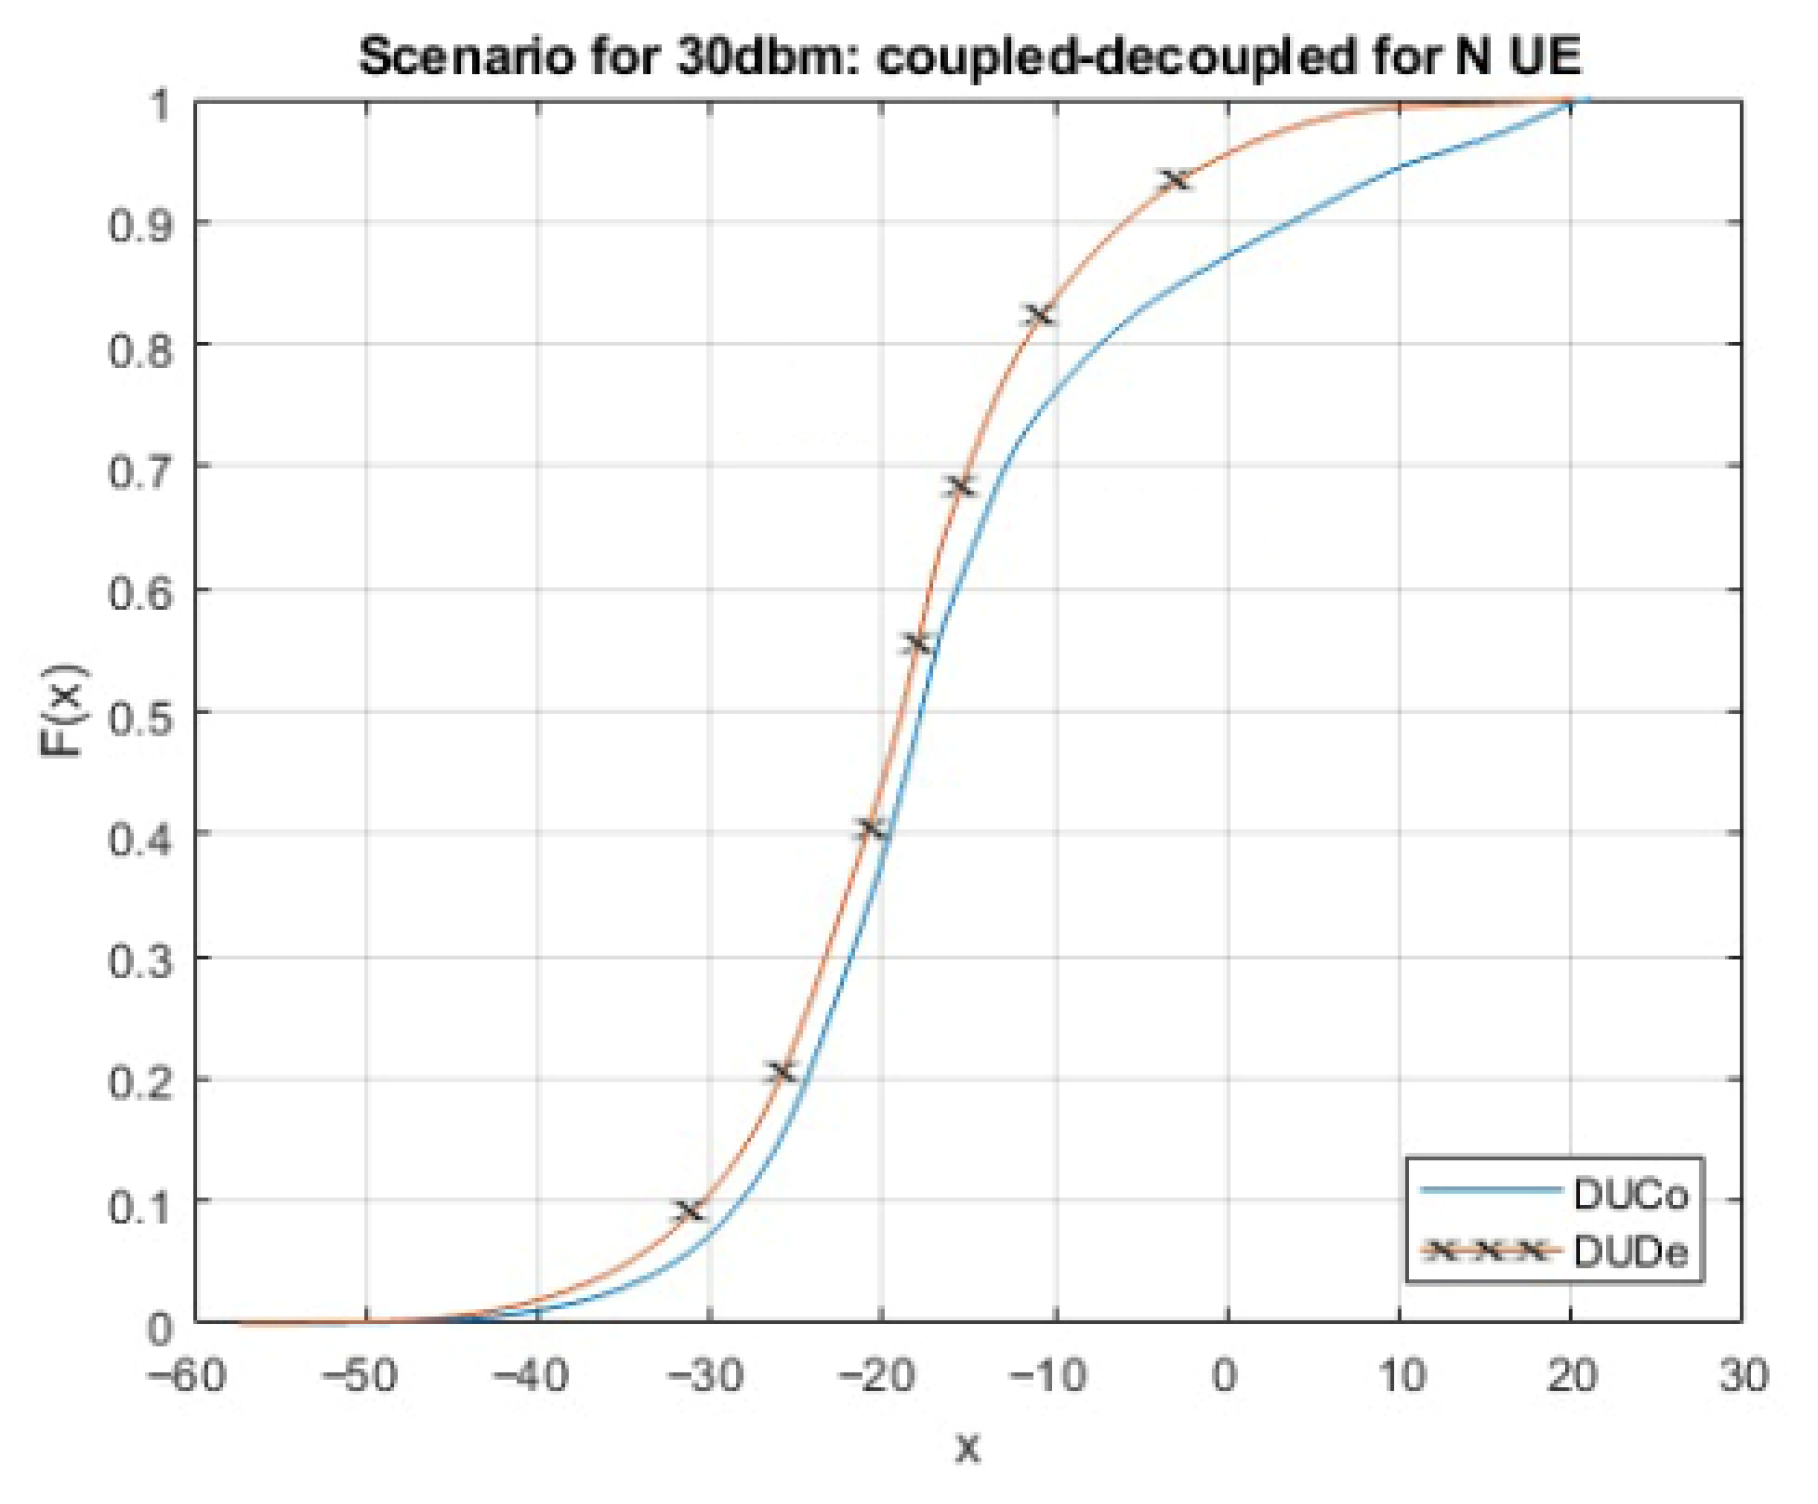
Within these graphical depictions, a crucial interplay is observed between the x-axis, which represents the average transmission power of the UE measured in decibels (dB), and the y-axis, which illustrates the probability distribution, providing insight into the success rates associated with the DUDe and DUCo scenarios. It is important to note that the second scenario introduces a significant factor—the 30 dBm limit—prescribed by the 3GPP, the Mobile Broadband Standard Partnership Project. This limit effectively establishes the maximum permissible transmit power for signal transmission within the designated scenario.
What is particularly noteworthy is that, even in the presence of this stringent 30 dBm limit, our results consistently echo the core conclusions derived from our initial scenario. Namely, our comprehensive findings reaffirm the assertion that the DUDe methodology for implementing a heterogeneous 5G network manifests as a more environmentally sustainable and efficient choice in comparison to the DUCo counterpart. Significantly, this consensus perseveres even under the influence of the 30 dBm constraint. It is pertinent to acknowledge that while the disparity in energy consumption between the DUDe and DUCo methods is somewhat narrower in this second scenario, the overarching agreement remains unaltered: the DUDe approach upholds its status as the exemplary of energy efficiency, promising a positive ecological impact. In sum, our investigations underscore the persistence of the DUDe method’s superiority in terms of its eco-conscious profile, notwithstanding the limitations imposed by the 30 dBm constraint within the domain of 5G network deployment. Furthermore, our detailed analyses spanning
Figure 7,
Figure 8 and
Figure 9 provide additional insights into the dynamics of energy-efficient associations. These visual representations and the corresponding data unravel a compelling trend: an increase in UE transmission power directly correlates with a heightened probability of successful DUDe associations. Notably, once the transmission power reaches the 2 dBm threshold or exceeds it, we observe a likelihood that consistently surpasses 70% for successful DUDe connections. These findings underscore the efficiency and efficacy of the DUDe communication algorithm, which continually excels in achieving comparable outcomes with lesser transmission power requirements when juxtaposed with the coupled scenario.
Lastly, the evidence within these diagrams robustly bolsters the case for the DUDe method, highlighting a distinct advantage in terms of the likelihood of establishing successful connections in comparison to the DUCo method. A clear illustration emerges when examining a UE transmission power of 10 dBm, where the DUDe method confidently secures a 100% probability of a successful connection. In contrast, the DUCo method necessitates twice the transmission power, specifically 20 dBm, to achieve a successful connection across all our evaluated simulations, encompassing varying user densities. These findings convincingly underscore the consistent and superior performance exhibited by the DUDe approach across diverse scenarios and user contexts.
6.3. Evaluation and Analysis of Scenarios in Rural Area
Experimental investigations within a specific provincial area were conducted, altering key parameters in MATLAB’s nrPathLoss function to observe the impact on our results. Our objective was to assess how modifying the region influences the outcomes of our experiments.
For the simulations, a 4 × 4 square region was utilized to evaluate technological performance, as depicted in
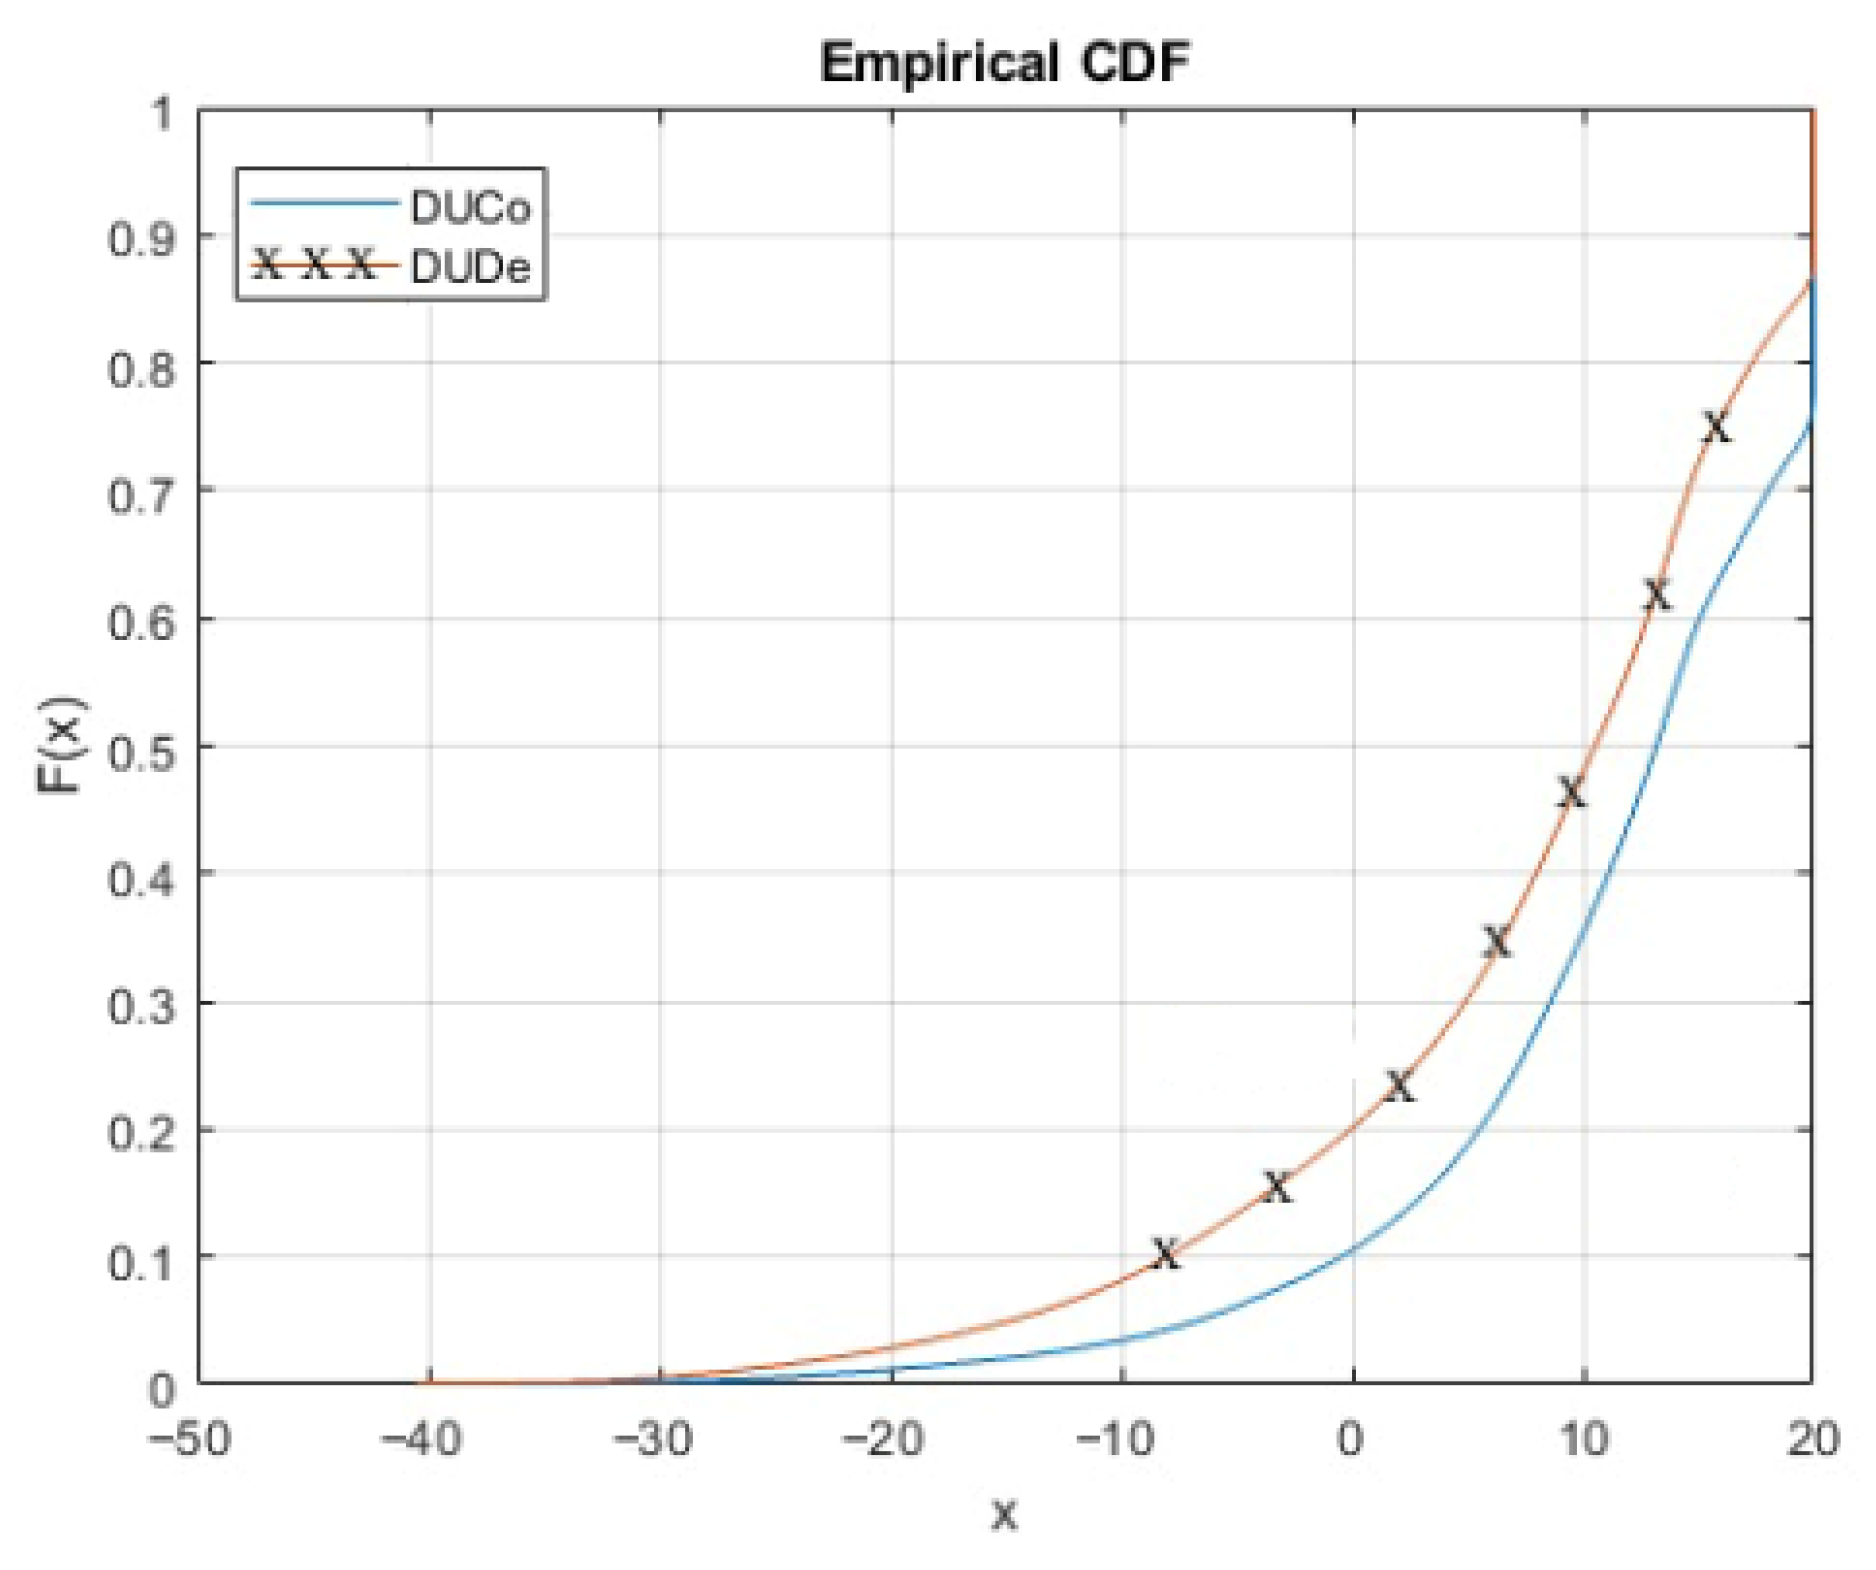
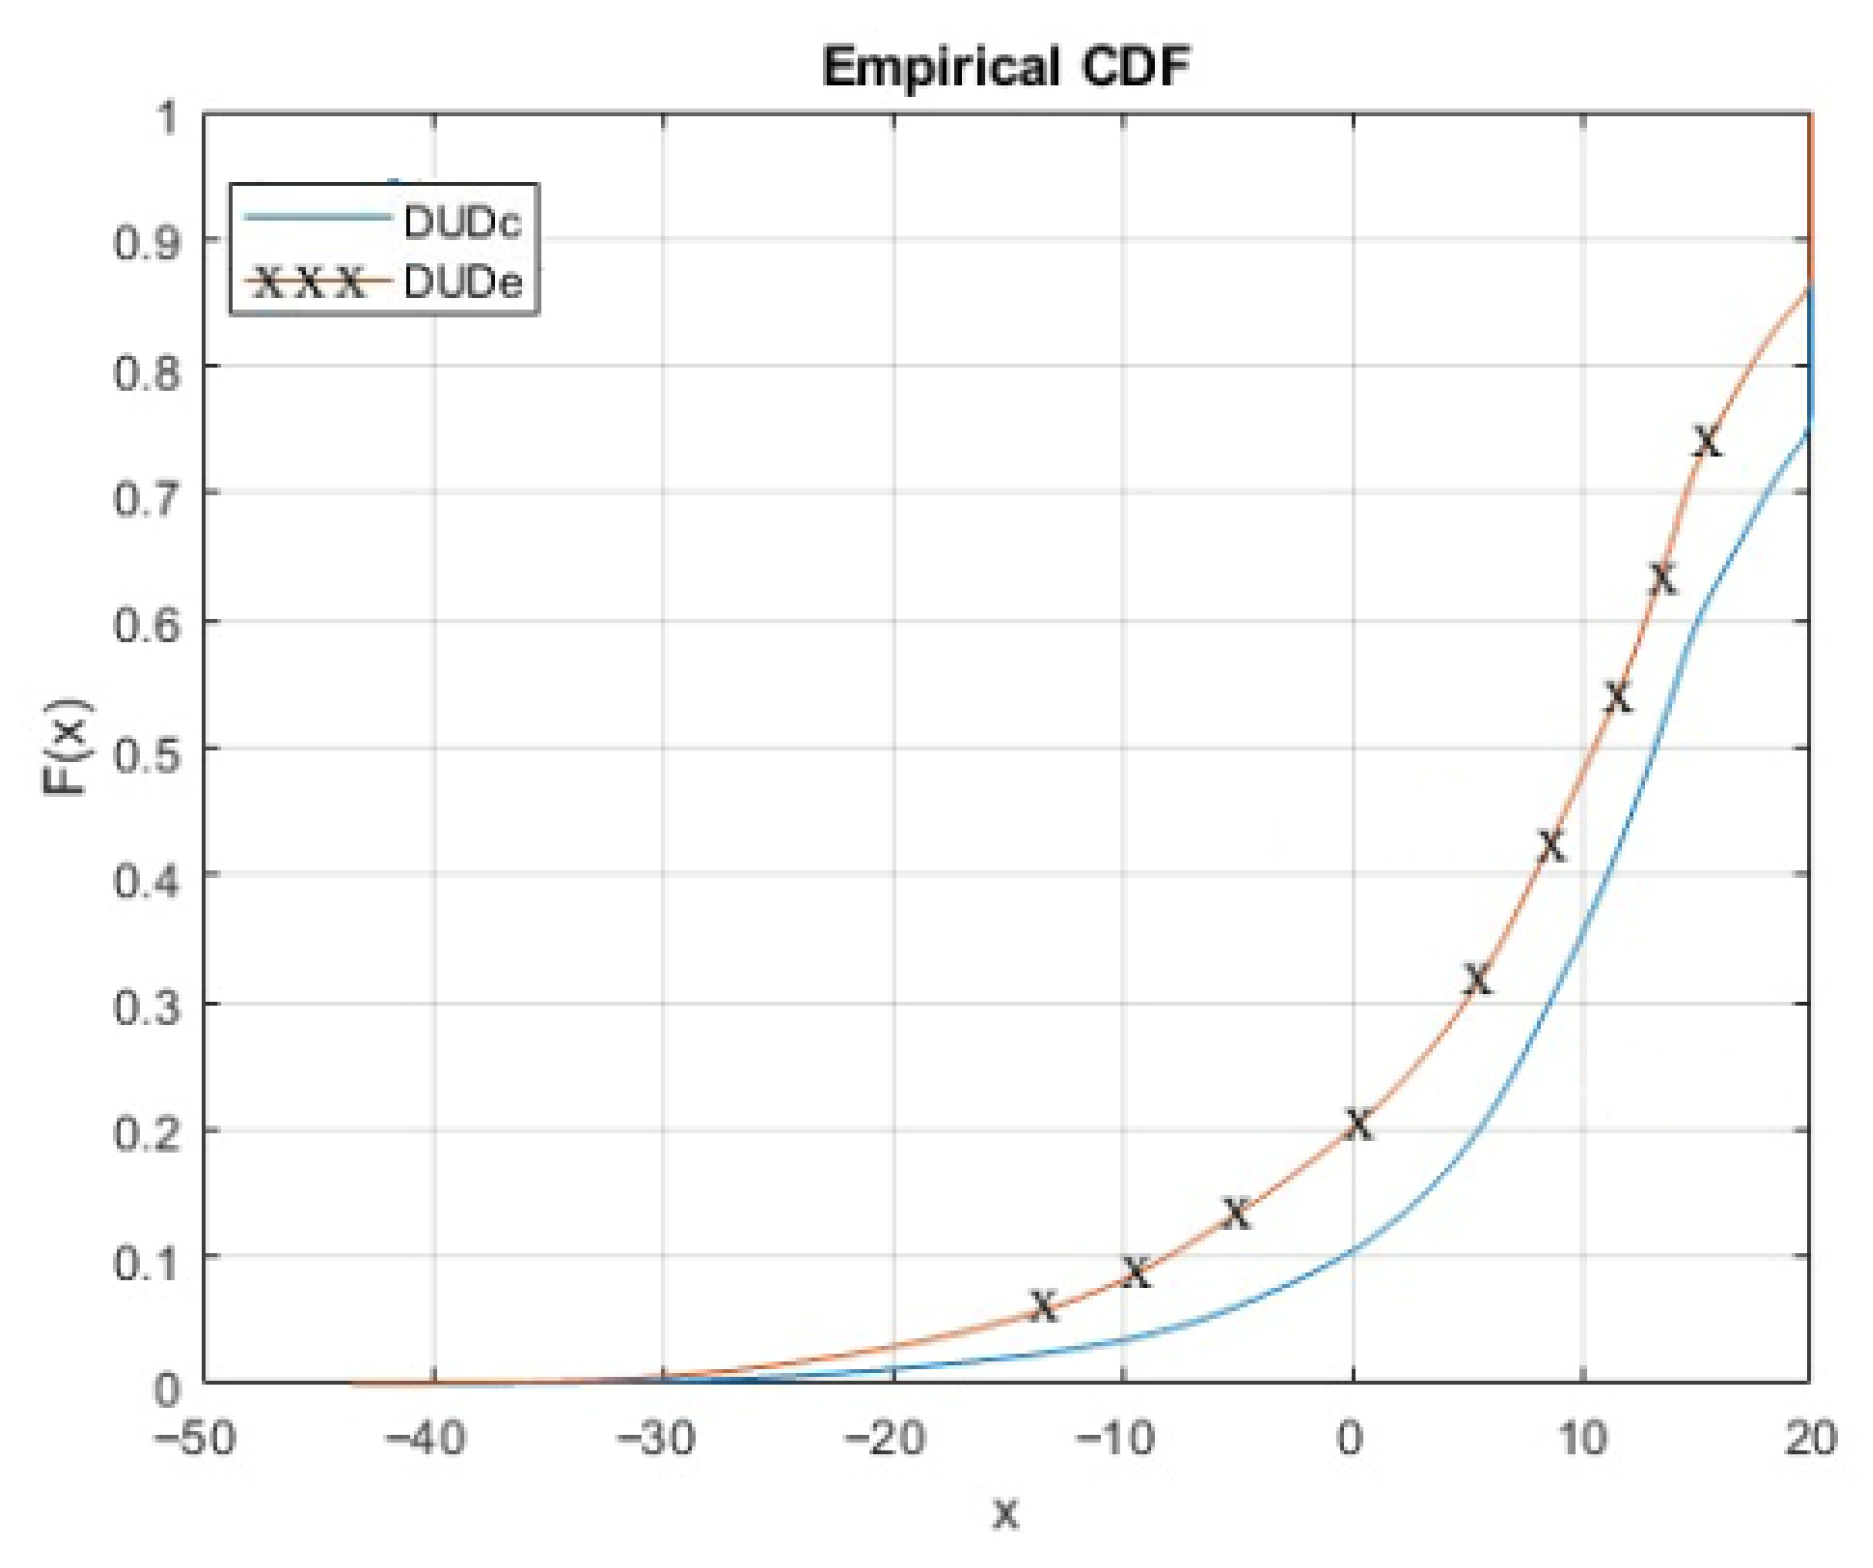
Figure 3 within the simulation environment section. This defined area served as the spatial domain for conducting experiments and analyses to observe the behaviors and outcomes of the technologies under examination. Different numbers of UEs (1000 and 2000) were used in the simulations to emulate varying levels of network congestion, with the SNR value set at 20 dBm.
Upon an exhaustive and meticulous analysis of the research outcomes, it has been discerned that the transition from an urban environment to a sparsely populated rural setting does not significantly alter our initially posited hypothesis or the conclusive deductions drawn from our study. Upon a thorough examination of the provided diagram, notable inferences have been made: As the transmission power of UE escalates, a discernible correlation with the scenario involving DUDe becomes evident, exhibiting a probability exceeding 60%. Specifically, as the power values ascend beyond the 11 dBm threshold, the likelihood of a DUDe correlation approaches nearly 70%. This empirical evidence substantiates the notion that the DUDe scenario necessitates a lesser magnitude of transmission power to elicit a commensurate impact akin to that observed in the coupled scenario
Figure 10 and
Figure 11.
7. Evaluation Regarding Energy Consumption Between DUDe and DUCo
An evaluation of energy consumption is conducted between scenarios involving DUDe and DUCo in both urban and rural settings. Understanding the energy dynamics in diverse environments is essential for assessing the impact of different geographical locations on energy efficiency strategies. By analyzing the energy consumption patterns in DUDe and DUCo configurations across urban and rural areas, the study aims to determine how these approaches influence power usage in varying landscapes. Additionally, before presenting the experimental analysis, it is noted for readers using a black-and-white version of the article that in all bar plots, the left bar corresponds to DUDe, and the right bar corresponds to DUCo.
7.1. Evaluation and Analysis Scenario for Urban Area
The investigation involved a rigorous comparative simulation between the DUDe and DUCo technologies, with user populations varying across 500, 1000, and 2000 individuals. Each simulation was meticulously repeated 1000 times, and the presented results represent the mean values obtained from these extensive iterations. The primary objective was to demonstrate the distinctive capability of DUDe technology in achieving a more uniform distribution of users within the network. DUDe targets the association layer and is largely orthogonal to radio-level energy-saving mechanisms such as cell sleep, antenna muting, or advanced beamforming. Our design isolates DUDe to quantify its association-driven gains; in operational systems, DUDe can complement sleep-mode policies by reducing macro-tier load (enabling deeper sleep) and can reduce beamforming power needed at macro nodes by shifting UEs to small cells in UL.
The essence of this achievement lies in ensuring that users are equitably allocated among the 14 BSs. By accomplishing this equilibrium, we effectively mitigate the risk of any single BS bearing an excessive user load, a scenario that typically leads to elevated power consumption. This imbalance was a conspicuous issue observed in the context of the earlier DUCo technology. In particular, it is imperative to highlight the predicament faced by the Macro BS in the network, where the DUCo technology predominantly attracts the highest number of users. This proclivity results in the Macro BS experiencing not only heightened user loads but also an increased demand for power consumption. Concomitantly, this disproportionate allocation not only underutilizes the remaining network BSs but also places undue stress on the Macro BS, subjecting it to excessive power consumption levels. Our simulation endeavors have culminated in the compelling revelation that DUDe technology emerges as the more energy-efficient option. It excels in the strategic redistribution of users, ensuring an equitable load across the network. This optimized allocation of user populations, in turn, contributes to a noticeable reduction in overall power consumption, ultimately culminating in a positive environmental impact.
It is noteworthy to mention that among the myriad parameters considered in our study, the SNR played a pivotal role. Users positioned at greater distances from the BS, where signal strength is inherently weaker, inevitably demand a more substantial electrical current for the provision of satisfactory services. This holds true, regardless of whether DUDe or DUCo technology is under consideration. In conclusion, our comprehensive analysis underscores the unique prowess of DUDe technology in fostering an efficient and eco-friendly distribution of users, further underlining its merit as the preferred choice for optimizing power consumption in wireless communication networks. Additionally, in the bar graphs shown in the results below, the first bar, from each index, consistently represents DUDe technology, while the second bar displays the comparable DUCo technology.
The simulation results confirm the initial hypothesis that DUDe technology provides superior network regulation compared to DUCo technology. This is demonstrated by the ability of DUDe technology to prevent Macro BSs from becoming overloaded through excessive current consumption, in contrast to DUCo technology.
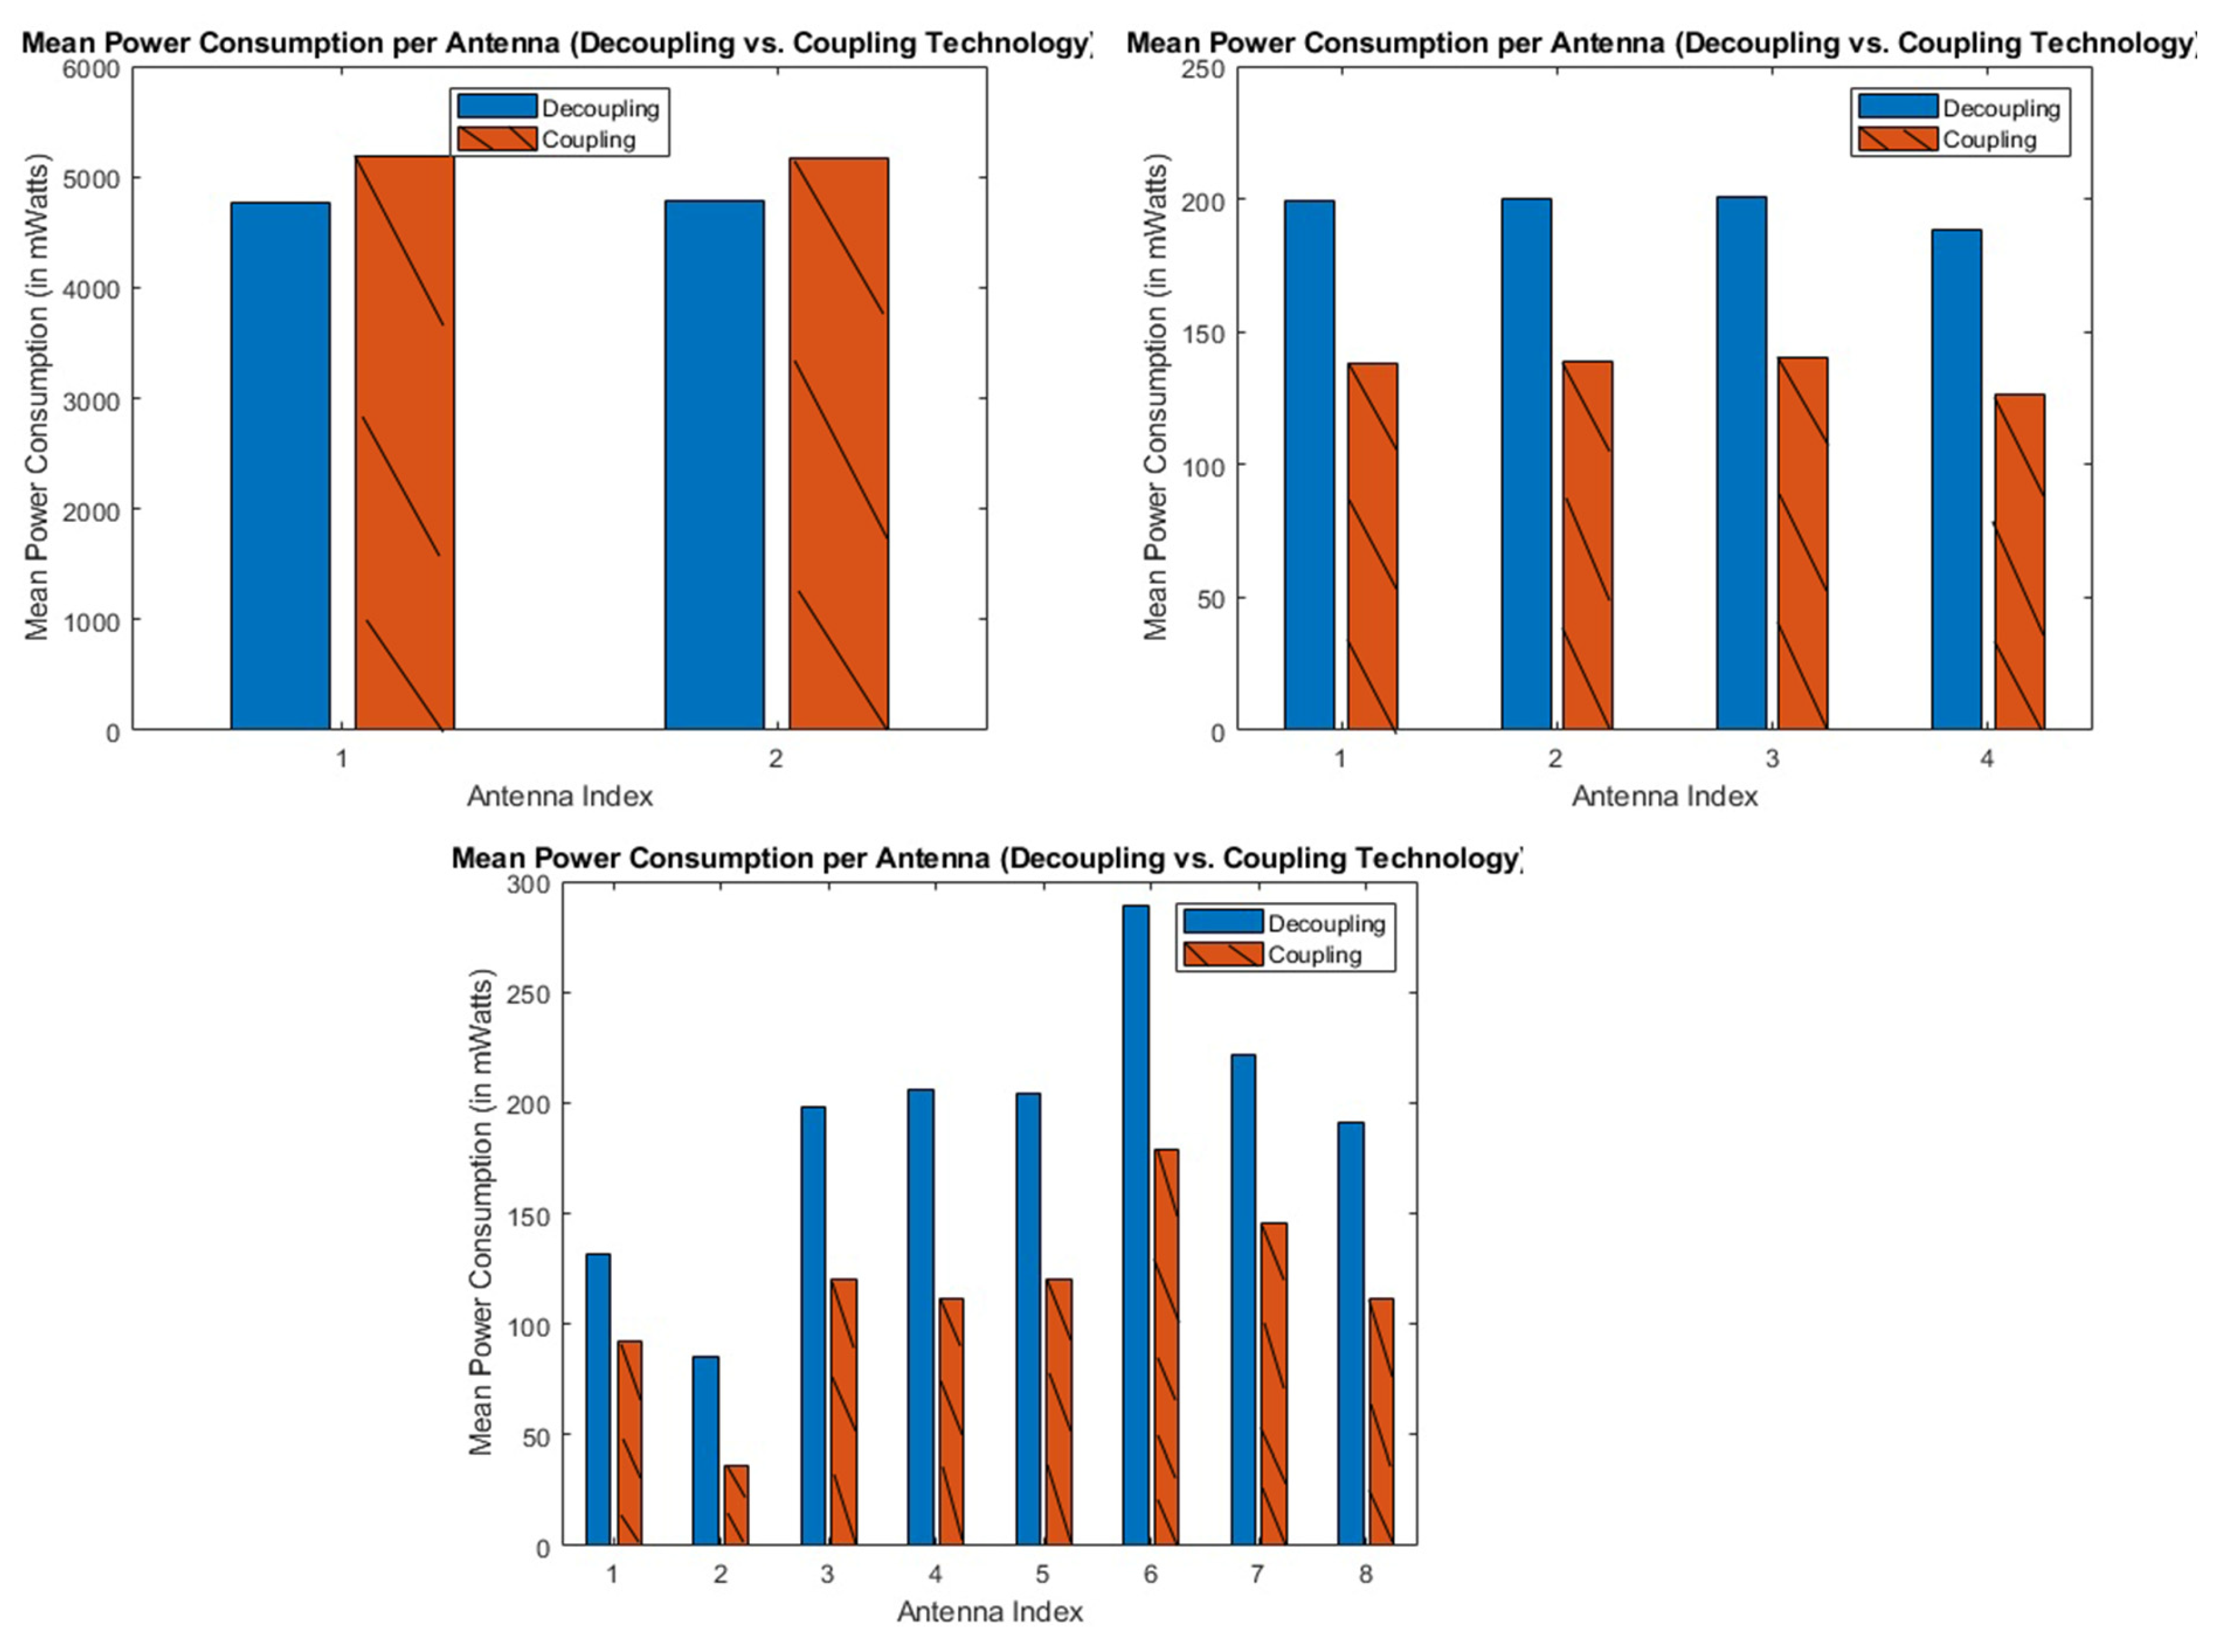
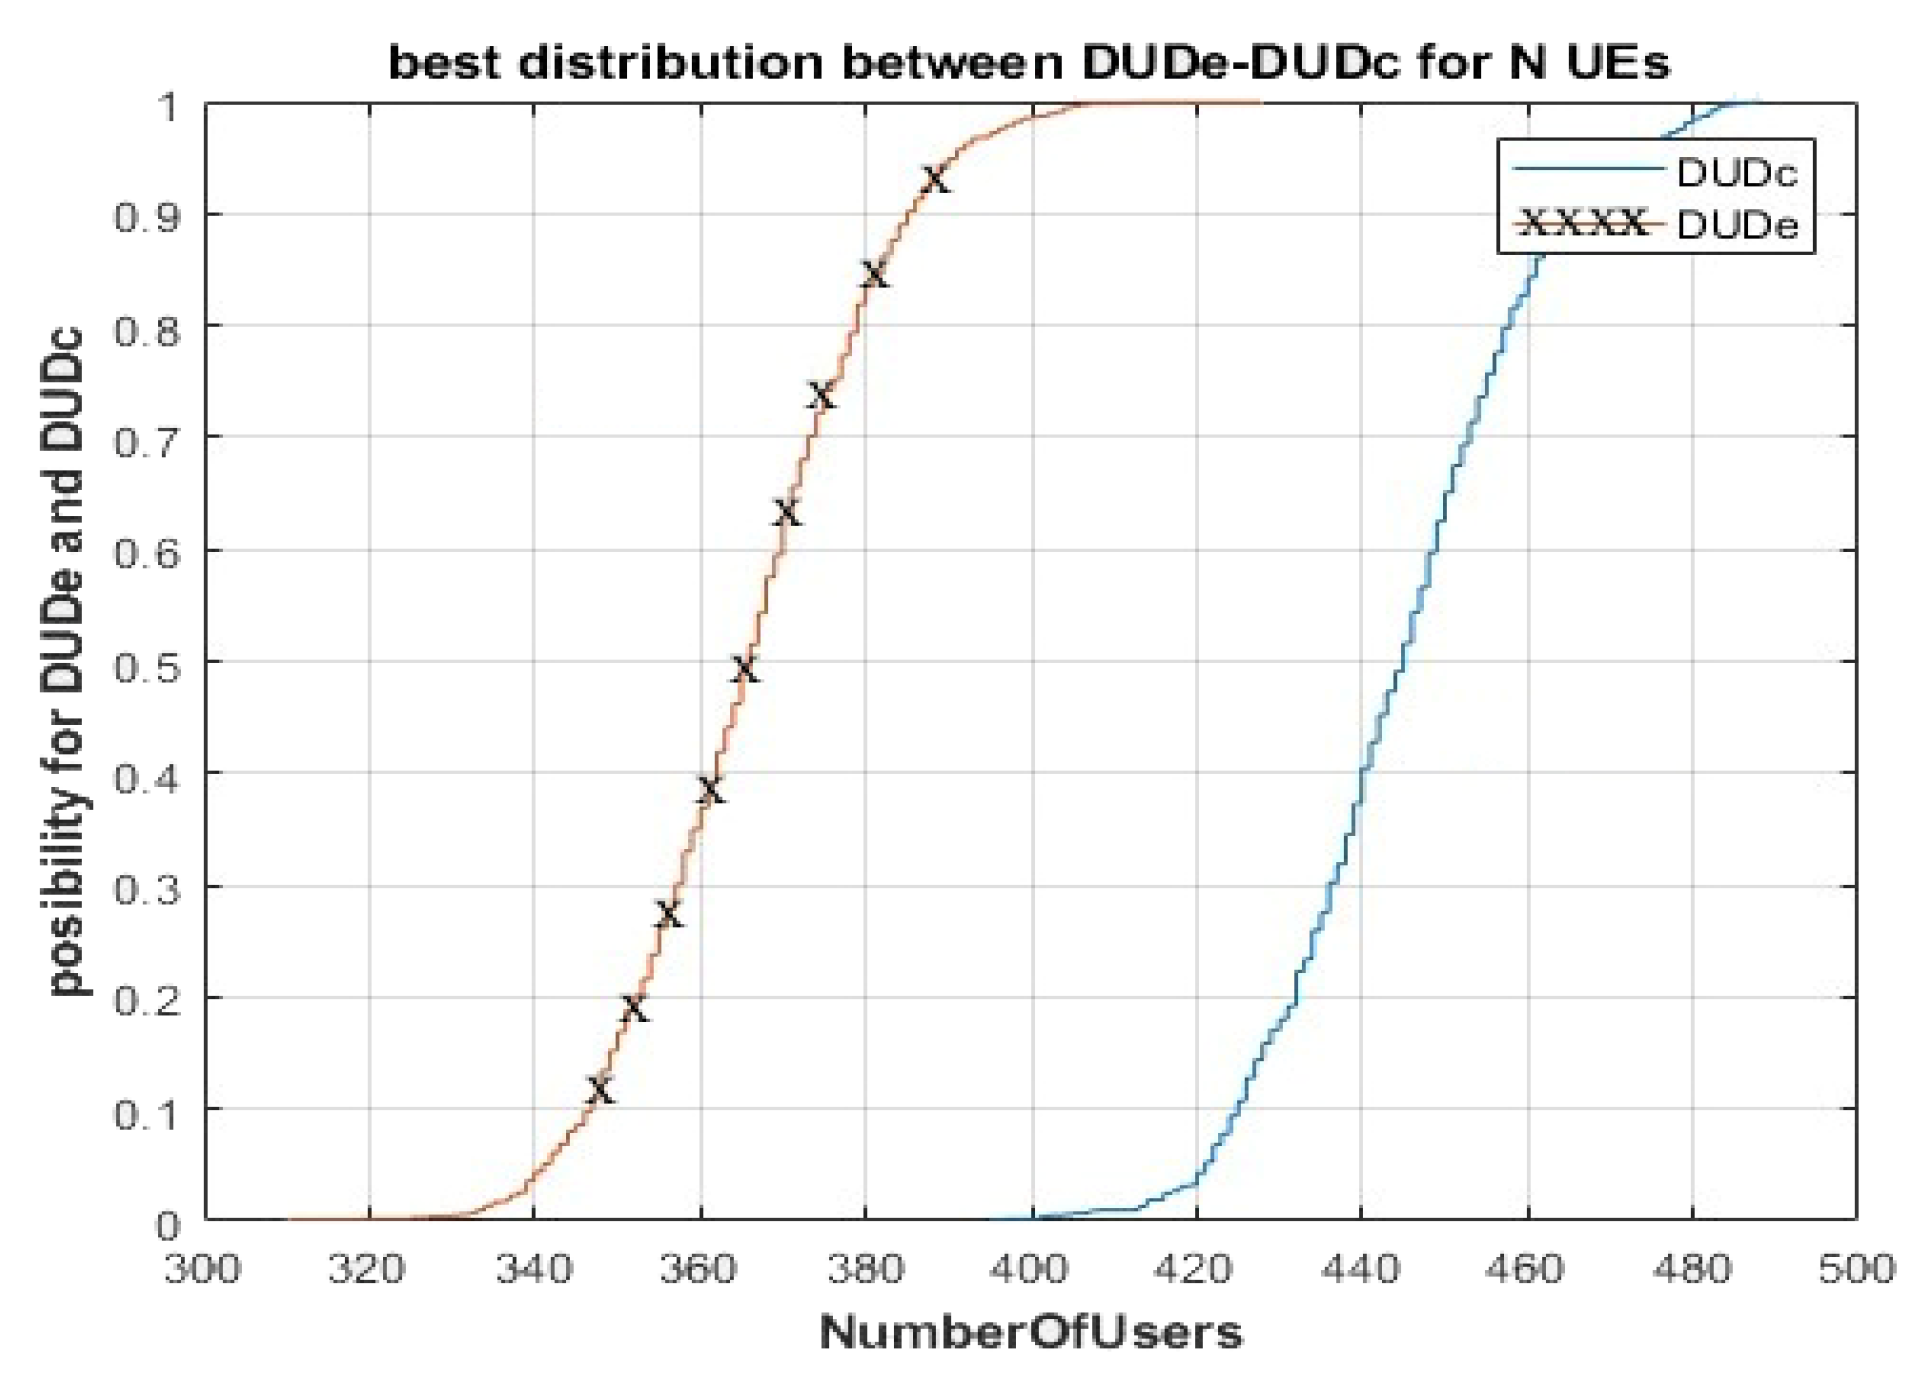
In
Figure 12, the visual representation of the mean UE assignments per BS during the simulation involving 500 UEs is presented. Notably, the average user distribution for DUDe technology was approximately 160 users per BS, whereas for DUCo technology, this Figure was approximately 200 users. This discrepancy amounts to roughly 22.22% in favor of DUDe technology, underlining its proficiency in achieving a more balanced user distribution. Moving on to
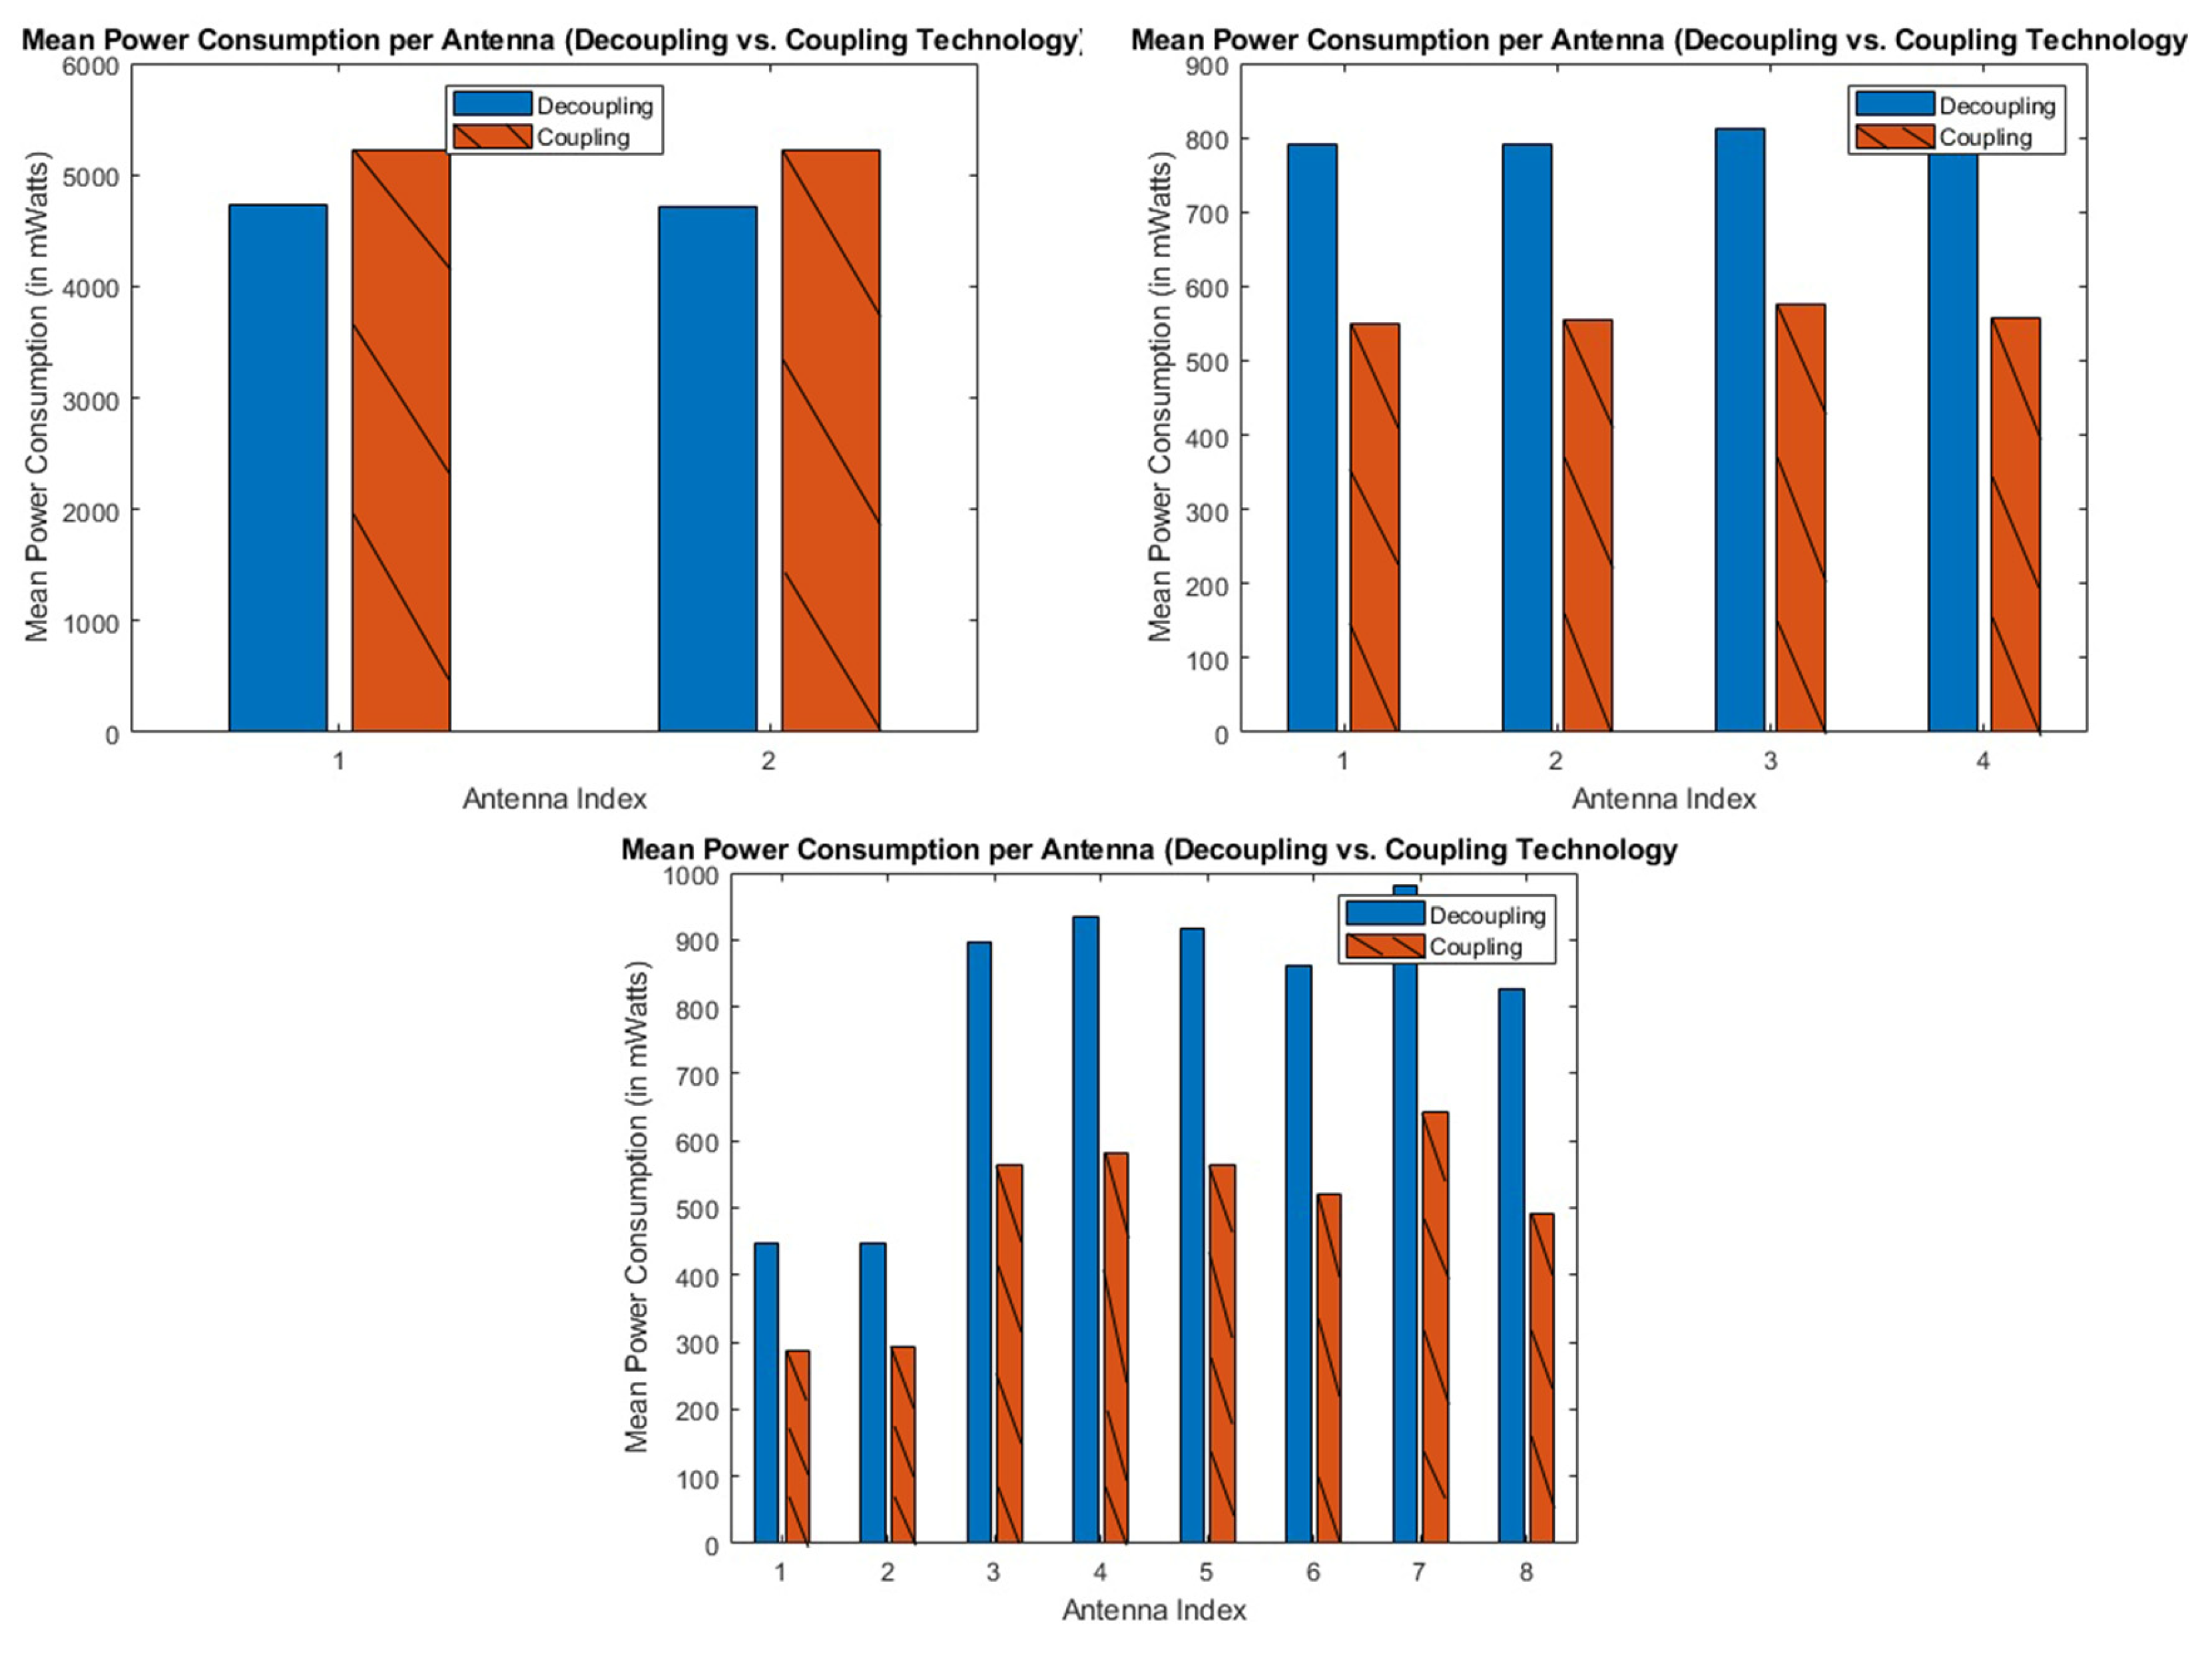
Figure 13, we scrutinize the energy consumption exhibited by each BS, meticulously categorized by BS type, including Macro, Micro, and Pico, during the simulation featuring 500 UEs. Noteworthy observations emerge as we delve into these energy consumption patterns.
Specifically, within the domain of the Macro BSs, the DUDe technology displayed an average power consumption of 4758 mW for Macro 1 BS and 4779 mW for Macro 2 BS. In stark contrast, the DUCo technology recorded an average power consumption of 5189 mW for Macro 1 BS and 5168 mW for Macro 2 BS. This delineates a notable percentage difference, approximately 8.6% and 7.8%, respectively, in Favor of the DUDe technology. These Figures underscore the energy efficiency of DUDe technology in relation to its DUCo counterpart, illustrating its capacity to curtail power consumption within the Macro BSs.
In summary, our observations provide empirical evidence of DUDe technology’s prowess in facilitating a more even UE distribution and its commendable ability to reduce power consumption across the diverse BS types. These findings substantiate the contention that DUDe technology presents a compelling advantage in optimizing both user allocation and energy efficiency within the network.
Extending the analysis to accommodate a scenario involving 1000 UEs,
Figure 14 highlights the average UE assignments to BSs. In this simulation, DUDe technology exhibited a mean user distribution of approximately 320 users, while DUCo technology displayed an average of approximately 420 users per BS. This contrast signifies a notable difference of approximately 27.02%, favoring DUDe technology. This finding underscore DUDe’s capacity to foster a more balanced user distribution, even with a larger UE population.
Proceeding to
Figure 15, our examination delves into the detailed energy consumption patterns across BS types, encompassing Macro, Micro, and Pico, within the context of a simulation involving 1000 UEs. Focusing on the Macro 1 BS, DUDe technology recorded an average power consumption of 4747 mW, while for Macro 2 BS, it consumed 4709 mW. In contrast, the DUCo technology exhibited an average power consumption of 5199 mW for Macro 1 BS and 5237 mW for Macro 2 BS. This divergence translated into a substantial percentage difference in favor of DUDe technology, accounting for approximately 9.08% for Macro 1 BS and 10.6% for Macro 2 BS. These results underscore DUDe technology’s notable efficiency in reducing power consumption within the Macro BS category, despite the higher UE count.
In summary, our findingsprovide compelling evidence of DUDe technology’s effectiveness in promoting a more equitable UE allocation and its significant role in minimizing power consumption, particularly in the Macro BS domain, even under conditions of increased UE density. These outcomes reinforce the assertion that DUDe technology offers a substantial advantage in terms of optimizing both user distribution and energy efficiency within the network.
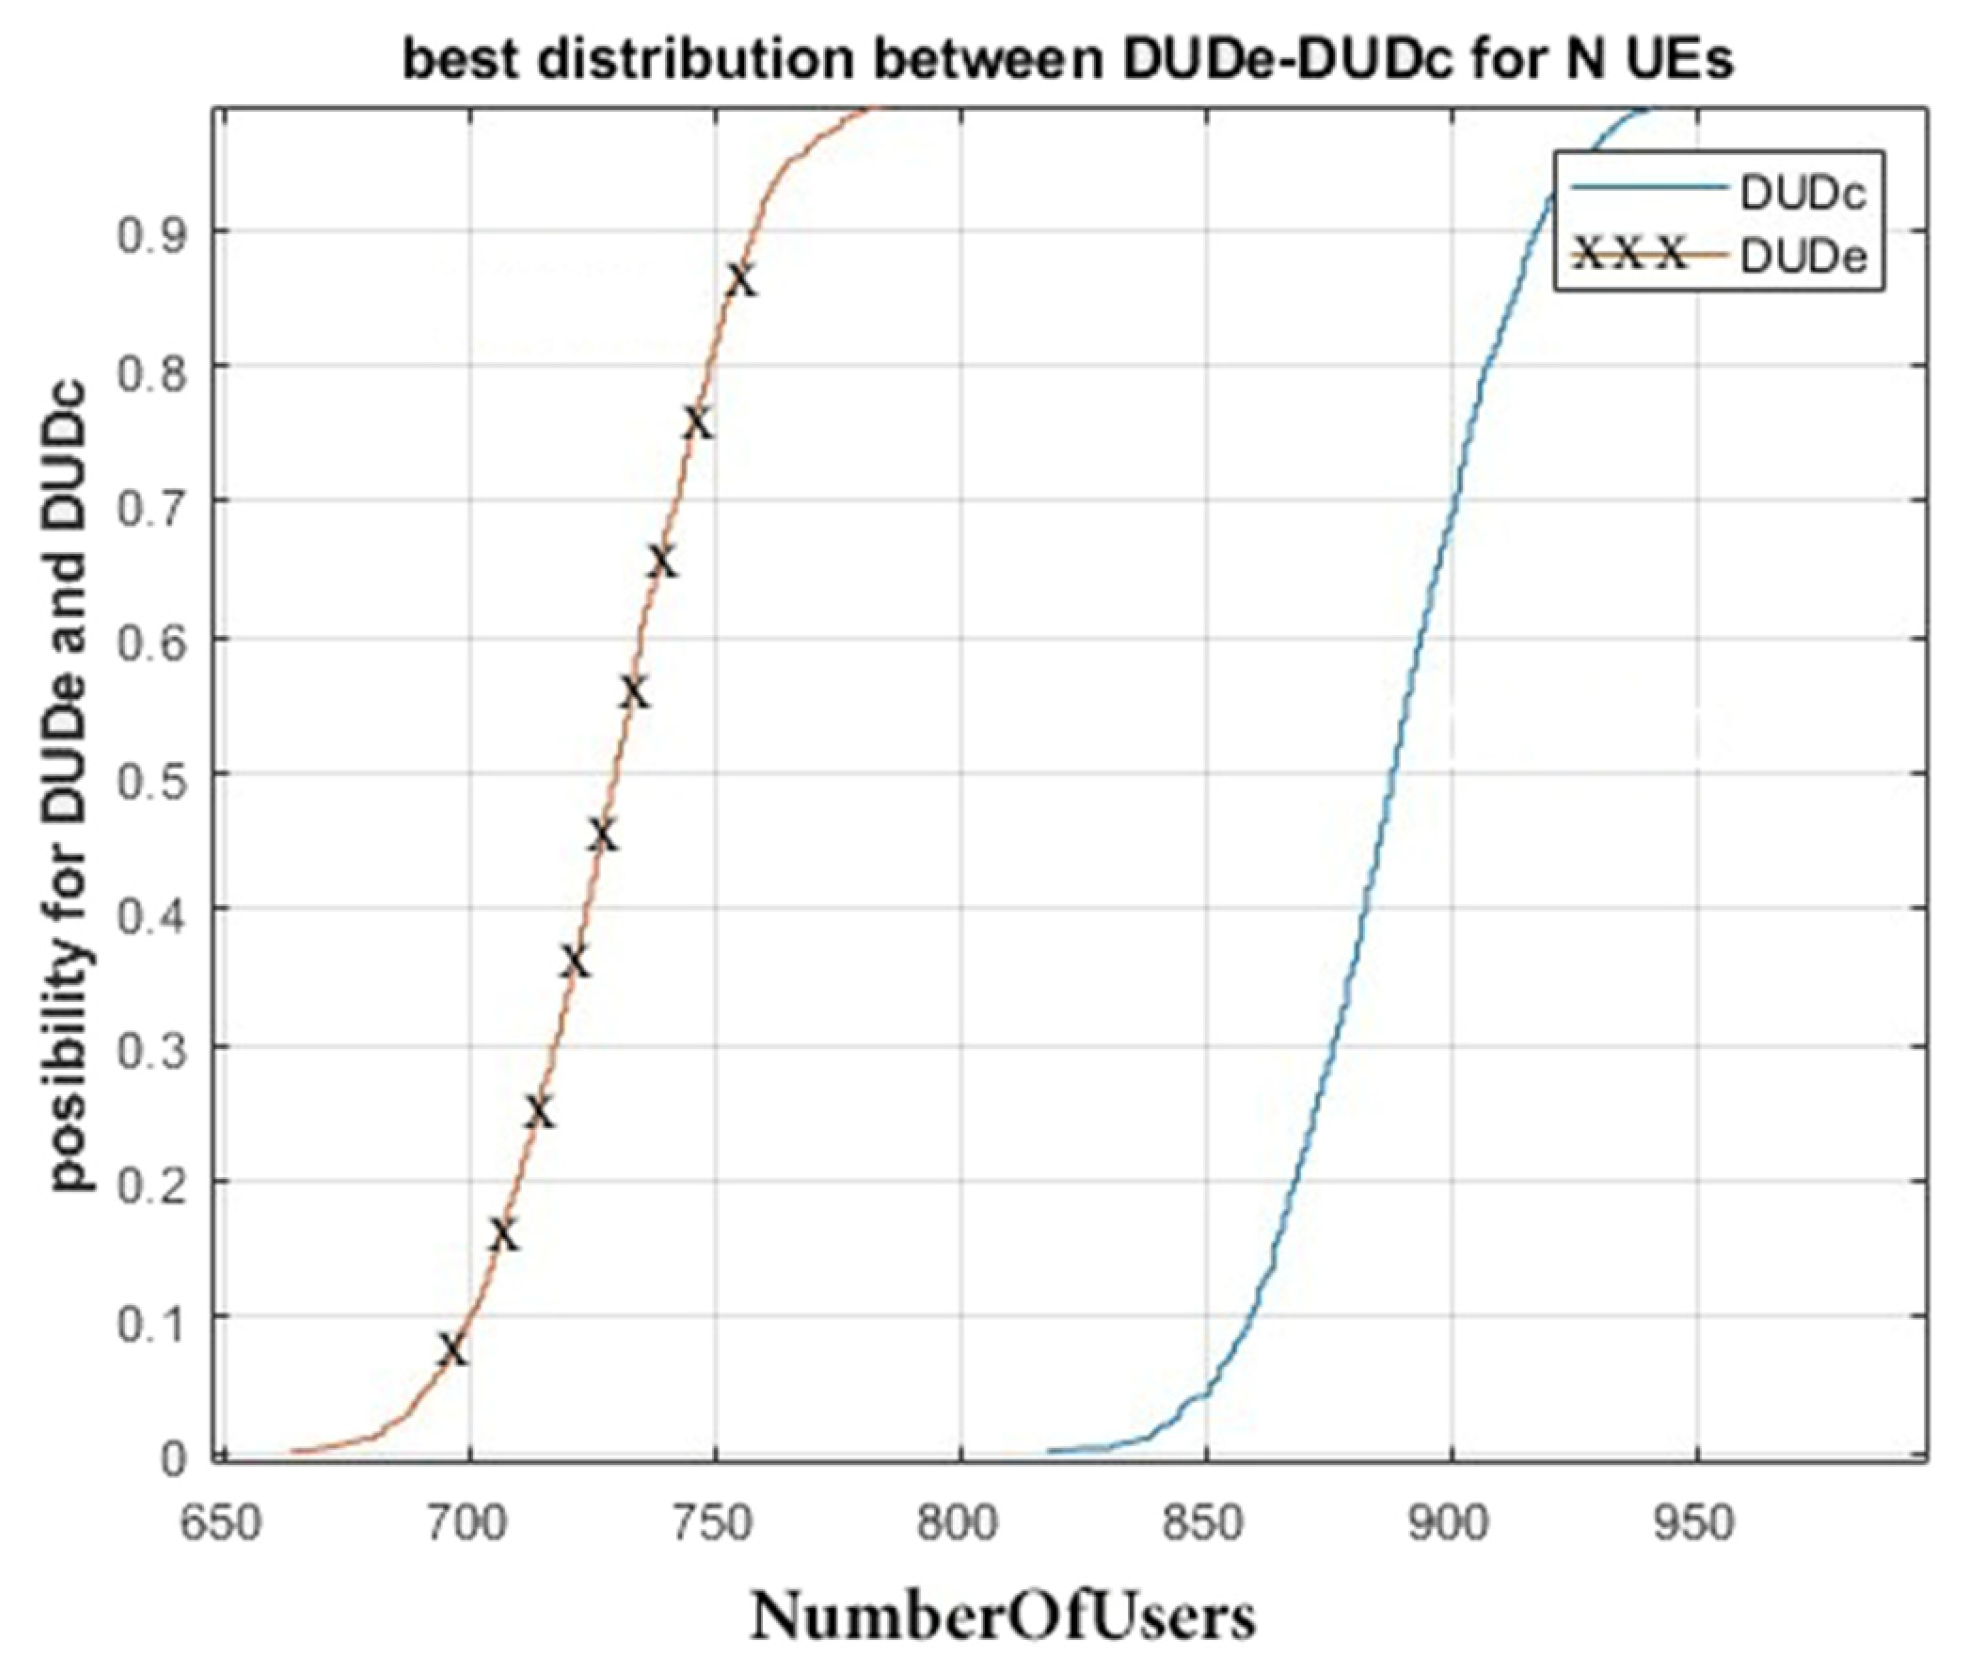
Continuing our investigation, the scenario involving 2000 UEs reveals intriguing insights.
Figure 16 illustrates the average assignment of UEs to BSs during this simulation. Notably, DUDe technology exhibited an average user distribution of approximately 750 users, while DUCo technology presented roughly 850 users per BS. This observation highlights a conspicuous difference of about 12.50% in Favor of DUDe technology, reiterating its capacity to maintain a balanced user allocation, even when dealing with a larger UE population.
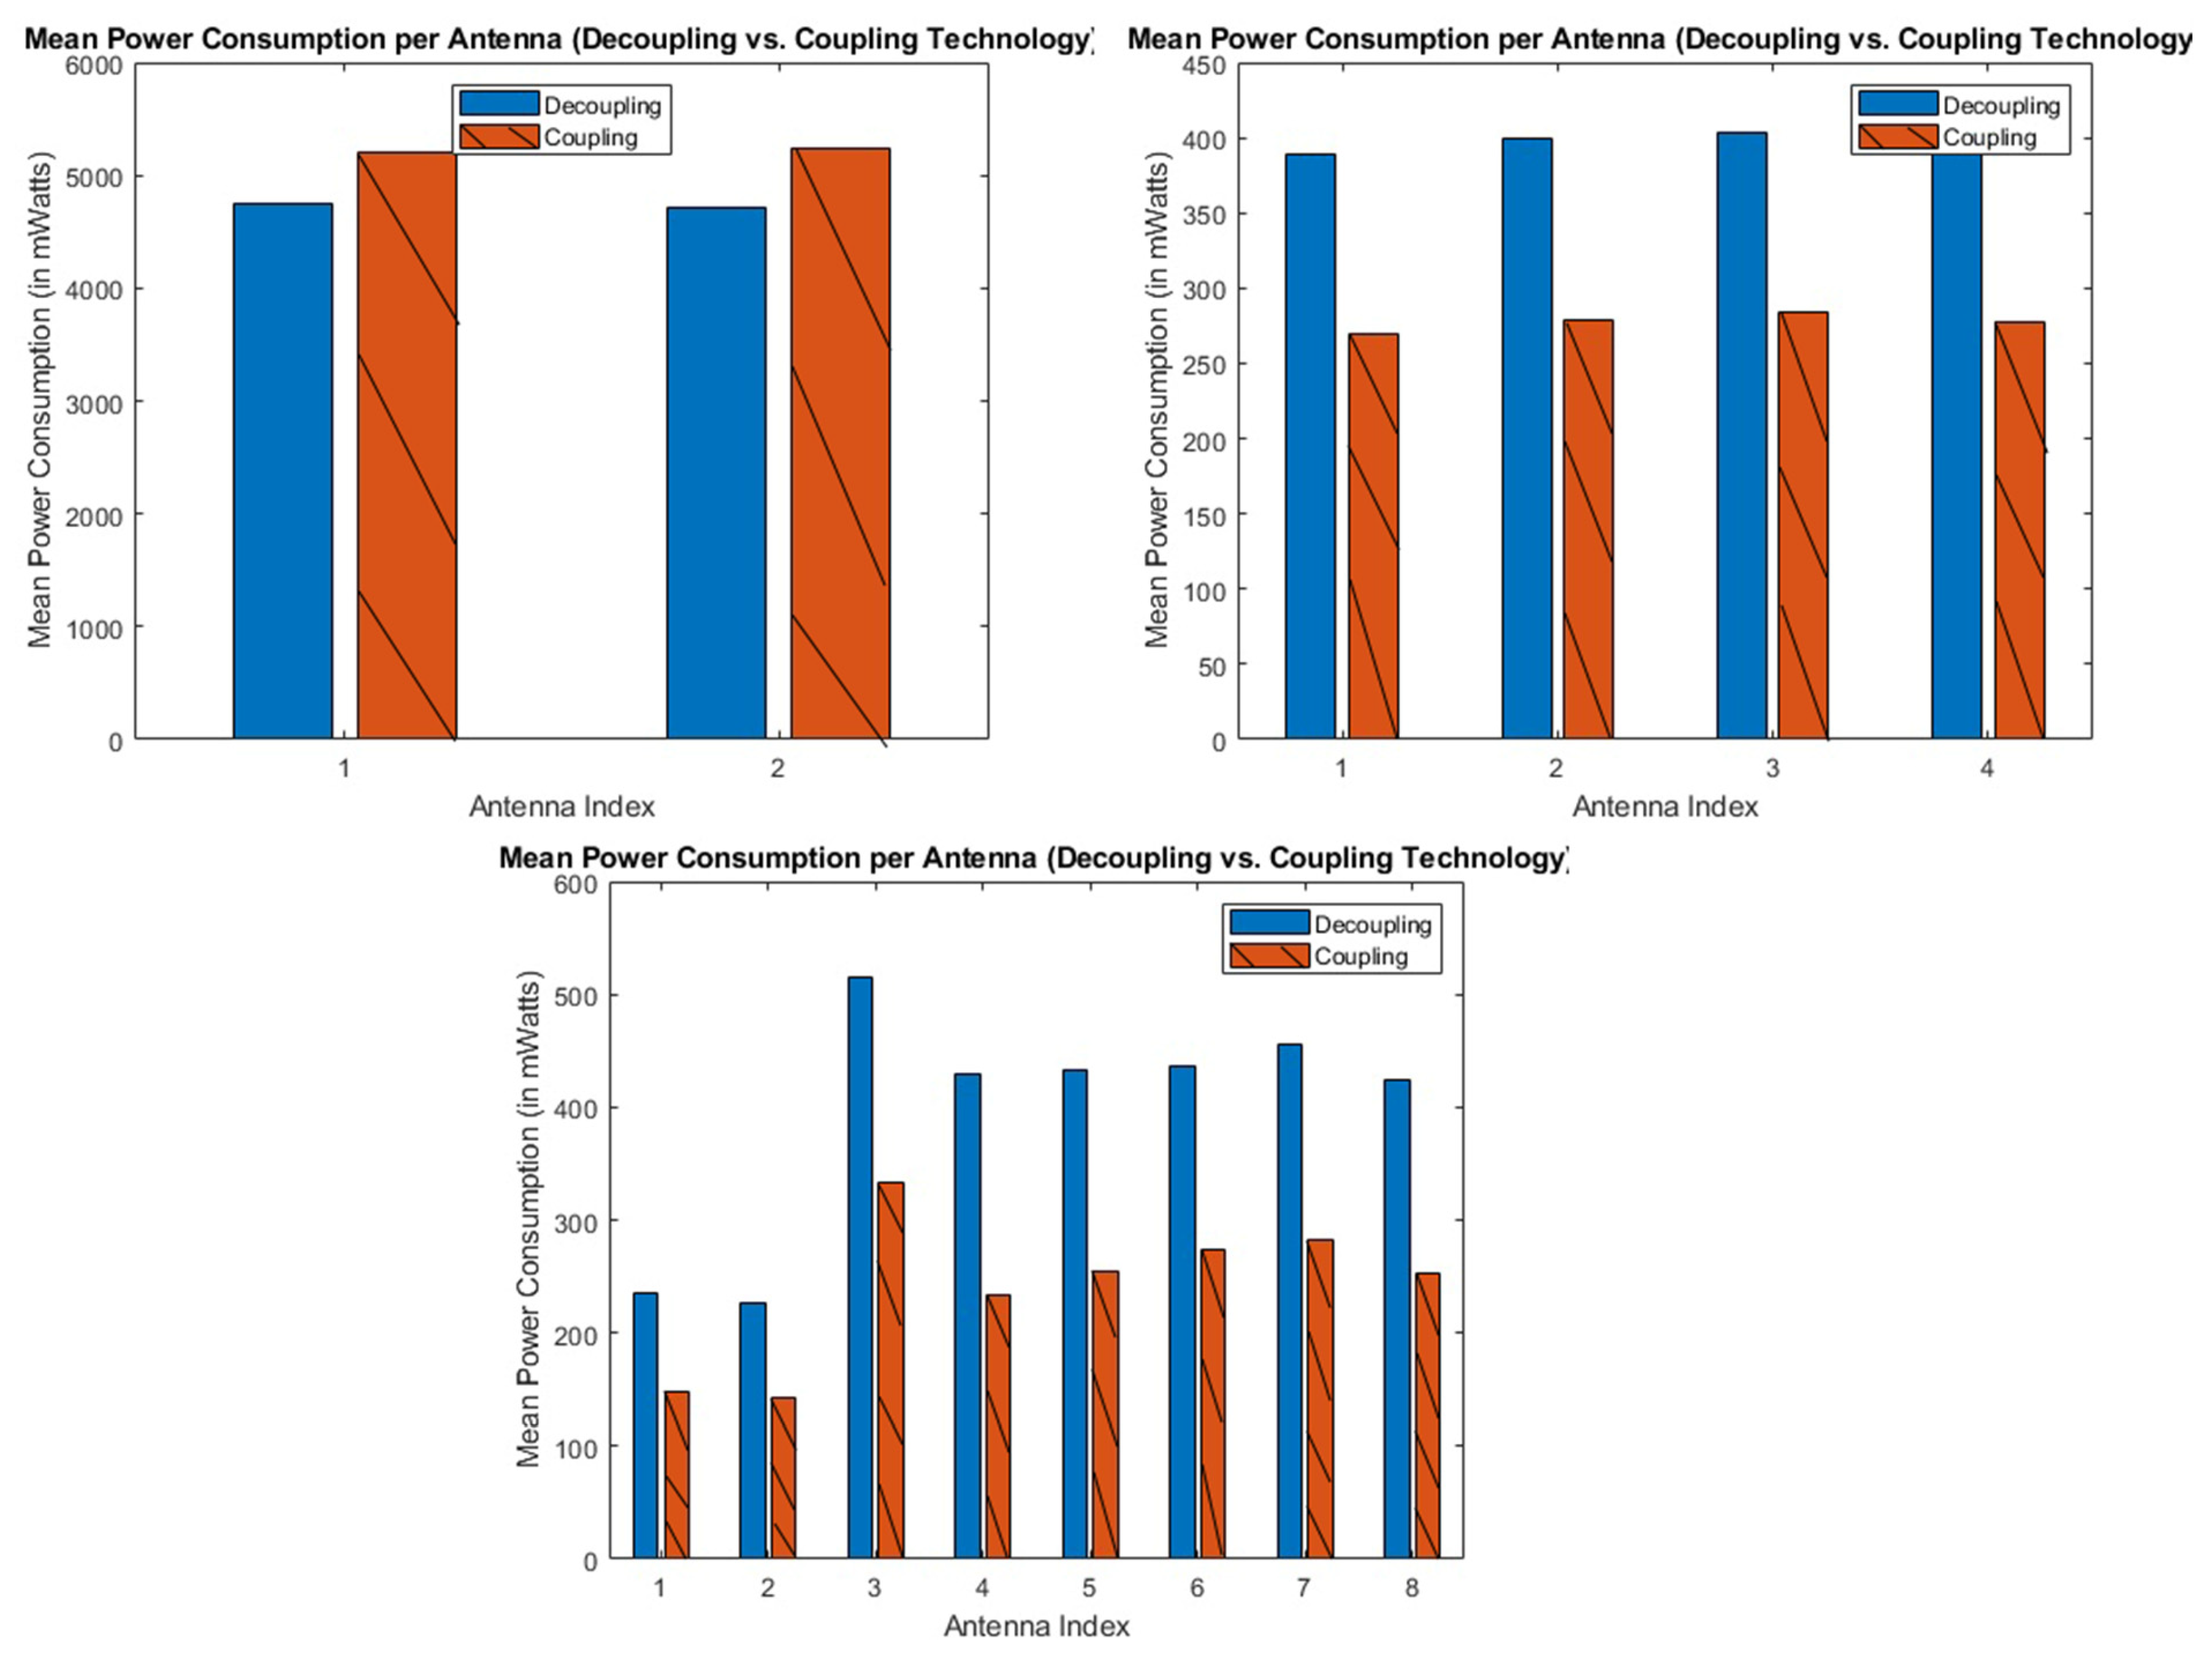
As we progress to
Figure 17, our scrutiny narrows down to the intricate patterns of energy consumption across BS types, distinguishing between Macro, Micro, and Pico BSs. These detailed assessments pertain to the simulation involving 2000 UEs. Notably, within the Macro BS category, DUDe technology exhibited an average power consumption of 4734 mW for Macro 1 BS and 4718 mW for Macro 2 BS. In contrast, the DUCo technology demonstrated an average power consumption of 5213 mW for Macro 1 BS and 5229 mW for Macro 2 BS. This variance translated into a substantial percentage difference, approximately 9.63% for Macro 1 BS and 10.27% for Macro 2 BS, favoring DUDe technology. These findings emphasize the energy efficiency of DUDe technology, particularly within the realm of Macro BSs, even when managing an increased UE count. It is important to acknowledge that larger BSs typically exhibit higher energy consumption in comparison to their smaller counterparts. In the DUDe approach, where users are evenly distributed among multiple BSs, energy consumption escalates due to the larger user base being served. This strategic distribution effectively prevents Macro BSs from becoming overwhelmed with a substantial number of users, mitigating the associated electricity consumption observed in DUCo technology. Consequently, as the network accommodates more users, the disparity in energy consumption between DUDe and DUCo becomes increasingly pronounced.
In conclusion, the decision to opt for either DUDe or DUCo hinges on a multitude of factors, including network capacity, coverage requirements, and overall efficiency. This decision-making process necessitates a thoughtful consideration of the trade-off between energy consumption and the attainment of a balanced user distribution. Furthermore, it is imperative to emphasize that throughout our simulations, the DUDe approach consistently delivered superior total energy consumption across all BSs, as indicated in
Table 2. DUDe consistently achieved energy savings ranging from 5.95% to 10.60% in comparison to DUCo, reinforcing its steadfast energy-efficiency advantage across diverse scenarios.
In summary, our extensive simulations and meticulous analysis have yielded compelling evidence that aligns with our initial hypothesis. The findings consistently affirm that DUDe technology outperforms DUCo technology when it comes to network management and energy consumption. Importantly, these advantages of DUDe technology become increasingly evident as the number of UEs in the network rises.
7.2. Evaluation and Analysis Scenario for Rural Area
In what follows we focus on conducting experimental inquiries within a specific provincial area, by adjusting key parameters in MATLAB’s nrPathLoss function to observe their impact on our research outcomes. Our goal is to investigate how modifications within this region influence the results of our experiments.
In the simulations, a 4 × 4 square area was utilized to assess each technology performance, as depicted in
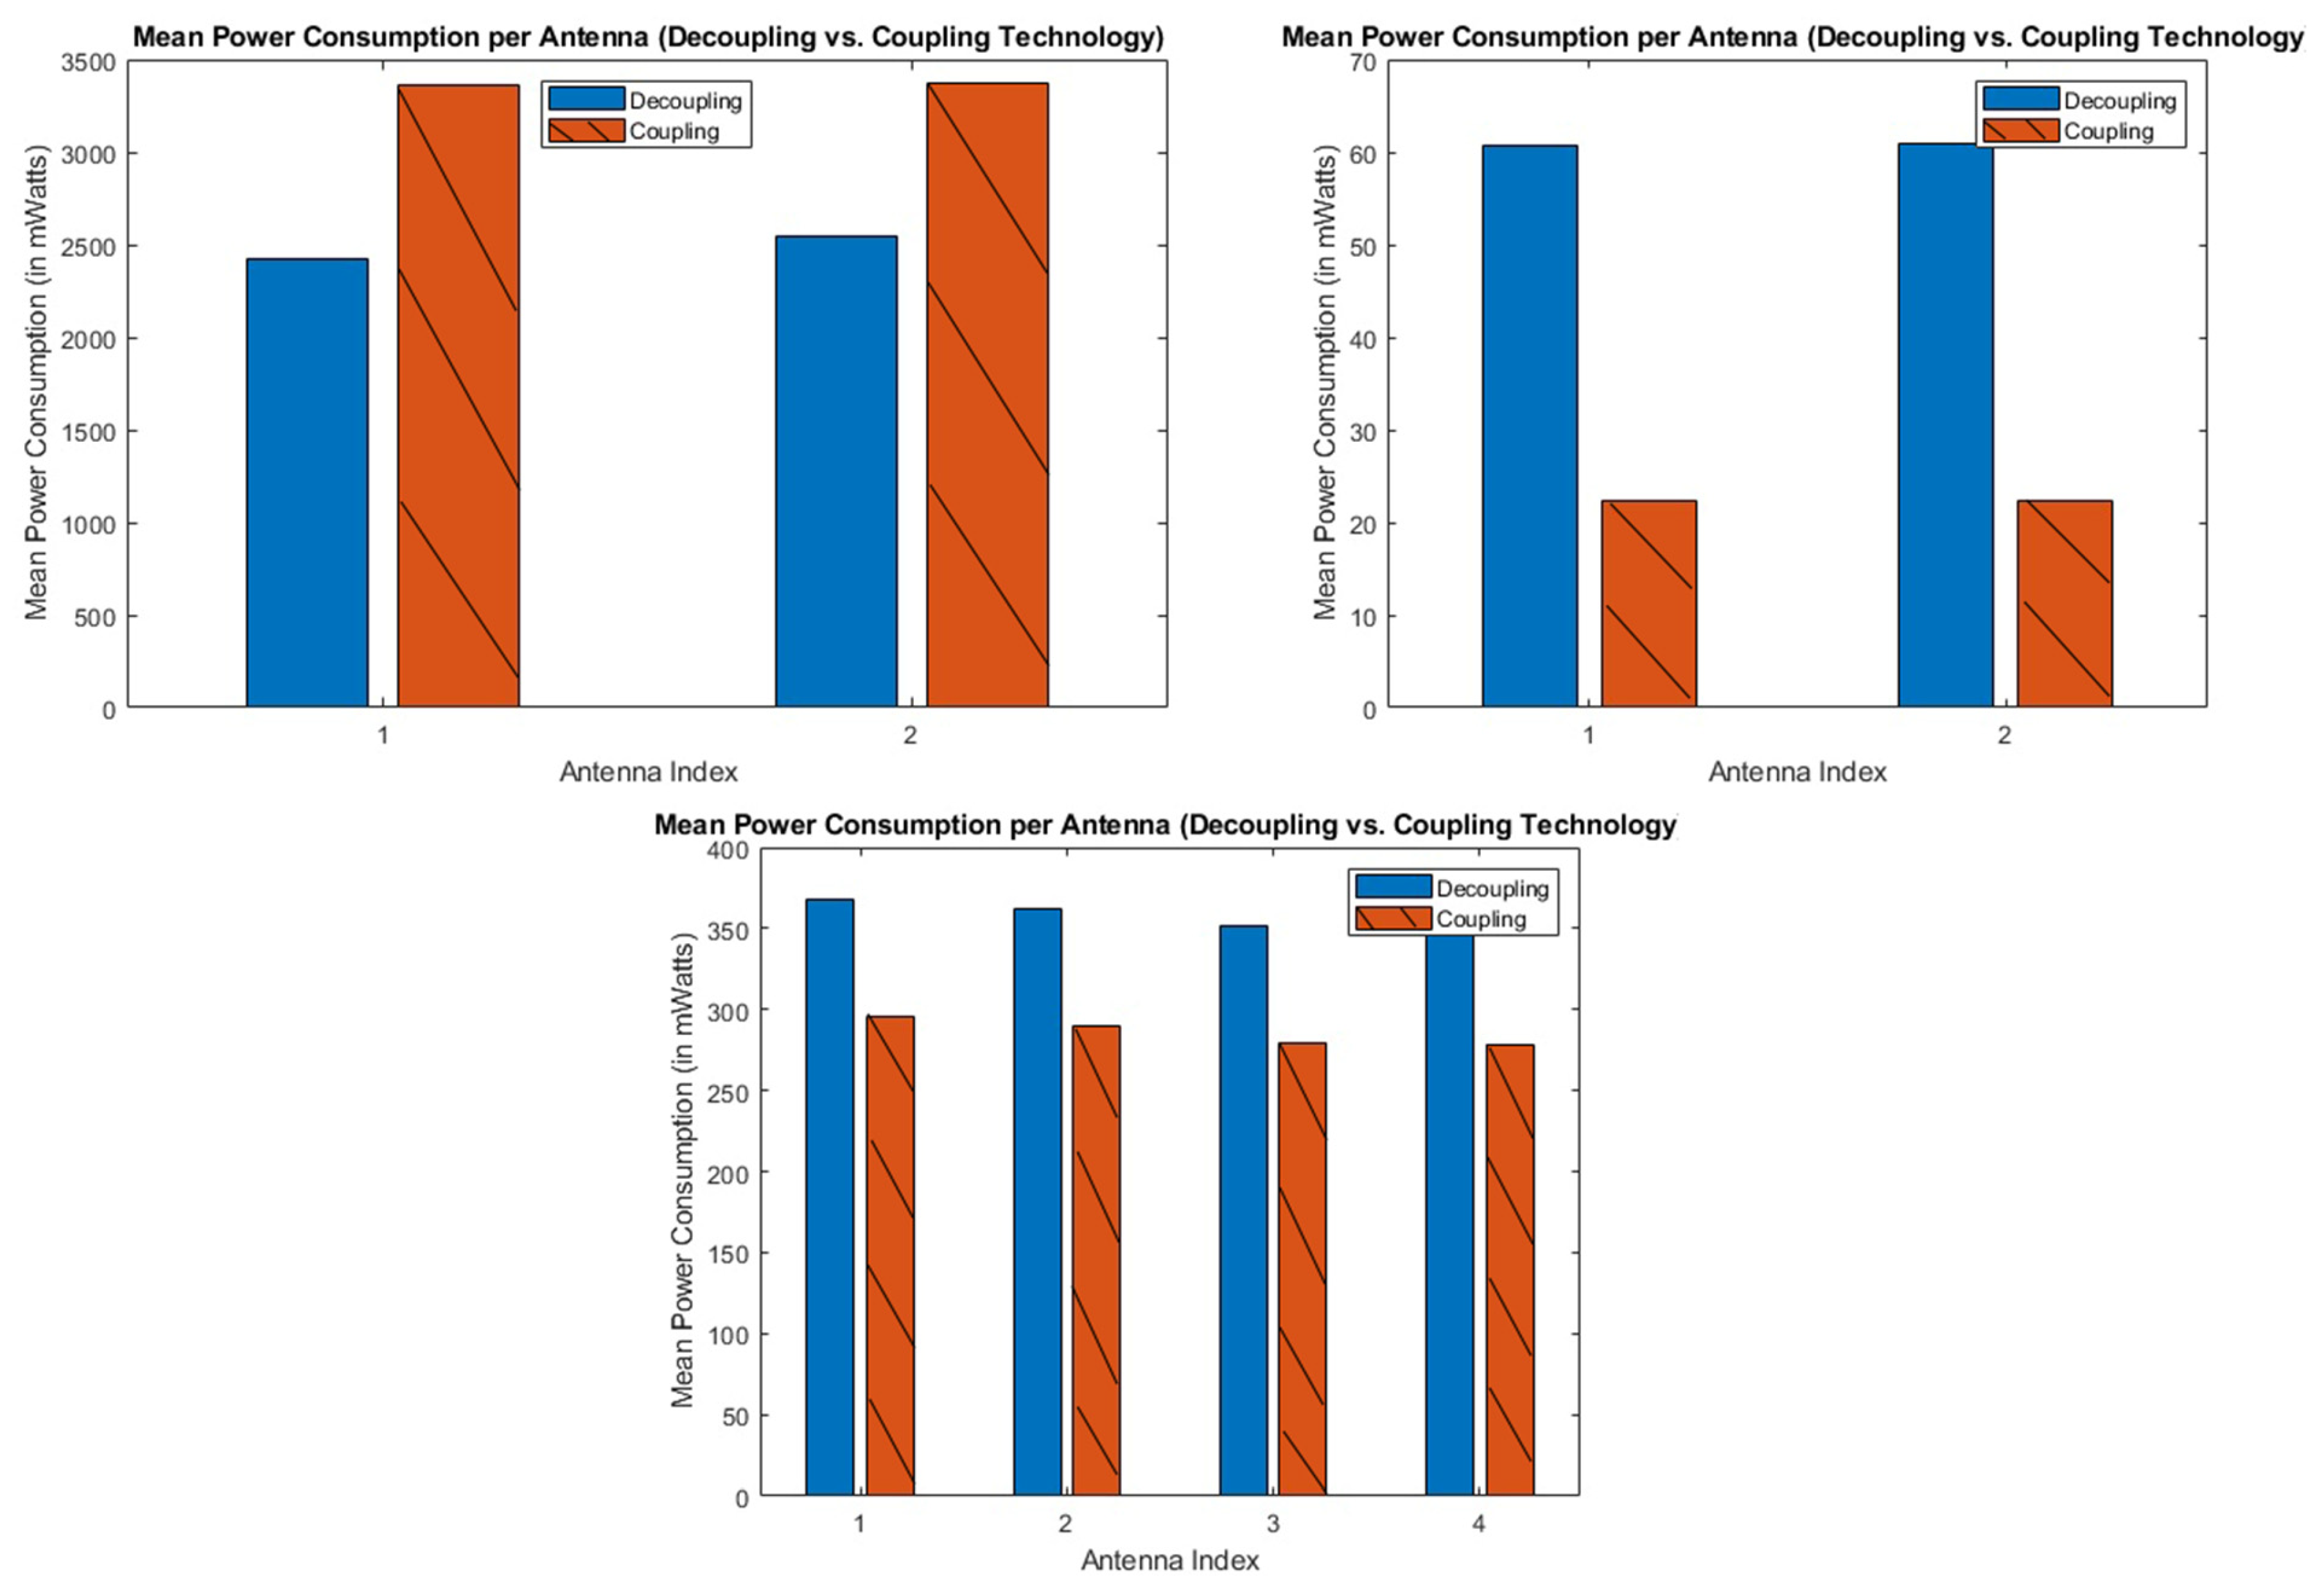
Figure 3 within the section describing the simulation environment. This defined region served as the spatial domain for conducting experiments and analyses, providing insights into the behaviors and conclusions derived from the technologies under examination. To emulate different levels of network congestion, varying numbers of UEs—1000 and 2000—were employed during the simulations.
Upon thorough completion
Figure 18 and meticulous analysis of our experimental procedures, we have arrived at the following conclusive observations: Primarily, it is evident that the characterization of the area, be it urban or rural, does not exert any discernible influence on either our original hypothesis or the fundamental motivation behind conducting these specific experiments. Remarkably, DUDe technology remains steadfast as the most energy-efficient solution for the entirety of the network infrastructure. Its superior efficiency stems from its adept ability to efficiently distribute users across smaller antennas, thereby conserving valuable resources within the macro BS. This allocation not only facilitates the seamless integration of new users into the network but also enhances the overall service quality provided to existing users within this network framework.
7.3. Bandwidth Allocation (Dude vs. Duco)
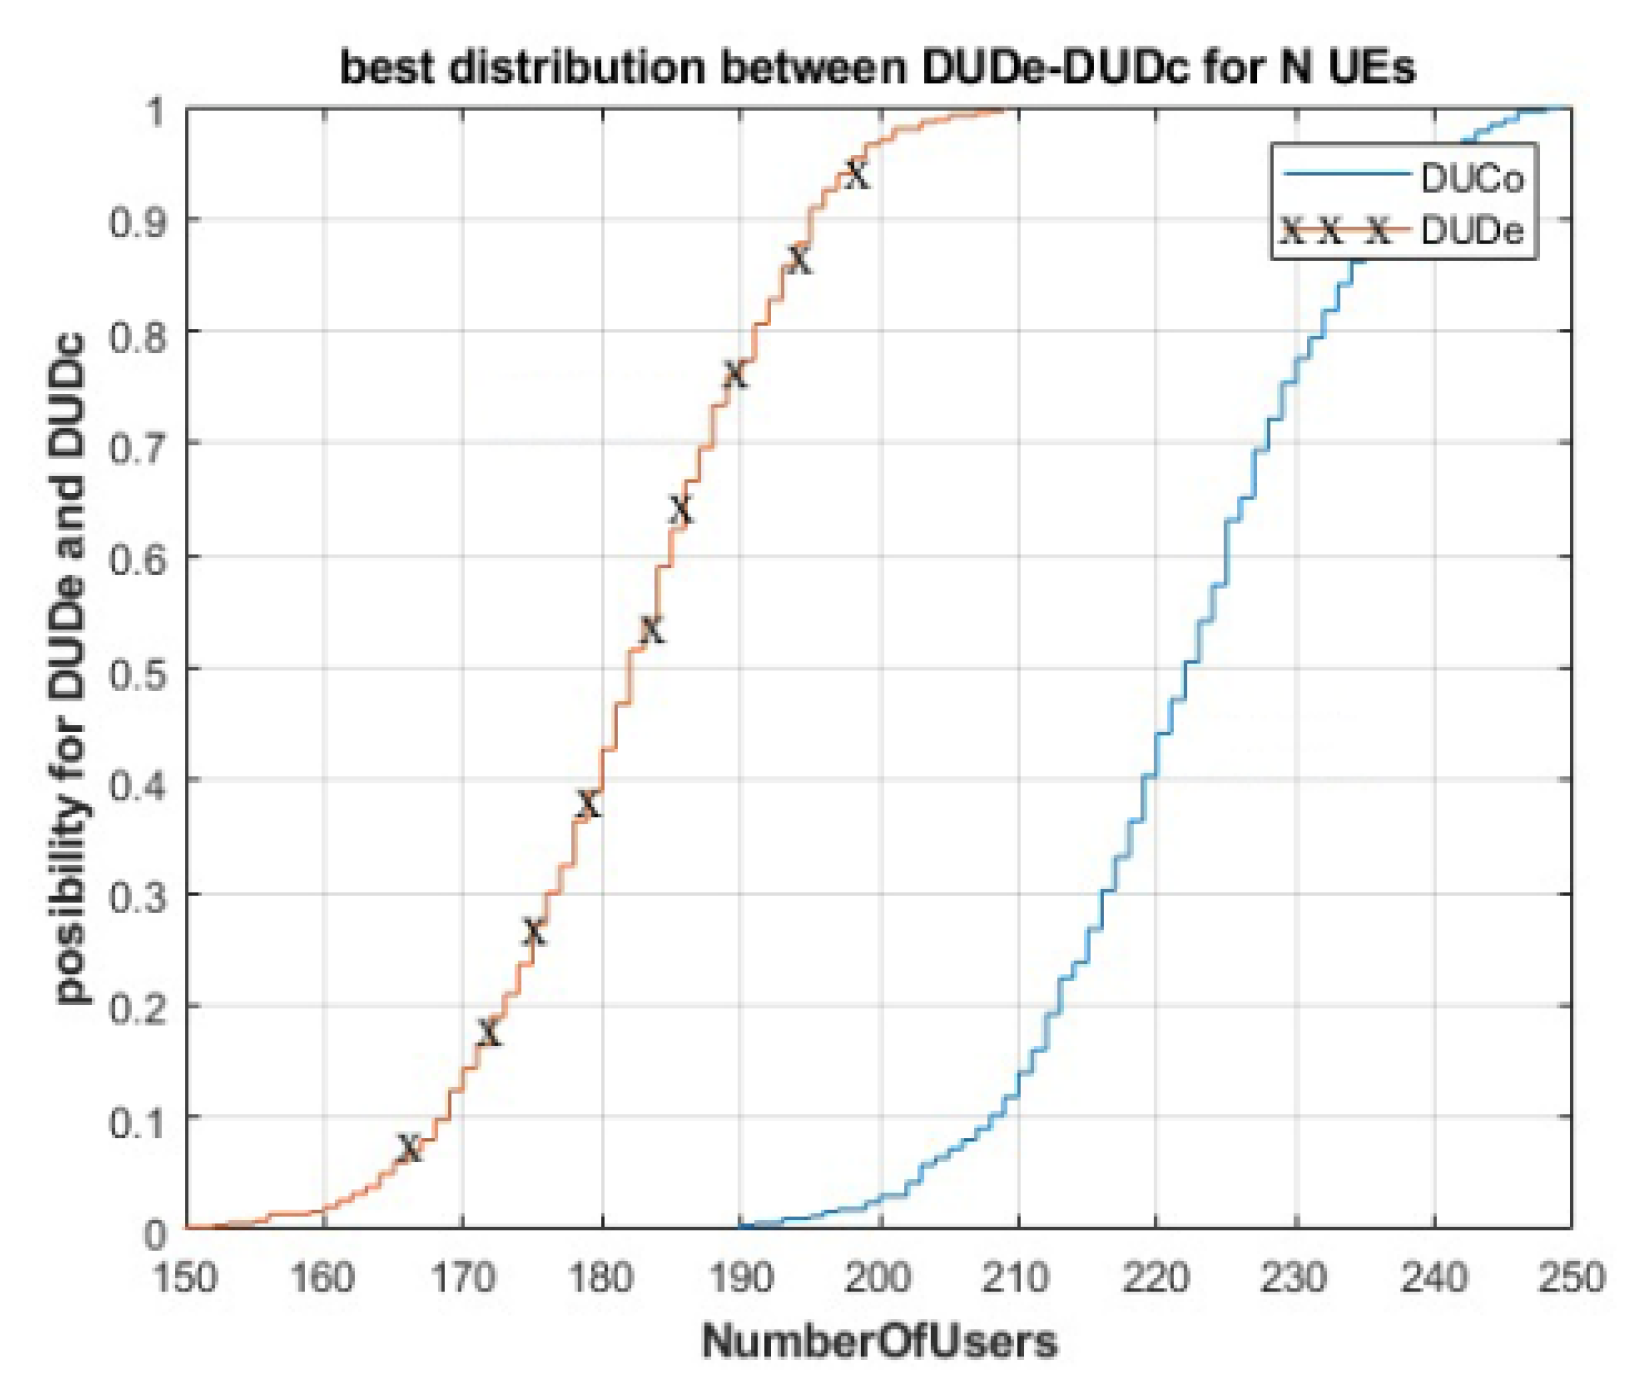
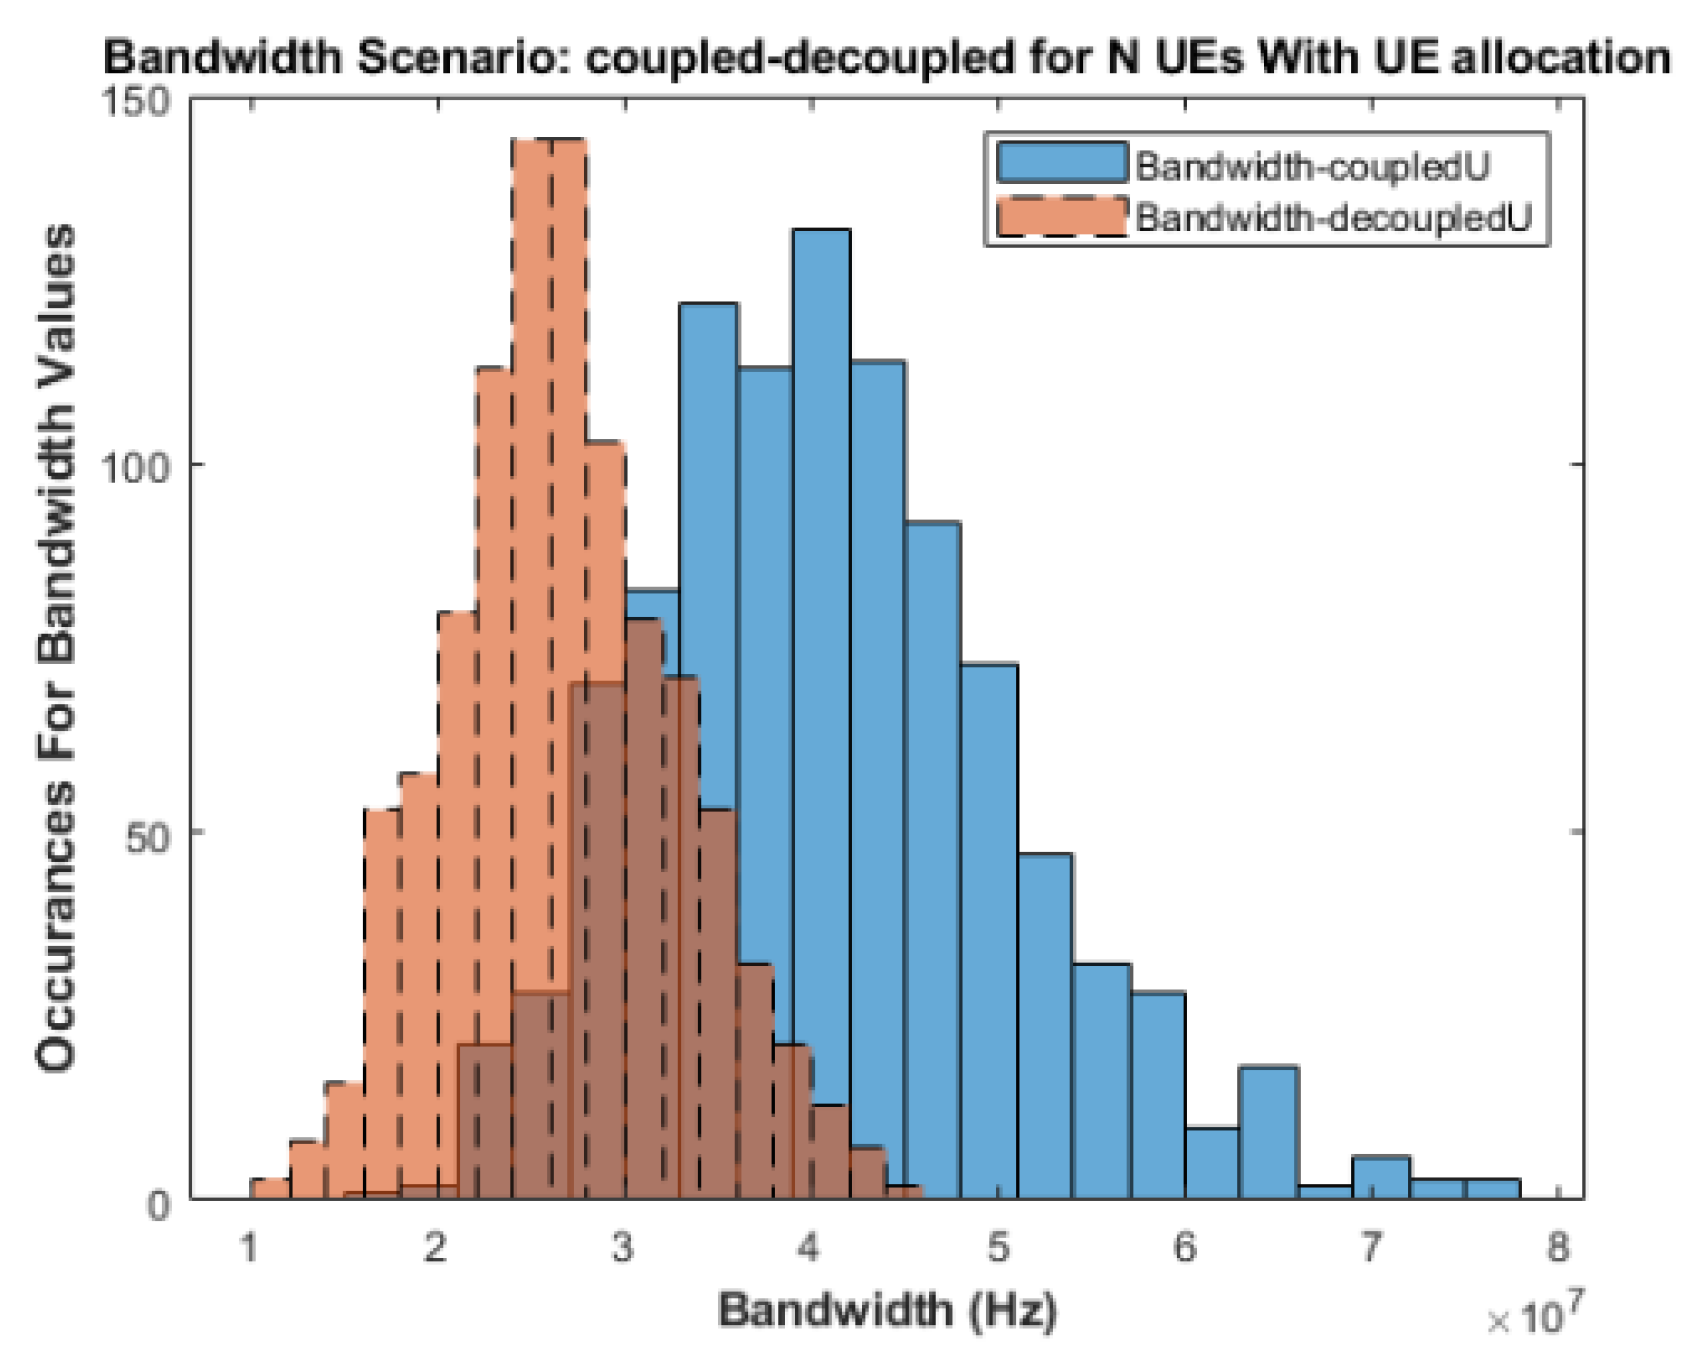
To complement the evaluation of energy efficiency, an additional metric based on bandwidth allocation is considered, highlighting the impact of DUDe and DUCo on spectrum usage at the macro tier. A comparison between the two schemes was conducted using the same heterogeneous 5G layout as in the related study. For each snapshot, UE service requirements were mapped to data rates and converted to bandwidth through the Shannon–Hartley relation, after which the bandwidth consumed at the macro tier was measured and the resulting distributions collected across multiple runs.
Figure 19 presents the histograms for both association policies, showing that DUDe leads to lower bandwidth demand at the macro tier, thereby leaving additional capacity for other users. Detailed simulation settings and the complete evaluation for different user loads (100/200/400 UEs) are provided in [
27].
8. Conclusions
In conclusion, this journal has presented the DUDe technology as a pioneering approach designed to enhance the energy efficiency of 5G networks. The research has underscored the significant benefits of DUDe, especially in terms of optimizing user allocation and achieving a substantial reduction in total energy consumption, in direct comparison to the conventional DUCo techniques. Through the extensive simulations and comprehensive evaluations conducted in this study, the efficacy of DUDe in elevating network performance while concurrently minimizing energy consumption has been unequivocally demonstrated.
Looking ahead, there are specific directions for future research that merit attention, particularly in the context of the concluding remarks and avenues for further exploration. A paramount advantage of DUDe technology is its prowess in significantly curtailing the overall energy consumption within 5G networks. By dynamically optimizing power allocation, resource utilization, and network configuration, DUDe effectively curbs superfluous energy expenditure. The decoupling of DL and UL transmissions empowers DUDe to allocate power with precision, thereby mitigating wasteful energy consumption. The outcomes of this research have irrefutably highlighted a substantial reduction in overall energy consumption when compared to DUCo techniques, thereby emphasizing the pronounced energy efficiency achievements attained by DUDe.
A key limitation of this study lies in its reliance on simulations rather than real-world deployment. Although the models and algorithms employed were carefully designed to capture essential aspects of heterogeneous 5G environments, they cannot fully reproduce the complexity and variability inherent in operational networks. Factors such as environmental interference, hardware imperfections, user mobility patterns, and unpredictable traffic behaviors remain outside the scope of the present analysis. The absence of physical experiments also means that hardware constraints, implementation costs, and unforeseen trade-offs were not evaluated. This choice was primarily motivated by the significant cost and complexity involved in setting up large-scale testbeds. Nonetheless, future work will focus on experimental validation through real-world trials, enabling a more comprehensive assessment of hardware impairments, signaling overhead, and system integration challenges, thereby complementing the simulation-based findings with empirical evidence. Moreover, the simulation methodology itself carries inherent restrictions. Randomized user distributions within predefined urban and rural areas ensured methodological consistency but do not necessarily reflect realistic user mobility and behavior, which can significantly influence energy consumption and user allocation outcomes. Similarly, the analysis was constrained to specific UE transmit power levels of 20 dBm and 30 dBm. While these thresholds align with common industry standards, they do not account for scenarios involving a broader range of transmit powers or adaptive power control strategies that dynamically respond to network conditions. In particular, the present results focus on UE transmit–linked energy and downlink aggregation; incorporating BS operational/base power and load-dependent efficiencies would likely amplify DUDe’s macro-tier benefits when load shifts away from Macro BSs. A calibrated BS-power model integration is programmed for future work. Extending the study to include such adaptive mechanisms could provide additional insights into energy efficiency under more diverse operational circumstances.
Another limitation arises from the fixed nature of the simulated network topologies. The study assumed predetermined configurations of Macro, Micro, and Pico base stations, whereas practical networks frequently undergo dynamic adjustments due to evolving user demands, equipment failures, or planned expansions. The omission of such adaptive topological changes may limit the generalizability of the findings. Finally, while the simulation-based outcomes presented here are promising, only real-world testing can confirm their robustness and reveal any hidden constraints that might affect the practicality of DUDe in live deployments. Recognizing these limitations defines the scope of this research clearly, while also outlining a path for future investigations. By addressing these gaps—through empirical validation, adaptive user modeling, and broader transmission power exploration—future studies can provide a more holistic understanding of DUDe and strengthen its role as a foundation for energy-efficient 5G and beyond.
Finally, while the present study focuses on evaluating the relative energy impact of DUDe and DUCo through detailed per-UE transmit-power modeling and downlink energy aggregation, future extensions will incorporate a more comprehensive base station operational energy model. This enhancement will account for static and dynamic power components, including base/idle consumption, load-dependent amplifier efficiency, and backhaul-related energy costs for Macro, Micro, and Pico tiers. Integrating these parameters will enable a more holistic understanding of the total network energy footprint and provide deeper insights into how DUDe influences overall system efficiency under realistic operational conditions. Furthermore, future work will explore adaptive power-control mechanisms, machine-learning-based association strategies, and joint optimization with cell-sleep or beamforming techniques, which are expected to further amplify the energy savings achieved through DUDe.
9. Future Work
In the realm of future work, there exists fertile ground for exploration and innovation. One promising avenue for further research involves the integration of DUDe technology with other energy-saving mechanisms and advanced network optimization strategies. This synergistic approach holds the potential to maximize energy efficiency, delivering even more substantial energy savings and performance enhancements. By delving deeper into these integrative possibilities, researchers can contribute to a richer and more robust understanding of energy-efficient solutions in the context of 5G networks.
Furthermore, real-world experiments and field trials hold significant promises in shedding light on the practical implementation and performance of DUDe across diverse network environments. This empirical approach can provide valuable insights into how DUDe technology operates under real-world conditions, where various factors and variables may influence its efficacy. Gathering data and observations from these practical scenarios will enrich our comprehension of DUDe’s feasibility and impact, potentially leading to fine-tuning and optimization for real-world deployment. Also, the research shows good energy savings. It is noted that additional performance measures such as Quality of Experience (QoE), throughput, and latency could add value to future work. The current study indicates that these extra metrics may help in understanding the system’s overall performance better. Future research may include these measures to provide a clearer view of how the network behaves under different conditions. This approach can help in identifying areas that require more study and in improving the system’s design and operation. In addition, based on our findings, future work should focus also on field tests that can be conducted to determine how adjusting resource allocation and base station configurations might reduce energy consumption. Network operators could benefit from simple energy monitoring tools that provide real-time data, while managers can develop clear guidelines for maintenance and upgrades. These steps are expected to enhance energy efficiency in practical applications, offering tangible benefits for network performance and sustainability. In parallel, future efforts will advance beyond simulation by developing a small-scale DUDe prototype on an open RAN testbed and running campus-style trials with one macro-like gNB and several small cells in both urban-like and rural-like layouts. The evaluation will record UE transmit power, SINR/RSRP, throughput, latency, handover rate, and energy per bit, include QoE indicators under controlled mobility and load, and assess robustness to NLoS conditions and hardware impairments; to support reproducibility and operational uptake, the team will release datasets, configurations, and scripts, and derive simple operator guidelines and energy dashboards for real deployments.
In summation, the research presented in this article signifies a significant step forward in the pursuit of energy-efficient solutions for 5G networks. The promising results and potential avenues for future work open exciting possibilities for further enhancing the sustainability and performance of modern wireless communication systems. As the field of 5G networks continues to evolve, DUDe technology stands as a compelling contender in the ongoing quest for energy efficiency and network optimization.
