Article

A Novel ANFIS-Dynamic Programming Fusion Strategy for Real-Time Energy Management Optimization in Fuel Cell Electric Commercial Vehicles

1
School of Mechanical & Automotive Engineering, Liaocheng University, Liaocheng 252000, China
2
Beiben Trucks Group Co., Ltd., Baotou 014030, China
*
Author to whom correspondence should be addressed.
Electronics 2025, 14(23), 4601; https://doi.org/10.3390/electronics14234601
Submission received: 10 November 2025 / Revised: 21 November 2025 / Accepted: 22 November 2025 / Published: 24 November 2025

Abstract

The present study proposes an integrated real-time energy management strategy (EMS) that combines an adaptive neuro-fuzzy inference system (ANFIS) with dynamic programming (DP) to enhance the energy efficiency and system durability of fuel cell electric commercial vehicles (FCECVs). Firstly, a comprehensive DP framework was established to optimize the EMS offline, which simultaneously considers power allocation and automated manual transmission (AMT) gear-shifting to minimize hydrogen consumption (HC). Then, the DP framework was employed to determine optimal power allocation patterns of the FCECVs under various initial state-of-charge (SOC) battery conditions. Based on the DP results, a novel real-time EMS integrating ANFIS with DP solution was developed to formulate an efficient fuzzy inference system (FIS), where the ANFIS model was trained using the particle swarm optimization (PSO) algorithm. The proposed ANFIS-DP EMS was evaluated through extensive simulations under stochastic driving cycles, with performance comparisons against both the DP method and conventional charge-depleting and charge-sustaining (CD-CS) strategies. The experimental results demonstrate that the ANFIS-DP maintains efficient FCS operation across diverse driving conditions while effectively controlling the rate of power change within optimal ranges. Compared to the CD-CS strategy, the proposed method achieves a substantial 14.98% reduction in HC, approaching the performance of DP (only 5.40% higher). Most notably, the ANFIS-DP strategy demonstrates remarkable computational efficiency improvements, outperforming DP by 96.13% and CD-CS by 22.05%. These findings collectively validate the effectiveness of our proposed approach in achieving real-time energy management optimization for FCECVs.

1. Introduction

The continuous advancements in the automotive industry primarily focus on gradually replacing internal combustion engines-based (ICE-based) with battery electric vehicles (BEVs) and fuel cell electric vehicles (FCEVs) due to their exceptional ability to reduce greenhouse gas emissions [1,2]. Nevertheless, the potential of BEVs is limited due to the constraints imposed by battery technology, such as time-consuming recharging processes and a relatively shorter lifespan. In contrast, fuel cell systems (FCSs) are widely recognized as the preferable power source for automobiles in terms of energy density, ensuring an extended range and minimizing refueling duration [3]. As a result, hydrogen-powered fuel cell electric commercial vehicles (FCECVs) have emerged as a highly promising electrified transportation technology [4,5]. To address the slow dynamic response of FCSs, lithium-ion batteries or supercapacitors are typically integrated, resulting in a highly nonlinear and complex power system in FCECVs [6]. Thus, the optimization and coordination of multiple power sources, such as FCSs and batteries, continues to be a critical challenge, necessitating the development of advanced real-time EMS for FCECVs [7].
Effective energy management is essential for maximizing the energy-saving potential of FCECVs [8]. Rule-based strategies, valued for their simplicity and computational efficiency, are widely used for real-time energy management in FCEVs and are typically categorized into deterministic and fuzzy logic approaches [9,10]. Deterministic methods rely on predefined rules derived from empirical knowledge [11], whereas fuzzy logic controllers transform precise inputs into linguistic variables before converting them into control outputs through defuzzification [12]. However, due to their fixed structural design, rule-based strategies exhibit limited adaptability under dynamic driving conditions. This limitation has driven increasing interest in optimization-based approaches, which are broadly classified as global and real-time optimization strategies [13].
Global optimization techniques, such as dynamic programming (DP) and Pontryagin’s minimum principle (PMP), can achieve optimal performance when complete information about the driving cycle is available [14]. DP applies to both linear and nonlinear multistage decision processes [15], while PMP provides a theoretical framework that supports potential real-time implementation [16]. Heuristic algorithms—such as simulated annealing (SA), genetic algorithms (GAs), and particle swarm optimization (PSO)—offer alternative global optimization methods that have reduced computational complexity [17,18,19]. However, these methods often converge to suboptimal or local solutions. Additionally, gradient-based approaches like linear programming (LP) and convex programming (CP) simplify system models to derive near-optimal solutions [20,21]. Despite their advantages, global optimization methods typically require prior knowledge of the entire driving cycle and place significant computational demands, limiting their applicability primarily to offline benchmarking scenarios. Real-time optimization methods are more viable for online implementation [22]. The equivalent consumption minimization strategy (ECMS) is widely recognized for transforming the global optimization problem into a local one by introducing an equivalent factor (EF) [23]. However, ECMS performance is sensitive to the EF, which is usually calibrated to specific driving cycles, limiting its adaptability across varying operational conditions [24]. Model predictive control (MPC) is another prominent real-time approach that utilizes information from global positioning systems (GPS) or intelligent transportation systems (ITS) to anticipate future power demand [25,26]. Although prediction techniques such as Markov processes and neural networks can improve prediction accuracy [27], they also increase system complexity and computational burden.
Advances in artificial intelligence have significantly accelerated the development of learning-based EMSs. Techniques such as artificial neural networks (ANN), deep neural networks (DNN), support vector regression (SVR), and reinforcement learning (RL) have been increasingly adopted in recent studies [28,29]. Among these, RL and its variants—including deep reinforcement learning (DRL), Q-learning (QL), and deep Q-learning (DQL)—enable agents to learn optimal control policies through iterative interaction with the environment [30]. Recent applications include RL-based strategies for minimizing hydrogen consumption (HC) [31], DRL frameworks that incorporate terrain preview information to improve FCS efficiency [32] and fuzzy logic-enhanced QL for performance evaluation [33]. Although dual-reward QL has demonstrated improved learning capability [34], these methods typically require discretization of state and action spaces, resulting in high computational complexity in multi-dimensional systems. While DQL and double DQL (DDQL) alleviate this challenge through value function approximation [35,36], they are still limited to discrete action outputs. This inherent constraint poses significant challenges for the continuous control requirements of FCEV energy management.
A practical real-time EMS must effectively balance simplicity, computational efficiency, and energy conservation. For FCECVs equipped with automated manual transmissions (AMTs), integrating gear-shifting strategies with energy management requires careful consideration. Although optimization-based and learning-based techniques have made significant advances, their industrial implementation often requires extensive training datasets. In contrast, rule-based strategies offer superior computational efficiency and operational reliability for real-time applications. Among these, fuzzy logic control (FLC) has demonstrated notable effectiveness by generating continuous control parameters through predefined rule bases and membership functions, while maintaining robust performance under uncertain driving conditions [9,12]. Recent research has increasingly focused on optimizing FLC strategies using evolutionary computing methods. An interactive adaptive GA integrated with an FLC was developed for multi-objective optimization in a hybrid ultracapacitor-battery system [37]. Similarly, PSO has been applied to optimize FLC rule weights, thereby minimizing fluctuations in battery current and power peaks [38]. Another study proposed an FLC-based intelligent control technique utilizing a GA to tune control parameters, achieving improvements in both fuel efficiency and vehicle performance [39]. While such optimized FLC approaches maintain acceptable computational efficiency in real-time operation, they still face challenges related to the absence of guaranteed optimal solutions and substantial data requirements for practical deployment.
Recently, the adaptive neuro-fuzzy inference system (ANFIS) has gained widespread application across various domains. An ANFIS-based controller has been developed for autonomous navigation of differential-drive mobile robots in unknown environments [40]. Concurrently, a theoretical review comparing different neuro-fuzzy architectures has highlighted ANFIS as a particularly effective hybrid framework [41]. Notably, ANFIS preserves the real-time execution capability of conventional FLC while demonstrating enhanced performance in handling optimization under stochastic and uncertain conditions. These attributes render ANFIS especially suitable for energy management in FCECVs, where achieving optimal power distribution during dynamic operation remains a critical challenge. To clearly situate this study within the existing research, Table 1 presents a comparative summary of related works, highlighting their limitations and the specific innovations introduced in this work to address these gaps.
As shown in the table, the core novelty of this work lies in the synergistic integration of DP and an ANFIS to develop a robust real-time EMS. The key contributions of this research can be summarized as follows: (1) A DP-based optimization framework was formulated to achieve optimal power allocation between the FCS and battery pack, where the FCS’s power output and AMT’s gear-shifting operations were deliberately decoupled to enhance system controllability. (2) A training data acquisition method was developed based on the proposed DP framework, incorporating multiple initial state-of-charge (SOC) conditions to ensure comprehensive coverage of operational scenarios. (3) An innovative ANFIS-based approach was successfully implemented by integrating the DP-optimized solution, resulting in the development of a robust fuzzy inference system (FIS) for real-time energy management in FCECVs. Through this integration, efficient online optimization was achieved while maintaining system stability and performance.
The article is structured into six sections. Section 2 provides a comprehensive overview of the investigated FCECV models. Section 3 presents a DP-based EMS formulation for the FCECV, along with its solving process and validation. Subsequently, Section 4 introduces an ANFIS-DP optimization framework for the online energy management of the FCECV in combination with the DP solution. In Section 5, typical and stochastic driving cycles are deployed to evaluate the performance of the proposed method. Finally, Section 6 summarizes the conclusions.

2. FCECV Models

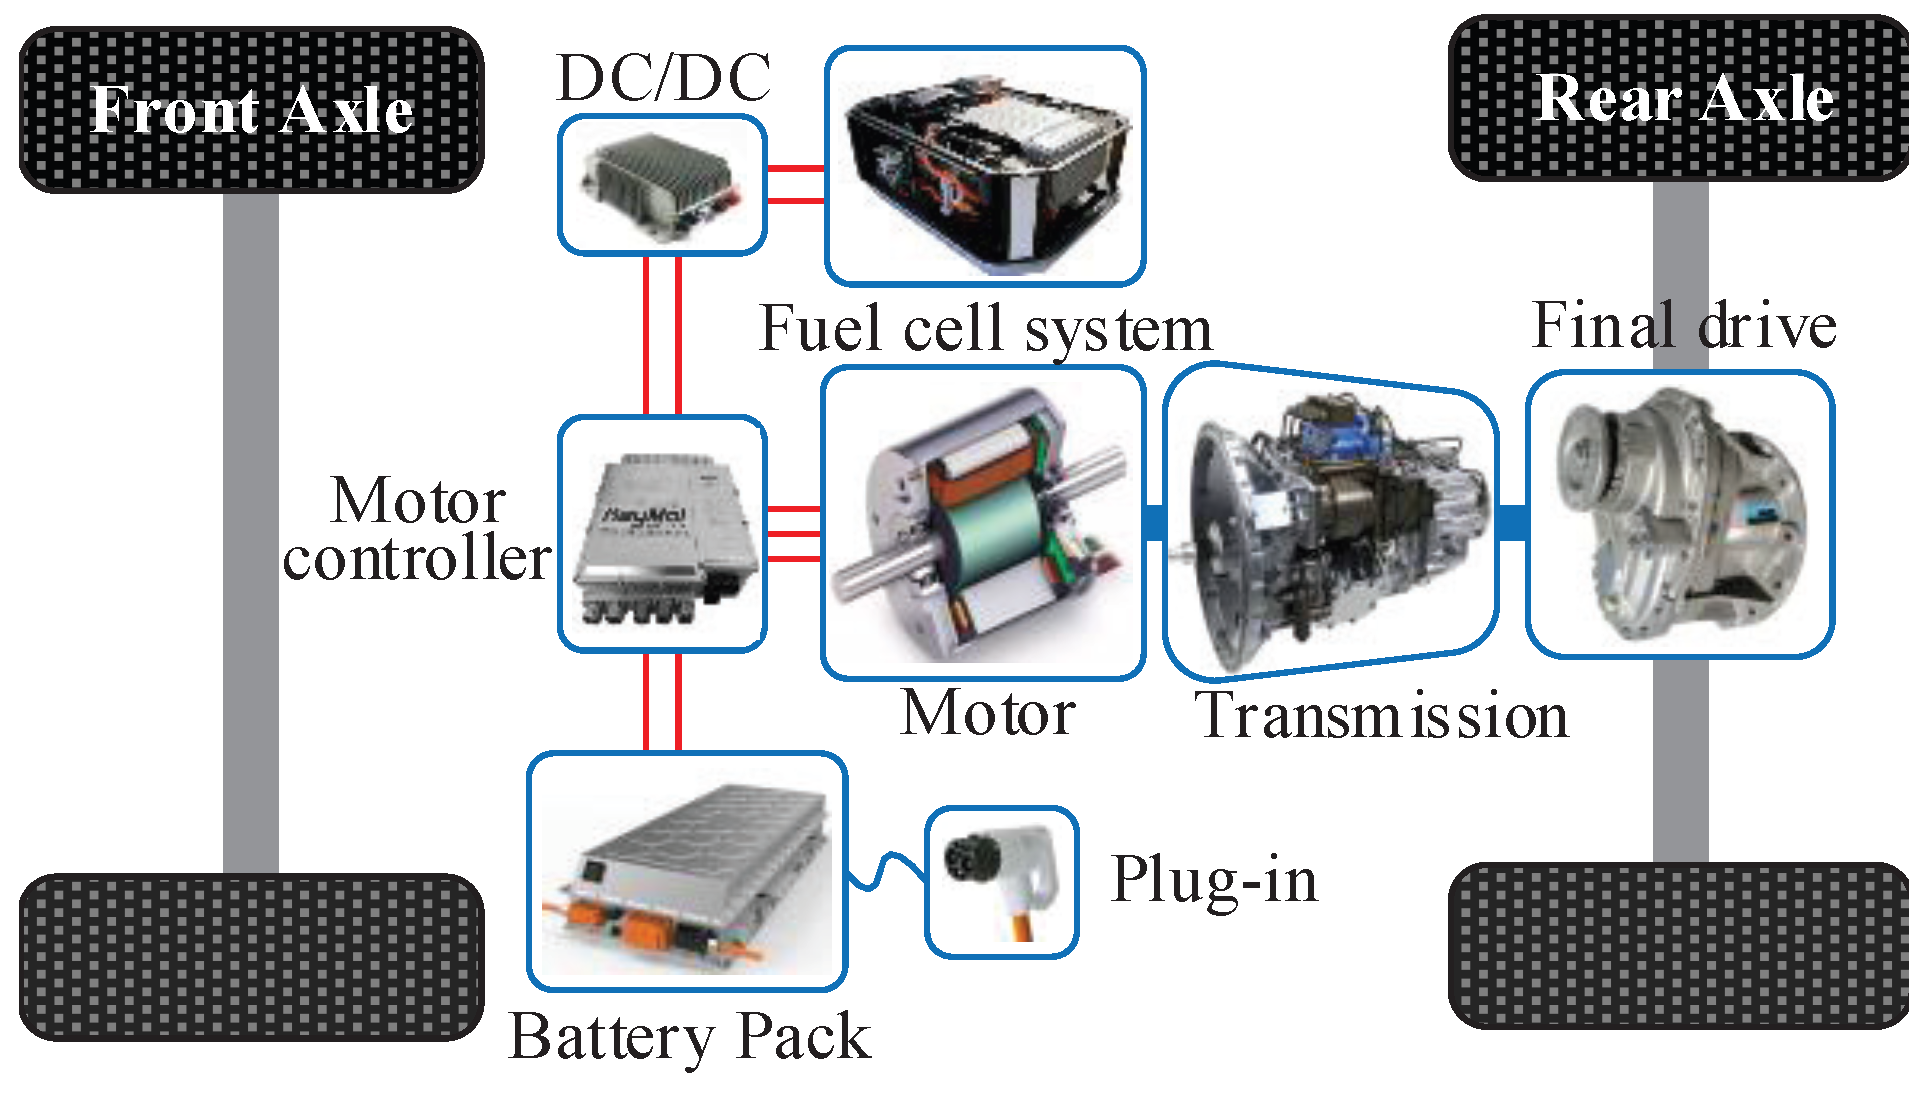
The present study examines an FCECV. Figure 1 depicts the FCECV’s driveline system, encompassing an electric motor, an AMT, and a final drive. The electric motor is mechanically linked to the AMT and the final drive. When the motor generates torque for driving or regenerating, the AMT and final drive collaborate to amplify the torque, providing sufficient force for propulsion or deceleration. The driveline system also integrates two power sources: an FCS and a battery pack, which supply power to the motor as needed. After voltage regulation by a DC/DC converter, the FCS is linked to the motor controller, while the battery pack is directly connected. Both power sources can provide power separately in low-power demand situations and simultaneously during high-power demand situations. The battery pack can also be recharged through plug-in charging from the power grid.

2.1. Motor Model

The FCECV was equipped with a permanent magnet synchronous motor, delivering a peak power of 350 kW and a peak torque of 2200 N · m. The motor is versatile as it can operate as a driving motor and a generator. Subsequently, a static motor model that considers driving and regenerative braking was established to address the energy management issue.
P m = T m · n m 9550 · 1 η m ( T m 0 ) T m · n m 9550 · η m ( T m < 0 ) ,
where P m is the power of the motor. T m and n m represent the torque and rational speed of the motor, respectively. η m is the motor’s efficiency, which can be determined by a function of the n m and T m , as shown in the following.
η m = f n m , T m .
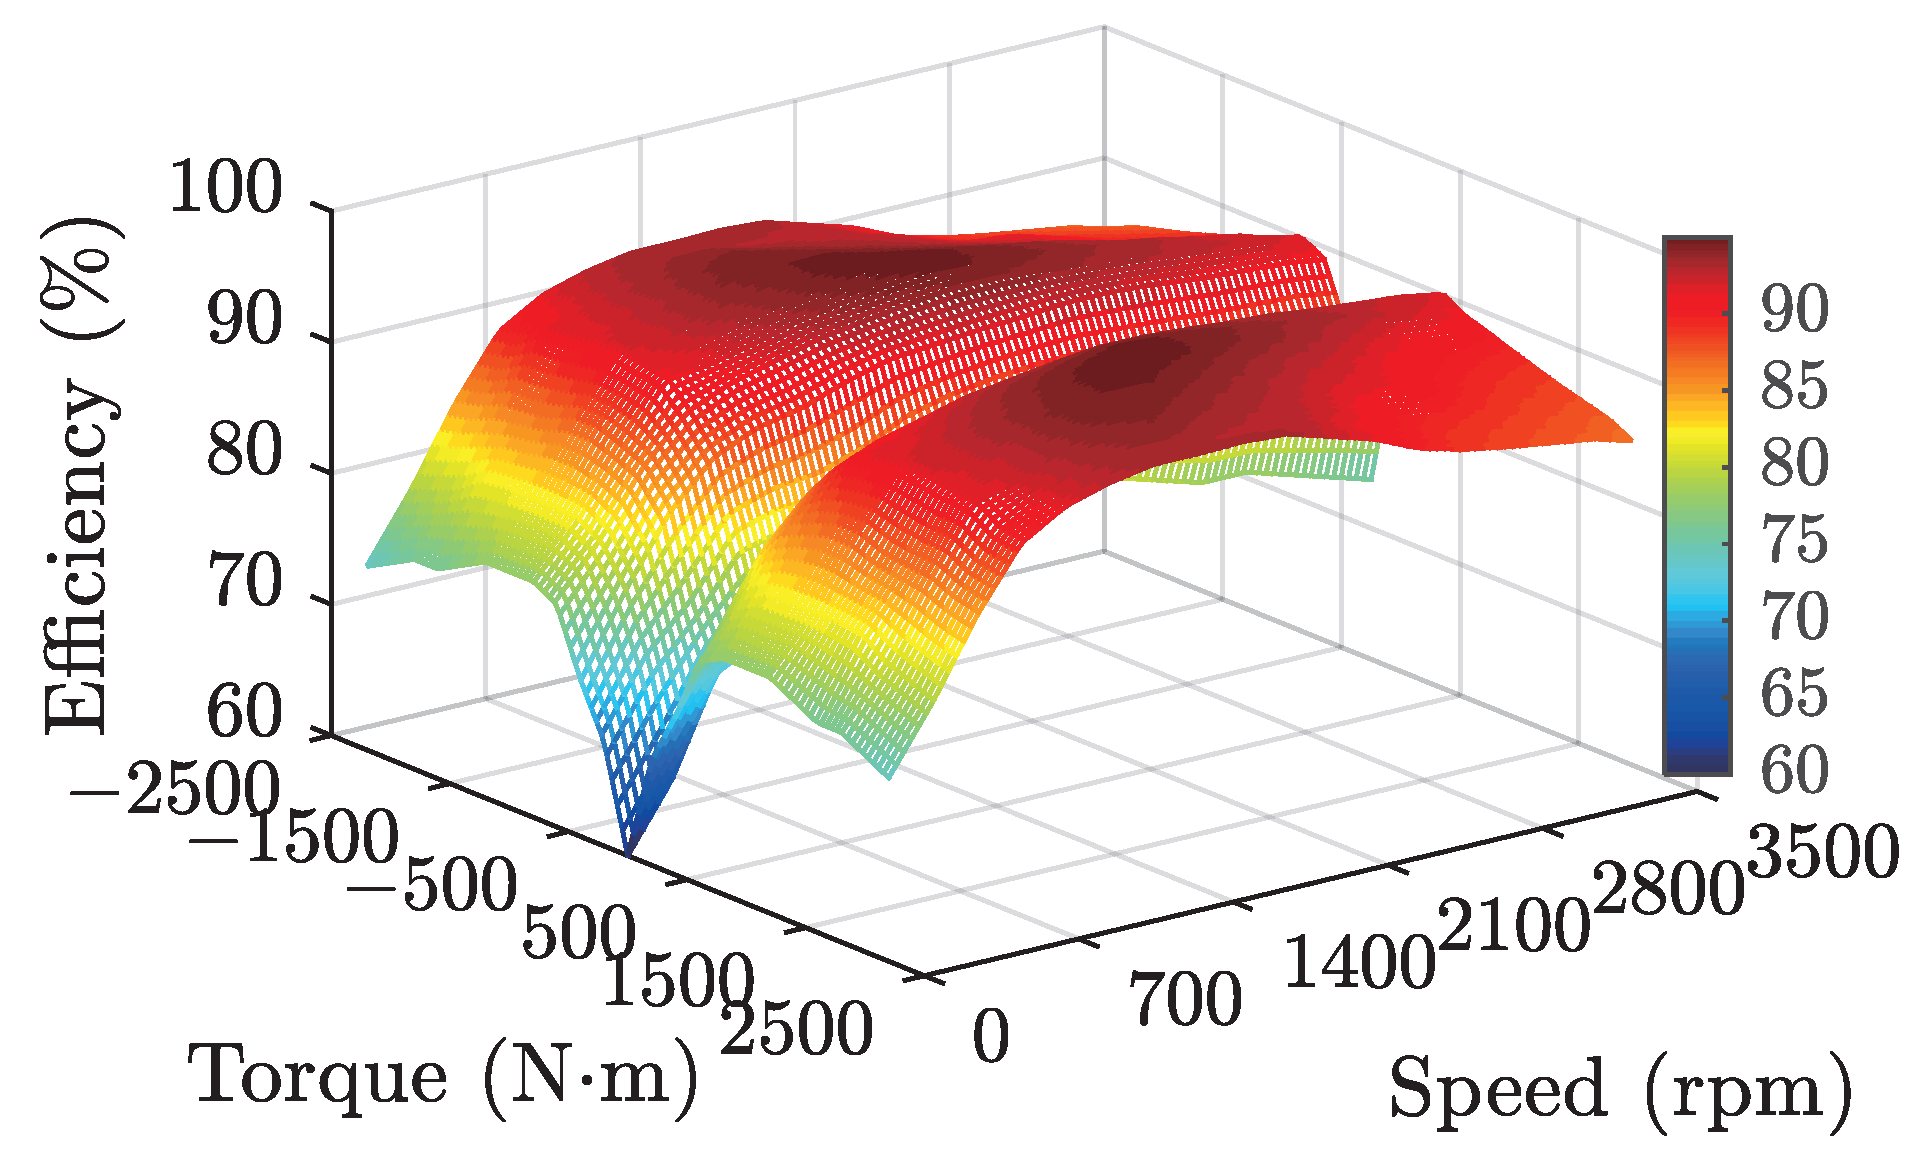
Generally, this function can be obtained through bench-test experiments and is typically presented as an efficiency map of the motor, as illustrated in Figure 2.

2.2. Transmission Model

The FCECV typically employs an AMT to enhance output torque and fulfill the vehicle’s torque requirements while minimizing motor size. This study utilized a six-speed AMT to augment the motor’s output torque and reduce the motor’s output rotation speed. Consequently, the model can be represented as follows [16,42].
T A M T _ o u t = T A M T _ i n · i g · η A M T n A M T _ o u t = n A M T _ i n / i g ,
where T A M T _ o u t and T A M T _ i n denote the torque output and input of the AMT, respectively. n A M T _ o u t and n A M T _ i n represent the rotation speed output and input of the AMT, respectively. i g is the speed ratio of the AMT, whilst η A M T denotes the efficiency of the AMT for different speed ratios.

2.3. FCS Model

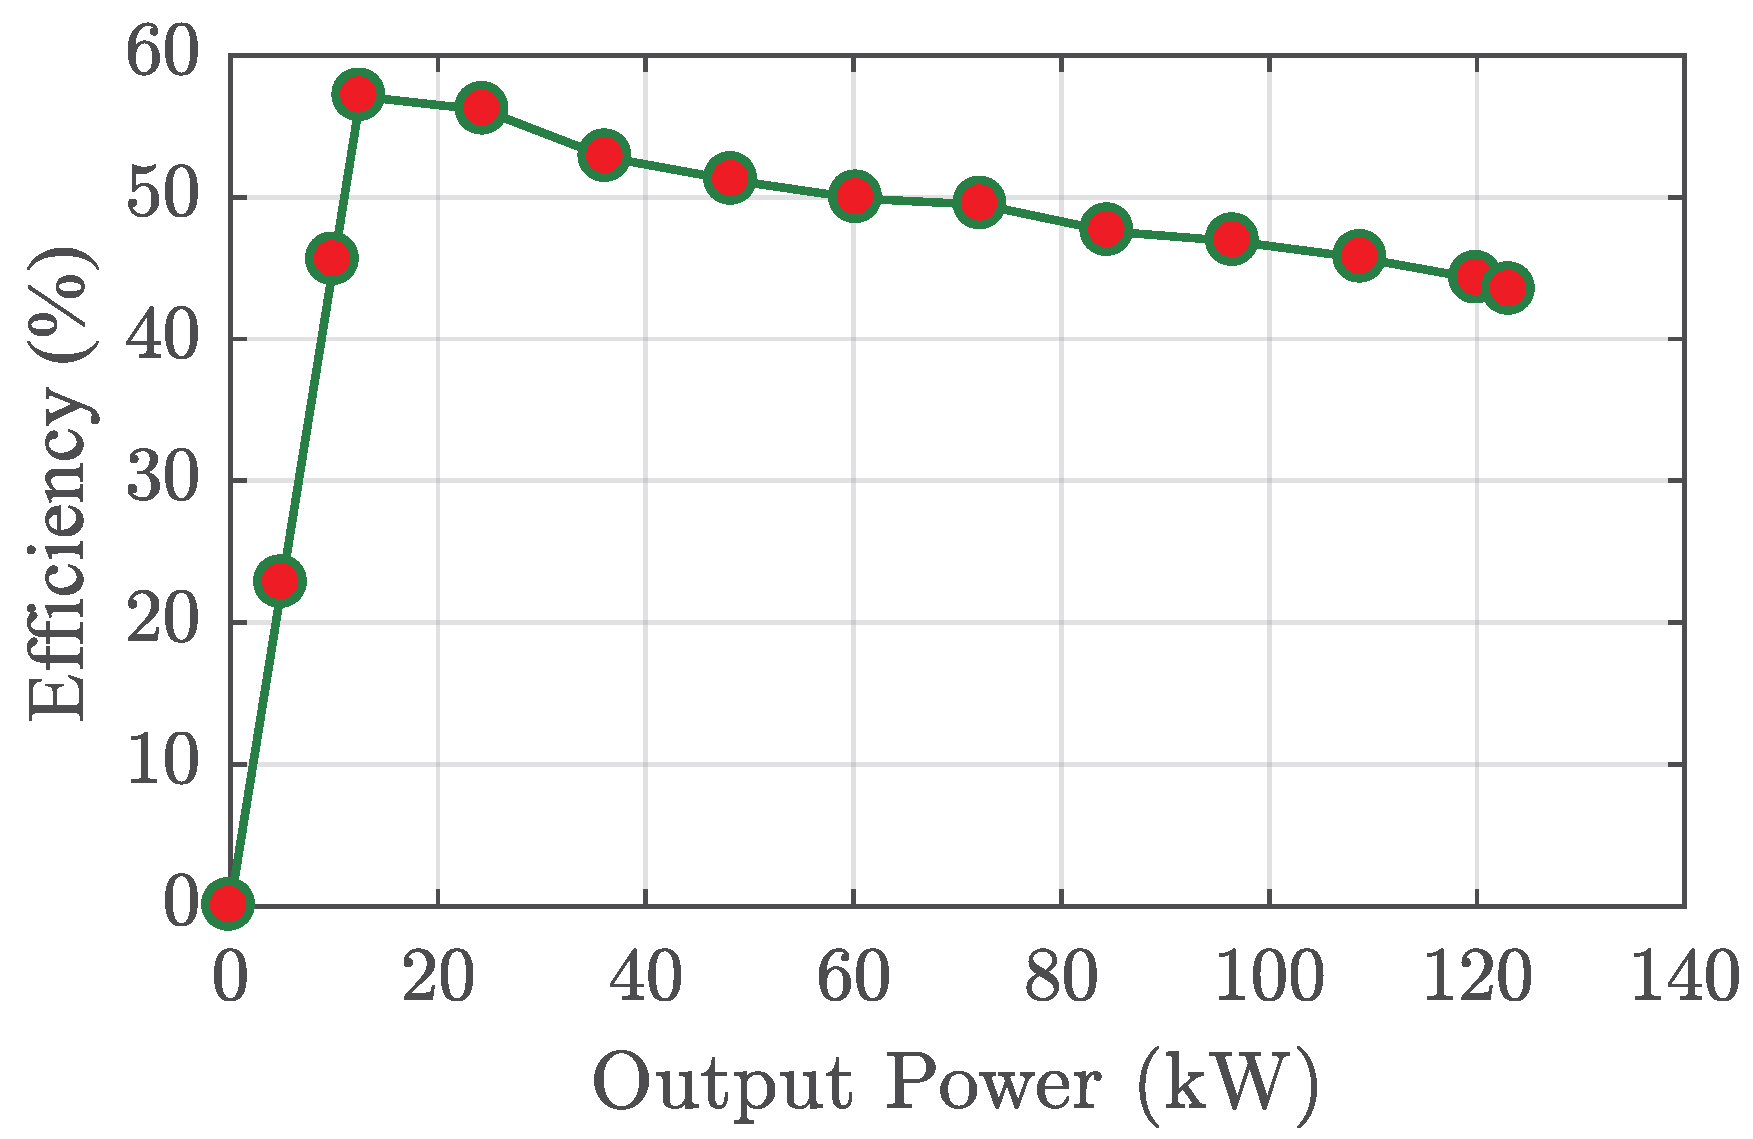
The FCS is the pivotal component of the FCECV. The proton exchange membrane fuel cell (PEMFC) exhibits promising characteristics such as high working current and low-temperature start-up, making it a preferred technology. Consequently, a PEMFC FCS with a peak power of 123 kW was chosen for the investigated FCECV. To address the energy management issue, we employed an HC-based static model, disregarding the intricate nonlinear characteristics of the FCS. By relating this formula to the output power of the FCS, we can calculate the mass of HC as follows.
m H 2 = 1 E l o w , H 2 0 t P f c η f c ( P f c ) · d t ,
where m H 2 denotes the mass of the consumed hydrogen. E l o w , H 2 represents the low heating value of hydrogen. P f c and η f c are the output power and efficiency of the FCS, respectively. Note that η f c is the function of the P f c , which can be obtained from a bench test, as illustrated in Figure 3. The efficiency of the FCS generally increases as the P f c increases, but it will start to decrease once the peak efficiency is reached. This means that there is a specific power density range within which the FCS operates at high efficiency. To improve the economy of the FCECV, the working points of the FCS should be distributed within this range as much as possible.

2.4. Battery Model

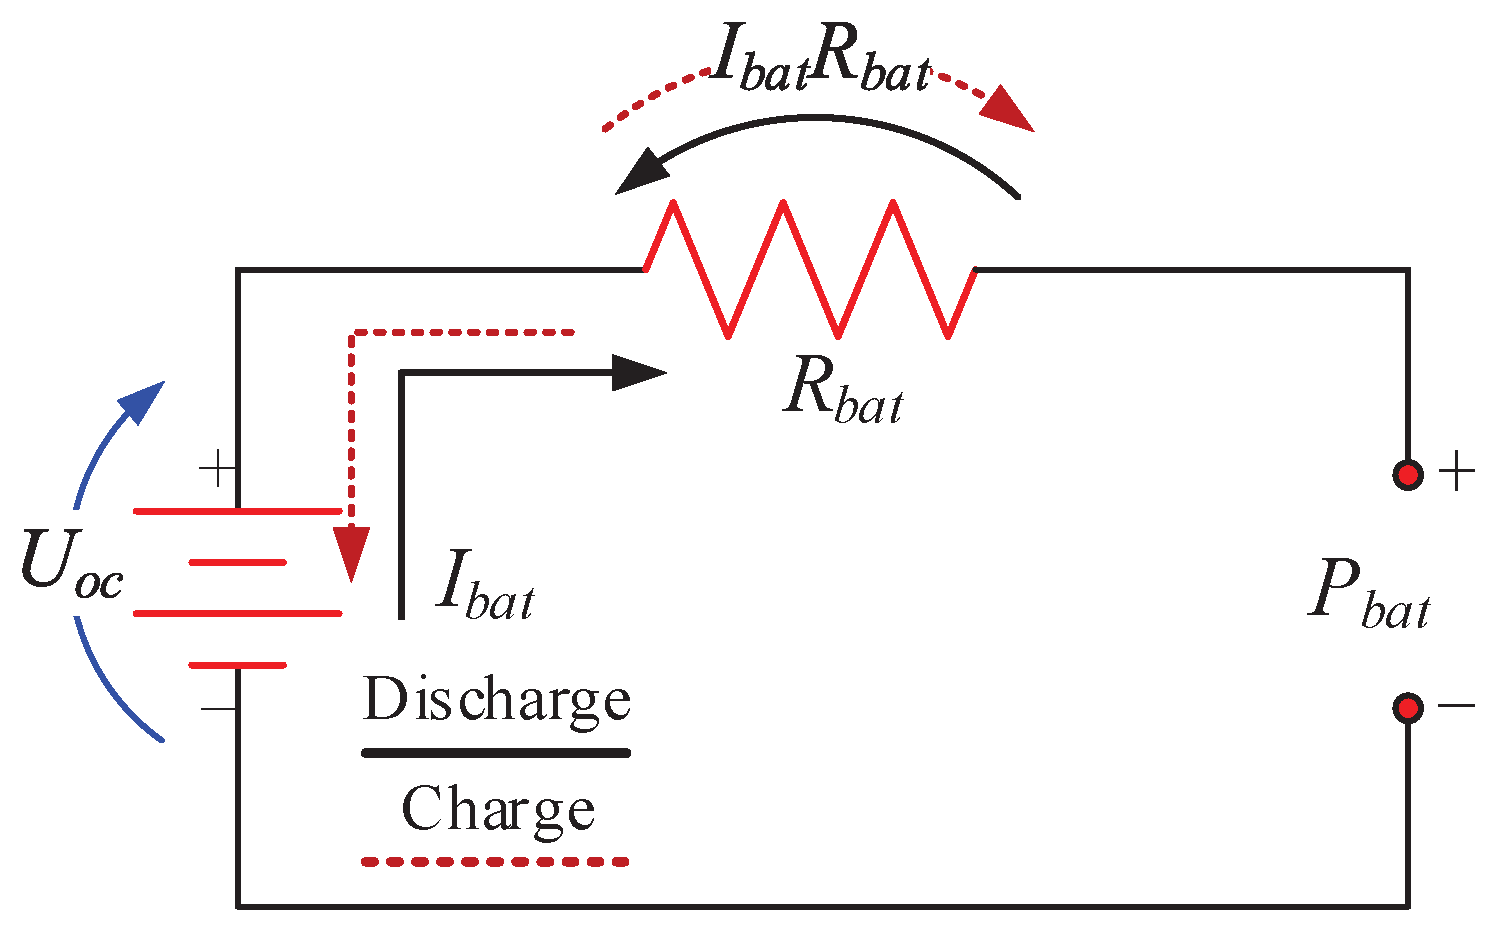
The studied FCECV is also powered by a lithium-ion battery pack with a nominal voltage of 530 V and a rated capacity of 100 A · h. In order to simplify the system model, a well-established RINT model (presented in Figure 4) was adopted, which intentionally does not consider the battery’s dynamic behavior.
The relationship between the battery’s current and open-circuit voltage, charge and discharge internal resistance and battery power is illustrated below.
I b a t = U o c U o c 2 4 R b a t P b a t 2 R b a t ,
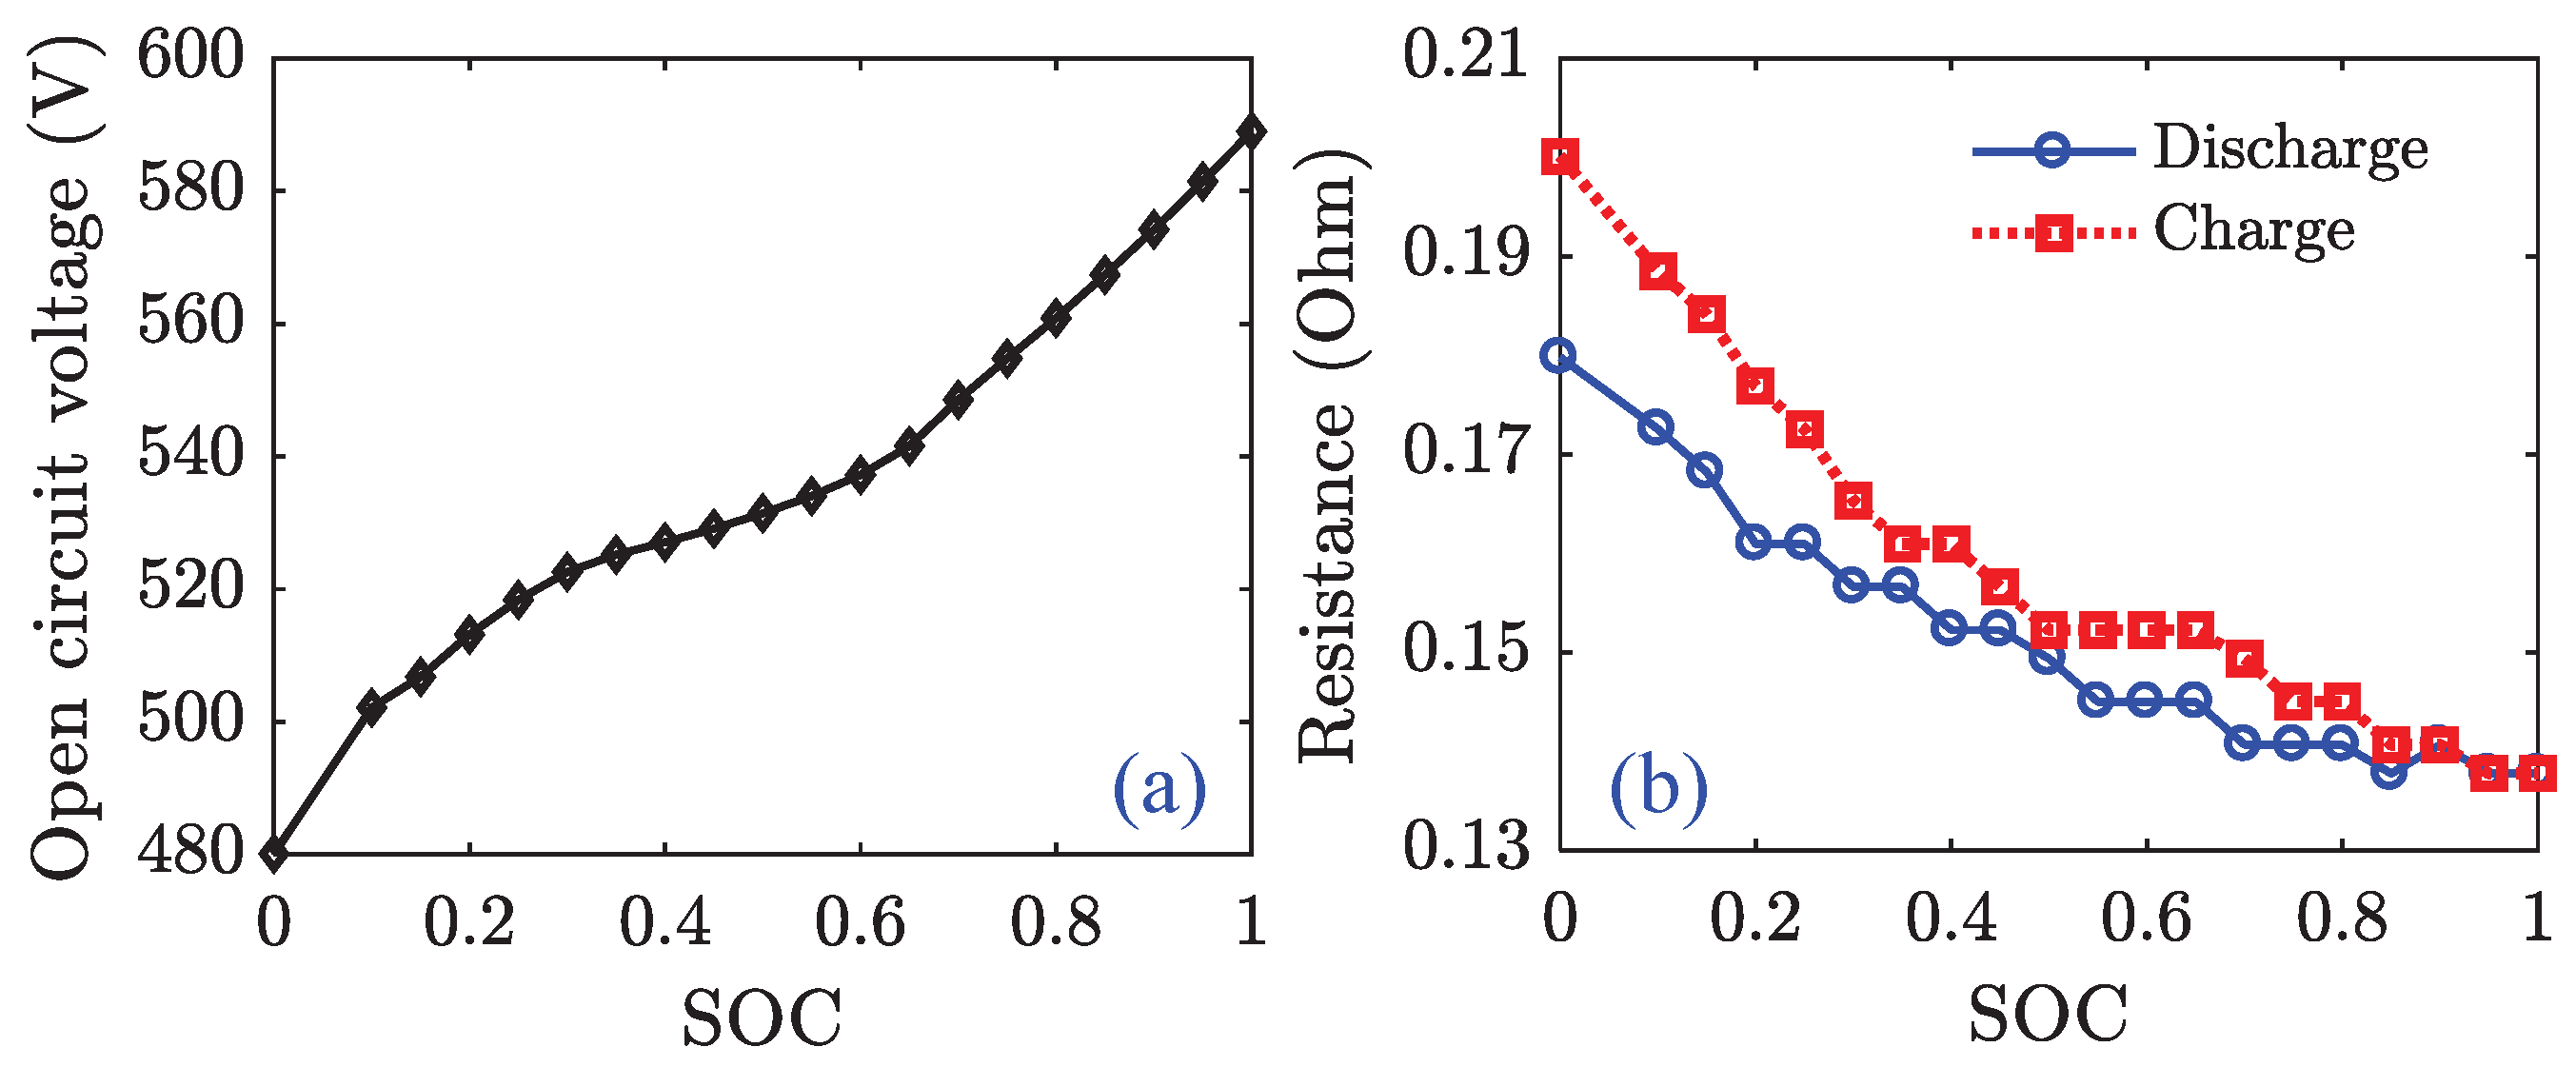
where I b a t represents the battery current. U o c and P b a t denote the open circuit voltage and battery power, respectively. When P b a t is positive, I b a t also exhibits a positive value, indicating that the battery is undergoing discharge; conversely, when P b a t is negative, I b a t also displays a negative value, signifying that the battery is being charged. R b a t represents the internal resistance associated with charge and discharge. It is worth noting that the resistance of the battery varies throughout its charging and discharging cycles, both of which can be determined through bench tests and described as a function of the battery’s SOC, similarly to the open circuit voltage behavior (as depicted in Figure 5).
Both the internal resistance and open circuit voltage exhibit variations based on the battery SOC. Meanwhile, the battery SOC can be determined using the ampere-hour integration method, as expressed in the following.
S O C ( t f ) = S O C ( t 0 ) t 0 t f I b a t · d t Q b a t ,
where S O C ( t f ) and S O C ( t 0 ) represent the terminal and initial battery SOC, respectively. Q b a t is the capacity of the battery. t 0 and t f indicate the time domain.
Then, the variation in the battery SOC can also be governed by the following equation.
Δ S O C = I b a t · Δ t Q b a t ,
where Δ S O C indicates the variation of the battery SOC and Δ t is the sampling time interval.

2.5. Vehicle Dynamics

The impact of vehicle handling stability and ride comfort is often overlooked in energy management, simplifying the issue by solely considering the longitudinal dynamic characteristics of the vehicle. This approach treats the entire vehicle as a particle, disregarding load transfer and the vehicle’s deformation. Therefore, the equation for the longitudinal dynamic balance of the vehicle can be expressed as follows.
F r e q = m g f cos α + 1 2 C d ρ a A f u 2 + m g sin α + δ m d u d t ,
where m, g, and f represent the vehicle mass, gravitational acceleration, and rolling resistance coefficient, respectively. α is road grade angle. C d , ρ a , and A f indicate the air drag coefficient, air density, and windward area of the vehicle, respectively. u denotes the vehicle velocity, while δ is the correction coefficient of rotating mass. F r e q represents the demand force for vehicle operation. Subsequently, the vehicle’s demand power P r e q can be calculated using the following equation.
P r e q = F r e q · u .
It should be noted that the power demanded by the vehicle is supplied by two sources: FCS and battery. Therefore, the following equation should also be satisfied.
P r e q = P f c + P b a t .

3. DP Solution for FCECV’s EMS

3.1. DP Problem Formulation

The DP approach is a commonly employed method for energy management problems. It enables the calculation of globally optimal solutions based on given driving cycles. The algorithm typically consists of two variables: state variables and control variables. In the case of FCECV under study, the state variables are defined as battery SOC and AMT gear, while the control variables include the output power of the FCS and gear-shift action of the AMT. The basic principle of DP dictates that a given driving condition should be initially segmented into N stages, followed by the resolution of the associated cost function at each stage. The transition function can be expressed as follows.
X ( k + 1 ) = f [ X ( k ) , U ( k ) ] , k = 0 , 1 , , N 1 ,
where X ( k ) and U ( k ) represent the system’s state vector and control vector, while k is the time step.
Subsequently, the state vector is expressed as follows.
X ( k ) = S O C ( k ) g x ( k ) ,
where S O C ( k ) is the state of battery SOC, and g x ( k ) is the AMT’s gear position.
Meanwhile, the control vector is described by the following equation [43].
U ( k ) = P f c ( k ) S h i f t ( k ) ,
where P f c ( k ) is the output power of FCS at the k step, and S h i f t ( k ) is the gear-shifting action at the k time step.
It should be noted that the FCS’s output power is determined by the accelerator pedal’s position, while the gear position of the AMT is determined by both the current gear and the gear-shifting action. We use a control vector of 1 , 0, and 1 for the AMT to represent downshift, hold, and upshift. As a result, the system’s state transition can be expressed as follows, according to Equations (5), (7), and (12).
S O C ( k + 1 ) = S O C ( k ) U o c ( k ) U o c 2 ( k ) 4 R b a t ( k ) P b a t ( k ) 2 R b a t ( k ) · Q b a t ( k ) g x ( k + 1 ) = 1 g x ( k ) + S h i f t ( k ) < 1 6 g x ( k ) + S h i f t ( k ) > 6 g x ( k ) + S h i f t ( k ) otherwise .
The objective of DP is to achieve optimal energy consumption and efficiency for FCECV. The cost function in this study focuses on three components: HC, battery consumption, and penalty functions related to gearshifts, as illustrated below.
J = k = 0 N 1 P f c ( k ) · C f η f c ( P f c ( k ) ) · E l o w , H 2 + P b a t ( k ) · C b 3.6 × 10 6 + β · | S h i f t ( k ) | ,
where the instantaneous power of the FCS and battery is denoted by P f c ( k ) and P b a t ( k ) , respectively. C f represents the price of HC, while C b represents the cost of battery energy consumption. β is the gearshift penalty coefficient.
Additionally, the DP problem also requires the incorporation of specific constraints to ensure compliance with the system’s physical characteristics, thus obtaining a viable solution. The physical constraints of the FCECV are accomplished in the following manner.
P b a t _ m i n P b a t ( k ) P b a t _ m a x P f c _ m i n P f c ( k ) P f c _ m a x P m _ m i n P m ( k ) P m _ m a x n m _ m i n n m ( k ) n m _ m a x S O C m i n S O C ( k ) S O C m a x 0.2 S O C f 0.25 .
Herein, the instantaneous power of the battery, FCS, and motor are denoted by P b a t ( k ) , P f c ( k ) , and P m ( k ) , respectively. Their respective constraints are defined as [ P b a t _ m i n , P b a t _ m a x ] , [ P f c _ m i n , P f c _ m a x ] , and [ P m _ m i n , P m _ m a x ] . The rotation speed of the motor at step k is represented by n m ( k ) , which is subject to the limitation confined by [ n m _ m i n , n m _ m a x ] . S O C ( k ) represents the battery SOC at step k with limitations defined by [ S O C m i n , S O C m a x ] . Additionally, a soft limit of 0.2 to 0.25 is imposed on the terminal SOC (i.e., S O C f ) to ensure that, during the optimization process, the battery power is fully depleted while preventing over-discharge.

3.2. DP Problem Solving

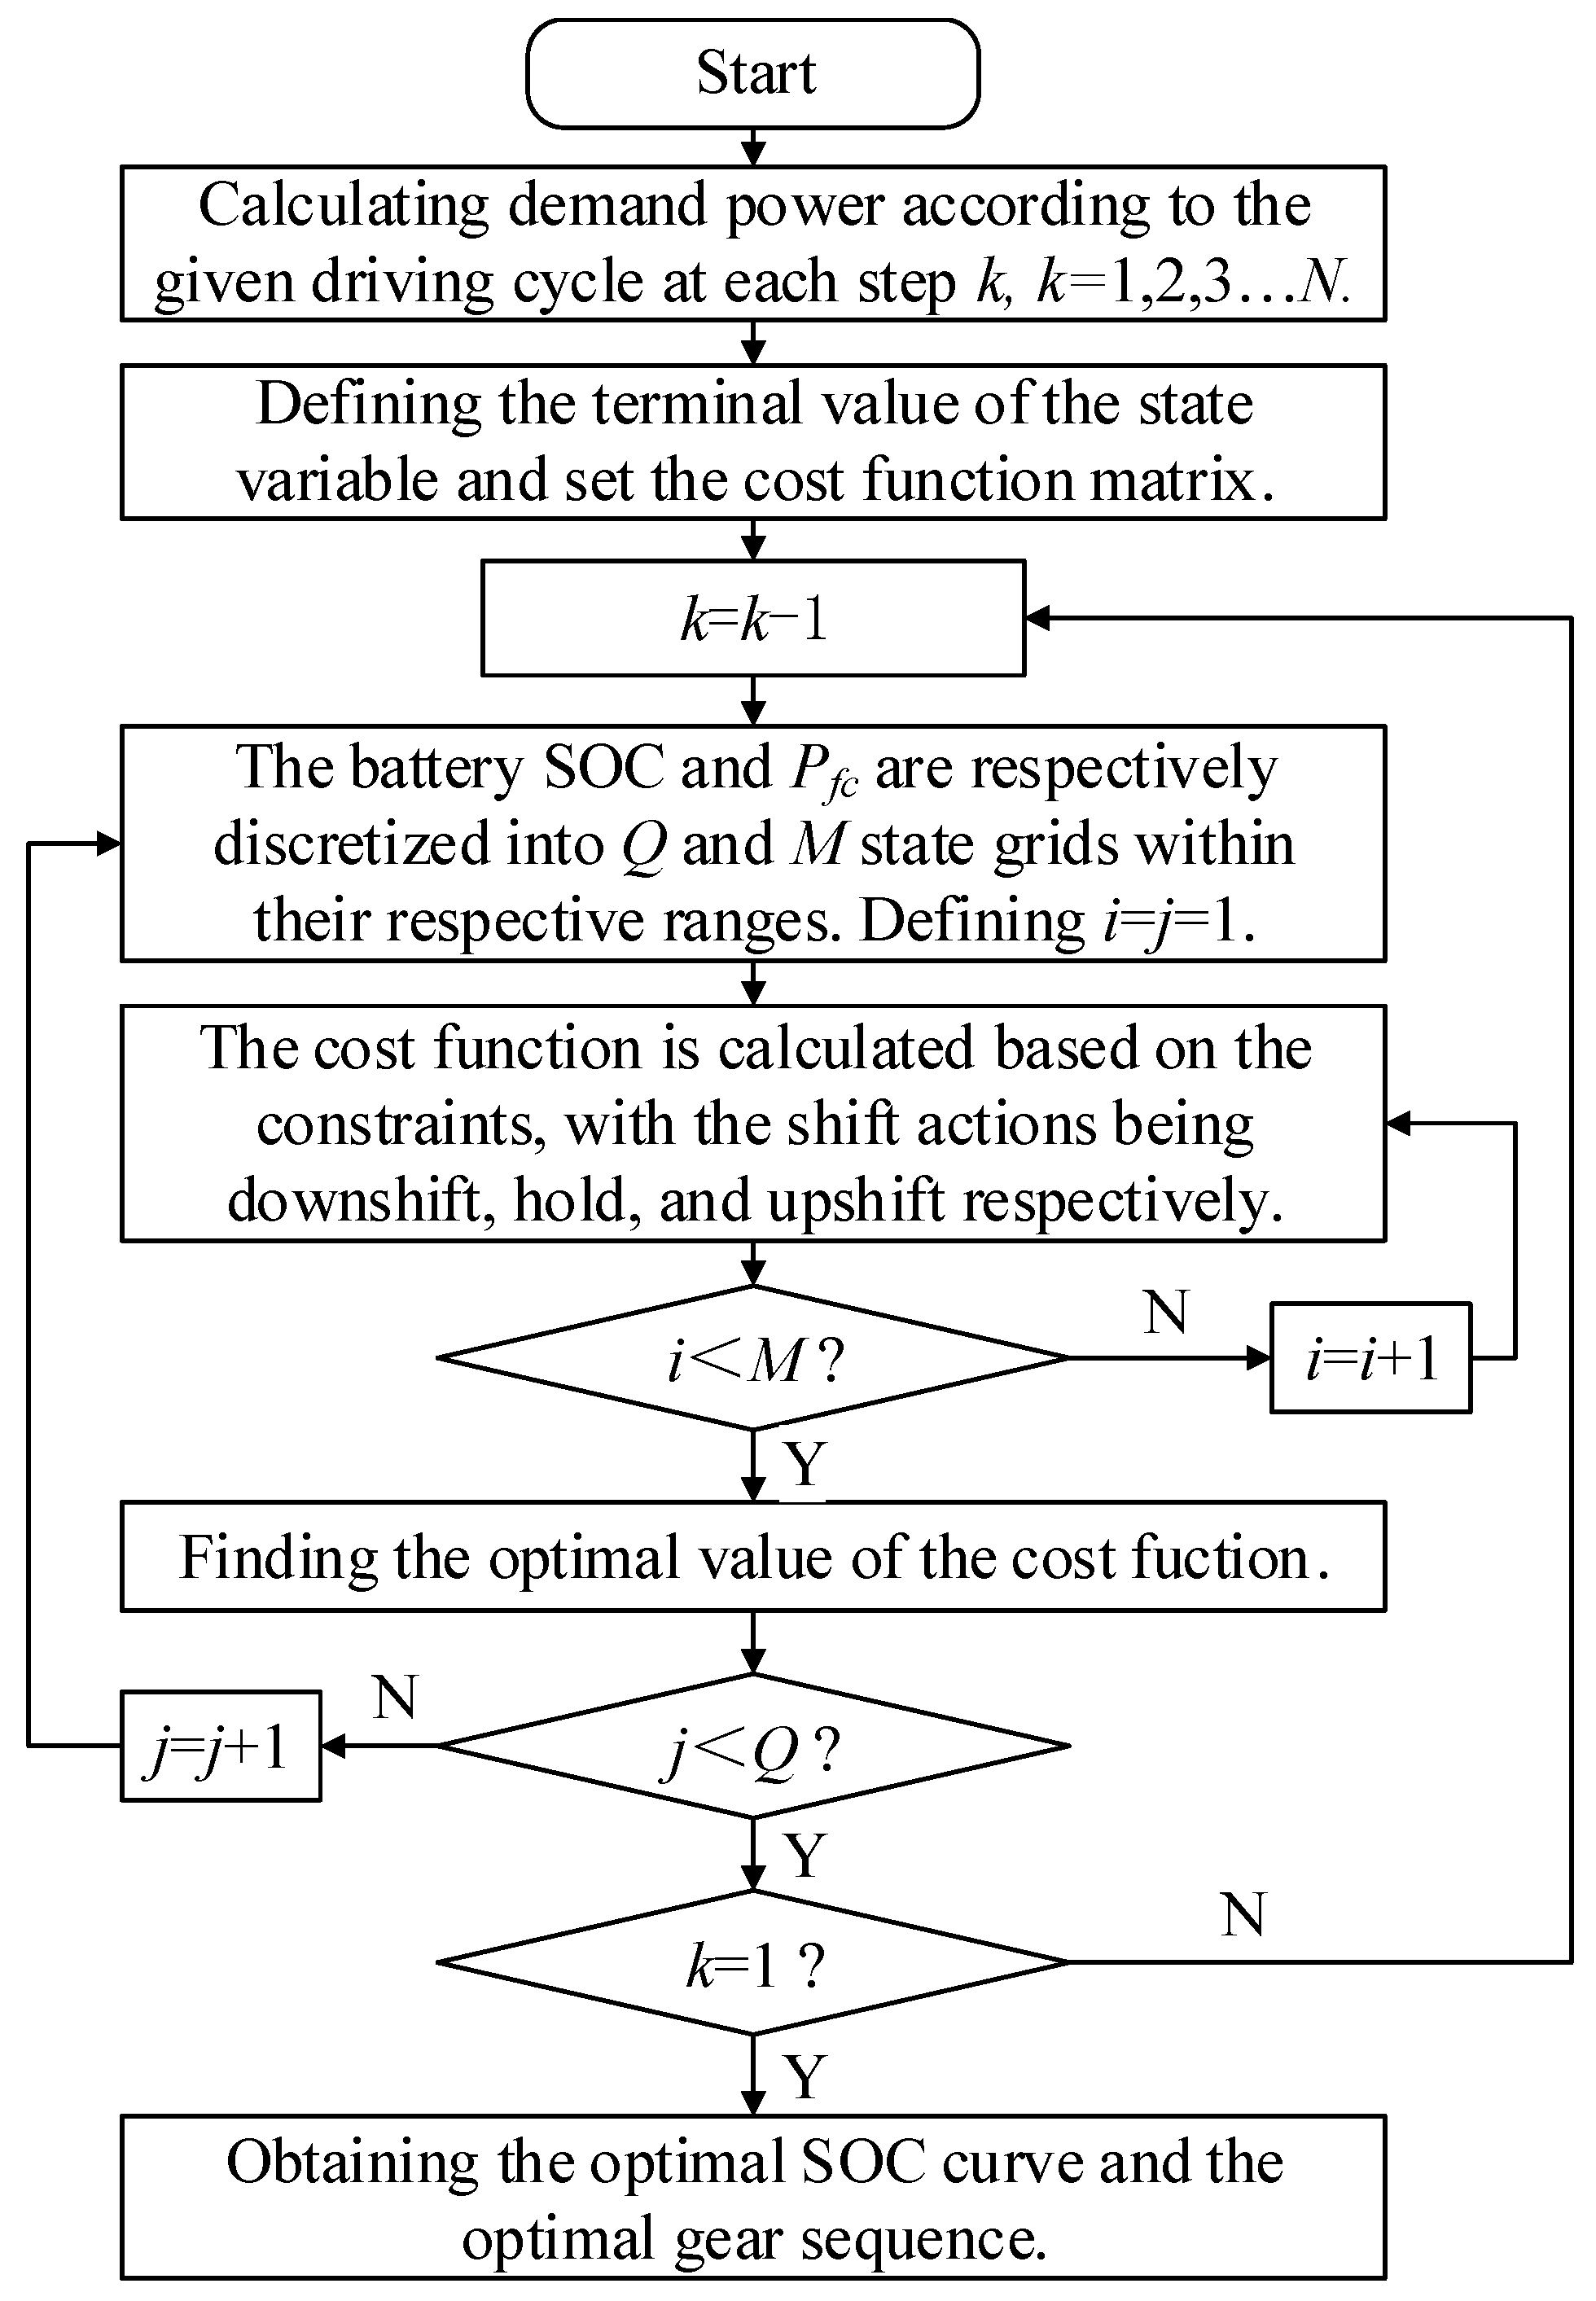
The DP algorithm can determine the shortest path by performing a backward traversal in time. Specifically, it transforms the optimal cost function of each grid at every time stage while storing the values of the minimum cost function and control variable U ( k ) in a matrix format. In our study, the energy management problem of FCECV is addressed by combining backward solution methods and forward optimization techniques, as illustrated in Figure 6.
The process consists of six steps:
Step 1: Calculate the power demand for each second based on the given driving cycle.
Step 2: Determine the terminal constraints for the battery SOC and the AMT’s gear position separately. Also, define a cost function matrix to store the optimal costs.
Step 3: Discretize the battery’s SOC, FCS output power, AMT gear position, and gear-shifting action into grids within their respective ranges.
Step 4: Compute the cost function from backward, meeting the constraint requirements, until all discretized grids have been traversed at each time step.
Step 5: Obtain the optimal cost function value and store it in the pre-designed cost function matrix at each time step.
Step 6: Continue the backward calculation of the cost function until time step k = 1 , and then perform forward optimization to obtain the optimized state variables, including battery SOC and AMT gear position.

3.3. DP Problem Simulation

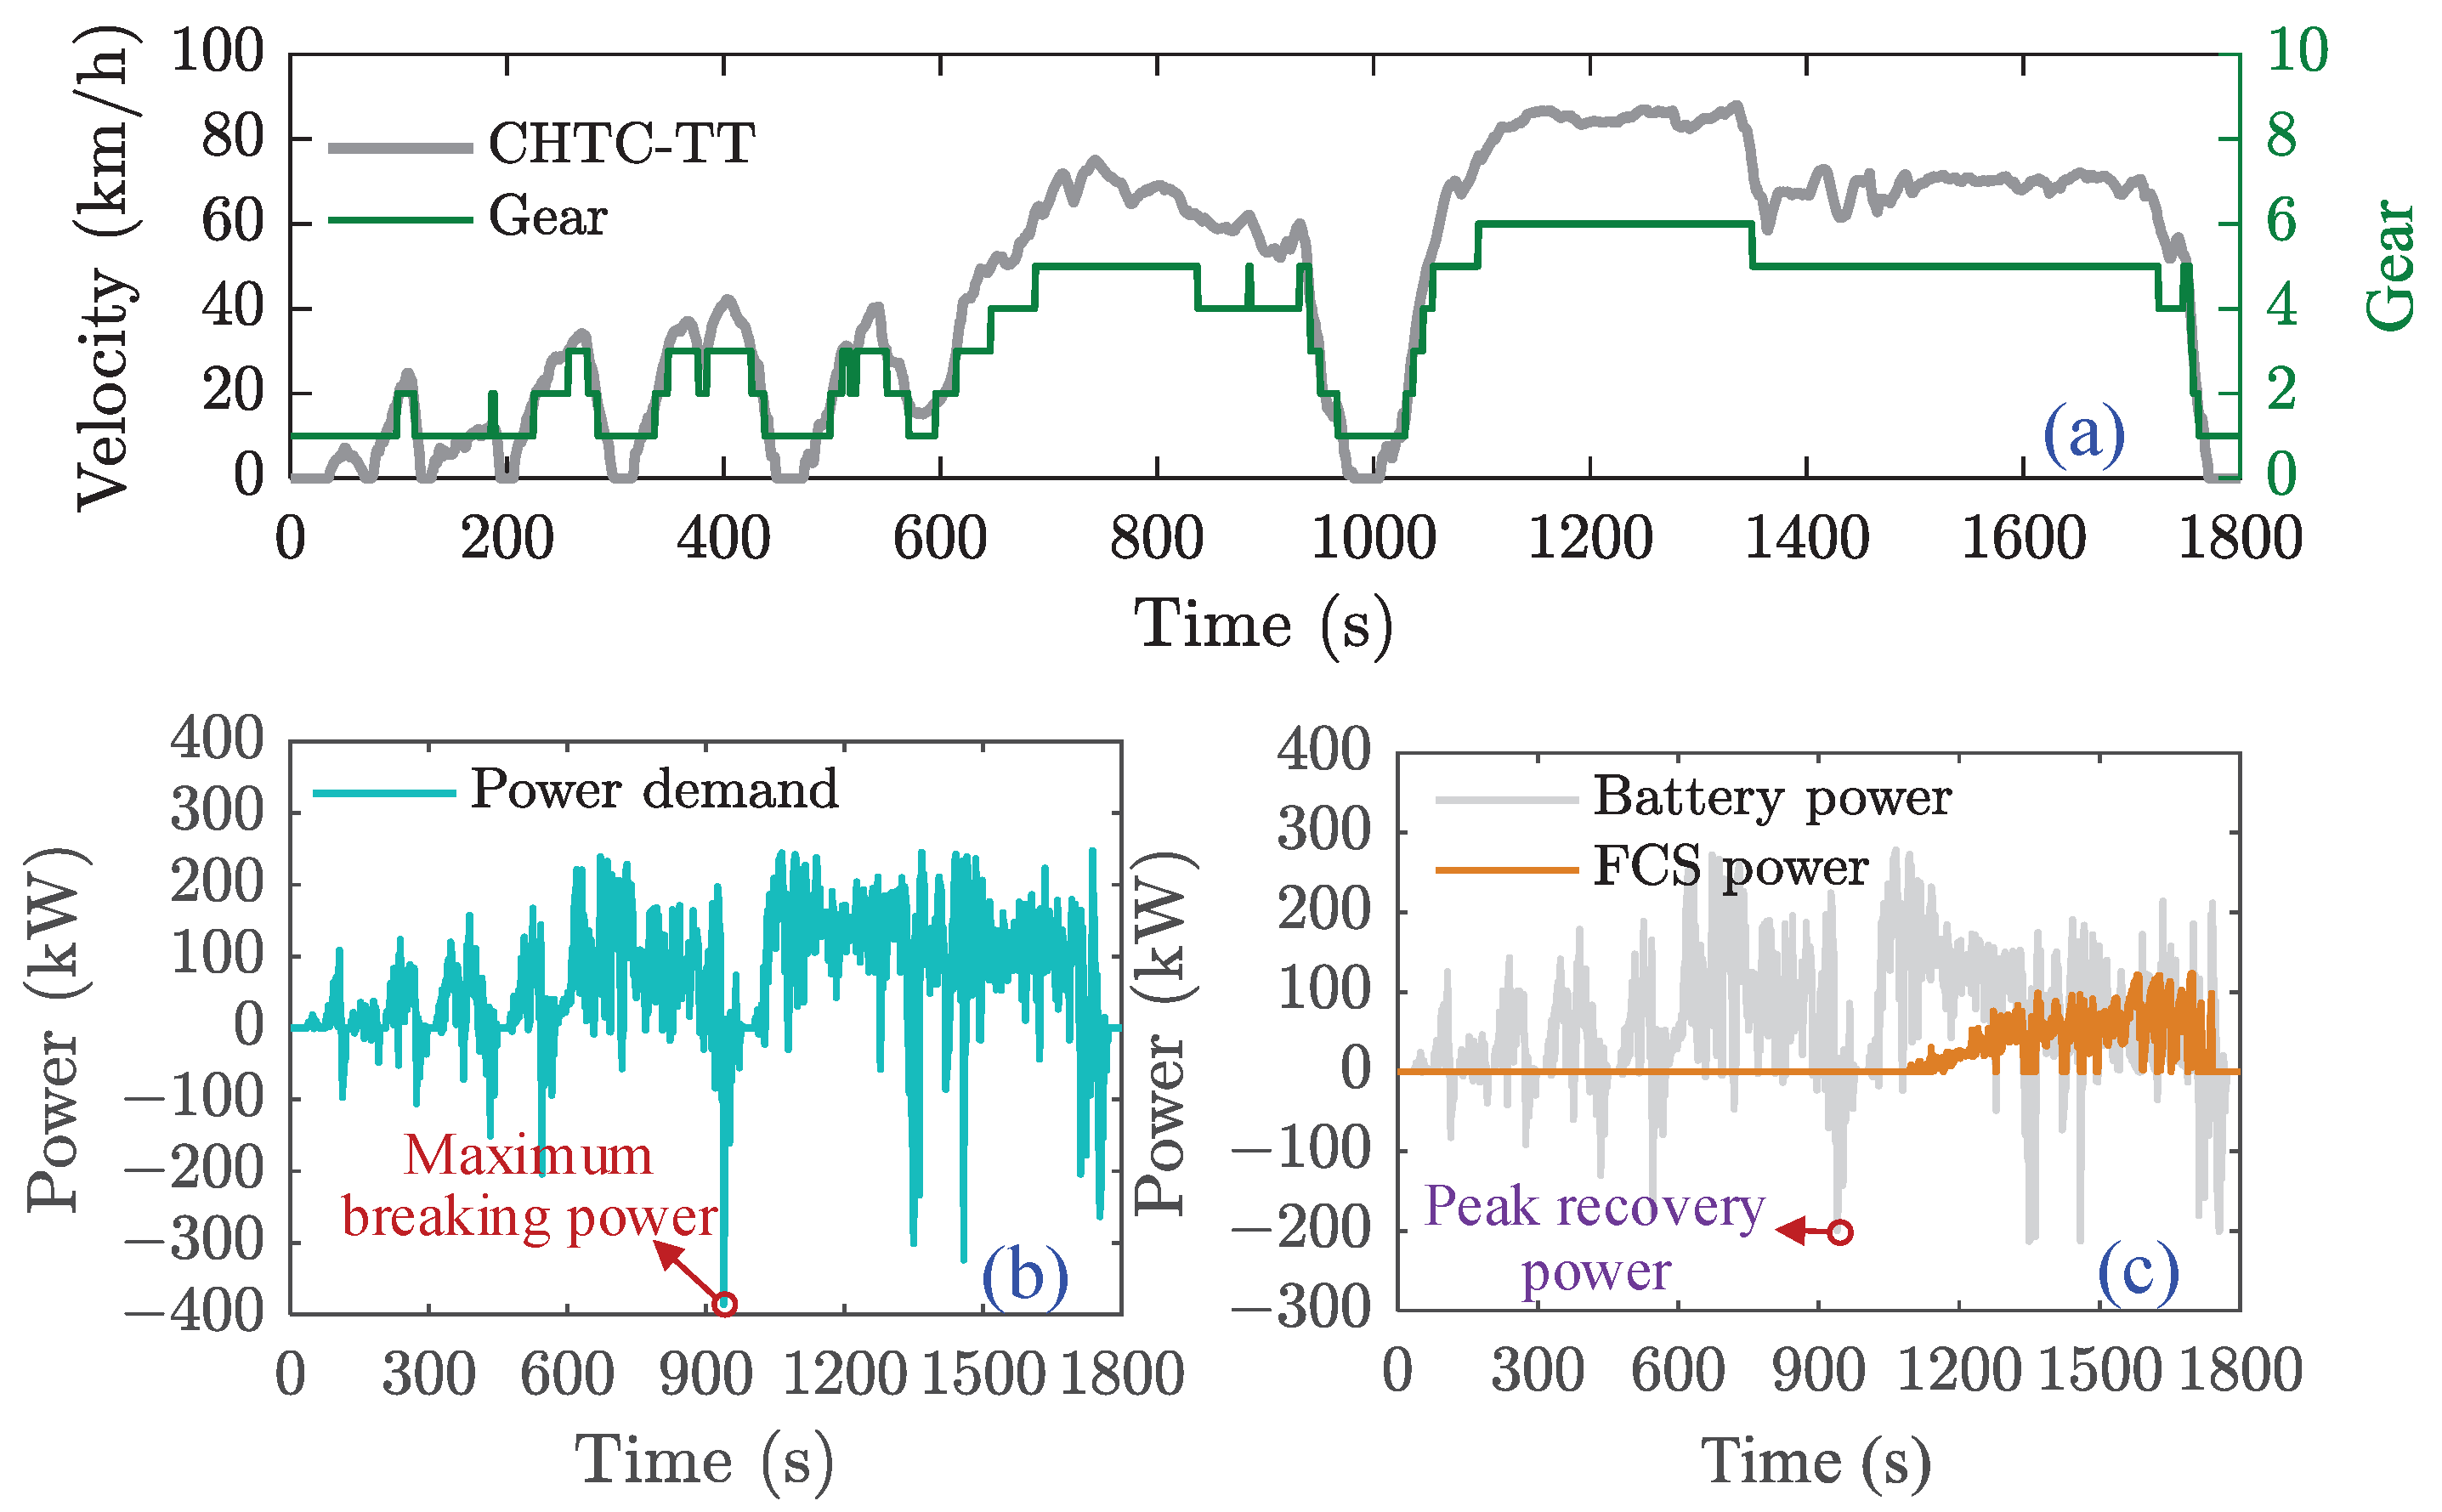
Given that the DP framework will be implemented in developing the real-time EMS, its effectiveness was rigorously validated through simulation studies using the China Heavy-duty Commercial Vehicle Test Cycle for Tractor-Trailers (CHTC-TT). The optimization results obtained from these simulations subsequently served as the training dataset for the online EMS’s further development. The main parameters of the vehicle are listed in Table 2.
As depicted in Figure 7a, the DP algorithm enables automatic AMT gear shifting in response to variations in vehicle speed, while maintaining an optimal distribution of gear operating points. Moreover, it ensures an efficient power distribution between the battery and the FCS to satisfy the vehicle’s power requirements. It is clarified that the vehicle is propelled by the combined power output of the FCS and the battery. During braking, the FCS remains inactive, and the required braking power is provided by both regenerative braking from the electric motor and mechanical friction braking. The control strategy prioritizes regenerative braking to maximize energy recovery and thereby minimize total energy consumption, with mechanical braking engaged only to compensate for any shortfall. To ensure battery safety and extend its operational lifespan, the regenerative braking capacity is intentionally limited. As evidenced in Figure 7b,c, this limitation results in the maximum regenerative power being below the peak braking demand. Consequently, the mechanical braking system provides the remaining braking force by dissipating kinetic energy as heat through friction. Given its minimal impact on the EMS, the mechanical braking subsystem is excluded from the scope of this study.
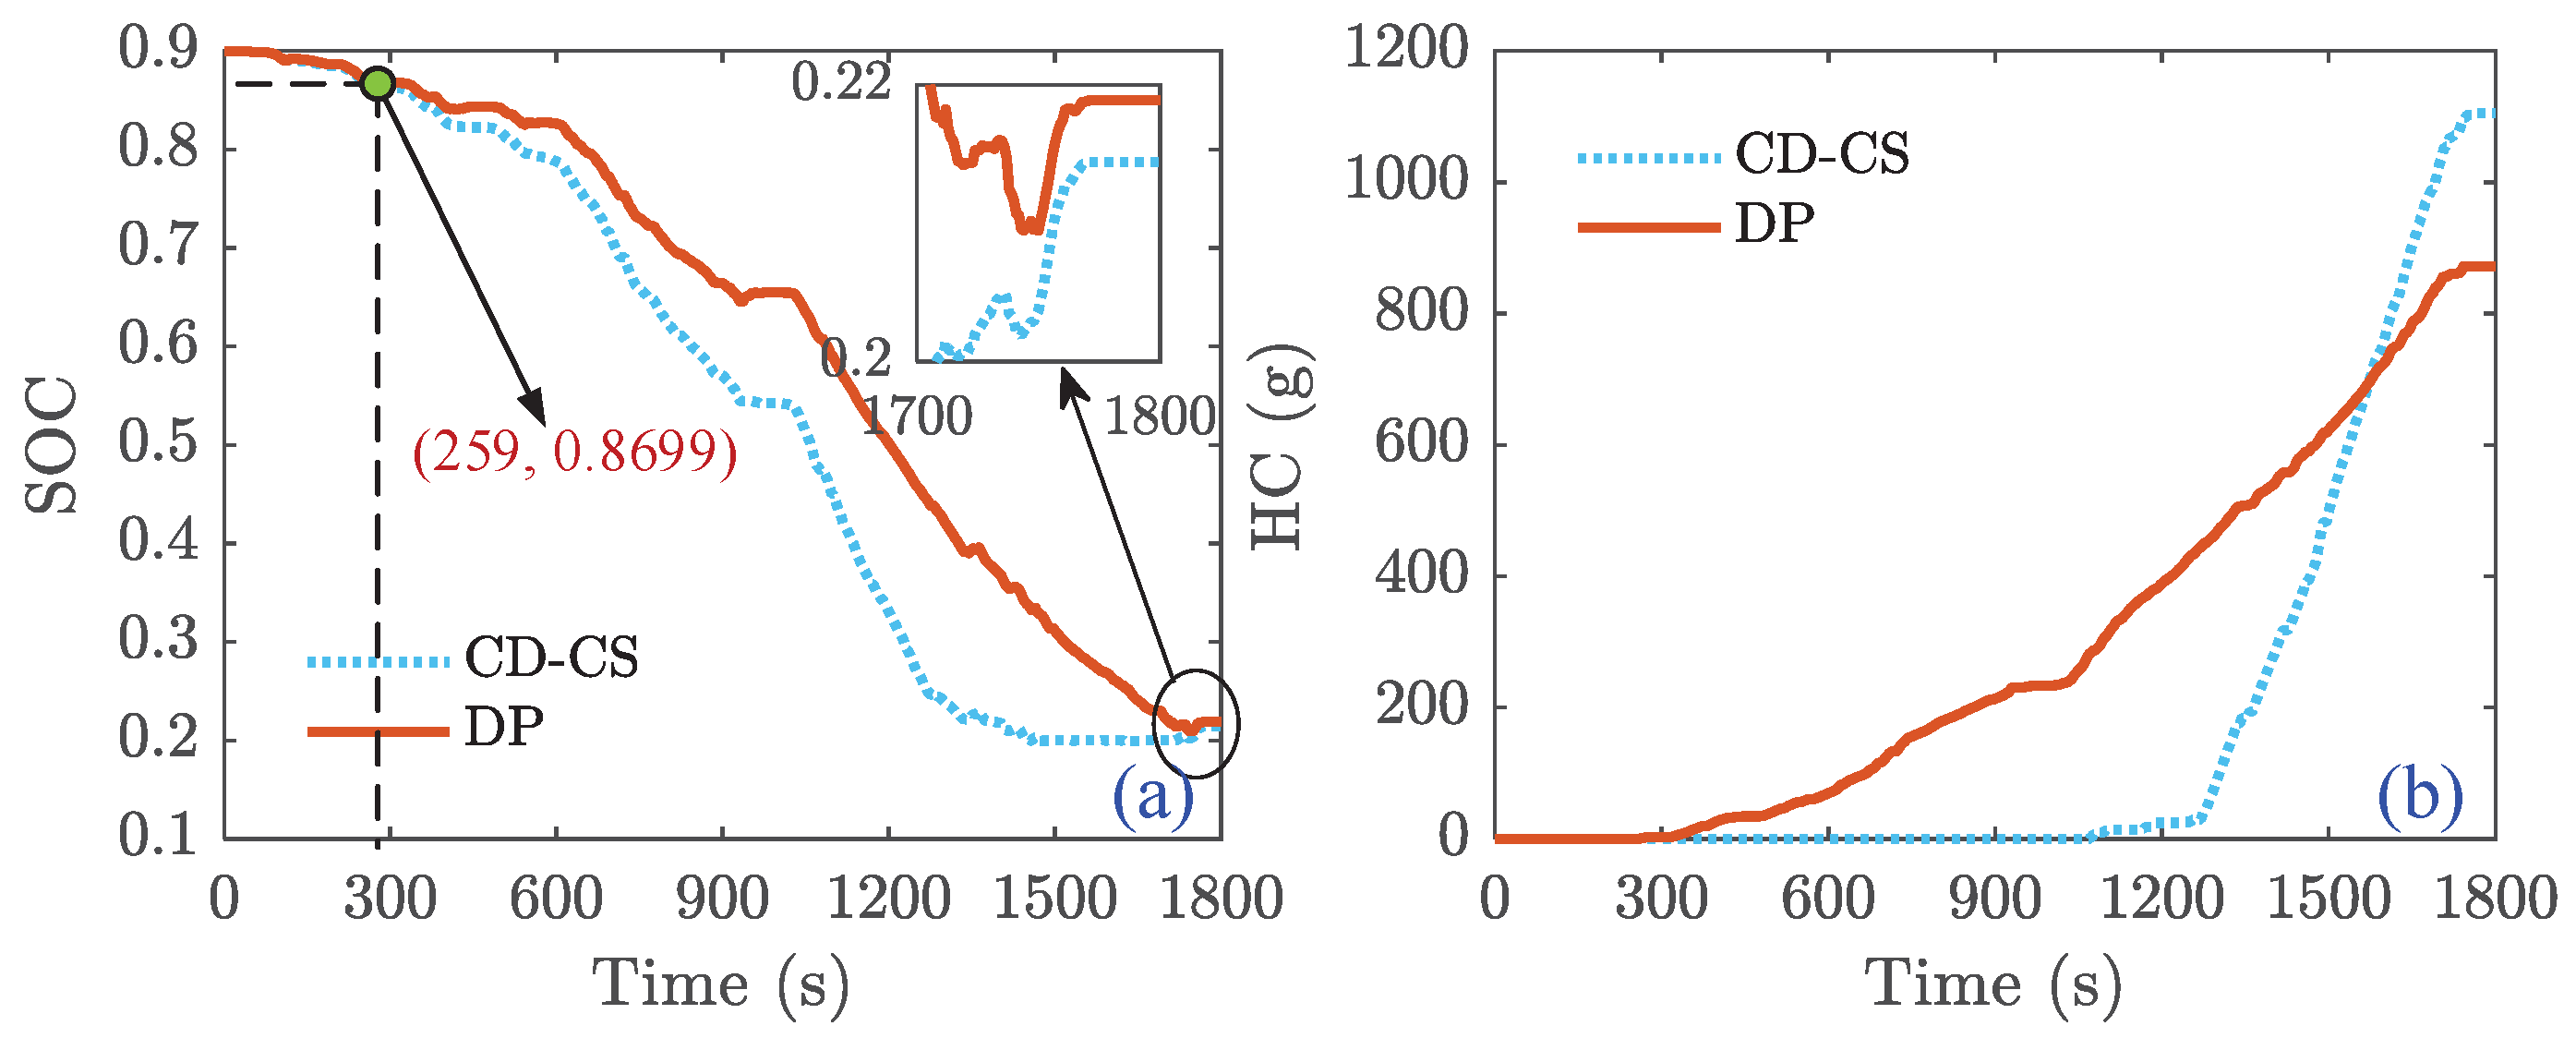
The charge-depleting and charge-sustaining (CD-CS) strategy was employed to evaluate the economic performance of the DP, as depicted in Figure 8. Assuming an initial battery SOC of 0.9, it is evident that both CD-CS and DP can deplete the battery SOC approximately to its minimum value at the end of the trip. Furthermore, both strategies primarily rely on battery energy consumption to provide the necessary power while driving. It is worth noting that the FCECV can operate in pure electric drive mode from 0 to 259 s for both strategies, thanks to the acceptable power requirement and adequate battery SOC. Subsequently, DP continues to consume more battery energy than CD-CS, while CD-CS begins to provide power through FCS. As a result, DP demonstrates better energy-saving performance for its lower HC. Notably, the battery’s SOC exhibits a transient increase at the trip’s conclusion, which is primarily attributed to the recovery of regenerative braking energy. During the deceleration phases, when the vehicle’s power demand becomes negative, the battery operates in energy absorption mode (negative power output) while the FCS maintains an inactive state. Consequently, this operational mode results in zero HC during these braking intervals.
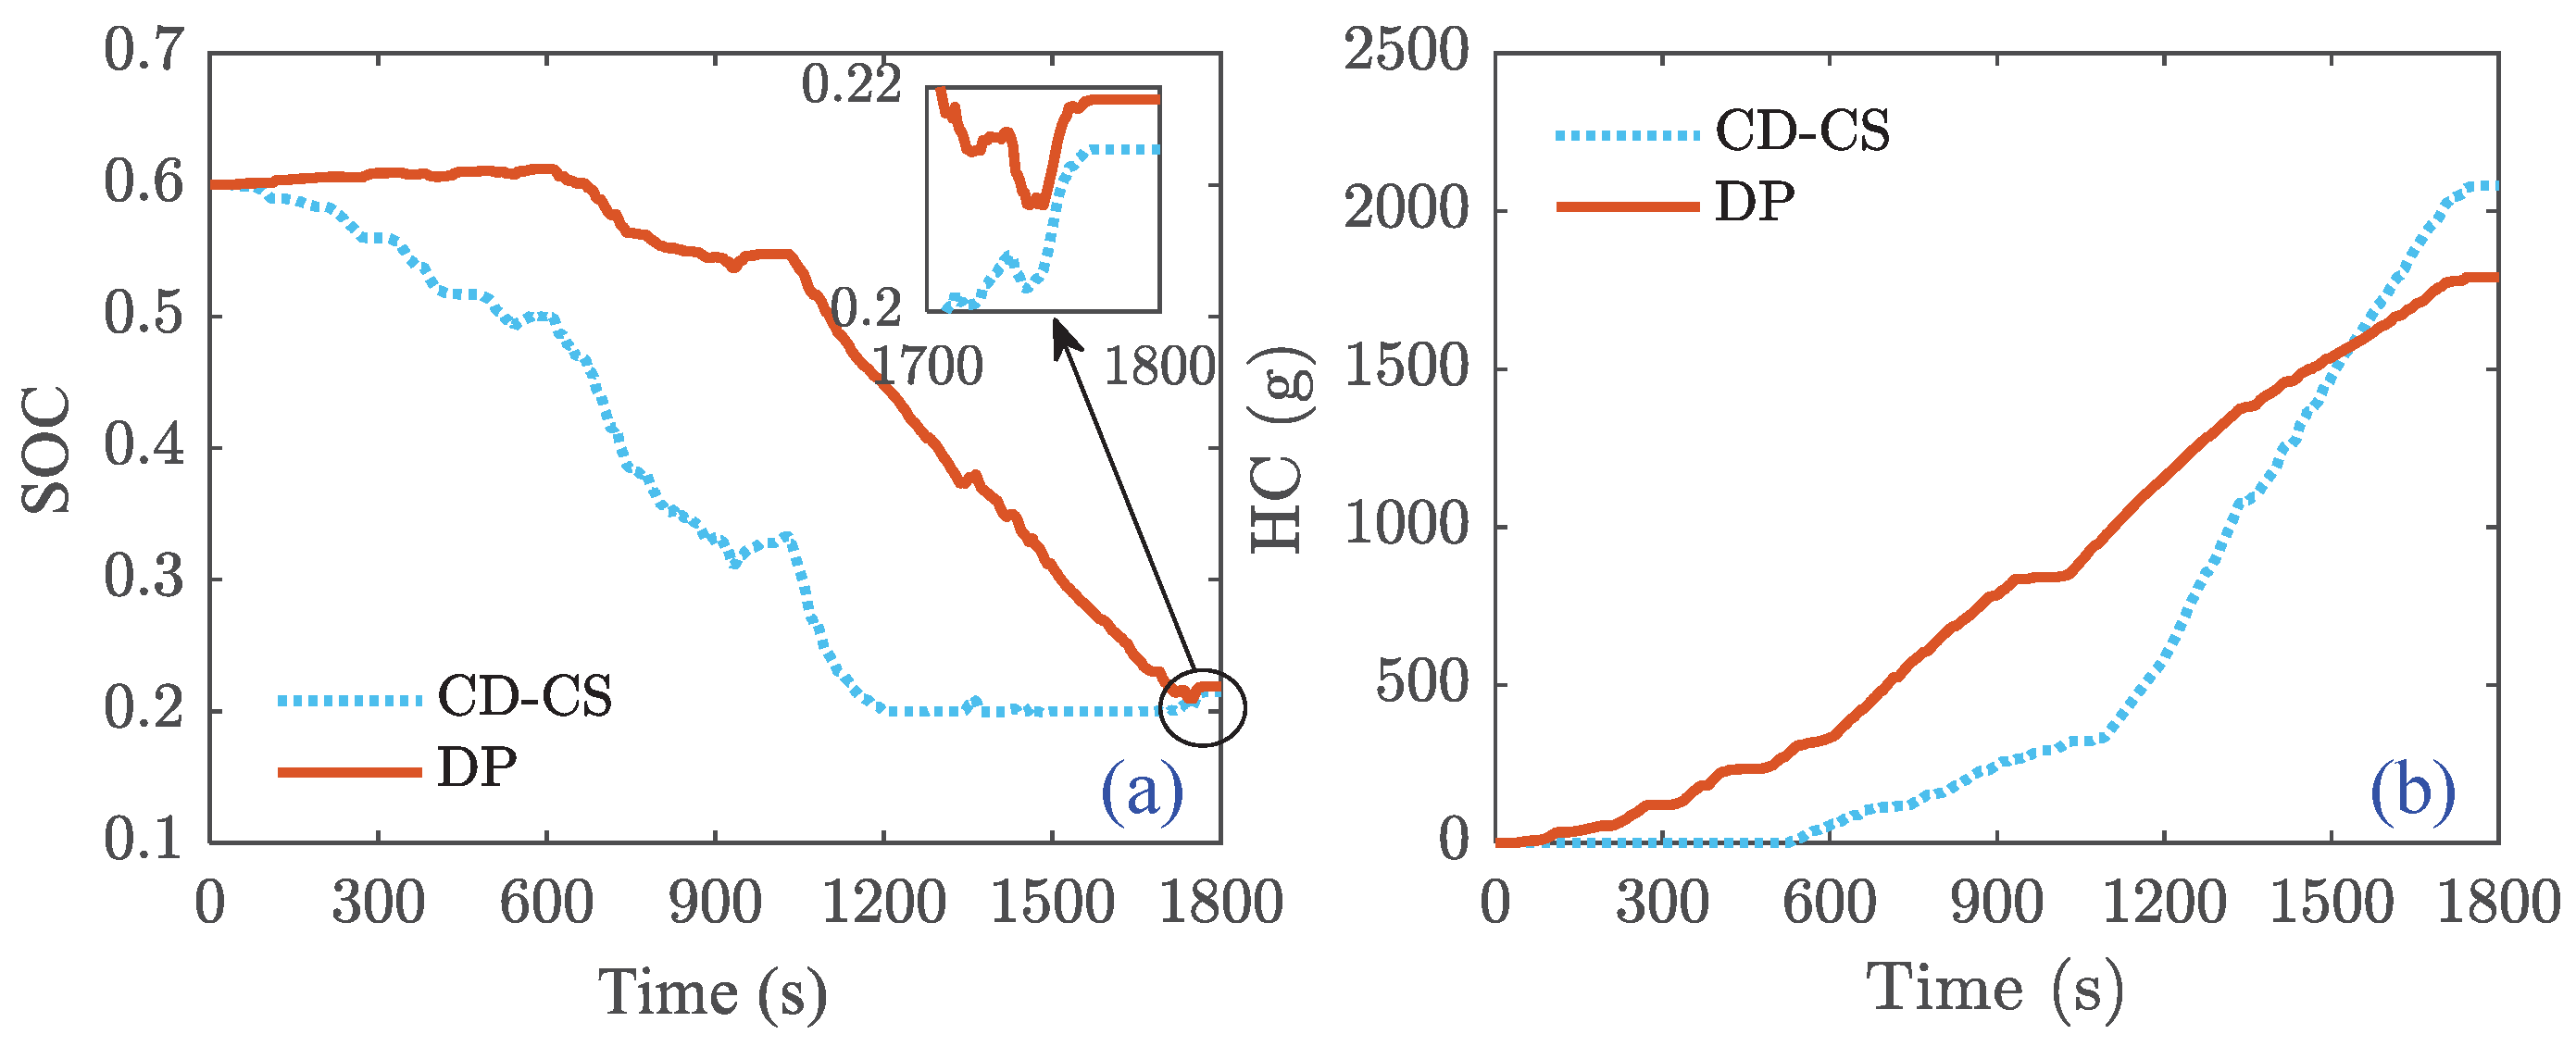
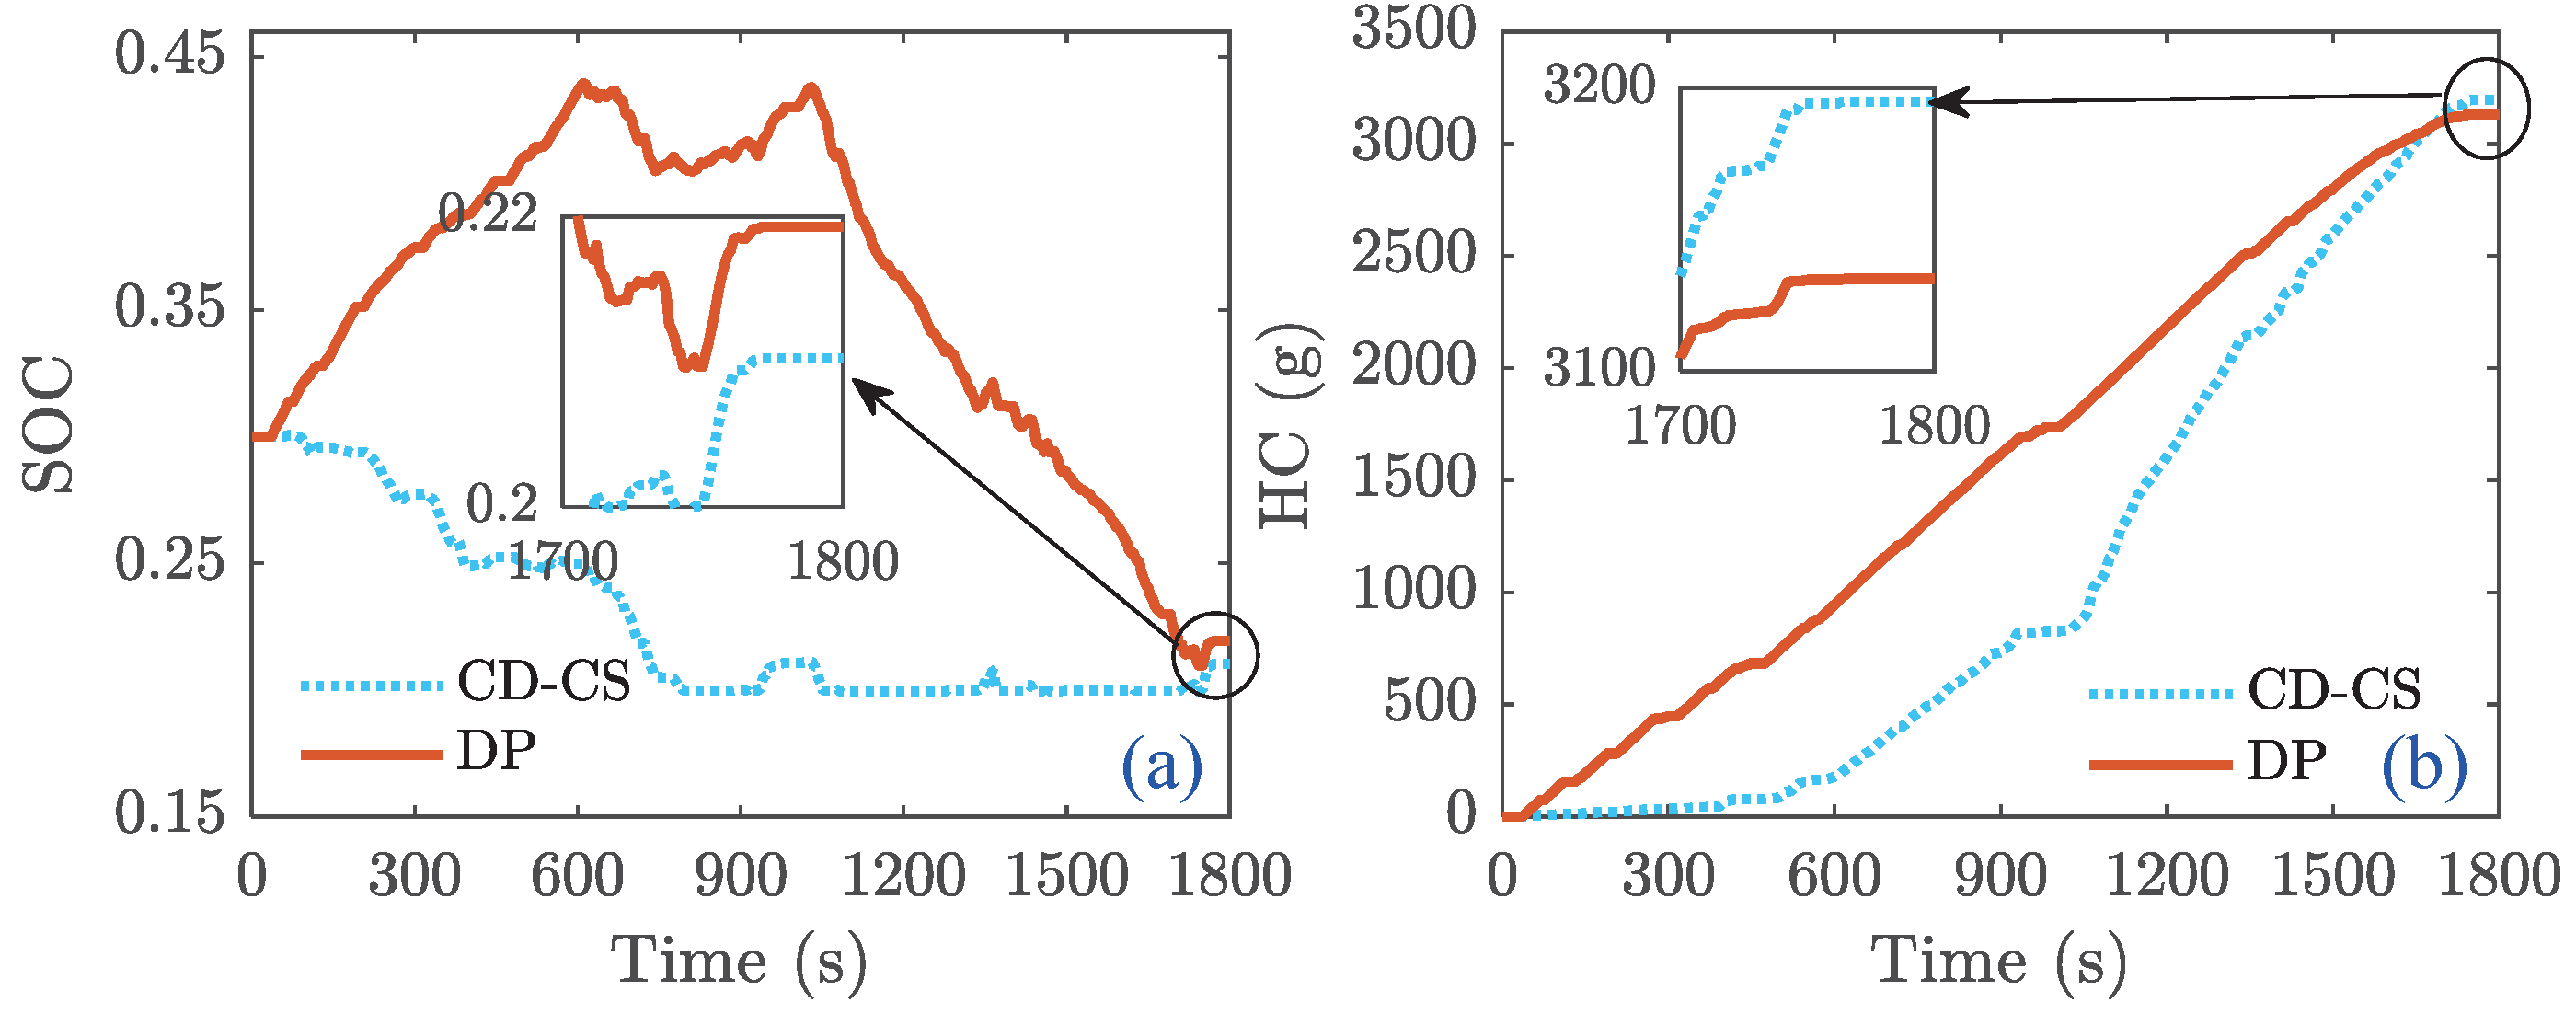
The DP strategy was assessed at different battery SOC levels, specifically when the initial SOC was at 0.6 and 0.3. Figure 9 and Figure 10 present the results, demonstrating that the DP strategy, similar to the CD-CS strategy, can effectively ensure that battery energy is depleted across various initial battery SOCs. Moreover, DP offers a more favorable HC economy than CD-CS. However, it is significant to note that when the initial SOC of the battery is 0.3, the energy-saving effectiveness decreases dramatically.
The comparison between the two strategies is presented in Table 3. The findings suggest that the energy-saving potential of the DP strategy is influenced by the battery SOC, with reductions in HC observed at 21.16%, 13.98%, and 1.94% as initial battery SOC varies from high to low. It has been observed that when the initial SOC is set at 0.3, the proposed DP strategy only manages to reduce the HC by a marginal 1.94%. However, significant improvements are noticeable when the initial SOC values are set at 0.9 and 0.6. It indicates that the proposed DP strategy has the potential to enhance the vehicle’s economic performance as long as the battery energy is not depleted.
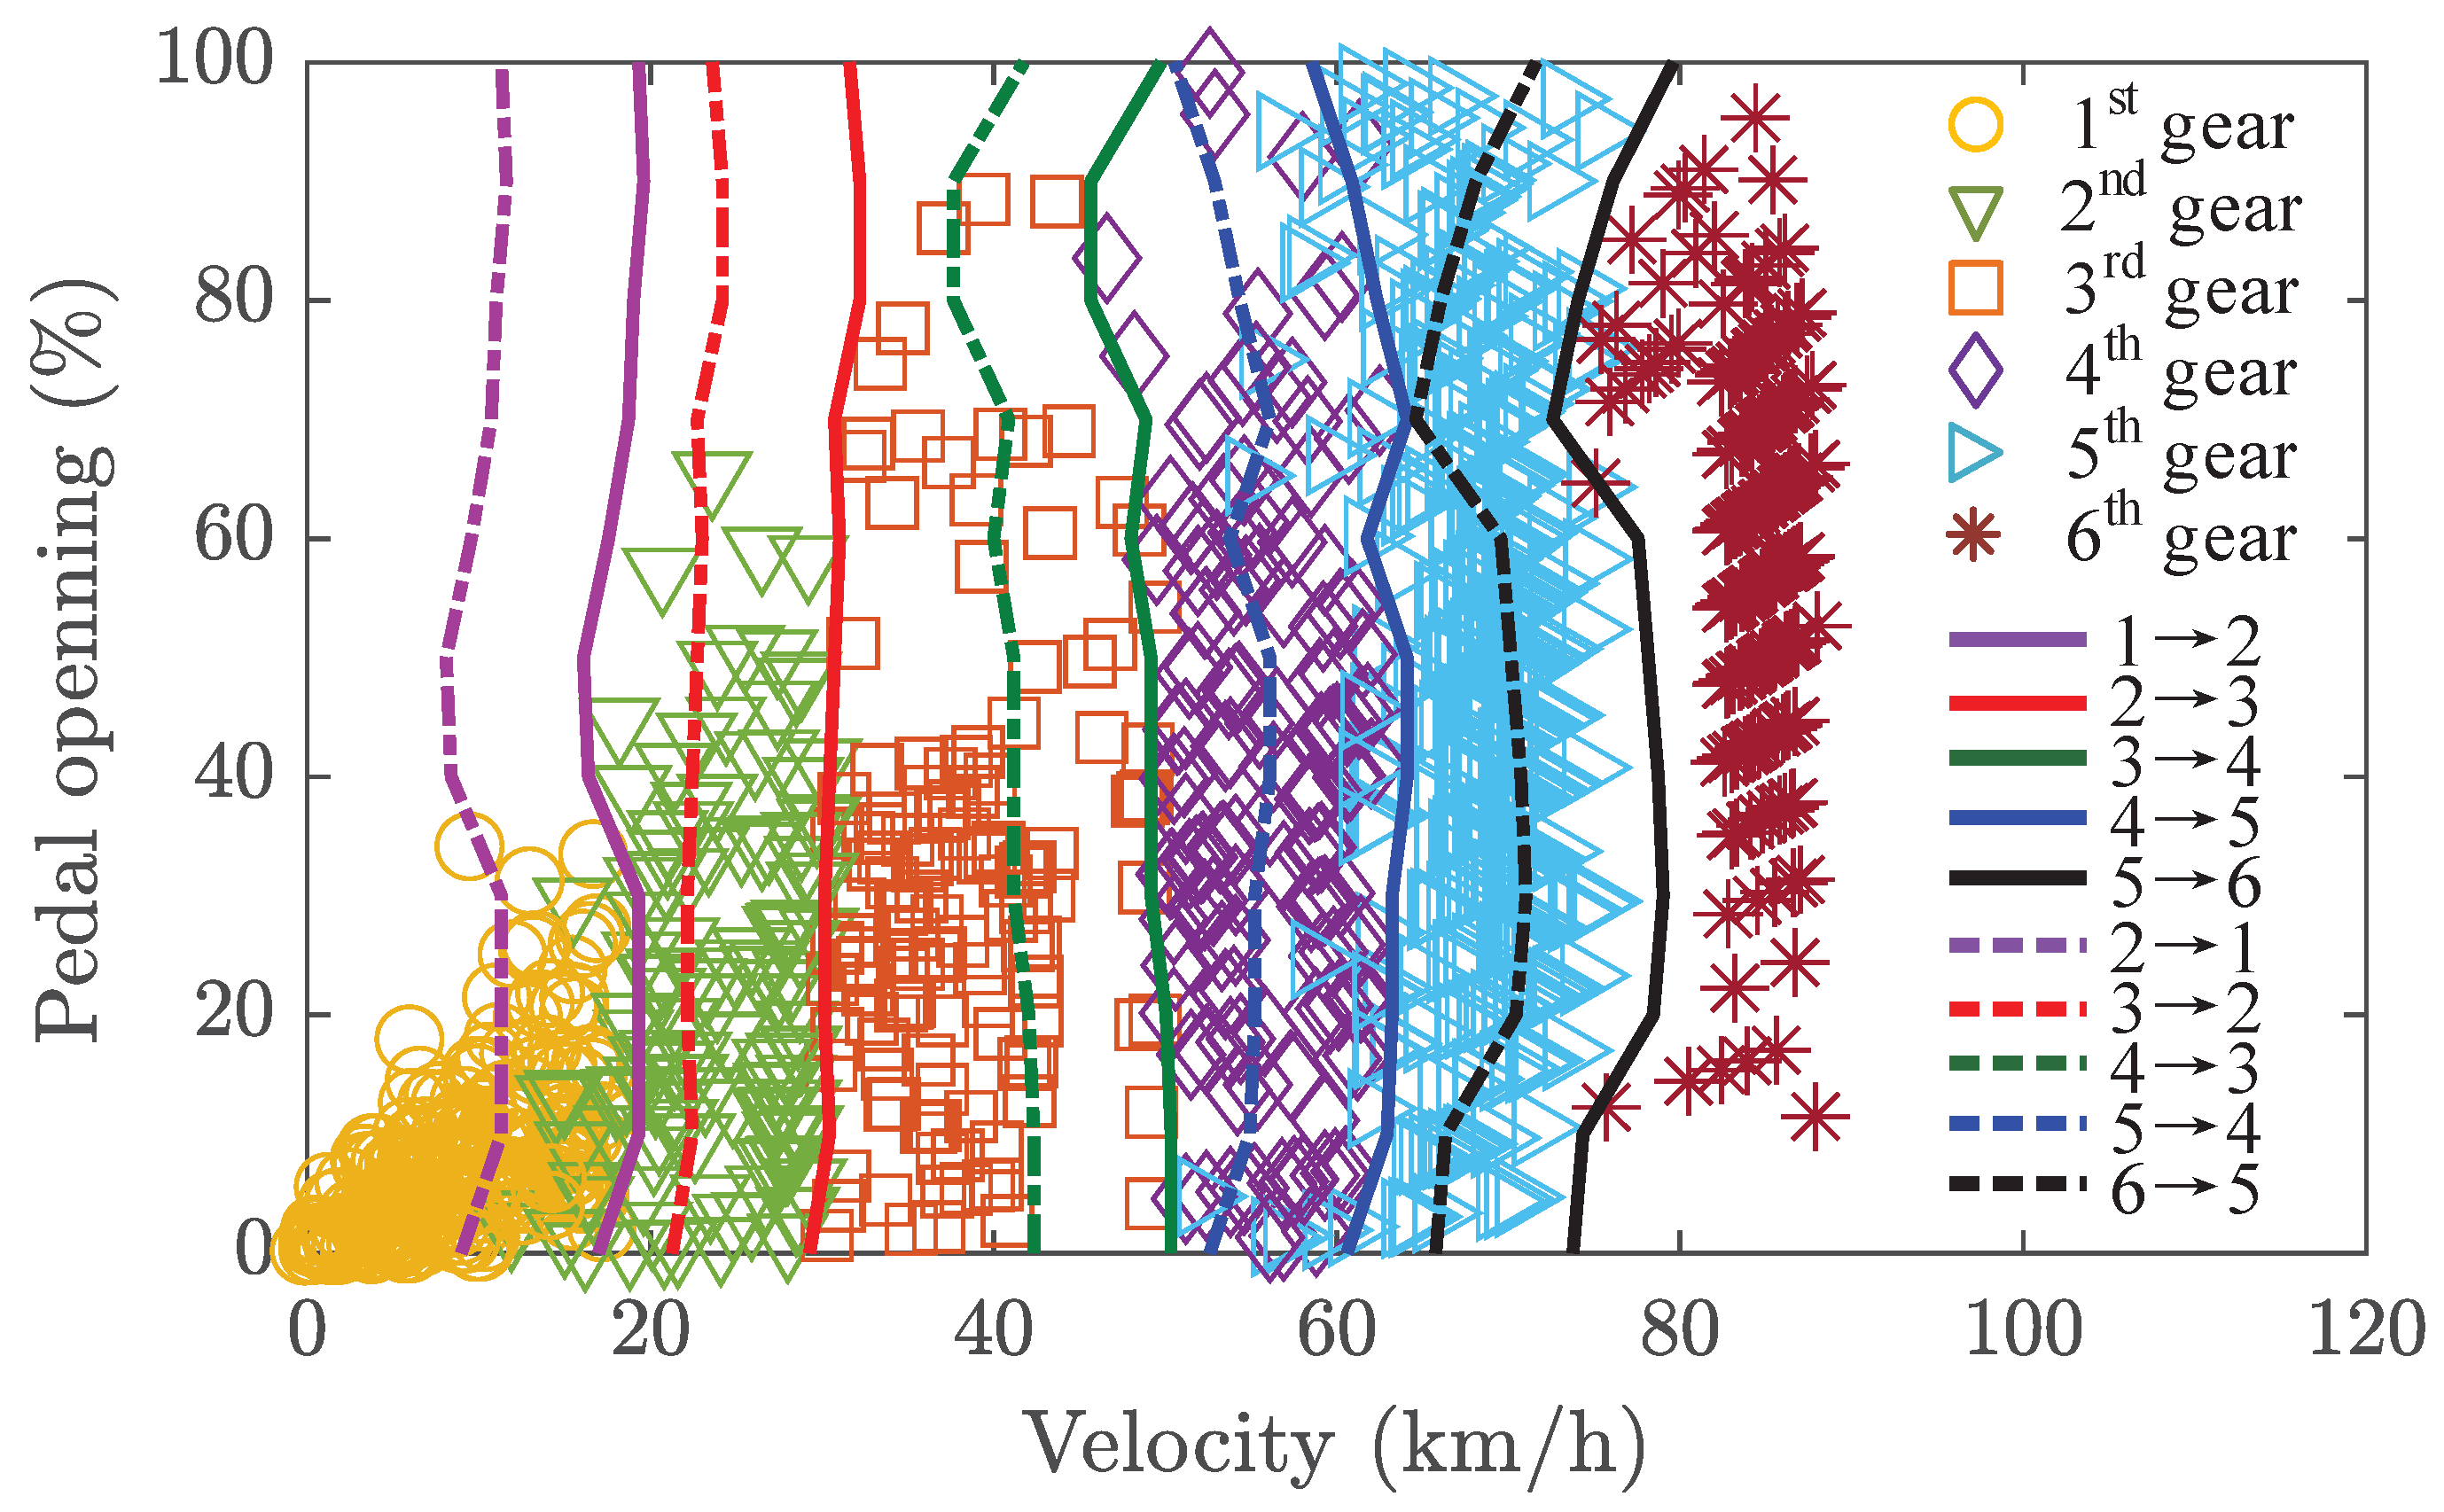
The optimal gear-shift schedule of the AMT can also be derived from the DP results, as illustrated in Figure 11. The marked data point represents the optimal operating state of the AMT under the specified driving cycle. Distinct markers and colors are utilized to differentiate among the various AMT gears. The resulting visualization illustrates clearly separated and well-defined clusters for each gear, with discernible boundaries between adjacent gears. These boundaries enable the approximation of an optimal gear-shift schedule, wherein the solid line indicates the optimal upshift threshold. To mitigate frequent gear shifts, a hysteresis-based downshift delay of 5–8 km/h is implemented relative to the upshift line, thereby establishing the downshift schedule—represented by a dashed line—for each adjacent gear [44]. The derived gear-shifting schedule can be implemented as a rule-based strategy for real-time AMT gear selection, significantly simplifying the energy management of the FCECV.

4. ANFIS-Based Method Integerated DP

4.1. Framework Description

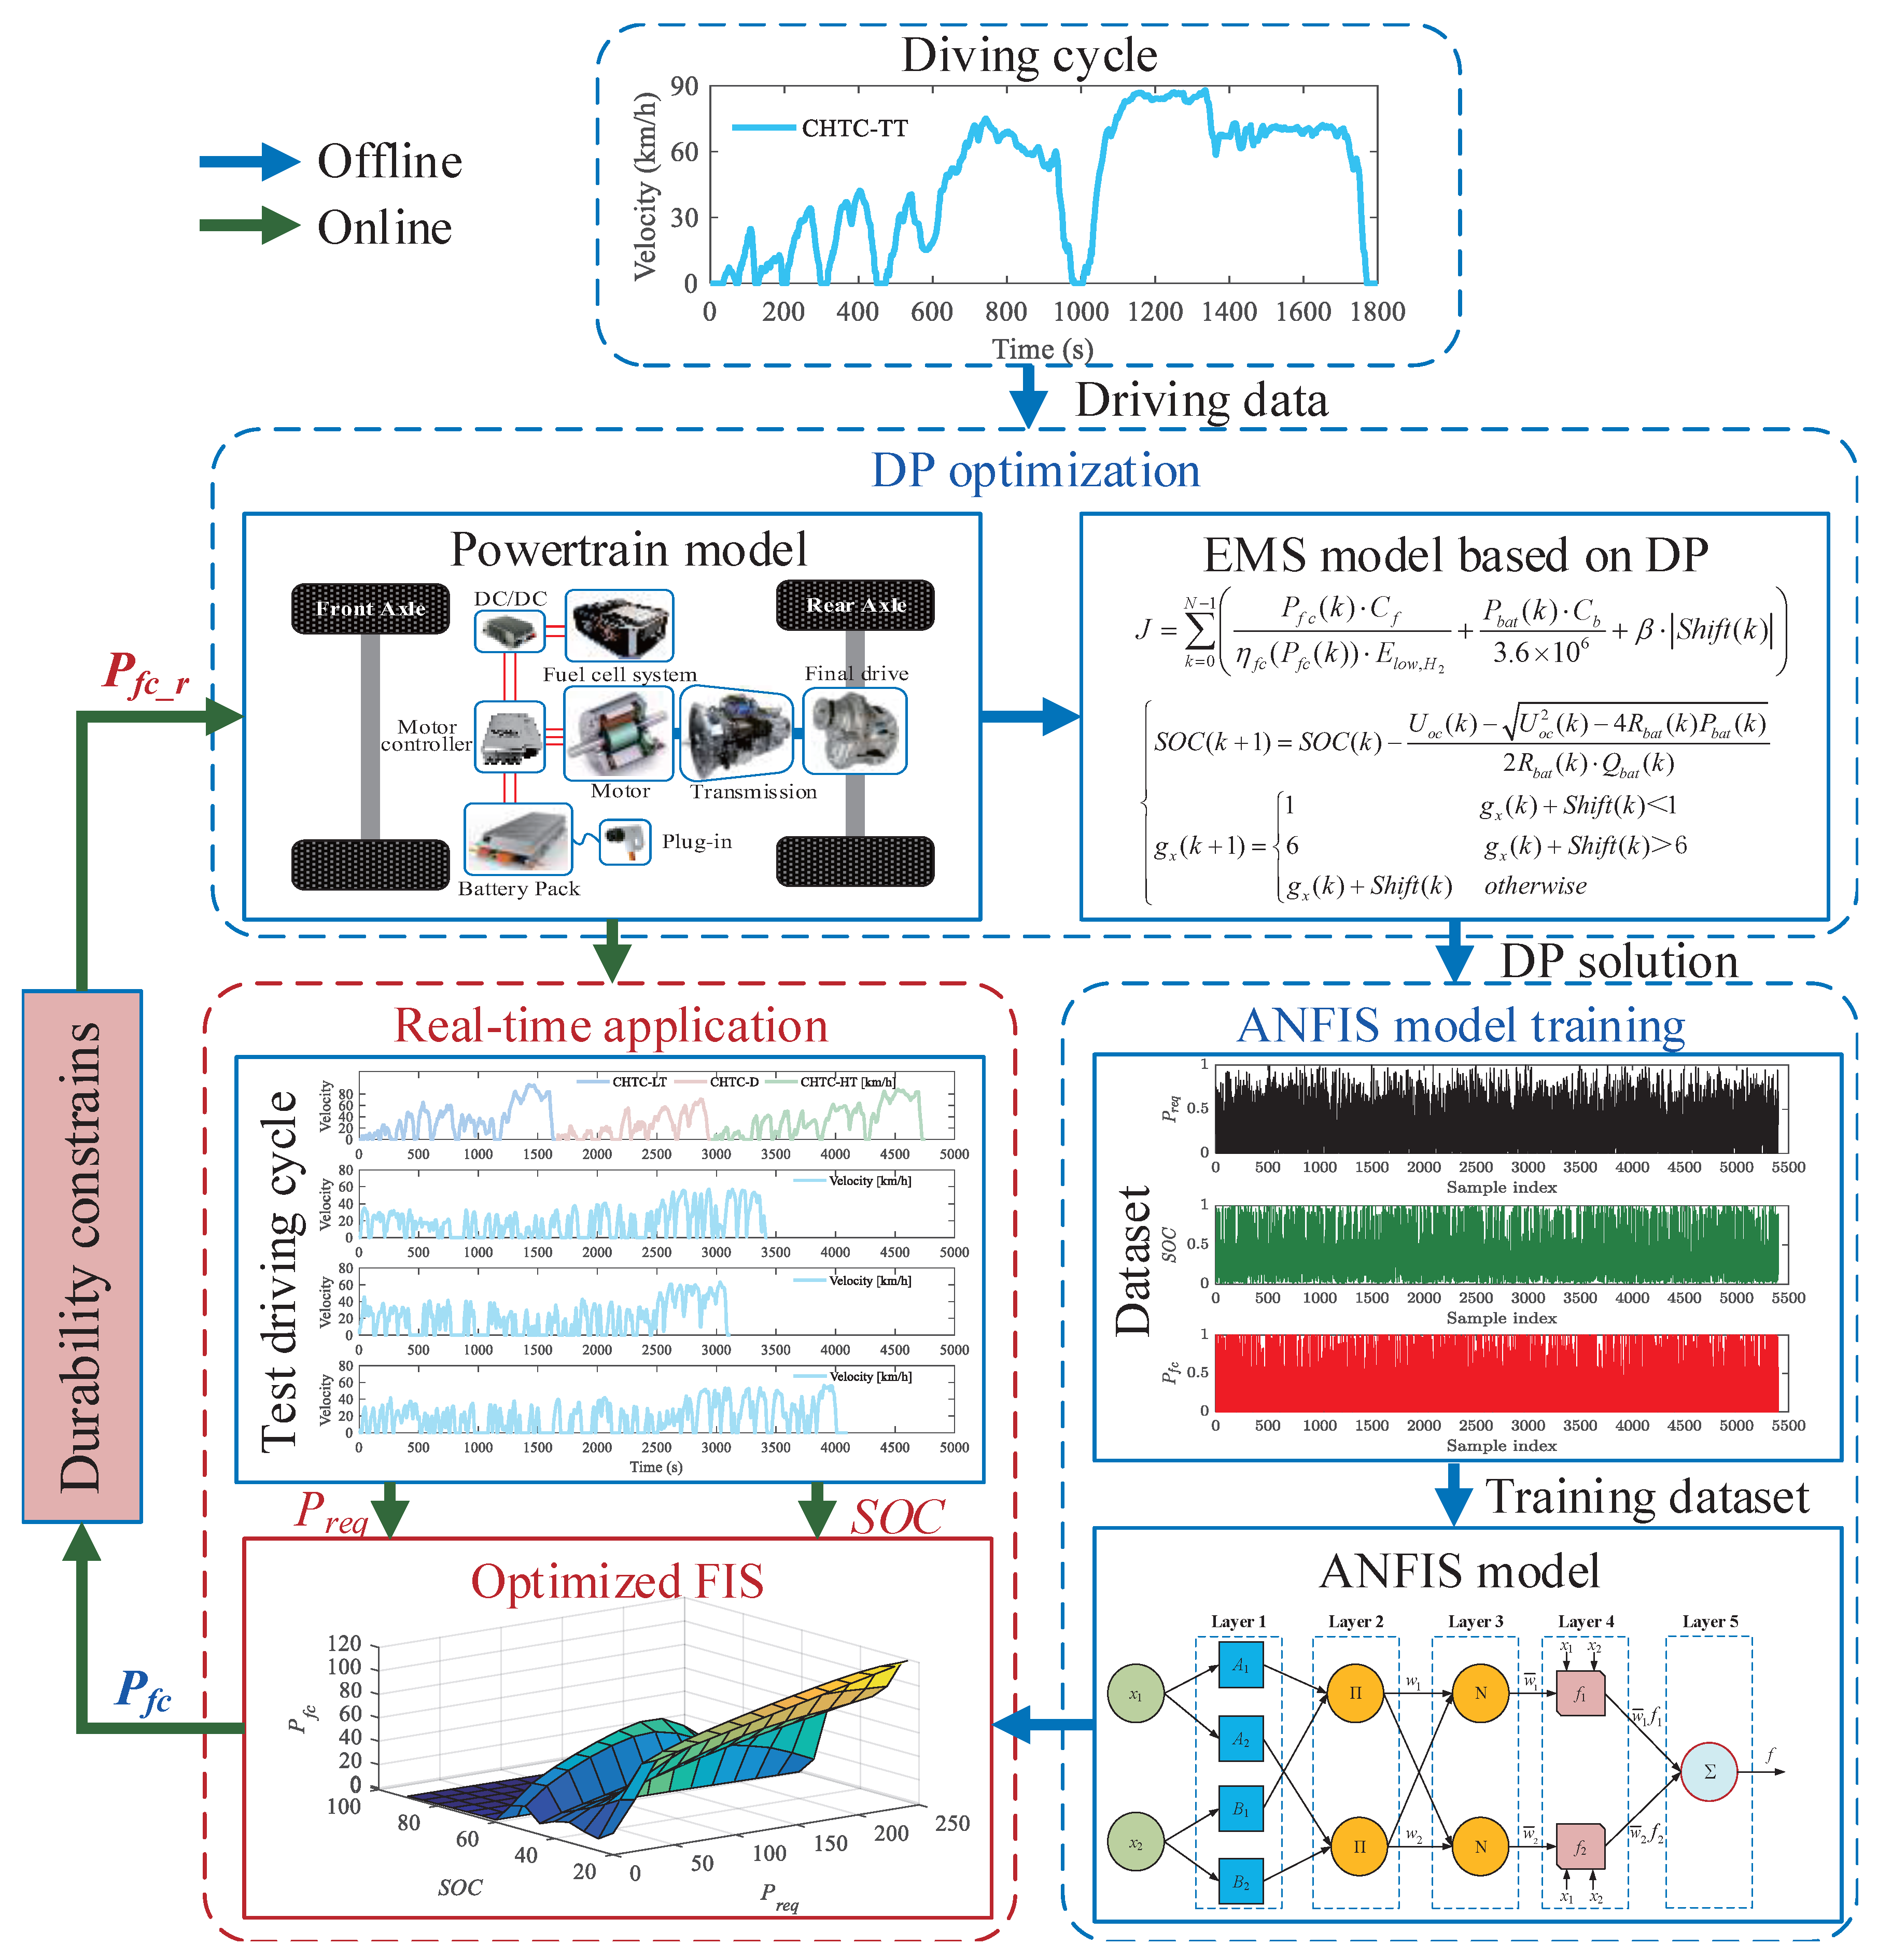
This study develops an online EMS utilizing an ANFIS framework, trained on optimal solutions derived from DP under predefined driving cycles. To enhance computational efficiency during real-time operation, a rule-based gear shift strategy that was precomputed offline (as depicted in Figure 11) is implemented. The DP algorithm was employed to generate optimal solutions, specifically the FCS’s output power profiles, using the CHTC-TT. Multiple initial battery SOC conditions were considered to ensure comprehensive coverage of training data. The resulting dataset, encompassing vehicle power demand, battery SOC, and optimized FCS output power derived from DP, was utilized to train the ANFIS model. Through this training process, an optimized FIS is obtained that is capable of generating near-optimal FCS power outputs in real-time operation based on instantaneous vehicle power requirements and battery SOC. To ensure FCS durability, operational constraints are imposed on its maximum allowable output power. Power is dynamically allocated in actual vehicle operation through real-time adjustment of FCS power output. The complete system architecture is illustrated in Figure 12.

4.2. Energy Mangement Based on ANFIS

4.2.1. ANFIS Model

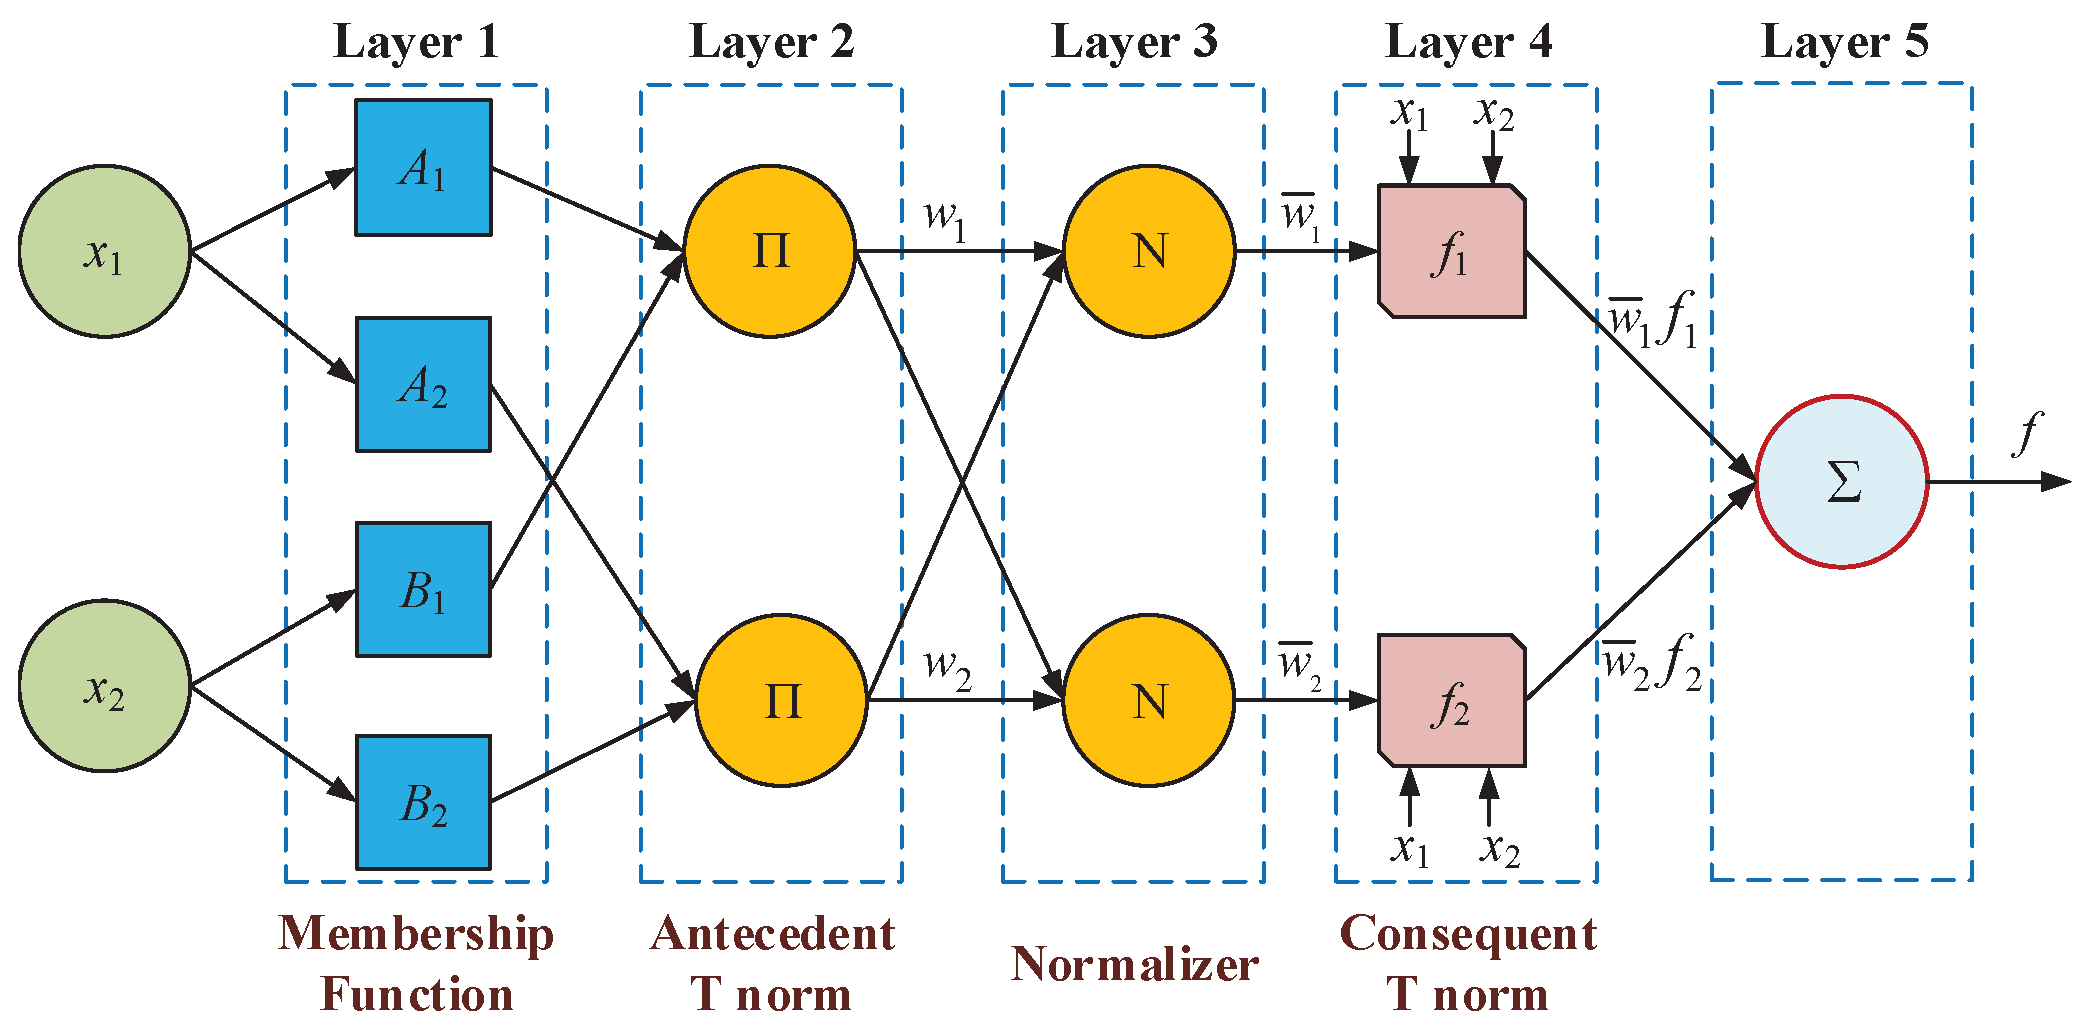
The ANFIS integrates an FIS with an ANN to address intricate and nonlinear problems effectively. During training, ANFIS utilizes input-output data pairs to establish interconnected if-then fuzzy rules. The overall structure of ANFIS is illustrated in Figure 13.
The case describes a system with two inputs and one output, where two fuzzy sets characterize each input variable. The system’s rule base contains two Takagi–Sugeno-type fuzzy if-then rules. In these rules, A 1 , A 2 , B 1 , and B 2 represent nonlinear parameters and membership functions for the input variables, while p 1 , p 2 , q 1 , q 2 , r 1 , and r 2 are linear function parameters for the output, as depicted below [45,46].
Rule 1: If x 1 is A 1 and x 2 is B 1 , then f 1 = p 1 x 1 + q 1 x 2 + r 1 .
Rule 2: If x 1 is A 2 and x 2 is B 2 , then f 2 = p 2 x 1 + q 2 x 2 + r 2 .
The ANFIS architecture comprises five layers with specific functionalities: the fuzzification layer, the rule layer, the normalization layer, the defuzzification layer, and the summation layer. The roles of each layer are illustrated in Equations (17)–(21). In this structure, the nodes in layers 1 and 4 are adaptive, meaning they have modifiable parameters, while the nodes in layers 2, 3, and 5 perform fixed operations without adjustable parameters.
Layer 1’s node can generate the degree of linguistic label membership. The relationship involving membership and including input and output functions can be represented as follows:
O i 1 = μ A i ( x 1 ) , i = 1 , 2 , μ B i ( x 2 ) , i = 1 , 2 , ,
where the output function is defined as O i 1 , while μ A i ( x ) and μ B i ( x ) are the membership functions. The nodes of layer 2 are typically utilized for computing each rule’s firing strengths ( w i ), which can be determined by multiplying the incoming membership values, as explained below.
O i 2 = w i = μ A i ( x 1 ) · μ B i ( x 2 ) , i = 1 , 2 , .
In layer 3, the firing strengths are normalized by calculating each rule’s proportion to the total sum of all firing strengths, as expressed in the following:
O i 3 = w ¯ i = w i w 1 + w 2 , i = 1 , 2 , .
Layer 4 calculates the weighted values of rules in each node, using a linear function to determine the values, as described in the following equation:
O i 4 = w ¯ i f i = w ¯ i ( p i x 1 + q i x 2 + r i ) , i = 1 , 2 , ,
where p i , q i and r i are commonly known as consequent parameters.
The final output of the ANFIS is obtained by summing the outputs from each rule in the defuzzification layer in response to the current input in layer 5:
O i 5 = w ¯ i f i = i w i f i i w i , i = 1 , 2 ,
The ANFIS structure includes parameters in the first and fourth layers that can be modified over time. The first layer addresses the nonlinearities of precursor parameters, while the fourth layer involves linear outcome parameters. Both parameters can be adjusted and updated through a learning method that trains and adapts to their respective conditions.

4.2.2. ANFIS-Based Energy Management

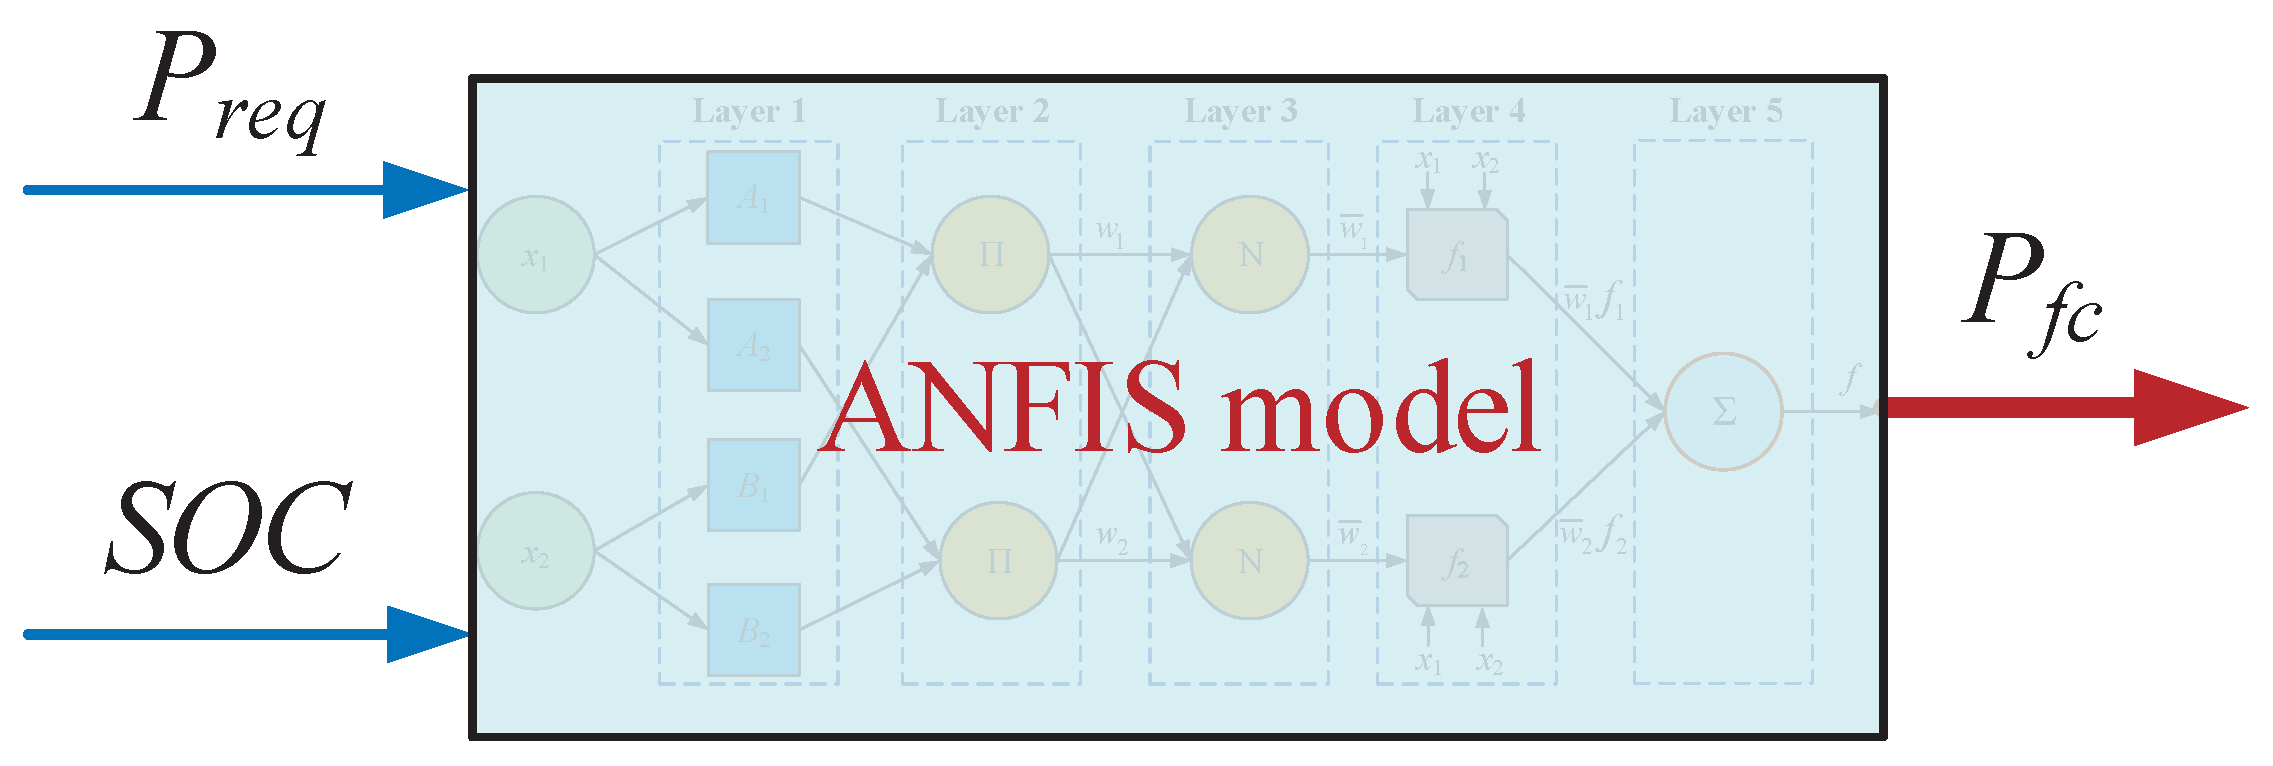
In this section, the ANFIS model was utilized to formulate an FIS for the energy management of the FCECV, as illustrated in Figure 14. The required power ( P req ) and battery SOC of the vehicle are considered inputs for the ANFIS model, while the FCS’s output power ( P fc ) is the output. Training the ANFIS model enables the development of more accurate fuzzy control rules for real-time vehicle applications, provided suitable data is available. Fortunately, the optimal control data for the FCECV can be obtained through DP, as outlined in Section 3. This will be significant for training the ANFIS model.
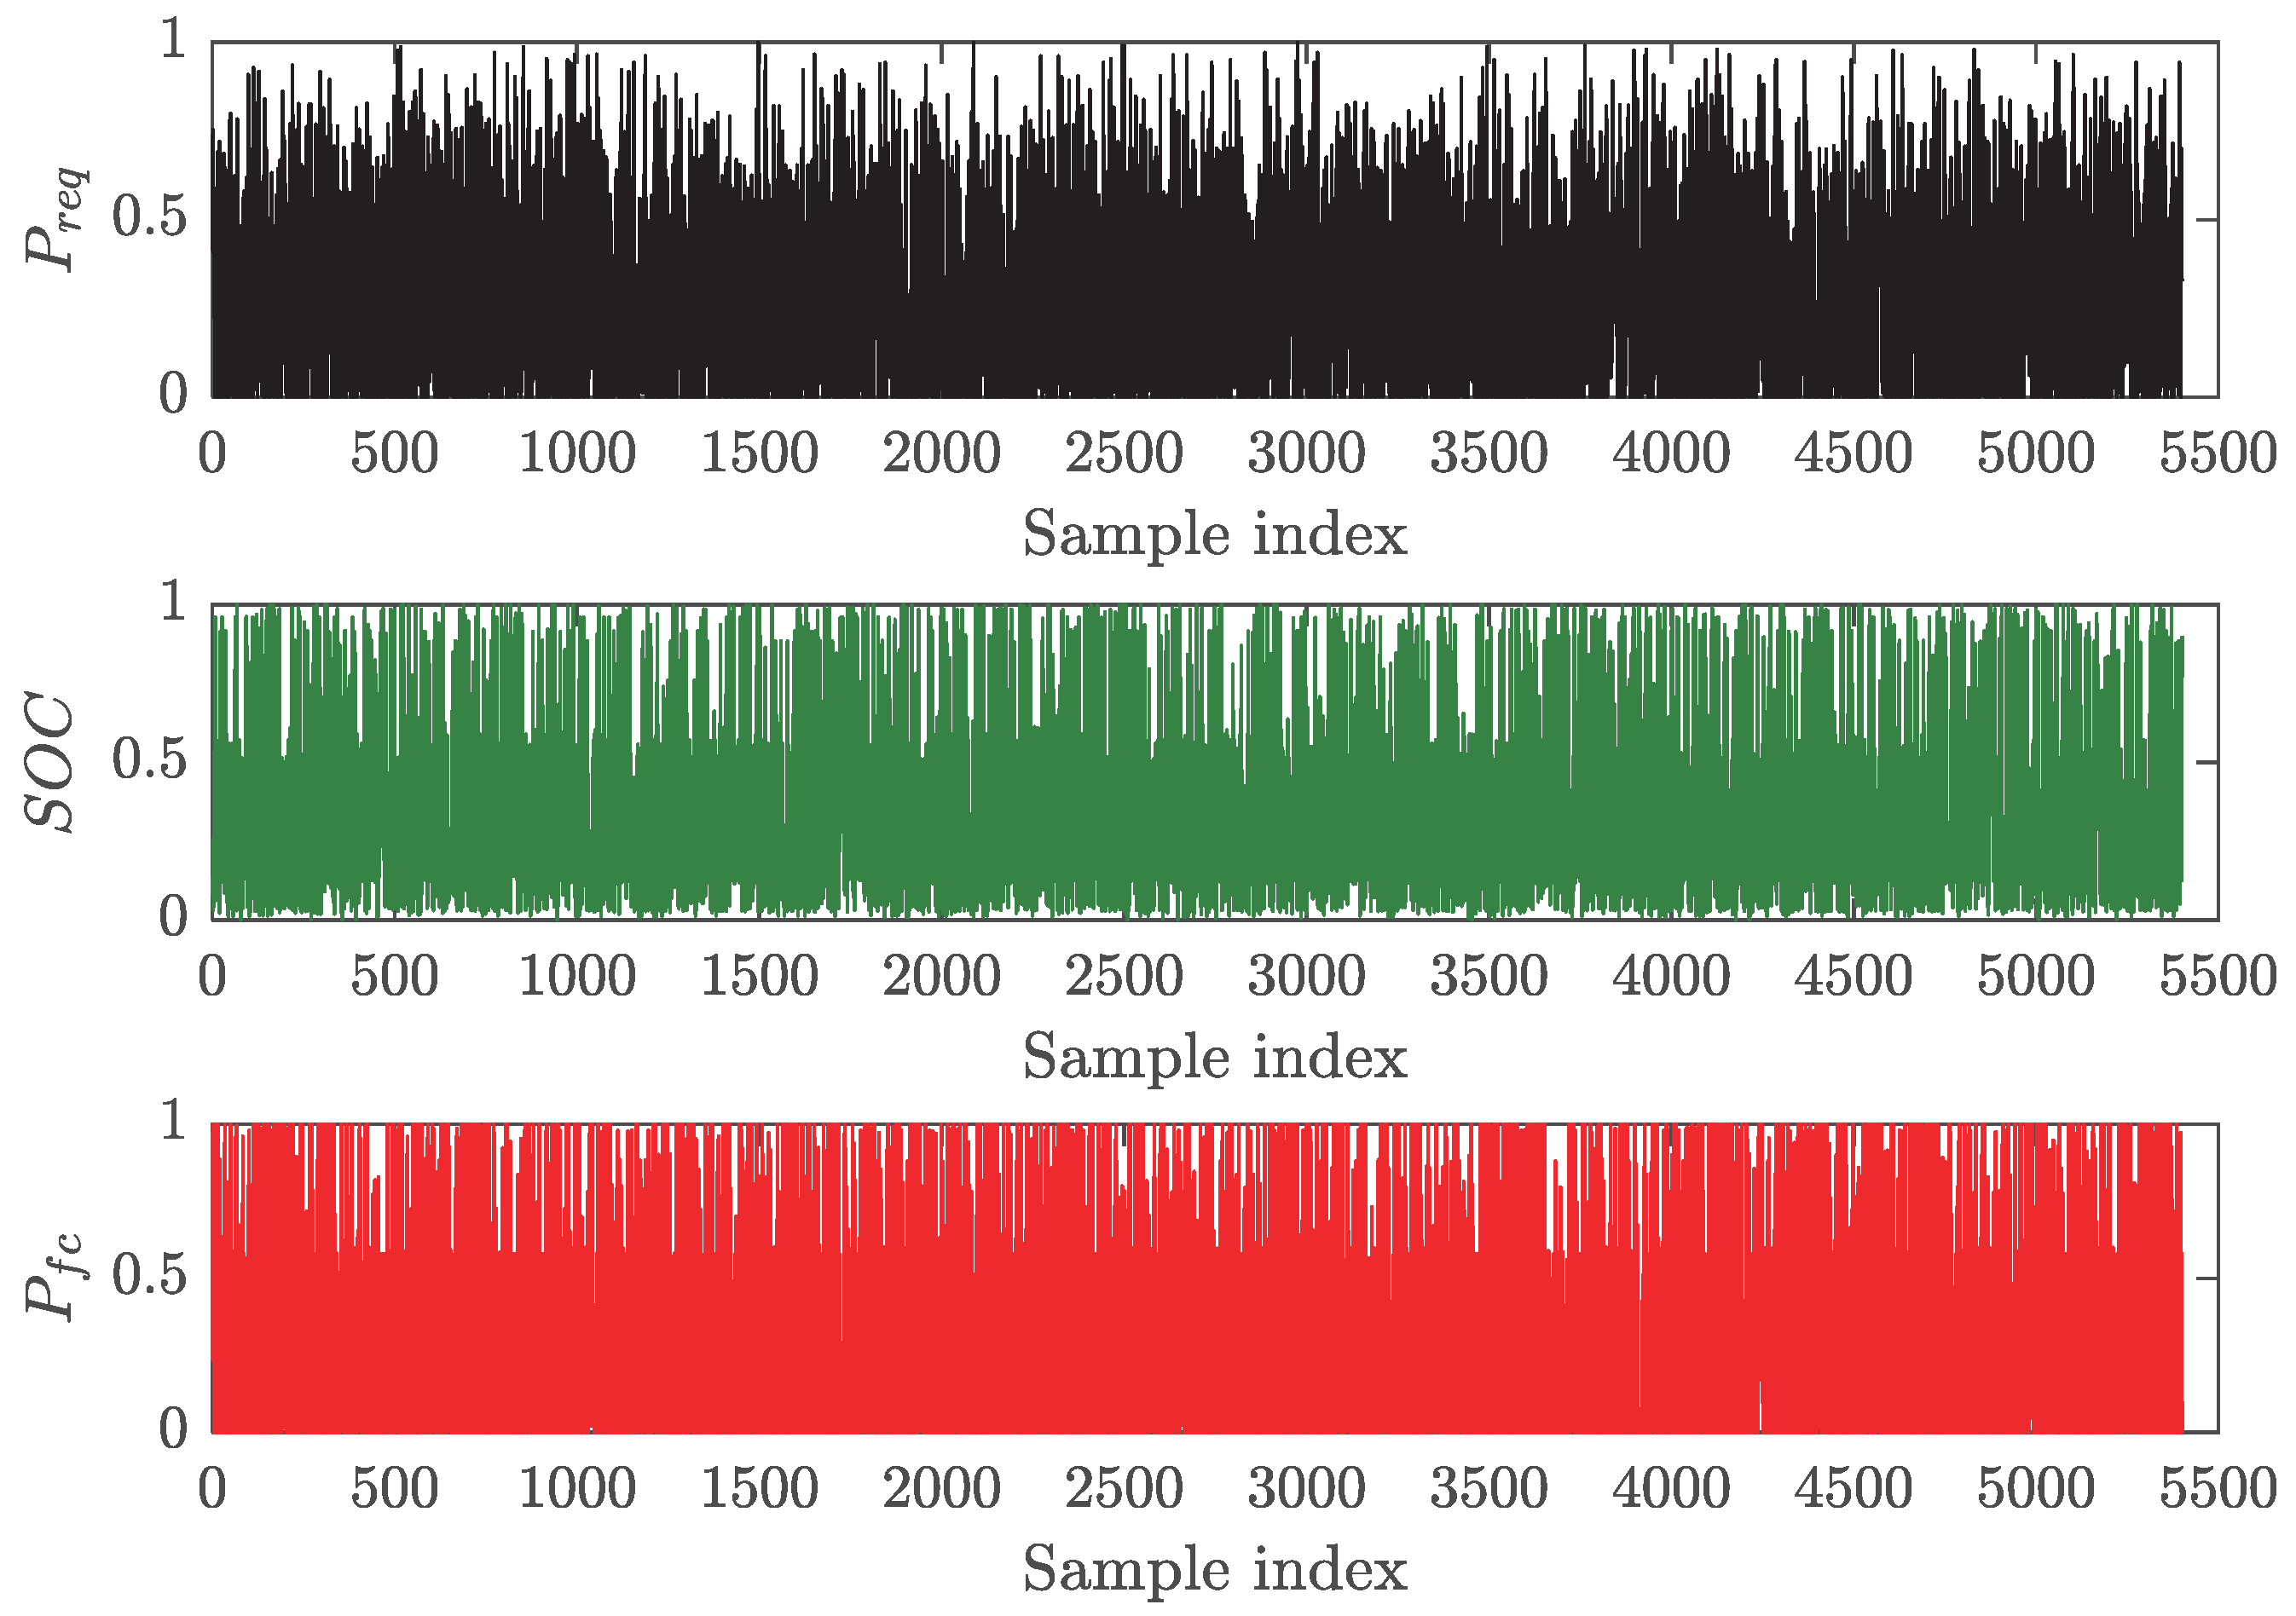
Figure 15 illustrates the dataset with all input and output variables normalized to the range of [0, 1] using Min–Max scaling. This normalization enhances training efficiency and promotes stable ANFIS training by mitigating scale differences. Specifically, the vehicle power demand ( P r e q ) was scaled to [0, 250] kW, with negative braking values excluded because they fall outside the FCS’s operational range. Additionally, the battery SOC ( S O C ) was normalized to [0.2, 0.9], while the FCS power ( P f c ) was scaled to [0, 123] kW.

4.2.3. Model Training

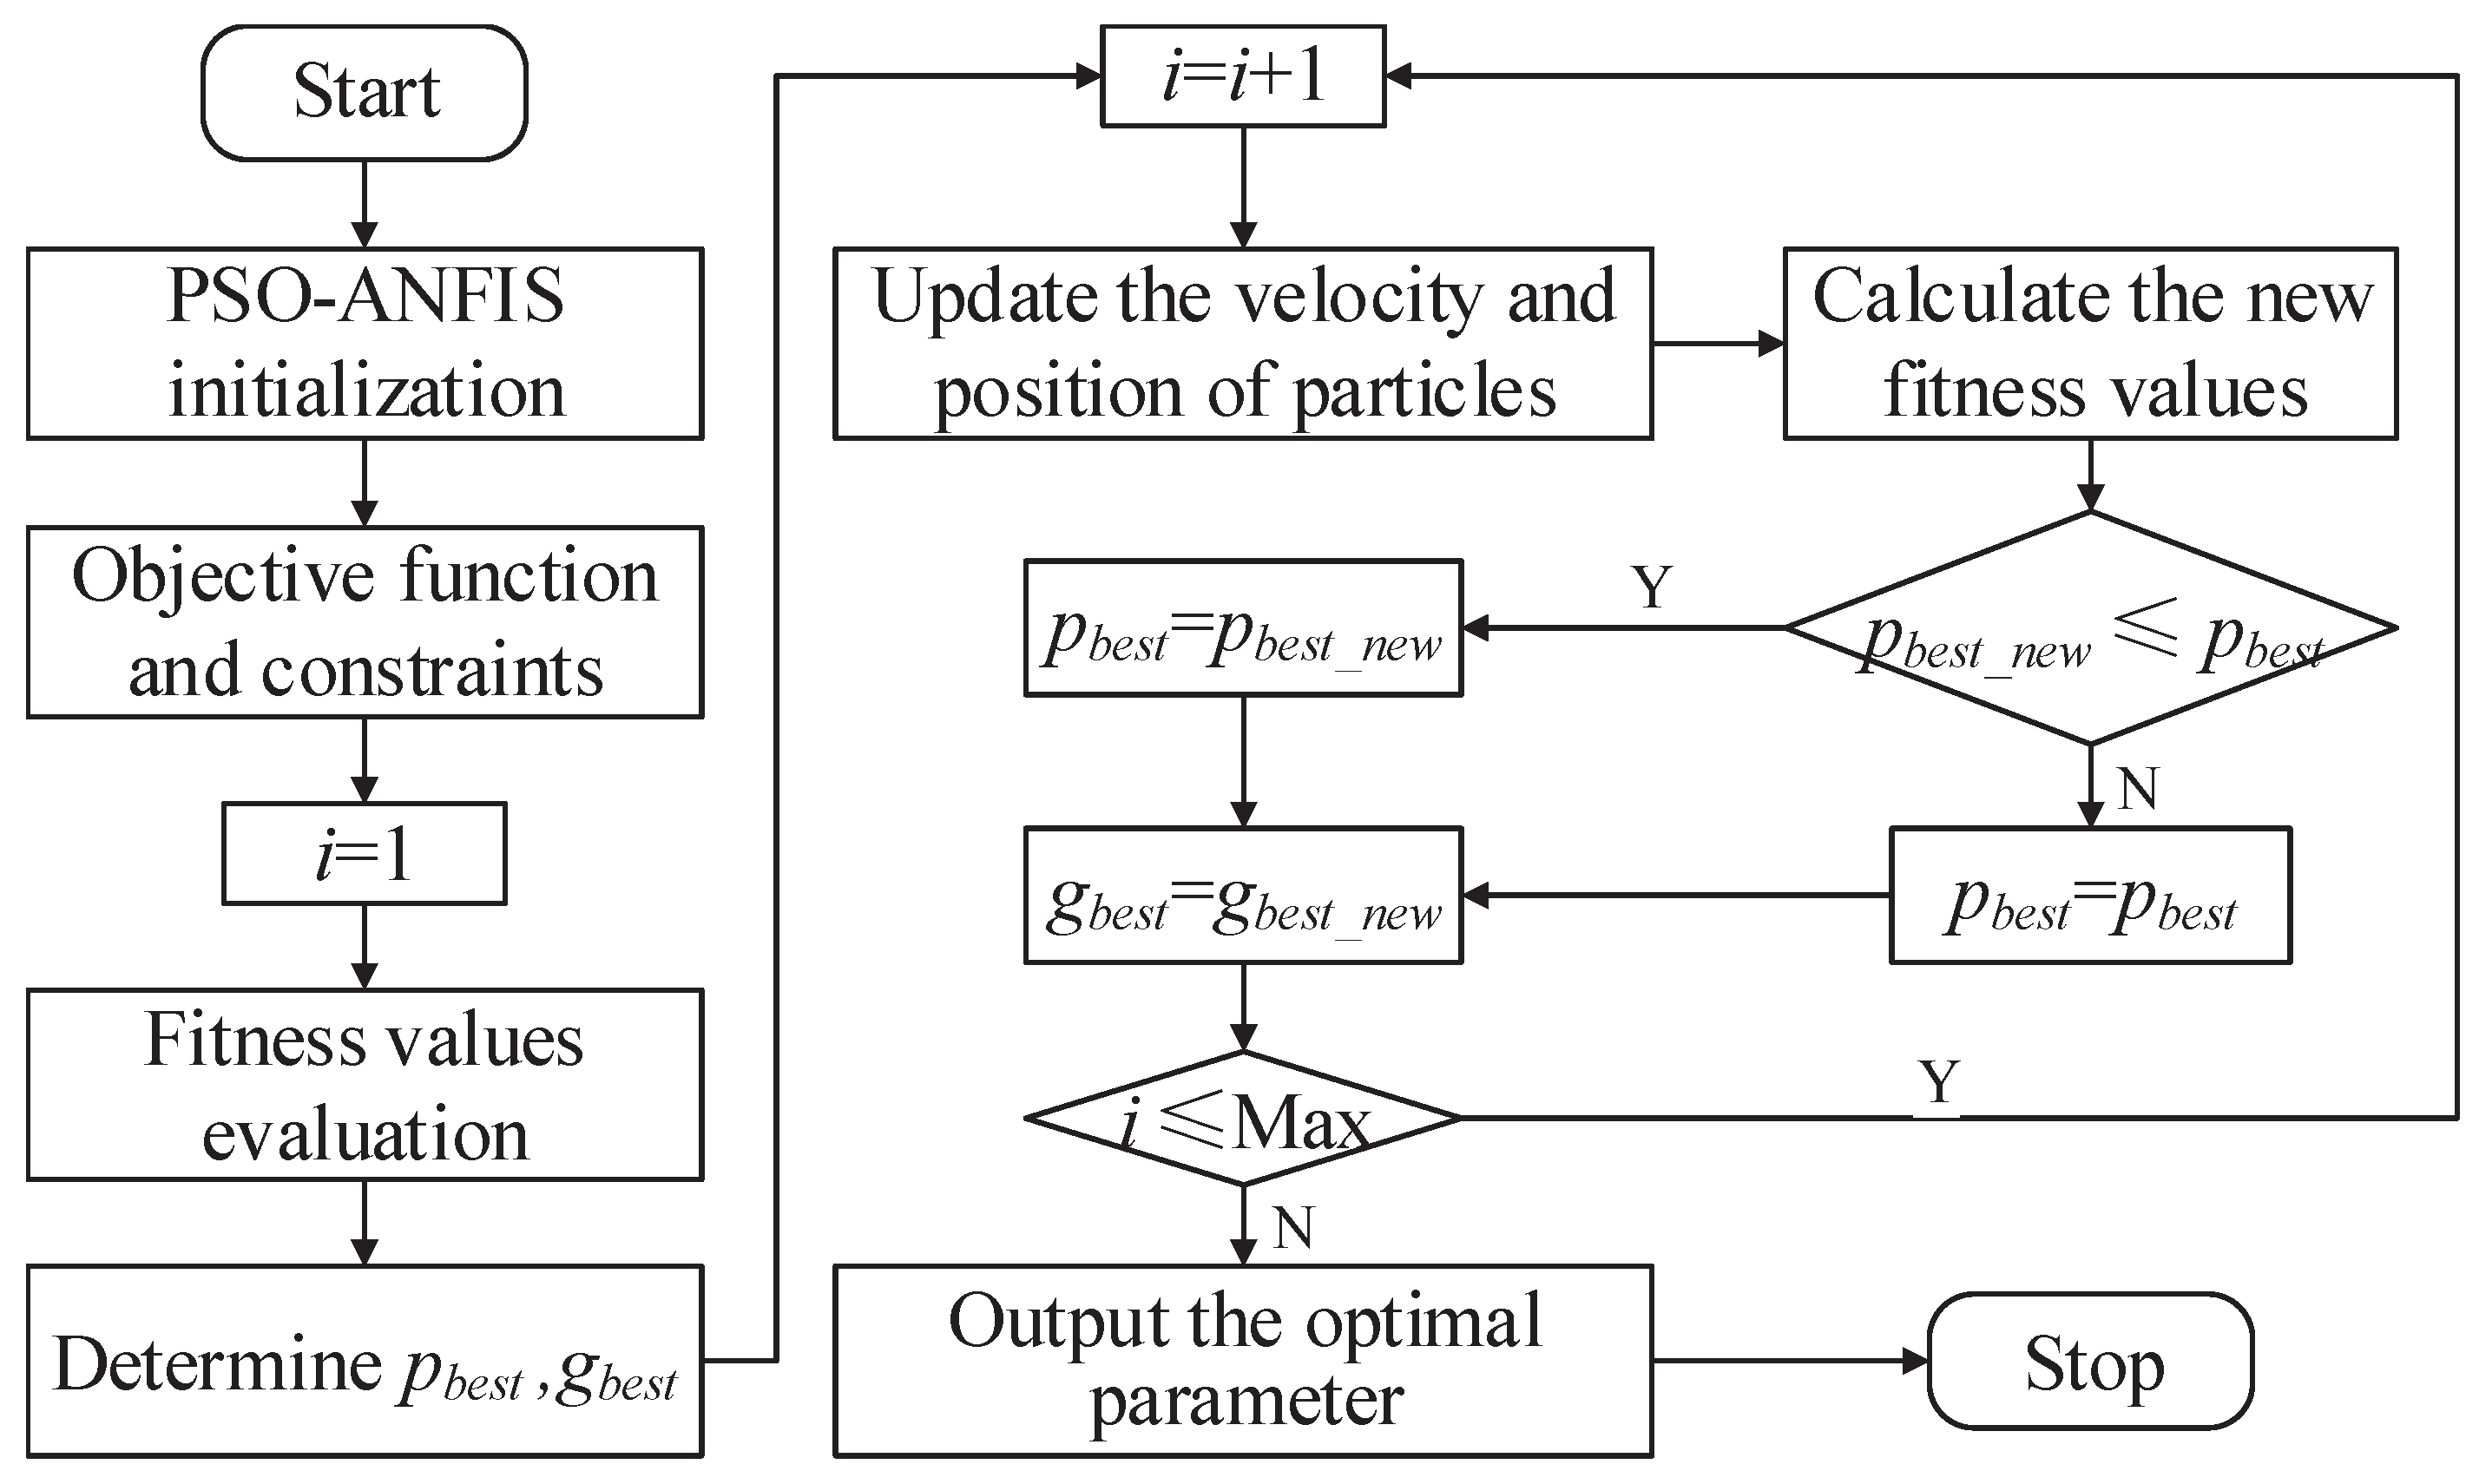
The training of ANFIS involves determining its structural parameters through an optimization algorithm. Successful training is crucial to achieving effective outcomes with ANFIS. PSO is well-known as a stochastic, population-based optimization technique. It starts by selecting a group of random solutions represented as particles. These particles then iteratively update generations to pursue optimal outcomes. In PSO, the particles navigate through the problem space by following the most favorable available solutions [47]. Therefore, it has been popularly utilized for training an ANFIS model. The flowchart illustrating the training process of the ANFIS model using PSO is presented in Figure 16. In the first iteration, each particle’s initial position is assigned as its personal best ( p best ), and the swarm’s global best ( g best ) is determined. The algorithm then proceeds iteratively as follows: (1) The velocity and position vectors of each particle are updated. (2) New fitness values ( p best _ new ) are evaluated and compared with previous values to determine the optimal solutions g best . Meanwhile, its position and corresponding particle index are recorded accordingly. (3) The process repeats until the maximum iteration count is reached. Upon termination, the final g best values serve as the identified global optimal parameters, and each particle’s position vector is sequentially applied to ANFIS as antecedent parameters.
The models’ performances are usually evaluated utilizing statistical measures, including mean-square error (MSE), root mean square error (RMSE), mean absolute error (MAE), and standard deviation error (St.D.) distribution. The equations for these measures are provided below.
M S E = 1 n i = 1 n ( y i y ^ i ) 2 R M S E = 1 n i = 1 n ( y i y ^ i ) 2 M A E = 1 n i = 1 n | y i y ^ i | S t . D . = ( y ^ 1 y ¯ ) 2 + ( y ^ 2 y ¯ ) 2 + + ( y ^ n y ¯ ) 2 n ,
where y i and y ^ i represent the i-th expected and estimated values during the training process. n denotes the total amount of training data, and y ¯ is the mean value of all expected values.
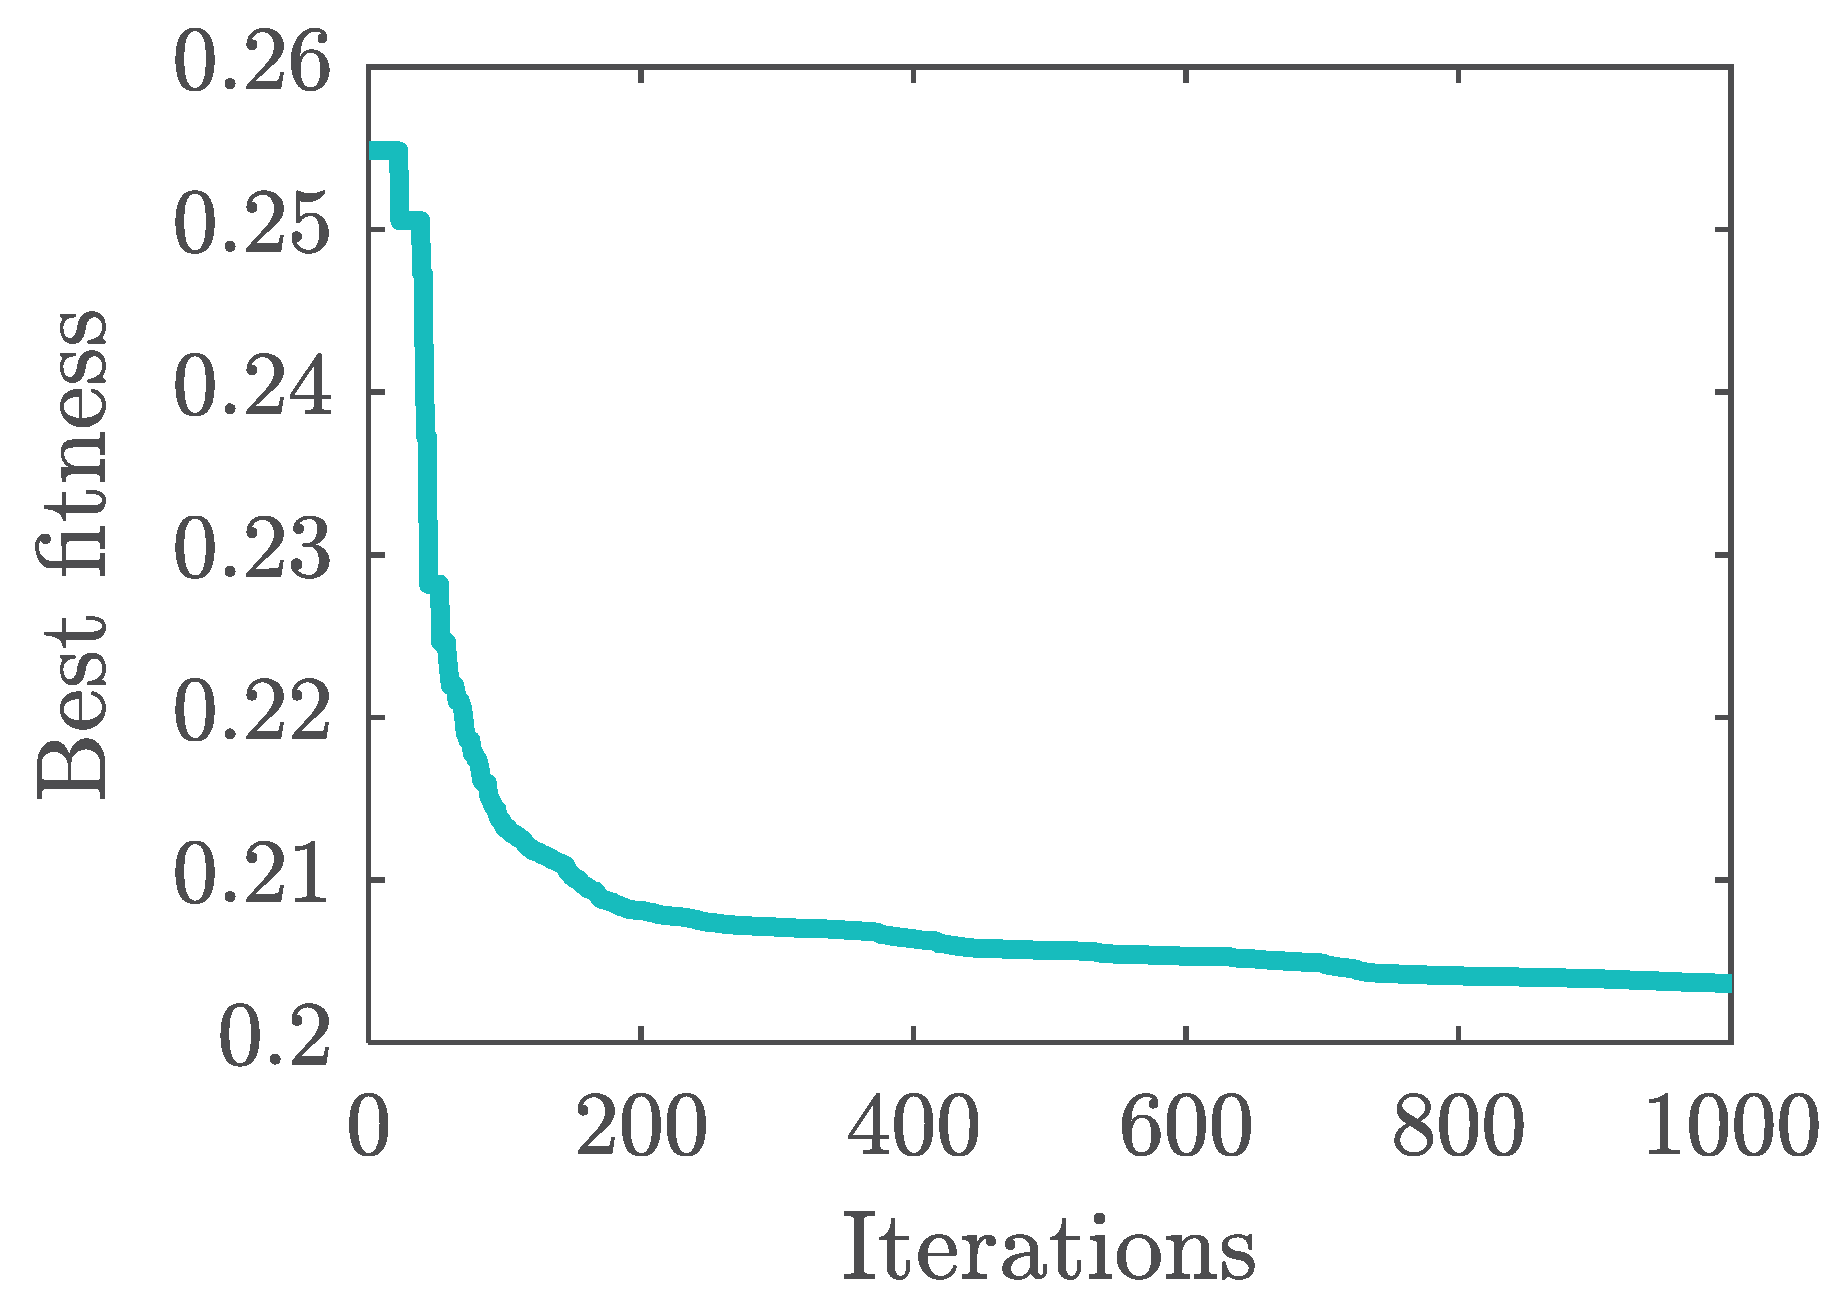
During the training process, the maximum number of iterations is 1000, and the population size of the PSO is 100. The initial inertia weight, inertia weight damping ratio, personal learning coefficient, and global learning coefficient are set to 1, 0.99, 1, and 2, respectively. The training dataset was created using optimal power allocation solutions generated by the DP algorithm, specifically applying CHTC-TT. This resulted in a total of 5400 samples, divided into a training set (80%, 4320 samples) and a testing set (20%, 1080 samples). Each sample comprises two inputs, including the vehicle power demand ( P r e q ) and the battery SOC ( S O C ). The output is the optimal FCS power ( P f c ) determined by the DP optimizer. The best fitness of the training process is shown in Figure 17. The results demonstrate that the ANFIS converges satisfactorily after training, with the best cost (RMSE) decreasing from 0.2548 to 0.2036 and gradually approaching convergence.
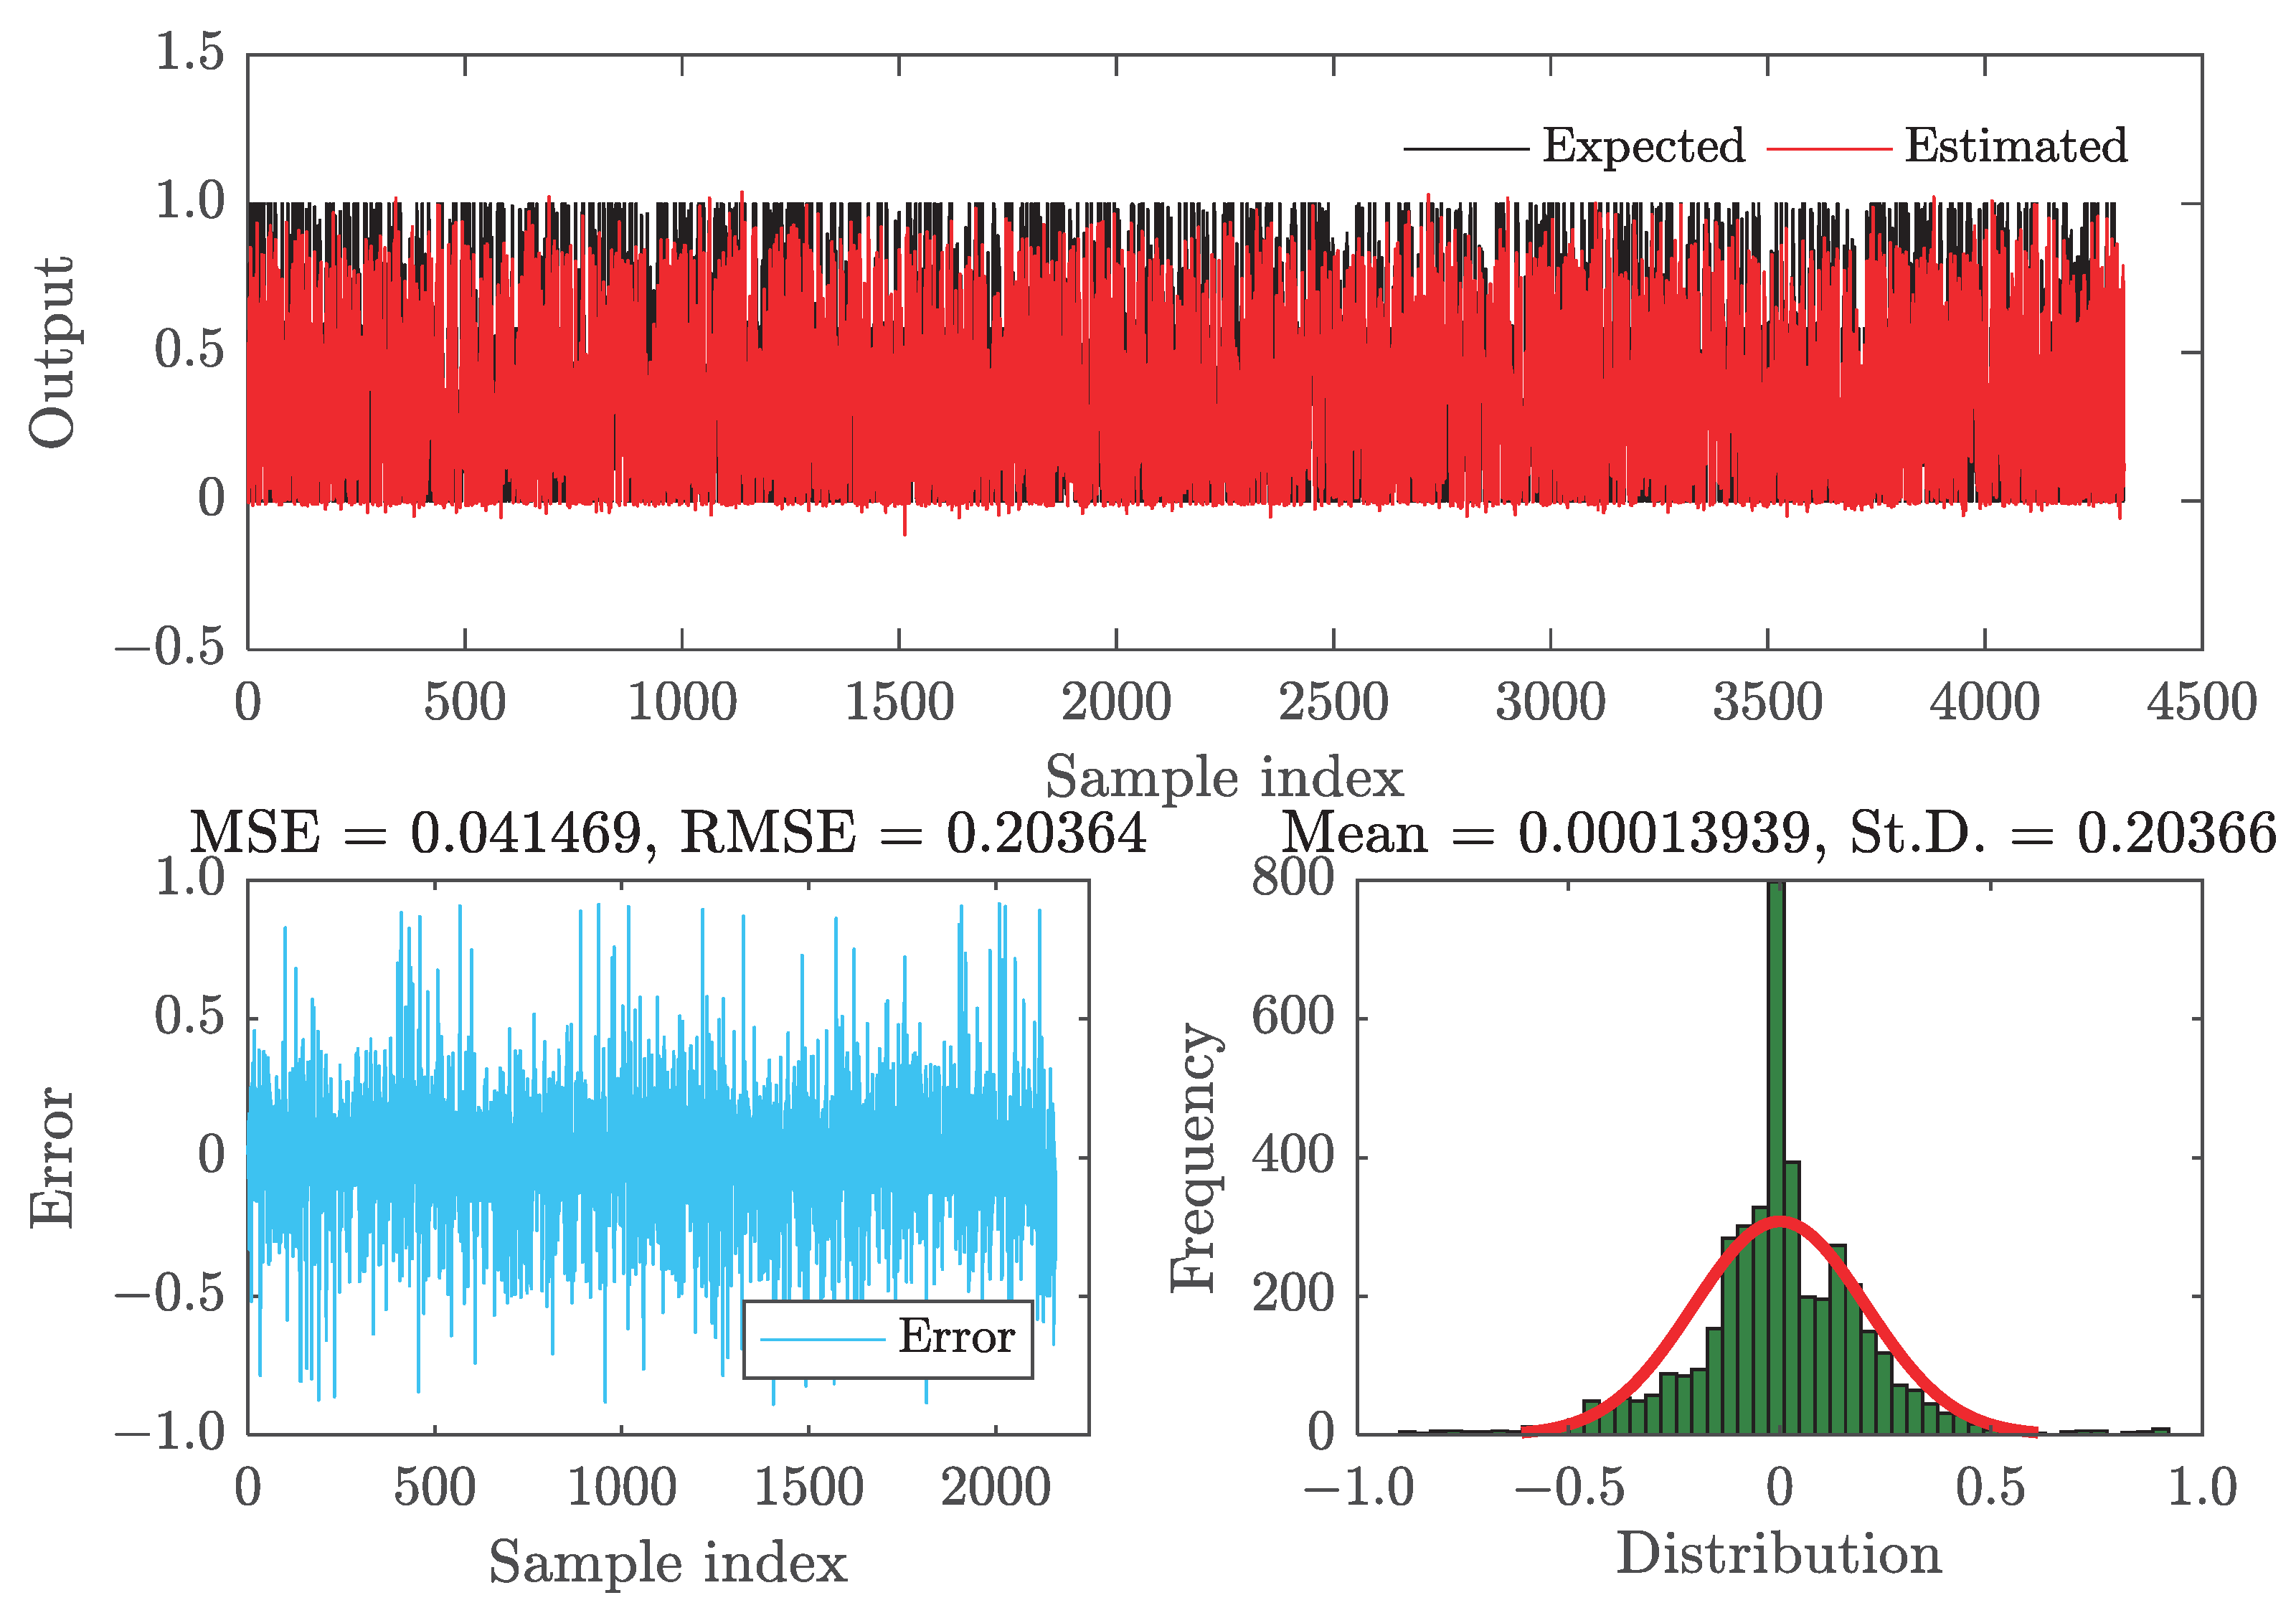
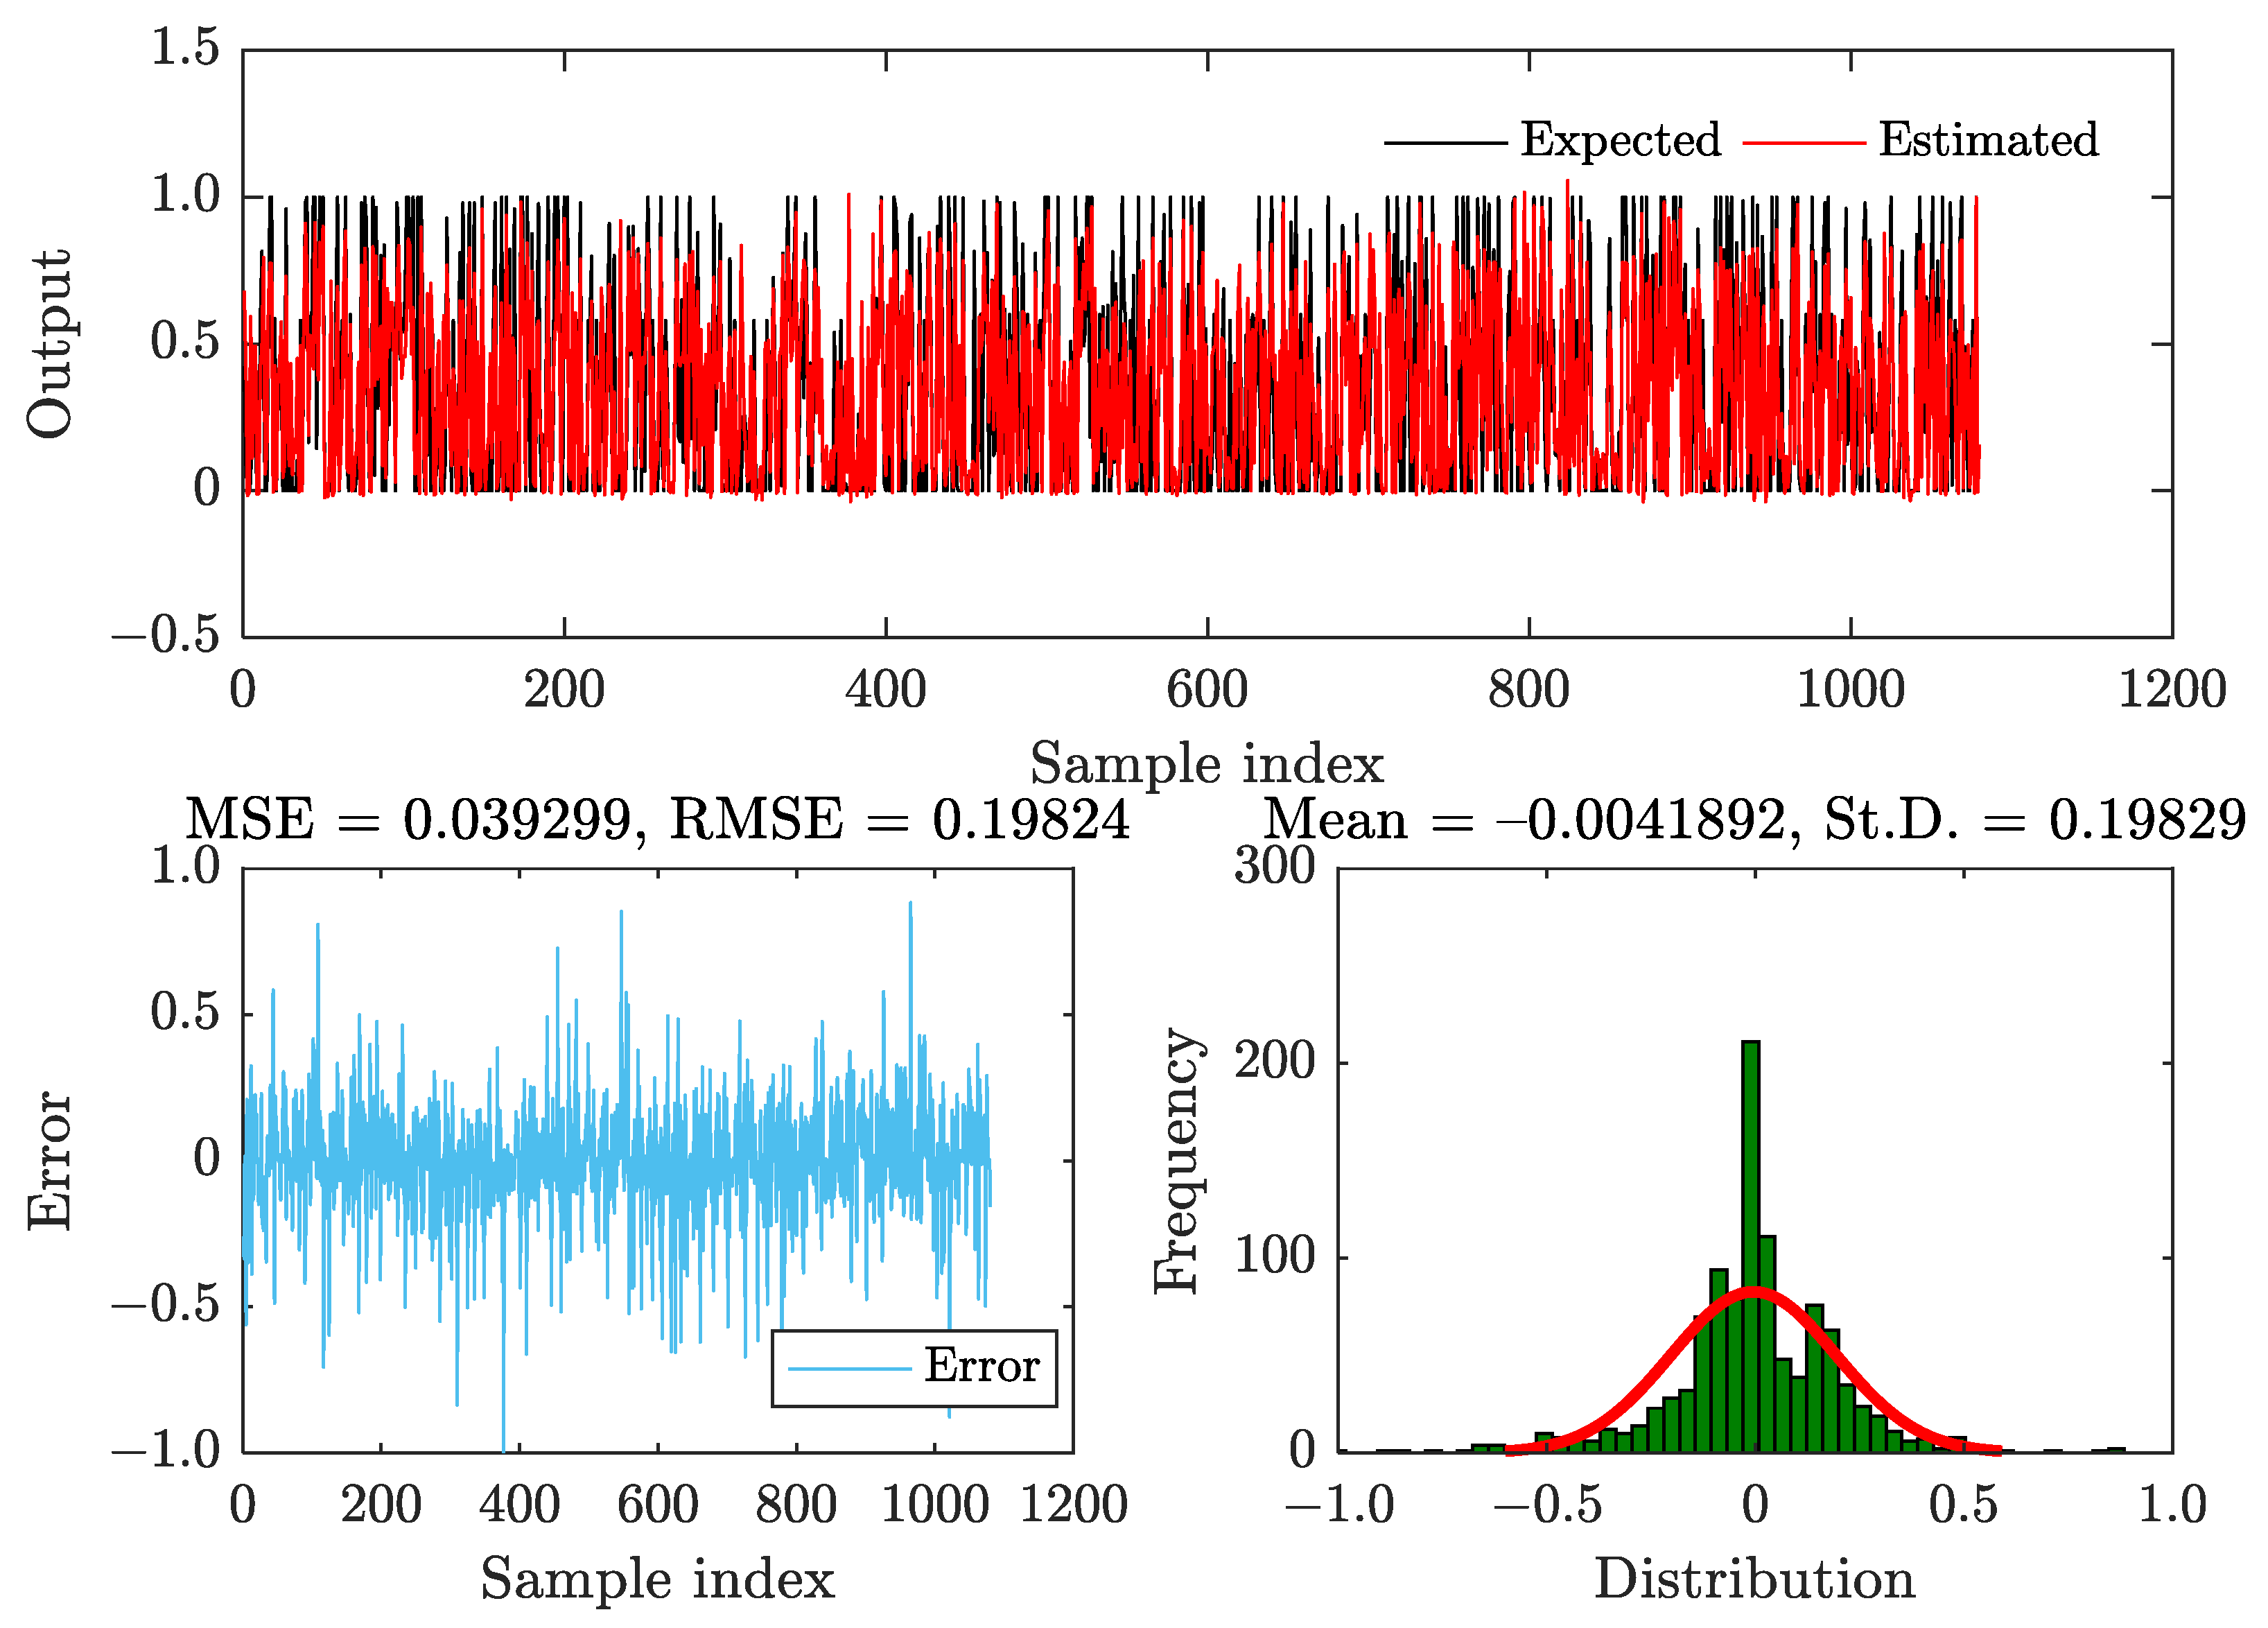
The training and testing results of the ANFIS model are presented in Figure 18 and Figure 19, respectively. These figures compare the expected and estimated values of the ANFIS model’s outputs, calculate their errors, and also analyze the distribution of these errors.
The results indicate that the PSO algorithm significantly enhances the performance of the ANFIS model, resulting in a strong agreement between the estimated and expected values. Compared to the training data, the MSE and RMSE values for the test data exhibited a further decrease, from 0.041469 and 0.20364 to 0.039299 and 0.19824, respectively. In addition, the distribution of errors in the test data exhibits a striking similarity to that of the training data, with a corresponding decrease in the standard deviation of error from 0.20366 to 0.19829. This will be a significant advantage in improving the adaptability of the ANFIS model in real-time applications.
When using the trained FIS for real-time energy management, it is important to take into account the durability of the FCS. As a result, the output power of the FCS is adjusted by adding an extra constraint. These constraints can be expressed as follows [48].
Δ P fc _ min Δ P fc Δ P fc _ max .
The symbol Δ P fc represents the rate of change in the output power of the FCS, where Δ P fc _ min and Δ P fc _ max denote its lower and upper limits, respectively. Consequently, the adjustment of P fc can be determined by the following equation.
P f c _ r = P f c + Δ P f c _ m i n if Δ P f c < Δ P f c _ m i n P f c _ r = P f c + Δ P f c _ m a x if Δ P f c > Δ P f c _ m a x P f c _ r = P f c other ,
where the FCS’s actual power, denoted as P fc _ r , typically varies within 10% of its maximum output power.

5. Validation and Discussion

5.1. CHTC-TT

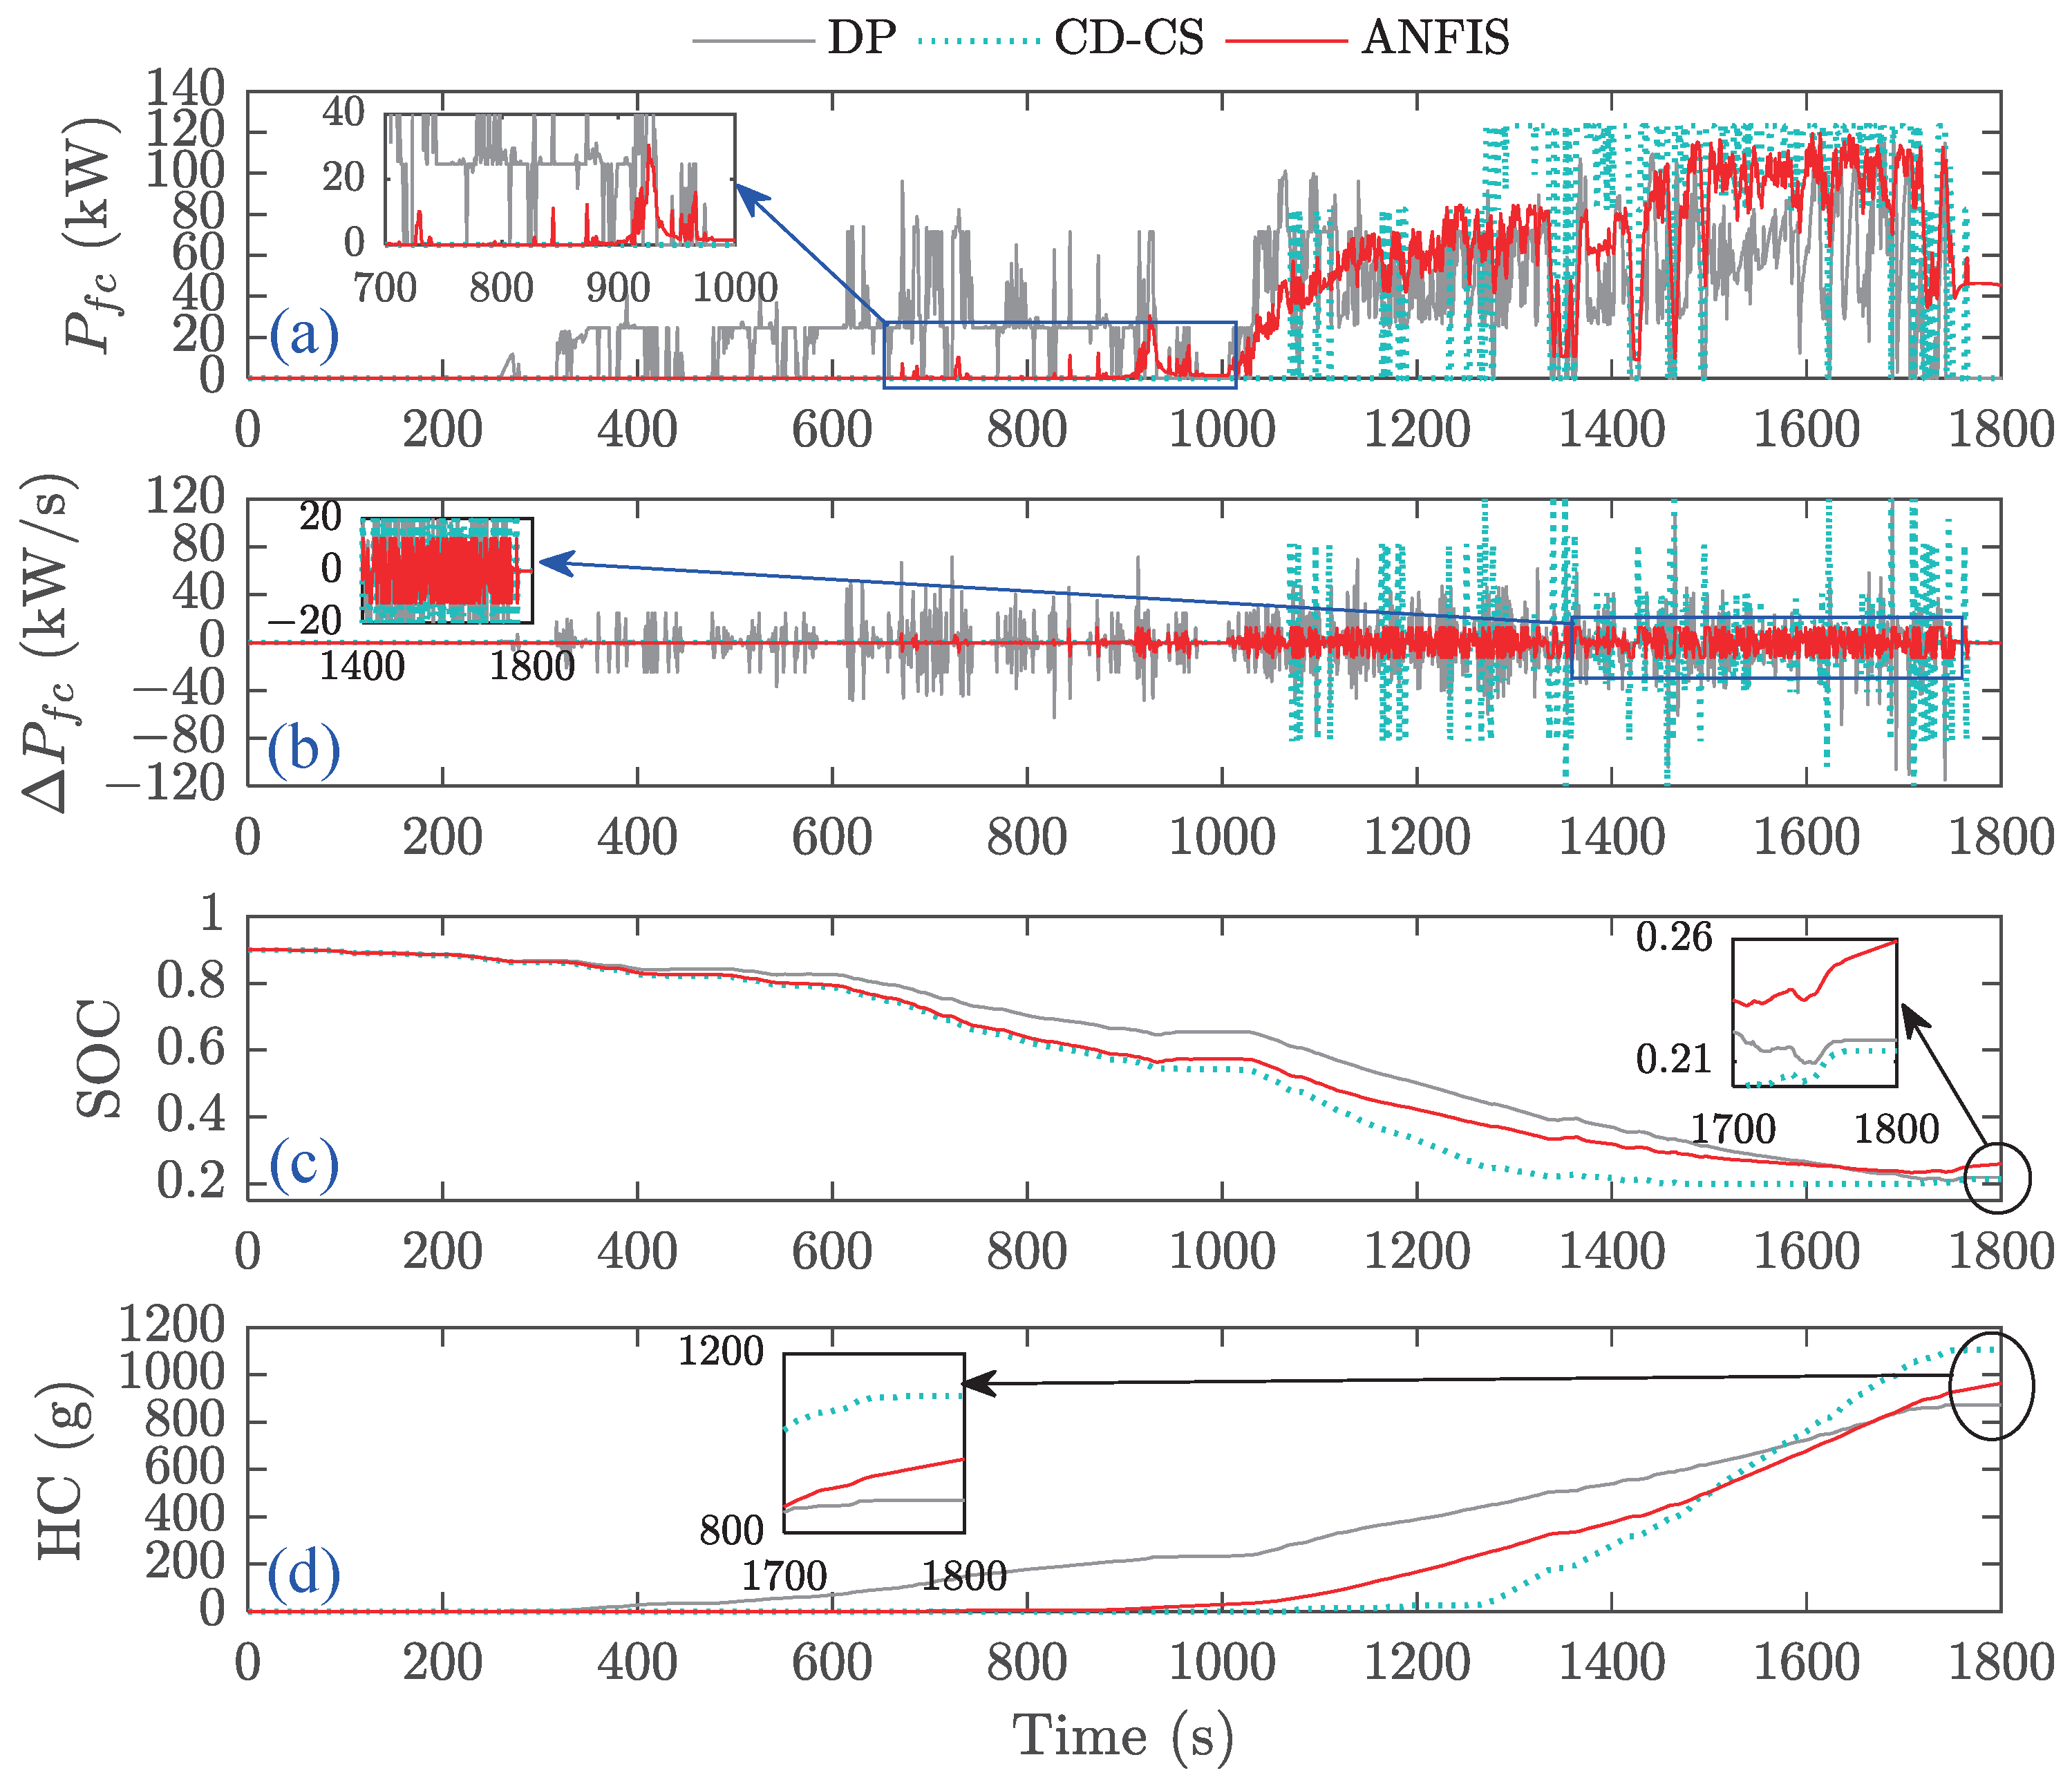
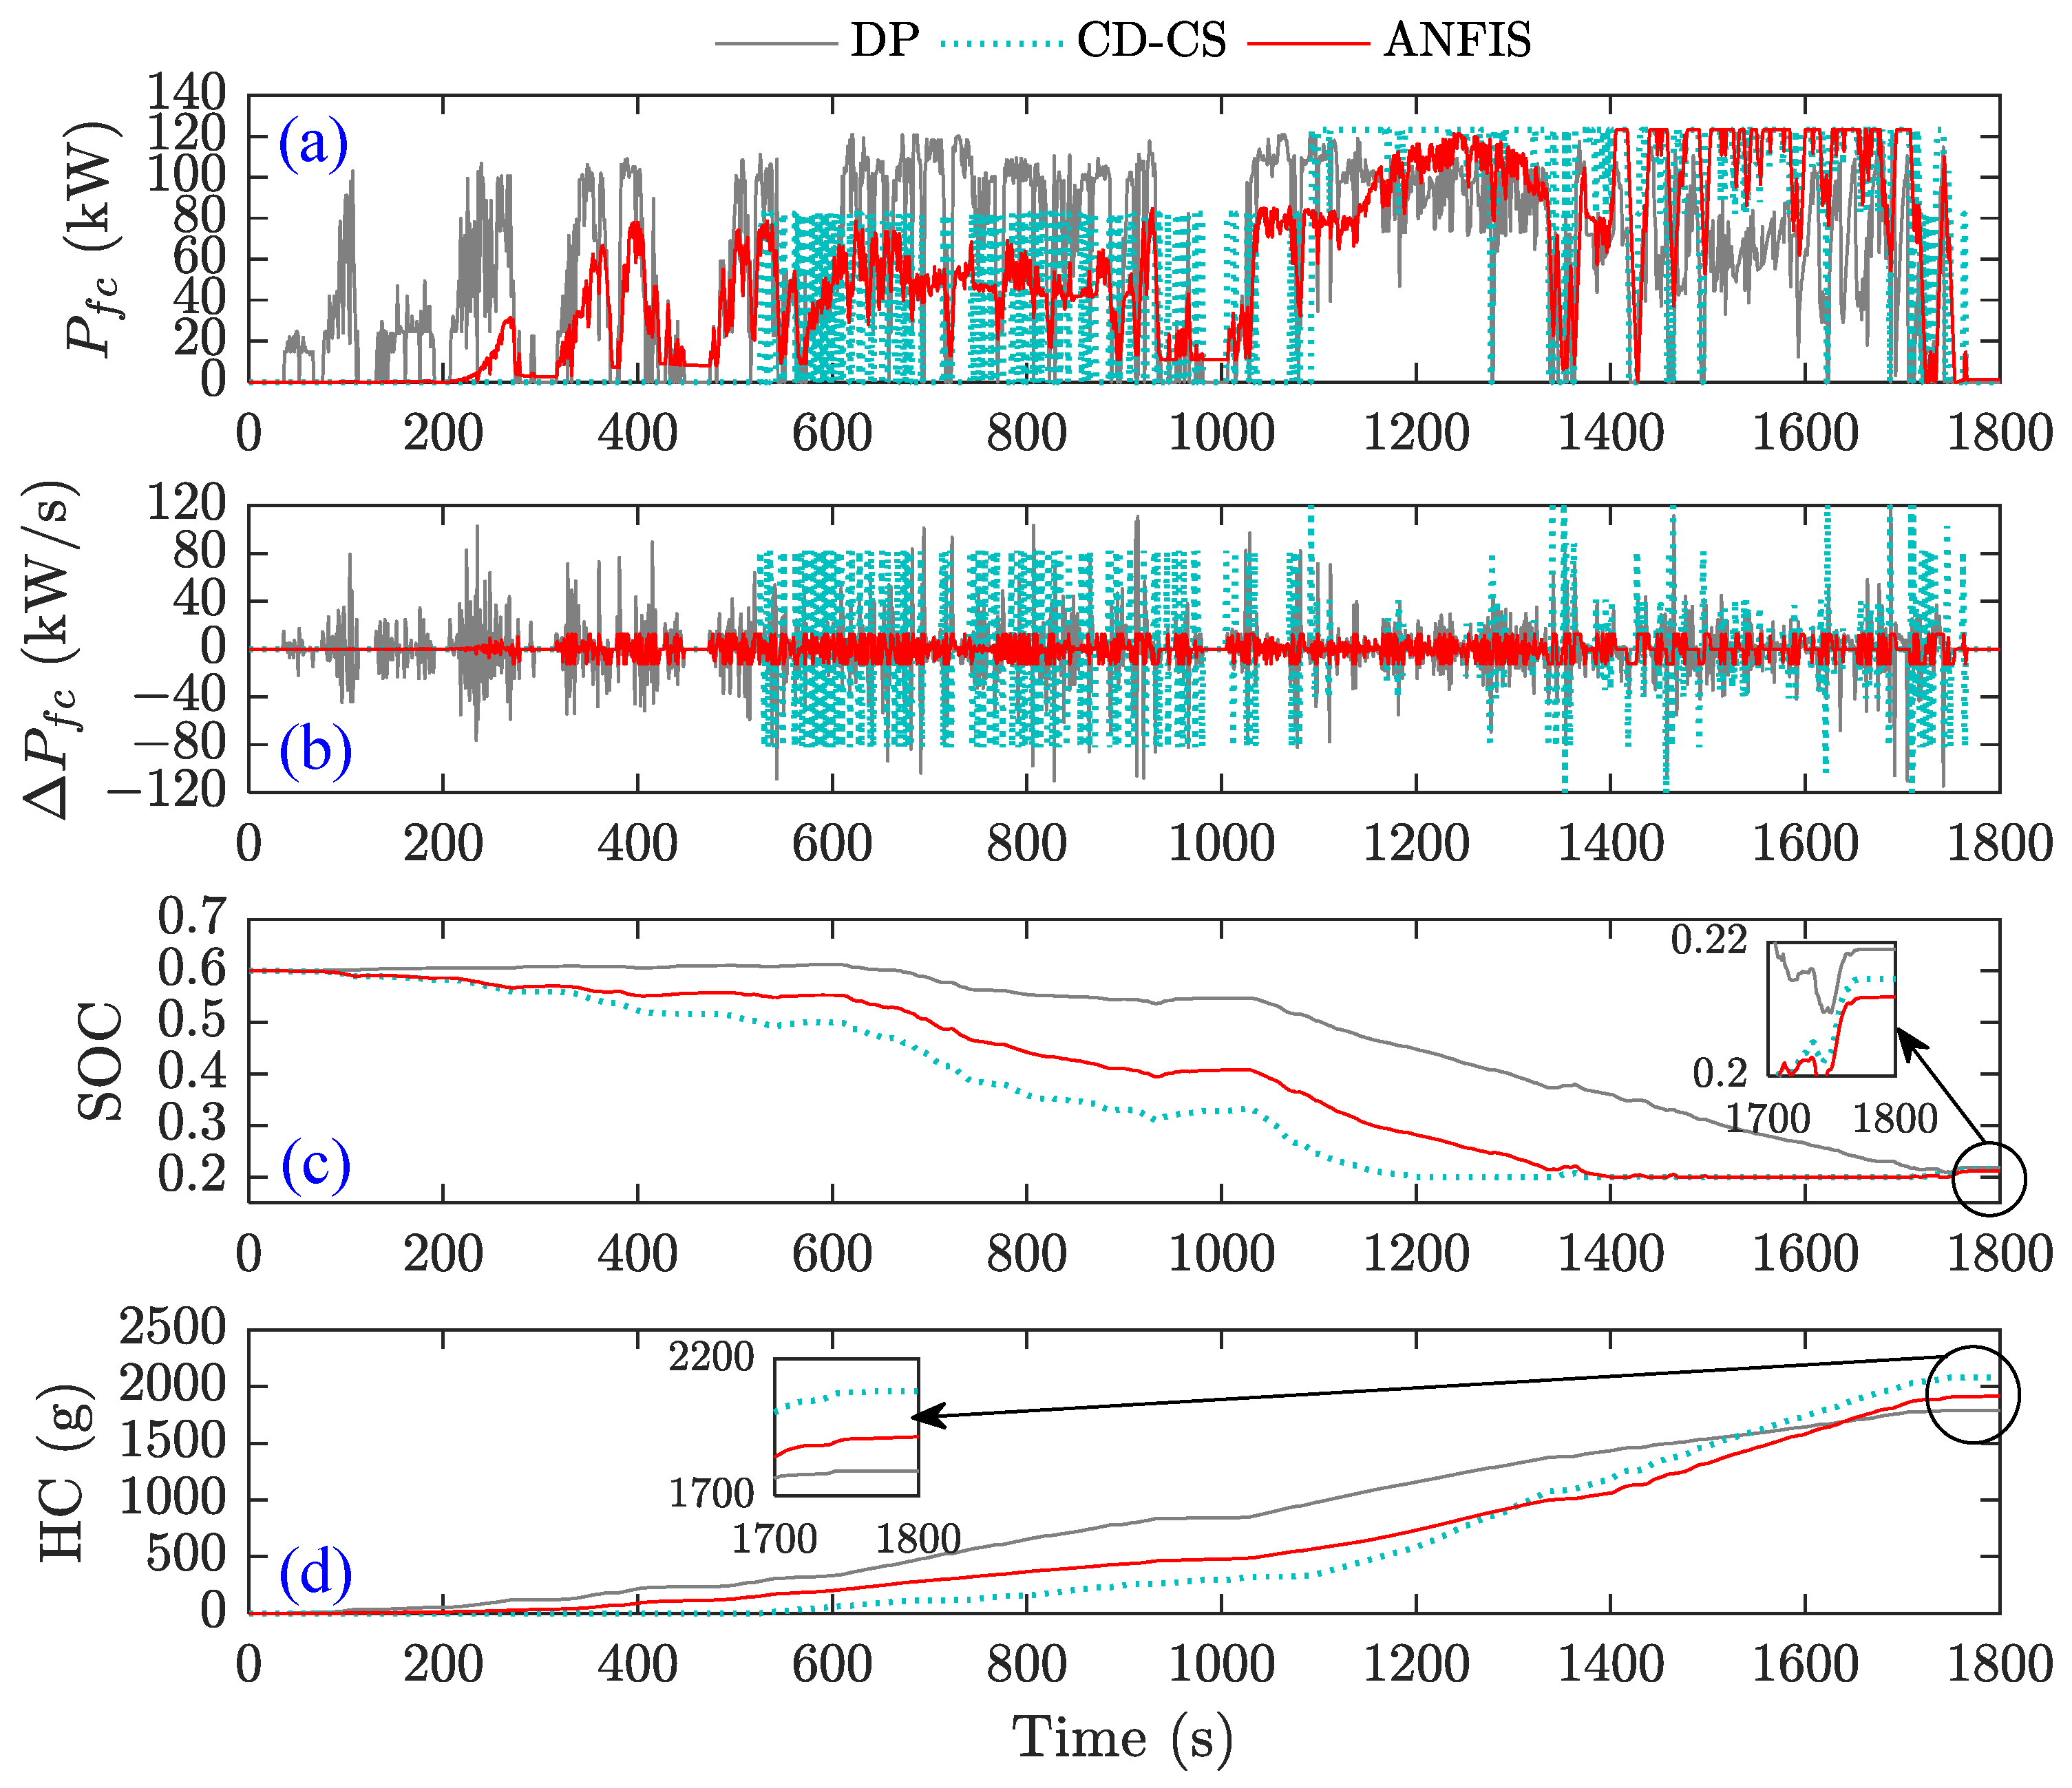
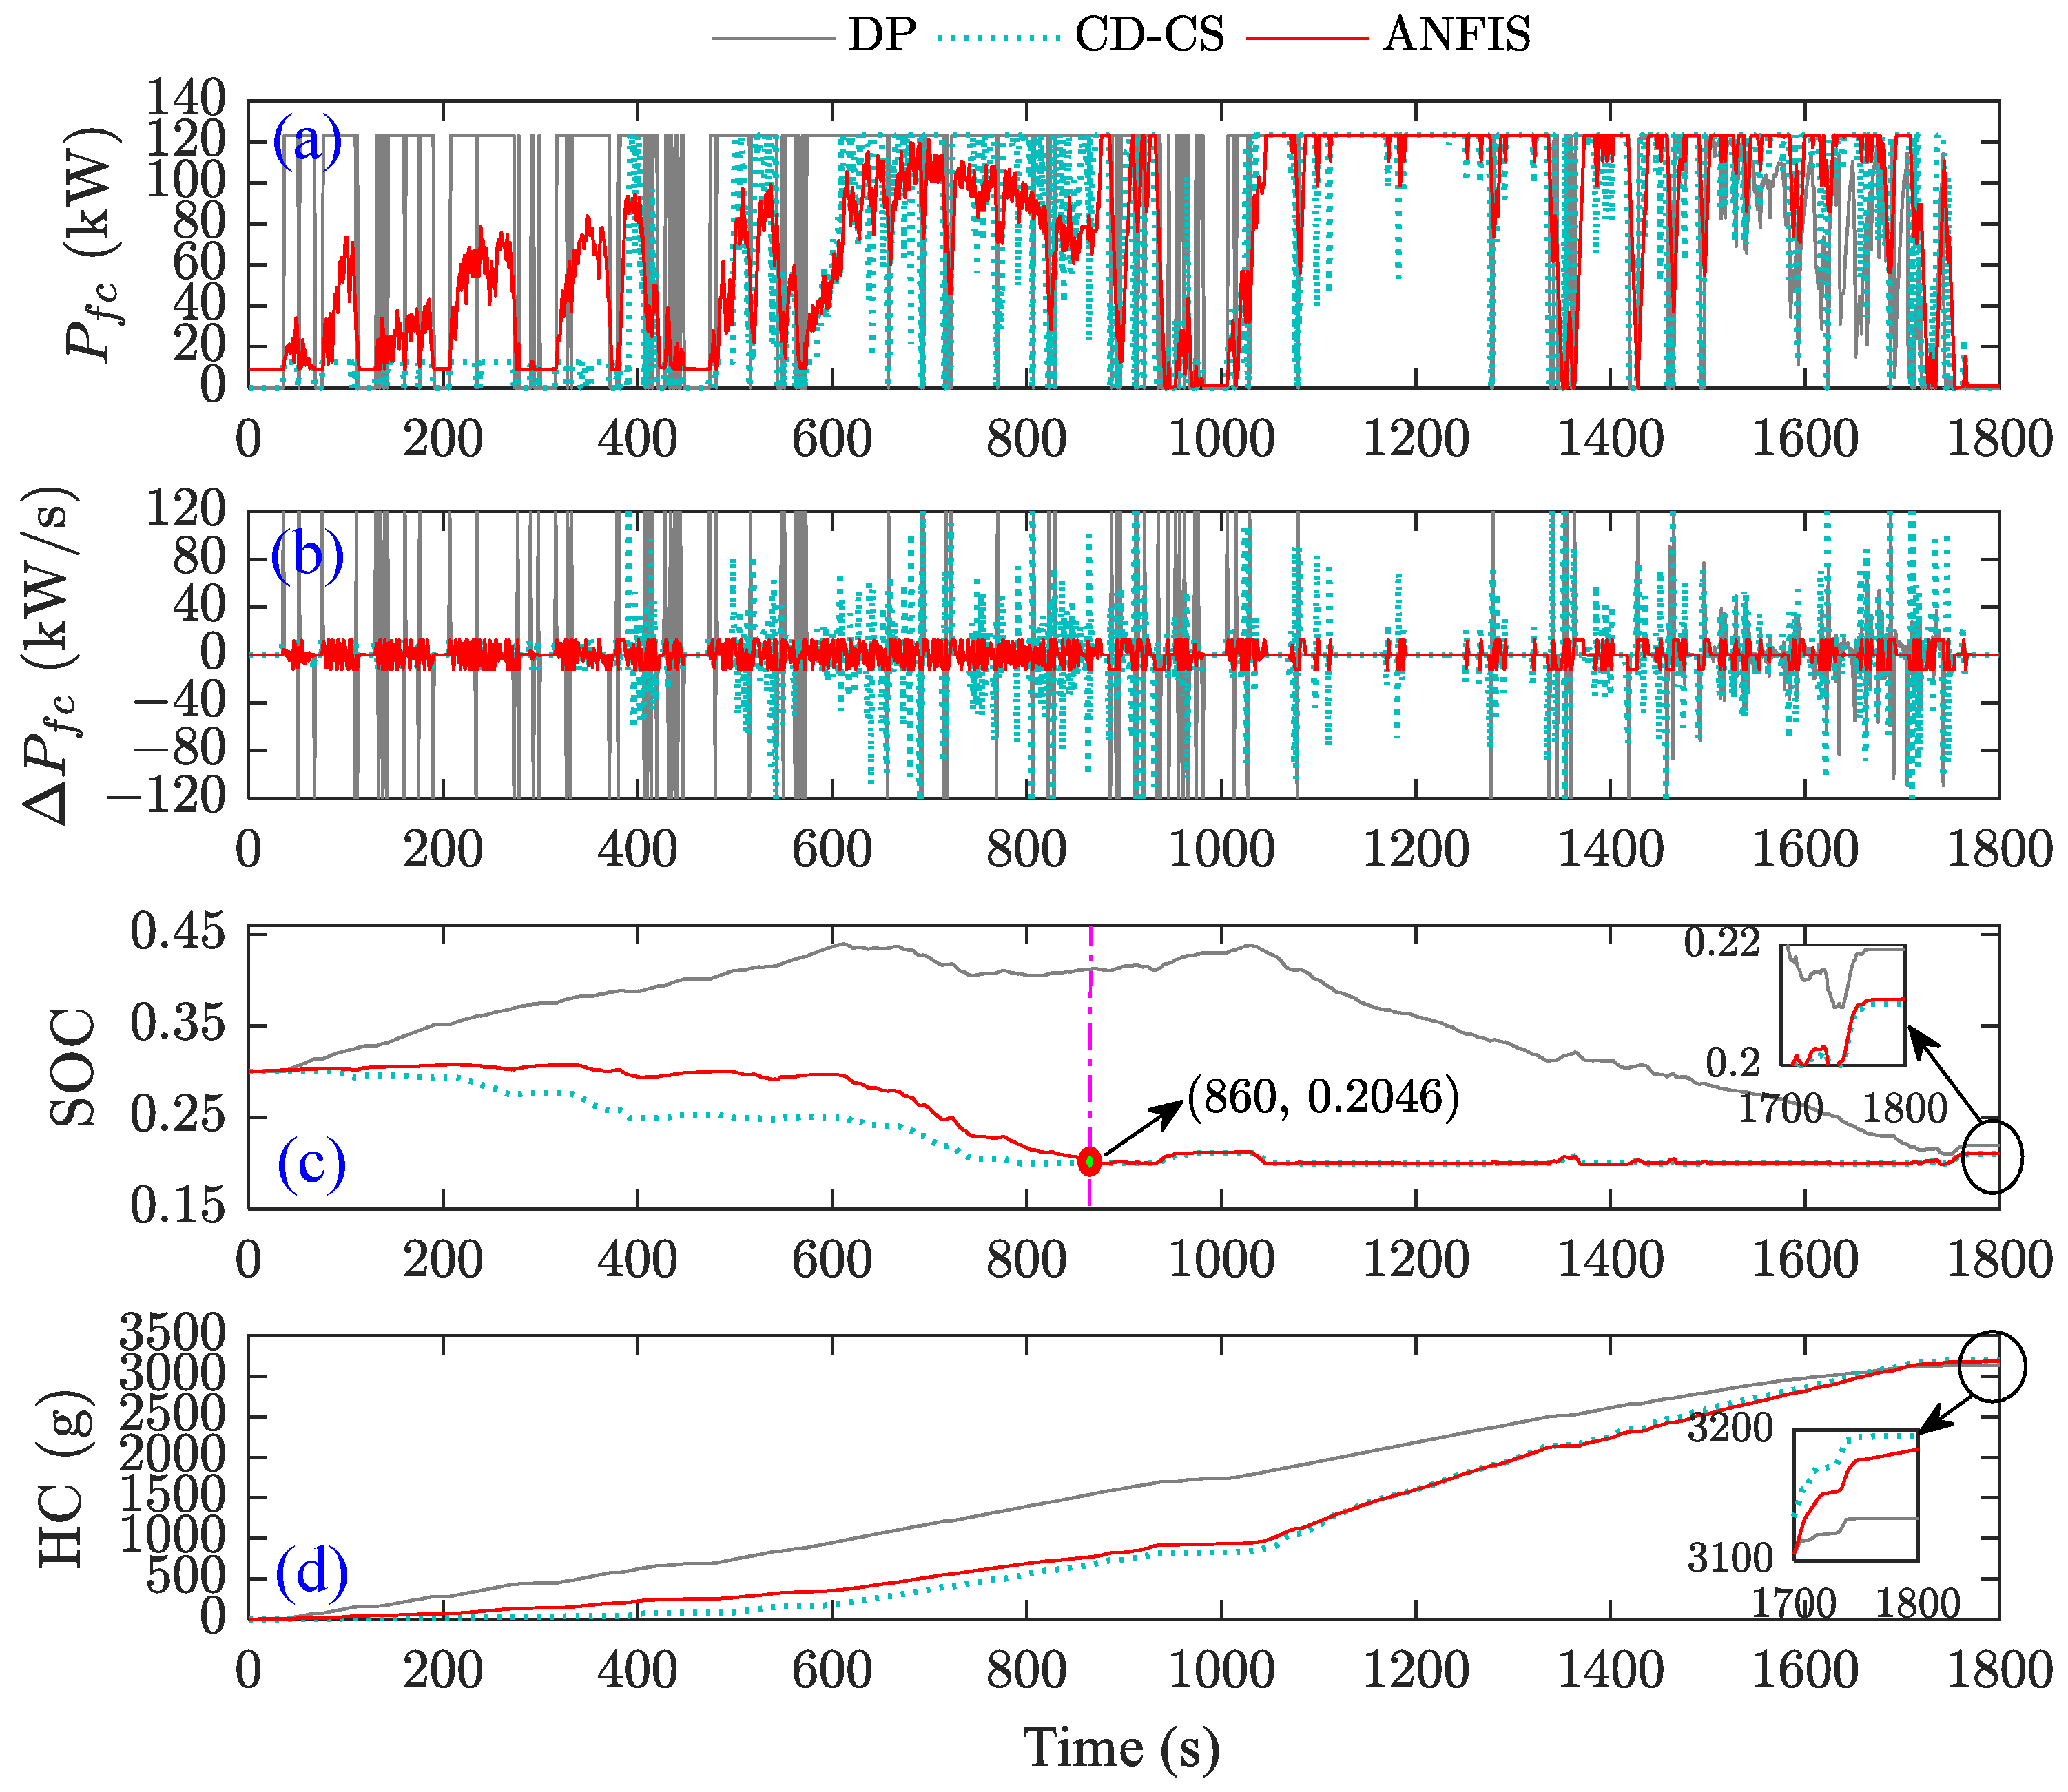
The well-trained FIS was first used for CHTC-TT to evaluate the performance of ANFIS-DP energy management. Furthermore, the DP and CD-CS strategies were utilized as benchmarks to comprehensively evaluate the energy-saving potential and effectiveness of the proposed ANFIS-based strategy in mitigating FCS degradation. To ensure a fair comparison of HC across the strategies, all three strategies aimed to completely deplete the battery energy by the end of the simulation, ideally achieving a battery SOC of 0.2. Additionally, to investigate the performance of the ANFIS-DP strategy at various SOC levels, this study analyzes its effectiveness under different initial SOC conditions. Figure 20, Figure 21 and Figure 22 illustrate the corresponding outcomes for initial battery SOC values of 0.9, 0.6, and 0.3. In the figures, (a), (b), (c), and (d) respectively represent the power of the FCS, the change rate of the FCS’s power, battery SOC, and HC. The DP algorithm is designed to achieve global optimization, resulting in the FCS having the earliest working time.
In contrast, the CD-CS strategy involves depleting the power battery energy before entering the FCS working mode, leading to a later working time. As for the ANFIS-DP strategy, its FCS working time primarily depends on factors such as the ANFIS model and training results, as well as battery SOC and power demand. Consequently, when the battery’s SOC reaches a certain threshold, it will be activated with a working time falling between the DP and CD-CS strategies (Figure 20a). The lifespan of fuel cells is significantly influenced by the rate of change in FCS output power. In this study, the ANFIS-DP strategy imposes restrictions on the power output of FCS, resulting in exceptional performance and maintaining a controlled rate of power change even at high power output levels. Conversely, DP and CD-CS have no limitations, leading to an unreasonable variation in their FCS’s output power (Figure 20b). All three strategies can achieve the intended terminal SOC when considering variations in battery SOC. However, slight deviations were observed between the strategy (see Figure 20c). As the battery SOC has reached its predetermined lower discharge limit, it can be considered effectively depleted. Therefore, only HC was considered when assessing the economic aspects of these three strategies. It is evident that DP is the optimal strategy, and ANFIS is suboptimal compared to CD-CS (see Figure 20d).
Figure 21 and Figure 22 show that reducing the battery’s initial SOC increases the FCS’s operating time across all three strategies. The start-up time of FCS is earlier than in the case where the initial battery SOC is 0.9, not only for the DP strategy but also for the ANFIS and CD-CS strategies. This phenomenon is particularly pronounced when the initial SOC of the battery is 0.3, as shown in Figure 21a and Figure 22a. On the other hand, decreasing the initial battery SOC also increases the power demand from the FCS. However, the power change rate of the FCS in the ANFIS-DP strategy remains acceptable.
In contrast, both DP and CD-CS exhibit an unsatisfactory power change rate (as shown in Figure 21b and Figure 22b). The battery’s SOC reflects its power consumption. When the initial SOC of the battery is 0.6, the SOC trajectories for all three strategies exhibit similarities to those shown for the battery with an initial SOC of 0.9. As shown in Figure 21c, the DP strategy involves early engagement of the FCS, resulting in a slower decline in battery SOC. Conversely, CD-CS entails engaging the FCS later, leading to a faster decline in battery SOC. However, the ANFIS-DP strategy involves earlier intervention by the FCS compared to CD-CS, resulting in a slower decline in battery SOC and offering more significant potential for operating within high-efficiency zones.
Notably, the SOC trajectories under the DP strategy exhibit an initial increase followed by a subsequent decrease when the battery’s initial SOC is 0.3 (see Figure 22c). This phenomenon arises because DP represents a globally optimal strategy, ensuring compliance with terminal constraints while achieving optimal performance within the broader context. As a result, the FCS charges the power battery first and then collaborates with the battery. In contrast, the ANFIS-DP and the CD-CS strategies maintained their previous changing characteristics. The CD-CS strategy declined rapidly, whereas the ANFIS-DP strategy declined slowly. However, due to the low initial battery SOC, the ANFIS and CD-CS strategies quickly reached the lower SOC limits, causing their SOC trajectories to always coincide after 860 s. Fortunately, regardless of whether the initial SOC is 0.6 or 0.3, the power battery’s energy is depleted by the end of the driving cycle. Therefore, evaluating the FCECV’s economy by HC is reasonable. The ANFIS-DP strategy exhibits a superior energy-saving effect when the initial SOC is 0.6, as depicted in Figure 21d. However, at an initial SOC of 0.3, its HC is comparable to CD-CS, as illustrated in Figure 22d, due to premature battery energy depletion. It is essential to note that the energy-saving effect of the DP strategy is less pronounced when the battery’s initial SOC is 0.3. This is due to insufficient initial energy in the power battery, limiting the energy conservation potential of the hybrid power system.
The efficiency distribution of FCS operating points under the three strategies is shown in Figure 23. When the initial SOC is 0.9, the DP strategy leads to an earlier transition of FCS into the operational state; however, its working efficiency is not satisfactory. This can be attributed to the fact that the DP strategy in this paper considers both optimal energy consumption of FCS and battery, which may result in specific operating points of FCS falling within non-efficient zones. Furthermore, since the ANFIS-DP strategy is based on DP results, low-efficiency FCS operating points may also exist, as shown in Figure 23a,b. Conversely, under the CD-CS strategy, FCS operates later with a shorter working time when the initial SOC is 0.9 or 0.6. Due to its regular nature, this strategy demonstrates a higher concentration of working efficiency. However, the working efficiencies of both cases are below 50%, leading to an increase in HC.
Remarkably, the FCS intervention of all three strategies occurred earlier in Figure 23c due to depleted battery energy levels. However, the DP strategy exhibits a higher frequency of FCS operation within low-efficiency zones, particularly before the 1200 s. In contrast, the ANFIS-DP strategy demonstrated superior FCS efficiency during this period. Nevertheless, the DP algorithm ensures global optimization, thereby enhancing the efficiency of its FCS beyond the 1500 s and thus guaranteeing its energy-saving advantage.
Table 4 below shows the change rate of the FCS power under three strategies, displaying the maximum, minimum, and standard deviation of the change rate. The power change rate for FCS is notably high under the DP and CD-CS strategies, exceeding the safe range for FCS power variation. Additionally, the standard deviation suggests that these two strategies lead to less stable and more volatile power fluctuations, presenting substantial challenges to the service life of FCS. In contrast, the ANFIS-DP strategy effectively regulates the power change rate of the FCS within a reasonable range of [ 12.3 , 12.3] kW, thus better meeting the power variation limit requirements of the FCS. Notably, the battery’s initial SOC does not affect this characteristic. Despite a higher standard deviation of the power change rate at initial SOC levels of 0.6 and 0.3, the stable power change rate remains consistent. This is expected to benefit the durability of the fuel cell significantly.
Table 5 exhibits the energy consumption for three different strategies. The results indicate that the DP strategy achieves a terminal SOC of 0.219 for various initial SOC levels within the specified range of [ 0.2 , 0.25 ] . The CD-CS strategy yields a terminal SOC below 0.22 for various initial SOC values, thereby ensuring more comprehensive battery energy utilization. When the battery’s initial SOC is set at 0.9, the terminal SOC for the ANFIS-DP strategy reaches 0.259, which is slightly higher than those obtained with initial SOCs of 0.6 and 0.3, effectively meeting the battery power depletion requirements. Regarding HC, the DP strategy emerges as the globally optimal approach across various initial SOC scenarios. However, it is worth noting that the ANFIS-based strategy also exhibits energy conservation advantages compared to the CD-CS, reducing HC by 13.20%, 7.97%, and 0.31% under different initial SOC conditions. While ANFIS falls short of matching the energy efficiency improvements achieved by the DP strategy, it can still be effectively employed for real-time applications when operating conditions are unknown. Although both DP and ANFIS enhance the energy efficiency of FCECVs, their advantage becomes less significant when the battery’s initial SOC is low. However, when the battery is fully charged, the ANFIS-based strategy can lead to substantial energy savings in real-time implementation.
Table 6 presents the operating characteristics of FCS to facilitate a comprehensive analysis of the energy-saving mechanism of the ANFIS-DP strategy. The peak operating power, average power, operating frequency (i.e., percentage of the working points for the entire driving cycle), and distribution of working point efficiency for the three strategies under different initial SOC scenarios are statistically analyzed. It is essential to note that the distribution of working point efficiency excludes cases where the FCS’s output power is zero, resulting from the varying operating frequency of the FCS associated with different strategies. Based on the findings, when the battery’s SOC is at 0.9, the DP and ANFIS strategies do not need to achieve the FCS’s peak power. As the initial SOC decreases, the maximum power of the ANFIS-DP strategy reaches its peak power at SOC levels of 0.6 and 0.3, whereas the DP strategy only achieves peak power at the 0.3 SOC level. Regarding mean power, the ANFIS-DP strategy performs similarly to the DP strategy, except for a higher mean power at an initial SOC of 0.3.
Additionally, it has been observed that the CD-CS strategy consistently achieves peak power and exhibits a similar trend in mean power variation compared to the DP and ANFIS-DP strategies. Moreover, the CD-CS strategy consistently shows lower mean power than the other two. This can be attributed to the fact that the FCS operating frequency of the CD-CS strategy is consistently lower than that of the other strategies. In contrast, the ANFIS-DP strategy generally operates at higher frequencies of FCS than the DP strategy, except when the SOC is 0.9. In other words, when the SOC is low, the ANFIS-DP strategy will prolong the FCS’s operating time. Despite this, it is more efficient than the CD-CS strategy across different initial SOC scenarios. In addition, when the battery’s initial SOC is 0.9 or 0.6, the proportion of operating point efficiencies exceeding 45% is lower than that of the DP strategy. However, the FCS of the DP strategy experiences a dramatic decrease in operating point efficiency when the initial SOC is 0.3, resulting in poor energy-saving performance. Similarly, although the ANFIS-DP strategy has better operating point efficiency than DP, its energy-saving effectiveness still requires improvement due to increased operational frequency.
The findings suggest that when the battery is fully charged (i.e., the initial SOC = 0.9 ), the ANFIS-DP strategy is comparable to DP in terms of maximum operating power and average power, with a lower operating frequency of FCS than DP. However, it slightly lags behind DP in terms of operating point efficiency. Therefore, the energy-saving effect is marginally inferior to DP. Furthermore, the ANFIS-DP strategy exhibits a slightly higher operating frequency compared to DP when the initial SOC of the battery is 0.6 . However, a noticeable disparity exists in operating point efficiency, particularly for η fc 45 % , indicating that its energy-saving effectiveness still falls short of DP. Nevertheless, the ANFIS-DP strategy remarkably surpasses the existing strategies for CD-CS real-time applications in terms of energy conservation and enhancement of FCS durability.
5.2. Stochastic Driving Cycles

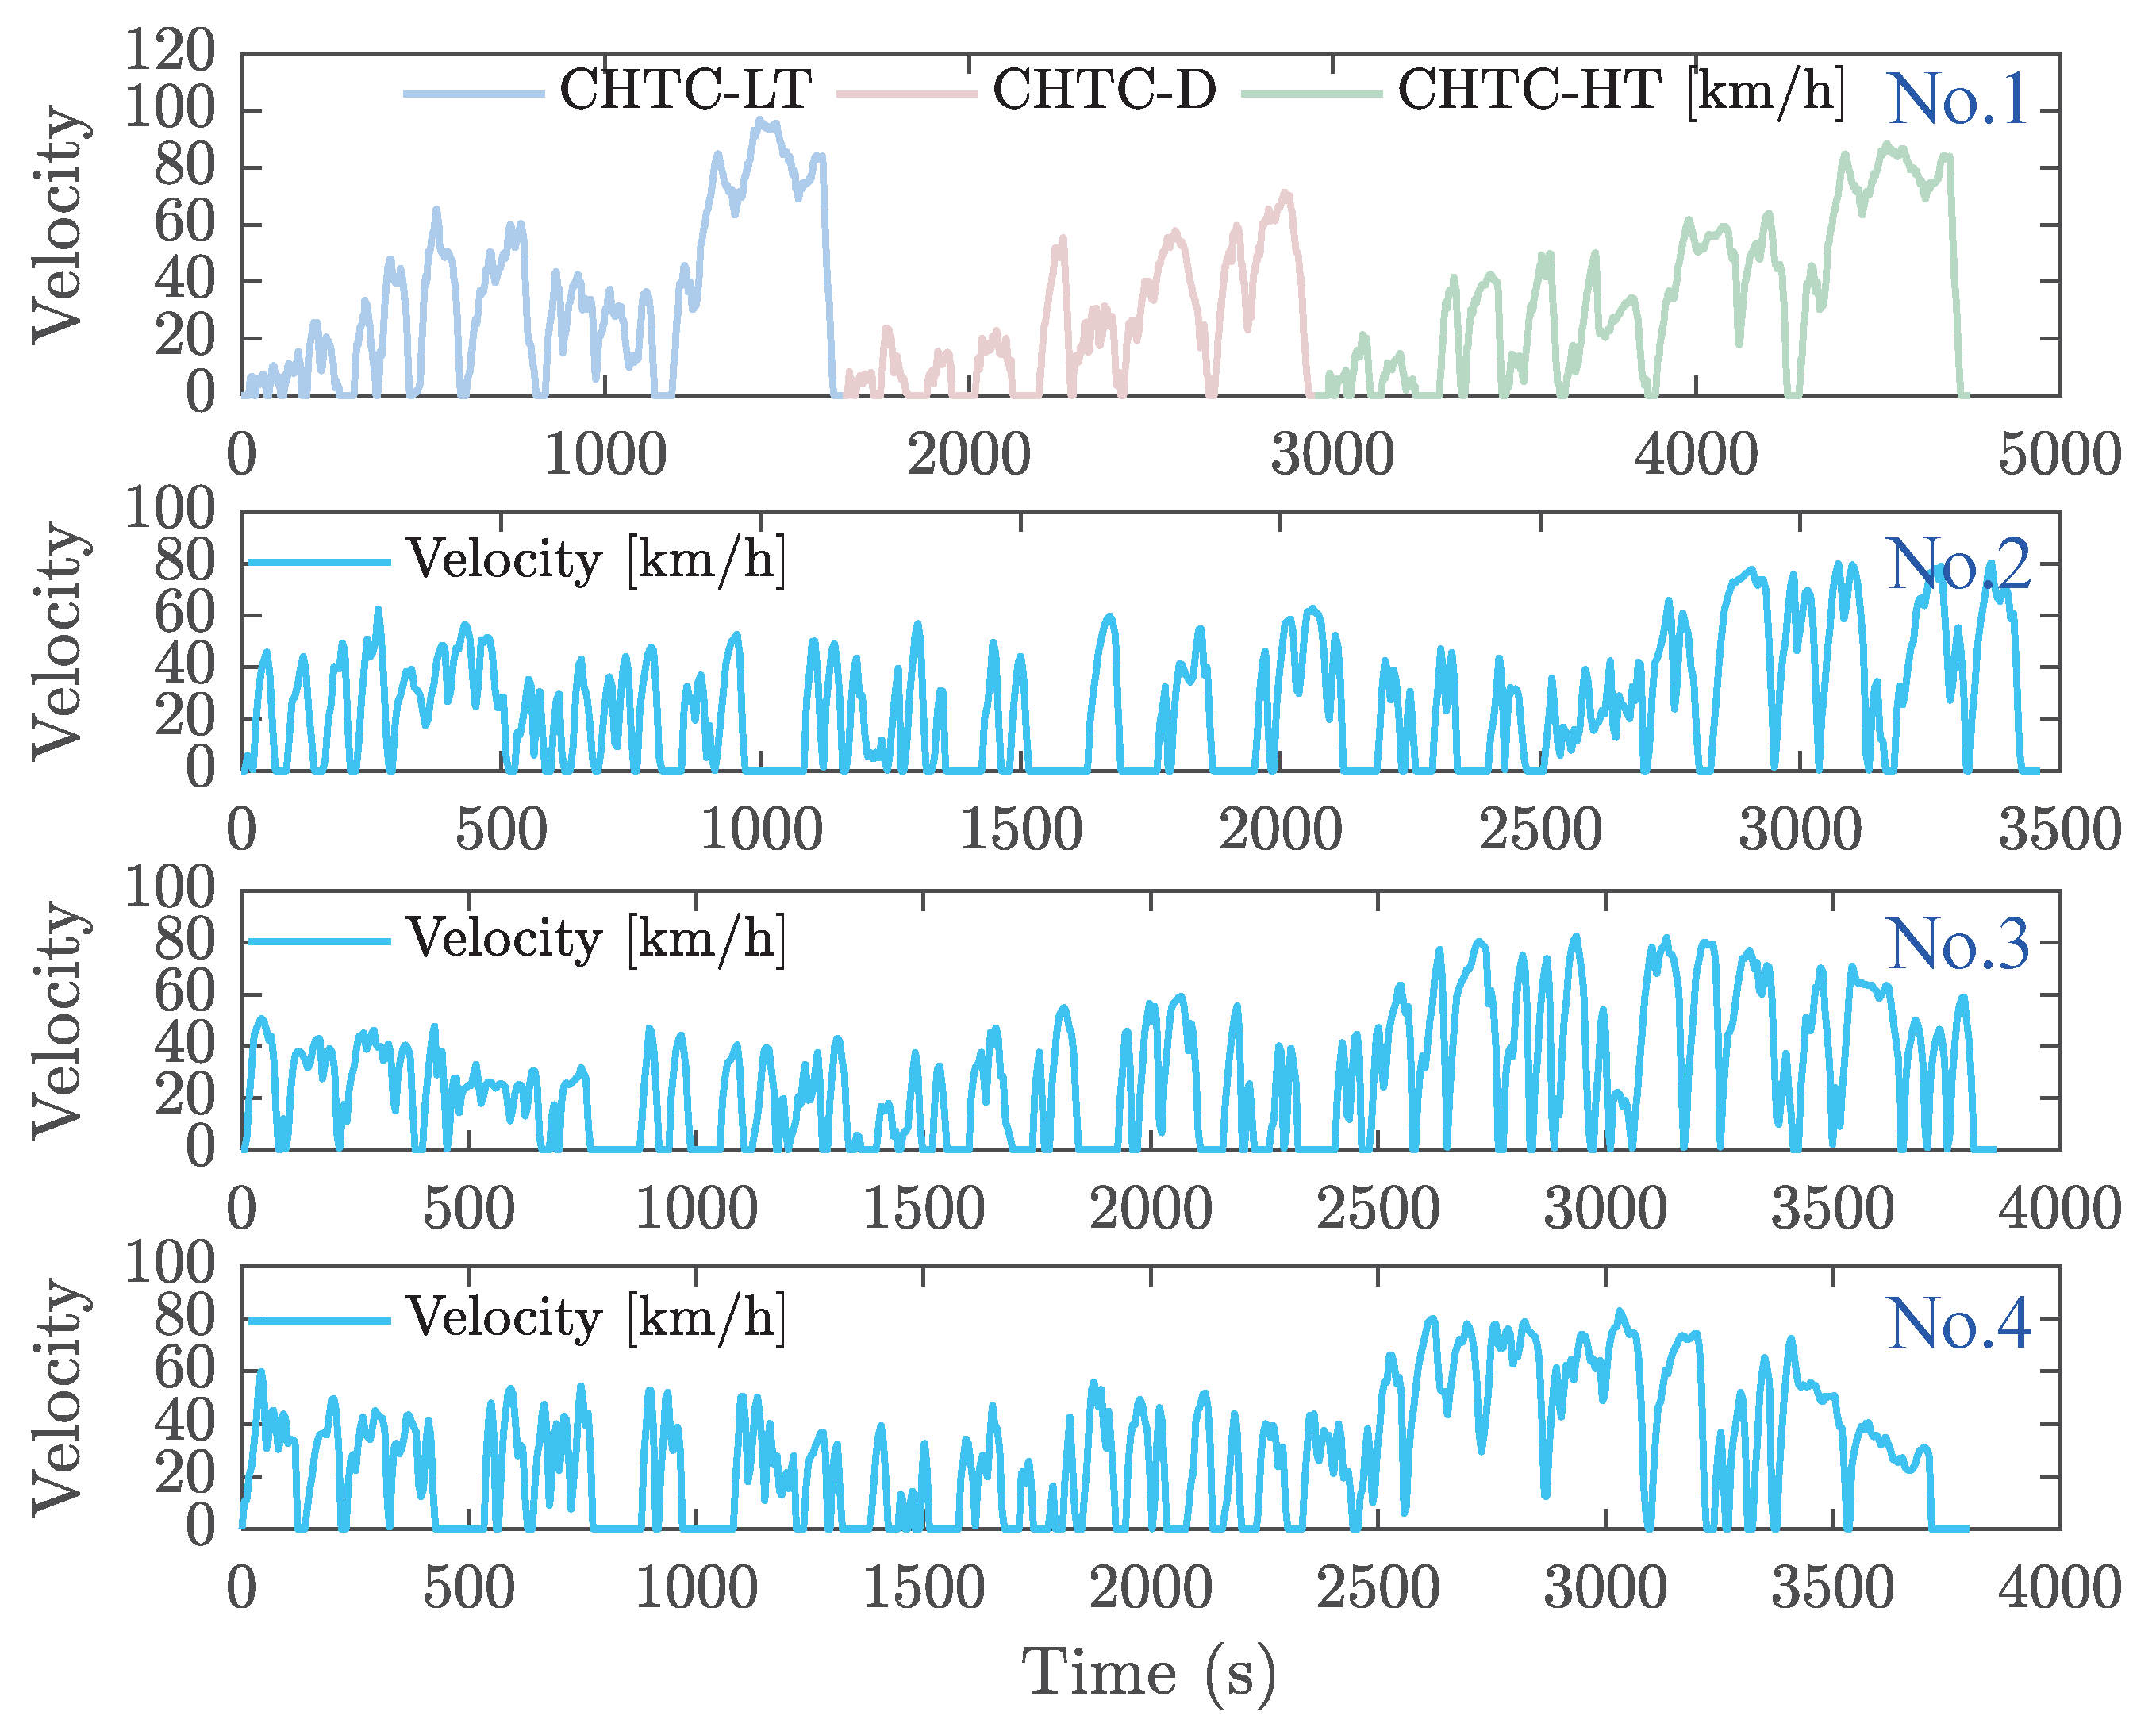
The performance of the ANFIS-DP strategy was further assessed using an additional set of four stochastic driving cycles (from No.1 to No.4), as shown in Figure 24. Cycle No.1 includes three typical driving cycles: the China heavy-duty commercial vehicle test cycle for light-truck (CHTC-LT), the China heavy-duty commercial vehicle test cycle for dump truck (CHTC-D), and the China heavy-duty commercial vehicle test cycle for heavy-truck (CHTC-HT). Cycles No.2 to No.4 were obtained from real-world driving scenarios. Two important considerations are: (1) The ANFIS-DP strategy’s energy-saving capability is limited when the battery’s SOC is low. Hence, we only consider an initial SOC of 0.9 for verification based on stochastic driving cycles. (2) To ensure comparability in energy consumption, all verification driving cycles should guarantee complete depletion of battery power, meaning that the terminal SOC reaches its lower limit at the end of the verification process.

5.2.1. FCS’s Power

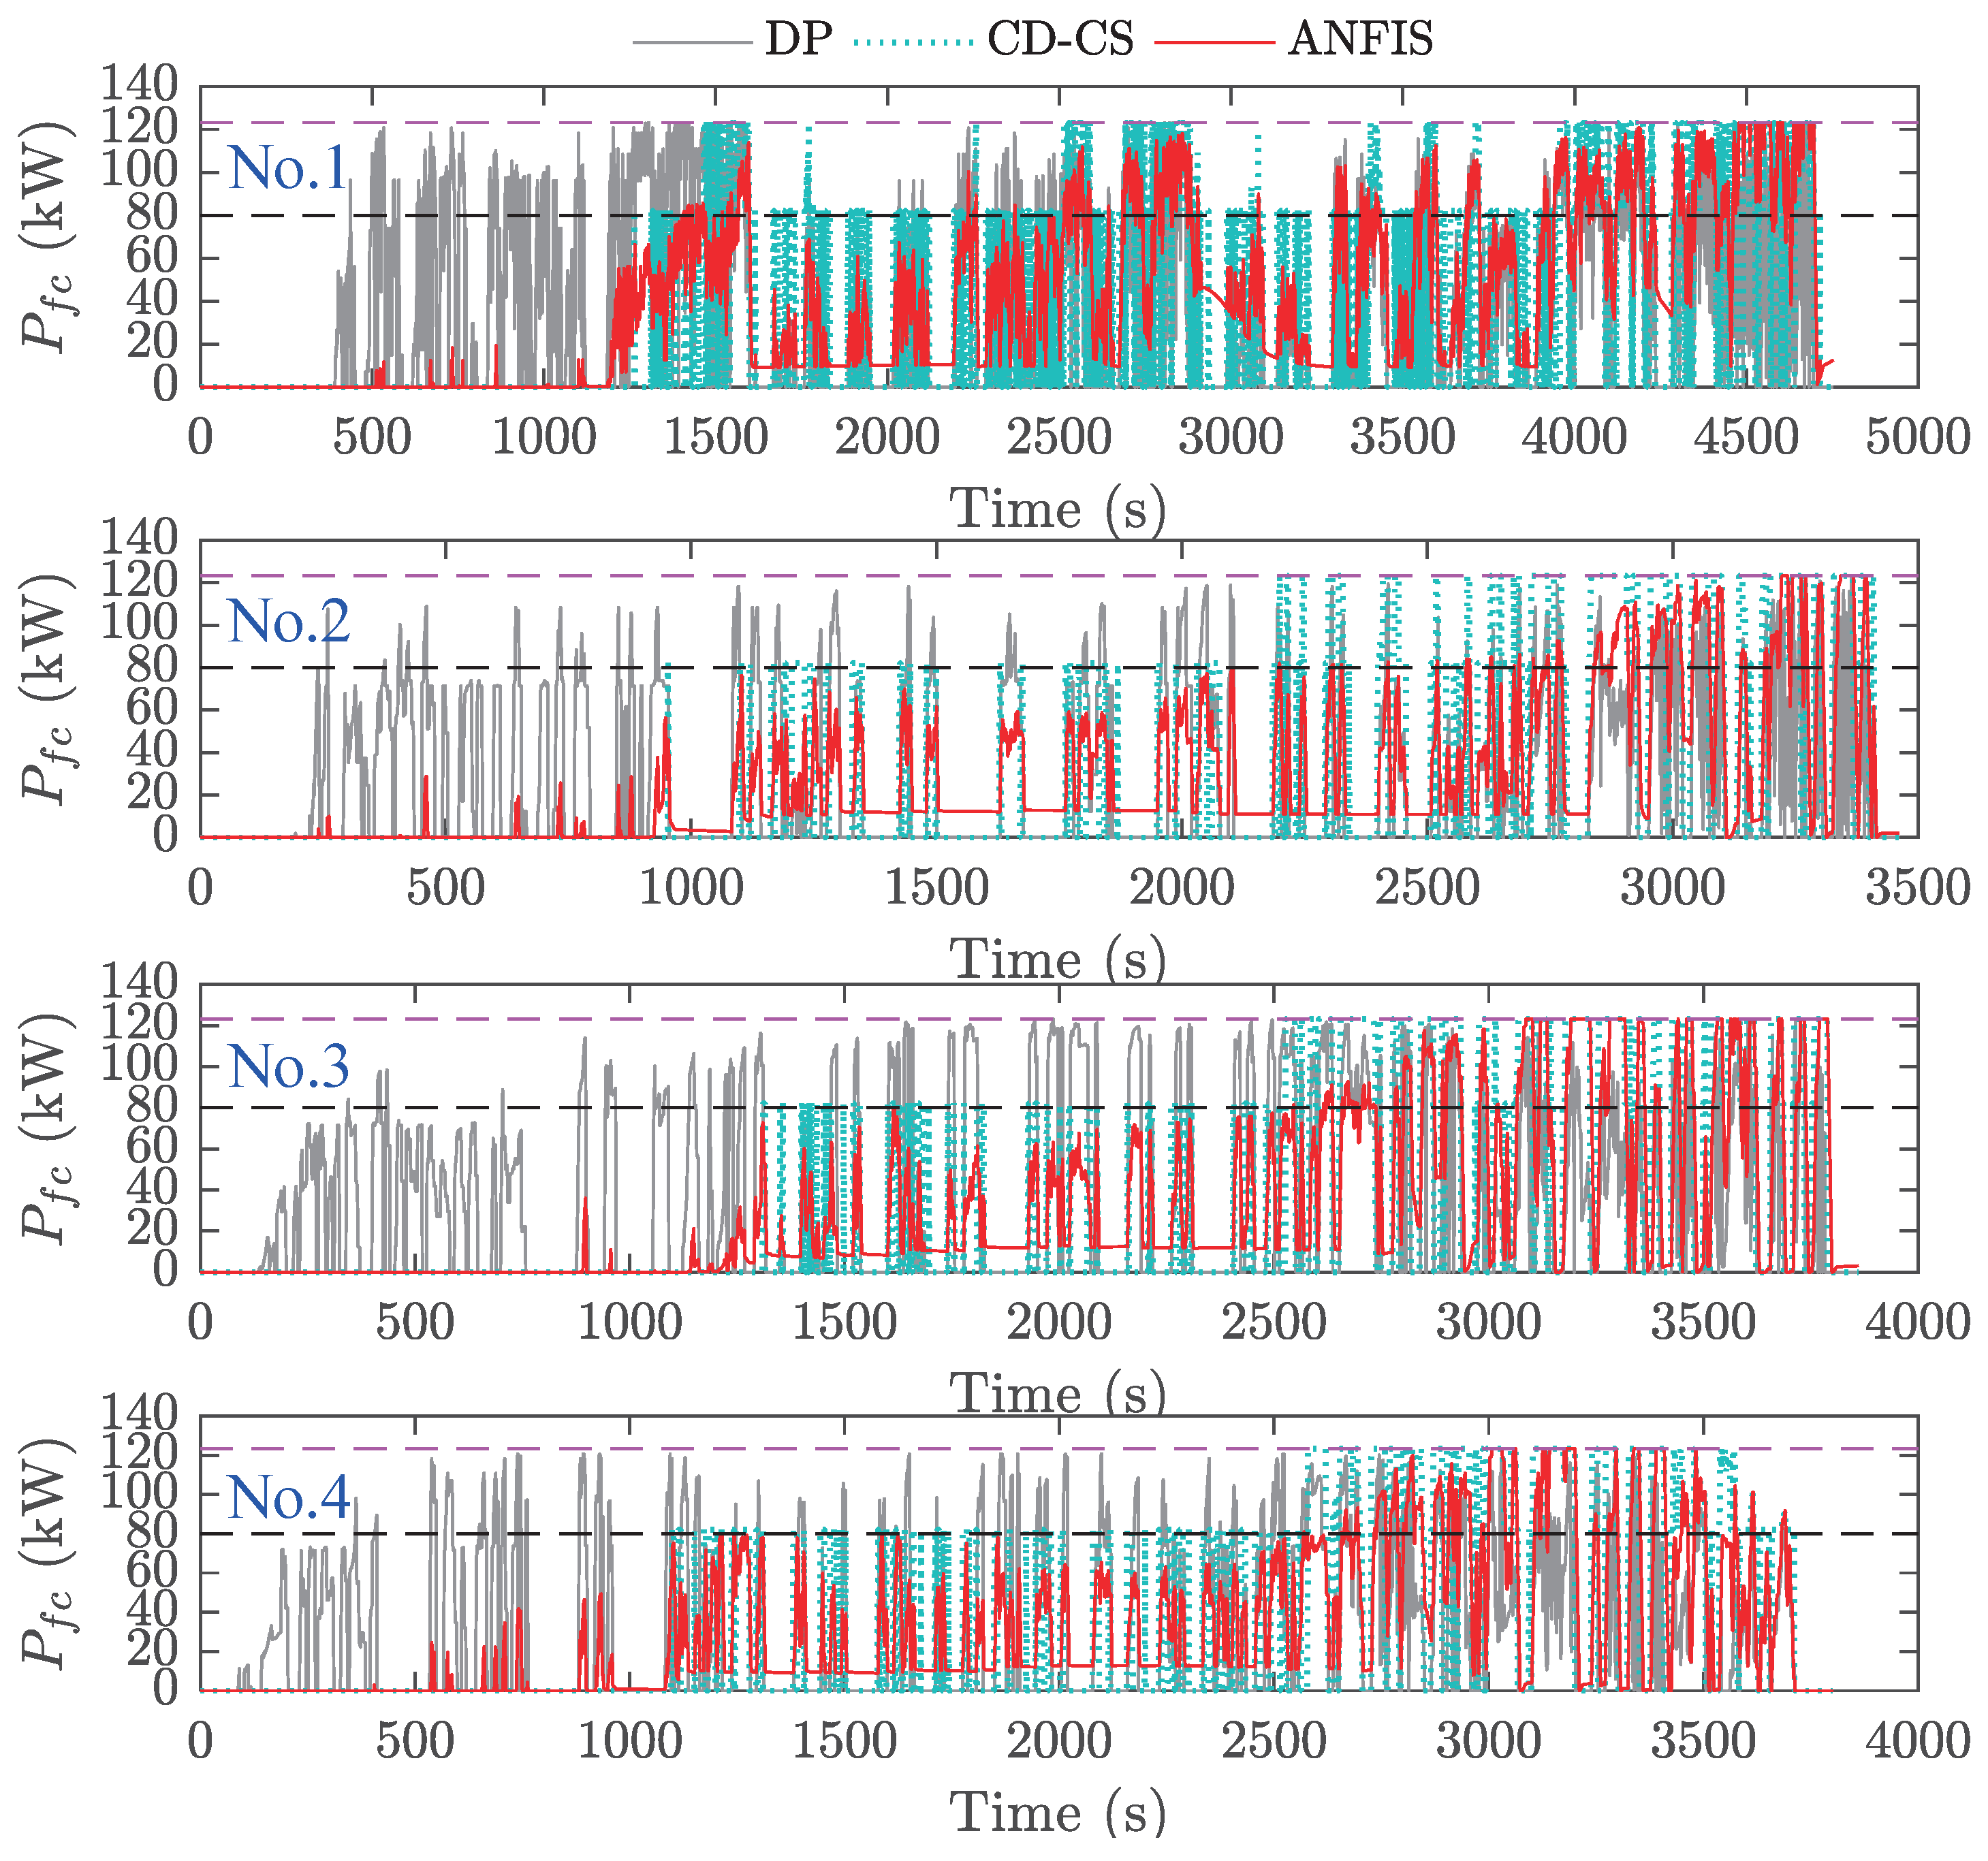
The FCS power of the three strategies across four driving cycles is illustrated in Figure 25. The results indicate that the DP strategy demonstrates the earliest activation for FCS entering the working state, followed by the ANFIS-DP strategy. In contrast, the CD-CS strategy shows the latest time for FCS to enter the working state. It is worth noting that despite the DP strategy having the earliest working time for FCS, its output power consistently remains within a reasonable range and operates at peak power less frequently. In contrast, the CD-CS strategy constantly adjusts its output power to approximately 80 kW , or the FCS’s peak power, to ensure compliance with predetermined rules. These findings align with those presented in Section 5.1. Moreover, the ANFIS-DP strategy allows the FCS to operate below its peak power, except towards the end of a journey. This is because when the power battery cannot provide energy due to depletion, propulsion in the FCECV primarily relies on the FCS, resulting in increased operating near its peak power. However, this does not necessarily lead to higher HC as the operation frequency of the FCS at peak power remains low.
Table 7 presents the FCS’s operational characteristics, comparing the peak power, mean power, and standard deviation of the output power for various strategies. Furthermore, the FCS’s initiation time, the proportion of operating points to total driving cycle points, and the proportion of peak power to all driving cycle points are also documented. The results show that the maximum output power of the three strategies generally peaks in different driving cycles, except for the DP strategy, which achieves a maximum output power of 120.72 kW in cycle No.4. However, there is a significant difference in mean power and standard deviation. The ANFIS-DP strategy exhibits a mean power closer to the DP while also demonstrating minimal variability with the lowest standard deviation compared to DP and CD-CS. These results indicate that the output power distribution of the ANFIS-DP strategy in FCS shows a higher concentration level, thereby demonstrating minimal variability in its rate of change.
In addition, the DP strategy demonstrates the earliest initiation time for FCS operation, and CD-CS exhibits the latest commencement. At the same time, the ANFIS-DP strategy falls between DP and CD-CS, leaning more closely towards DP. Regarding FCS’s operating frequency, the ANFIS-DP strategy has a significantly higher frequency than the lowest CD-CS and a higher frequency than the DP. The highest operating frequency for the ANFIS-DP strategy reaches 77.2 % . In contrast, DP and CD-CS have frequencies of 42.23 % and 60.14 % , respectively, for cycle No.1. Nevertheless, CD-CS shows a significant increase in operational frequency during peak power of the FCS (e.g., No.1 is 13.78 % , and No.3 is 16.74 % ). Remarkably, despite having a higher working frequency for FCS operation, the ANFIS-DP strategy can effectively avoid operating at peak power, resulting in a lower proportion of peak power points (e.g., No.1 is 2.55 % and No.3 is 5.29 % ). This characteristic proves that the ANFIS-DP strategy is effective in reducing HC.
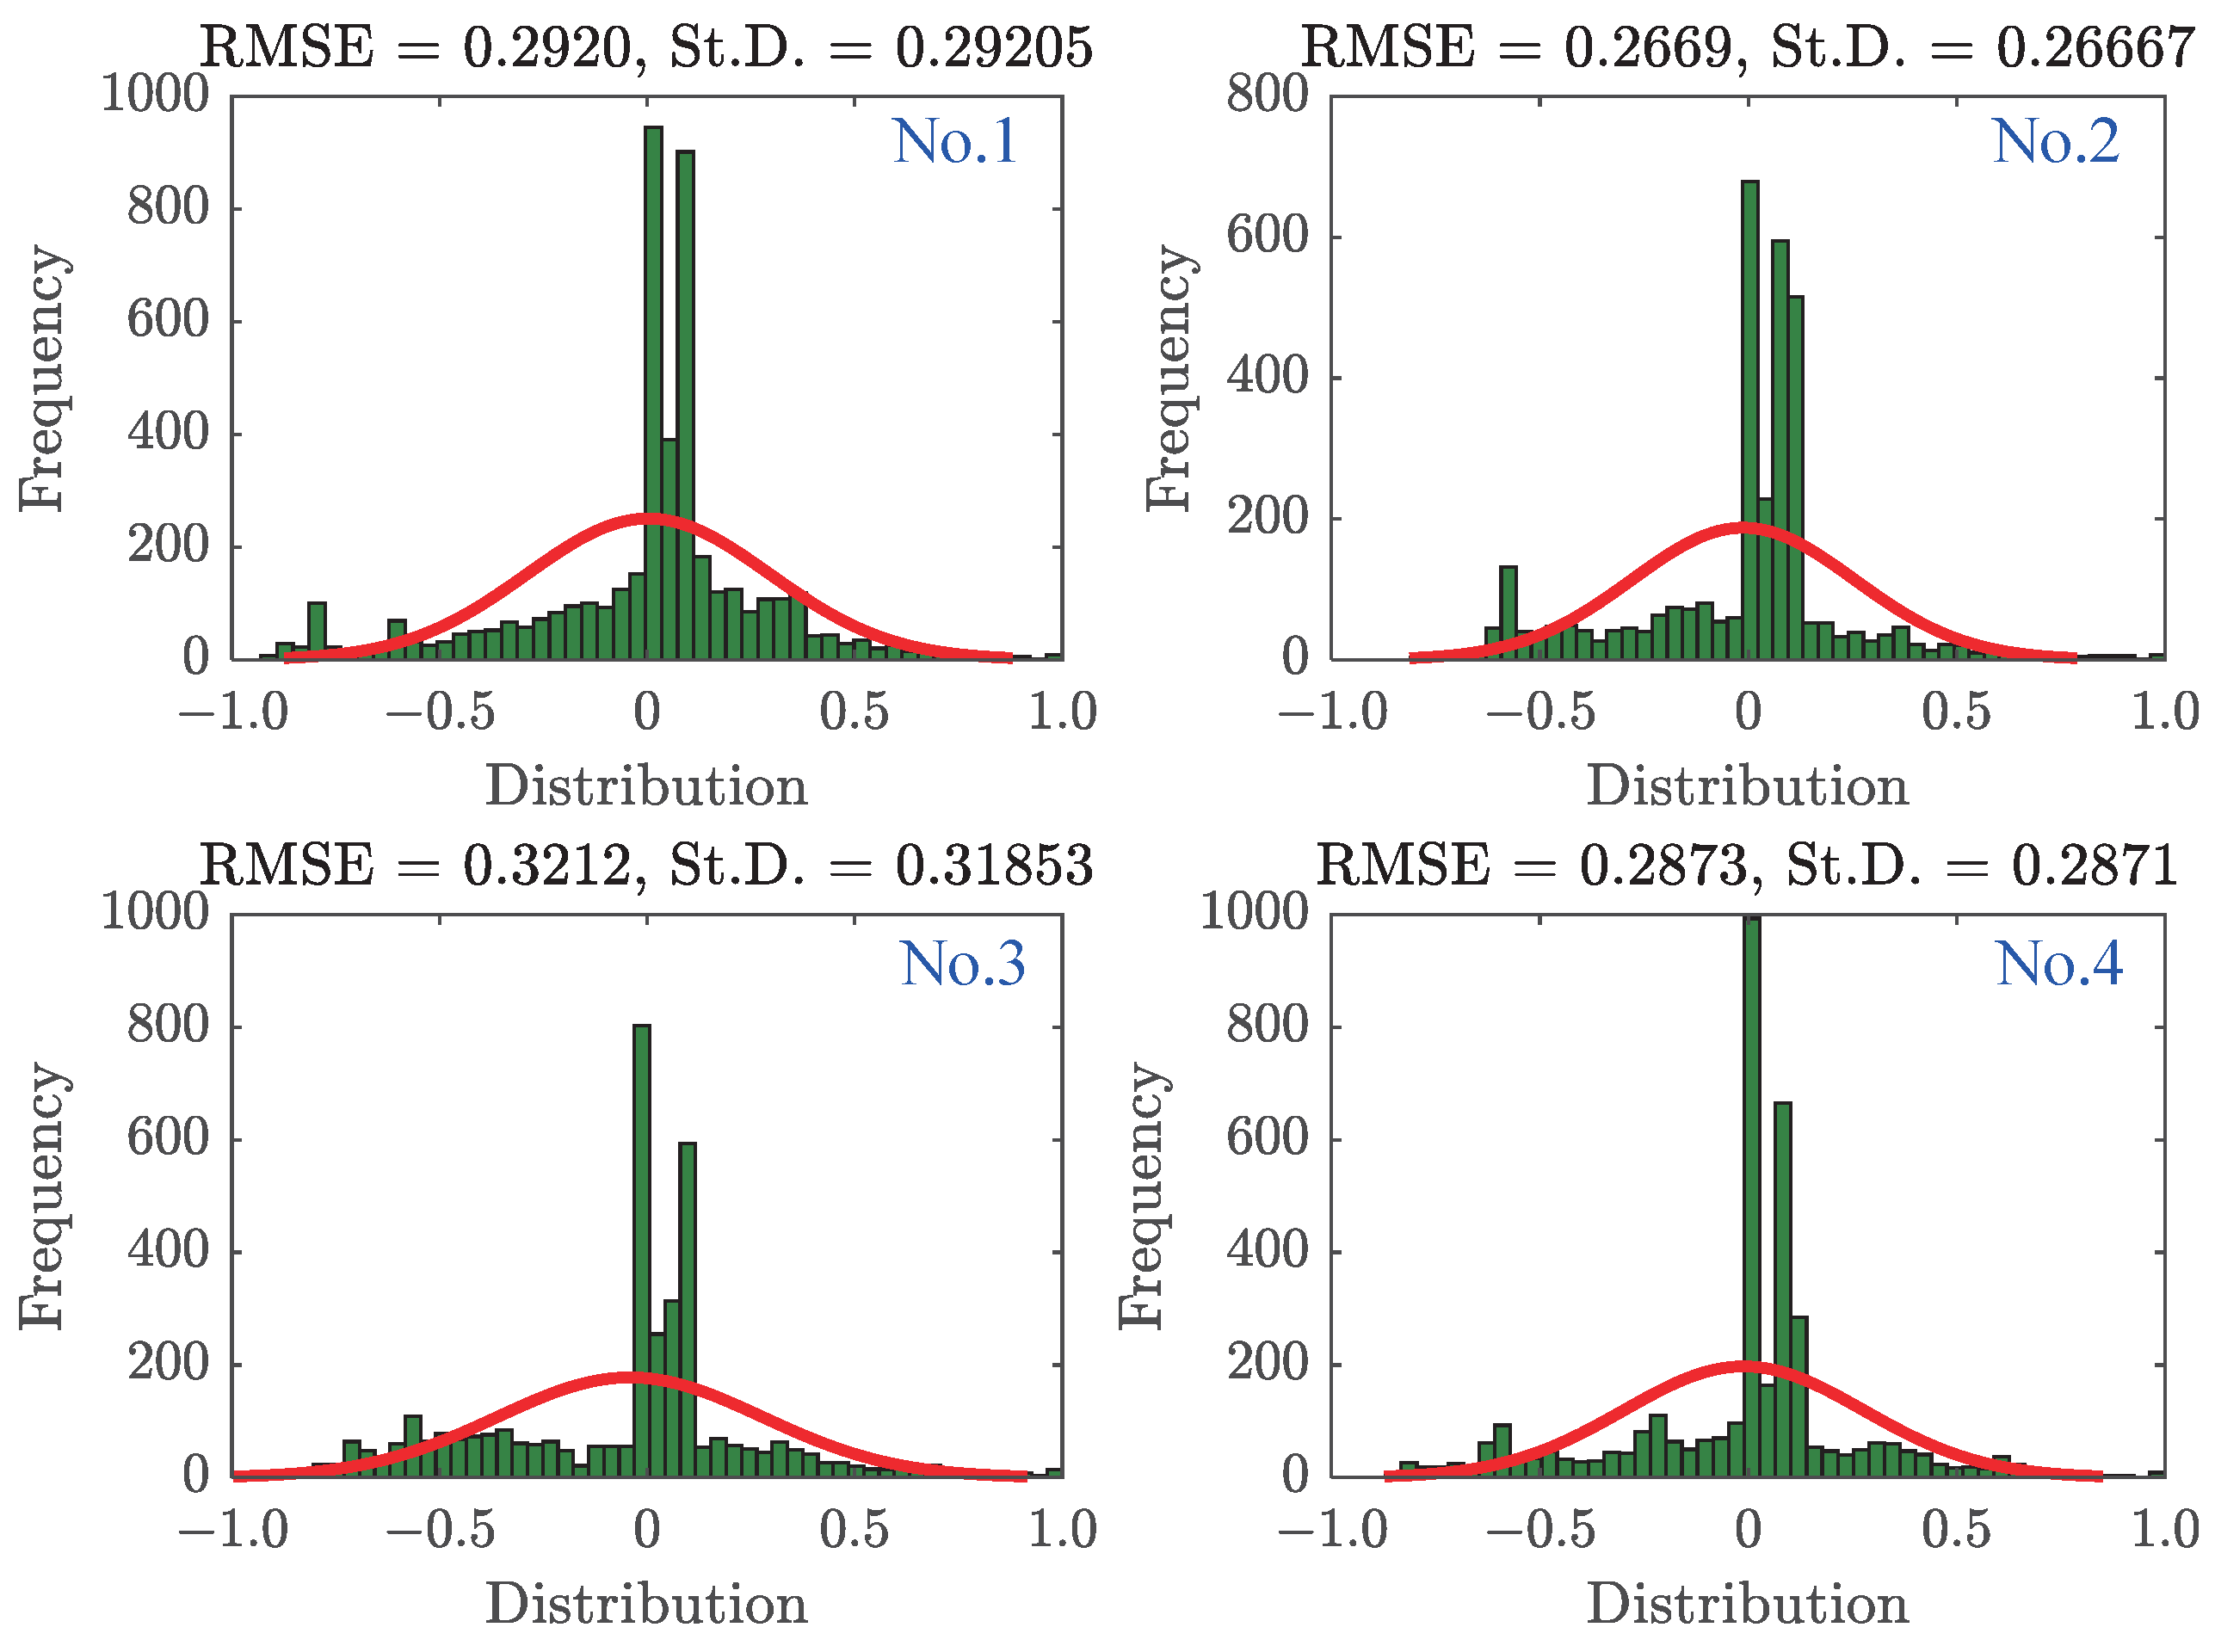
Figure 26 presents the error distributions of the ANFIS model across multiple test cycles, demonstrating its prediction robustness beyond conventional aggregate metrics. The distributions exhibit symmetric, bell-shaped profiles centered near zero, indicating minimal systematic bias and well-balanced dispersion of prediction errors. The close agreement between the RMSE and St.D. values confirms that RMSE accurately captures the inherent variability in the predictions.
The slight increase in RMSE and St.D. observed during testing—compared to training—is attributable to the power rate limitation module (Equation (24)), which is implemented in the real-time control system. While this constraint introduces minor deviations from the DP-optimized reference trajectory, it plays a critical role in maintaining FCS power variations within durable operational boundaries, thereby achieving an effective trade-off between tracking accuracy and long-term system durability. Despite these intentional modifications, the high consistency in distribution patterns across all test cycles underscores the model’s robustness and strong generalization capability. This provides empirical evidence that the ANFIS-DP framework sustains reliable predictive performance under varying operating conditions while complying with practical engineering requirements.
5.2.2. Change Rate of the FCS

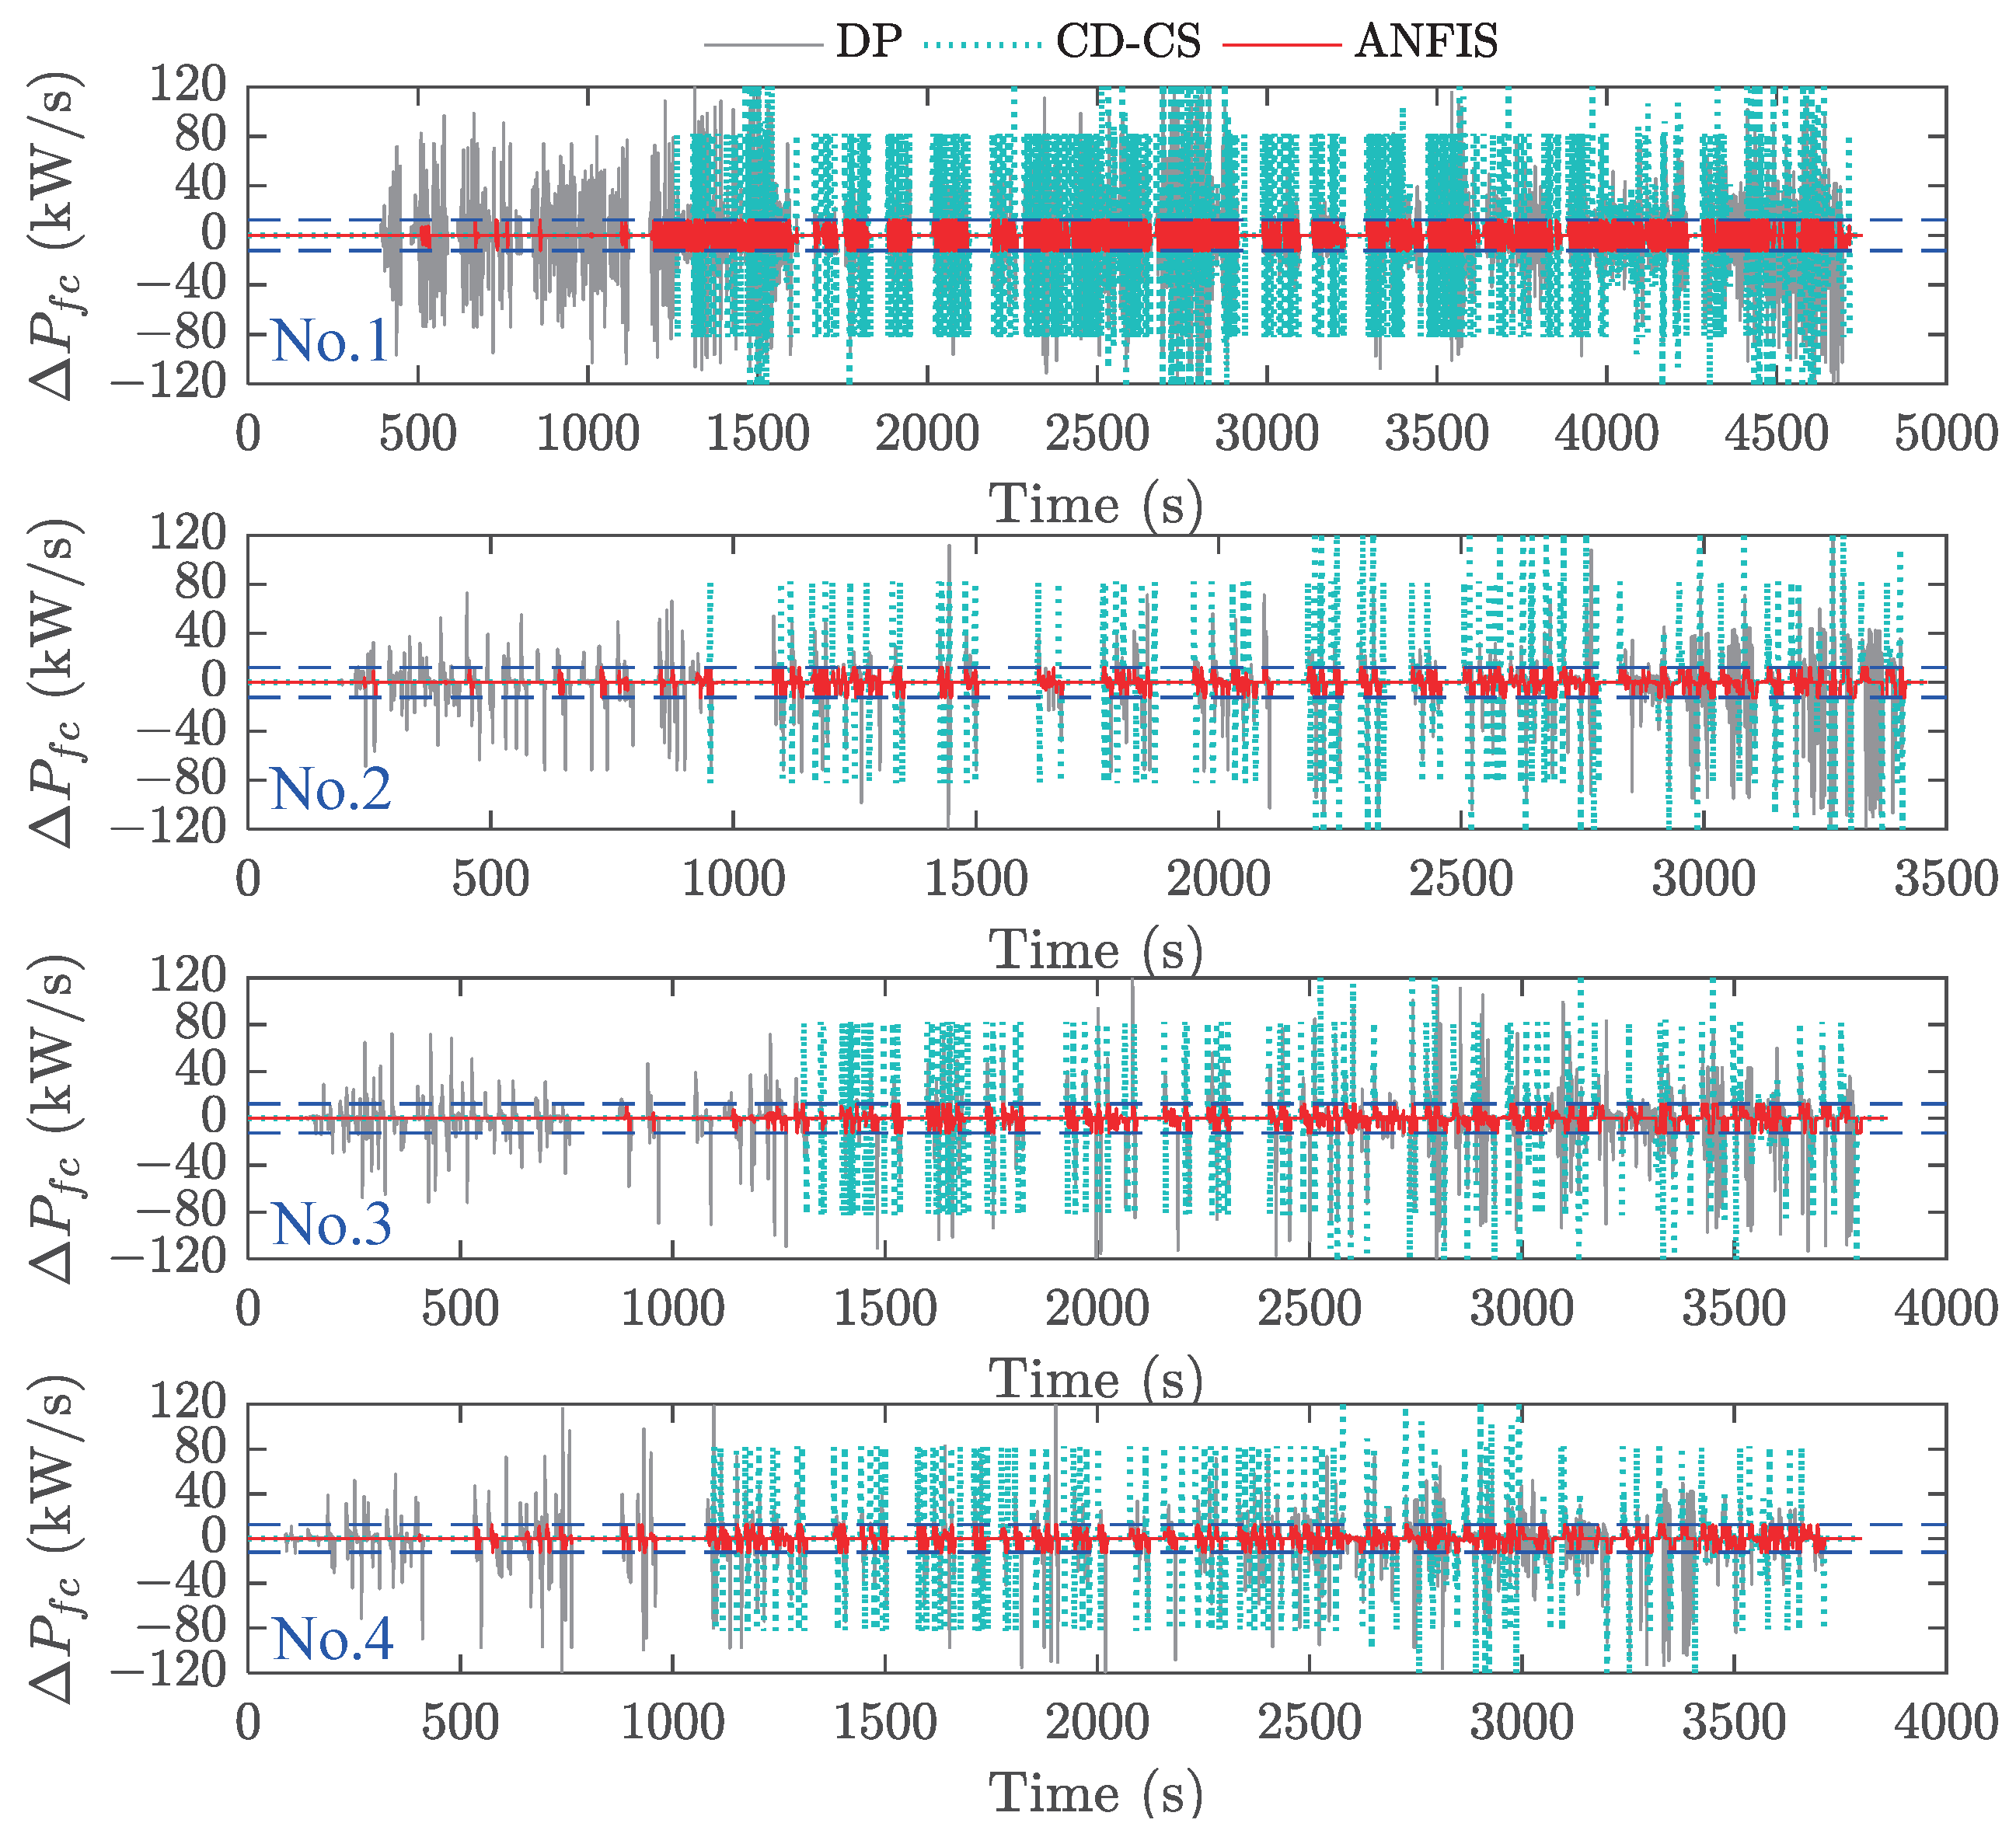
The rate of power change for FCS using the three strategies is shown in Figure 27. It is evident that the ANFIS-DP strategy effectively maintains the FCS’s power change rate within an acceptable range across different operating conditions. However, both the DP and CD-CS strategies show inferior performance. While the power change rate of the CD-CS strategy follows a regular pattern, there are numerous instances where the change rates reach peak power, especially in cycle No.1. Even though the power change rate of the DP strategy is relatively better than that of the CD-CS, it still exceeds the limit necessary to ensure the durability of the FCS.
The change rate of the FCS’s power for the three strategies is presented in Table 8. The CD-CS strategy exhibits the highest power change rate (i.e., ± 123.18 kW ) among all operating conditions, which could have a detrimental impact on the durability of the FCS. In contrast, the DP strategy can marginally enhance this disadvantage. The power change rate of FCS only reaches its peak power in No.1 and decreases under other driving cycles. The average values for the maximum and minimum power change rates are 121.23 kW and 121.09 kW , respectively. However, even with these improvements, this outcome still needs to satisfy the durability requirements of the FCS. Fortunately, due to the FCS’s output power limit, the ANFIS-DP strategy ensures a maximum and minimum power change rate of ± 12.3 kW at any operating condition. Moreover, its average standard deviation of the change rate is merely 5.87 , significantly smaller than DP’s 19.63 and CD-CS’s 22.68 . This indicates that the ANFIS-DP strategy holds substantial advantages in guaranteeing stability in FCS power change rates.

5.2.3. Battery SOC

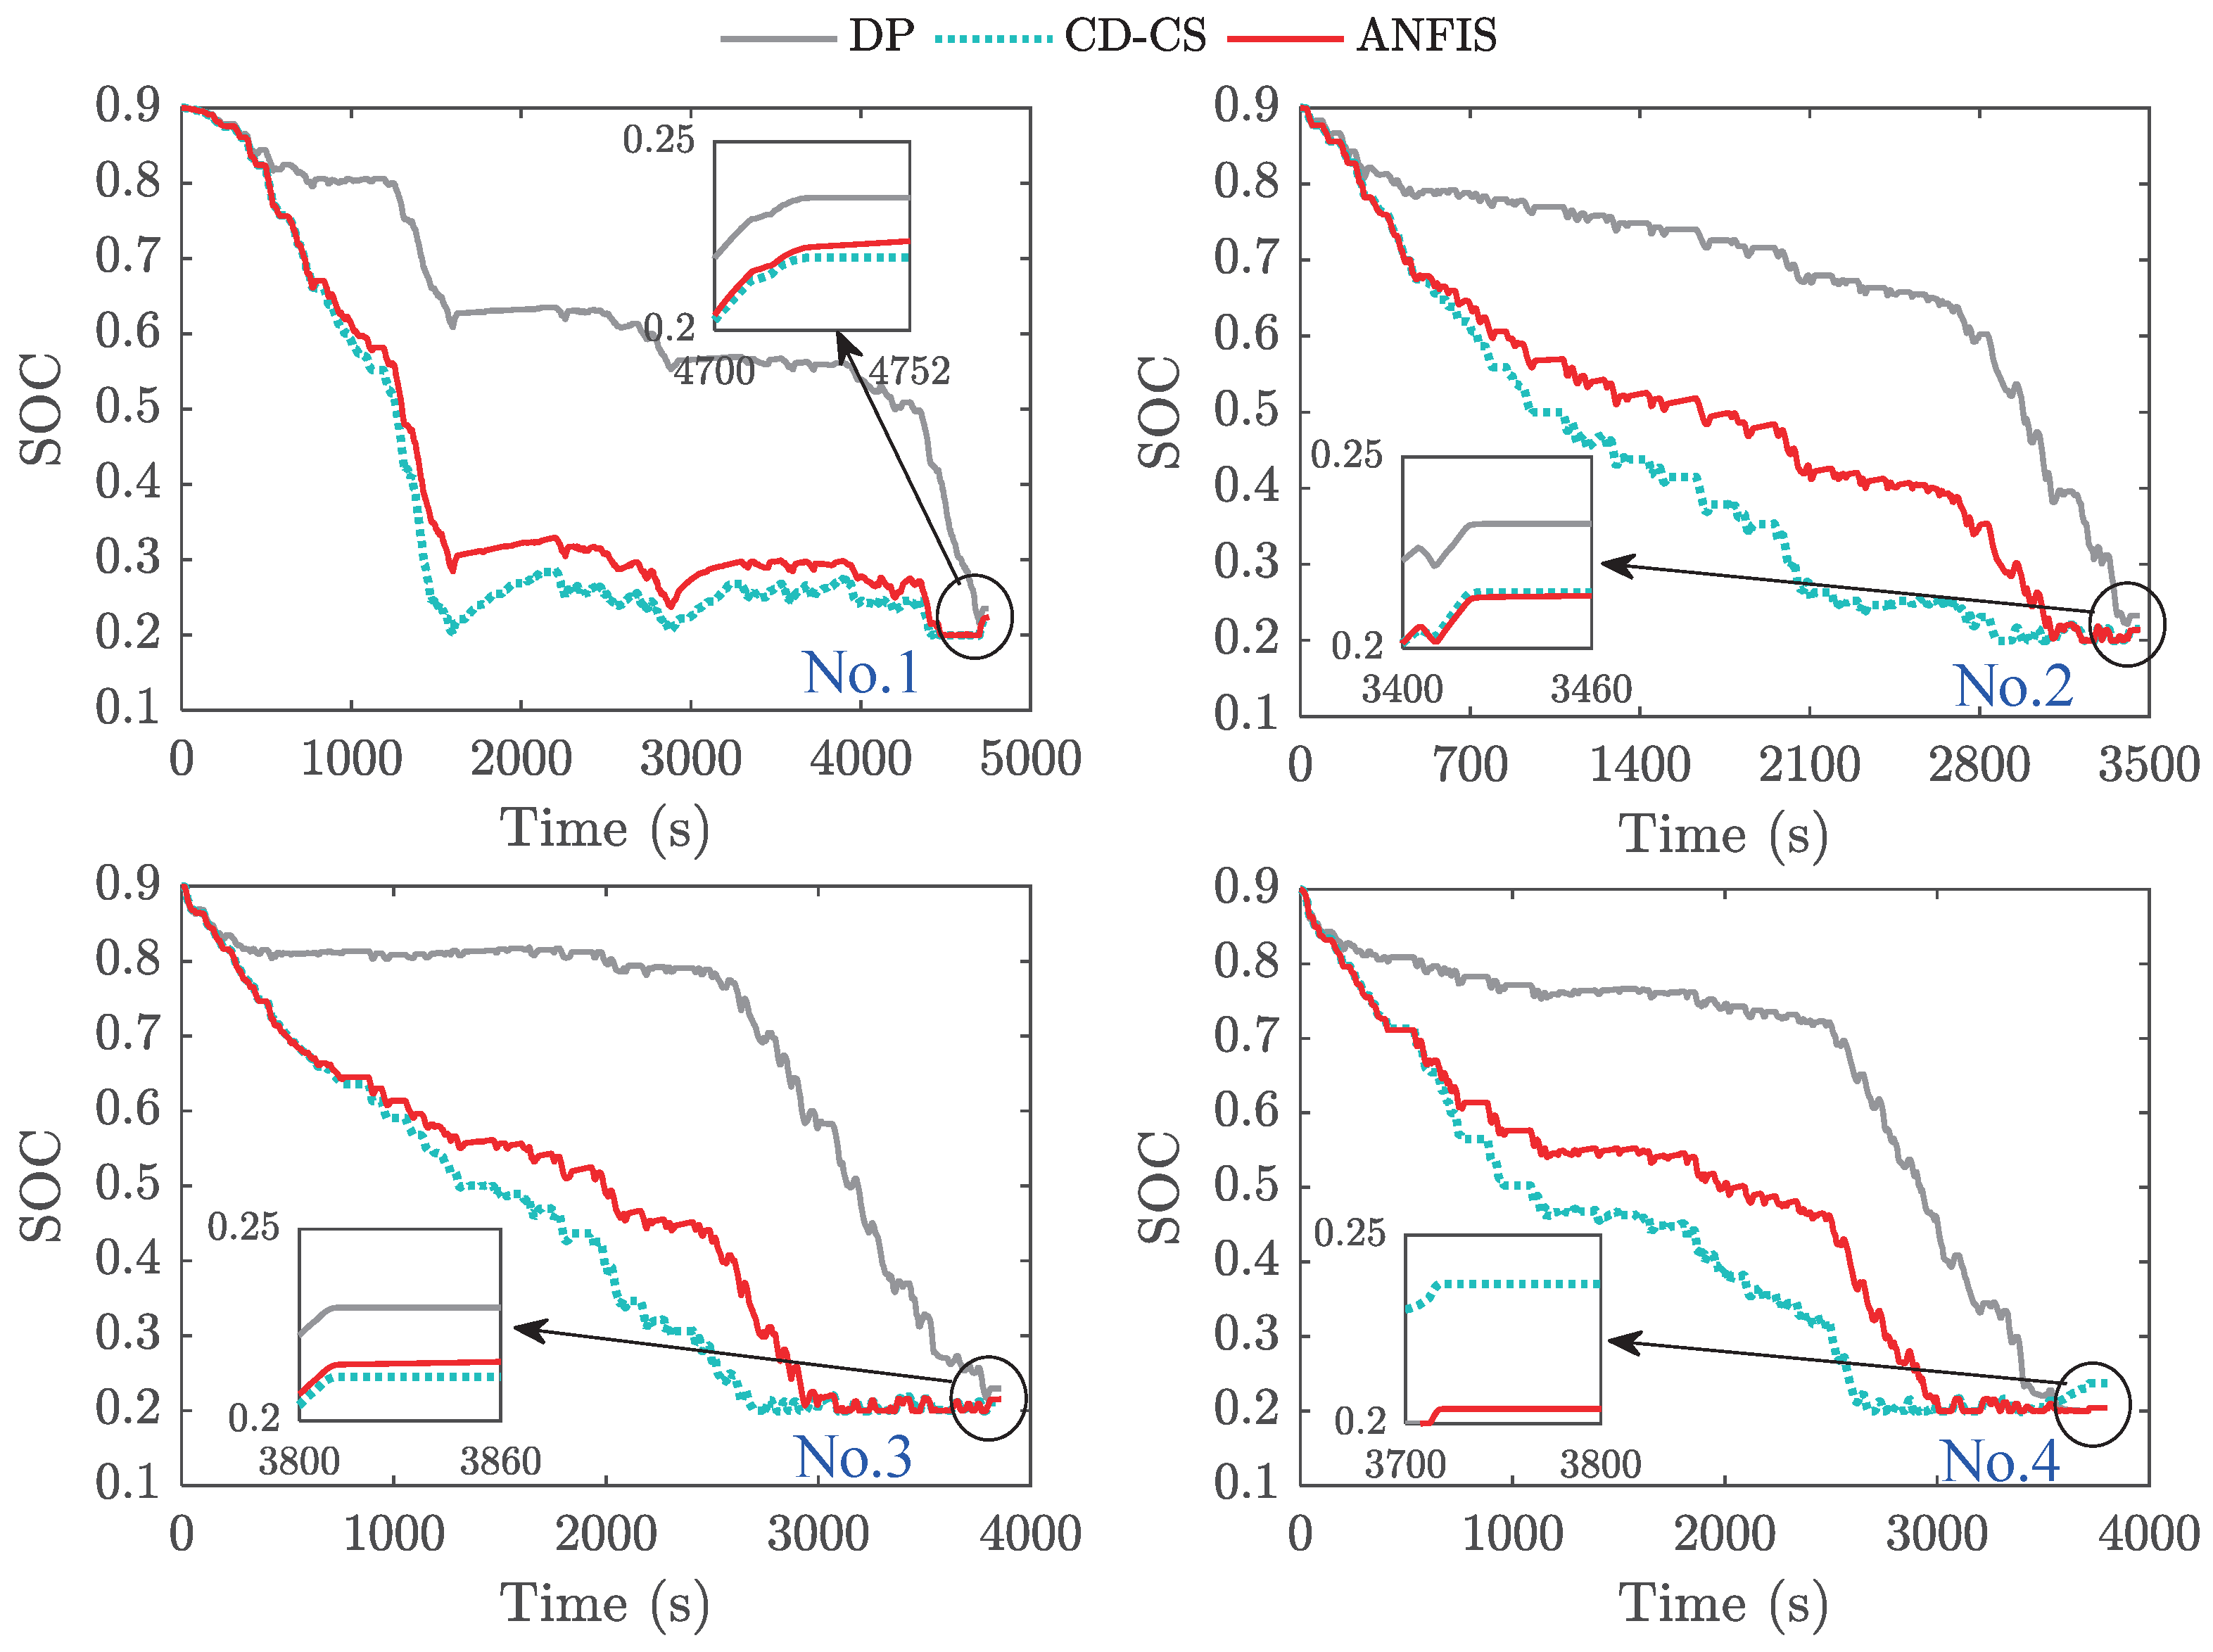
The battery SOC trajectories for three strategies are illustrated in Figure 28. The DP strategy exhibits the slowest rate of SOC decrease under varying driving cycles, while the CD-CS strategy demonstrates the fastest decline. The ANFIS-DP strategy’s battery SOC trajectory falls between these two, exhibiting distinct characteristics based on different driving cycles. All three strategies ensure that the reduction in battery SOC reaches its lower bound by the end of the operating cycle. Except for case No.4, the ANFIS-DP strategy’s termination SOC closely aligns with that of the CD-CS strategy. Due to an interval constraint imposed on its terminal value, DP tends to have a slightly larger terminal battery SOC than the ANFIS-DP and CD-CS strategies. Nevertheless, all three strategies can guarantee optimal utilization of battery power.
The results shown in Table 9 compare the terminal battery SOC for three different strategies. The findings indicate that the strategy based on ANFIS-DP ensures a lower battery SOC within its minimum limitation, with an average terminal SOC of 0.2103 compared to 0.2255 for DP and 0.2218 for CD-CS. Moreover, the ANFIS-DP strategy exhibits better consistency in the battery’s terminal SOC under different driving cycles, with a minimal standard deviation of 0.0064 compared to 0.0145 for the DP strategy and 0.0115 for the CD-CS strategy. These results highlight the enhanced stability of the ANFIS-DP strategy across various driving cycles.

5.2.4. Working Efficiency

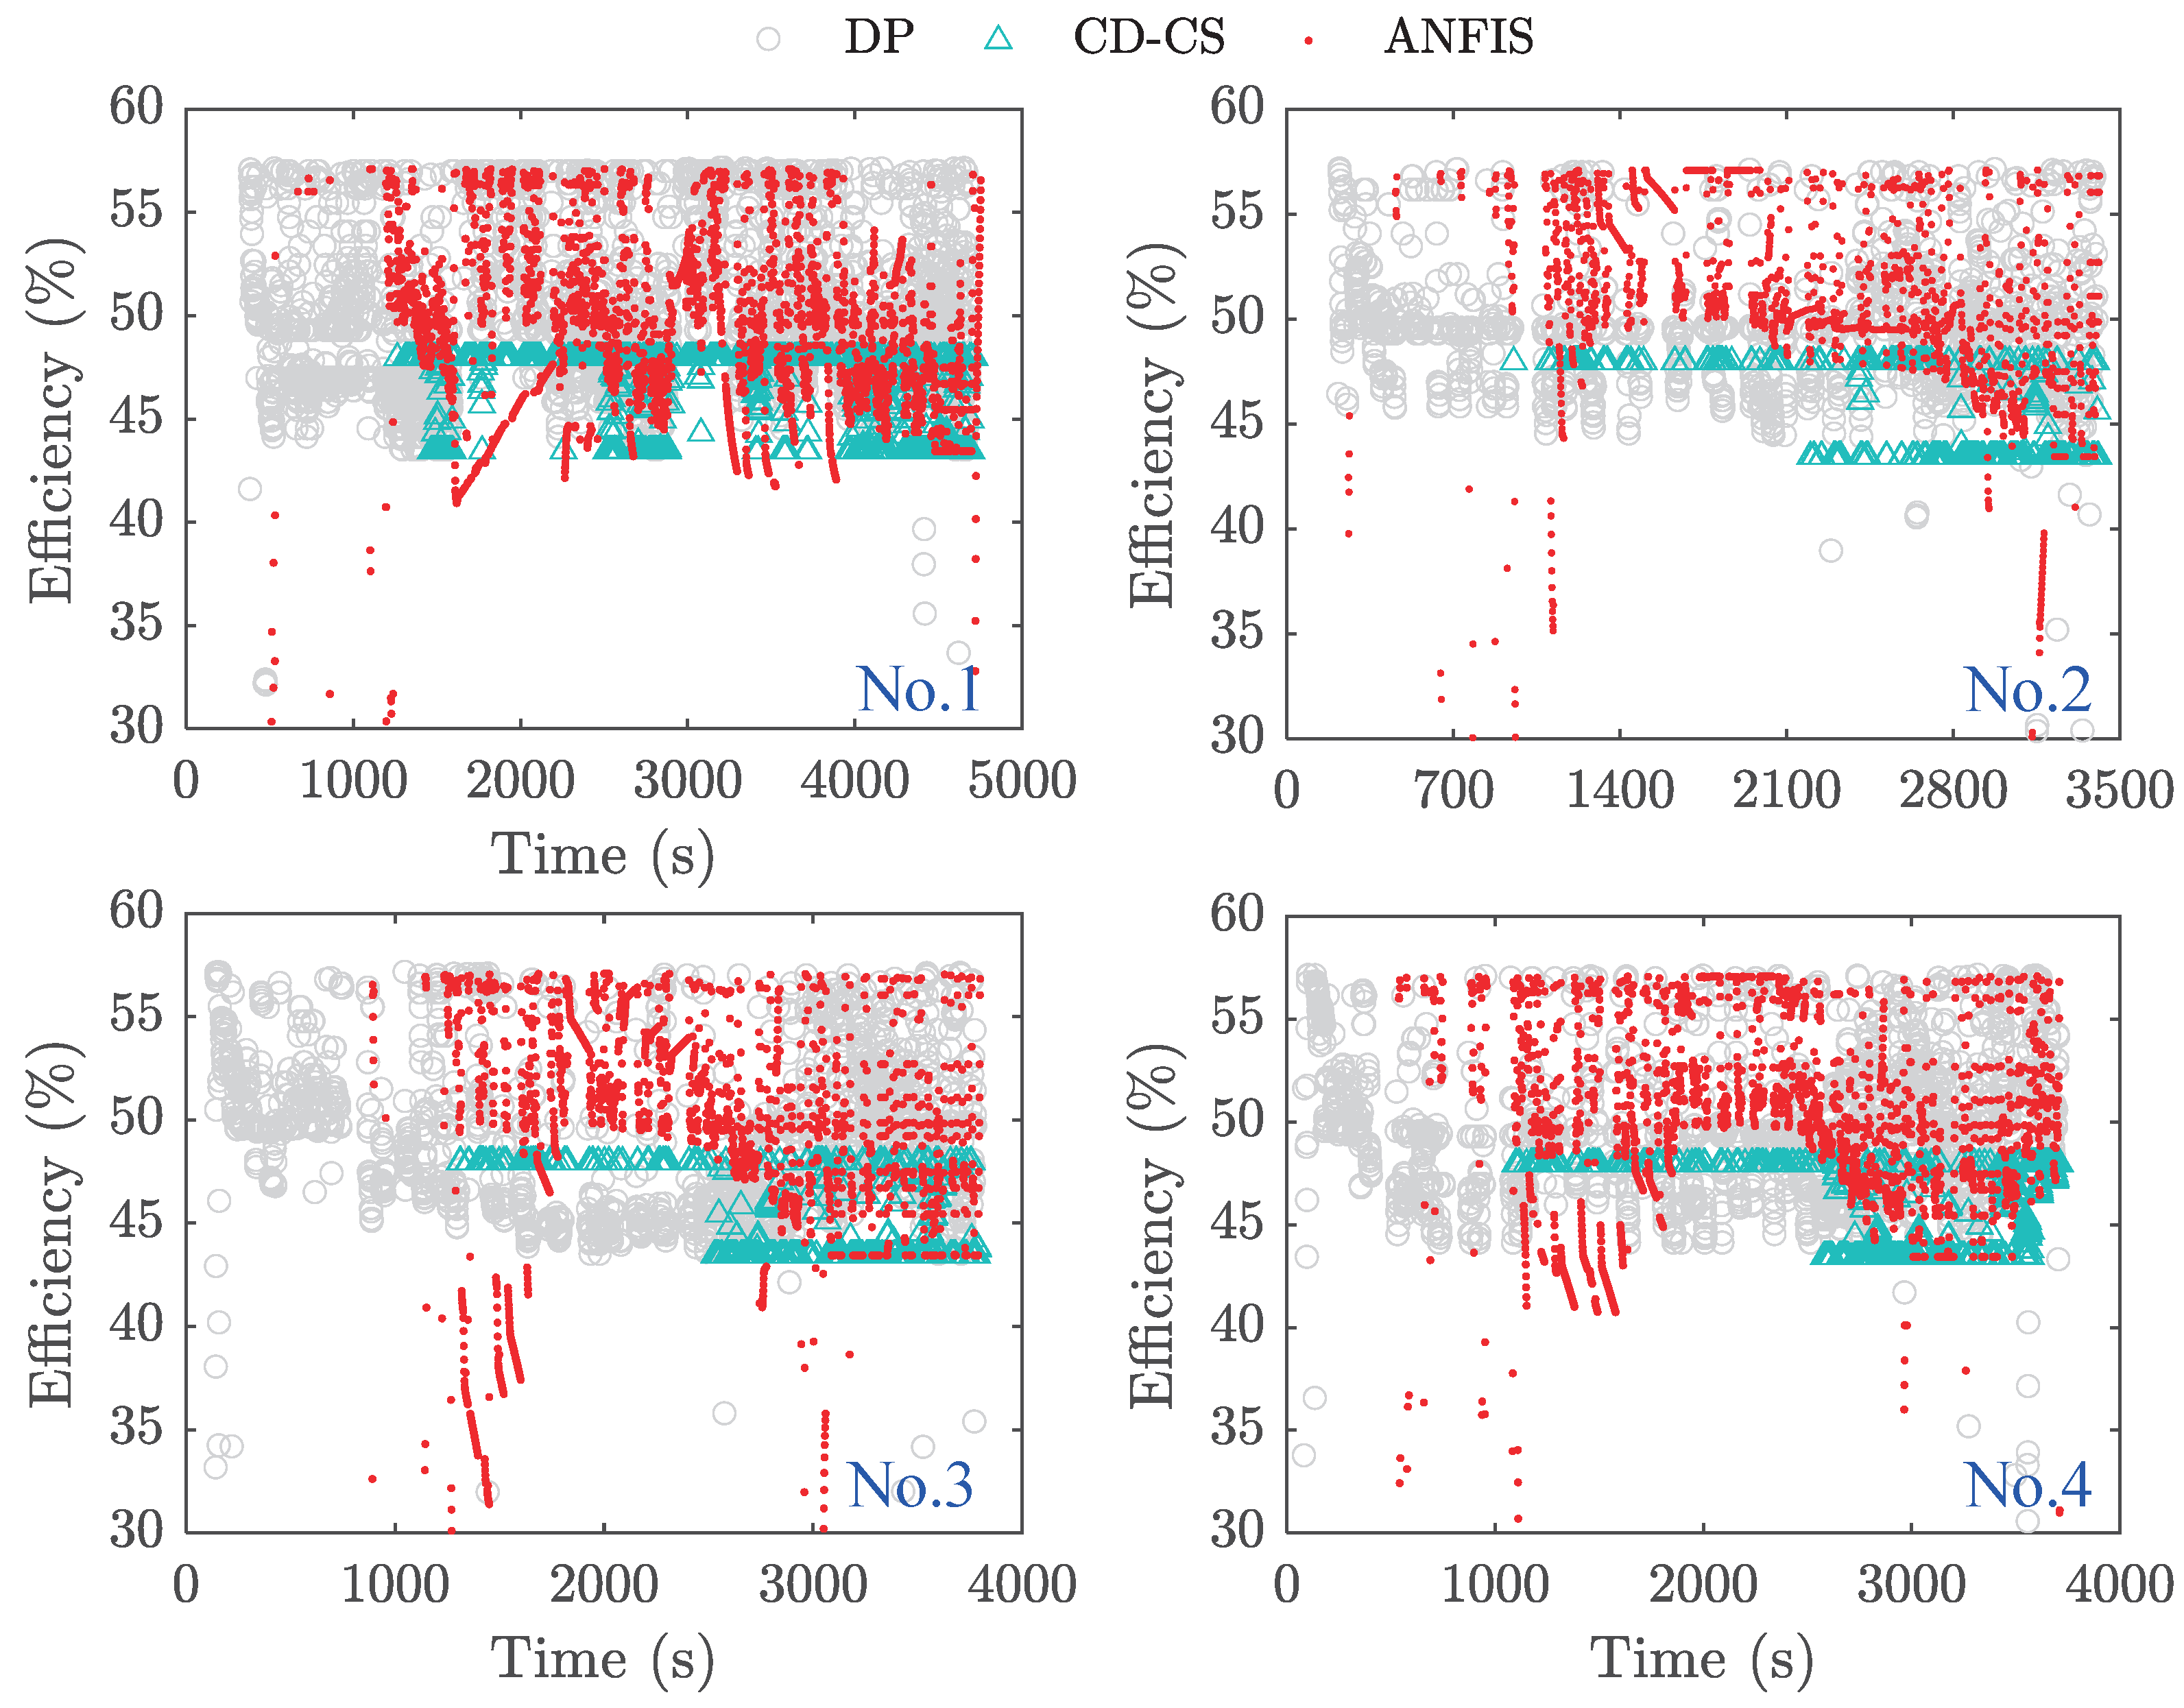
The efficiency distribution of the FCS’s operating points based on the three strategies is depicted in Figure 29. The DP strategy shows scattered operating points but fewer instances of inefficiency. In contrast, the CD-CS strategy exhibits a highly concentrated distribution of operating points, with most points located in the low-efficiency zone. Compared to the DP, the ANFIS-DP strategy exhibits a more concentrated distribution, with a greater number of operating points in the high-efficiency area; however, some operating points still fall into the low-efficiency region. This can be attributed to errors during the training of the ANFIS model and the constraints imposed by FCS output power within the ANFIS-DP strategy. Nevertheless, it should be noted that the proposed strategy outperforms CD-CS in terms of operating points within high-efficiency zones.
Table 10 presents the statistics of FCS’s operating points for at least 45 % and 50 % efficiency under three strategies. Only FCS’s non-zero output power points are considered. The DP strategy demonstrates the highest operating point efficiency across different driving cycles, with an average of 93.83 % of operating points achieving an efficiency of at least 45 % and 37.82 % achieving an efficiency of at least 50 % . The CD-CS strategy clearly shows the lowest operating point efficiency, averaging 50.35 % for a maximum efficiency of 45 % , with no points exceeding 50 % . Interestingly, the ANFIS-DP strategy has more operating points with an efficiency of at least 50 % compared to the DP, with an average distribution of around 49.59 % . However, when considering efficiencies above 45 % , DP outperforms the ANFIS-DP strategy significantly, with an average distribution of approximately 93.83 % compared to the ANFIS’s 85.05 % . This suggests that most of FCS’s operating points under the ANFIS-DP strategy are concentrated in areas where efficiencies exceed 50 % . It will be a significant advantage in improving FCECV’s economy more effectively.

5.2.5. Hydrogen Consumption

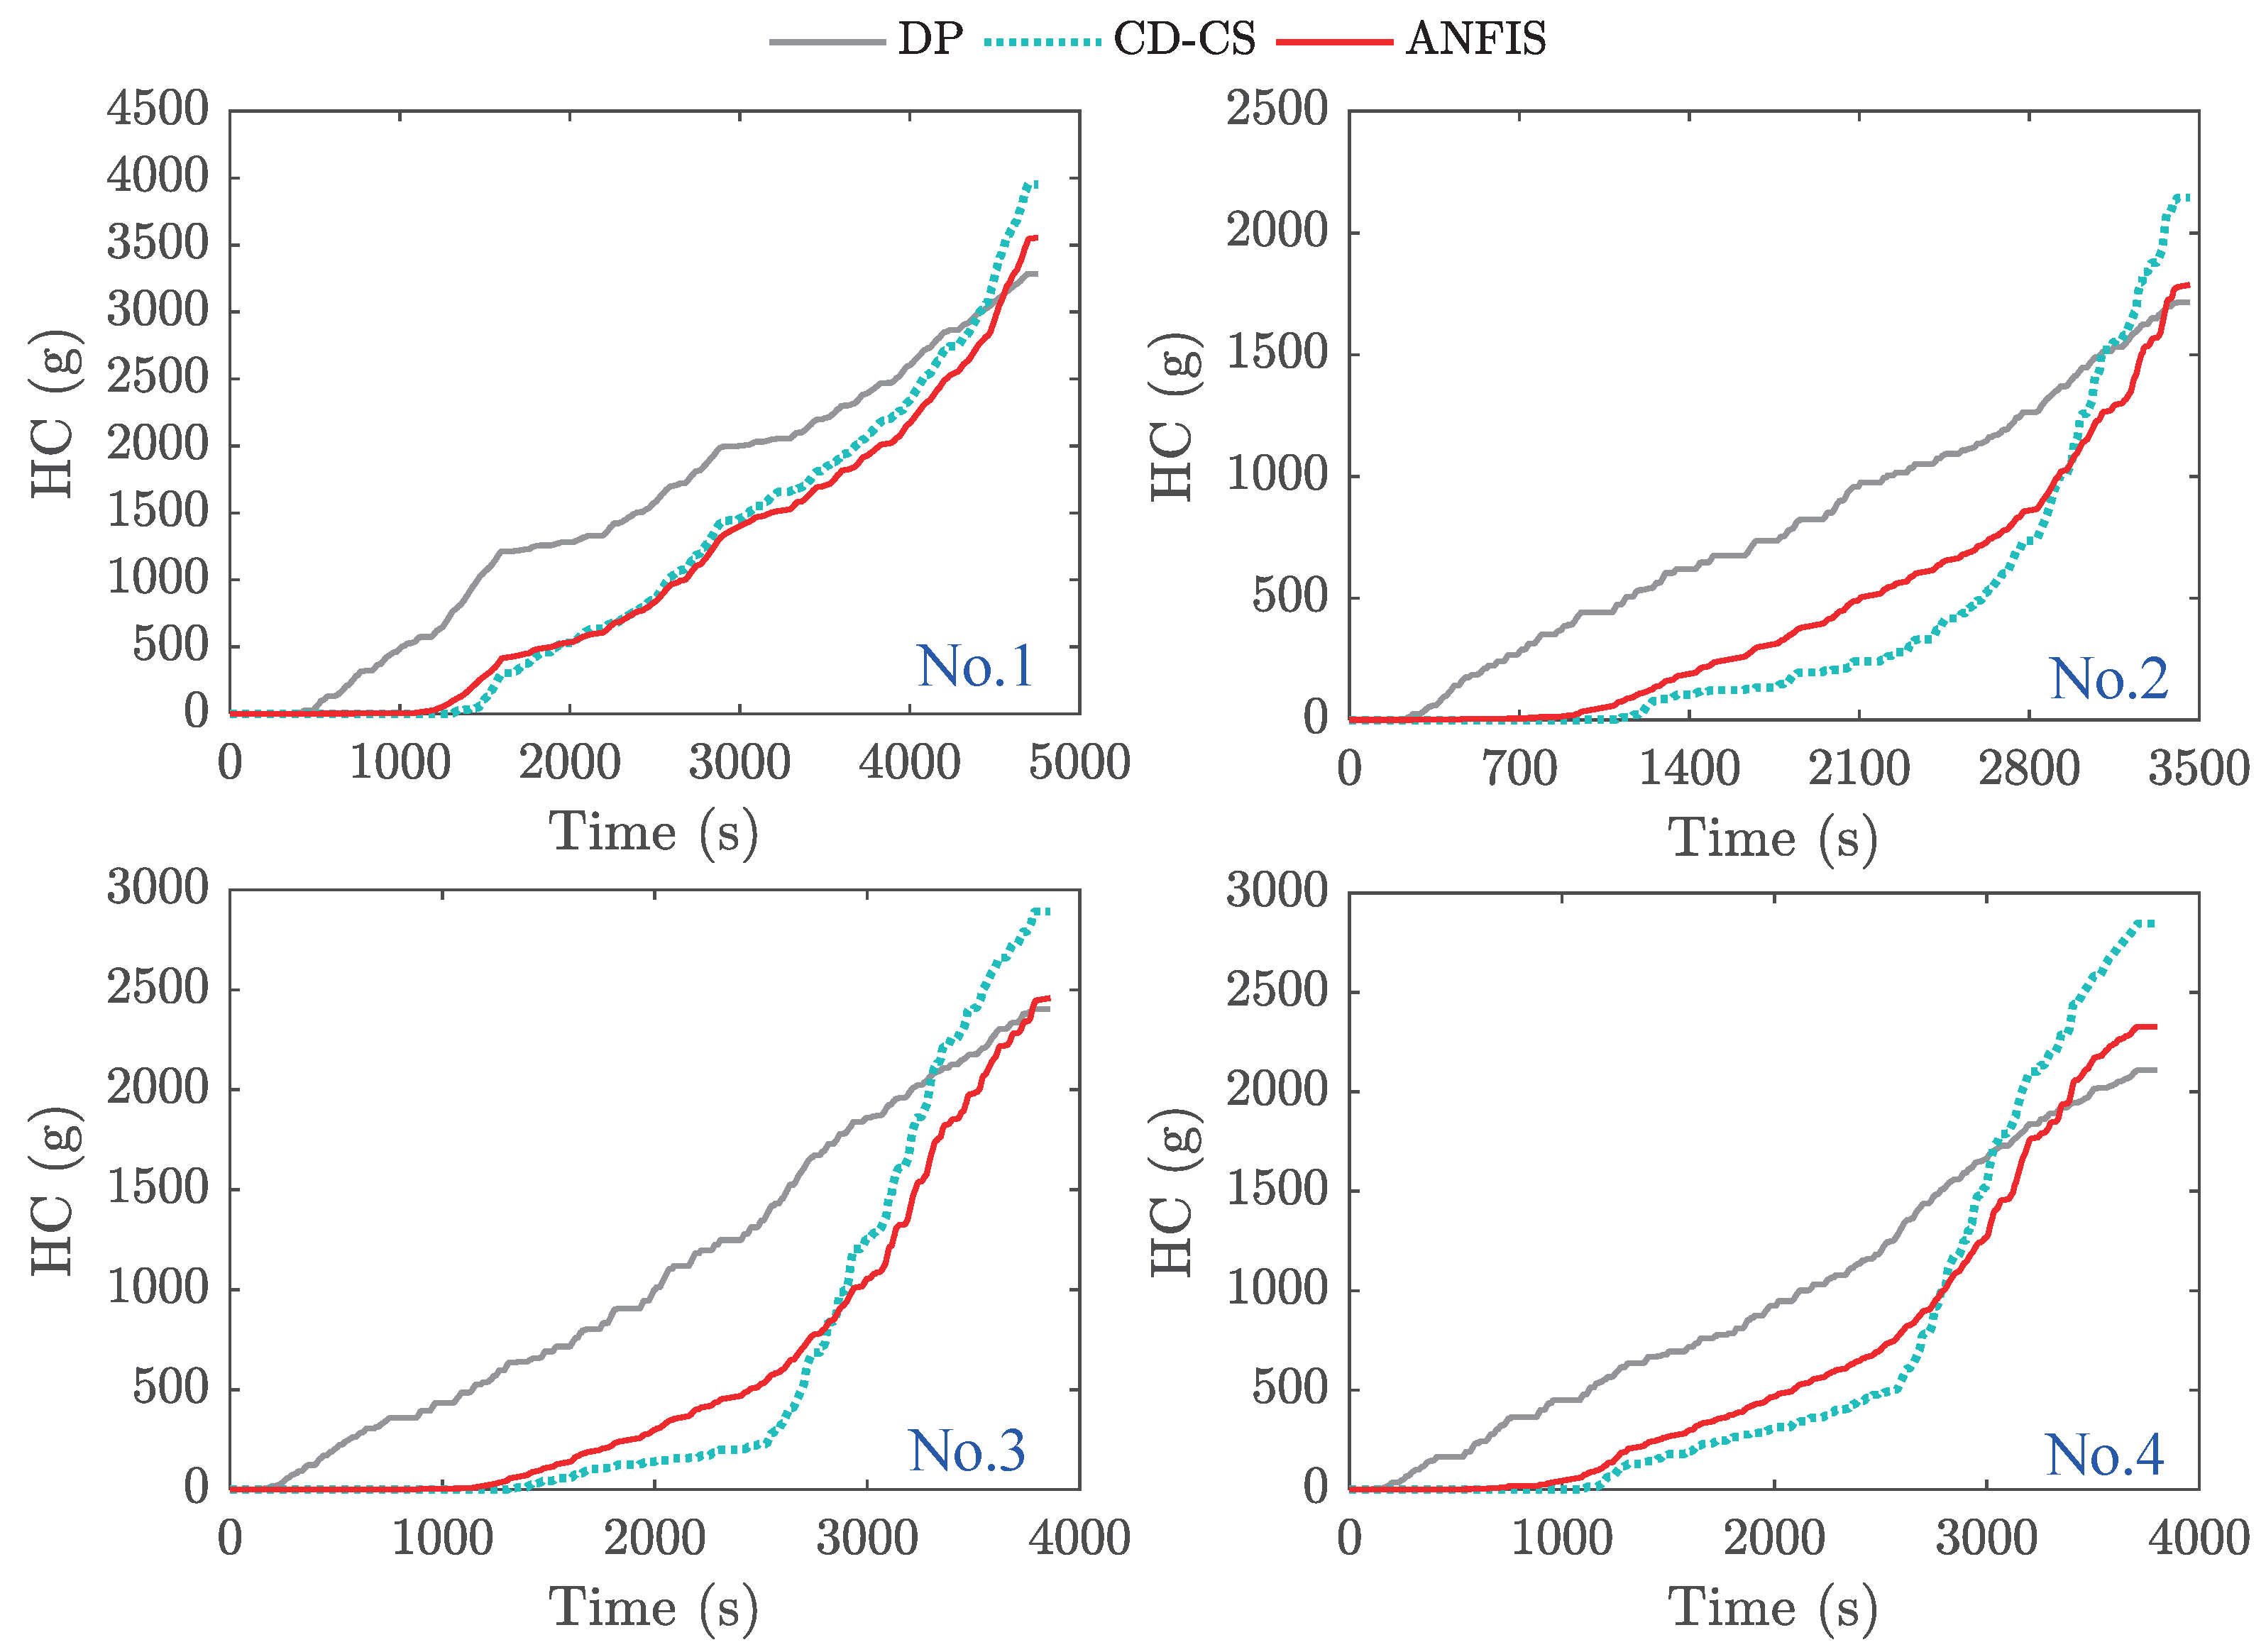
The HC of the FCS under the three strategies is illustrated in Figure 30. The DP strategy achieves the best HC across various driving cycles, while the CD-CS strategy exhibits the highest. The ANFIS-DP strategy falls in between these two in terms of energy consumption. Compared to the CD-CS strategy, the ANFIS-DP strategy significantly enhances the economic performance of the FCECV and approaches the efficiency levels of the DP for specific driving cycles (e.g., No.2 and No.3). These results further highlight the substantial potential of the ANFIS-DP strategy in improving the vehicle’s economic performance.
Table 11 compares the energy consumption of vehicles using three different strategies. The results show that the DP strategy can significantly improve fuel efficiency, achieving an average improvement of 19.32 % across four driving cycles. The ANFIS-DP strategy also demonstrates a substantial economic benefit, with an average improvement of 14.98 % . It is only 5.40 % lower than the DP strategy. However, applying the DP strategy in real-time presents particular challenges. In contrast, the ANFIS-DP strategy proposed in this study offers considerable advantages for online energy-saving applications.

5.2.6. Computing Efficiency

Table 12 compares the computing time of the three strategies to assess the feasibility of employing the ANFIS-DP strategy online. The simulations were conducted exclusively on a laptop computer equipped with a 2.6 GHz CPU frequency and 16 GB of memory, which is worth mentioning. The results demonstrate that the ANFIS-DP strategy exhibits a satisfactory computational time compared to the DP strategy. The improvement in computational time can reach up to 96.13 % with an average across the four driving cycles. Furthermore, it is noteworthy that the computing efficiency of the ANFIS-DP strategy surpasses CD-CS, as evidenced by a mean reduction of 22.05 % in execution time. This advantage is particularly significant for real-time applications that utilize the proposed ANFIS-DP strategy.

6. Conclusions

This study presented a novel ANFIS-based real-time EMS for FCECVs, integrating DP to address the critical challenges of energy efficiency and system durability. A hybrid ANFIS-DP framework was developed, combining the global optimization capability of DP with the real-time adaptability of ANFIS. This innovative approach effectively bridges the gap between offline optimization and online implementation, offering a practical solution for real-world FCECV operations. The proposed strategy demonstrates exceptional energy-saving capabilities, achieving a 14.98 % reduction in HC compared to the conventional CD-CS strategy while maintaining performance within 5.40 % of the global optimum (i.e., DP). Furthermore, it significantly enhances computational efficiency, with a 96.13 % improvement over DP and a 22.05 % improvement over CD-CS, making it highly suitable for real-time applications. The ANFIS-DP EMS ensures that the FCS operates consistently within its high-efficiency zone while effectively regulating power change rates to enhance system durability. This dual focus on energy efficiency and operational stability represents a significant advancement in FCECV energy management.
The proposed ANFIS-DP framework exhibits improved energy efficiency and enhanced computational performance; however, its validation, which relies solely on battery SOC and power demand, presents a simplification. Future efforts will concentrate on three key enhancements: (1) validating the framework on a hardware-in-the-loop (HIL) platform under dynamic operating conditions, (2) integrating vehicle-to-infrastructure (V2I) and vehicle-to-vehicle (V2V) communication for predictive energy management, and (3) implementing multi-objective optimization that includes thermal management and component degradation. These advancements aim to bolster practical applicability while preserving real-time computational efficiency.

Author Contributions

Conceptualization, J.D. and X.L.; methodology, J.D. and X.L.; software, X.Z. and S.W.; validation, J.D., X.Z. and S.W.; data curation, M.X.; writing—original draft preparation, J.D. and X.Z.; writing—review and editing, J.D. and X.L. All authors have read and agreed to the published version of the manuscript.

Funding

This research was funded in part by the Innovation Capability Enhancement Initiative for Technology-Oriented SMEs of Shandong Province 2024PDJH38/K24LB9601, and in part by the Doctoral Scientific Research Foundation of Liaocheng University 318052058.

Institutional Review Board Statement

Not applicable.

Informed Consent Statement

Not applicable.

Data Availability Statement

The data presented in this study are available on request from the corresponding author.

Conflicts of Interest

Author Manxi Xing was employed by the company Beiben Trucks Group Co., Ltd. The remaining authors declare that the research was conducted in the absence of any commercial or financial relationships that could be construed as a potential conflict of interest.

Abbreviations

The following abbreviations are used in this manuscript:
SymbolDescription
P m / T m Power/Torque of the motor
n m Rational speed of the motor
η m Motor’s efficiency
T AMT _ in / T AMT _ out Torque in/output of the AMT
n AMT _ in / n AMT _ out Rotation speed in/output of the AMT
i g / η AMT Speed ratio/Efficiency of the AMT
m H 2 Mass of the consumed hydrogen
E low , H 2 Low heating value of hydrogen
P f c / η f c Output power/Efficiency of the FCS
I b a t / P b a t Battery current/power
U o c / R b a t Open circuit voltage/Internal resistance
S O C ( t 0 ) / S O C ( t f ) Initial/Terminal battery SOC
Q b a t Capacity of the battery
Δ S O C Variation of the battery SOC
m / α Vehicle mass/Road grade angle
gGravitational acceleration
fRolling resistance coefficient
C d Air drag coefficient
ρ a Air density
A f Windward area of the vehicle
uVehicle velocity
δ Correction coefficient of rotating mass
F r e q / P r e q Vehicle’s demand force/power
X ( k ) State vector of the system
U ( k ) Control vector of the system
kTime step
S O C ( k ) State of battery SOC
g x ( k ) AMT’s gear position
P b a t ( k ) Instantaneous power of the battery
P f c ( k ) Instantaneous power of the FCS
P m ( k ) Instantaneous power of the motor
Shift ( k ) Gear-shifting action
C f Price of HC
C b Cost of battery energy consumption
β Gearshift penalty coefficient
AcronymFull Name
ANFISAdaptive neuro-fuzzy inference system
DPDynamic programming
FCECVFuel cell electric commercial vehicle
AMTAutomated manual transmission
HCHydrogen consumption
CHTC-TTChina heavy-duty commercial vehicle test cycle for tractor-trailers
SOCState-of-charge
FISFuzzy inference system
PSOParticle swarm optimization
CD-CSCharge-depleting and charge-sustaining
ICEInternal combustion engine
BEVBattery electric vehicle
EMSEnergy management strategy
FCSFuel cell system
PMPPontryagin’s minimum principle
SASimulated annealing
GAGenetic algorithm
LPLinear programming
CPConvex programming
ECMSEquivalent consumption minimization strategy
EFEquivalent factor
MPCModel predictive control
GPSGlobal positioning system
ITSIntelligent transportation system
ANNArtificial neural networks
DNNDeep neural networks
SVRSupport vector regression
RLReinforcement learning
DRLDeep reinforcement learning
QLQ-learning
DQLDeep Q-learning
PEMFCProton exchange membrane fuel cell
FLCFuzzy logic control
V2Vvehicle-to-vehicle
V2Ivehicle-to-infrastructure

References

  1. Oladosu, T.L.; Pasupuleti, J.; Kiong, T.S.; Koh, S.P.J.; Yusaf, T. Energy management strategies, control systems, and artificial intelligence-based algorithms development for hydrogen fuel cell-powered vehicles: A review. Int. J. Hydrogen Energy 2024, 61, 1380–1404. [Google Scholar] [CrossRef]
  2. Zhang, W.; Fang, X.; Sun, C. The Alternative Path for Fossil Oil: Electric Vehicles or Hydrogen Fuel Cell Vehicles? J. Environ. Manag. 2023, 341, 118019. [Google Scholar] [CrossRef] [PubMed]
  3. Inci, M.; Buyuk, M.; Demir, M.H.; Ilbey, G. A Review and Research on Fuel Cell Electric Vehicles: Topologies, Power Electronic Converters, Energy Management Methods, Technical Challenges, Marketing and Future Aspects. Renew. Sustain. Energy Rev. 2021, 137, 110648. [Google Scholar] [CrossRef]
  4. Zhou, Y.; Yang, F.; Guo, Y.; Chen, B.; Jiang, W.; Ma, R.; Gao, F. Adaptive Energy Management for Fuel Cell Heavy Trucks Based on Wavelet Neural Network Speed Predictor and Real-Time Weight Distribution. IEEE Trans. Transp. Electrif. 2025, 11, 5069–5083. [Google Scholar] [CrossRef]
  5. Ahmad, S.; Ullah, A.; Samreen, A.; Qasim, M.; Nawaz, K.; Ahmad, W.; Alnaser, A.; Kannan, A.M.; Egilmez, M. Hydrogen Production, Storage, Transportation and Utilization for Energy Sector: A Current Status Review. J. Energy Storage 2024, 101, 113733. [Google Scholar] [CrossRef]
  6. Hu, X.; Zou, C.; Tang, X.; Liu, T.; Hu, L. Cost-Optimal Energy Management of Hybrid Electric Vehicles Using Fuel Cell/Battery Health-Aware Predictive Control. IEEE Trans. Power Electron. 2020, 35, 382–392. [Google Scholar] [CrossRef]
  7. KoteswaraRao, K.V.; Srinivasulu, G.N.; Rahul, J.R.; Velisala, V. Optimal Component Sizing and Performance of Fuel Cell—Battery Powered Vehicle over World Harmonized and New European Driving Cycles. Energy Convers. Manag. 2024, 300, 117992. [Google Scholar] [CrossRef]
  8. Zhang, J.; Xun, Q.; Liserre, M.; Yang, H. Health-Aware Bi-level Optimization of Component Sizing and Real-Time Energy Management in Fuel Cell Hybrid Electric Trucks. IEEE Trans. Ind. Appl. 2024, 60, 7279–7290. [Google Scholar] [CrossRef]
  9. Shen, Y.; Xie, J.; He, T.; Yao, L.; Xiao, Y. CEEMD-Fuzzy Control Energy Management of Hybrid Energy Storage Systems in Electric Vehicles. IEEE Trans. Energy Convers. 2024, 39, 555–566. [Google Scholar] [CrossRef]
  10. Liu, X.; Guo, H.; Du, J.; Zhao, X. A Modified Model-free-adaptive-control-based Real-time Energy Management Strategy for Plug-in Hybrid Electric Vehicle. Semanticscholar 2022, 10, 4007–4024. [Google Scholar] [CrossRef]
  11. Li, F.; Hu, X.; He, L.; Niu, W.; Lu, S.; Zhang, T. Multi-mode Energy Management Strategy for Fuel Cell Electric Vehicles Based on Driving Pattern Identification Using Learning Vector Quantization Neural Network Algorithm. J. Power Sources 2018, 389, 230–239. [Google Scholar] [CrossRef]
  12. Hemi, H.; Ghouili, J.; Cheriti, A. A Real Time Fuzzy Logic Power Management Strategy for a Fuel Cell Vehicle. Energy Convers. Manag. 2014, 80, 63–70. [Google Scholar] [CrossRef]
  13. Sulaiman, N.; Hannan, M.A.; Mohamed, A.; Ker, P.J.; Majlan, E.H.; Daud, W.R.W. Optimization of Energy Management System for Fuel-Cell Hybrid Electric Vehicles: Issues and Recommendations. Appl. Energy 2018, 228, 2061–2079. [Google Scholar] [CrossRef]
  14. Pramuanjaroenkij, A.; Kakac, S. The Fuel Cell Electric Vehicles: The Highlight Review. Int. J. Hydrogen Energy 2023, 48, 9401–9425. [Google Scholar] [CrossRef]
  15. Enang, W.; Bannister, C. Modelling and Control of Hybrid Electric Vehicles (a Comprehensive Review). Renew. Sustain. Energy Rev. 2017, 74, 1210–1239. [Google Scholar] [CrossRef]
  16. Liu, X.; Du, J.; Ma, J.; Liu, G.; Xiong, Y. An Adaptive Co-State Design Method for Pmp-Based Energy Management of Plug-In Hybrid Electric Vehicles Based on Fuzzy Logical Control. J. Energy Storage 2024, 102, 114118. [Google Scholar] [CrossRef]
  17. Sousa, T.; Soares, T.; Morals, H.; Castro, R.; Vale, Z. Simulated Annealing to Handle Energy and Ancillary Services Joint Management Considering Electric Vehicles. Electr. Power Syst. Res. 2016, 136, 383–397. [Google Scholar] [CrossRef]
  18. Lü, X.; Wu, Y.; Lian, J.; Zhang, Y.; Chen, C.; Wang, P.; Meng, L. Energy management of hybrid electric vehicles: A review of energy optimization of fuel cell hybrid power system based on genetic algorithm. Energy Convers. Manag. 2020, 205, 112474. [Google Scholar] [CrossRef]
  19. Chen, Z.; Xiong, R.; Cao, J. Particle Swarm Optimization-Based Optimal Power Management of Plug-in Hybrid Electric Vehicles Considering Uncertain Driving Conditions. Energy 2016, 96, 197–208. [Google Scholar] [CrossRef]
  20. Fares, D.; Chedid, R.; Karaki, S.; Jabr, R.; Panik, F.; Gabele, H.; Huang, Y. Optimal Power Allocation for A Fchv Based on Linear Programming and Pid Controller. Int. J. Hydrogen Energy 2014, 39, 21724–21738. [Google Scholar] [CrossRef]
  21. Hu, X.; Murgovski, N.; Johannesson, L.M.; Egardt, B. Optimal Dimensioning and Power Management of a Fuel Cell/Battery Hybrid Bus Via Convex Programming. IEEE/ASME Trans. Mechatron. 2014, 20, 457–468. [Google Scholar] [CrossRef]
  22. Sahwal, C.P.; Sengupta, S.; Dinh, T.Q. Advanced Equivalent Consumption Minimization Strategy for Fuel Cell Hybrid Electric Vehicles. J. Clean. Prod. 2024, 437, 140366. [Google Scholar] [CrossRef]
  23. Wang, Z.; Yin, S.; Guo, Z.; Ma, W. Adaptive Real-Time Optimal Energy Management Strategy Based on Equivalent Factors Optimization for Hybrid Fuel Cell System. Int. J. Hydrogen Energy 2021, 46, 4329–4338. [Google Scholar] [CrossRef]
  24. Li, C.; Hu, G.; Zhu, Z.; Wang, X.; Jiang, W. Adaptive Equivalent Consumption Minimization Strategy and Its Fast Implementation of Energy Management for Fuel Cell Electric Vehicles. Int. J. Energy Res. 2022, 46, 16005–16018. [Google Scholar] [CrossRef]
  25. Huang, X.; Xu, H.; Sun, H.; Chen, Y.; Huang, D. Model Predictive Control Energy Management Strategy Integrating Long Short-Term Memory and Dynamic Programming for Fuel Cell Vehicles. Int. J. Hydrogen Energy 2024, 56, 1235–1248. [Google Scholar] [CrossRef]
  26. Huang, Y.; Wang, H.; Khajepour, A.; He, H.; Ji, J. Model predictive control power management strategies for HEVs: A review. J. Power Sources 2017, 341, 91–106. [Google Scholar] [CrossRef]
  27. Trinh, H.A.; Truong, H.V.A.; Do, T.C.; Nguyen, M.H.; Phan, V.D.; Ahn, K.K. Optimization-based Energy Management Strategies for Hybrid Construction Machinery: A Review. Energy Rep. 2022, 8, 6035–6057. [Google Scholar] [CrossRef]
  28. Yilmaz, U.; Turksoy, O. Artificial Intelligence Based Active and Reactive Power Control Method for Single-Phase Grid Connected Hydrogen Fuel Cell Systems. Int. J. Hydrogen Energy 2023, 48, 7866–7883. [Google Scholar] [CrossRef]
  29. Deng, P.; Wu, X.; Yang, J.; Yang, G.; Jiang, P.; Yang, J.; Bian, X. Optimal Online Energy Management Strategy of a Fuel Cell Hybrid Bus Via Reinforcement Learning. Energy Convers. Manag. 2024, 300, 117921. [Google Scholar] [CrossRef]
  30. Ming, W.; Zhang, Z.; Qiu, W.; Du, J.; Li, X.; Zhang, Y.; Zhang, G.; Liu, K.; Wang, Y.; Guo, X. A Systematic Review of Machine Learning Methods Applied to Fuel Cells in Performance Evaluation, Durability Prediction, and Application Monitoring. Int. J. Hydrogen Energy 2023, 48, 5197–5228. [Google Scholar] [CrossRef]
  31. Sun, H.; Fu, Z.; Tao, F.; Zhu, L.; Si, P. Data-driven Reinforcement-Learning-based Hierarchical Energy Management Strategy for Fuel Cell/battery/ultracapacitor Hybrid Electric Vehicles. J. Power Sources 2020, 455, 227964. [Google Scholar] [CrossRef]
  32. Fu, Z.; Wang, H.; Tao, F.; Ji, B.; Dong, Y.; Song, S. Energy Management Strategy for Fuel Cell/Battery/Ultracapacitor Hybrid Electric Vehicles Using Deep Reinforcement Learning with Action Trimming. IEEE Trans. Veh. Technol. 2022, 71, 7171–7185. [Google Scholar] [CrossRef]
  33. Hsu, R.C.; Chen, S.M.; Chen, W.Y.; Liu, C.T. A Reinforcement Learning Based Dynamic Power Management for Fuel Cell Hybrid Electric Vehicle. In Proceedings of the 2016 Joint 8th International Conference on Soft Computing and Intelligent Systems (SCIS) and 17th International Symposium on Advanced Intelligent Systems (ISIS), Sapporo, Japan, 25–28 August 2016. [Google Scholar]
  34. Zhang, Y.; Ma, R.; Zhao, D.; Huangfu, Y.; Liu, W. A Novel Energy Management Strategy Based on Dual Reward Function Q-learning for Fuel Cell Hybrid Electric Vehicle. IEEE Trans. Ind. Electron. 2022, 69, 1537–1547. [Google Scholar] [CrossRef]
  35. Li, J.; Wang, H.; He, H.; Yang, Q.; Igic, P. Battery Optimal Sizing under a Synergistic Framework with DQN-Based Power Managements for the Fuel Cell Hybrid Powertrain. IEEE Trans. Transp. Electrif. 2021, 8, 36–47. [Google Scholar] [CrossRef]
  36. Su, Q.; Huang, R.; Zhang, Z.; Shou, Y.; He, H. Uncertainty-aware Deep Reinforcement Learning for Trainable Equivalent Consumption Minimization Strategy of Fuel Cell Hybrid Electric Tracked Vehicle. IEEE Trans. Transp. Electrif. 2025, 11, 10310–10321. [Google Scholar] [CrossRef]
  37. da Silva, S.F.; Eckert, J.J.; Correa, F.C.; Silva, F.L.; Silva, L.C.A.; Dedini, F.G. Dual HESS Electric Vehicle Powertrain Design and Fuzzy Control Based on Multi-Objective Optimization to Increase Driving Range and Battery Life Cycle. Appl. Energy 2022, 324, 119723. [Google Scholar] [CrossRef]
  38. Omakor, J.; Alzayed, M.; Chaoui, H. Particle Swarm Optimized Fuzzy Logic Energy Management of Hybrid Energy Storage in Electric Vehicles. Energies 2024, 17, 2163. [Google Scholar] [CrossRef]
  39. Ahmadi, S.; Bathaee, S.M.T.; Hosseinpour, A.H. Improving Fuel Economy and Performance of a Fuel-Cell Hybrid Electric Vehicle (Fuel-Cell, Battery, and Ultra-Capacitor) Using Optimized Energy Management Strategy. Energy Convers. Manag. 2018, 160, 74–84. [Google Scholar] [CrossRef]
  40. Subbash, P.; Chong, K.T. Adaptive Network Fuzzy Inference System Based Navigation Controller for Mobile Robot. Front. Inf. Technol. Electron. Eng. 2019, 20, 141–151. [Google Scholar] [CrossRef]
  41. Vargas, O.S.; Aldaco, S.E.D.L.; Alquicira, J.A.; Vela-Valdes, L.G.; Nunez, A.R.L. Adaptive Network-Based Fuzzy Inference System (ANFIS) Applied to Inverters: A Survey. IEEE Trans. Power Electron. 2024, 39, 869–884. [Google Scholar] [CrossRef]
  42. Li, L.; Zhang, Y.; Zhang, L.; Song, J. Correctional DP-Based Energy Management Strategy of Plug-In Hybrid Electric Bus for City-Bus Route. IEEE Trans. Veh. Technol. 2015, 64, 2792–2803. [Google Scholar] [CrossRef]
  43. Liu, X.; Ma, J.; Zhao, X.; Zhang, Y.; Zhang, K.; He, Y. Integrated Component Optimization and Energy Management for Plug-In Hybrid Electric Buses. Processes 2019, 7, 477. [Google Scholar] [CrossRef]
  44. Liu, X.; Du, J.; Cheng, X.; Zhu, Y.; Ma, J. An Adaptive Shift Schedule Design Method for Multi-Gear AMT Electric Vehicles Based on Dynamic Programming and Fuzzy Logical Control. Machines 2023, 11, 915. [Google Scholar] [CrossRef]
  45. Soto, J.; Castillo, O.; Soria, J. A New Approach for Time Series Prediction Using Ensembles of ANFIS Models. Expert Syst. Appl. 2012, 39, 3494–3506. [Google Scholar] [CrossRef]
  46. Yang, J.; Shang, C.; Li, Y.; Li, F.; Shen, L.; Shen, Q. Constructing ANFIS with Sparse Data Through Group-Based Rule Interpolation: An Evolutionary Approach. IEEE Trans. Fuzzy Syst. 2022, 30, 893–907. [Google Scholar] [CrossRef]
  47. Ghomsheh, V.S.; Shoorehdeli, M.A.; Teshnehlab, M. Training ANFIS Structure with Modified PSO Algorithm. In Proceedings of the Mediterranean Conference on Control and Automation, Athens, Greece, 27–29 June 2007. [Google Scholar]
  48. Du, J.; Zhao, X.; Liu, X.; Liu, G.; Xiong, Y. A Fuzzy Logic Control-Based Approach for Real-Time Energy Management of the Fuel Cell Electrical Bus Considering the Durability of the Fuel Cell System. World Electr. Veh. J. 2024, 15, 92. [Google Scholar] [CrossRef]
Figure 1. Architecture of the FCECV’s driveline.
Electronics 14 04601 g001
Figure 2. Motor’s efficiency MAP.
Electronics 14 04601 g002
Figure 3. Efficiency of the FCS.
Electronics 14 04601 g003
Figure 4. RINT model of the battery.
Electronics 14 04601 g004
Figure 5. Characteristics of the Battery. (a) Open circuit voltage; (b) Resistance.
Electronics 14 04601 g005
Figure 6. Optimization process of DP.
Electronics 14 04601 g006
Figure 7. DP results. (a) Driving cycle and AMT gear; (b) Power demand; (c) Power distribution.
Electronics 14 04601 g007
Figure 8. Results @ initial SOC is 0.9. (a) Battery SOC; (b) HC.
Electronics 14 04601 g008
Figure 9. Results @ initial SOC is 0.6. (a) Battery SOC; (b) HC.
Electronics 14 04601 g009
Figure 10. Results @ initial SOC is 0.3. (a) Battery SOC; (b) HC.
Electronics 14 04601 g010
Figure 11. Gear-shift schedule from DP.
Electronics 14 04601 g011
Figure 12. Framework of ANFIS-DP EMS.
Electronics 14 04601 g012
Figure 13. ANFIS architecture.
Electronics 14 04601 g013
Figure 14. ANFIS-based energy management.
Electronics 14 04601 g014
Figure 15. The dataset.
Electronics 14 04601 g015
Figure 16. The flowchart of the PSO-ANFIS.
Electronics 14 04601 g016
Figure 17. Training process.
Electronics 14 04601 g017
Figure 18. Training result.
Electronics 14 04601 g018
Figure 19. Testing result.
Electronics 14 04601 g019
Figure 20. Results of CHTC-TT @ Initial SOC = 0.9. (a) Power of FCS; (b) Change rate of the FCS’s power; (c) Battery SOC; (d) HC.
Electronics 14 04601 g020
Figure 21. Results of CHTC-TT @ Initial SOC = 0.6. (a) Power of FCS; (b) Change rate of the FCS’s power; (c) Battery SOC; (d) HC.
Electronics 14 04601 g021
Figure 22. Results of CHTC-TT @ Initial SOC = 0.3. (a) Power of FCS; (b) Change rate of the FCS’s power; (c) Battery SOC; (d) HC.
Electronics 14 04601 g022
Figure 23. Efficiency of FCS’s working points for CHTC-TT. (a) Initial SOC = 0.9; (b) Initial SOC = 0.6; (c) Initial SOC = 0.3.
Electronics 14 04601 g023
Figure 24. Test driving cycles.
Electronics 14 04601 g024
Figure 25. FCS’s power for stochastic cycles.
Electronics 14 04601 g025
Figure 26. ANFIS estimation errors across different test cycles.
Electronics 14 04601 g026
Figure 27. Change rate of the FCS’s power for stochastic cycles.
Electronics 14 04601 g027
Figure 28. Battery SOCs for stochastic cycles.
Electronics 14 04601 g028
Figure 29. Efficiency of FCS’s operating points for stochastic cycles.
Electronics 14 04601 g029
Figure 30. HC for stochastic cycles.
Electronics 14 04601 g030
Table 1. Summary of related works and novelty of this study.
CategoryMethodKey IdeaMain ChallengeOur Solution
Global OptimizationDP/PMP [15,16]Global optimum with full cycle infoOffline only; not real-timeUse DP data to train ANFIS model
Real-time
Optimization
ECMS [23,24]Instantaneous optimization via EFSensitive to factor calibrationANFIS learns optimal solution directly
MPC [25,26]Predictive control with previewHigh computation; needs accurate predictionNo prediction model; uses current states only
Learning-BasedRL/DQN [31,32]Learn policy through interactionNeeds lots of data; discrete actionsSupervised learning with DP data; continuous actions
Fuzzy LogicFLC [9,12]Expert rules; robustFixed rules; not optimalANFIS auto-tunes rules and parameters
FLC+EA [37,38,39]Optimize FLC with evolutionary algorithmsNo global benchmark; local optimaTrain with global DP optimum; use PSO
Table 2. Powertrain parameters of the studied FCECV.
ComponentsParametersValuesUnits
VehicleCurb mass25,000kg
Gross mass49,000kg
Tire radius0.534m
Windward area8.366m2
Drag coefficient0.53-
Max. velocity89km/h
MotorPeak power320kW
Peak speed2200rpm
Peak torque2400N·m
TransmissionSpeed ratio8.456/4.913/2.976/-
1.915/1.238/1.000
FCSPeak power123.18kW
Rated power120kW
Peak current680A
BatteryNominal capacity100A · h
Rated voltage529.92V
Table 3. Comparison of the two strategies.
Initial SOCStrategiesTerminal SOCHC (g)Improvements of HC (%)
0.9CD-CS0.214110621.16
DP0.219872
0.6CD-CS0.215208213.98
DP0.2191791
0.3CD-CS0.21031951.94
DP0.2193133
Table 4. Change rate of FCS’s power based on CHTC-TT.
ItemsChange Rate of the Power (kW/s)
SOC = 0.9SOC = 0.6SOC = 0.3
Max.Min.St.D.Max.Min.St.D.Max.Min.St.D.
DP120.03 114.67 16.70120.03 114.67 22.99123.18 123.18 35.87
CD-CS123.18 123.18 19.21123.18 123.18 30.41123.18 123.18 25.92
ANFIS12.30 12.30 5.6012.30 12.30 7.4112.30 12.30 7.73
Table 5. Comparison of energy consumption for CHTC-TT.
ItemsTerminal SOCHC (g)
SOC = 0.9SOC = 0.6SOC = 0.3SOC = 0.9SOC = 0.6SOC = 0.3
DP0.2190.2190.21987217913133
CD-CS0.2140.2150.210110620823195
ANFIS0.2590.2120.21196519163185
Improvement
@ HC (%)
DP vs. CD-CS21.1613.981.94
ANFIS vs. CD-CS13.207.970.31
ANFIS vs. DP 10.67 6.98 1.66
Table 6. Working characteristics of FCS for CHTC-TT.
ItemsInitial SOCFCS Power (kW)Percentage @ Working Points (%)Distribution of Efficiency (%)
PeakMean η f c 50 % η f c 45 %
DP0.9120.0329.4866.2269.6398.74
0.6120.7256.8877.8933.5995.58
0.3123.1891.4878.333.4813.83
CD-CS0.9123.1828.3624.94027.39
0.6123.1850.0546.61040.88
0.3123.1866.6572.50050.27
ANFIS0.9119.4730.3748.8330.9489.08
0.6123.1853.3881.1139.7980.55
0.3123.1872.2996.5024.7664.25
Table 7. FCS’s working characteristics.
CyclesItemsFCS Power (kW)Starting-TimeProportion (%)
PeakMeanSt.D.(s)Working PointsPeak Power
No.1DP123.1839.8741.3539260.140.51
CD-CS123.1841.2049.78124642.2313.78
ANFIS123.1840.2538.0351277.822.55
No.2DP123.1828.8737.4019444.450.03
CD-CS123.1825.6846.2495324.4513.32
ANFIS123.1827.3732.9824075.901.82
No.3DP123.1835.4742.8713550.650.16
CD-CS123.1829.0749.44131026.4216.74
ANFIS123.1830.3838.5488670.395.29
No.4DP120.7232.1938.948849.610.42
CD-CS123.1831.7248.12109831.4512.63
ANFIS123.1831.5135.9740574.923.34
Table 8. Change rate of FCS’s power for stochastic cycles.
Items Change Rate of the Power (kW/s)
No.1No.2No.3No.4Mean
DPMax.123.18120.49120.54120.72121.23
Min. 123.18 120.99 119.45 120.72 121.09
St.D.27.7317.5016.9316.3619.63
CD-CSMax.123.18123.18123.18123.18123.18
Min. 123.18 123.18 123.18 123.18 123.18
St.D.34.1619.2518.6918.6322.68
ANFISMax.12.3012.3012.3012.3012.30
Min. 12.30 12.30 12.30 12.30 12.30
St.D.7.445.235.225.605.87
Table 9. Comparison of terminal SOCs.
ItemsTerminal SOCs
No.1No.2No.3No.4MeanSt.D.
DP0.2350.2330.2300.2040.22550.0145
CD-CS0.2240.2150.2110.2370.22180.0115
ANFIS0.2190.2140.2150.2040.21030.0064
Table 10. Distribution of working efficiency.
Items η fc 45 % ( % ) η fc 50 % ( % )
DPCD-CSANFISDPCD-CSANFIS
No.194.7065.2283.7739.92040.29
No.297.3645.0493.4633.91060.11
No.387.8634.3179.6337.66048.93
No.495.4056.8283.3239.79049.03
Mean93.8350.3585.0537.82049.59
Table 11. Comparison of HCs.
ItemsHC (g)Improvement (%)
DPCD-CSANFISDP vs. CD-CSANFIS vs. CD-CSANFIS vs. DP
No.132853952355616.8810.02 8.25
No.217142145178720.0916.69 4.26
No.324042892245916.8714.97 2.29
No.421802847232823.4318.23 6.79
Mean23962959235319.3214.98 5.40
Table 12. Comparison of computing time.
ItemsCycle Duration (s)Computing Time (s)Improvement (%)
DPCD-CSANFISANFIS vs. DPANFIS vs. CD-CS
No.1475283.4864.4962.86196.5736.37
No.2346060.8662.8782.72995.525.18
No.3386072.0273.4102.70896.2420.59
No.4380067.8713.3312.70596.0118.79
Mean396871.0633.5292.75196.1322.05
Disclaimer/Publisher’s Note: The statements, opinions and data contained in all publications are solely those of the individual author(s) and contributor(s) and not of MDPI and/or the editor(s). MDPI and/or the editor(s) disclaim responsibility for any injury to people or property resulting from any ideas, methods, instructions or products referred to in the content.