1. Introduction
The realm of traditional digital finance has long been the cornerstone of modern economic systems, facilitating the seamless flow of capital across international borders. Governed by central banks and financial institutions, these structures aid monetary transactions, asset management, and credit services through heavily regulated, centralized architectures [
1]. While effective in providing financial stability, these traditional systems often utilize complex, multi-layered processes and numerous intermediaries, leading to inefficiencies such as high transaction costs, time-consuming money transfers, and a general lack of flexibility that can delay innovation [
2]. Additionally, the centralized nature of traditional financial systems makes them particularly susceptible to systemic risks, including fraud, cyber-attacks, and data breaches, which not only pose significant financial threats but also undermine public confidence in centralized financial systems [
3,
4].
In response to the limitations of traditional financial systems and asset management, blockchain technology has emerged as a significant innovation, transforming the way transactions are executed. Built on a decentralized framework, blockchain technology offers a scalable, transparent, and immutable transaction record-keeping approach, inherently resistant to manipulation [
5]. This mechanism ensures the integrity of transaction data and facilitates the traceability and verification of each user interaction. By eliminating the necessity for third-party oversight, blockchain technology reduces transaction costs and increases processing limits, significantly improving the efficiency of monetary exchanges. A key element enabling these properties is the underlying decentralized consensus mechanism, which coordinates how multiple distributed nodes agree on the validity of the transactions. By requiring economic (Proof-of-Stake) or computational (Proof-of-Work) commitments from validators and enforcing a common block selection rule, these protocols ensure that all honest nodes converge on a consistent state, making large-scale ledger manipulation or double-spending economically infeasible [
6].
The influence of blockchain technology extends well beyond the financial sector, affecting areas such as healthcare by securing patient records [
7], or intellectual property management, by verifying the authenticity and ownership [
8,
9]. One of the most notable advancements enabled by blockchain technology is the development of smart contracts, offering a mechanism to execute and enforce agreements autonomously [
10]. Smart contracts automate transactions and contractual agreements by reducing the need for intermediaries and thereby decreasing transaction times and costs. Moreover, by encoding contract terms on the blockchain, these smart contracts ensure that all parties to the contract adhere to the agreed terms without the possibility of dispute.
Blockchain technology has played a pivotal role in the introduction and development of both fungible and non-fungible digital assets, fundamentally transforming asset management and ownership [
11]. Cryptocurrencies such as Bitcoin and Ethereum are prime examples of fungible assets, characterized by the interchangeability of each unit with others of the same type. This fungibility ensures their viability as a medium for commercial transactions and value storage. In contrast, Non-Fungible Tokens (NFTs) represent a unique class of digital assets with blockchain technology providing a robust transaction framework for their indisputable ownership [
12]. NFTs have rapidly gained prominence by facilitating the tokenization of a wide array of unique digital and tangible assets, ranging from artwork and musical compositions to virtual real estate and beyond [
13,
14].
The economic significance of blockchain technology is further underscored by the substantial growth in market capitalization and trading volumes observed in both the cryptocurrency and NFT markets. Moreover, the liquidity of these markets has improved with the introduction of numerous platforms [
15] that facilitate the trading of both fungible and non-fungible blockchain digital assets. These platforms enhance market accessibility, while contributing significantly to price discovery and market efficiency.
As blockchain technology and ecosystem continue to mature and expand, its unique attributes of anonymity and decentralization have inevitably become a fertile ground for cybercriminals. These malicious actors intentionally exploit the system’s features to engage in illegal activities, from executing complex fraudulent schemes [
16,
17] to the dissemination of malware and the initiation of security breaches [
18]. Also, as technology and fraudulent schemes advance, detecting fraud within the blockchain becomes increasingly challenging and complex.
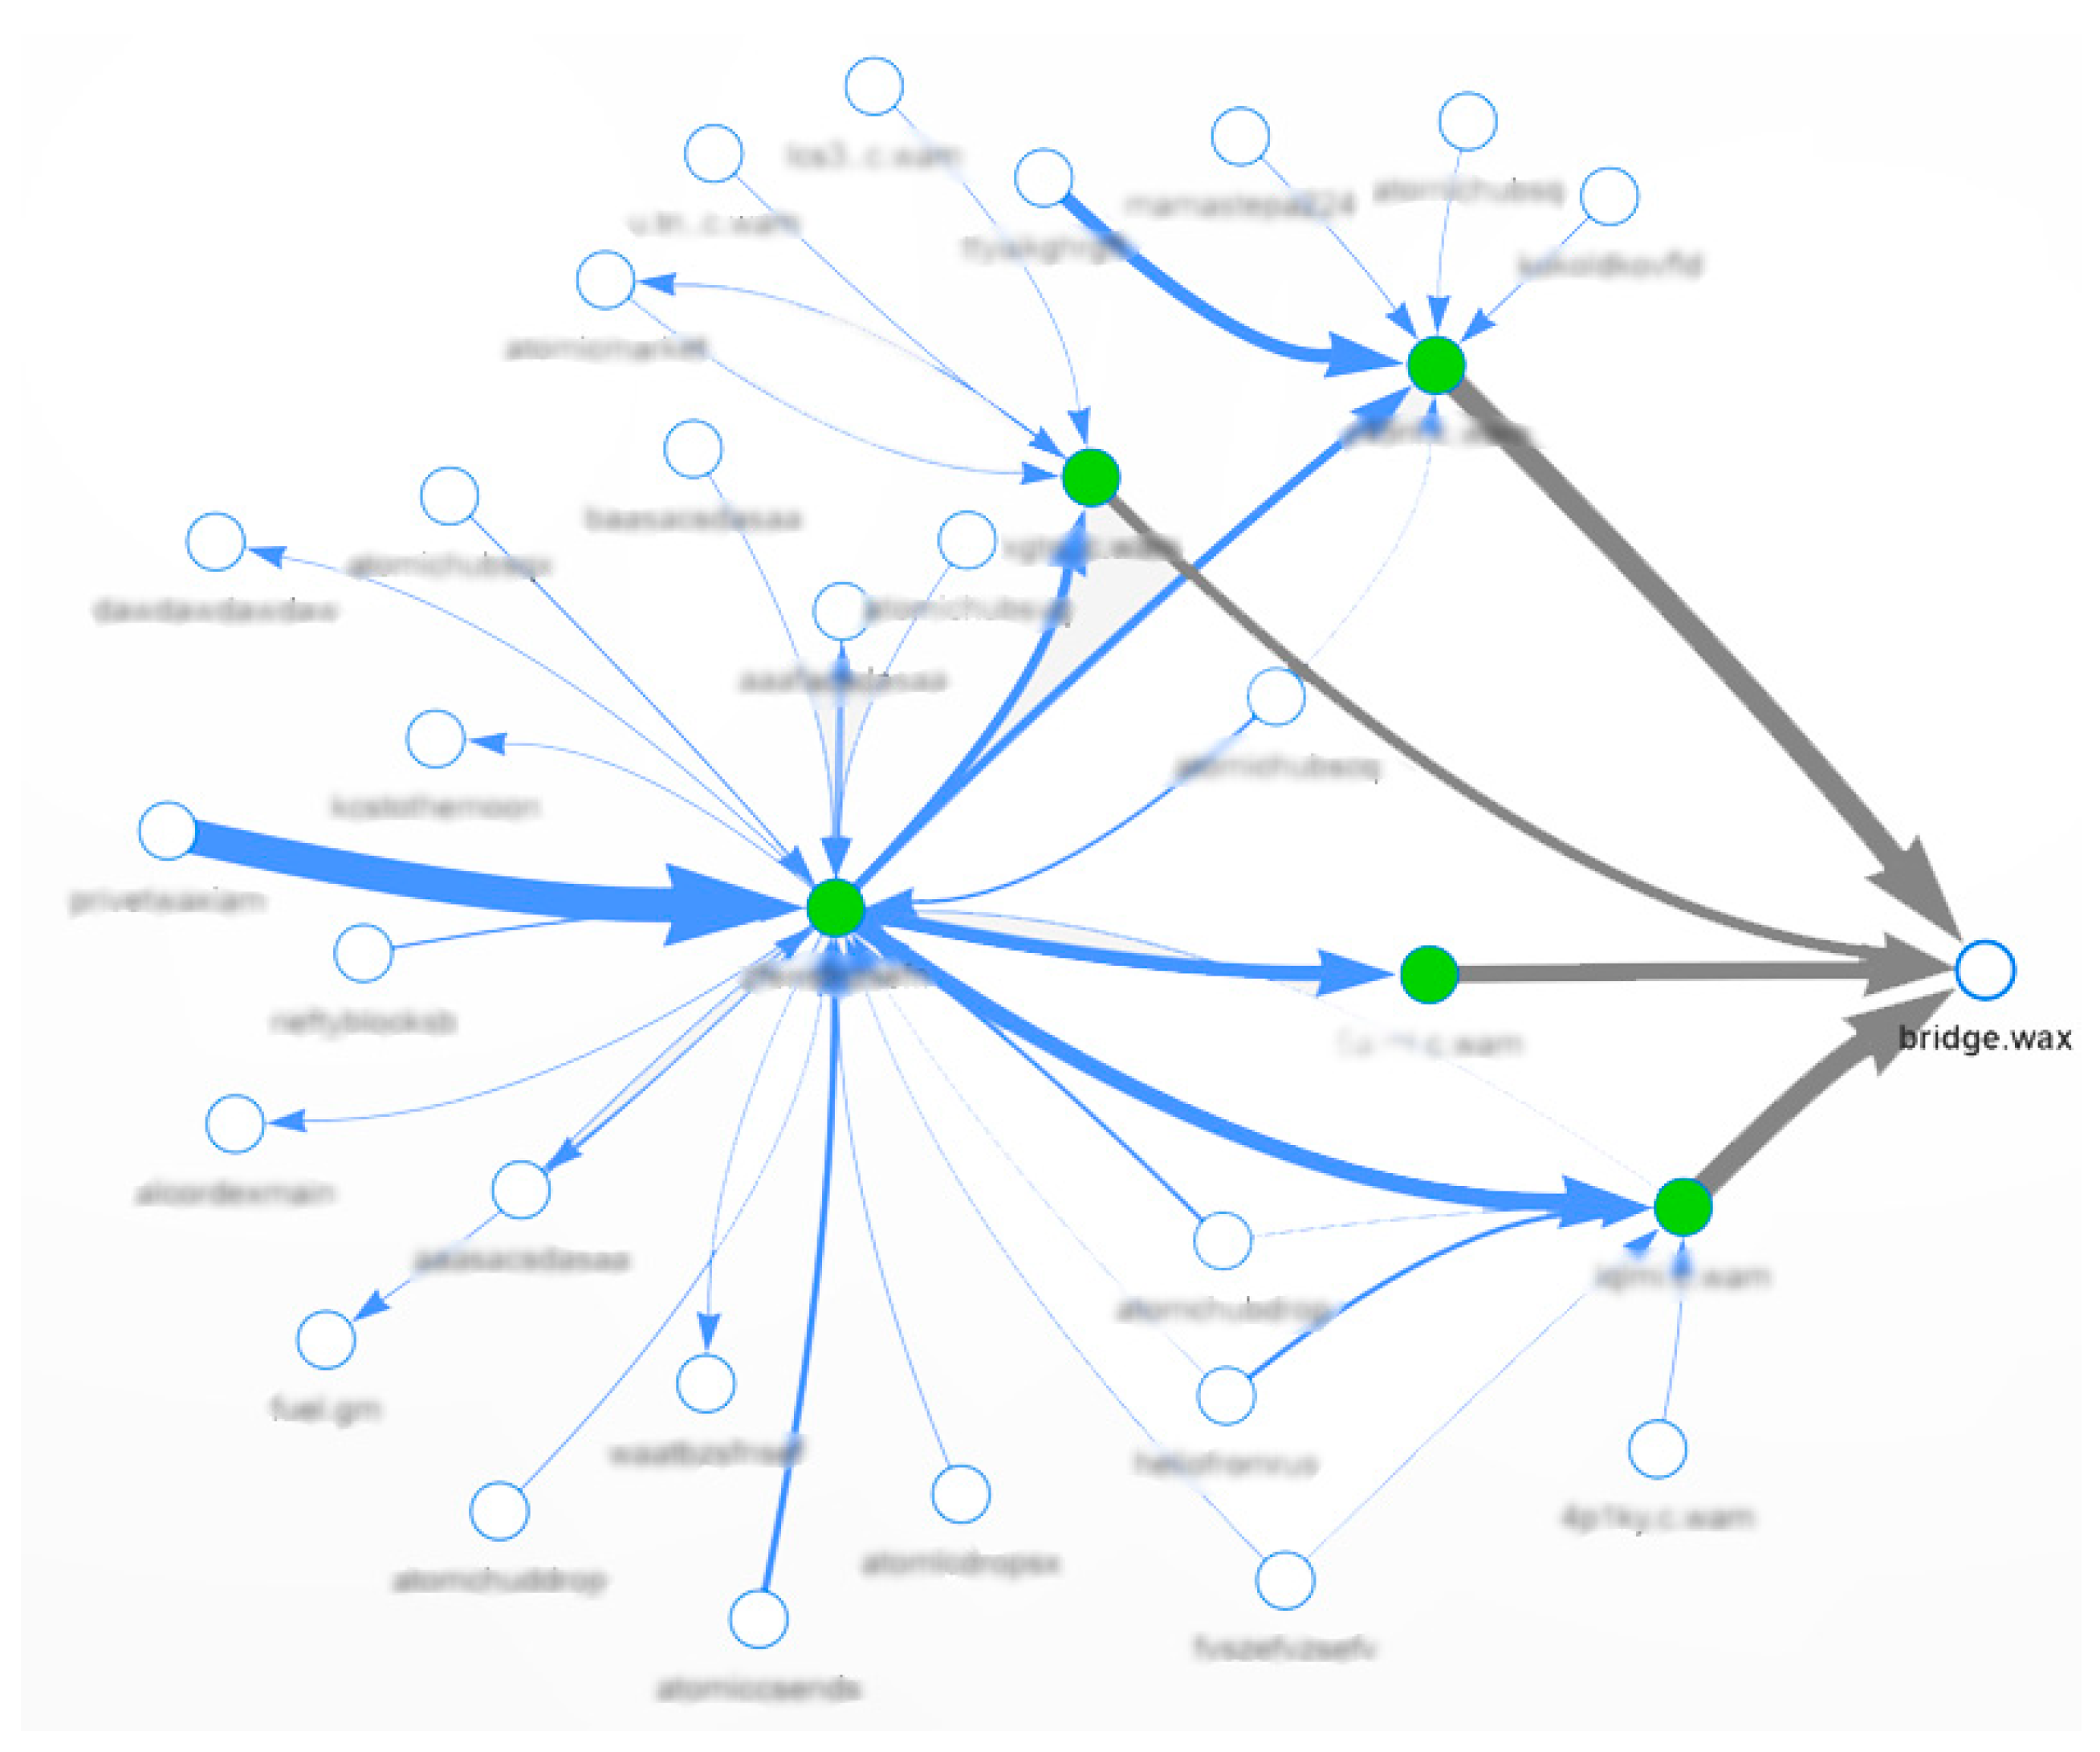
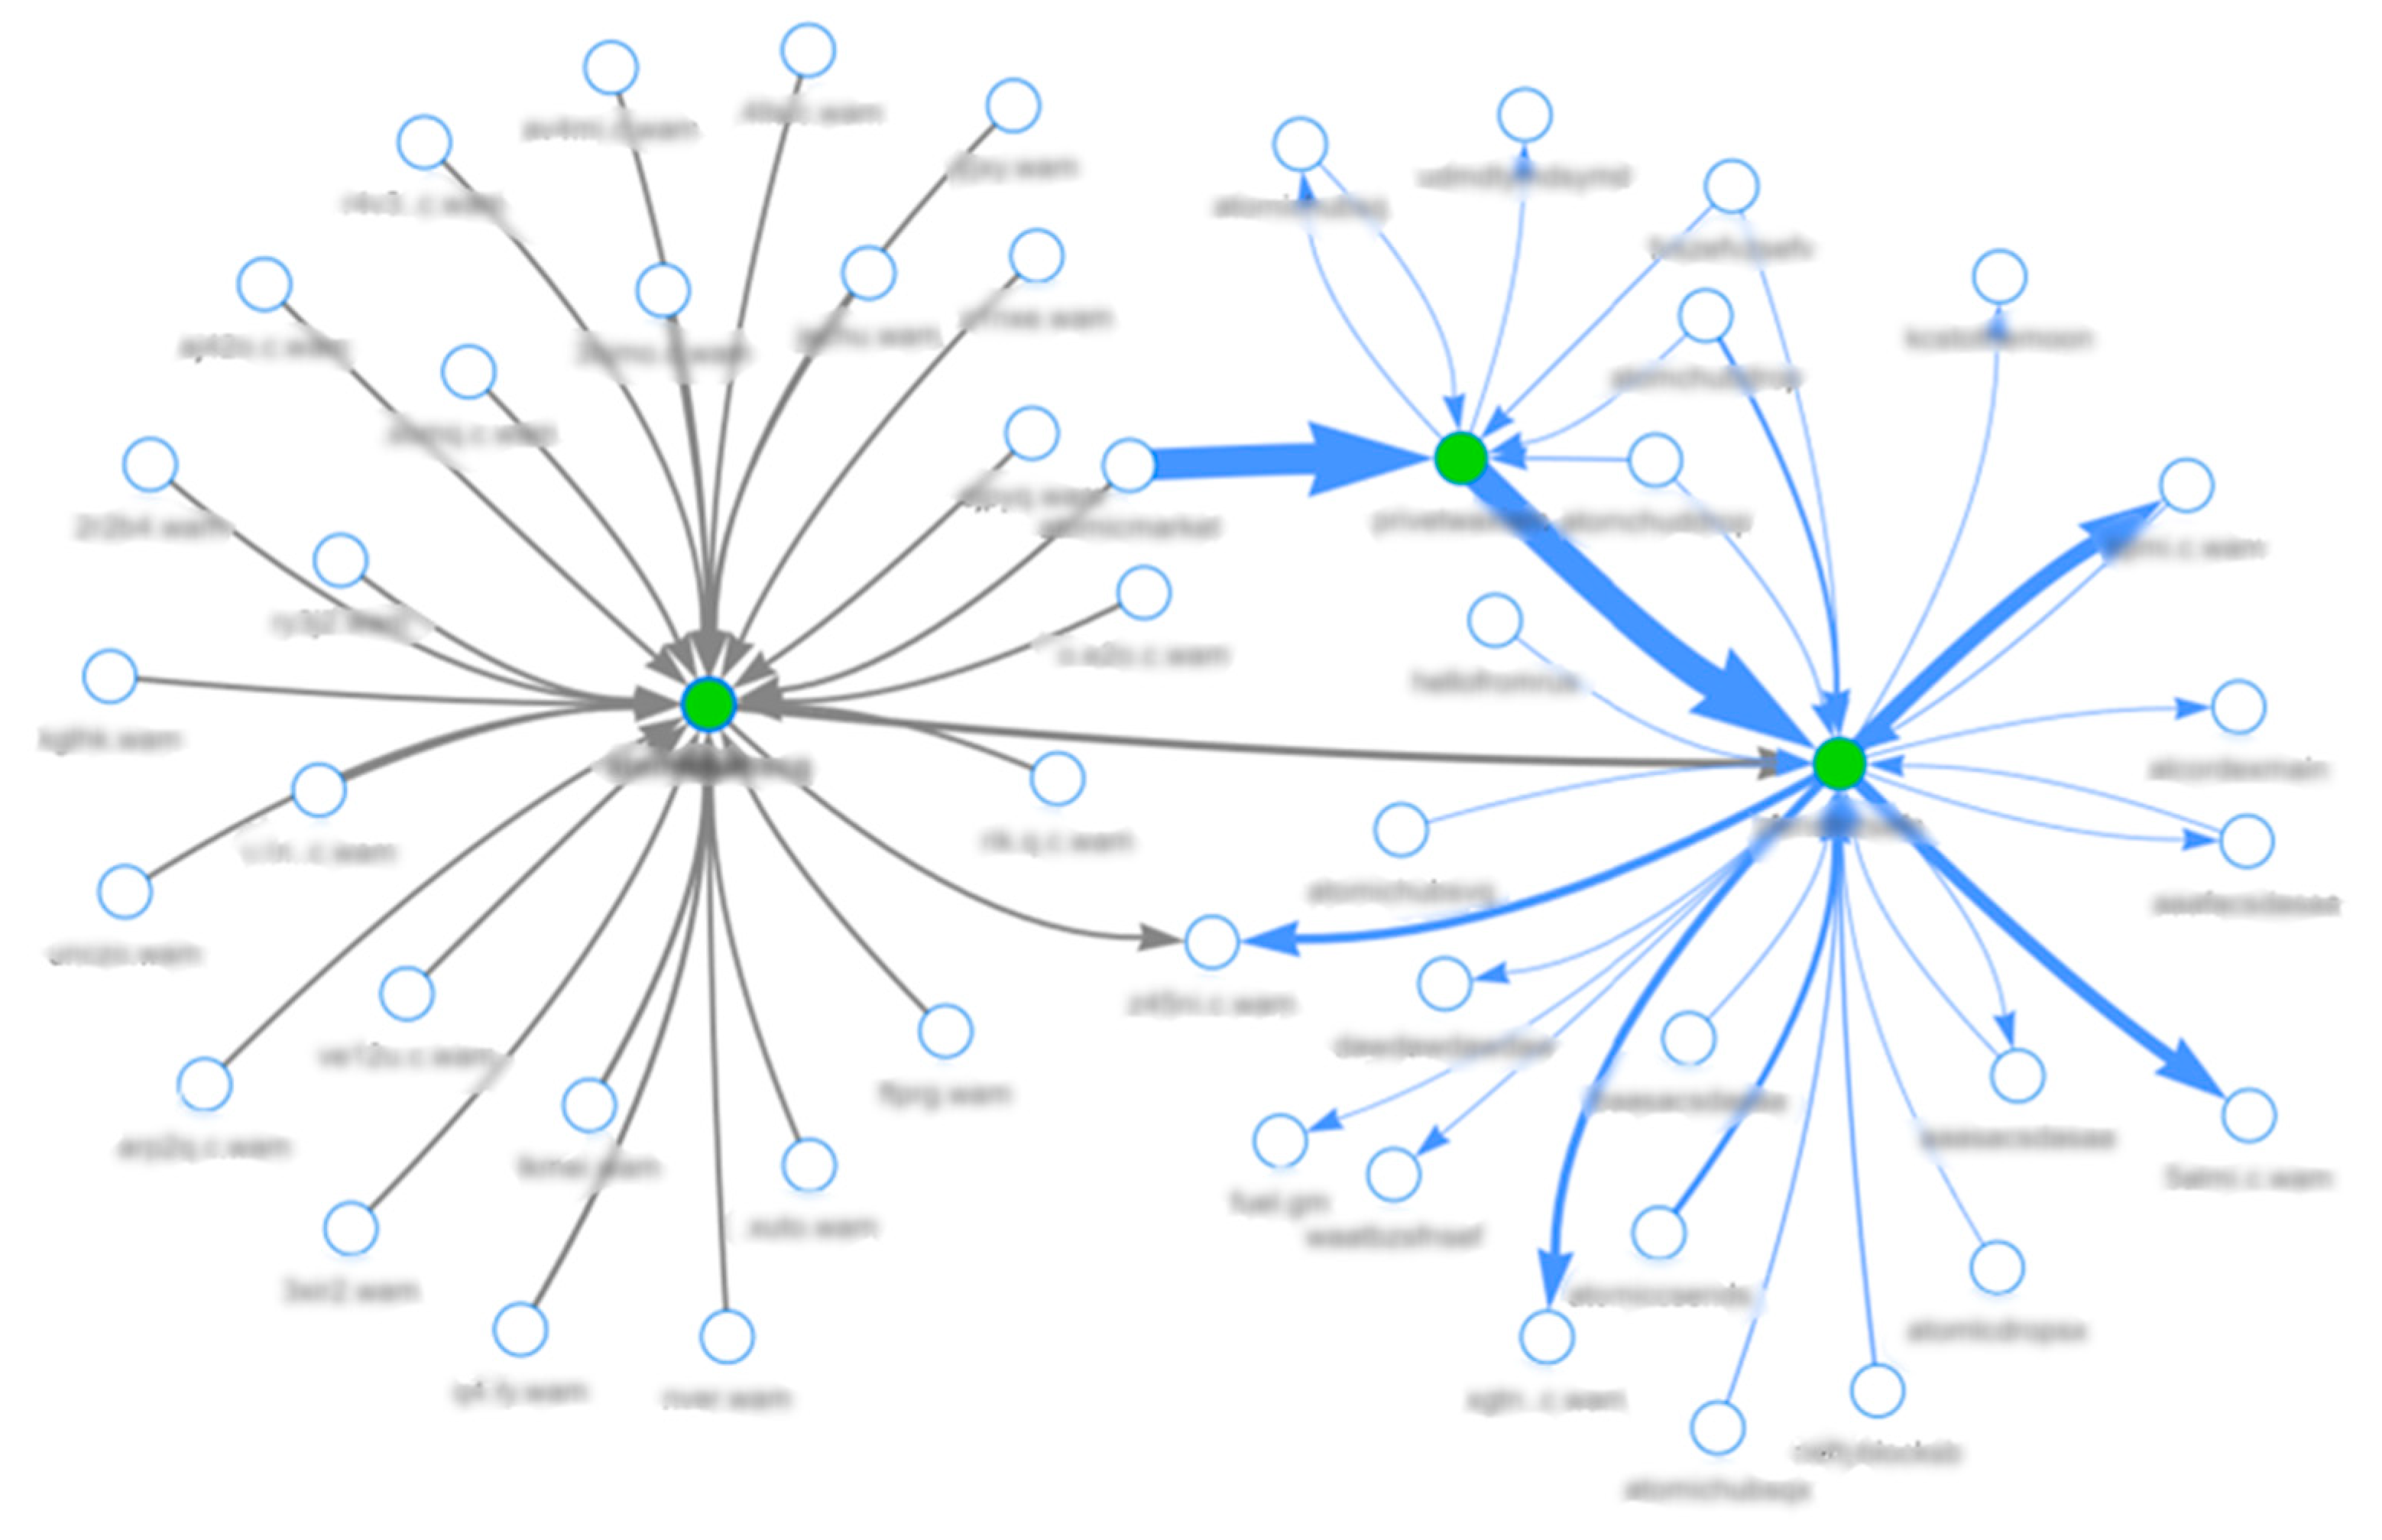
Among the most disruptive of these illicit activities, phishing attacks are particularly prevalent. Phishing exploits the blockchain’s pseudonymity by deceiving users into exposing sensitive key credentials or making unauthorized transactions. Cybercriminals often create sophisticated fake websites or social media profiles that mimic trusted entities such as popular cryptocurrency exchanges [
19] or wallet providers. Unsuspecting users, lured by the appearance of legitimacy, may enter private keys or initiate transfers that grant attackers direct access to their assets. These phishing schemes often exhibit a clear pattern of transferring funds into a set of intermediary wallets and subsequently routing through blockchain bridges to other networks in order to obfuscate tracing efforts (
Figure 1). The irreversible nature of blockchain transactions means that once funds are misappropriated, the likelihood of recovery is minimal, resulting in substantial financial losses.
This paper provides an in-depth exploration of the complexities inherent in fraudulent behavior in blockchain ecosystems, with a particular emphasis on the growing prevalence of NFTs. By leveraging state-of-the-art machine learning algorithms and graph-based representation learning, the proposed approach aims primarily at fungible and non-fungible assets transactions to detect and classify suspicious and fraudulent activities. To address the challenges of data scale, temporal dynamics, and severe class imbalance, this paper makes the following contributions:
Dynamic subgraph sampling framework for WAX blockchain transaction network, where accounts are represented as nodes and transactions as time-stamped edges. The framework constructs temporally ordered, account-centric subgraphs that capture both local structural context and short-term transactional dynamics within the ledger. By focusing computation on high-relevance neighborhoods around candidate accounts and prioritizing graph regions with elevated fraud risk, this design supports scalable learning on large graphs under severe class imbalance.
The representation learning component employs a Graph Attention Network (GAT) to encode the structural neighborhood of each account and an LSTM layer to capture temporal dependencies in its transaction history. The resulting embeddings are optimized with a triplet-based contrastive loss, encouraging intra-class compactness and inter-class separation between fraudulent and legitimate accounts.
Building on the learned embeddings, this paper introduces a hybrid detection pipeline that combines a supervised classifier with multiple unsupervised anomaly detection models. Classifier outputs and anomaly scores are aggregated into a unified ranking of potentially suspicious accounts, supporting effective prioritization in label-scarce environments characteristic of blockchain investigations.
3. System Architecture
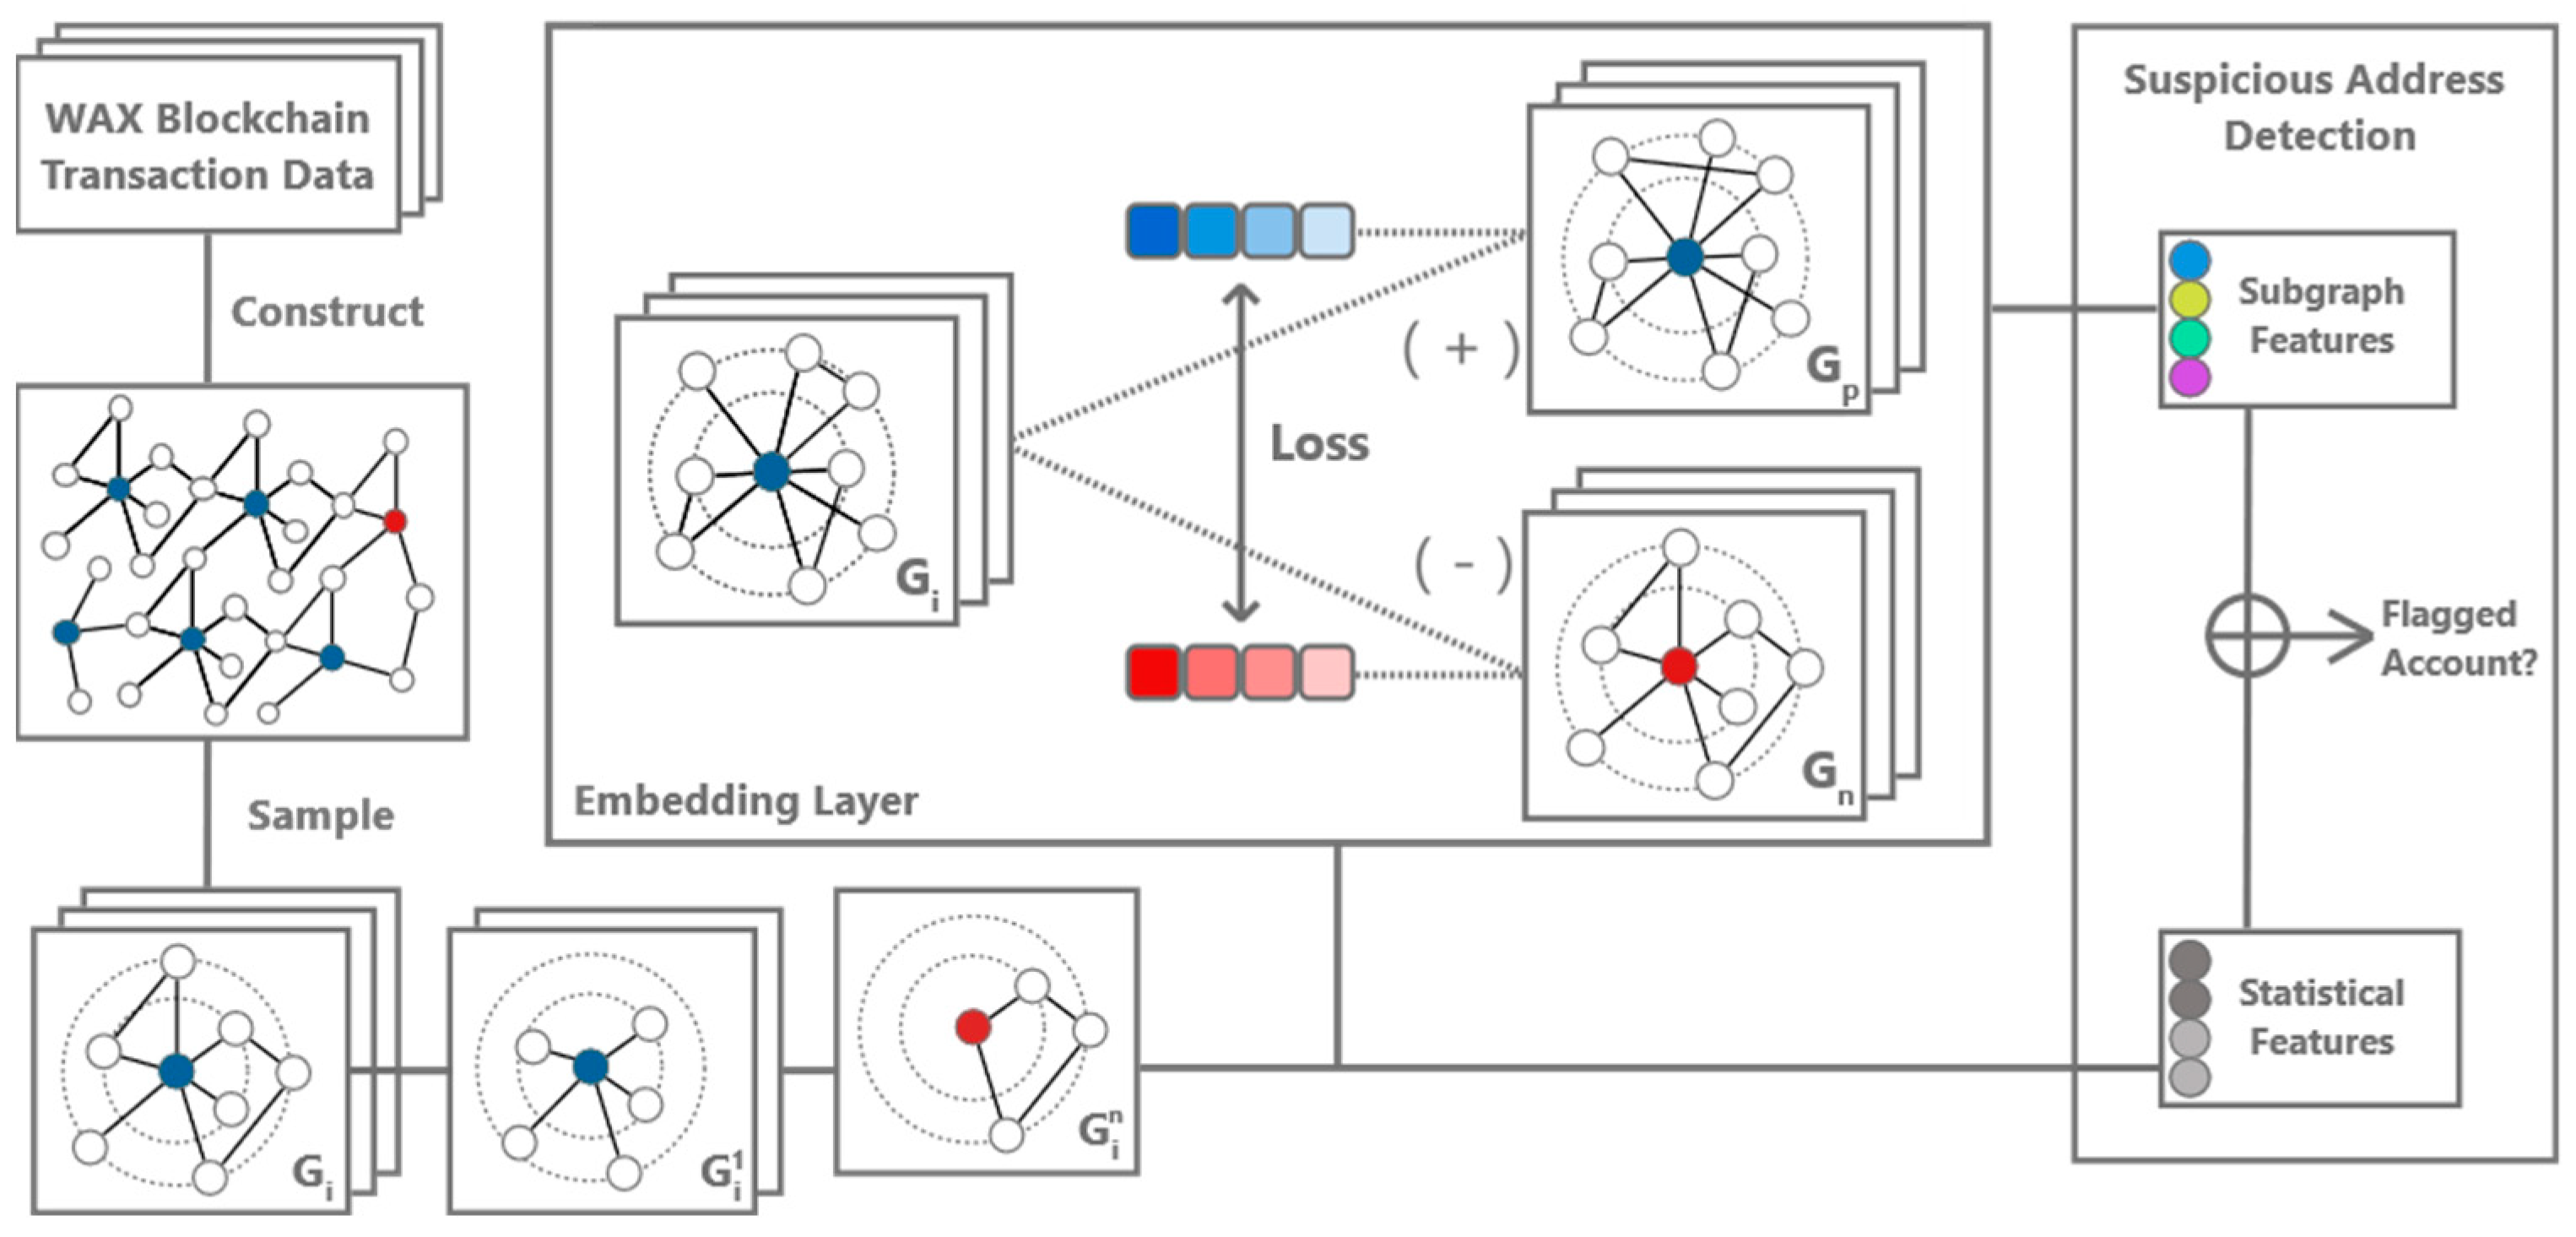
The architecture of the proposed system (
Figure 2) is founded upon a comprehensive analysis of blockchain transactions, aimed at identifying and categorizing suspicious and fraudulent activities. This initiative is driven by the objectives of enhancing trust and transparency among all participants within blockchain networks. By integrating machine learning approaches with principles of graph representation learning, the model seeks to identify transaction patterns within blockchain ecosystems, differentiating legitimate users from potentially malicious actors.
The system’s architecture is structured as a multi-step process, with each stage designed to build upon the insights and data transformations provided by its predecessors. The initial phase focuses on the comprehensive collection and systematic organization of blockchain transaction data. This step involves the aggregation of transaction records, their transformation into a structured format, and quantification of the monetary value of transactions in selected timestamps to a unified format, suitable for further processing. After initial data collection, the system advances to a data preprocessing stage, dedicated to the cleaning of the dataset from missing values, the extraction of relevant features, and normalization to ensure uniformity. Following the data preprocessing, an advanced graph-based representation of the transaction data is constructed. This dynamic graph representation, which evolves in response to ongoing blockchain transactions, maps accounts to nodes and transactions to edges.
The next step involves feature preprocessing and dynamic subgraph generation. During this phase, the model extracts and processes the graph features that are essential for identifying fraudulent patterns. These features include transaction frequencies, monetary values, and characteristics that are intrinsic to each node and edge within the graph.
Subgraph generation is a strategy employed to manage the complexity and size of the final blockchain transaction graph. By creating subgraphs, the model isolates segments of the network that are statistically significant. Segmental processing allows the system to handle large, imbalanced datasets efficiently, focusing computational resources on the selected sections of the graph. A fundamental layer of the system is the embeddings generation, which involves encoding the complex features of the transaction subgraphs into a dense, lower-dimensional space. Contrastive learning is applied to fine-tune these embeddings by contrasting similar and dissimilar transaction class samples. Such an approach significantly enhances the model’s discriminative capabilities within large imbalanced datasets with very low occurrence of minority class samples.
The final phase of the model architecture is dedicated to decision making. By utilizing advanced approaches such as supervised learning and anomaly detection, the proposed system classifies accounts as fraudulent or legitimate based on the distinct patterns encoded in the embeddings.
3.1. Transaction Graph Construction
The construction of a transaction graph begins with the acquisition of raw transaction data from the blockchain network. The acquisition process involves interaction with the selected blockchain’s public nodes for cryptocurrency transactions and NFT transfers. These public APIs serve as gateways to the extensive ledger of historical transaction records, enabling the retrieval of data samples. To ensure comprehensive coverage, the data is collected over multiple extended periods, capturing a wide array of transaction types. The retrieved transaction data, which includes sender and receiver addresses, transaction amounts, and timestamps, are essential for further analysis.
A foundational aspect of transaction graph construction involves a primary differentiation between transaction types, specifically distinguishing between those involving fungible assets and those involving NFTs. By categorizing transactions based on their type, the system can better quantify the monetary value of each transaction, for accurately assessing the economic impact. For transactions involving fungible assets, the monetary value is assessed by converting the value of cryptocurrencies into a standard metric using exchange rates from publicly available sources. This asset conversion process is necessary because different cryptocurrencies can have varying prices and quantities. By standardizing these values, the transaction graph ensures a consistent quantification of monetary value across various types of fungible cryptocurrency transactions and stable coins.
Given the unique nature of each NFT on the market and the considerable fluctuations in their values, transactions involving NFTs necessitate a different approach. NFTs often represent high-value items such as digital art, collectibles, or virtual real estate, and their value can vary significantly. NFTs generally involve more complex transaction processes compared to fungible assets. Therefore, an essential part of preprocessing these transactions is the accurate assessment of the transaction cost for each transfer. It is achieved by determining the average price of the NFT during the transfer window, incorporating data from historical sale records and current market trends. When a direct sale occurs, the sale price is linked to the NFT transaction to ensure precision and to maintain a compact, consistent monetary valuation across all fungible and non-fungible transactions.
Following the acquisition of transaction data, the next step involves the transformation of this data into a graph representation. This representation takes the form of a directed graph, where nodes correspond to individual accounts on the blockchain network, and edges symbolize transactions between these accounts.
3.2. Subgraph Sampling
The main objective of subgraph sampling within the system architecture is the generation of dynamic subgraphs centered around selected nodes, capturing transaction activities within specific time frames. Given the vast scale and complexity of blockchain transaction graphs, analyzing the entire network at once is computationally intensive and may not yield usable insights. Subgraph sampling targets a manageable yet informative portion of the graph, focusing on areas around selected nodes (
Figure 3).
Dynamic subgraphs for selected nodes are created by systematically filtering the transaction history associated with each node. This process involves segmenting the transaction data by time intervals, which are determined through clustering of timestamps. Each cluster corresponds to a time slice containing selected transactions. As a result, each generated subgraph represents a temporal snapshot of the transactional ecosystem surrounding the node within a defined time window, effectively capturing the dynamics of the neighborhood.
Generating multiple subgraphs for each central node facilitates the identification of patterns that may not be evident in a static analysis. This method enhances the ability to detect suspicious activities by incorporating a temporal context, allowing for the observation of changes in a node’s behavior over time. Employing this dynamic approach to subgraph sampling ensures the system’s scalability and efficiency, even during processing extensive and complex blockchain networks.
3.3. Graph Feature Preprocessing
The preprocessing of node features within the transaction graph is a crucial step in transforming raw transaction data into a structured format that is amenable to machine learning algorithms. This process involves extraction, filtration, aggregation, and normalization of features from both nodes and their connecting edges. The primary task in feature preprocessing is the extraction and calculation of relevant features for each node. These features encompass various dimensions of user’s transactional behavior and network connectivity, including the following:
Transaction Volume: The total amount of transferred assets to and from the selected node, split into incoming and outgoing transaction volumes.
Degree Information: The degree of a node, divided into in-degree (number of incoming transactions) and out-degree (number of outgoing transactions).
Unique Transaction Neighbors: Involves quantifying the number of distinct entities a node interacts with by counting the unique senders and receivers associated with the node.
To enhance the representation, the Recency, Frequency, and Monetary (RFM) variables are widely considered effective tools, as they are frequently used in traditional financial fraud detection scenarios [
60]:
Recency: The time between the last ongoing transaction and the end of the interval.
Frequency: The number of transactions involving the node within a given period.
Monetary: The total value of transactions involving the node within a given period.
The preprocessing phase also extends to the attributes of edges connecting the nodes. Edges in the transaction graph are annotated with transaction amounts, timestamps, and types, reflecting the flow and nature of assets transferred between nodes.
3.4. Embedding Generation
The embedding generation in the proposed system represents a pivotal component that transforms the high-dimensional feature space of the subgraph-based representations into a compact, and lower-dimensional space suitable for further processing. This transformation is achieved using a hybrid combination of GATs and LSTM networks. These two approaches together build an embedding model capable of capturing the complex relationships within the transaction subgraphs and the temporal dynamics across different states.
The initial stage of the embedding generation process employs multiple GAT layers, which are pivotal for their ability to handle the irregular structure of graph data through attention mechanisms. Each node in a subgraph is processed using an attention mechanism that computes the weights of edges connecting to nodes in neighborhood. This attention mechanism allows the model to focus on the most relevant parts of the graph dynamically, emphasizing features that are more predictive of the central node’s behavior. To ensure the stability of the learning process and to capture information from various representations of the data, the GAT layers utilize multiple attention heads. Each head independently computes attention weights and node features, which are then combined to provide a comprehensive representation of each node’s local neighborhood.
Following the extraction of spatial features by the GAT layers, the embeddings are passed into an LSTM network to capture temporal dependencies and dynamics. The LSTM layer processes sequences of node embeddings generated for each time-sliced subgraph, allowing the model to capture temporal patterns and dependencies across different states of the graph. Each time slice corresponds to a specific temporal window, allowing the LSTM to track and learn from the progression and evolution of node states over time. By modeling structural and temporal dependencies, the proposed GAT–LSTM approach attains a higher representational capacity than either component in isolation. The temporally aware embeddings produced by the LSTM are further processed to reduce dimensionality and prepare for downstream tasks such as contrast learning and the final fraudulent address classification.
3.5. Learning Process
The model training process for the proposed architecture, aimed at analyzing blockchain transactions for suspicious account detection, leverages a contrastive loss mechanism to fine-tune the embedding generation process. This approach enhances the model’s discrimination capabilities by focusing on differences between similar pairs (positive) and dissimilar (negative) node pair examples. The application of contrastive learning specifically addresses the challenges posed by class imbalance common in blockchain transaction data, where fraudulent nodes are vastly outnumbered by legitimate ones.
By focusing on representative and informative triplets, contrastive learning ensures that even a limited amount of labeled data from the minority class can effectively enhance the model’s detection capabilities. The cornerstone of the learning process is the utilization of a contrastive loss mechanism, designed to optimize the model by enhancing the distinction between embeddings of fraudulent and non-fraudulent nodes.
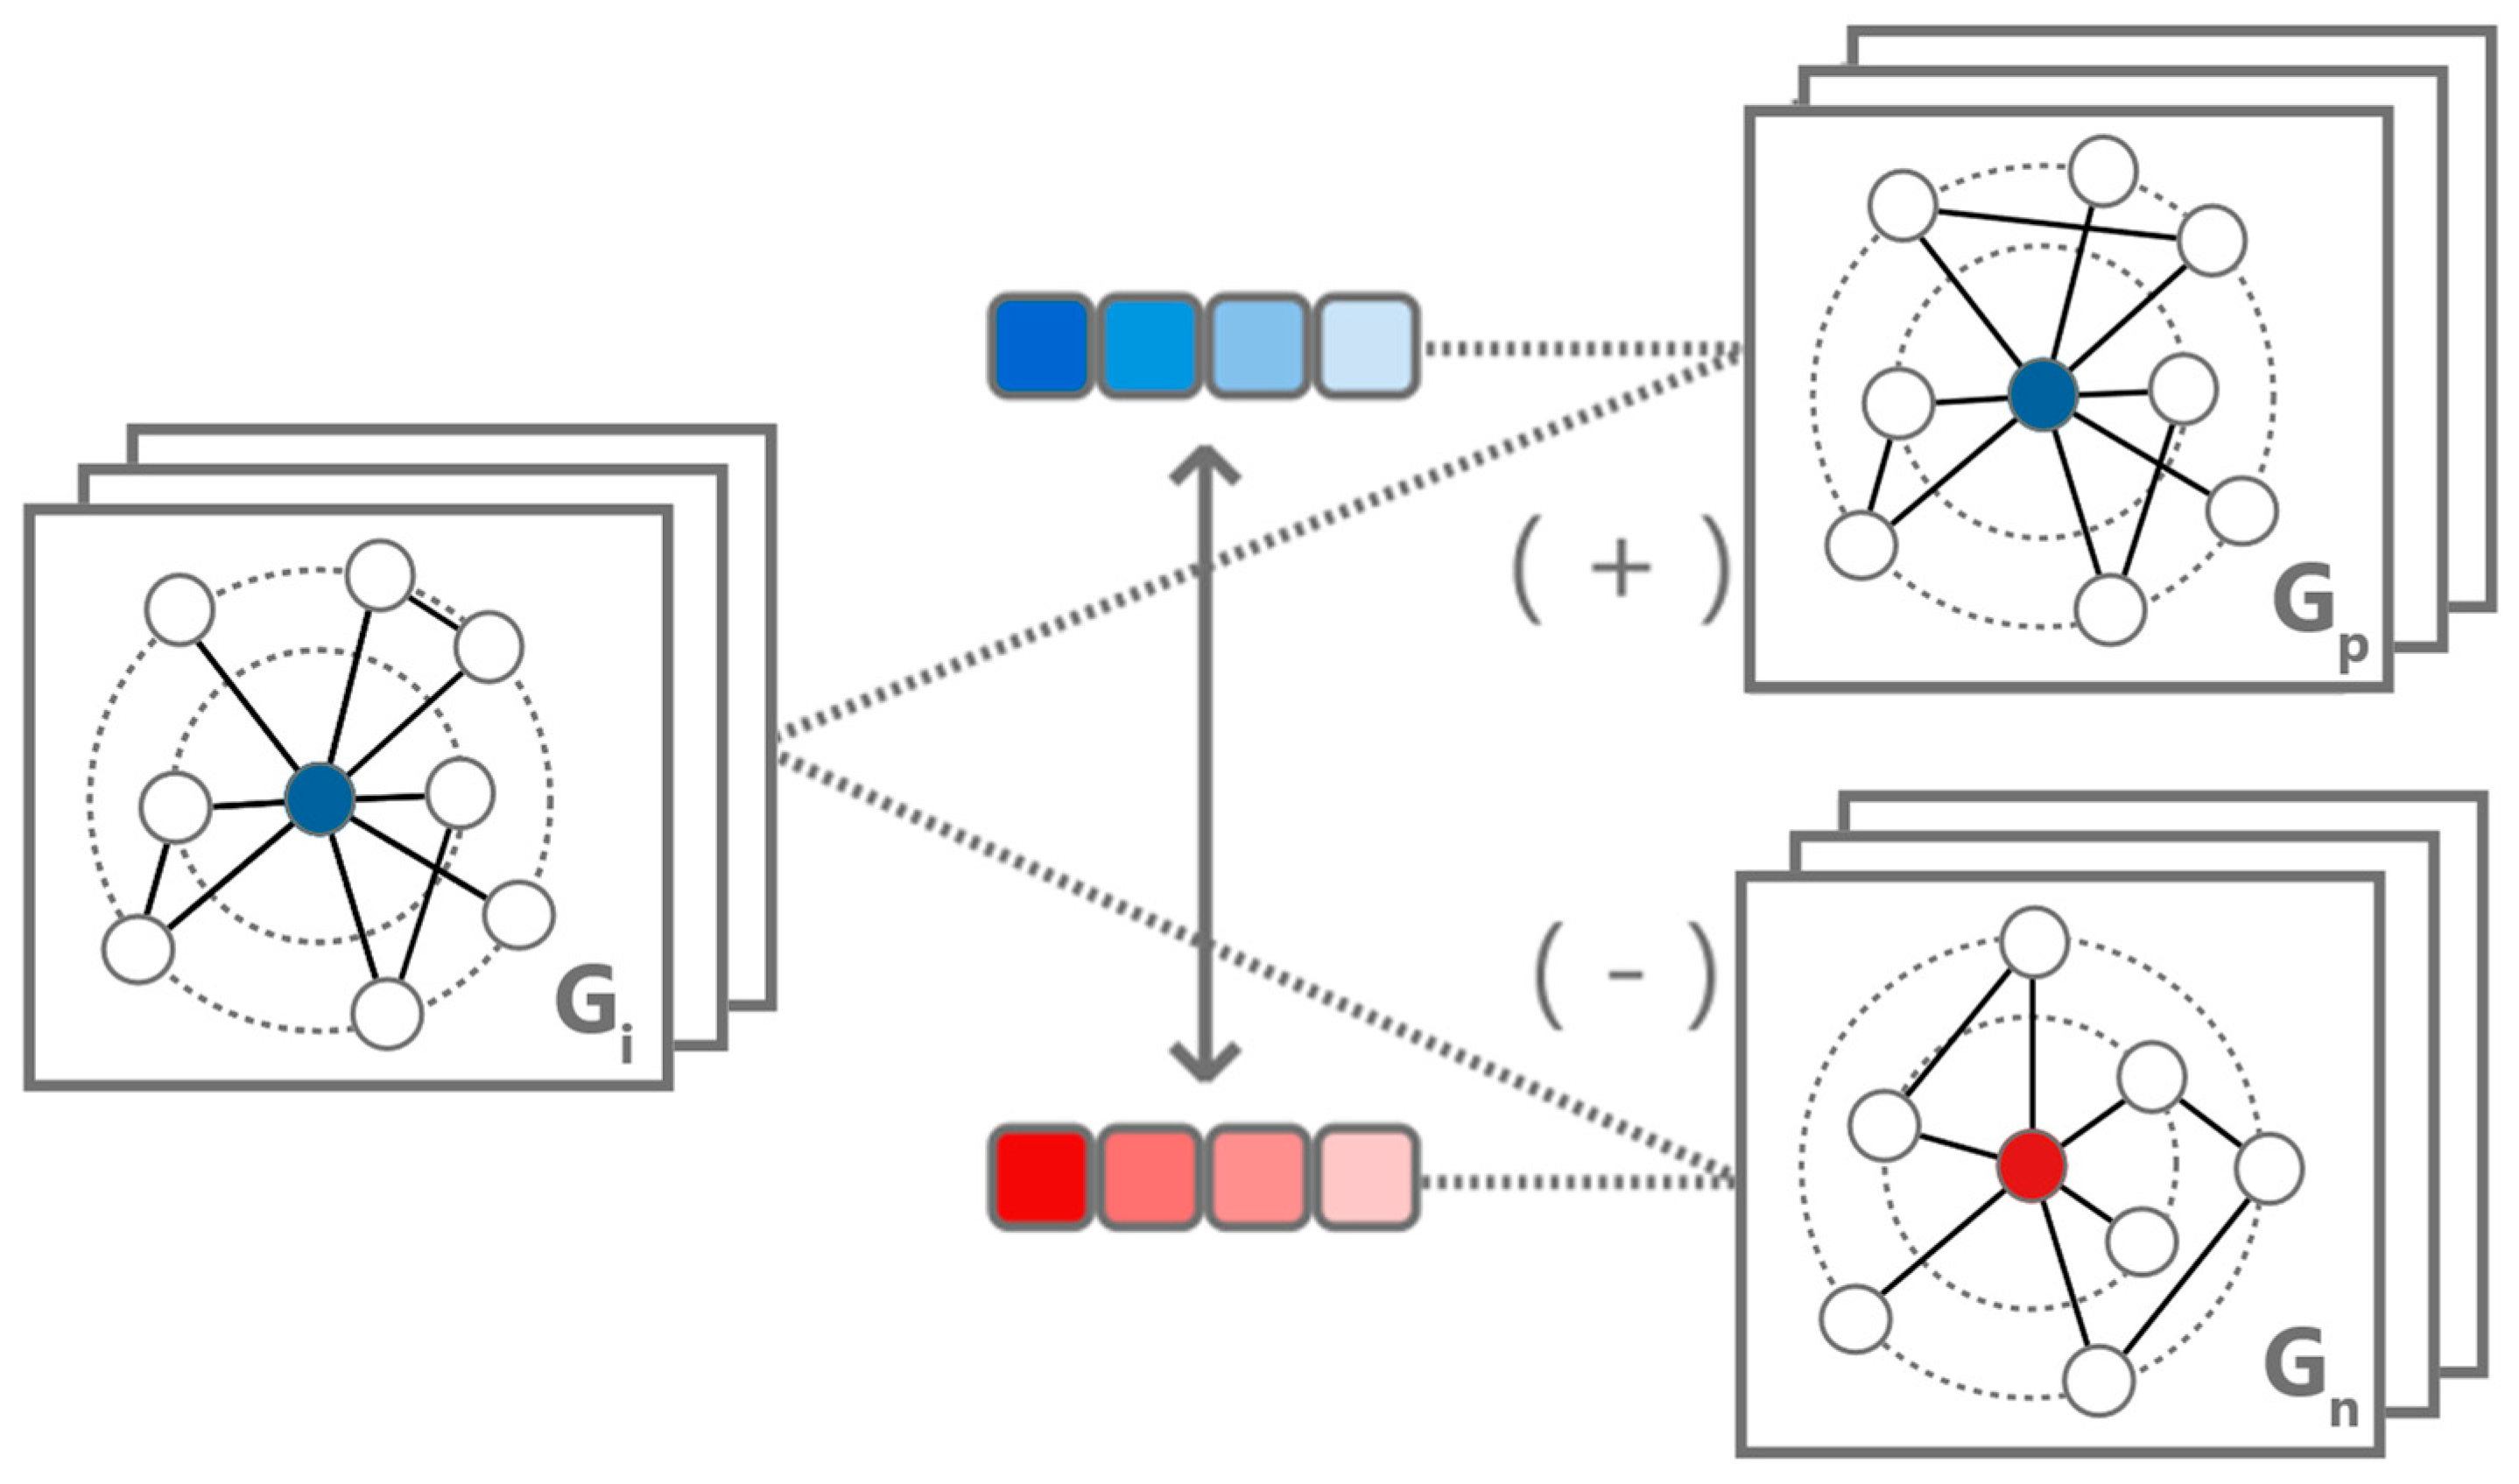
Central to the contrastive learning strategy is the use of triplet loss (
Figure 4). This approach involves three key elements: anchor (a node under examination), a positive sample (a node like the anchor), and a negative sample (a node dissimilar from the anchor). The anchor and positive sample share the same class, while the negative sample belongs to the opposite class. The triplet loss function is designed to decrease the distance between the anchor and the positive sample while increasing the distance between the anchor and the negative sample in the embedding space, enhancing the separability between classes.
Through this refined contrastive learning approach, the model undergoes a continuous self-enhancement process. The optimization of the contrastive loss function leads to a more robust graph embedding space where the proximity of embeddings accurately reflects the positive similarity in node behavior, thereby clustering similar behaviors more closely and pushing dissimilar ones farther apart.
3.6. Fraudulent Address Classification
The classification of fraudulent addresses represents the final component in the detection of suspicious activities within blockchain transaction graph. This phase employs the embeddings generated from transaction data, incorporating the static and dynamic features of transactions, to classify nodes as either fraudulent or legitimate. The classification process is underpinned by traditional machine learning models that are trained on labeled embedding data, where each node is marked as fraudulent or non-fraudulent based on historical evidence and analysis.
In the evaluation of various machine learning models for classifying suspicious accounts, the focus has been primarily on their performance in accurately identifying minority class nodes. A diverse set of algorithms was considered, including XGBoost [
61] or SVM. However, the Random Forest [
62] was chosen for implementation within this system due to its capabilities in managing high-dimensional data and class imbalance. Random Forest, an ensemble learning method that combines multiple decision trees, is particularly noted for its effectiveness in classification accuracy. The strength of this model lies in its ensemble approach which averages the outputs of individual decision trees, thereby reducing the potential for overfitting.
4. Experiments
Within the diverse landscape of blockchain platforms, the Worldwide Asset Exchange (World Asset Exchange (WAX) blockchain:
https://www.wax.io/ (accessed on 10 April 2025)) (WAX) blockchain diversifies itself with features specifically designed for blockchain gaming and trading virtual assets, particularly NFTs. Utilizing a delegated proof-of-stake consensus mechanism with 21 block producers, the WAX blockchain offers a specialized environment tailored for the dynamics of NFT markets. A defining feature of the WAX blockchain platform is its integration of the Atomic Assets (AtomicAssets:
https://github.com/pinknetworkx/atomicassets-contract (accessed on 10 April 2025)) standard for NFT utilities. This protocol establishes a uniform framework for the creation, purchase, sale, and exchange of digital assets across decentralized applications. It ensures seamless interoperability among applications and services, facilitating the broad adoption and functional expansion of digital collectibles. The Atomic Assets standard also enforces a standardized method for recording these transactions, enhancing the transparency, reliability and consistency of data for analytical processes.
Additionally, the WAX blockchain’s implementation of short cryptocurrency wallet addresses significantly improves the user accessibility by simplifying transaction processes and reducing the cognitive load associated with managing complex wallet addresses. Another notable advantage of the WAX ecosystem is its elimination of transaction fees, which serves as a significant incentive for frequent and voluminous trading activities. This unique feature is relatively rare in blockchain ecosystems and is pivotal in promoting active user interaction. The absence of fees not only stimulates trading activities but also generates extensive transactional data, providing a rich resource for in-depth analysis of network behaviors and transactional dynamics.
These distinctive characteristics make the WAX blockchain an exemplary platform for conducting experimental research into user transaction behaviors within decentralized digital marketplaces, especially in the evolving and dynamic landscape of NFTs and blockchain gaming. Although this study focuses on WAX blockchain, the proposed fraud-detection framework is not restricted to this network. Any account or address-based blockchain with a transactional history can be transformed into a transaction graph and processed by dynamic subgraph sampling.
4.1. Dataset Creation
Given the scarcity and challenges associated with obtaining robust and accurately labeled data for blockchain fraud detection, the proposed system involves the establishment of a Hyperion History API (Hyperion History API:
https://github.com/eosrio/hyperion-history-api (accessed on 10 April 2025)) targeting the WAX blockchain. As specialized node enables data collection from specific smart contracts, enhancing the capability to monitor a wide range of data and standards across the blockchain network. This systematic approach facilitates the acquisition of a diverse transaction dataset, which currently encompasses over 5 million accounts. Every record within the dataset includes several distinct attributes, providing details about each transaction. The attributes include the following:
simple_actions.transaction_id: Unique identifier for each stored transaction, enabling the tracking and analysis of individual transactions across the network.
simple_actions.timestamp: The execution timestamp of the transaction.
simple_actions.data.from: The sender of the transaction.
simple_actions.data.to: The recipient of the transaction.
simple_actions.data.amount: The amount involved in the transaction, providing a quantitative value.
simple_actions.data.symbol: The currency token symbol, which indicates the type of asset transferred.
simple_actions.data.memo: Information included by the sender, serving as a description of the transaction.
For the transaction dataset construction, approximately 9000 accounts have been identified and incorporated based on their blacklisting by AtomicHub (AtomicHub Digital Asset Marketplace:
https://atomichub.io/ (accessed on 17 November 2025)) smart contracts due to fraudulent activities. Additionally, 450 accounts were selected from the WAX fraud prevention database (Wax Fraud Prevention:
https://github.com/wax-fraud-prevention/ (accessed on 17 November 2025)), which is maintained by the community and regularly updated with new instances of reported activities. The dataset was further enriched by analyzing transactions associated with these blacklisted and suspicious accounts to determine their periods of activity. Correspondingly, normal nodes active within previously identified periods were also included to ensure a comprehensive representation of network behavior.
To facilitate diverse experimental scenarios and validate the effectiveness of the detection approach, multiple datasets (
Table 1) were constructed by random walks to simulate real-world conditions. These datasets vary by the number of nodes and the proportion of labeled instances, reflecting different levels of class imbalance typical in the context of fraud detection scenarios.
4.2. Experimental Setup
To assess the efficacy of the proposed detection model, a robust experimental setup was implemented to ensure the reliability of the findings. Cross-validation [
63] is employed to train and evaluate learning algorithms by dividing data into distinct sets for training and validation. This approach is beneficial in datasets characterized by class imbalances as it optimizes the usage of available labeled data by stratified selection for training and validation while ensuring that the model’s performance is not biased and accurately reflects the ability to generalize across unseen data. For each dataset, accounts are partitioned into k = 10 equally sized subsets while preserving the fraud/legitimate ratio in each selection. At each iteration, one-fold represents the test set, and the remaining k − 1 folds form the training pool. This approach reduces dependence on a single arbitrary split and makes the evaluation more robust in the presence of severe class imbalance, with the reported metrics reflecting the average performance across all k folds.
In the evaluation process, a range of machine learning models was systematically deployed. It included feature-based methods relying only on node attributes, reflecting a straightforward approach. Additionally, graph representation learning techniques such as Node2Vec which incorporates topological information of the network, and advanced deep learning-based methods like GAT and GraphSage [
64].
The performance of the previously mentioned models was quantitatively measured using three metrics specifically chosen to address the high imbalance in the dataset and real-world fraud scenarios [
65]. Recall measures the percentage of actual fraudulent nodes correctly identified by the model. Precision assesses the proportion of nodes classified as fraudulent that are indeed fraudulent. Additionally, F1-score is a harmonic mean of precision and recall, providing a single metric that balances both aspects. A high F1-score for the minority class indicates that the model maintains a good balance between correctly identifying fraudulent nodes and minimizing false positives.
The model architecture utilizes two GAT layers. Each layer uses 32 hidden units incorporating four attention heads to diversify the focus on various subgraph parts. Architectural choices were determined via a grid search on D1. For the GAT were considered {1, 2, 3} layers, {16, 32, 64} hidden units, and {2, 4, 8} attention heads. The configuration with two GAT layers, 32 hidden units, four attention heads per layer achieved the best minority-class F1-score on D1 and was subsequently reused for D2–D4. For training, a batch size of 128 is used to balance computational efficiency and effective learning. The model is optimized using the Adam optimizer, initialized with a learning rate of 0.01. To fine-tune the learning process, a learning rate scheduler is employed, reducing the learning rate if no improvement in validation loss is observed.
All models were implemented in Python (3.10) using PyTorch (2.1.0) and standard graph-learning libraries. Experiments were conducted on a dedicated server equipped with a single GPU with 32 GB of device memory, a 2.10 GHz multi-core CPU, and 128 GB of RAM. Table entries marked “OOM” indicate that the corresponding full-graph method ran out of GPU memory on this device.
4.3. Under-Sampled Scale Dataset Results
The evaluation of the proposed fraud detection model on minor scale datasets provides valuable insights into its performance under different conditions of data scarcity and class imbalance. These smaller datasets, designed to mimic real-world scenarios with limited labeled data, serve as a manageable scale for assessing the model’s robustness and adaptability. The datasets used for this evaluation consist of D1, D2, D3 (
Table 2), reflecting a label percentage of 0.35%. Each dataset encompasses various distribution of transaction records, including those from wax fraud database and normal nodes, ensuring a representative sample of the WAX blockchain transaction behavior. By focusing on nodes exhibiting moderate levels of connectivity, we eliminated outliers that could potentially negatively impact the analysis. This filtration ensured that the focus remained on the most relevant entities without smart contracts, to understand the network’s fraudulent and non-fraudulent behaviors.
The results of the evaluation on these manageable minor scale datasets highlight the effectiveness of the model’s contrastive learning approach. Despite the limited number of labeled instances, the model demonstrates a strong ability to differentiate between fraudulent and legitimate nodes. The use of contrastive loss ensures that even a sparse amount of labeled data is sufficient to significantly enhance the model’s discriminative capabilities. The proposed method achieves the best performance at about 95.50% F1-score, 95.81% Recall and 95.19% precision under the D3 dataset for the minority class.
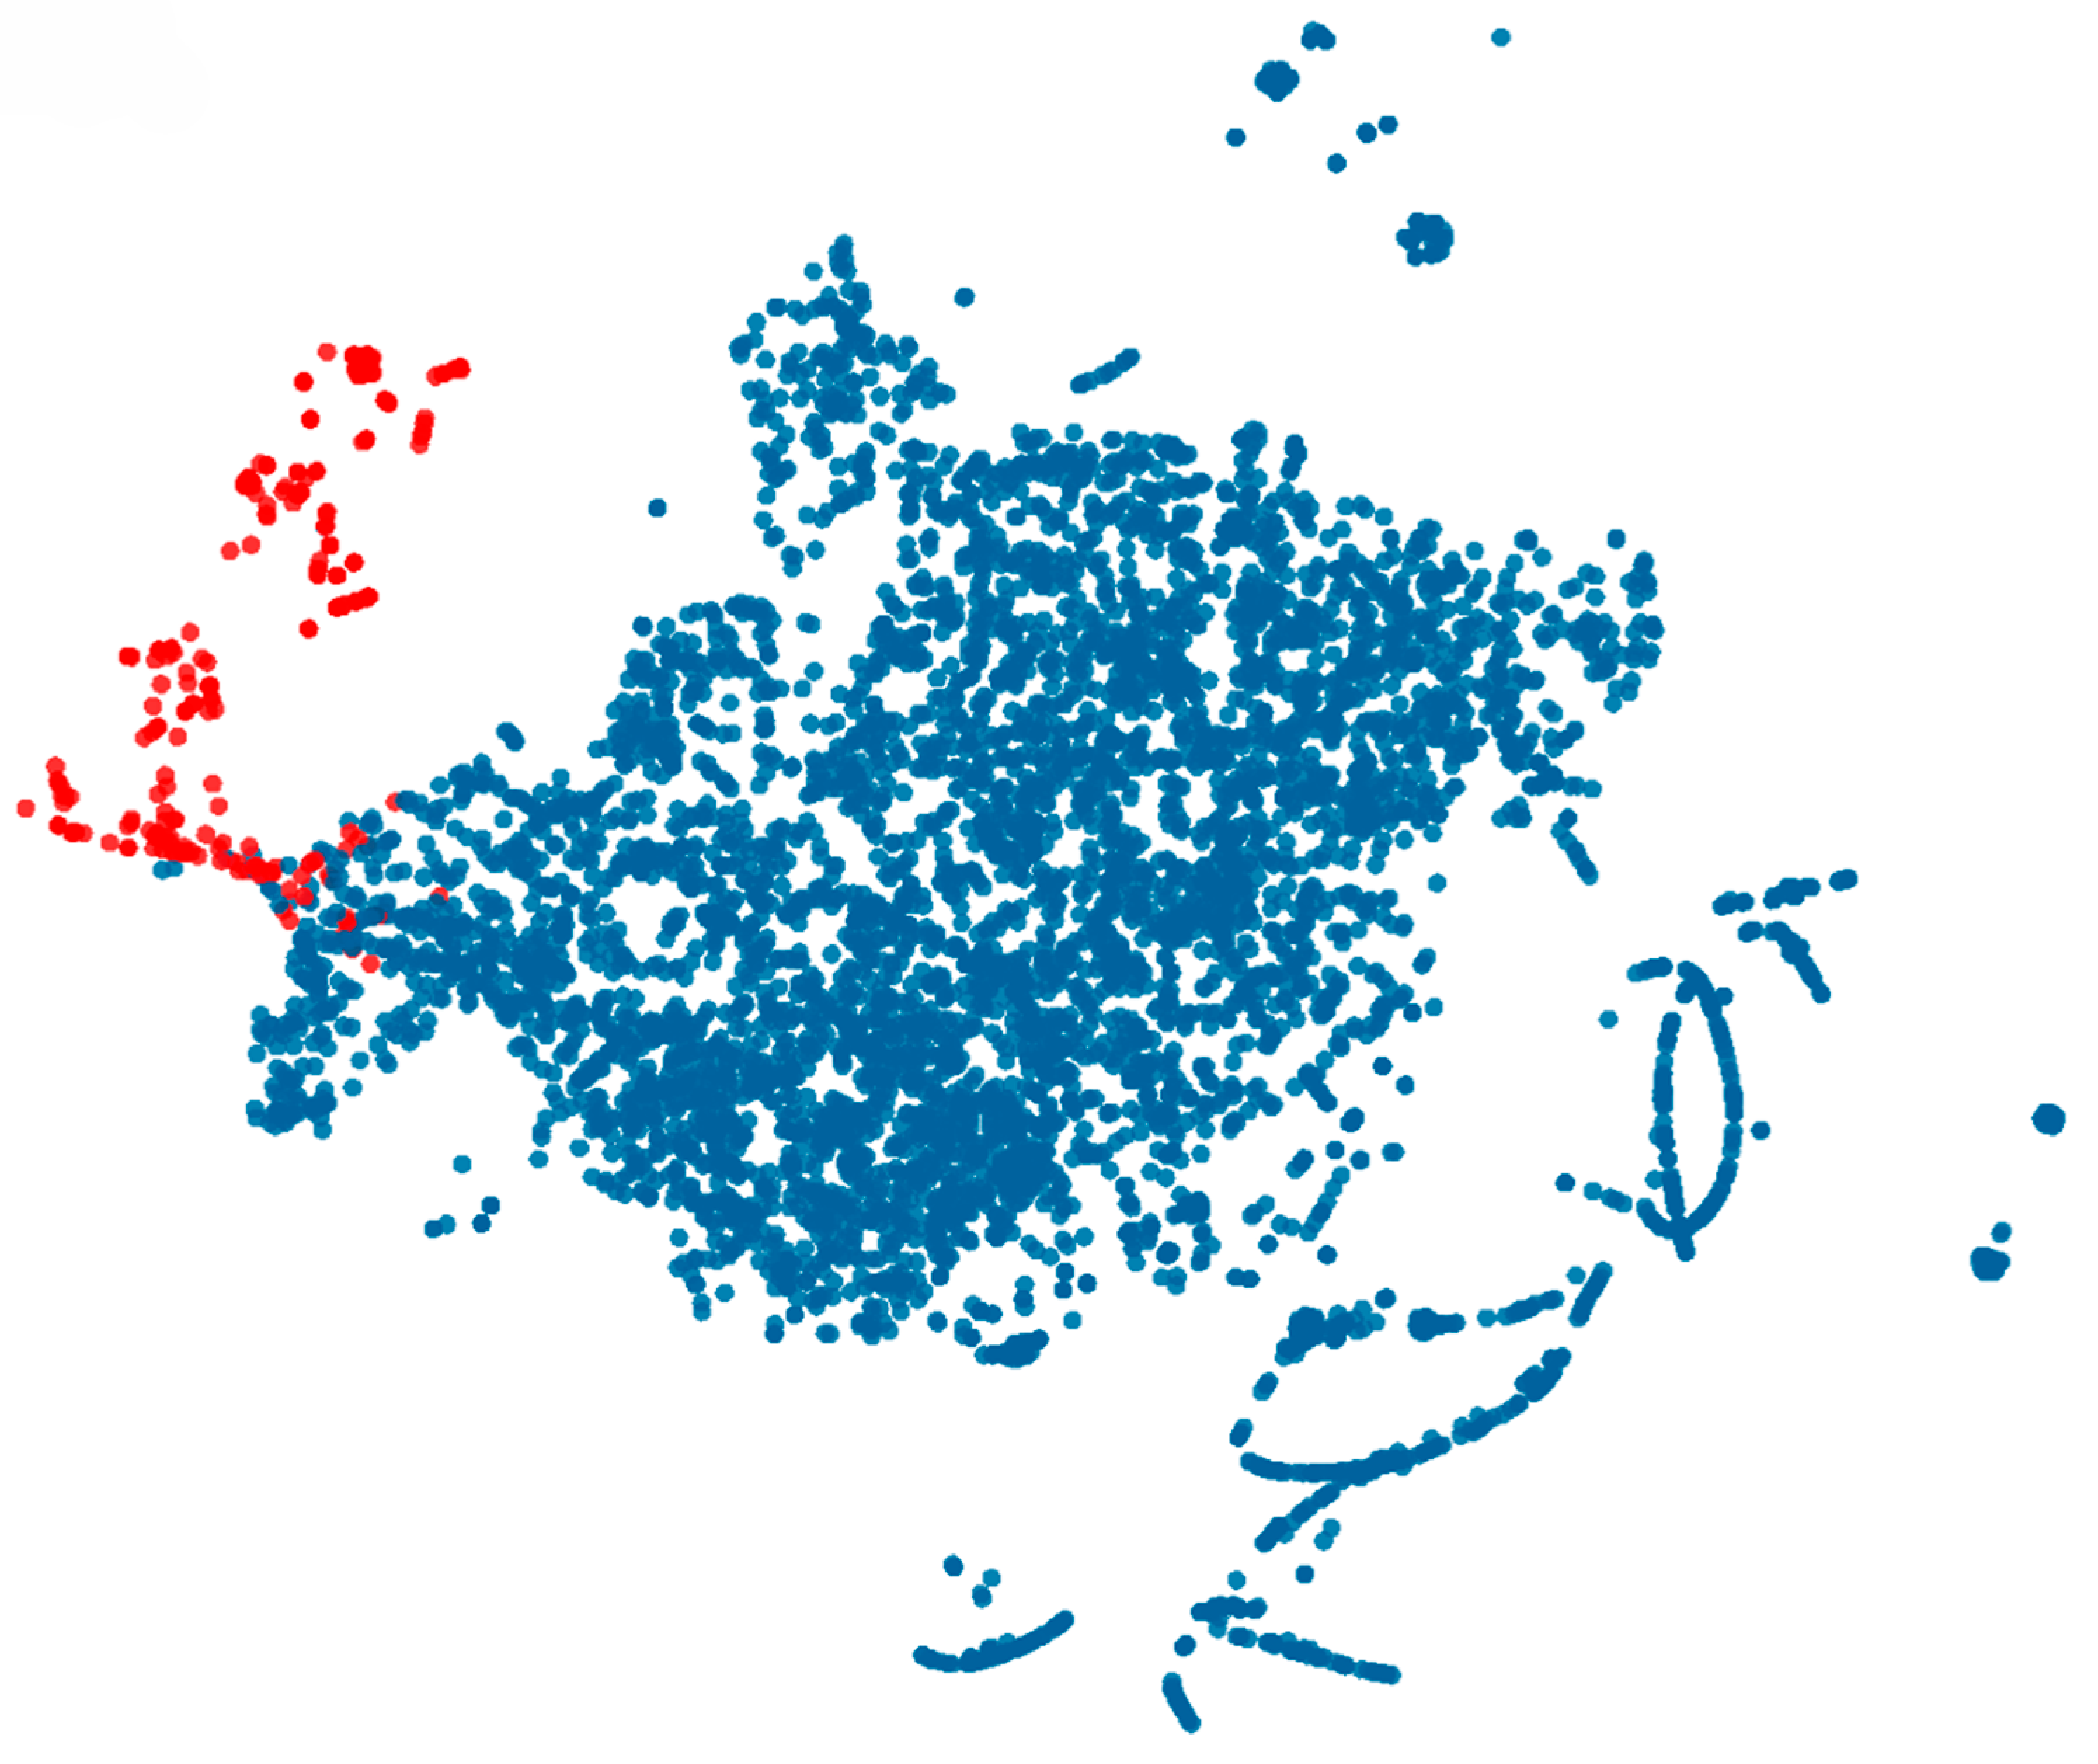
To complement the quantitative analysis, the visualized results (
Figure 5), illustrate the separated distribution of nodes from D1. In the visualization, red points represent fraudulent accounts, while blue points represent legitimate ones. This visualization demonstrates the model’s ability to distinguish between fraudulent and legitimate nodes, as evidenced by the clustering patterns observed in the plot. The distinct separation of red and blue points indicates that the model effectively isolates suspicious nodes, providing a visual confirmation of its accuracy and reliability in fraud detection.
After analyzing the classification results, the operation for observed suspicious addresses involves a clear two-step transaction pattern. Initially, these illicit addresses acquire substantial amounts of digital assets through deceptive means, which include phishing links, scam promotions, or direct messages through social media platforms. Following the acquisition, the stolen assets are quickly converted to the platform’s native currency and subsequently transferred to different accounts, which may be controlled by the attackers or used to obscure the trail of stolen funds (
Figure 6).
The transactional behavior of these fraudulent addresses is also characterized by rapid movements of funds, which are usually inconsistent with the normal transaction patterns observed in regular user accounts. For instance, a typical reported address may engage in sudden and uncharacteristic accumulation of assets followed by equally rapid dispersion to multiple accounts. This behavior is indicative of the ‘cash-out’ phase [
66] in fraud schemes, where the accumulated digital assets are converted into untraceable forms through mixing services.
One of the most prevalent fraudulent schemes identified involves the creation of fake websites that closely mimic legitimate entities, often differing by only minor variations in the domain names. Given that decentralized applications require a signature for authentication during login, many users inadvertently overlook these subtle discrepancies and unwittingly authorize fraudulent transactions. The attackers often use tactics such as fake giveaways and time-sensitive promotions to create a sense of urgency, prompting users to act quickly without further due diligence. This results in the transfer of all digital assets from their accounts without explicit consent, leading to significant financial losses.
Analyzing false positives and false negatives can help to understand the nature of the problem and the shortcomings of the model. In this experiment, 35 misclassified addresses were thoroughly examined to determine the reasons for misclassification. For false negatives, the analysis revealed that the transactional patterns of some misclassified nodes did not align with the typical fraudulent patterns identified in this study. A notable example includes addresses involved in minimal activity, such as having only two transactions (one incoming and one outgoing) and interacting with just two other addresses. These addresses did not exhibit the typical behavior patterns that the model was trained to recognize, leading to their misclassification as legitimate nodes.
False positives, on the other hand, involved addresses that exhibited similar characteristics to suspicious addresses. For instance, certain star addresses were noted for receiving transfers from multiple distinct users while sending out to only a few. These addresses can be mistakenly identified as fraudulent due to their high volume of incoming transactions from diverse sources. However, these activities might not necessarily indicate malicious intent but could represent a hub in a legitimate business or community network.
4.4. Large-Scale Dataset Results
The scale and volume of the transaction data on the WAX Blockchain are significantly larger than what are typically observed in smaller, more balanced datasets. This highly imbalanced scale presents unique challenges in data analysis and processing. This section undertakes a comprehensive data scale experiment using dataset D4, specifically chosen to assess the processing capabilities and scalability of various transaction data processing methods. The selected dataset reflects a label percentage of 0.06% highlighting the imbalance between the classes.
As
Table 3 outlines, the findings highlight the relative performances of conventional methods versus the proposed dynamic subgraph sampling contrastive training approach. Graph-based learning methods, which typically involve processing the entire graph for training, exhibit significant limitations as the data scale increases. For instance, methods such as GraphSage and GAT face challenges due to the extensive volume of data, which exceeds the processing capabilities of typical processing limits, compromising their ability to effectively identify suspicious accounts within a reasonable timeframe.
In contrast, the subgraph sampling method exhibits a robust ability to remain computationally lightweight even as the dataset expands. This approach leverages the structural segmentation of blockchain transactions by focusing on localized subgraphs, which are smaller, manageable sections of the entire larger network. By concentrating on the local neighborhood of the central nodes, the method significantly reduces the computational complexity, making it feasible to process large-scale datasets without overwhelming system resources. As a result, the model can accommodate growing datasets while maintaining high performance levels.
Through clustering and analysis of blacklisted accounts, we have uncovered another fraudulent pattern exploiting the decentralized and transparent nature of NFT market trade offers (
Figure 7). This scheme involves a multi-stage process that mimics legitimate trading activities, making it particularly challenging to detect. The fraudulent operation involves continuous surveillance of the public blockchain network for transactions featuring high-value NFTs. Upon identifying a viable transaction, the perpetrators initiate a duplicate fake transaction.
This duplicate or mirror transaction is designed to closely resemble the original, legitimate NFT buy offer, maintaining its visual and structural integrity while also incorporating a deceptive modification. Specifically, the required cryptocurrency component of this fraudulent buy offer transaction is altered either in its nominal valuation or denominative characteristics to a variant with significantly reduced value, misleadingly presented as equivalent to more legitimate counterparts.
This fraudulent tactic capitalizes on the inherent trust typically present in direct NFT transactions between users. In a common scenario, a seller who intends to transact an NFT to a specific buyer receives a purchase offer which they are prepared to accept. However, perpetrators exploit this transactional trust by deploying a mirror offer that is meticulously designed to emulate the legitimate buyer’s offer. Sellers, who may be under time pressure or may not conduct a thorough due diligence of the offers, are at risk of mistakenly accepting the fraudulent offer in place of the genuine one. This strategic manipulation targets the seller’s primary focus on the NFT’s attributes and the urgency to finalize the sale, consequently leading to an oversight of critical discrepancies in the cryptocurrency component.
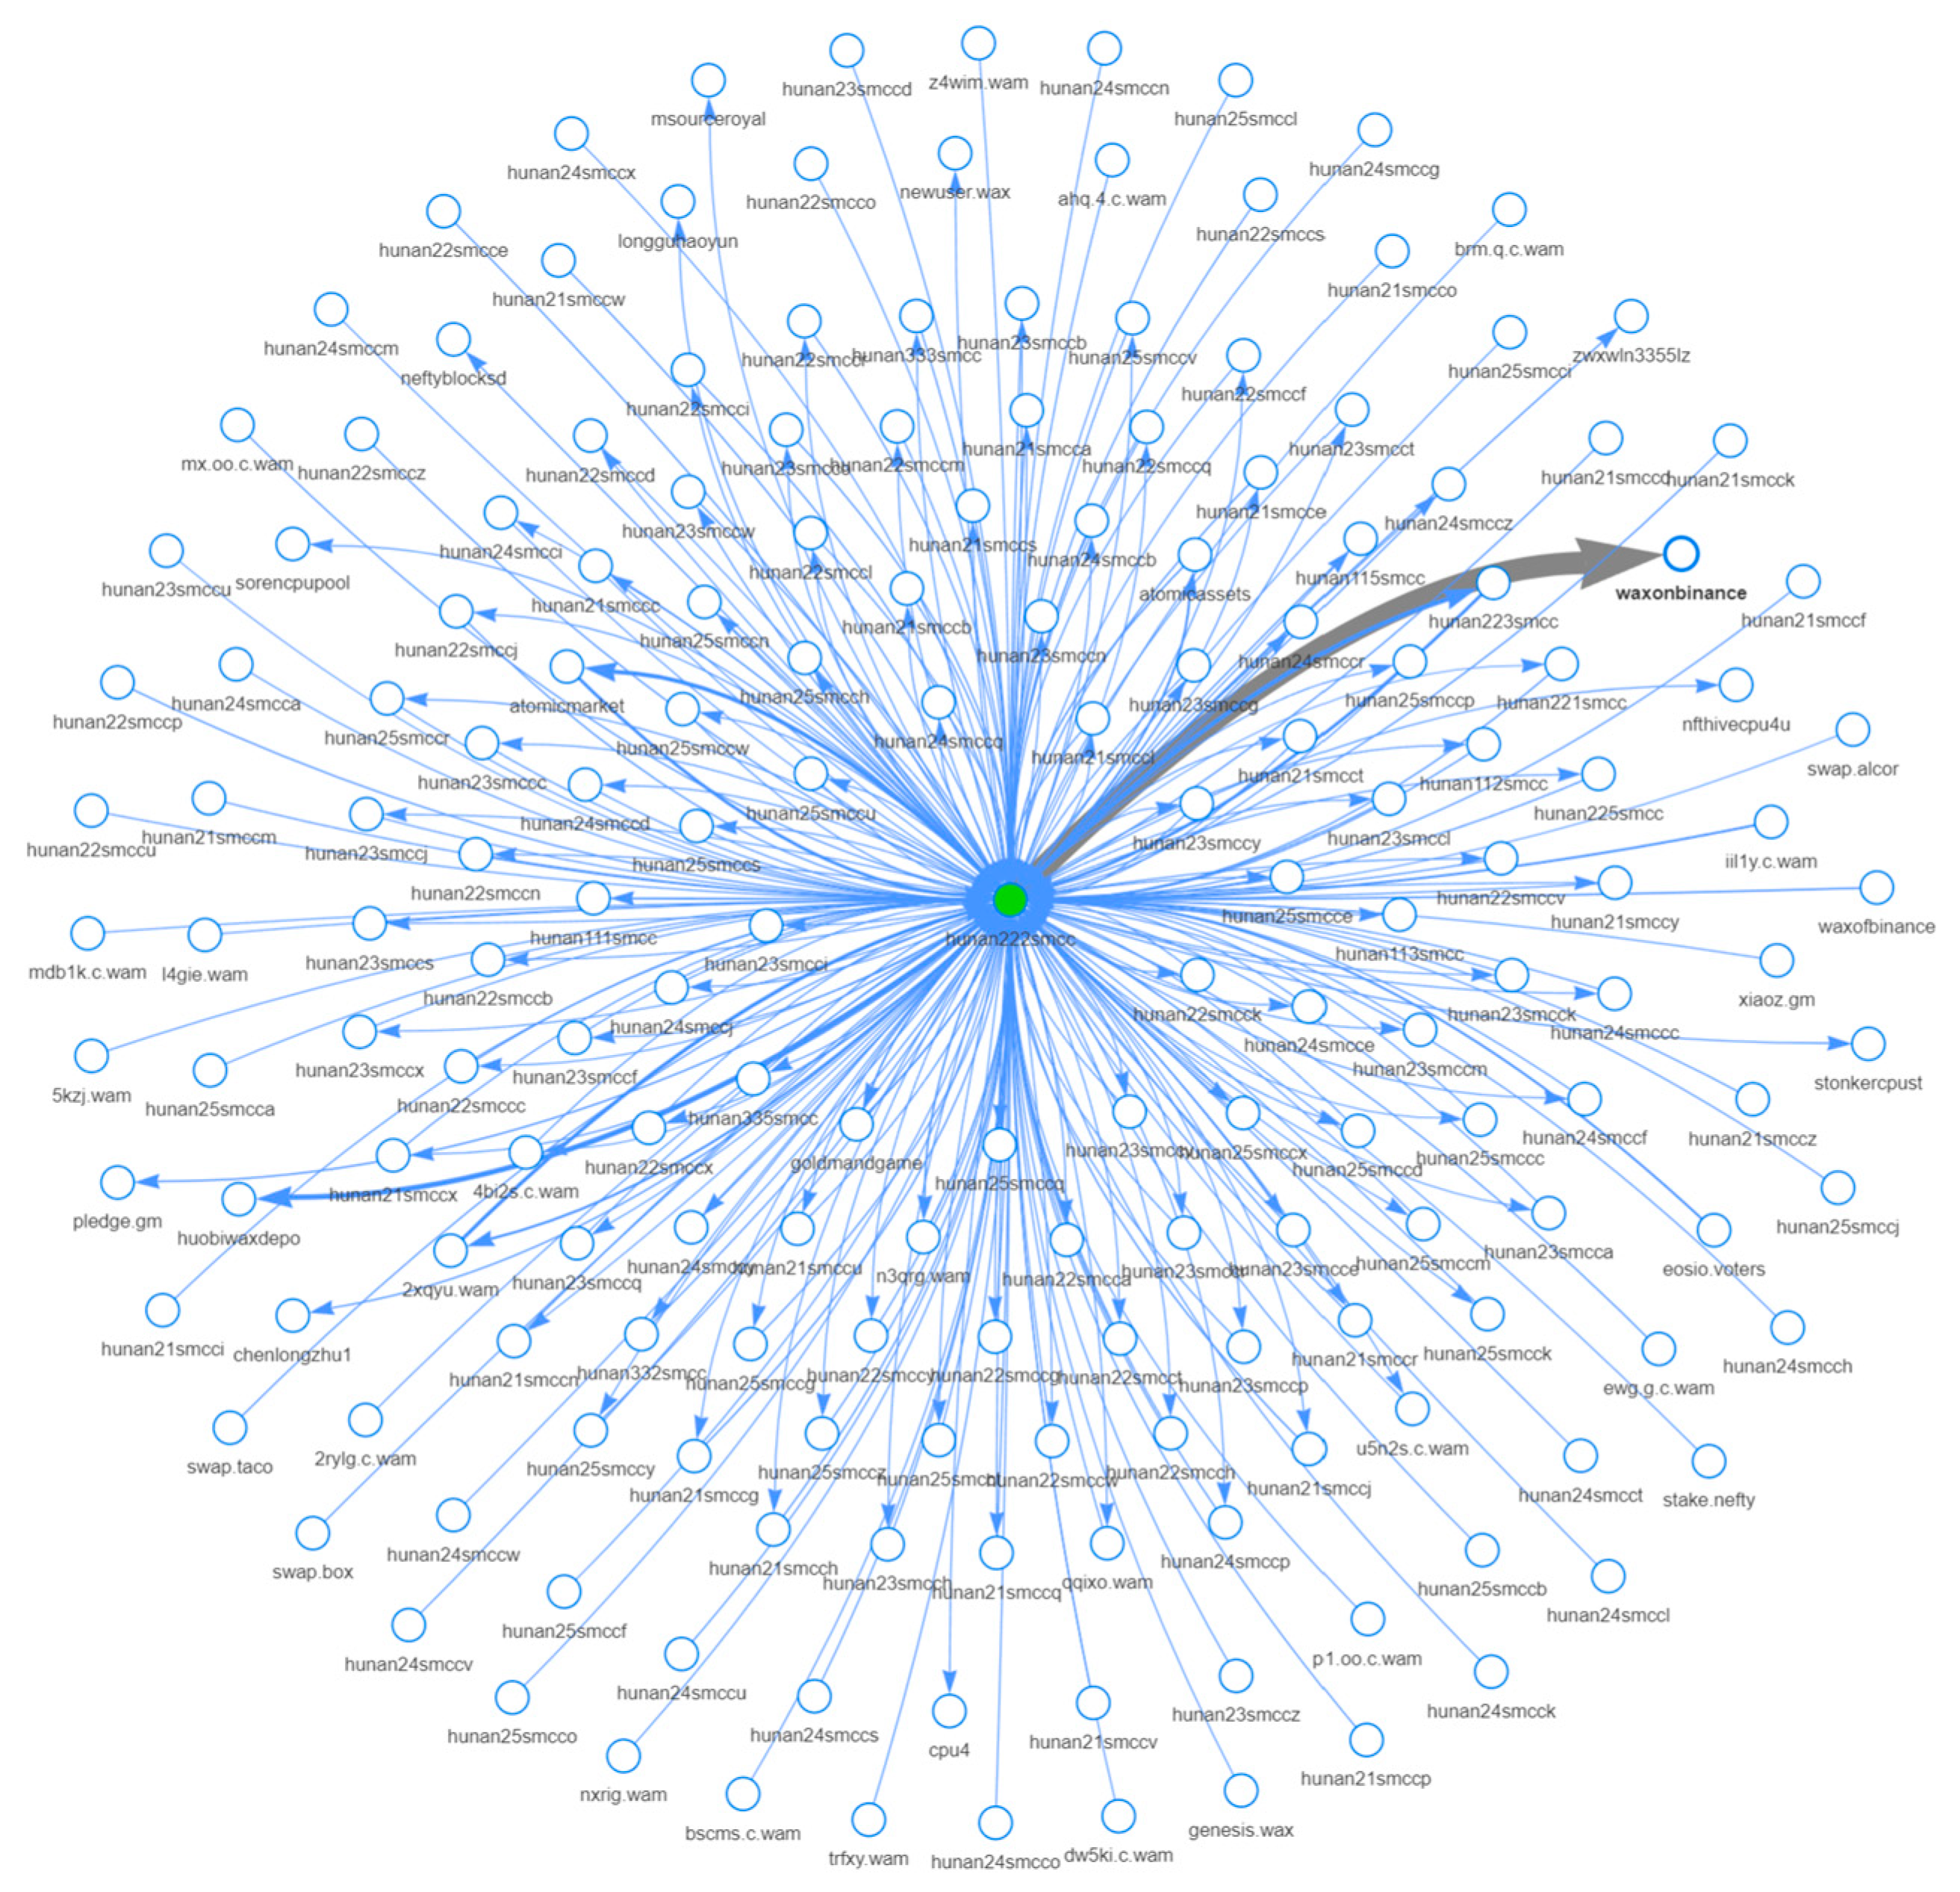
Moreover, the deeper analysis of false-positive accounts uncovered multiple networks of accounts associated with botnets (
Figure 8), which are primarily involved in systematic mining activities within decentralized applications. These botnets exhibit a well-coordinated pattern of behavior, where they frequently interact with specific smart contracts on the blockchain network and subsequently transfer accrued cryptocurrencies to predetermined external addresses. This pattern of behavior, while not inherently illegal, suggests a coordinated effort that could potentially distort market dynamics through concentrated resource allocation.
Creating a vast number of wallets is a common practice that is not fraudulent by itself. However, the proliferation of such wallets, particularly when linked to a decentralized project, can artificially inflate the user metrics and distort project standings in public and investor perceptions [
67]. This inflation can misrepresent a project’s true popularity and success, potentially attracting new investors under false pretenses. In more severe scenarios, these false actions may mimic characteristics of wash trading [
68], where the intent is to create a deceptive appearance of activity by generating numerous transactions to simulate high trading volumes.
4.5. Unsupervised Learning
Anomaly detection has a significant role in the identification of suspicious and potentially fraudulent activities within blockchain transactions. This approach leverages a diverse array of machine learning algorithms designed to identify deviations from expected values, fluctuations, or sudden changes in trends that may indicate malicious intent or irregular behavior. This analytical process is essential for detecting unusual and suspicious events, potentially serving as indicators of novel or previously unrecognized behavioral patterns [
54,
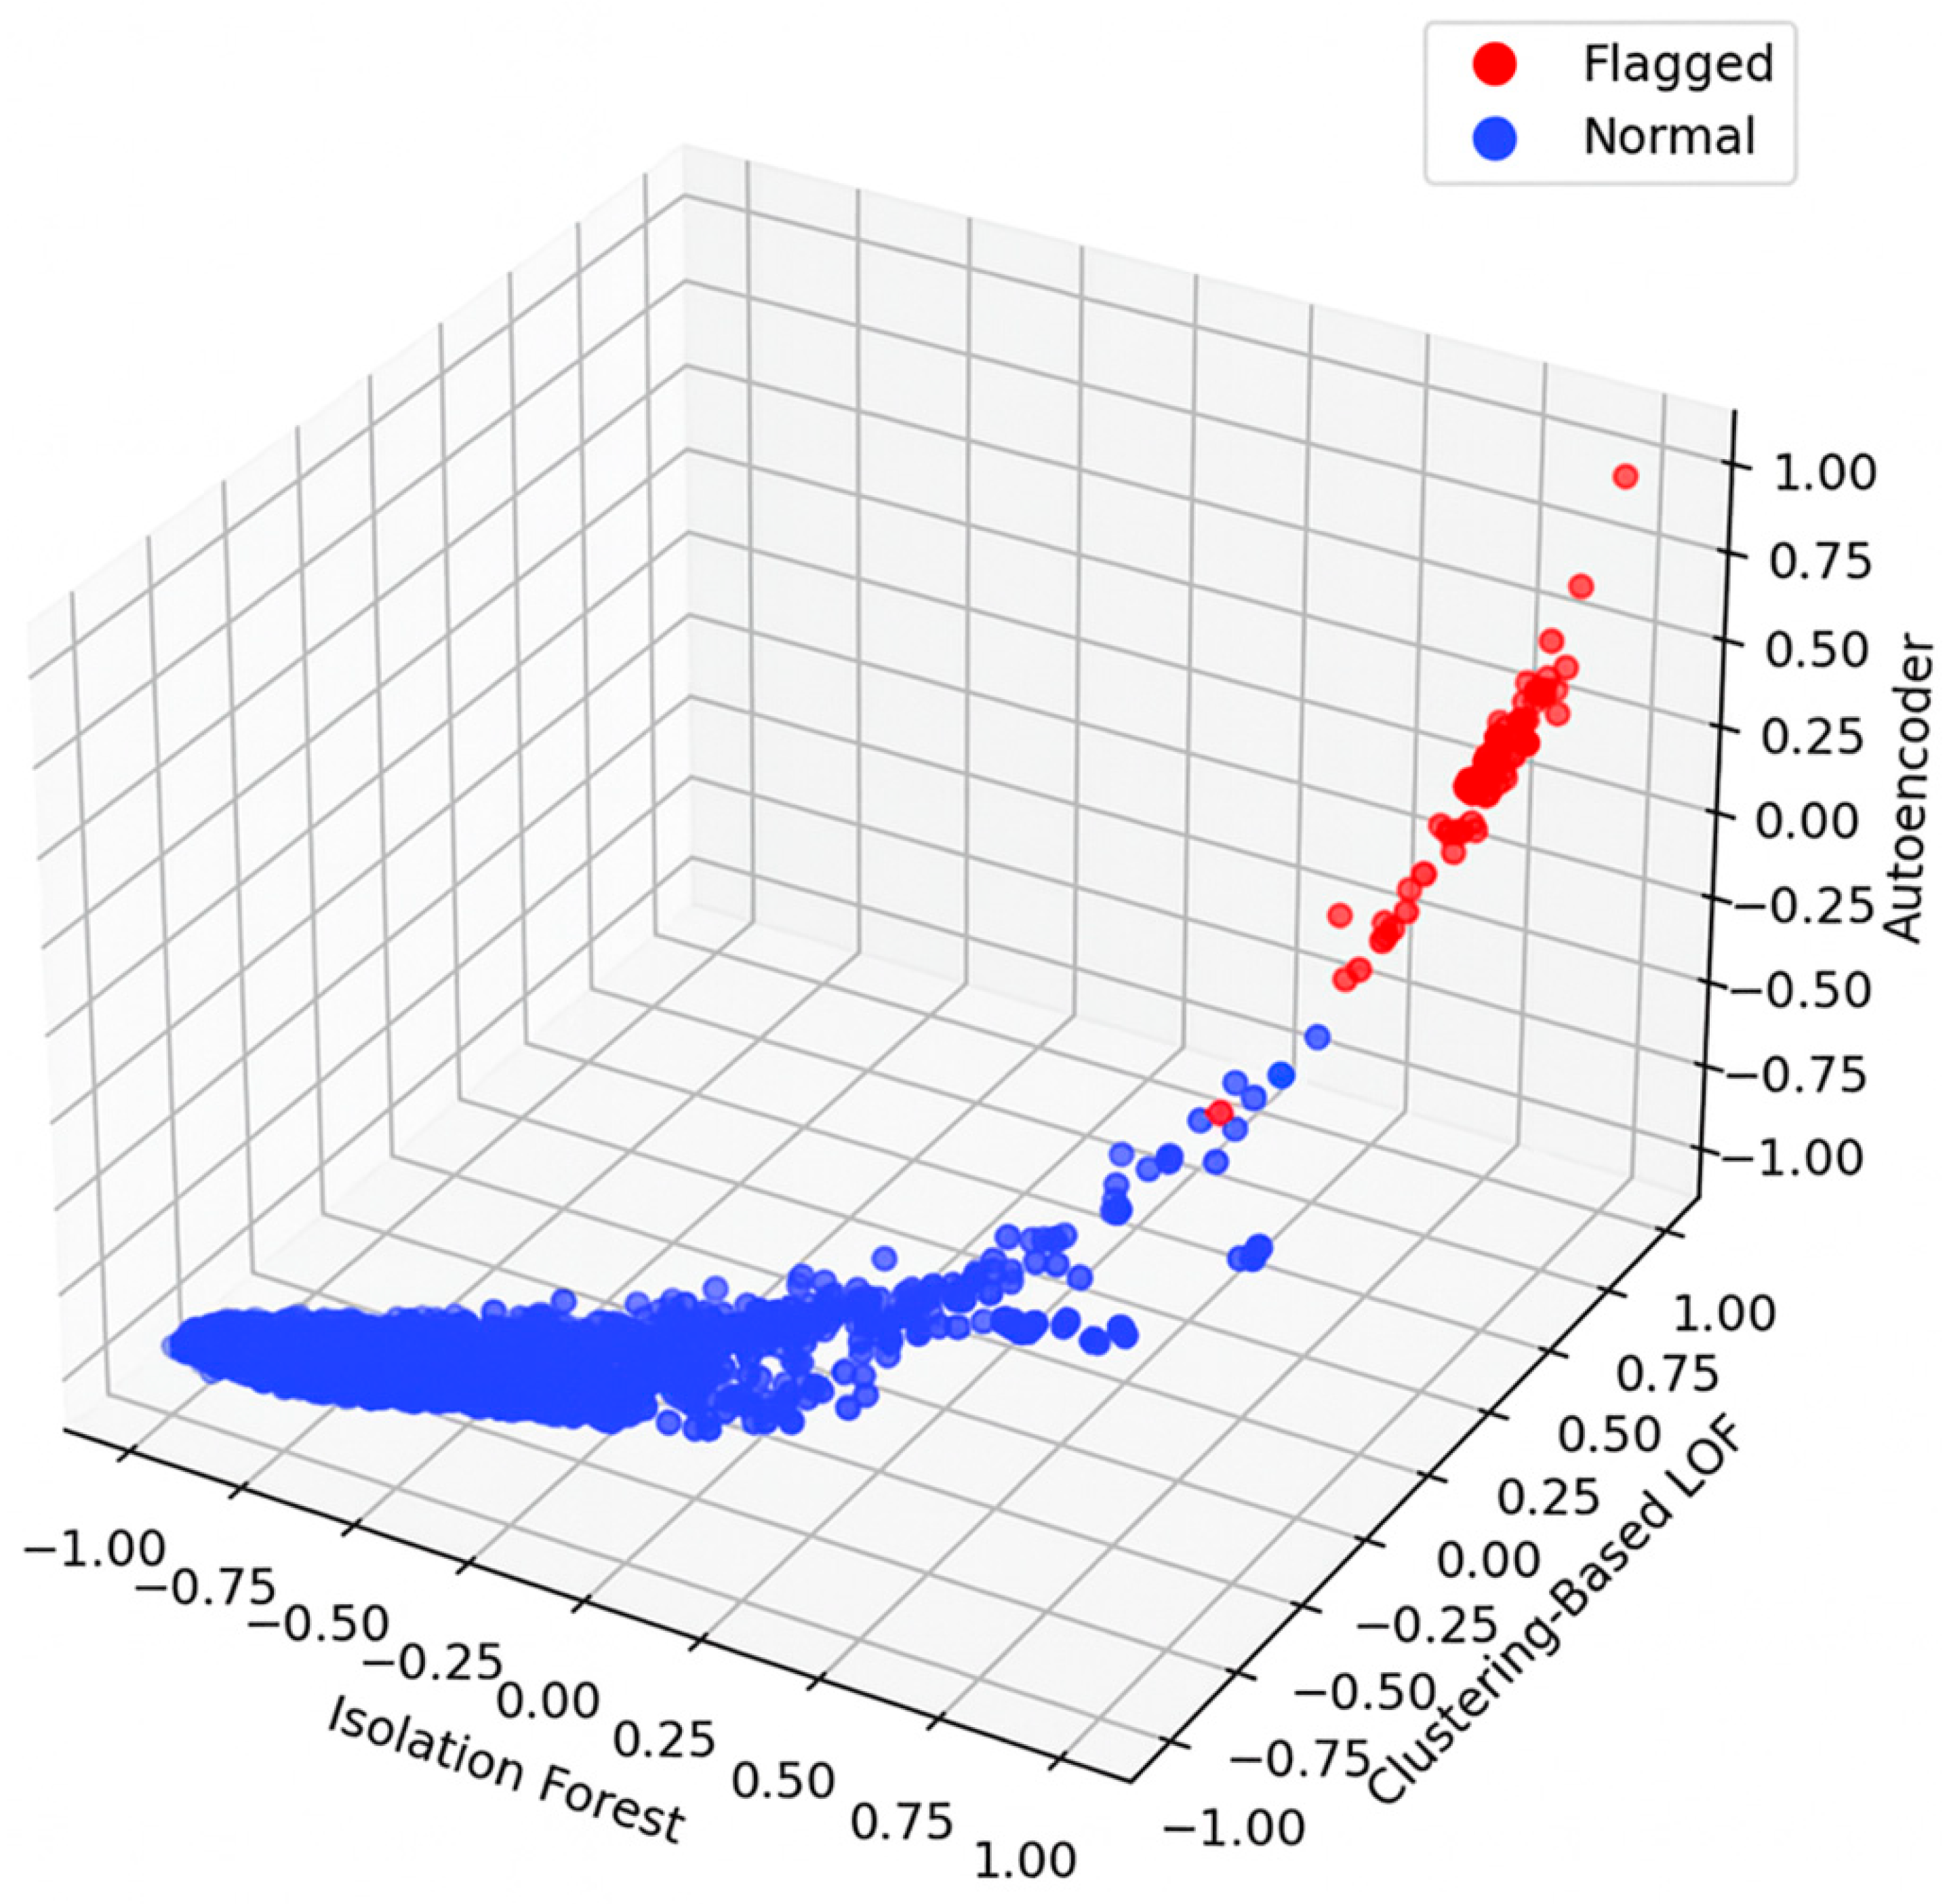
55]. For this study a selection of unsupervised machine learning algorithms was employed due to their robust capability to process the embeddings derived from the transaction data. These embeddings were crafted using contrastive learning and graph representation to capture the transaction patterns, enhancing the model’s ability to discern normal from anomalous activities. These algorithms include Isolation Forest (IF), Clustering-Based Local Outlier Factor (CBLOF) and Autoencoder (AE).
In the detection process, each selected algorithm assigns an anomaly score to individual accounts based on their embeddings, which encapsulate a range of transactional data and features. To maintain consistency and comparability of the results across different models, all anomaly scores are normalized to a uniform scale with interval ranging from 0 to 1. The primary anomaly score for each selected account is then computed by averaging the scores assigned by the three algorithms. This method establishes a robust mechanism for ranking accounts, where higher score values are flagged as they indicate a greater deviation from typically observed transaction patterns.
The distribution of these anomaly scores is depicted in
Figure 9, where red points represent fraudulent, blacklisted accounts, while blue points represent legitimate ones. The alignment of individual anomaly scores along the diagonal of the graph shows a consistent evaluation across all models. The visual representation aids in identifying accounts with the highest anomaly scores, which are prioritized for further manual analysis and verification by experts. This visual and analytical approach aids in the prompt identification of high-risk accounts and enhances the decision-making process for subsequent investigations.
To ensure the reliability of the detected anomalies, a threshold was established to categorize the anomaly scores. Accounts with scores above this threshold were flagged for further investigation. The detected anomalies were then cross verified with labeled accounts in the dataset, identified from the public blacklists or community reports. This cross-validation process, detailed in
Table 4, confirmed that the detected anomalies correspond to labels of known fraudulent nodes, thereby validating the effectiveness of the approach.
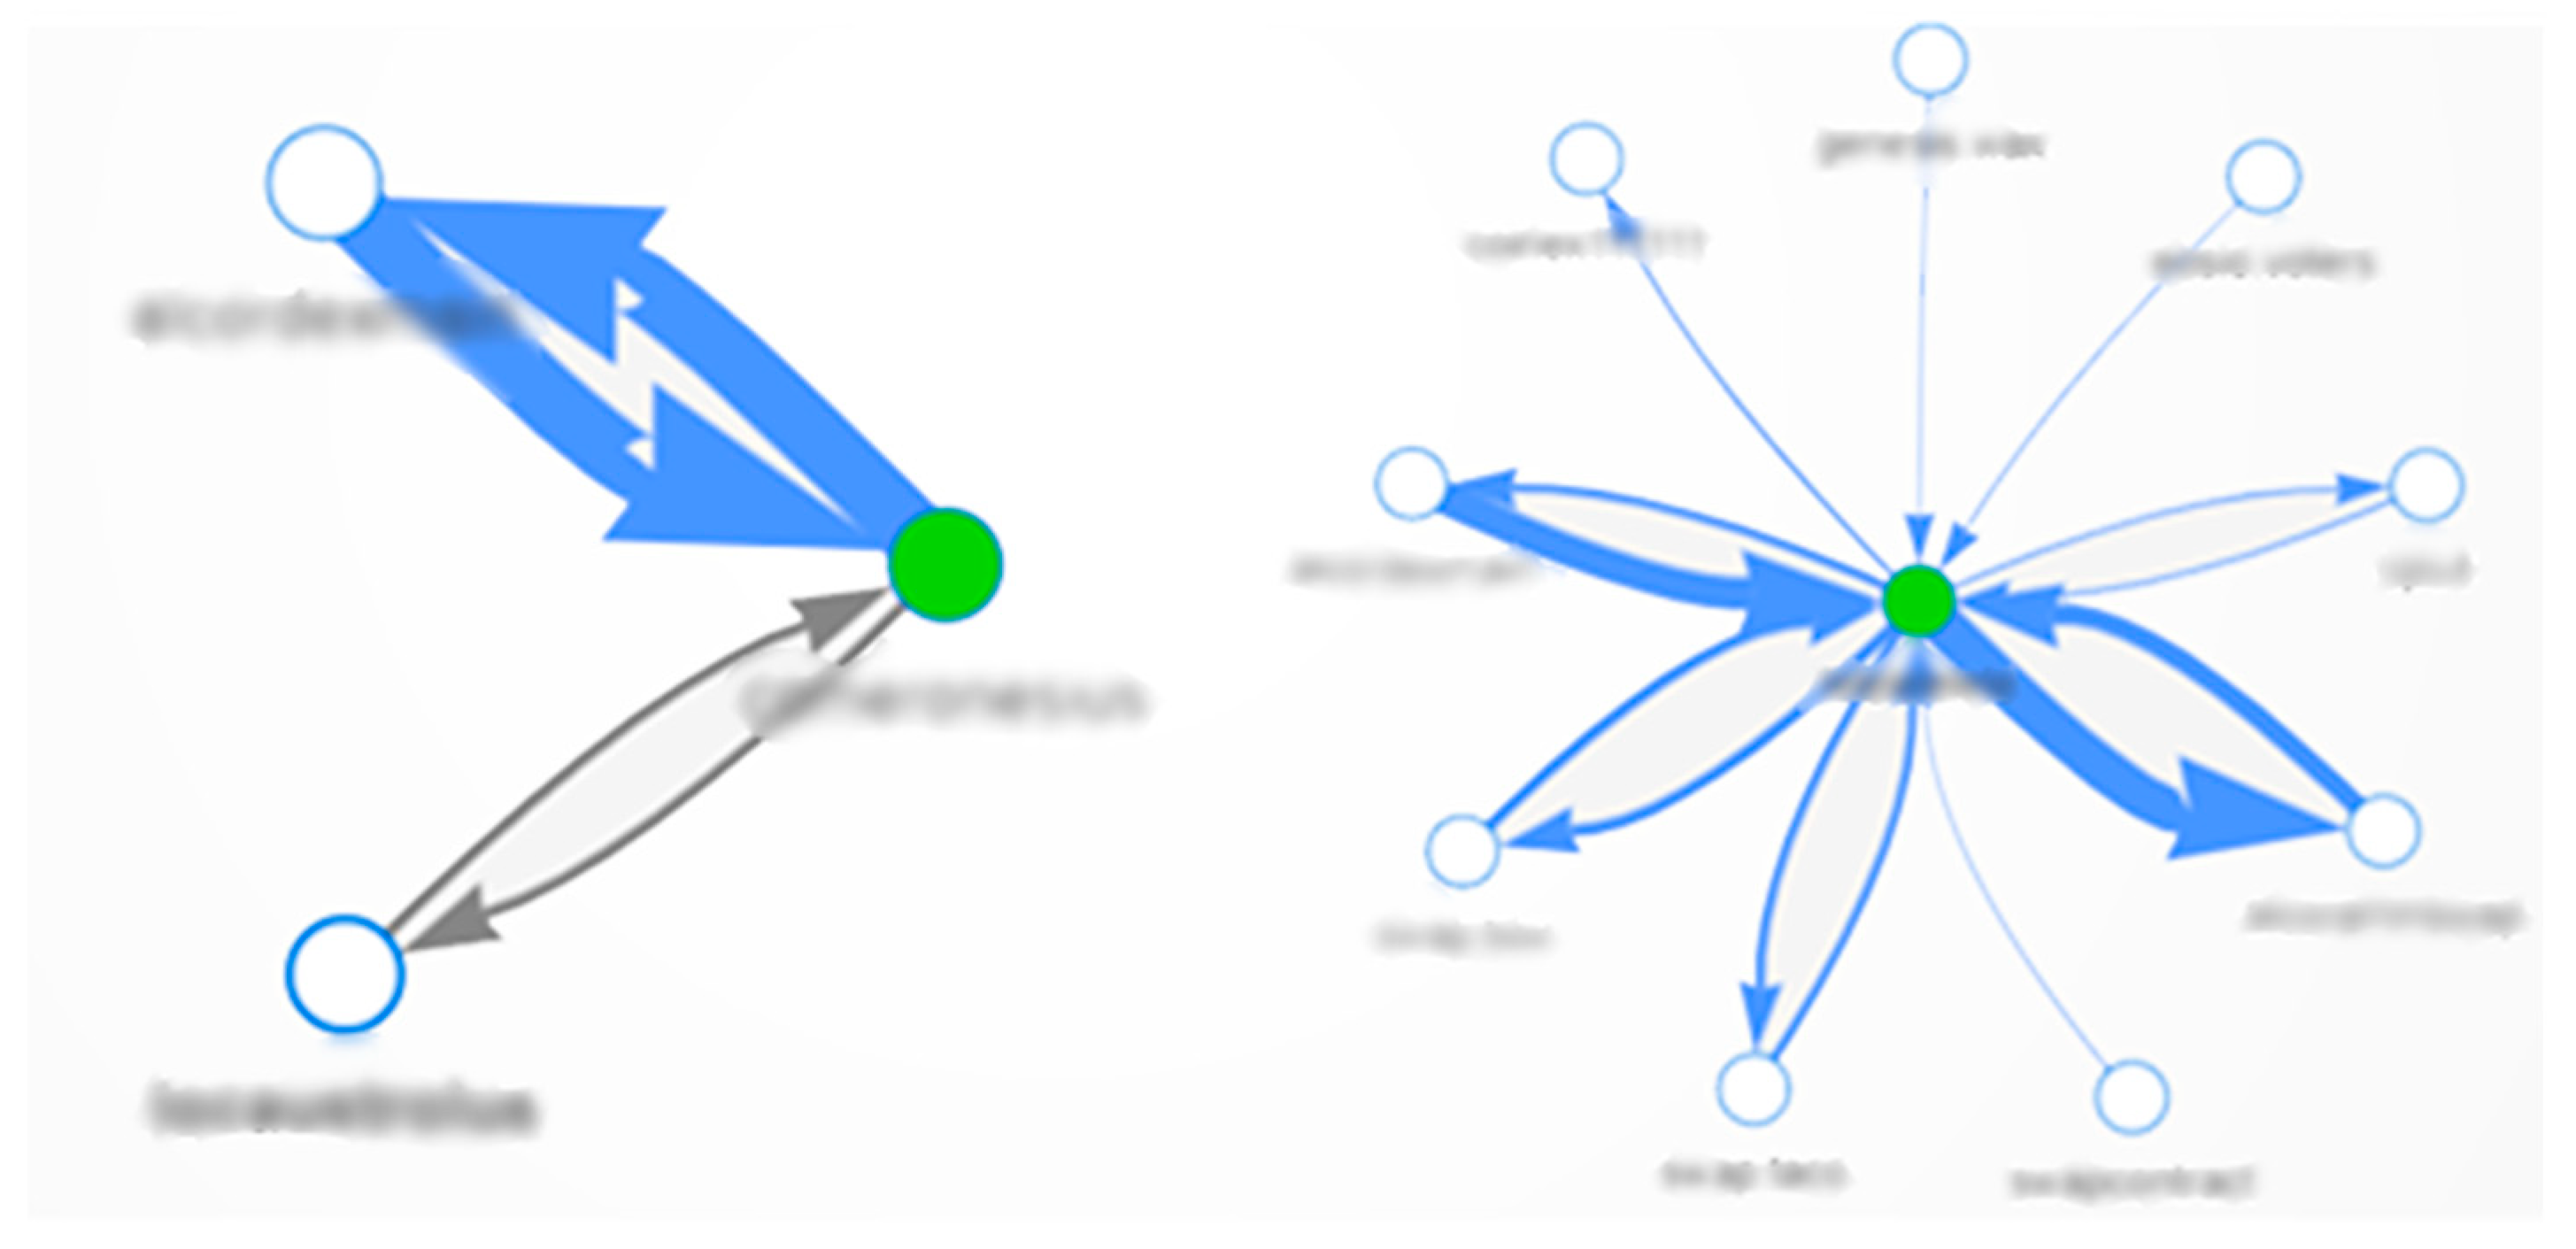
The anomaly detection process not only validated the effectiveness of the contrast learning embedding generation approach but also provided significant insights into the broader transaction ecosystem. Furthermore, the detailed analysis revealed that the anomaly detection algorithms identified multiple legitimate accounts exhibiting unusual transaction behavior (
Figure 10). These accounts include large trading accounts, known as high-frequency trading (HFT (HFT:
http://academy.binance.com/glossary/high-frequency-trading-hft (accessed on 14 August 2025))) bots, that perform high-value transactions at a rapid pace. Additionally, automated accounts executing transactions to exploit price differences across markets, known as arbitrage bots, were also identified [
69,
70]. Although these accounts are normal and not fraudulent, their atypical frequency of transactions flagged them as suspicious. Identifying and categorizing these legitimate outliers is essential, as their removal from the dataset can further enhance the accuracy of fraud detection models. By filtering out these legitimate outliers, the anomaly detection process ensures that the model focuses more accurately on genuinely suspicious activities without smart contracts and accounts with similar behavior.
This integrated approach facilitated a refined validation of suspicious accounts, affirming the robustness of both the contrastive learning embedding generation and the anomaly detection algorithms. By providing deeper insights into transactional behavior patterns, this approach enhances the precision of fraud detection by effectively filtering out outliers that can mislead the learning process.
5. Conclusions and Future Work
This paper has provided a comprehensive overview of the experimental setup and results for detecting fraudulent transactions on the WAX Blockchain. Using a multi-faceted approach integrating various machine learning models, the experiments have effectively demonstrated the ability to identify and analyze patterns of fraudulent behavior within a complex blockchain environment. The WAX Blockchain, notable for its unique features tailored for NFT transactions and a user-friendly wallet address system, provided a rich dataset for the proposed research. The absence of transaction fees encouraged a high volume of interactions, which was instrumental in facilitating a detailed study of the transaction patterns and potential anomalies.
This research managed to gather detailed transaction data from approximately 5745 blacklisted accounts and more than 5 million normal accounts enabling a targeted analysis of suspicious versus normal, non-fraudulent behavior. The experiments employed multiple machine learning methods to process and analyze the data. It included feature-based approach, random walk-based graph representation learning, deep learning-based methods, and contrastive learning based embedding generation. These methods were evaluated on multiple datasets with various scales based on their ability to capture the complex characteristics of minority class in blockchain transaction records.
The performance of these methods was assessed through precision, recall, and F1-score metrics, with the proposed approach demonstrating superior performance across all datasets. This indicates the effectiveness of the proposed approach in capturing complex interactions and subtle indicators of suspicious behavior that might require more conventional analysis techniques. Moreover, the robustness of the proposed approach was further validated through anomaly detection, which tested the model’s performance under constrained data availability. This analysis highlighted the model’s resilience and its ability to maintain high levels of accuracy even with limited labeled data, representing a common challenge in real-world blockchain environments.
Manual analysis of the observed transaction data is time-consuming, and the models do not offer a straightforward interpretation of their decisions. Nevertheless, the WAX blockchain community is highly active, and its members can be considered experts in the related domain. Relevant discussions regarding suspicious accounts and unusual transactions were sourced from the official fraud reporting channels on community forums, which were further used for better data labeling and transaction analysis.
Expanding the scope of the methodology to specifically focus on NFT transactions, this study was able to quantify transfers and detect suspicious activities related to NFT trades on the WAX blockchain. NFT transactions, which typically exhibit clear patterns of acquiring and subsequently transferring digital assets, provided pronounced behavioral embeddings that facilitated the detection of fraudulent accounts. The distinct pattern of these transactions offered a significant advantage in identifying suspicious activities within NFT markets, as accounts involved in fraudulent actions exhibited anomalous, contrastive behavior compared to typical user transactions.
Although the empirical evaluation in this study focuses on the WAX blockchain, the proposed fraud-detection framework is not restricted to this network. Any account or address based blockchain with a transactional history can be transformed into a transaction graph and processed by dynamic subgraph sampling. Despite these strengths, several limitations remain, which also outline important directions for future research. Training graph-neural-network-based models with temporal components and contrastive learning on large transaction graphs remains computationally demanding.
A promising direction for future research involves broadening the scope of detection to more comprehensively identify and analyze anomalous NFT sales on digital markets that may indicate complex fraudulent activities such as money laundering or wash trading. By refining detection algorithms to recognize the contrast patterns typical for these illicit activities, and by broadening the neighborhood analysis around central nodes, the detection capabilities for complex schemes can significantly improve the capability to detect and address these complex schemes.
Additionally, the clustering of accounts based on their transaction behaviors, which has proven effective in identifying suspicious activities, can be leveraged to develop targeted detection strategies for specific types of fraud. This approach can utilize the transactional networks within these clusters to fine-tune the contrastive learning approach, improving the capability to distinguish between legitimate and illegitimate nodes by decreasing the distance of similar nodes in cluster together while positioning dissimilar ones further apart. This targeted approach improves detection accuracy and aids in the development of more robust multi-class classification models that address various categories of fraud more effectively.
Another significant area of development can be the integration of Explainable AI (XAI) approach [
71,
72]. The current pipeline provides limited model transparency, as decisions are primarily driven by high-dimensional embeddings that are difficult to interpret without additional forensic tools, underscoring the need for systematic integration of explainable AI techniques. This integration can provide clearer insights into the decisions made by the fraud detection algorithms, aligning the model’s outputs with for example, Financial Action Task Force red flags [
73] and other rule-based regulatory frameworks. This alignment enhances the transparency of the fraud detection process, while also aids experts in quickly and effectively responding to potential threats, thus reducing the time required for expert review.
Future focus could also extend to the dynamic analysis of subgraphs to identify specific transactions as fraudulent. This approach would allow for a more granular view of the transactional ecosystem, identifying specific instances of fraud within a network of interactions. By dynamically analyzing subgraphs where transactions occur, the detection systems can evolve to recognize temporal patterns and sudden anomalies in user’s transaction behavior, providing a more immediate and precise detection capability.
