Data Availability Statement
The data supporting the findings of this study are publicly available from institutional and open-access sources. Electricity demand profiles, carbon intensity, and generation mix for the Canary Islands are available from Red Eléctrica de España (REE) at
https://www.ree.es (accessed on 15 May 2025). Information on electric vehicle consumption benchmarks, efficiency, and charging infrastructure was obtained from the Instituto para la Diversificación y Ahorro de la Energía (IDAE) at
https://www.idae.es (accessed on 23 July 2025) and the European Alternative Fuels Observatory (EAFO) at
https://alternative-fuels-observatory.ec.europa.eu (accessed on 2 June 2025). Regional fleet data and annual registrations were sourced from the Dirección General de Tráfico (DGT) at
https://www.dgt.es (accessed on 2 August 2025), and the Instituto Canario de Estadística (ISTAC) at
https://www.gobiernodecanarias.org/istac/ (accessed on 18 July 2025). Policy targets for renewable integration and electromobility were obtained from the Plan de Transición Energética de Canarias (PTECan 2030–2040), published by the Canary Islands Government at
https://www.gobiernodecanarias.org/energia/ (accessed on 29 June 2025). Benchmark data for vehicle consumption were taken from publicly available technical specifications of leading manufacturers (BMW, Nissan, Tesla) at
https://www.bmw.com (accessed on 24 April 2025),
https://www.nissan-global.com (accessed on 24 April 2025), and
https://www.tesla.com (accessed on 24 April 2025). No proprietary or restricted datasets were used in this research. Indicators were either sourced directly from official repositories or computed from them: (i) EV stock and registrations—ISTAC/DGT; (ii) public recharging points and definitions—EAFO; (iii) Grid generation mix and CO
2 intensity—Redeia/REE; (iv) policy targets—PTECan (regional) and PNIEC (national); (v) vehicle energy use (WLTP)—IDAE database. Derived indicators (e.g., EVs per public charging point, kW per EV) follow EAFO/IEA practice.
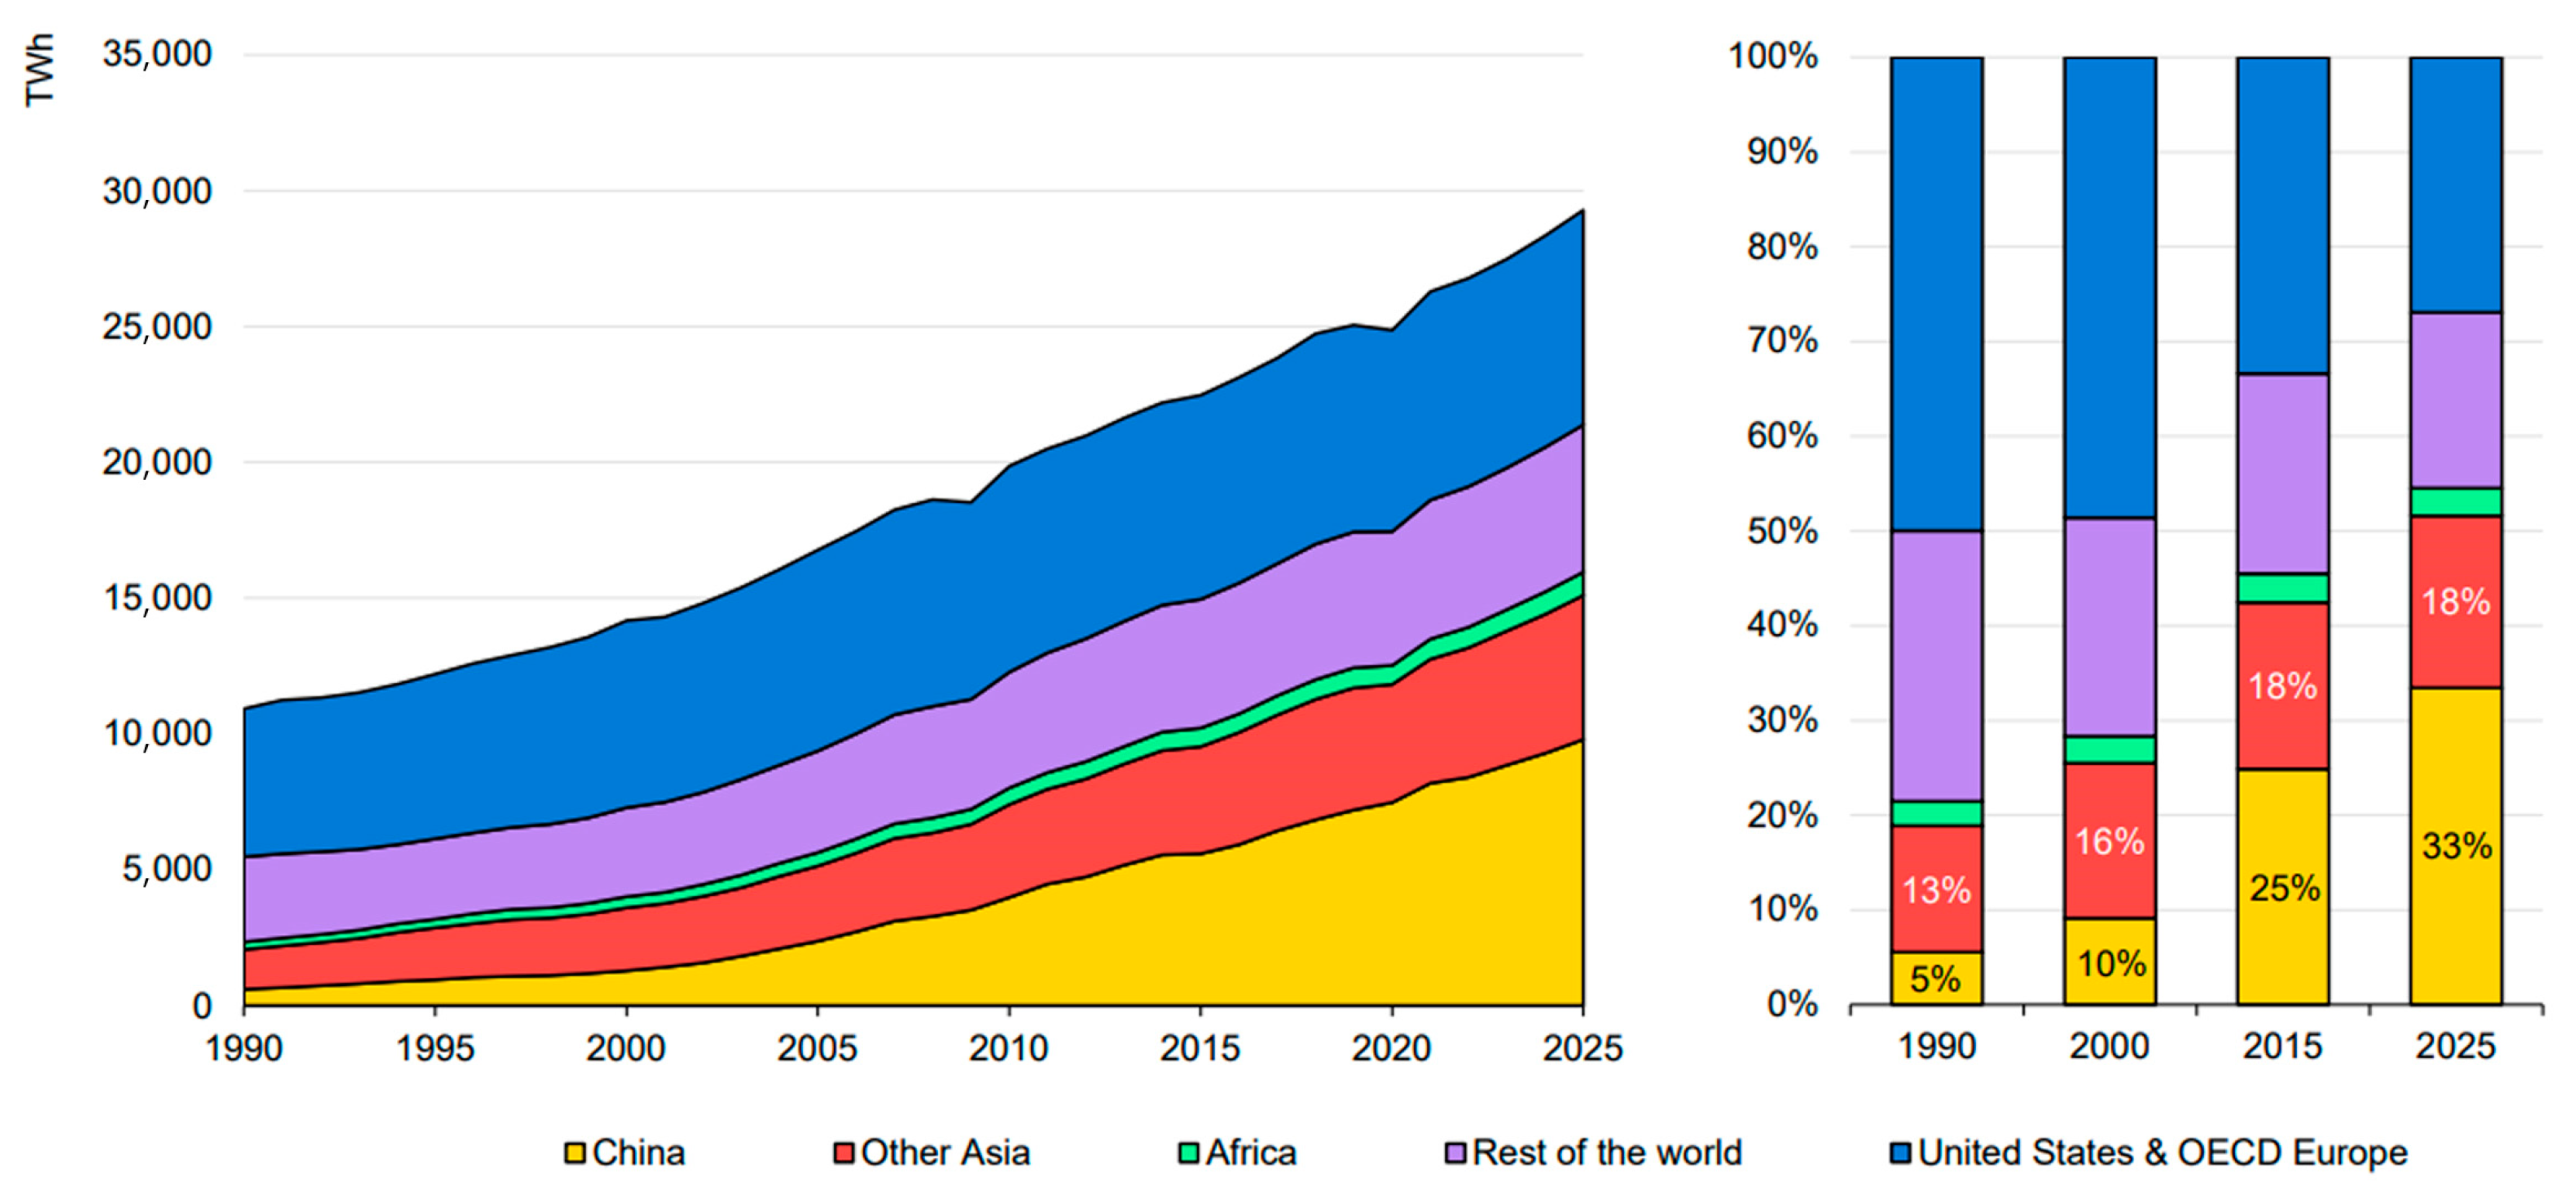
Figure 1.
Evolution of global electricity demand by region and regional shares in the world. Source: Electricity Market Report 2023 [
1].
Figure 1.
Evolution of global electricity demand by region and regional shares in the world. Source: Electricity Market Report 2023 [
1].
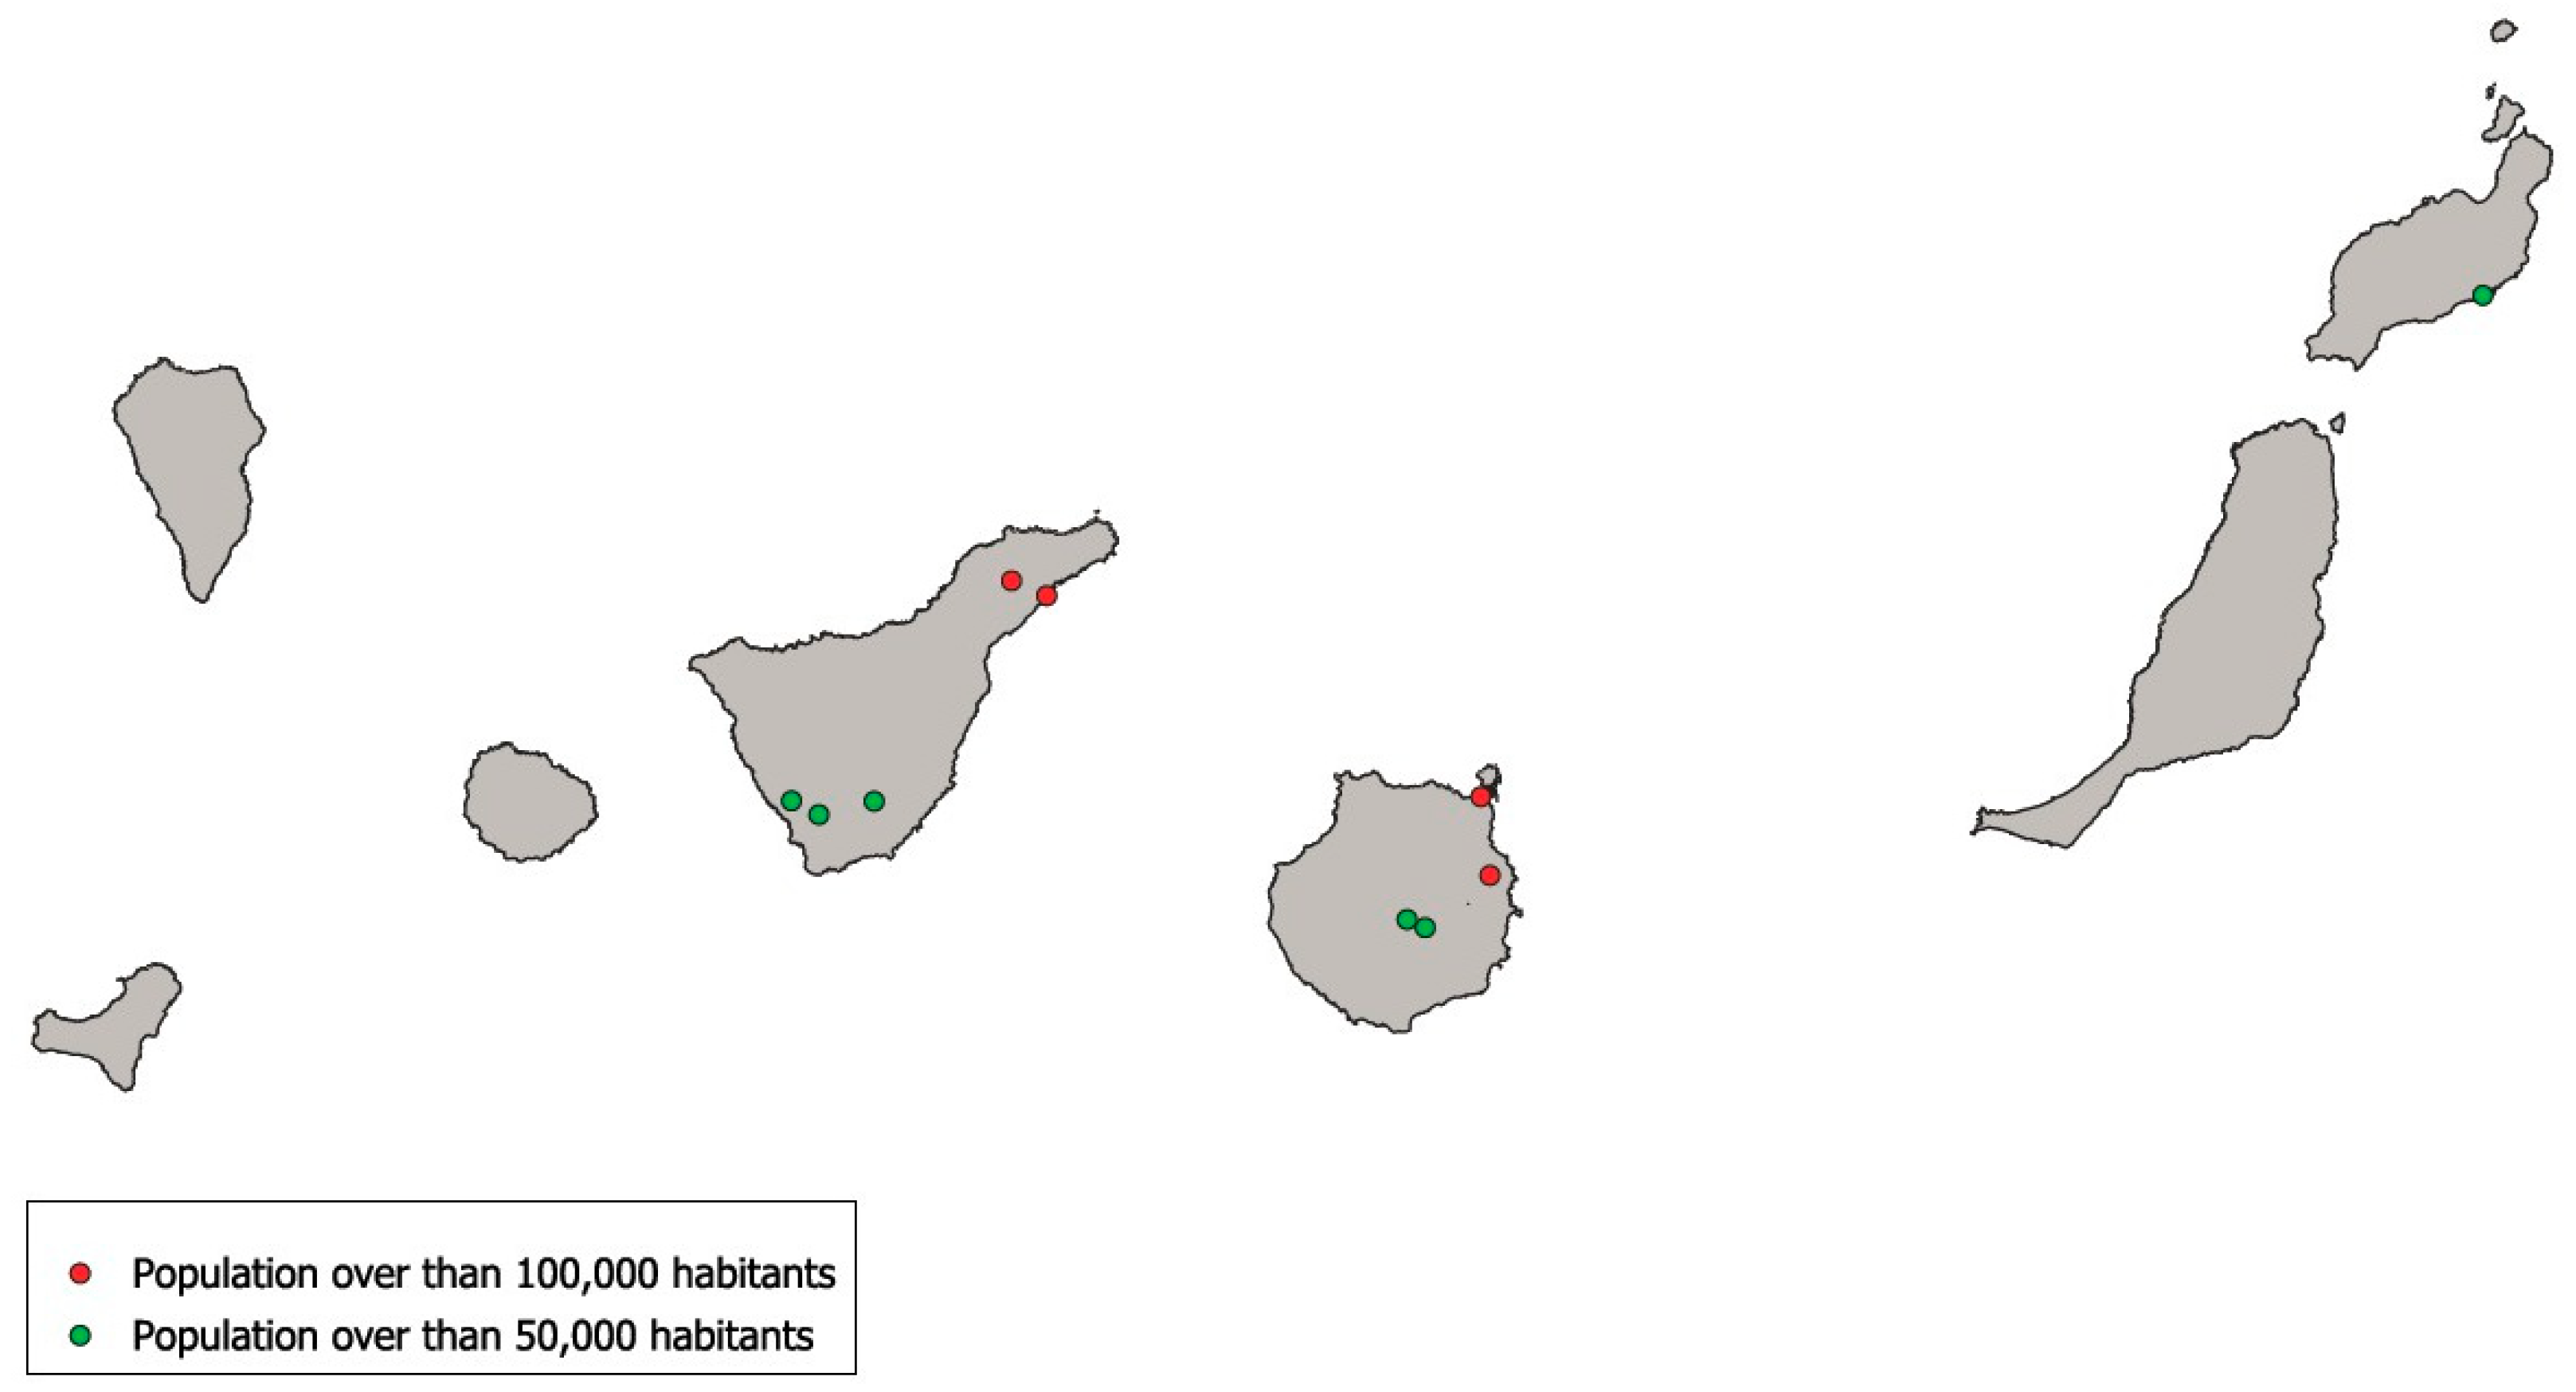
Figure 2.
Populations with more than 50,000 inhabitants in Canary Islands. There are no other cities with over 50 k inhabitants in the archipelago. Source: authors.
Figure 2.
Populations with more than 50,000 inhabitants in Canary Islands. There are no other cities with over 50 k inhabitants in the archipelago. Source: authors.
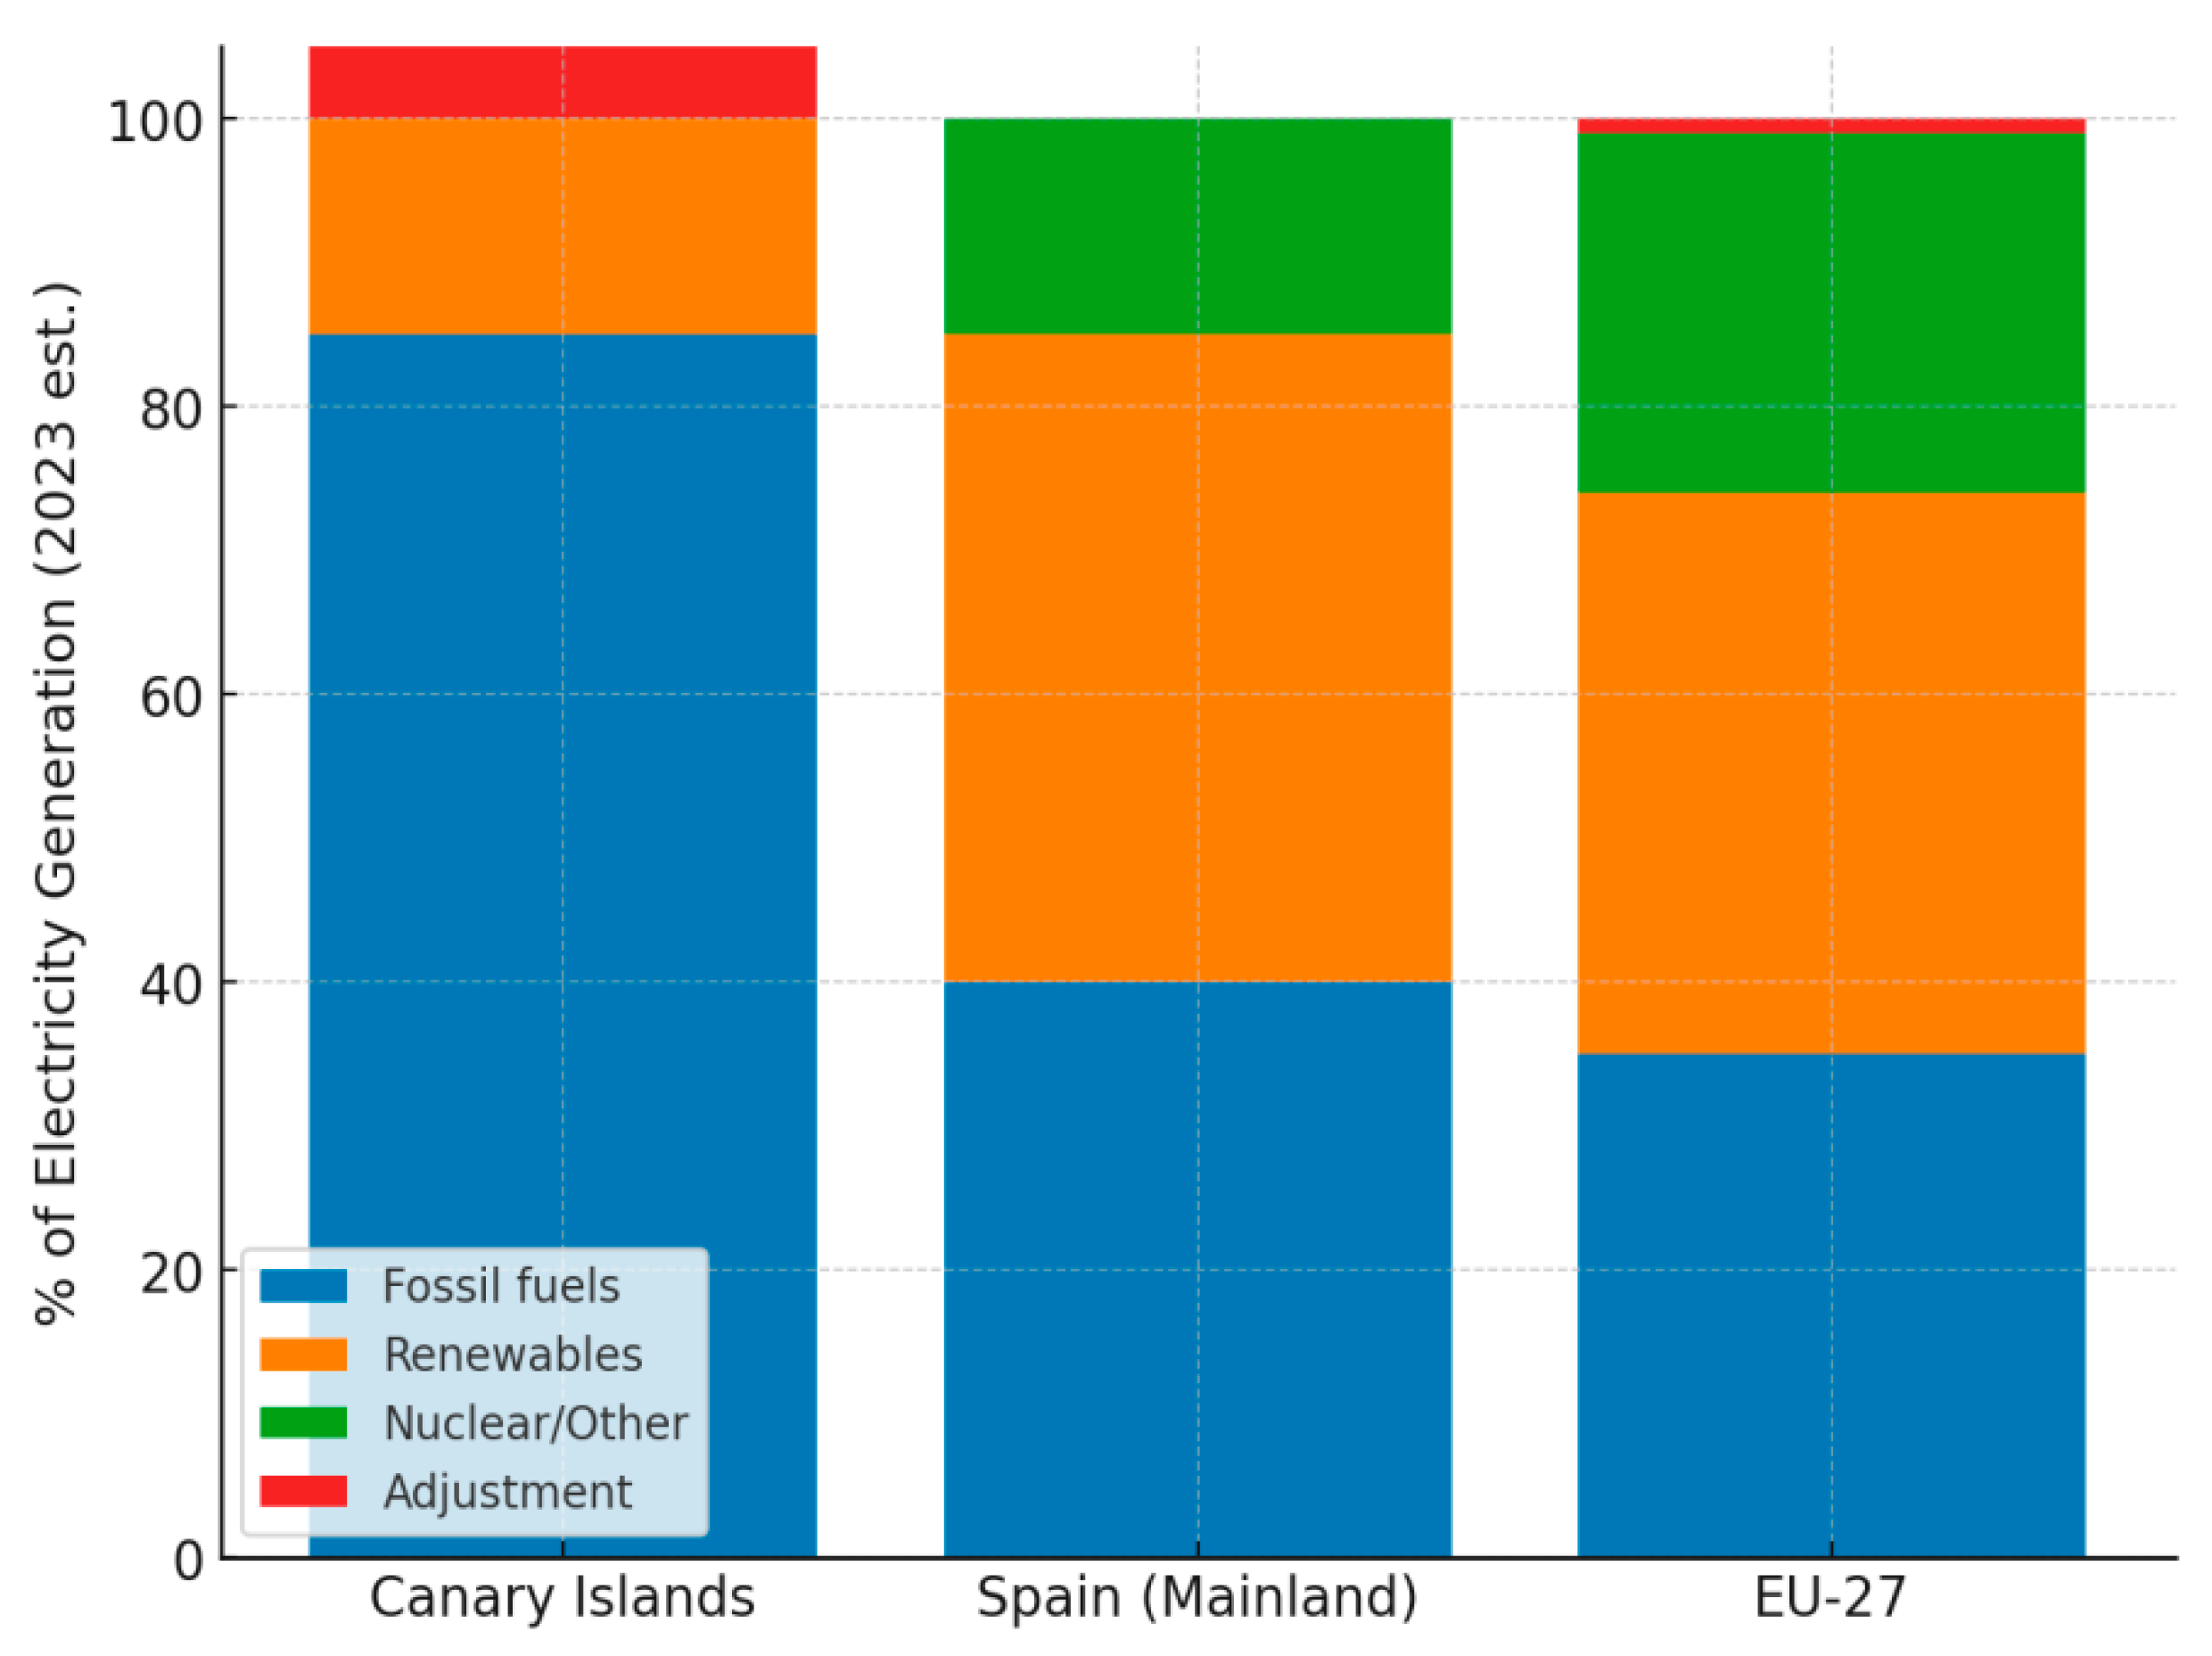
Figure 3.
Electricity generation mix: Canary Islands vs. Spain vs. EU-27. Source: authors.
Figure 3.
Electricity generation mix: Canary Islands vs. Spain vs. EU-27. Source: authors.
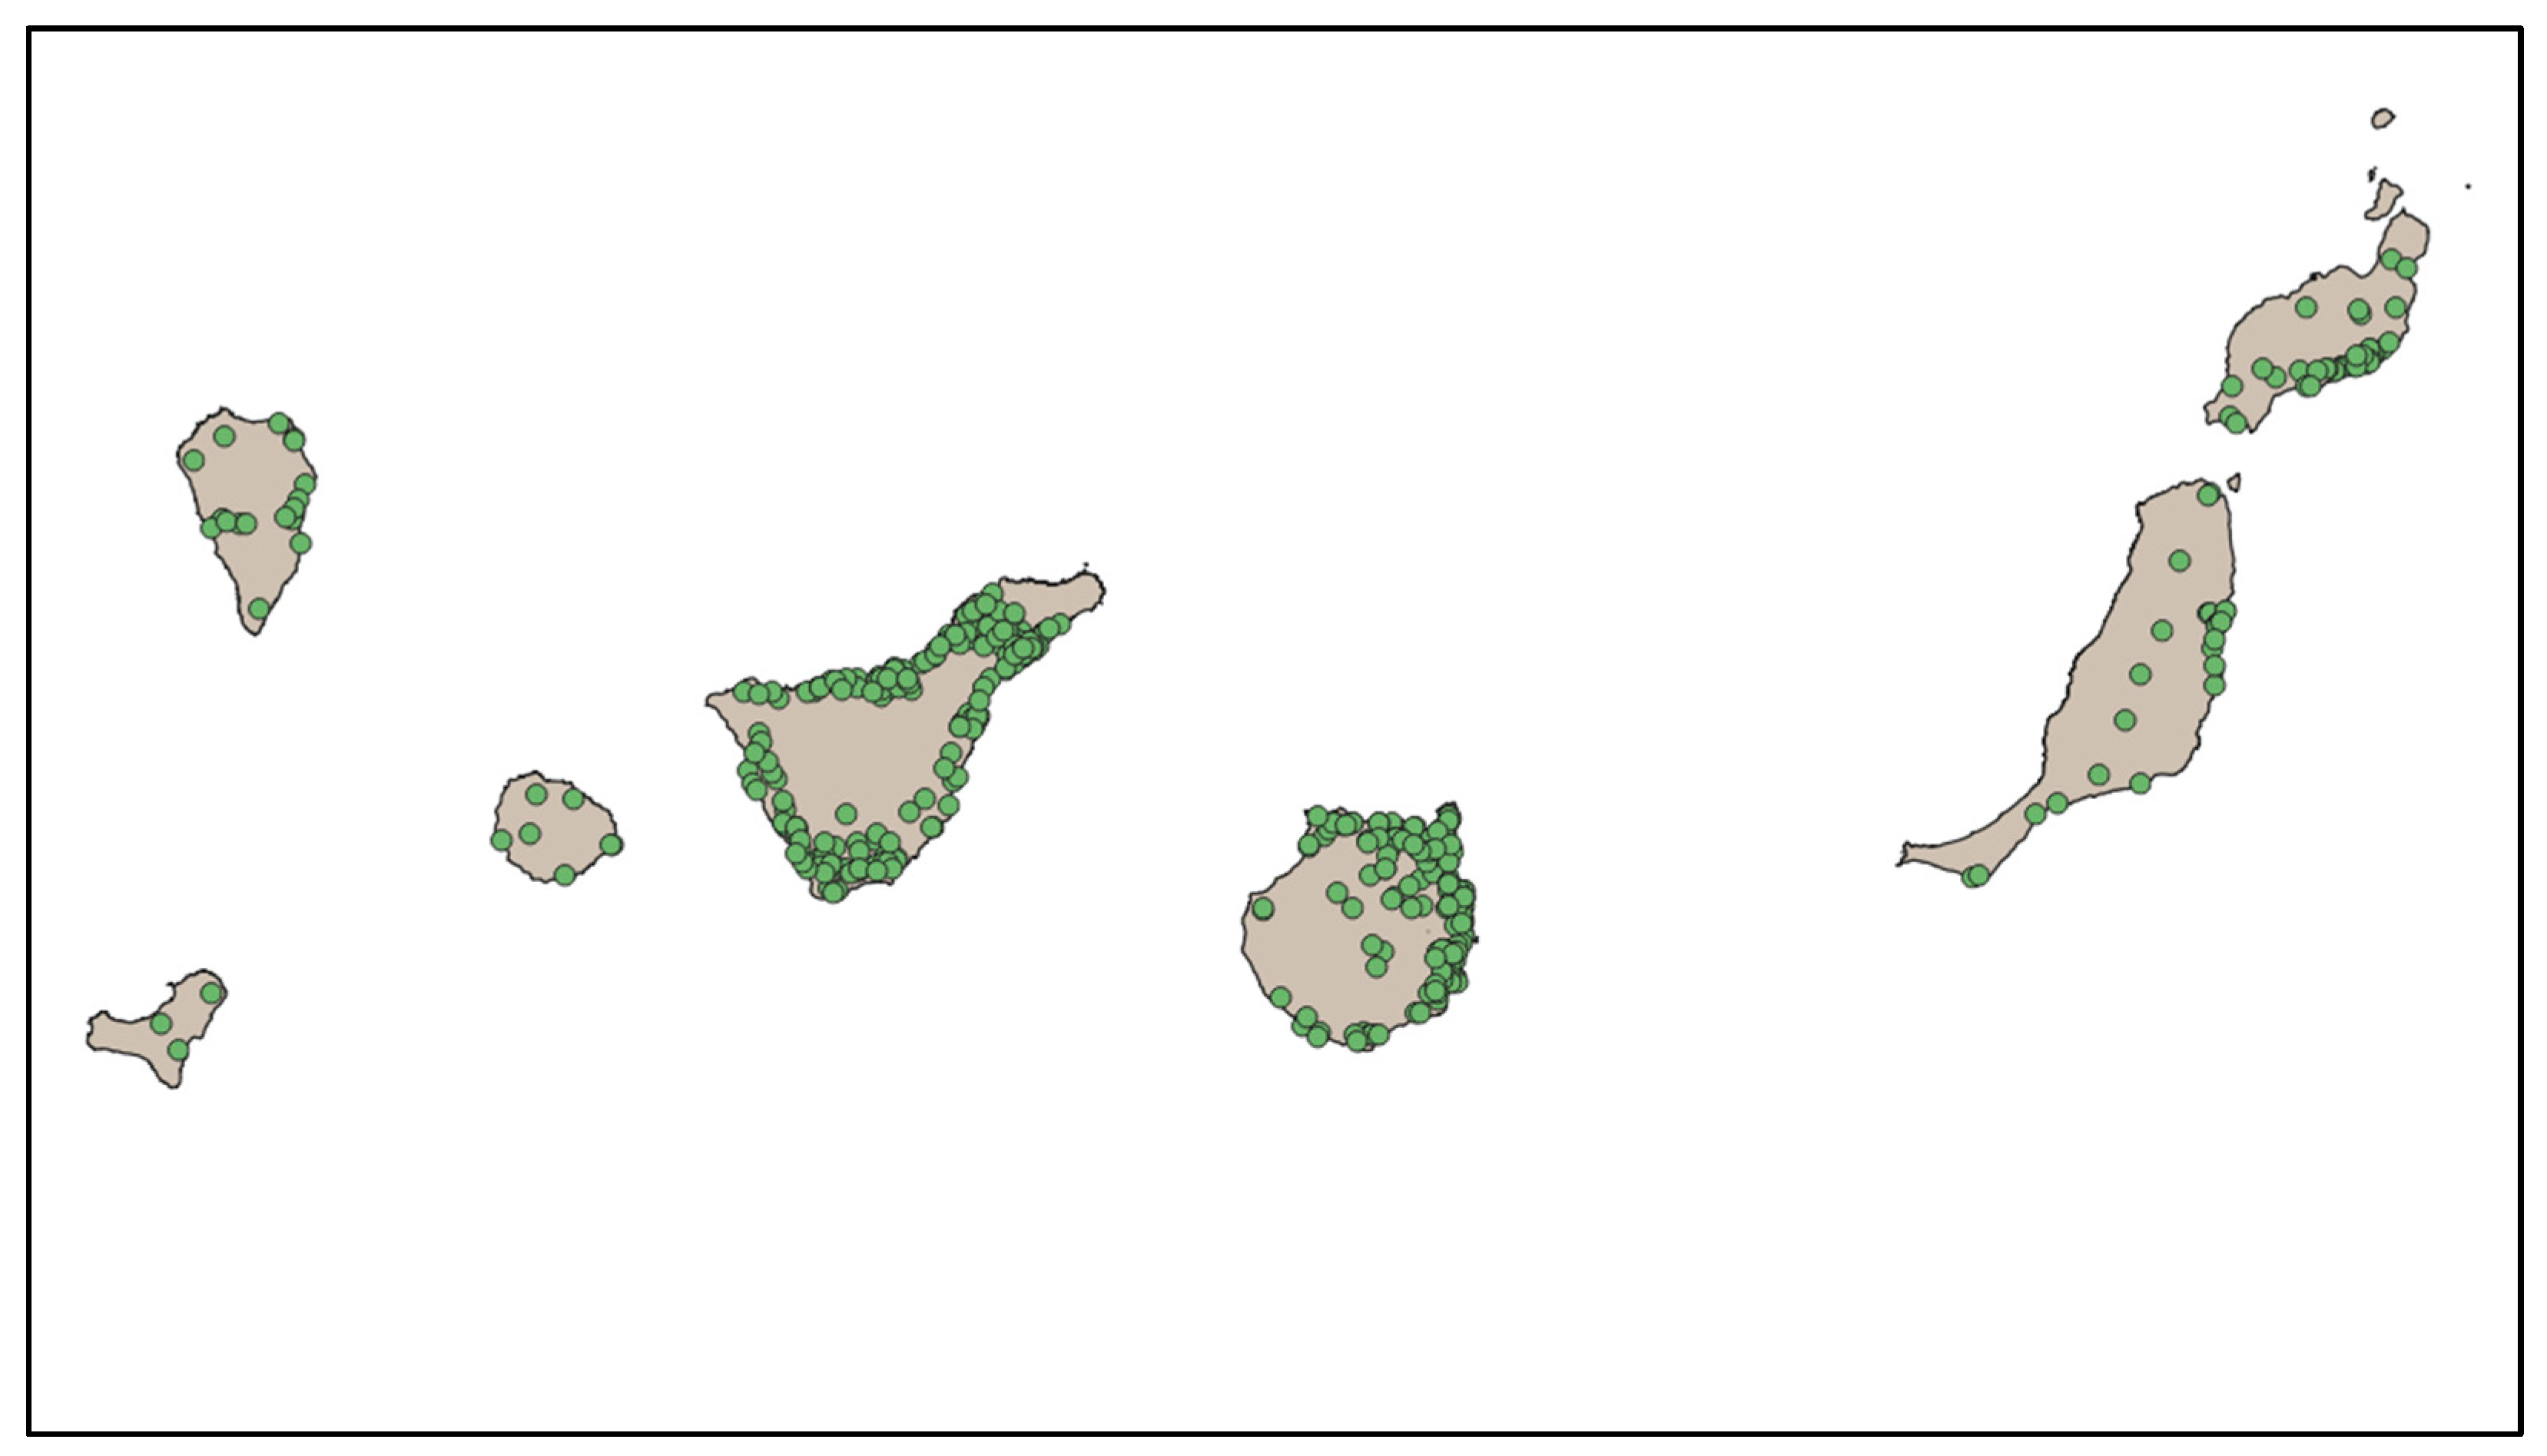
Figure 4.
Distribution of current fuel stations (green points) in Canary Islands. Source: Authors.
Figure 4.
Distribution of current fuel stations (green points) in Canary Islands. Source: Authors.
Figure 5.
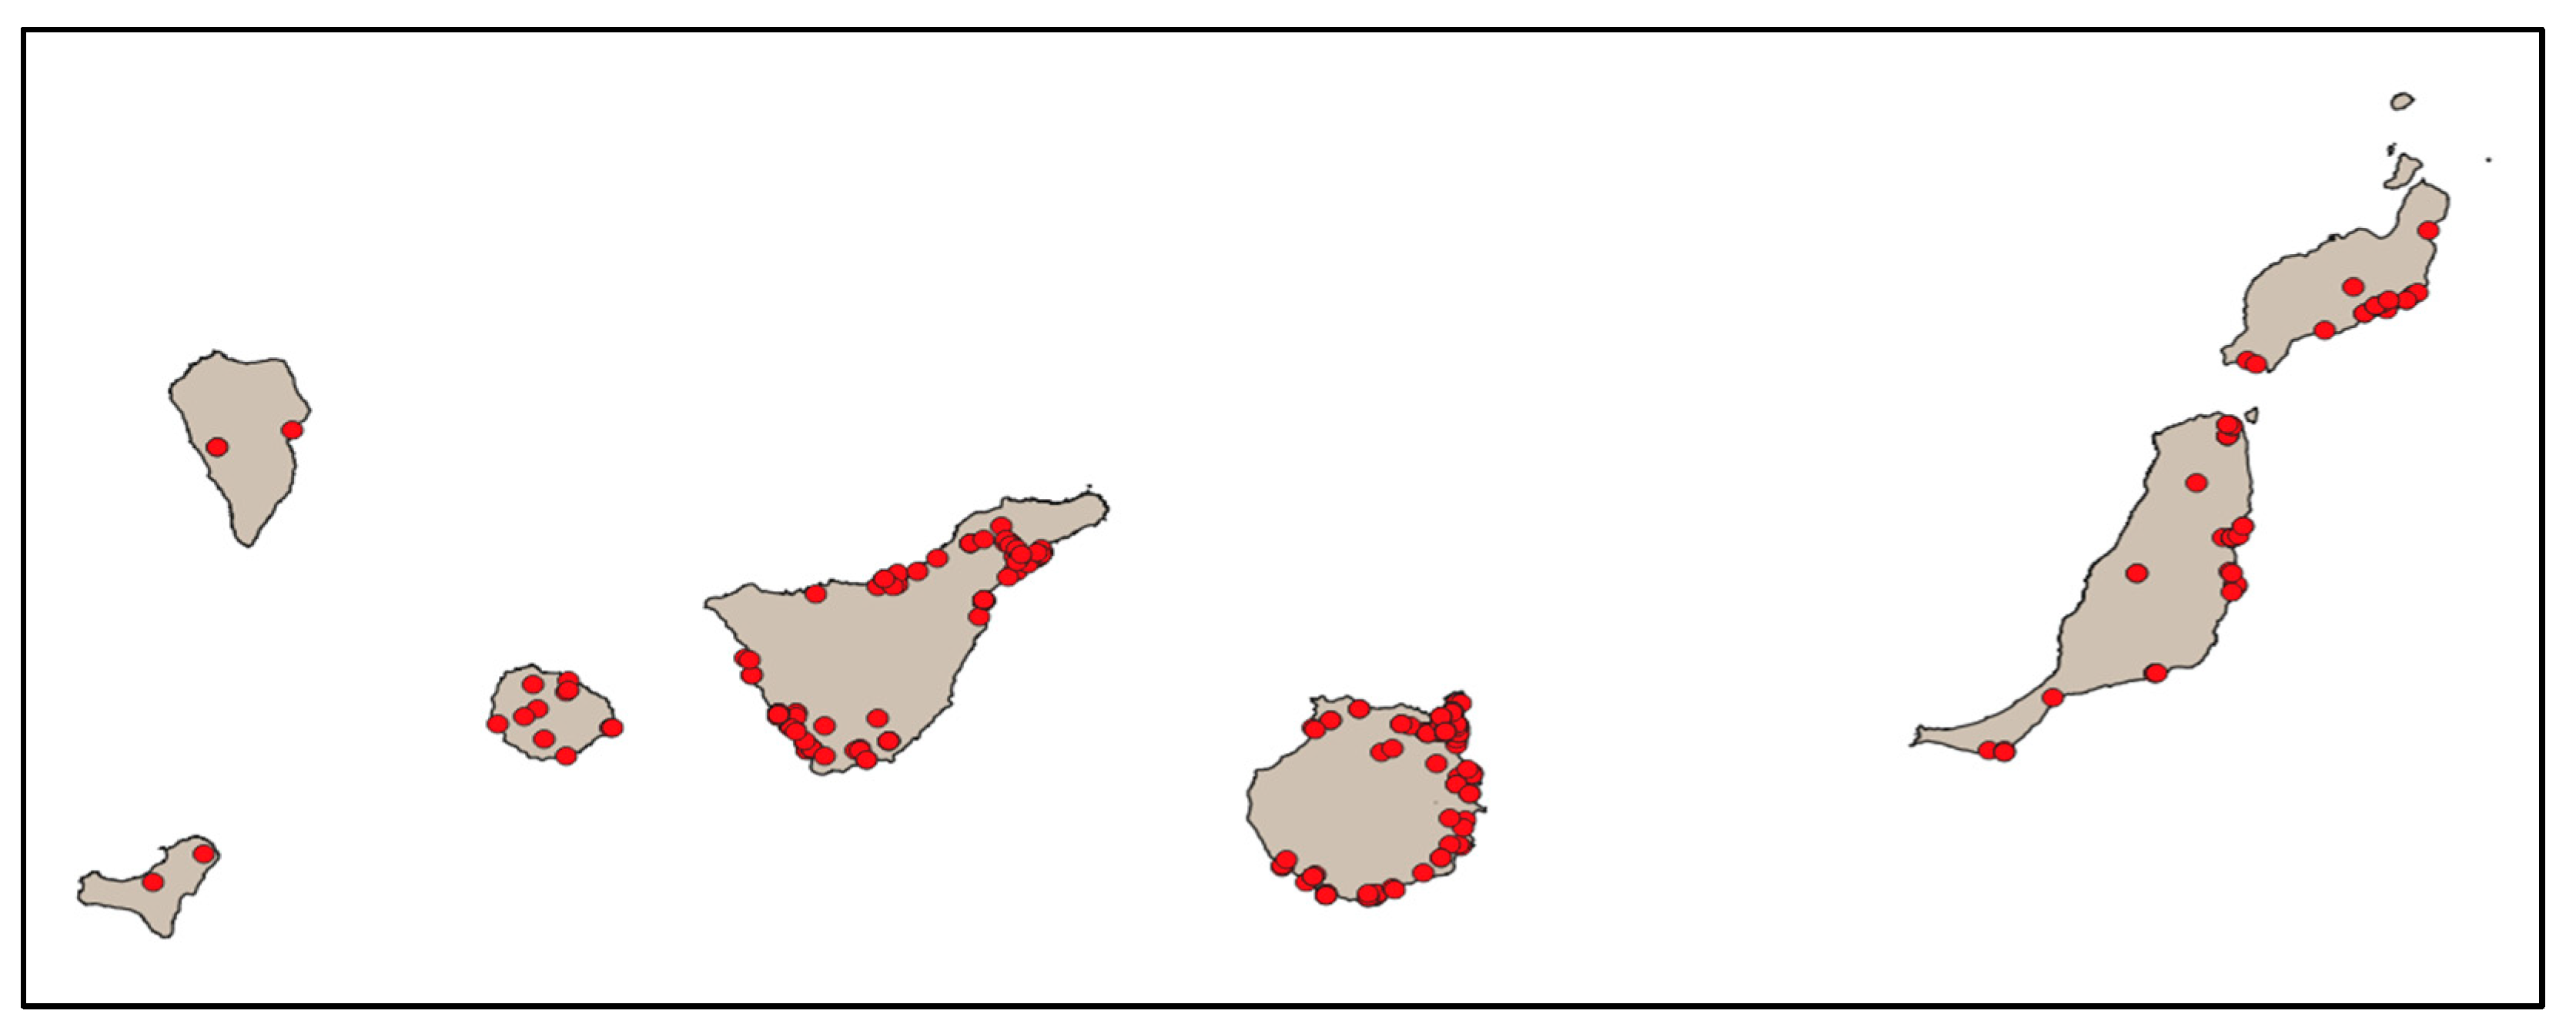
Distribution of current charging points (red points) in Canary Islands. Source: Authors.
Figure 5.
Distribution of current charging points (red points) in Canary Islands. Source: Authors.
Figure 6.
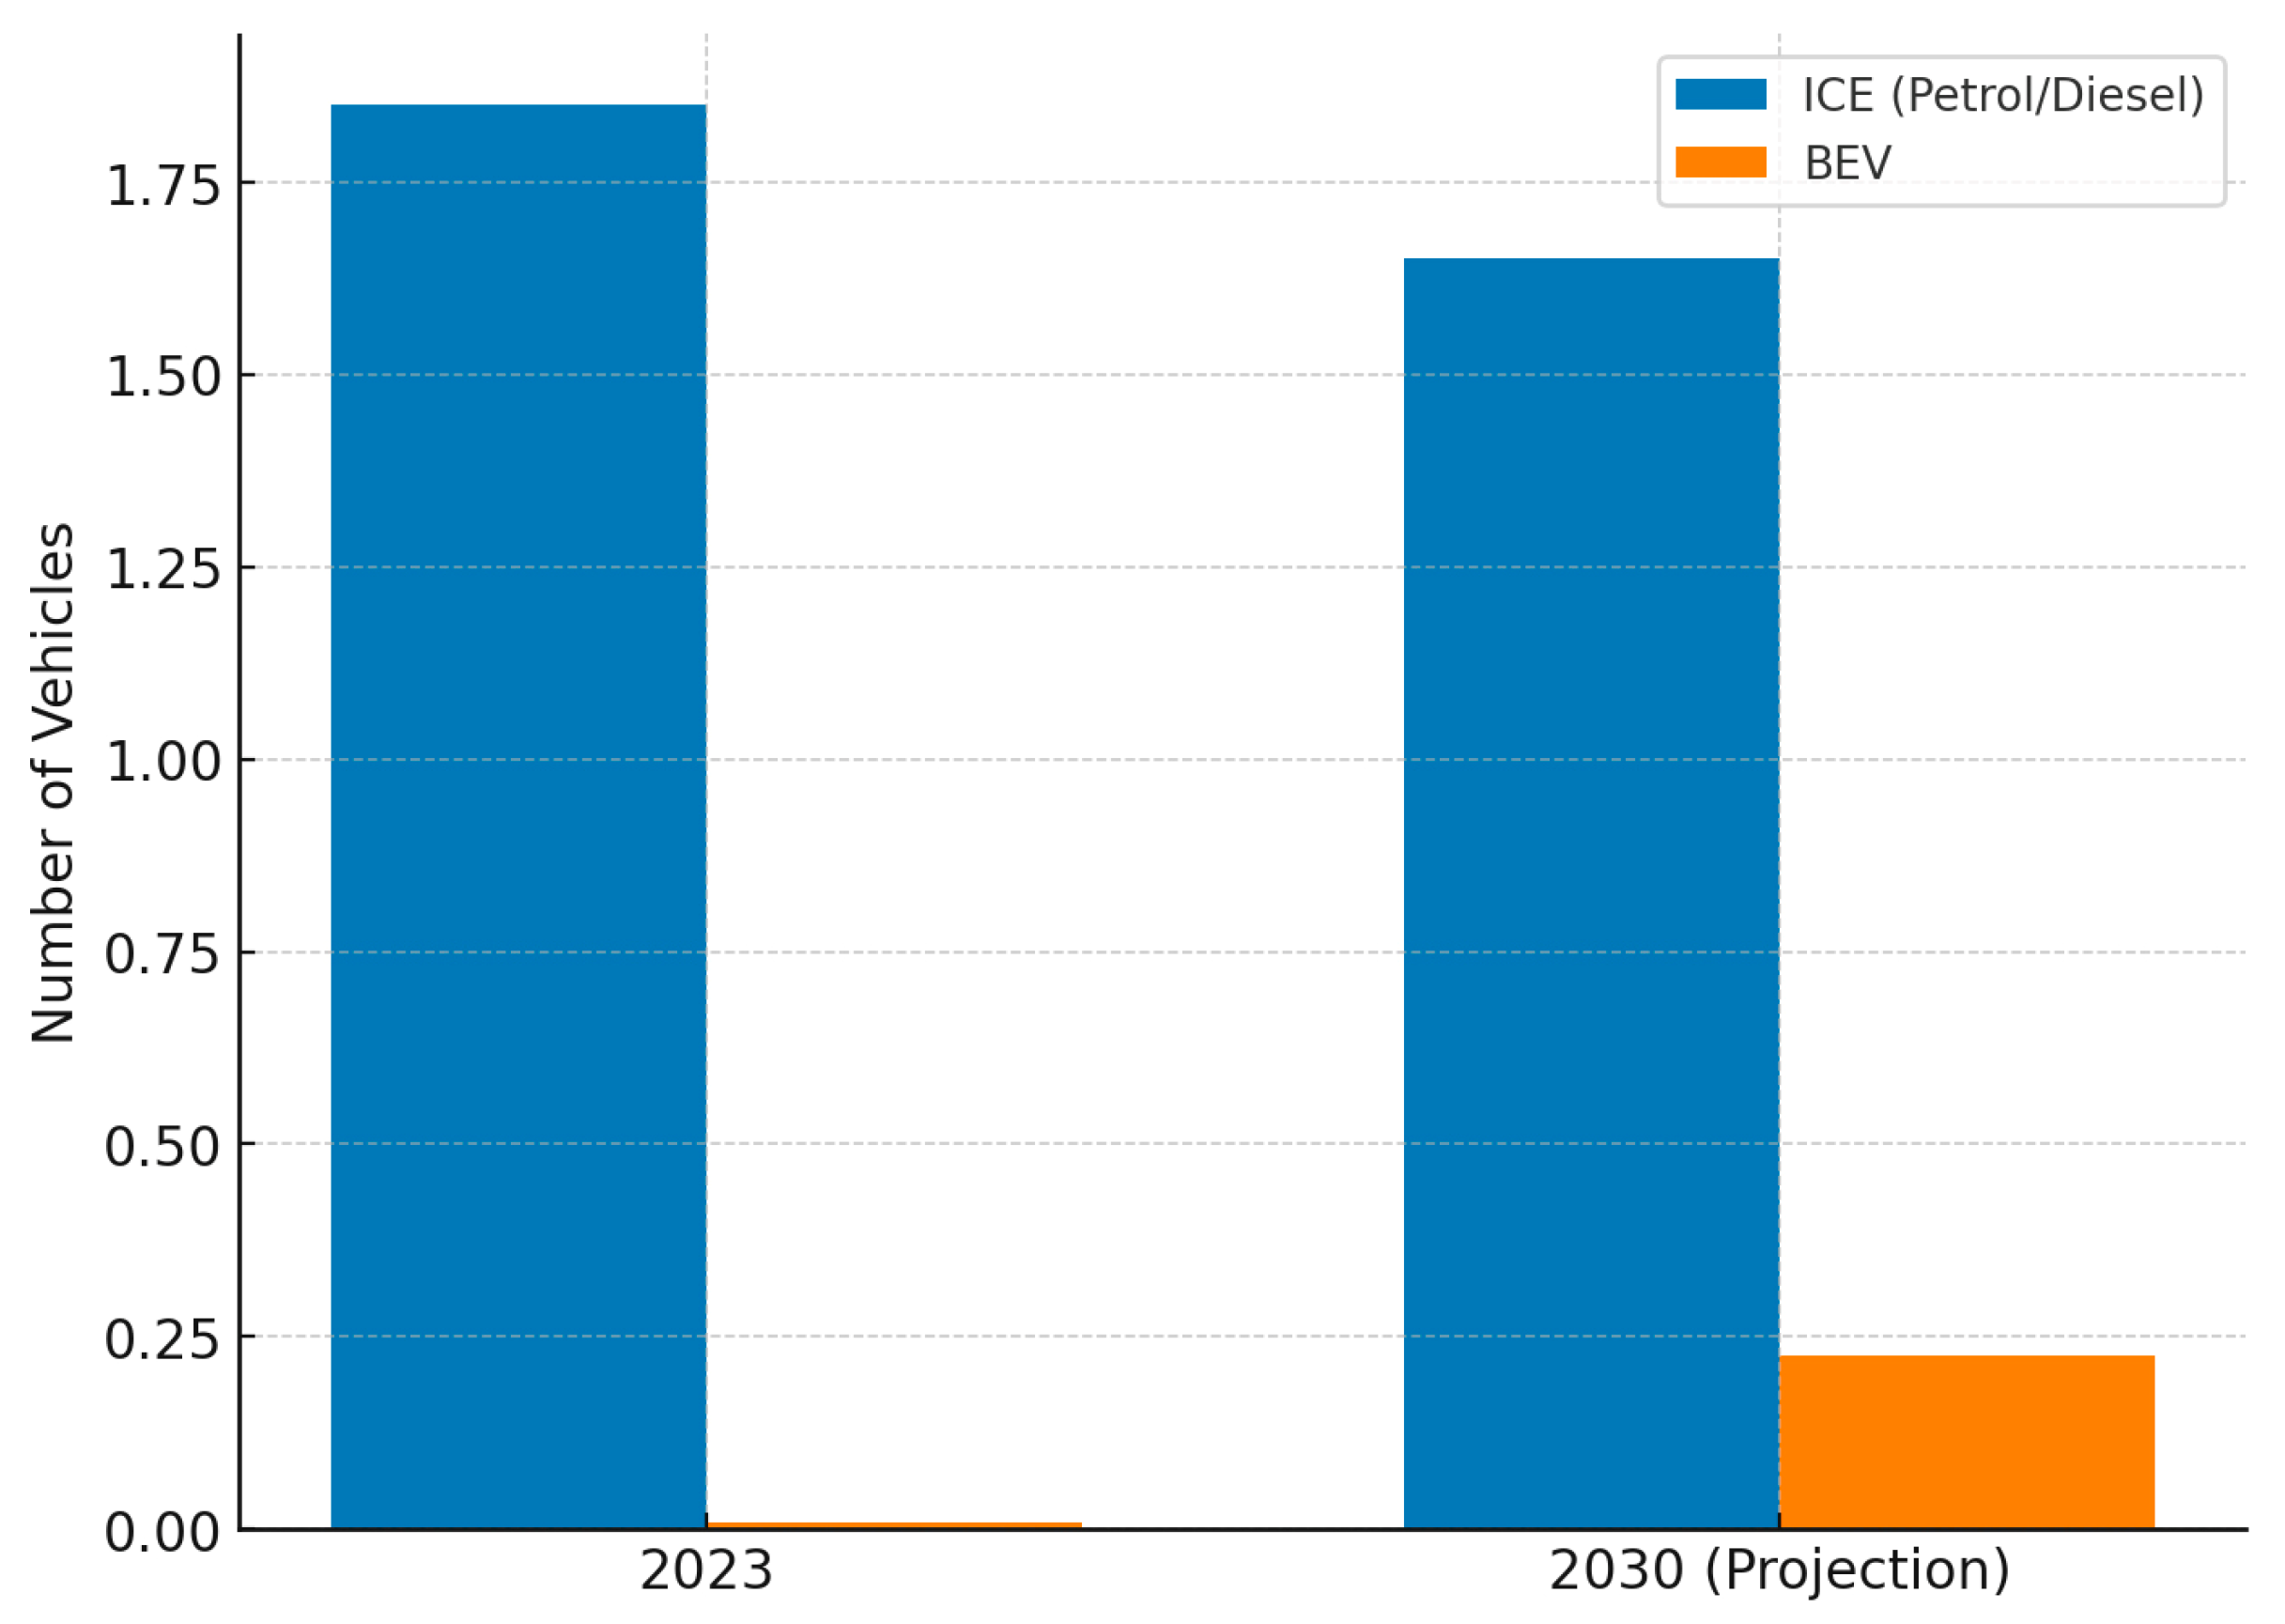
Projected evolution of the vehicle fleet in the Canary Islands. Source: Authors.
Figure 6.
Projected evolution of the vehicle fleet in the Canary Islands. Source: Authors.
Figure 7.
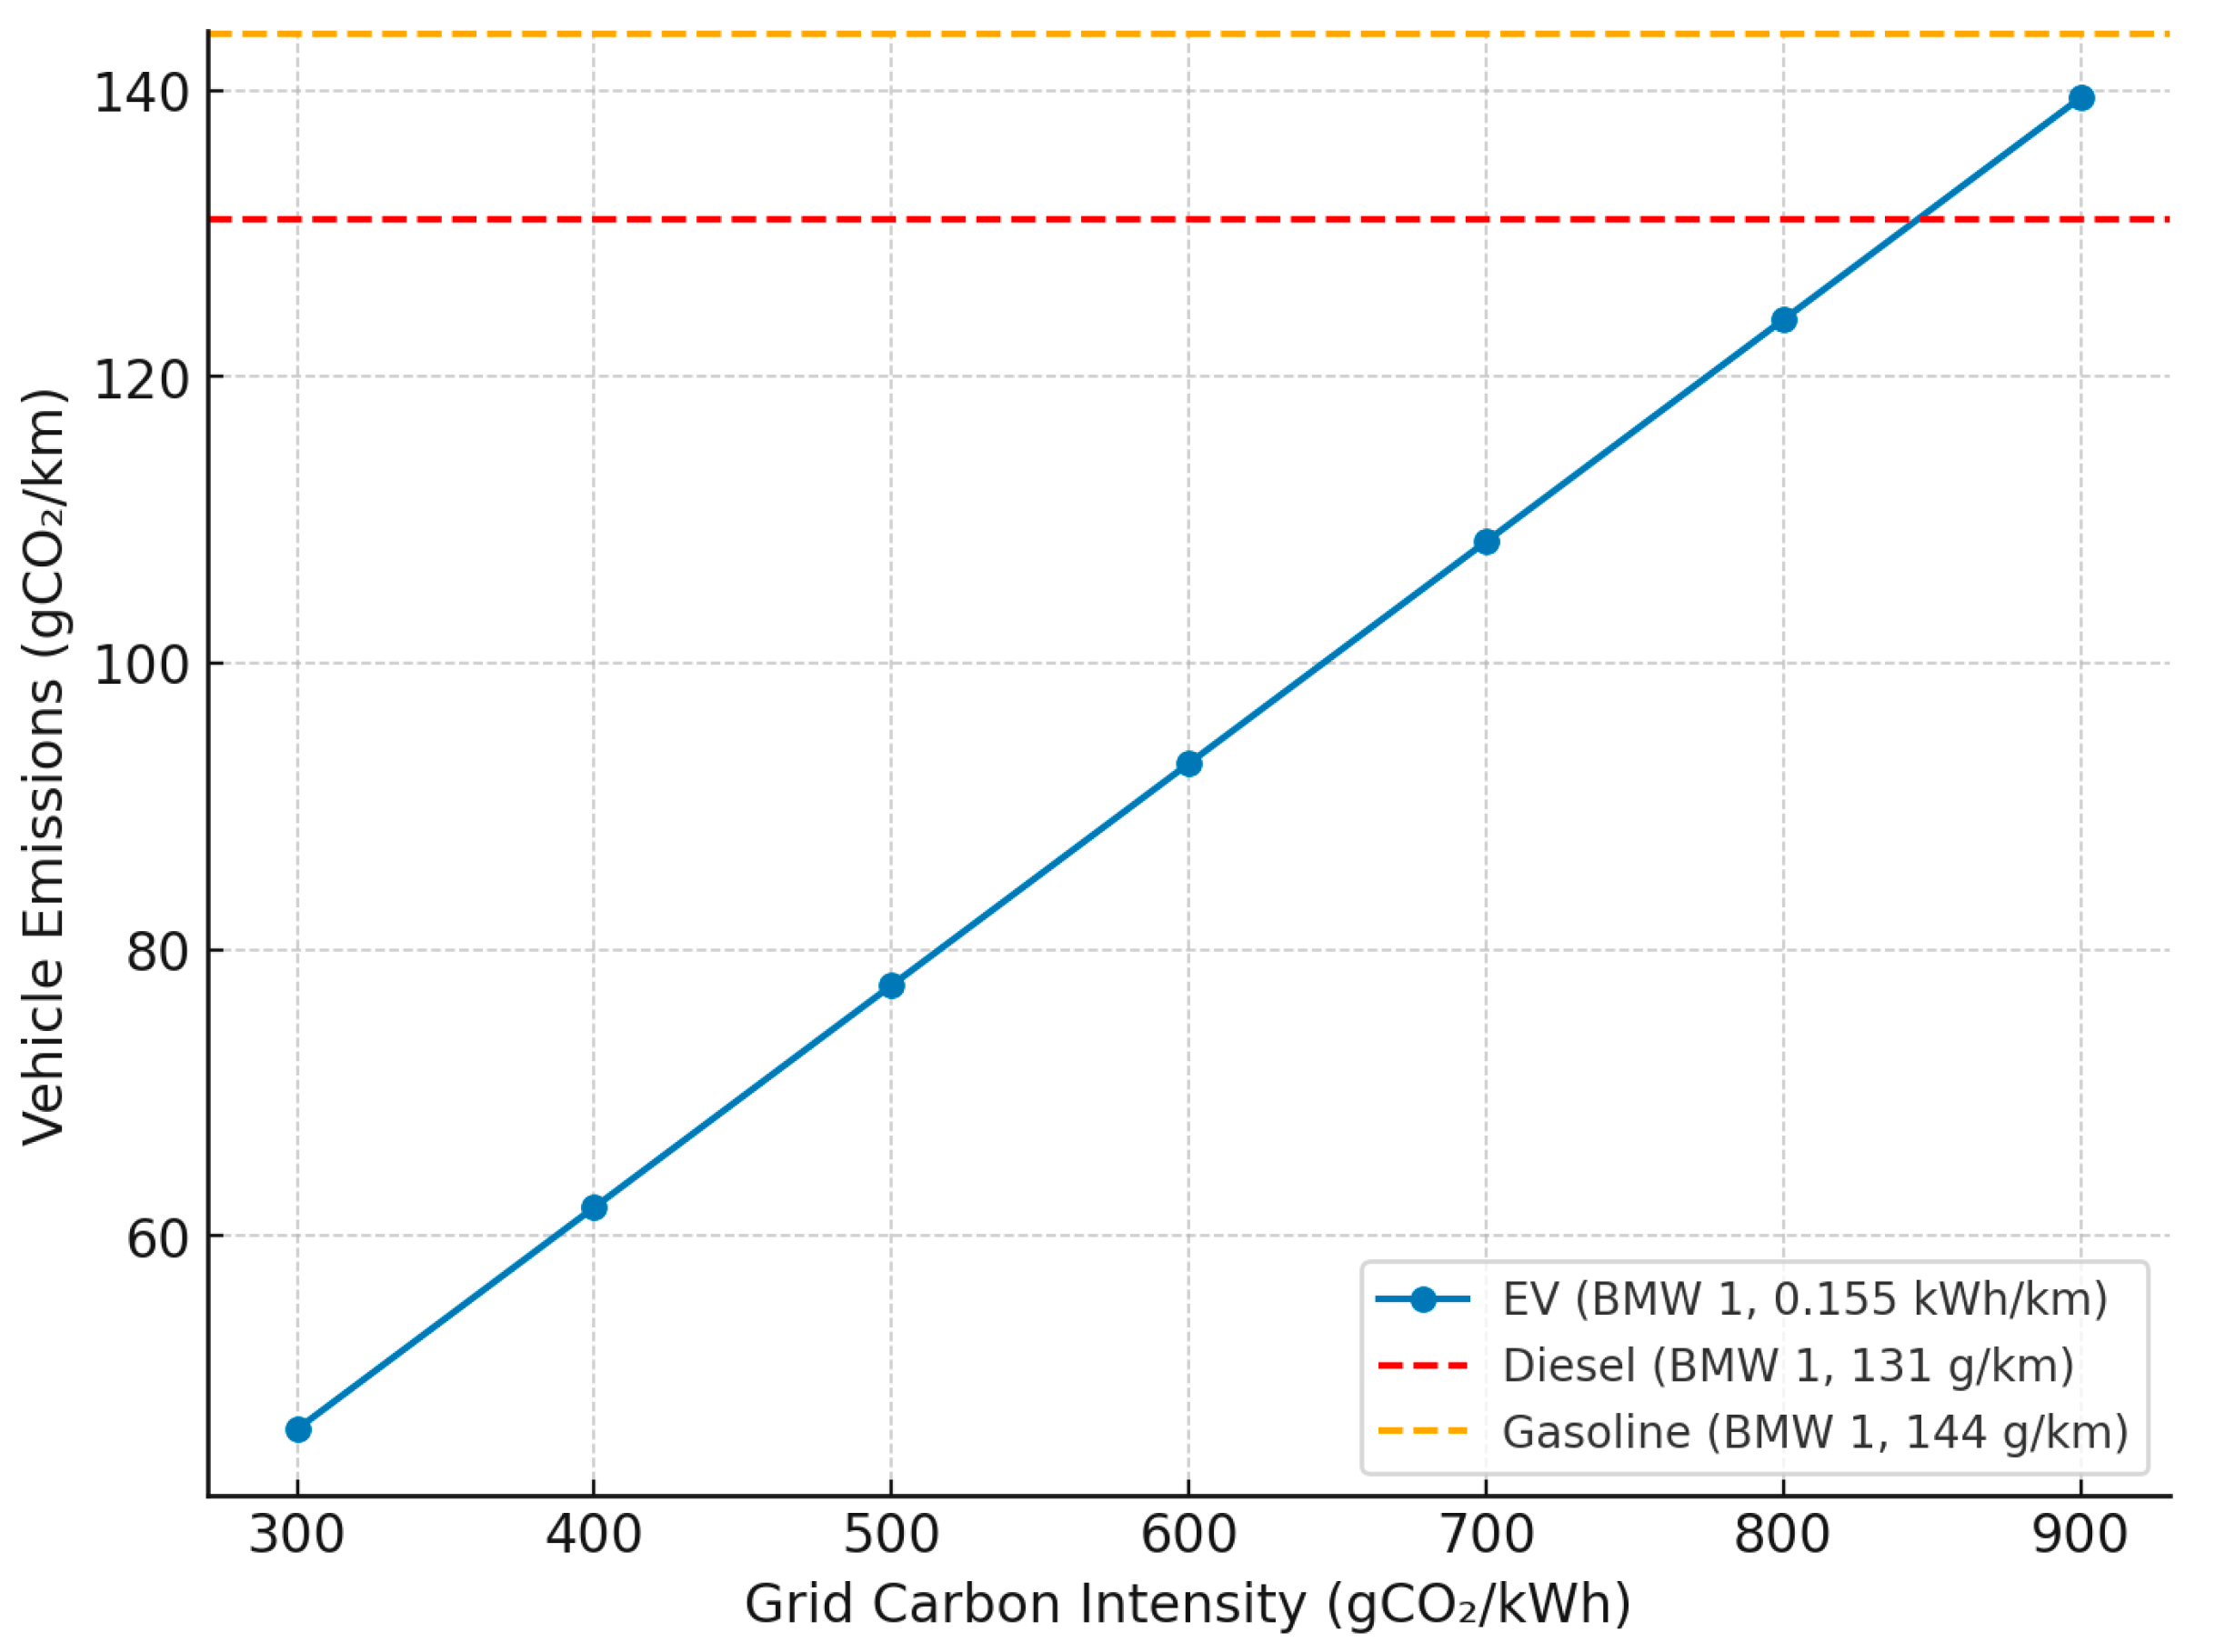
Comparison of EV vs. diesel/gasoline emissions in the Canary Islands. Source: Authors.
Figure 7.
Comparison of EV vs. diesel/gasoline emissions in the Canary Islands. Source: Authors.
Figure 8.
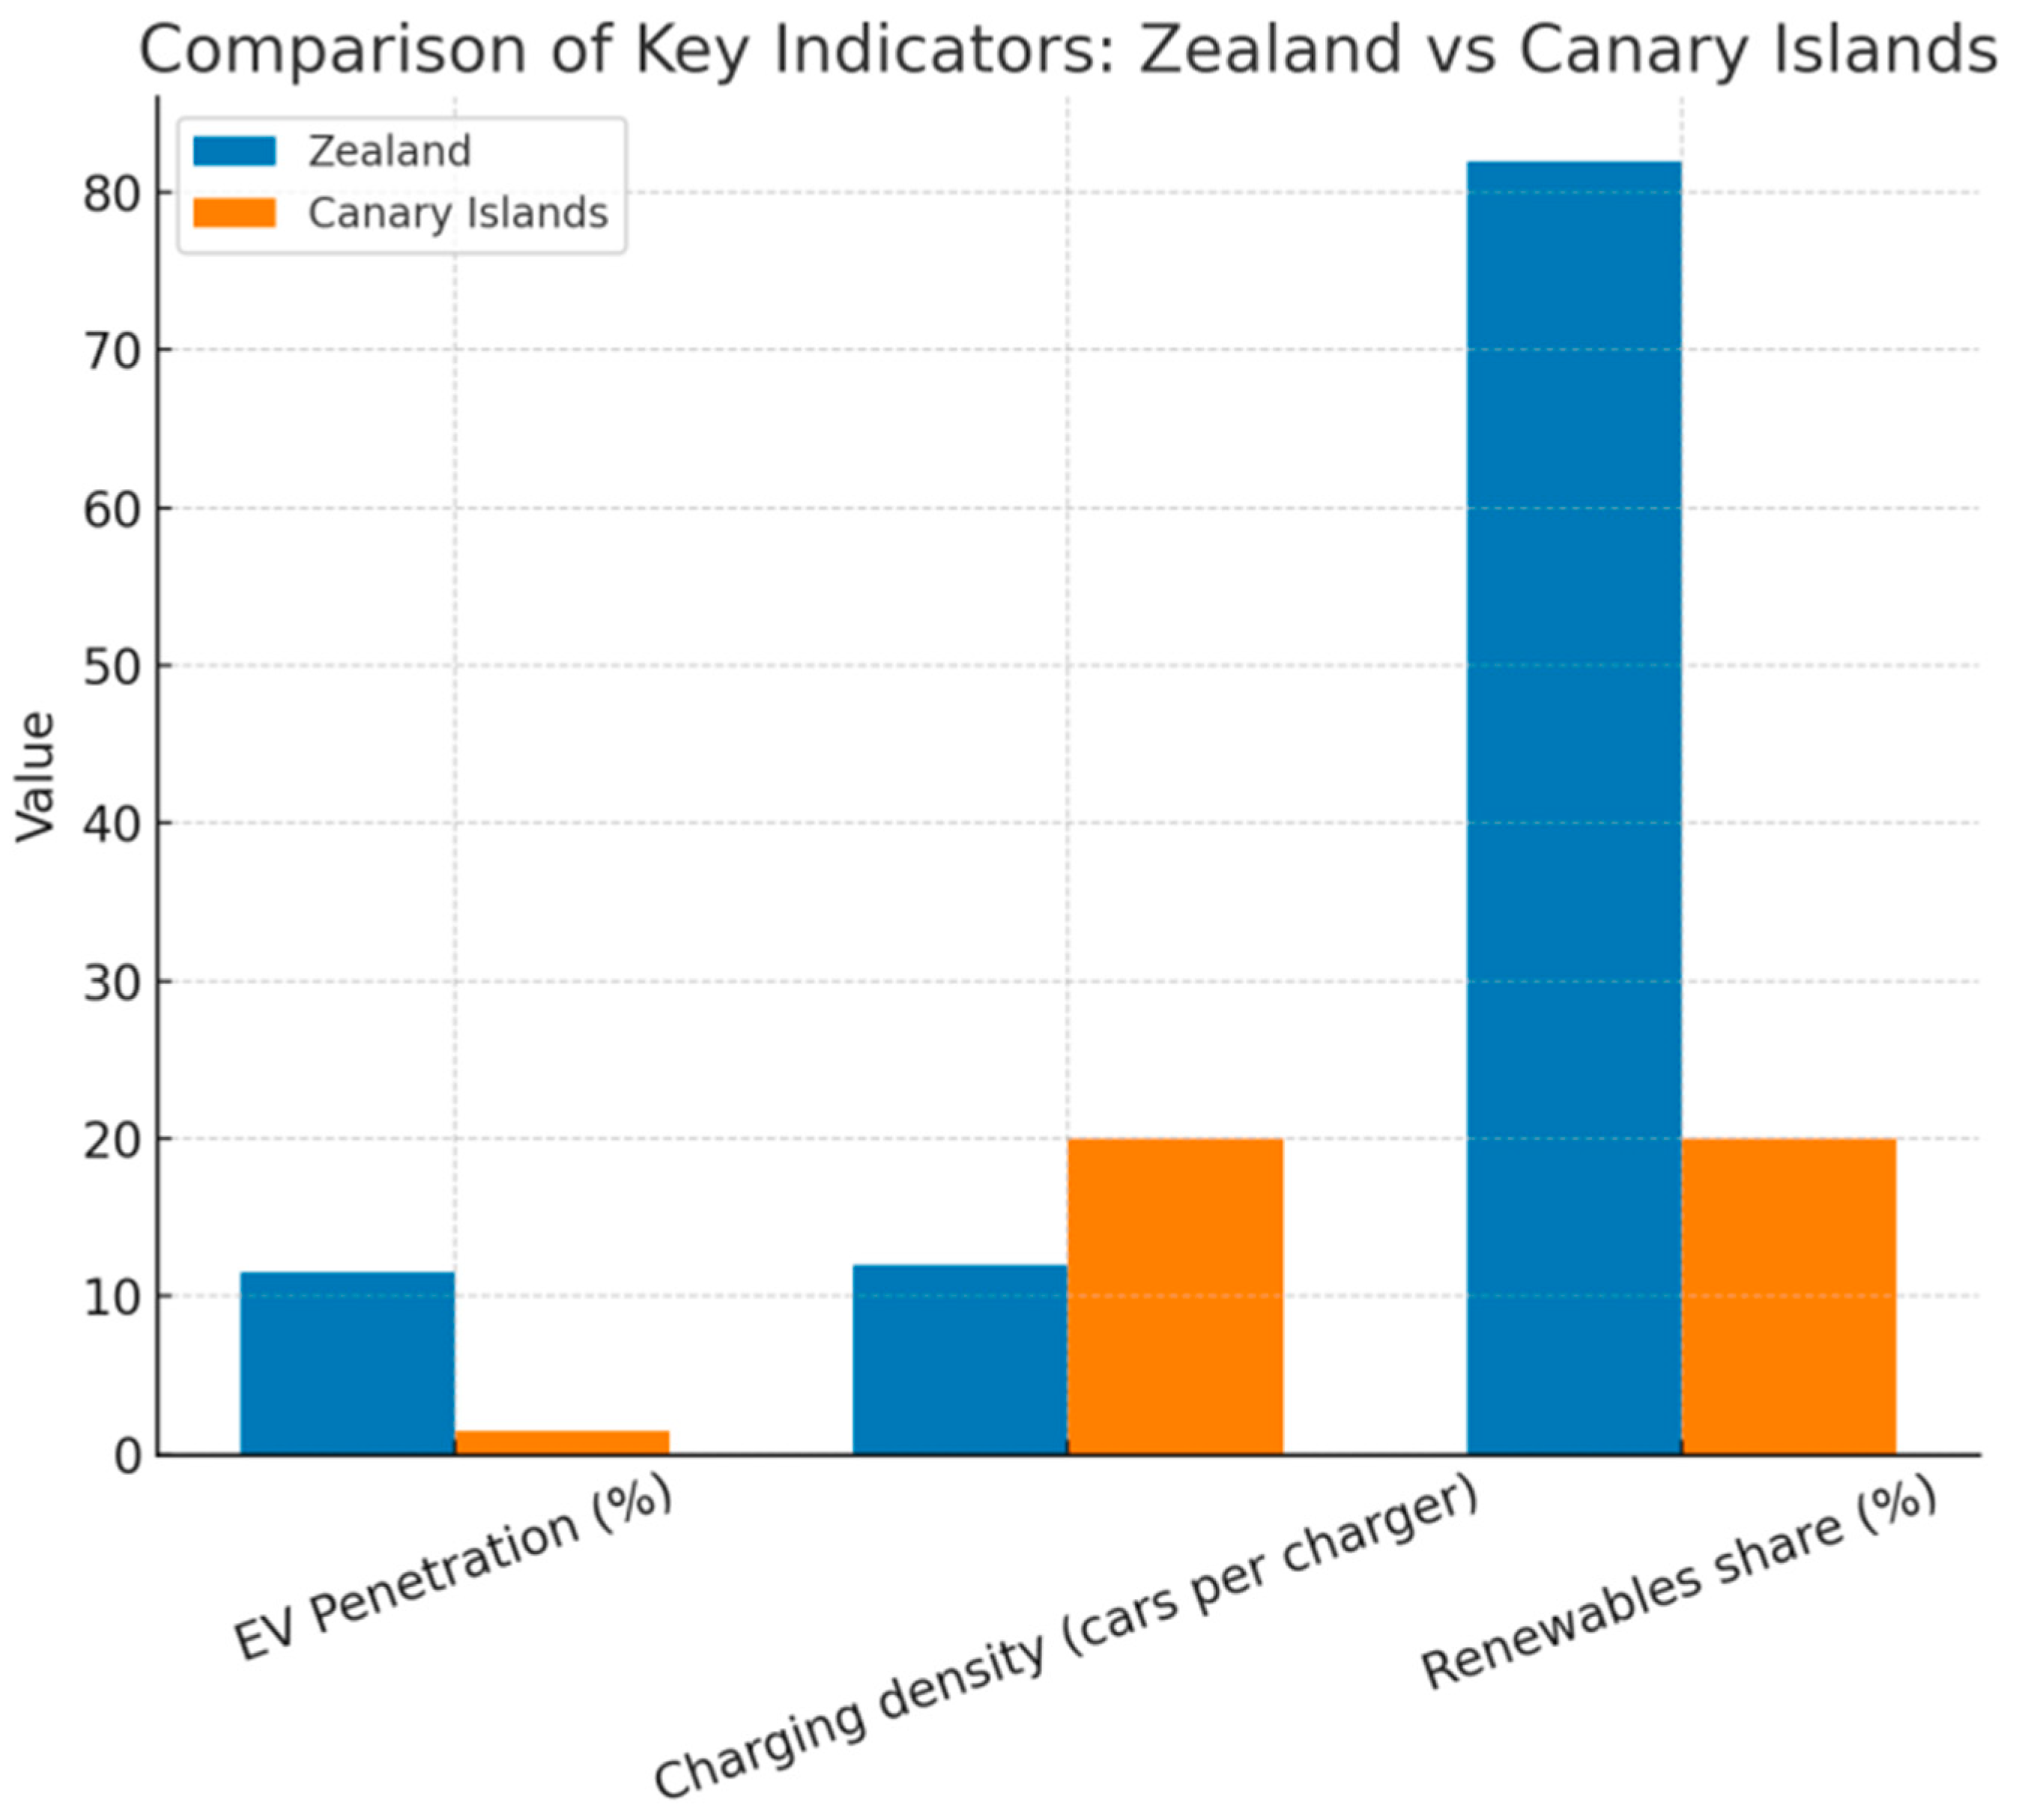
Differences between Zealand and the Canary Islands in terms of EV penetration, charging density, and renewable energy share. Zealand exhibits a significantly higher EV adoption rate (11.5% vs. 1.5%), a denser charging network (1 charger per 12 vehicles vs. 1 per 20 vehicles), and a markedly higher renewable integration (80% vs. 20%). Source: authors. Data sources: Redeia/OECAN for Canary generation mix and renewables share; ISTAC/DGT for vehicle stock (Canary Islands); MITECO/REE ‘REVE’ map for Spanish public points; Danish Energy Agency/Energinet energy statistics for renewables in electricity; StatBank Denmark for car stock by fuel; and Denmark’s national mapping of charging-point data for regional charger inventories.
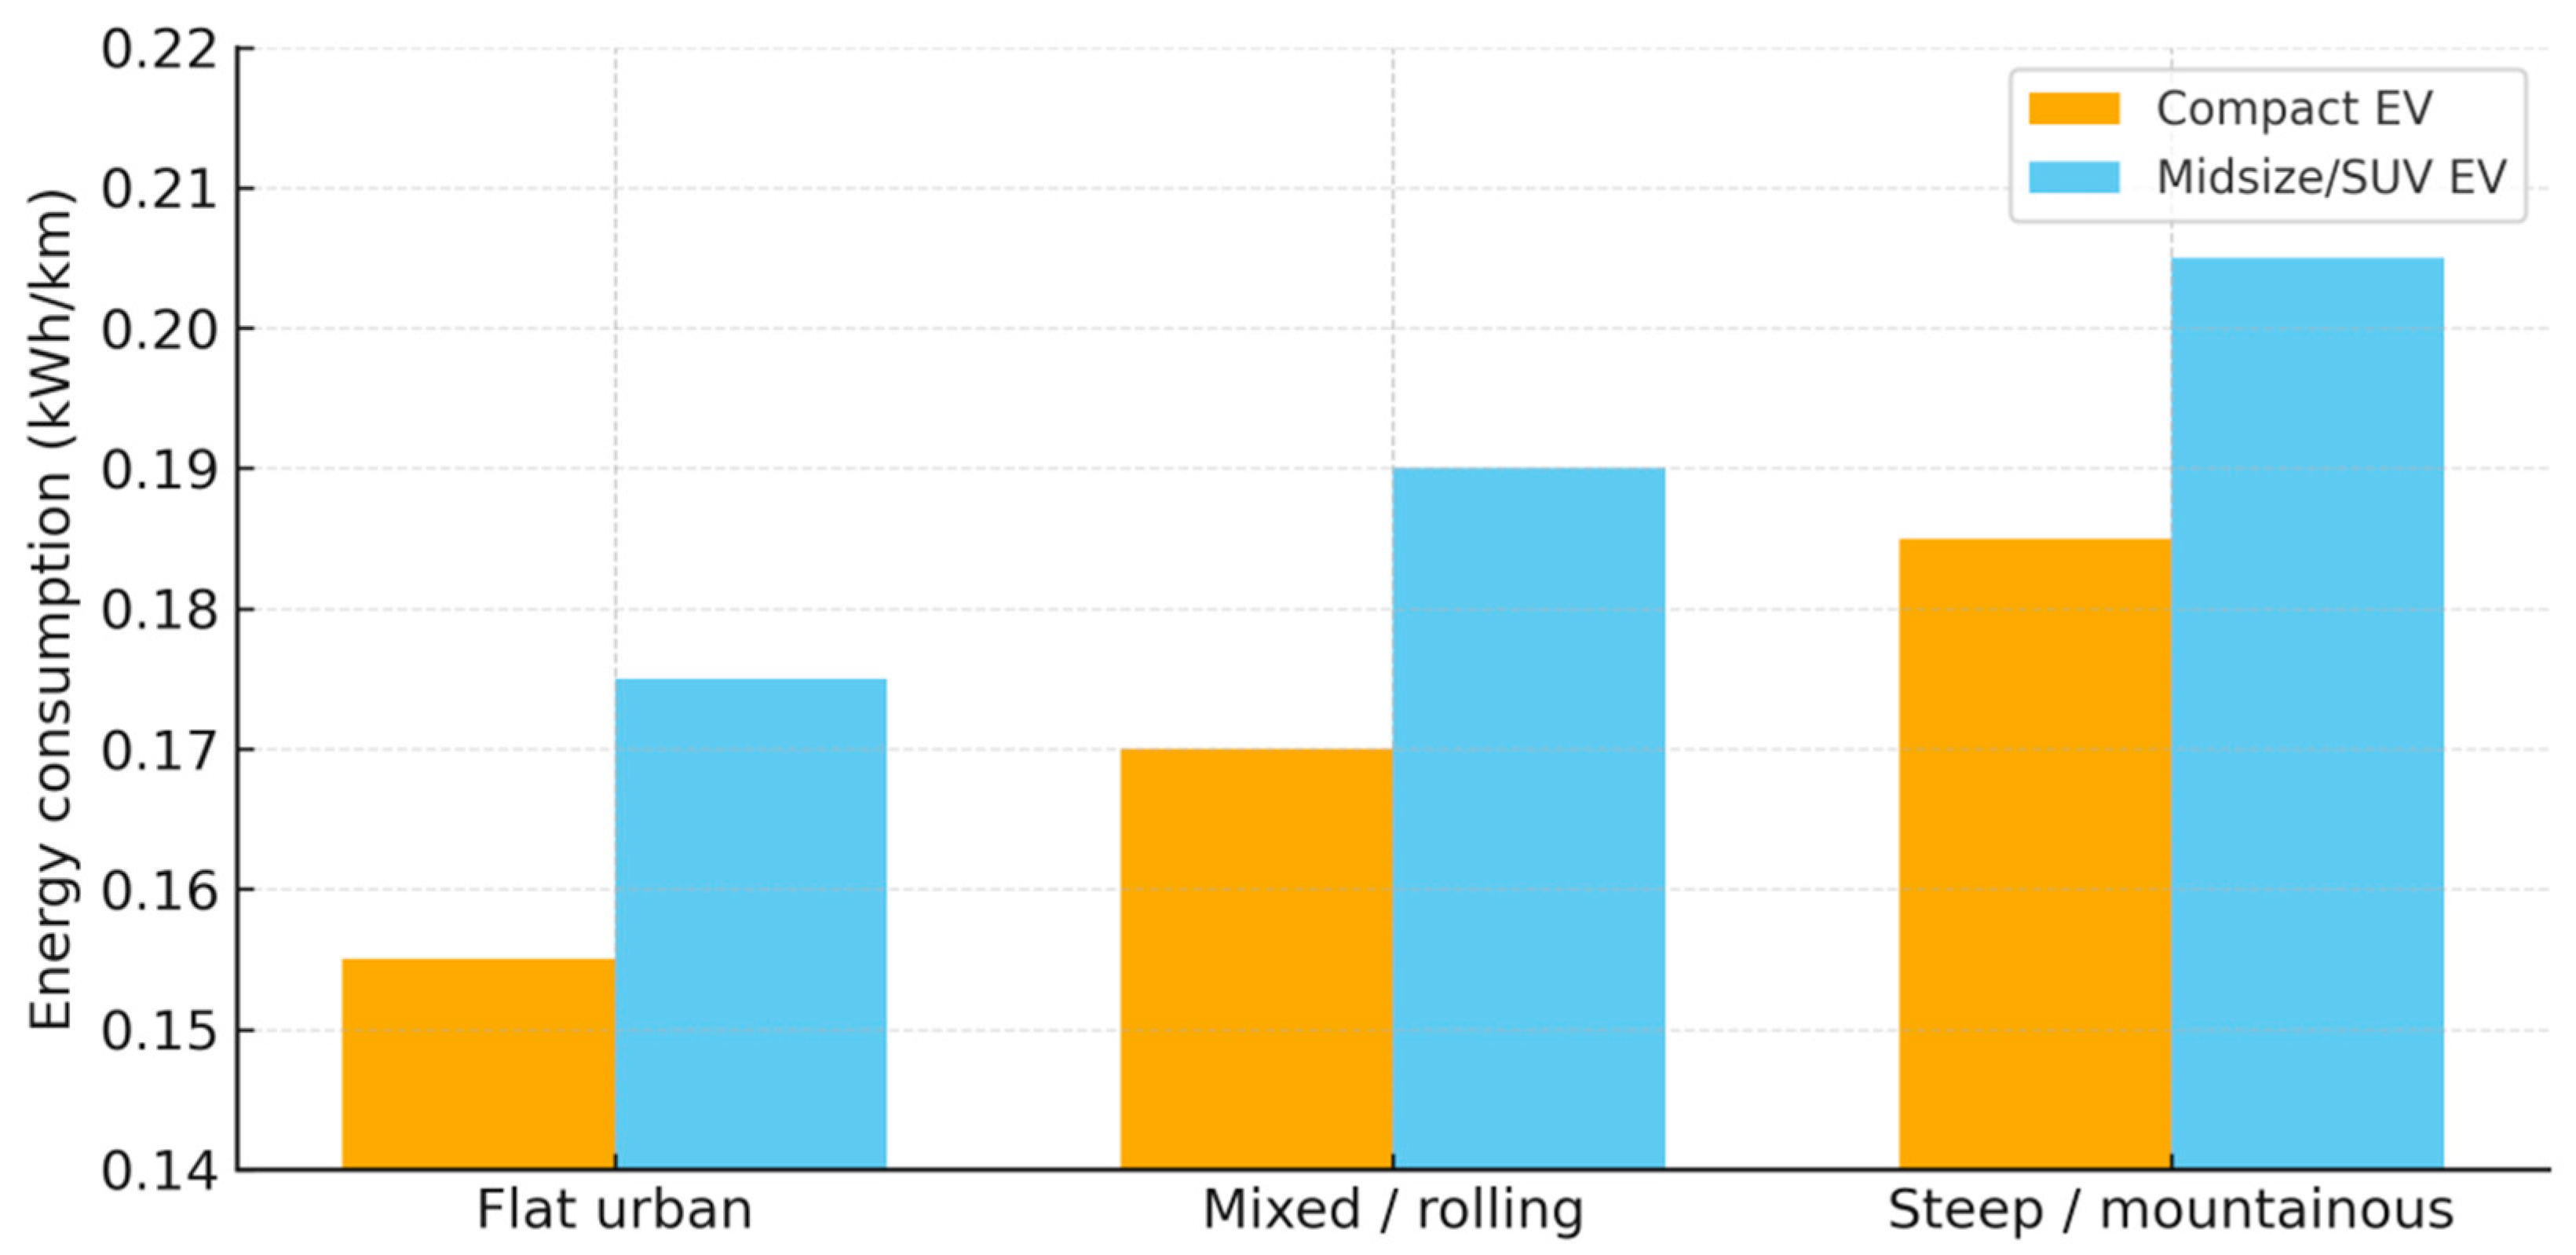
Figure 9.
Sensitivity of EV energy consumption to driving conditions and vehicle size. The figure illustrates typical real-world consumption bands for a compact EV and a midsize/SUV EVs under flat urban driving, mixed/rolling terrain, and steep/mountainous profiles. Values fall within the 0.155–0.20 kWh/km range adopted in this study, reflecting the influence of topography and vehicle mass in the Canary Islands context.
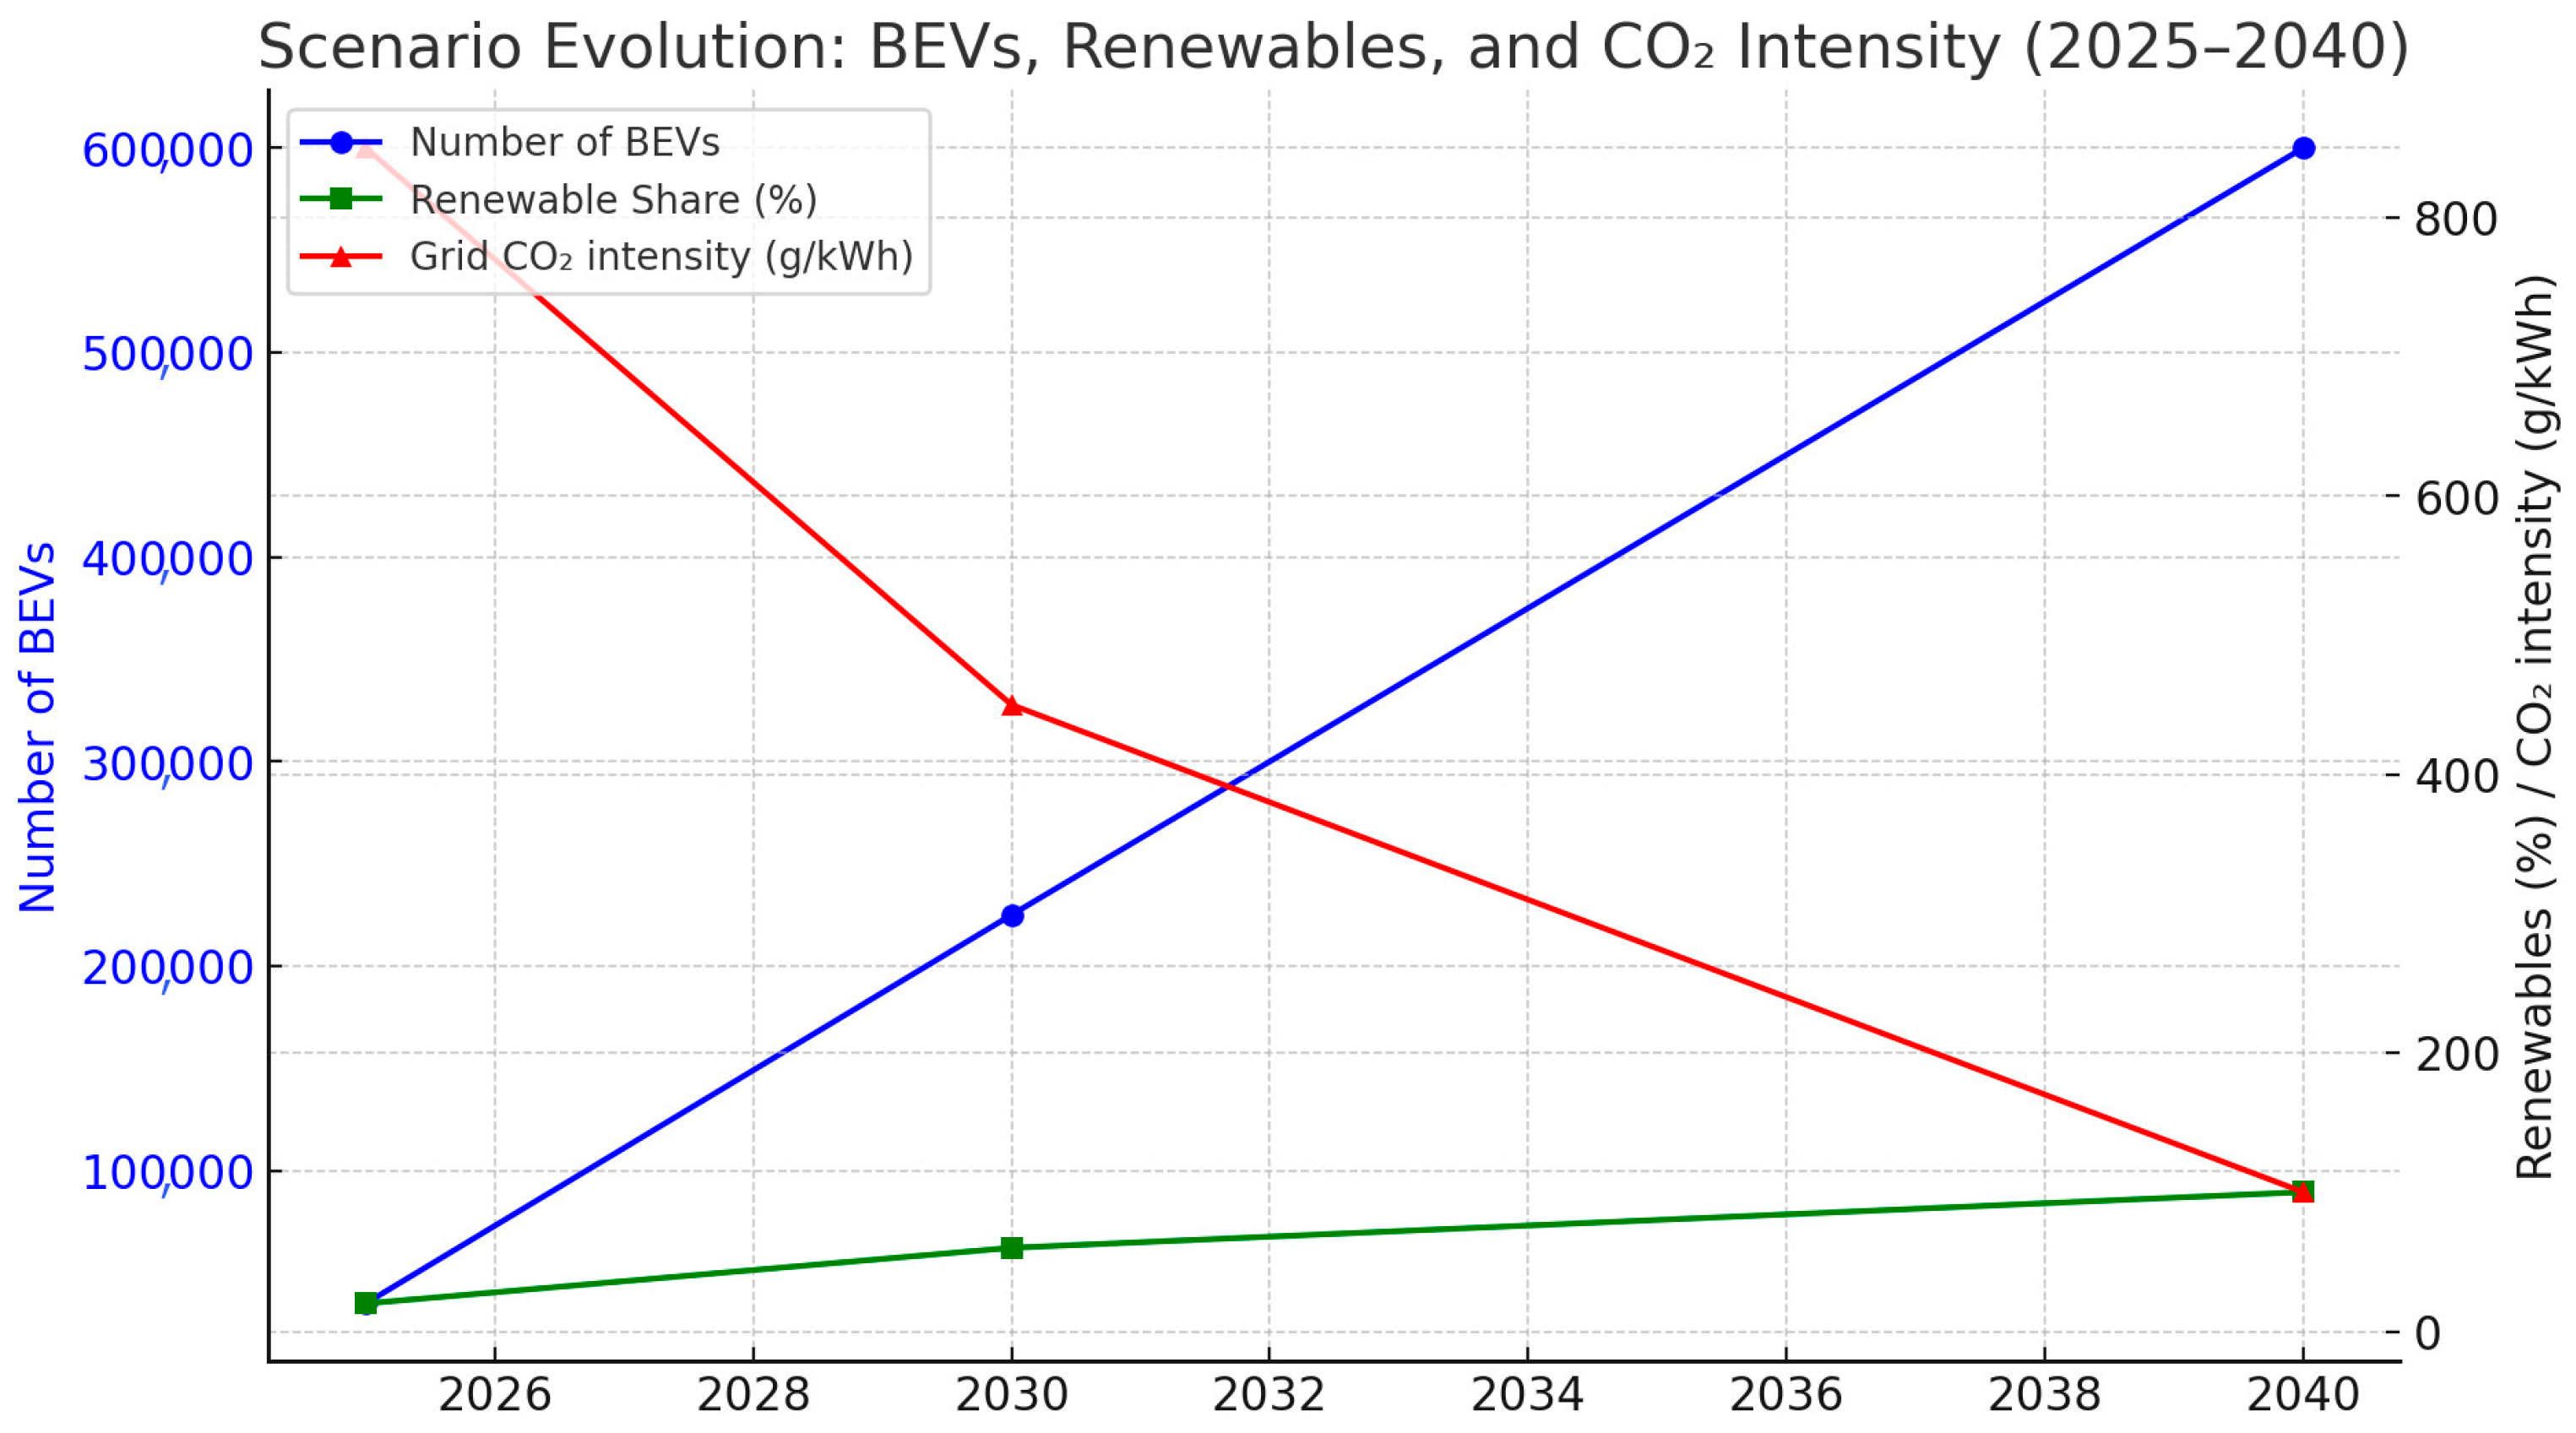
Figure 10.
Evolution of core variables across three scenarios: baseline (2025), medium-term (2030), and long-term (2040). It highlights the projected growth of battery electric vehicles (BEVs), the increasing share of renewables in the generation mix, the corresponding reduction in grid carbon intensity, and the required improvements in charging infrastructure density. Source: authors. Scenario database is built through an ETL workflow that ingests only official, reproducible sources and harmonizes them to AFIR/EAFO definitions. Baseline EV stock is taken from ISTAC’s annual vehicle registry and used to derive EV shares by island; public charging infrastructure is compiled under the EAFO definition of a ‘recharging point’; power-system variables (renewables share and average grid CO2 intensity) come from Redeia’s Canary Islands statistics; vehicle energy intensity (WLTP kWh/100 km) is taken from the IDAE vehicle database; and policy anchors (2030/2040 targets) are drawn from the Canary Islands Energy Transition Plan (PTECan) and Spain’s National Energy and Climate Plan (PNIEC).
![Electronics 14 04579 g010 Electronics 14 04579 g010]()
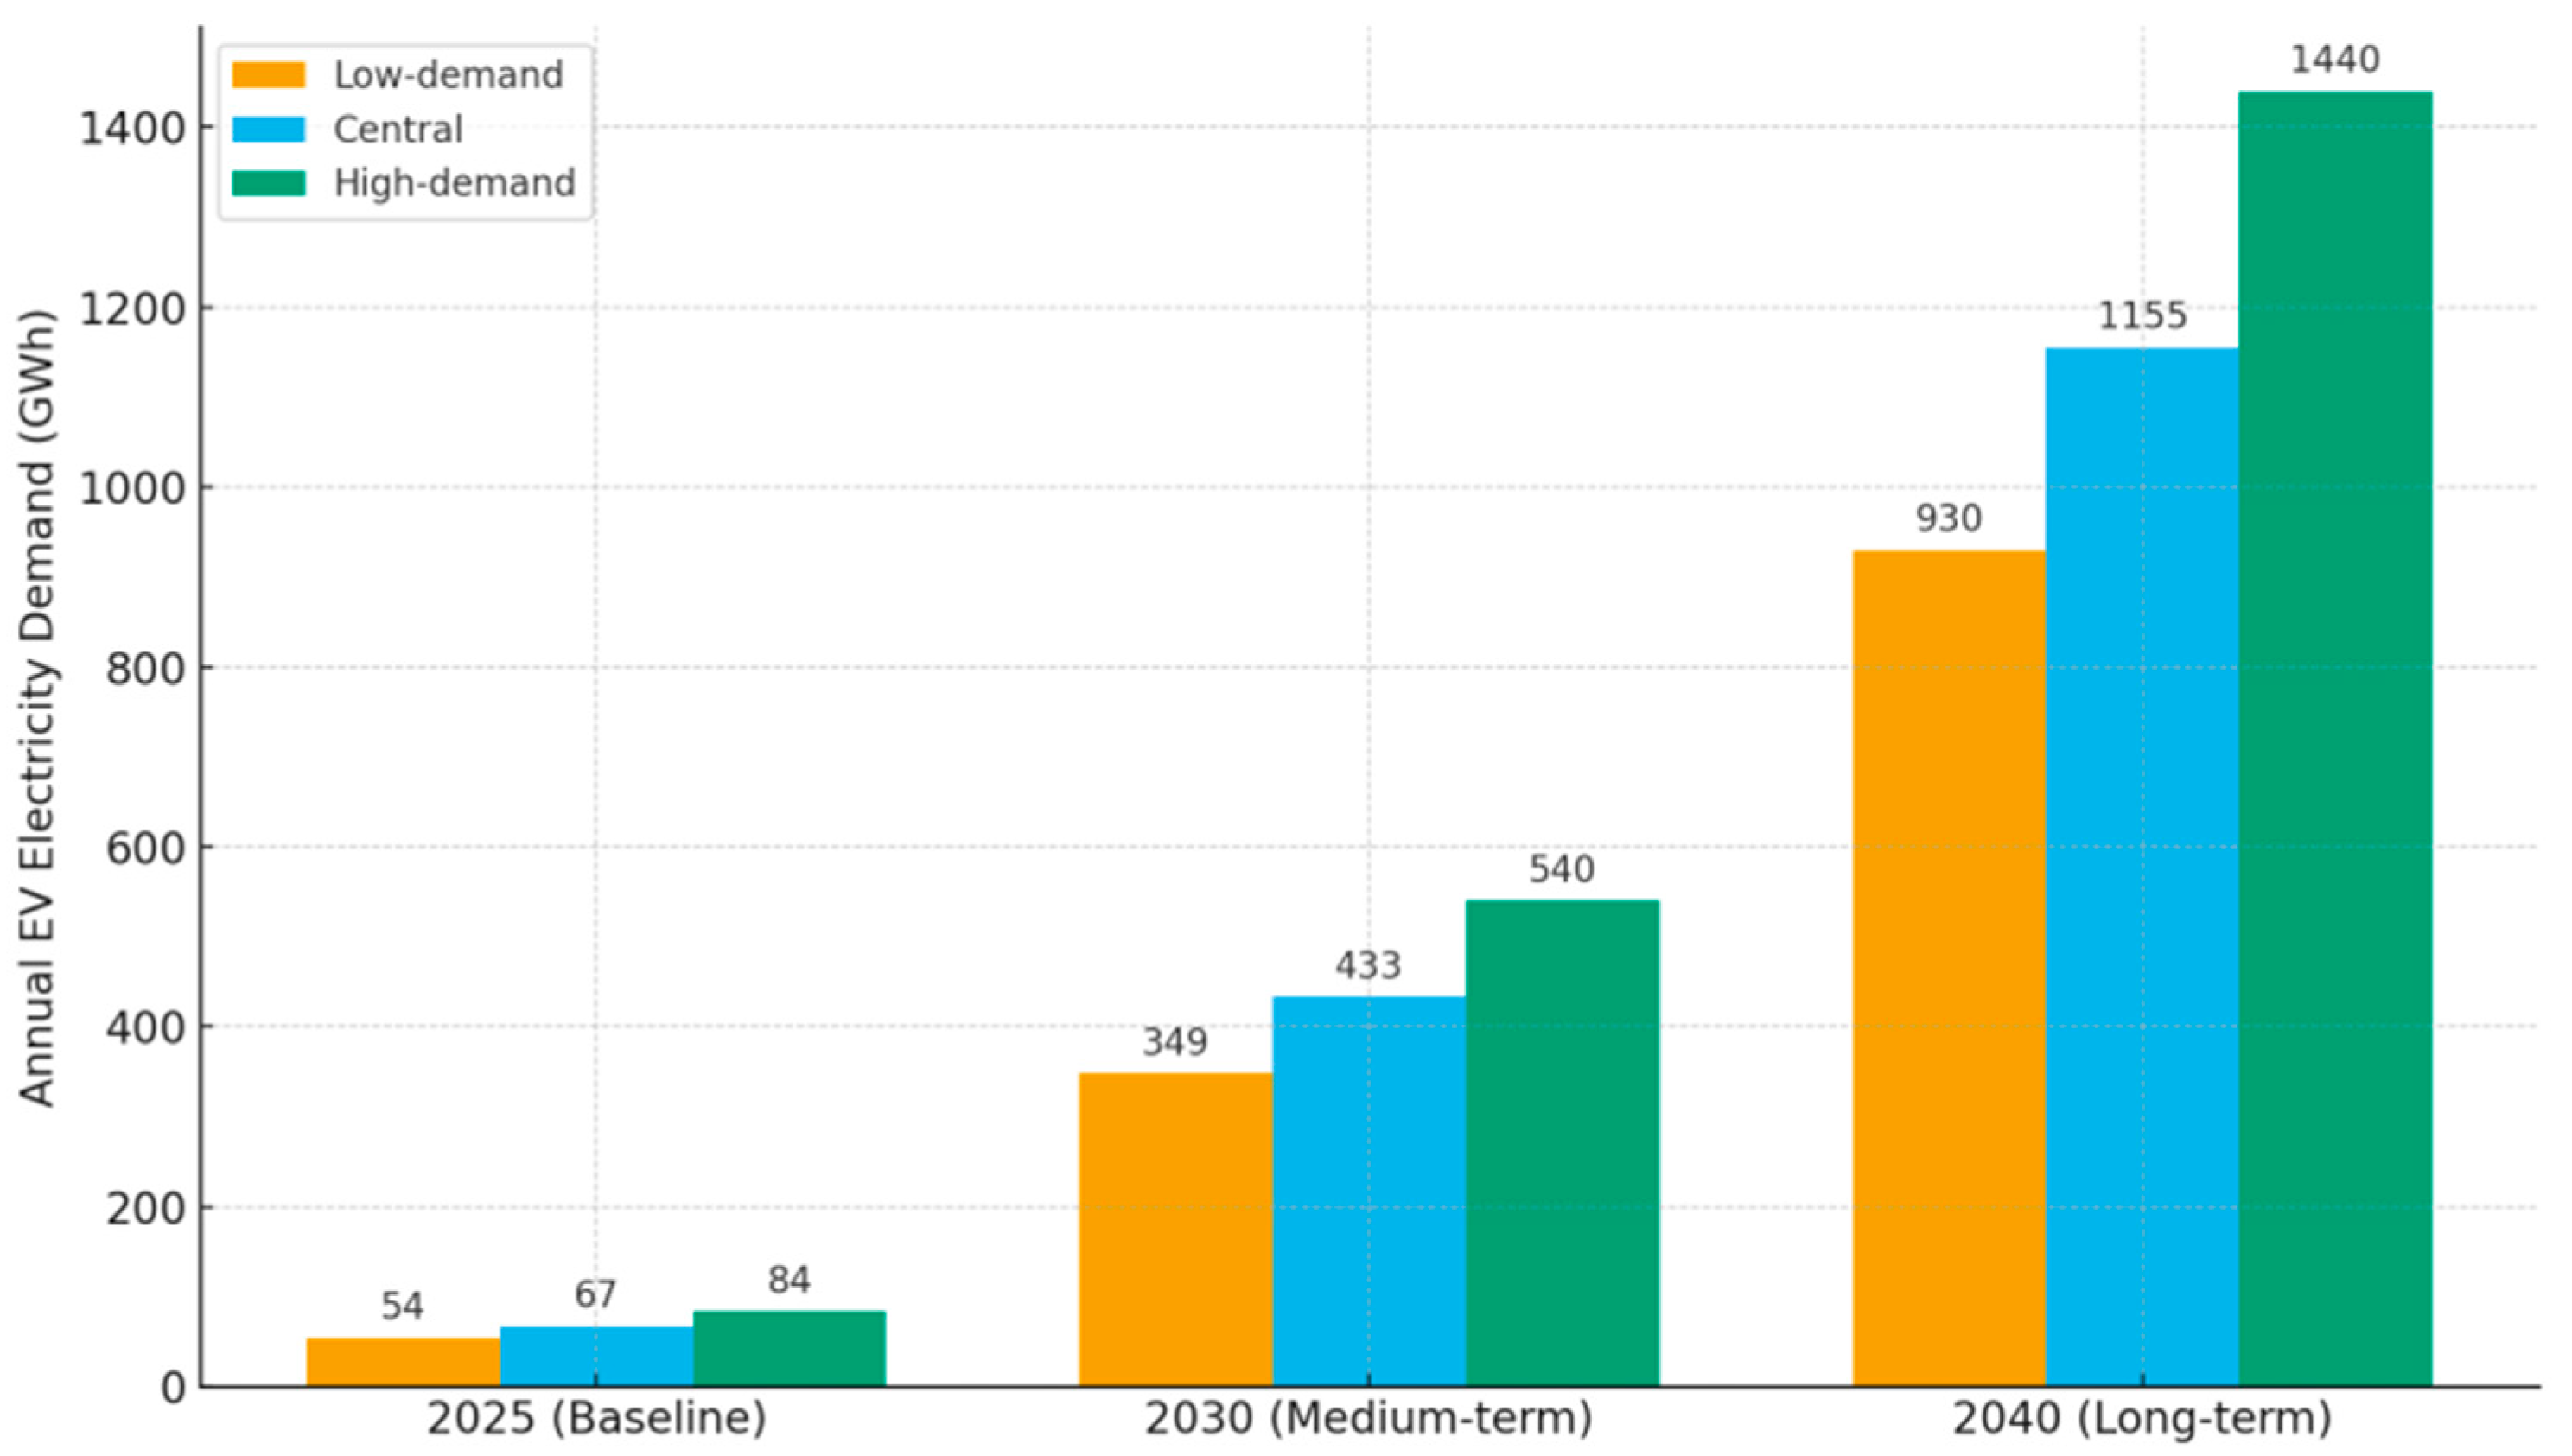
Figure 11.
Estimated annual electricity demand of battery electric vehicles (BEVs) in the Canary Islands across three scenarios (2025, 2030, 2040). It illustrates both the scale of the challenge and the sensitivity of projections to behavioural and technological factors. Source: authors.
Figure 11.
Estimated annual electricity demand of battery electric vehicles (BEVs) in the Canary Islands across three scenarios (2025, 2030, 2040). It illustrates both the scale of the challenge and the sensitivity of projections to behavioural and technological factors. Source: authors.
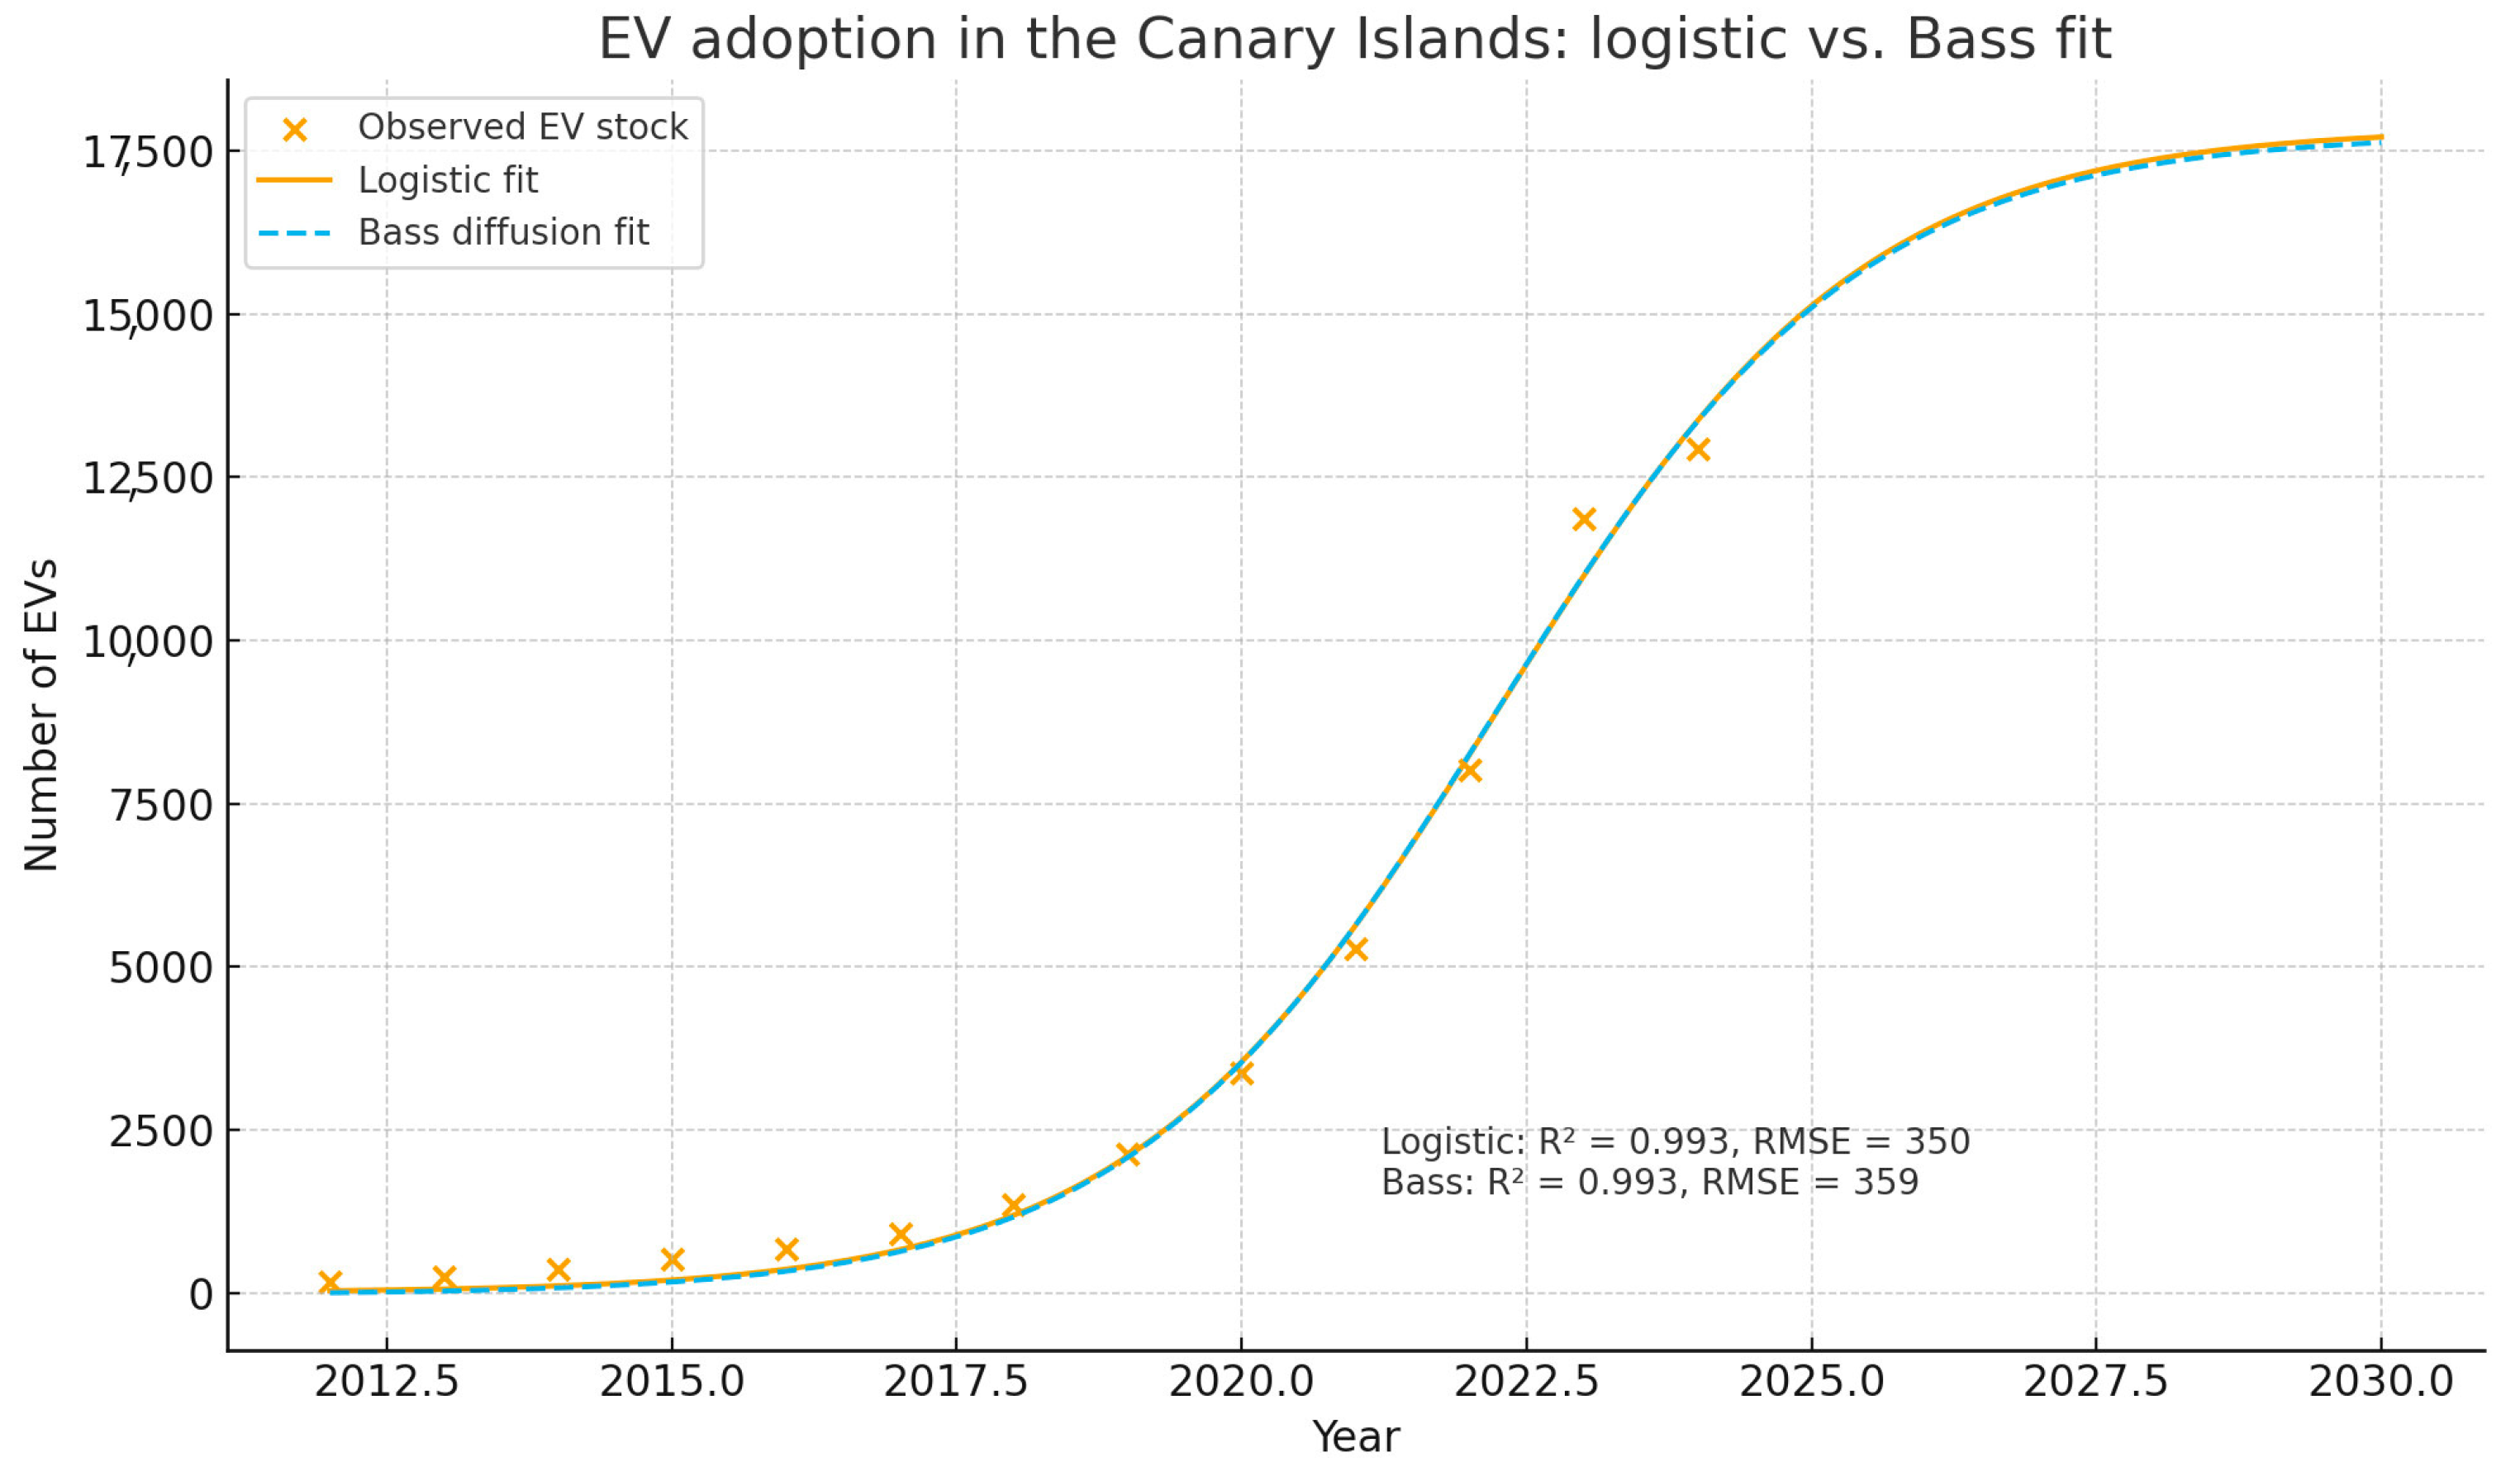
Figure 12.
Historical BEV stock in the Canary Islands (2012–2024) and calibrated logistic and Bass diffusion curves. Points represent observed data, while solid and dashed lines represent the logistic and Bass fits, respectively. Both models exhibit high goodness-of-fit (R2 ≈ 0.99), supporting the use of the logistic model as the main projection tool in this study. Source: authors.
Figure 13.
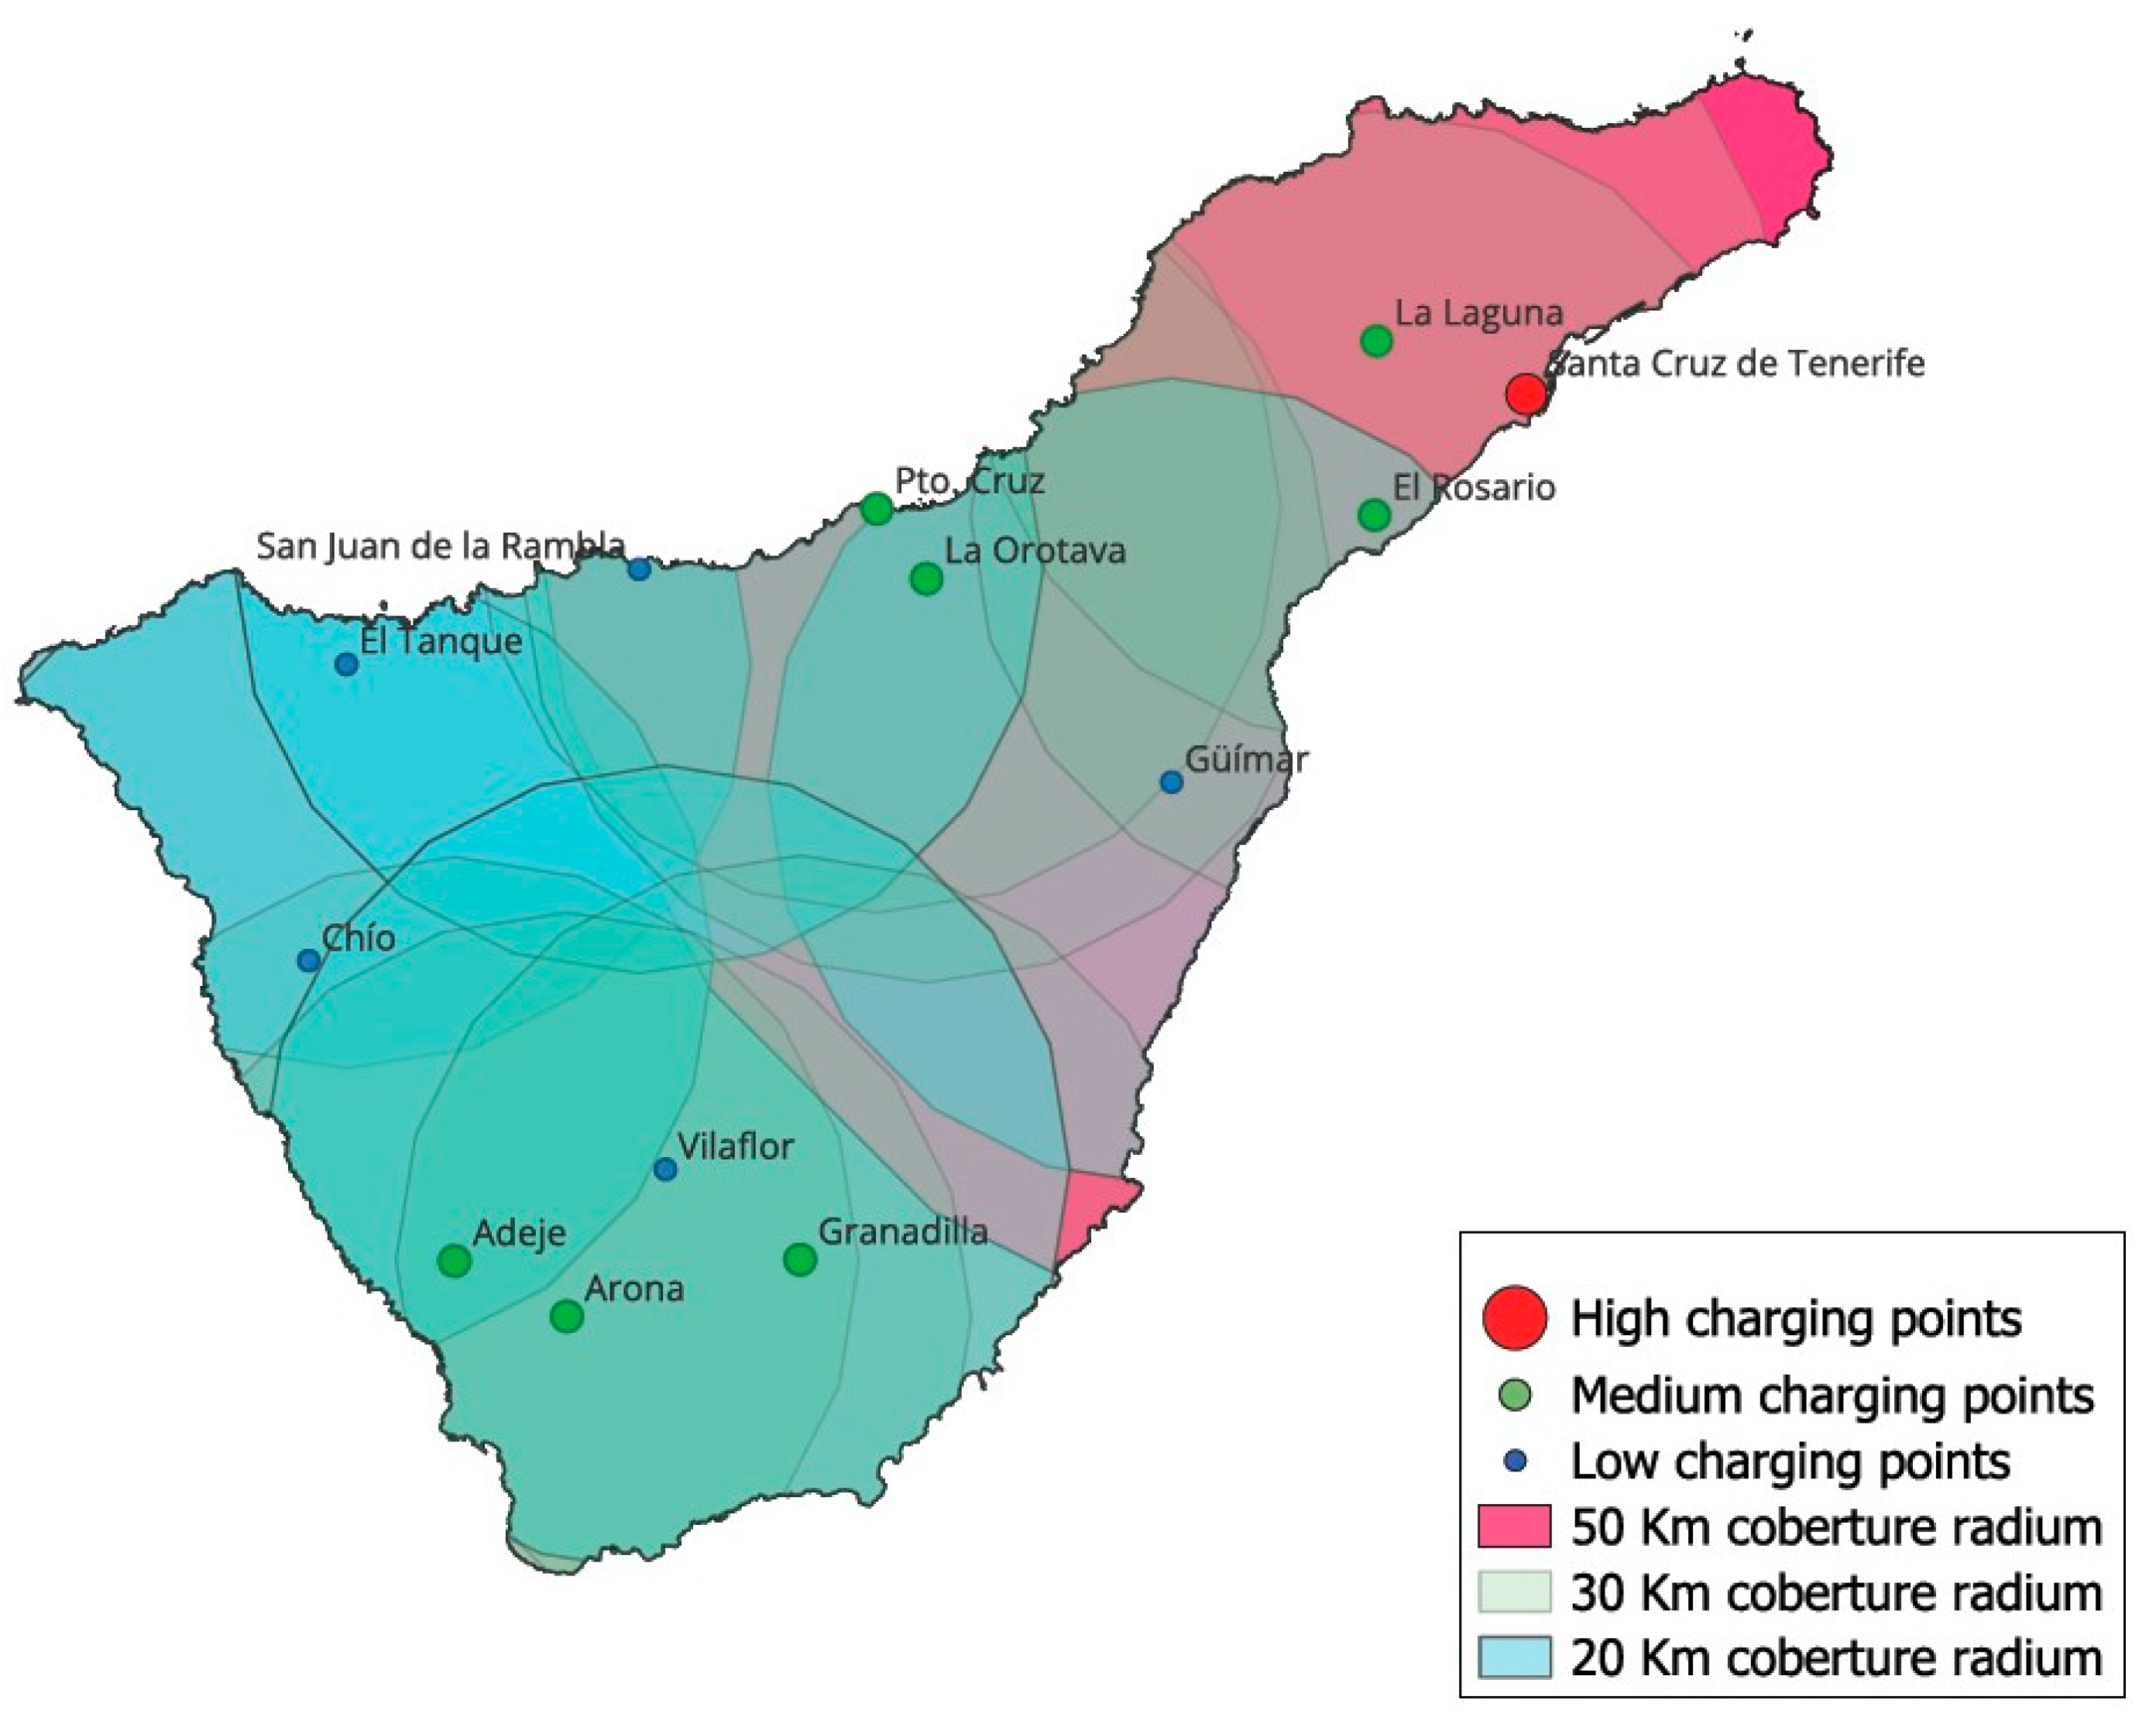
Spatial distribution of charging stations in Tenerife. Figure depicts the location of charging stations across the island of Tenerife, categorized by density: high (red), medium (green), and low (blue). Superimposed coverage radius of 20 km, 30 km, and 50 km highlight the territorial accessibility of the network. Dark green and brown areas reflects the overlapping of the coverture. Source: authors.
Figure 14.
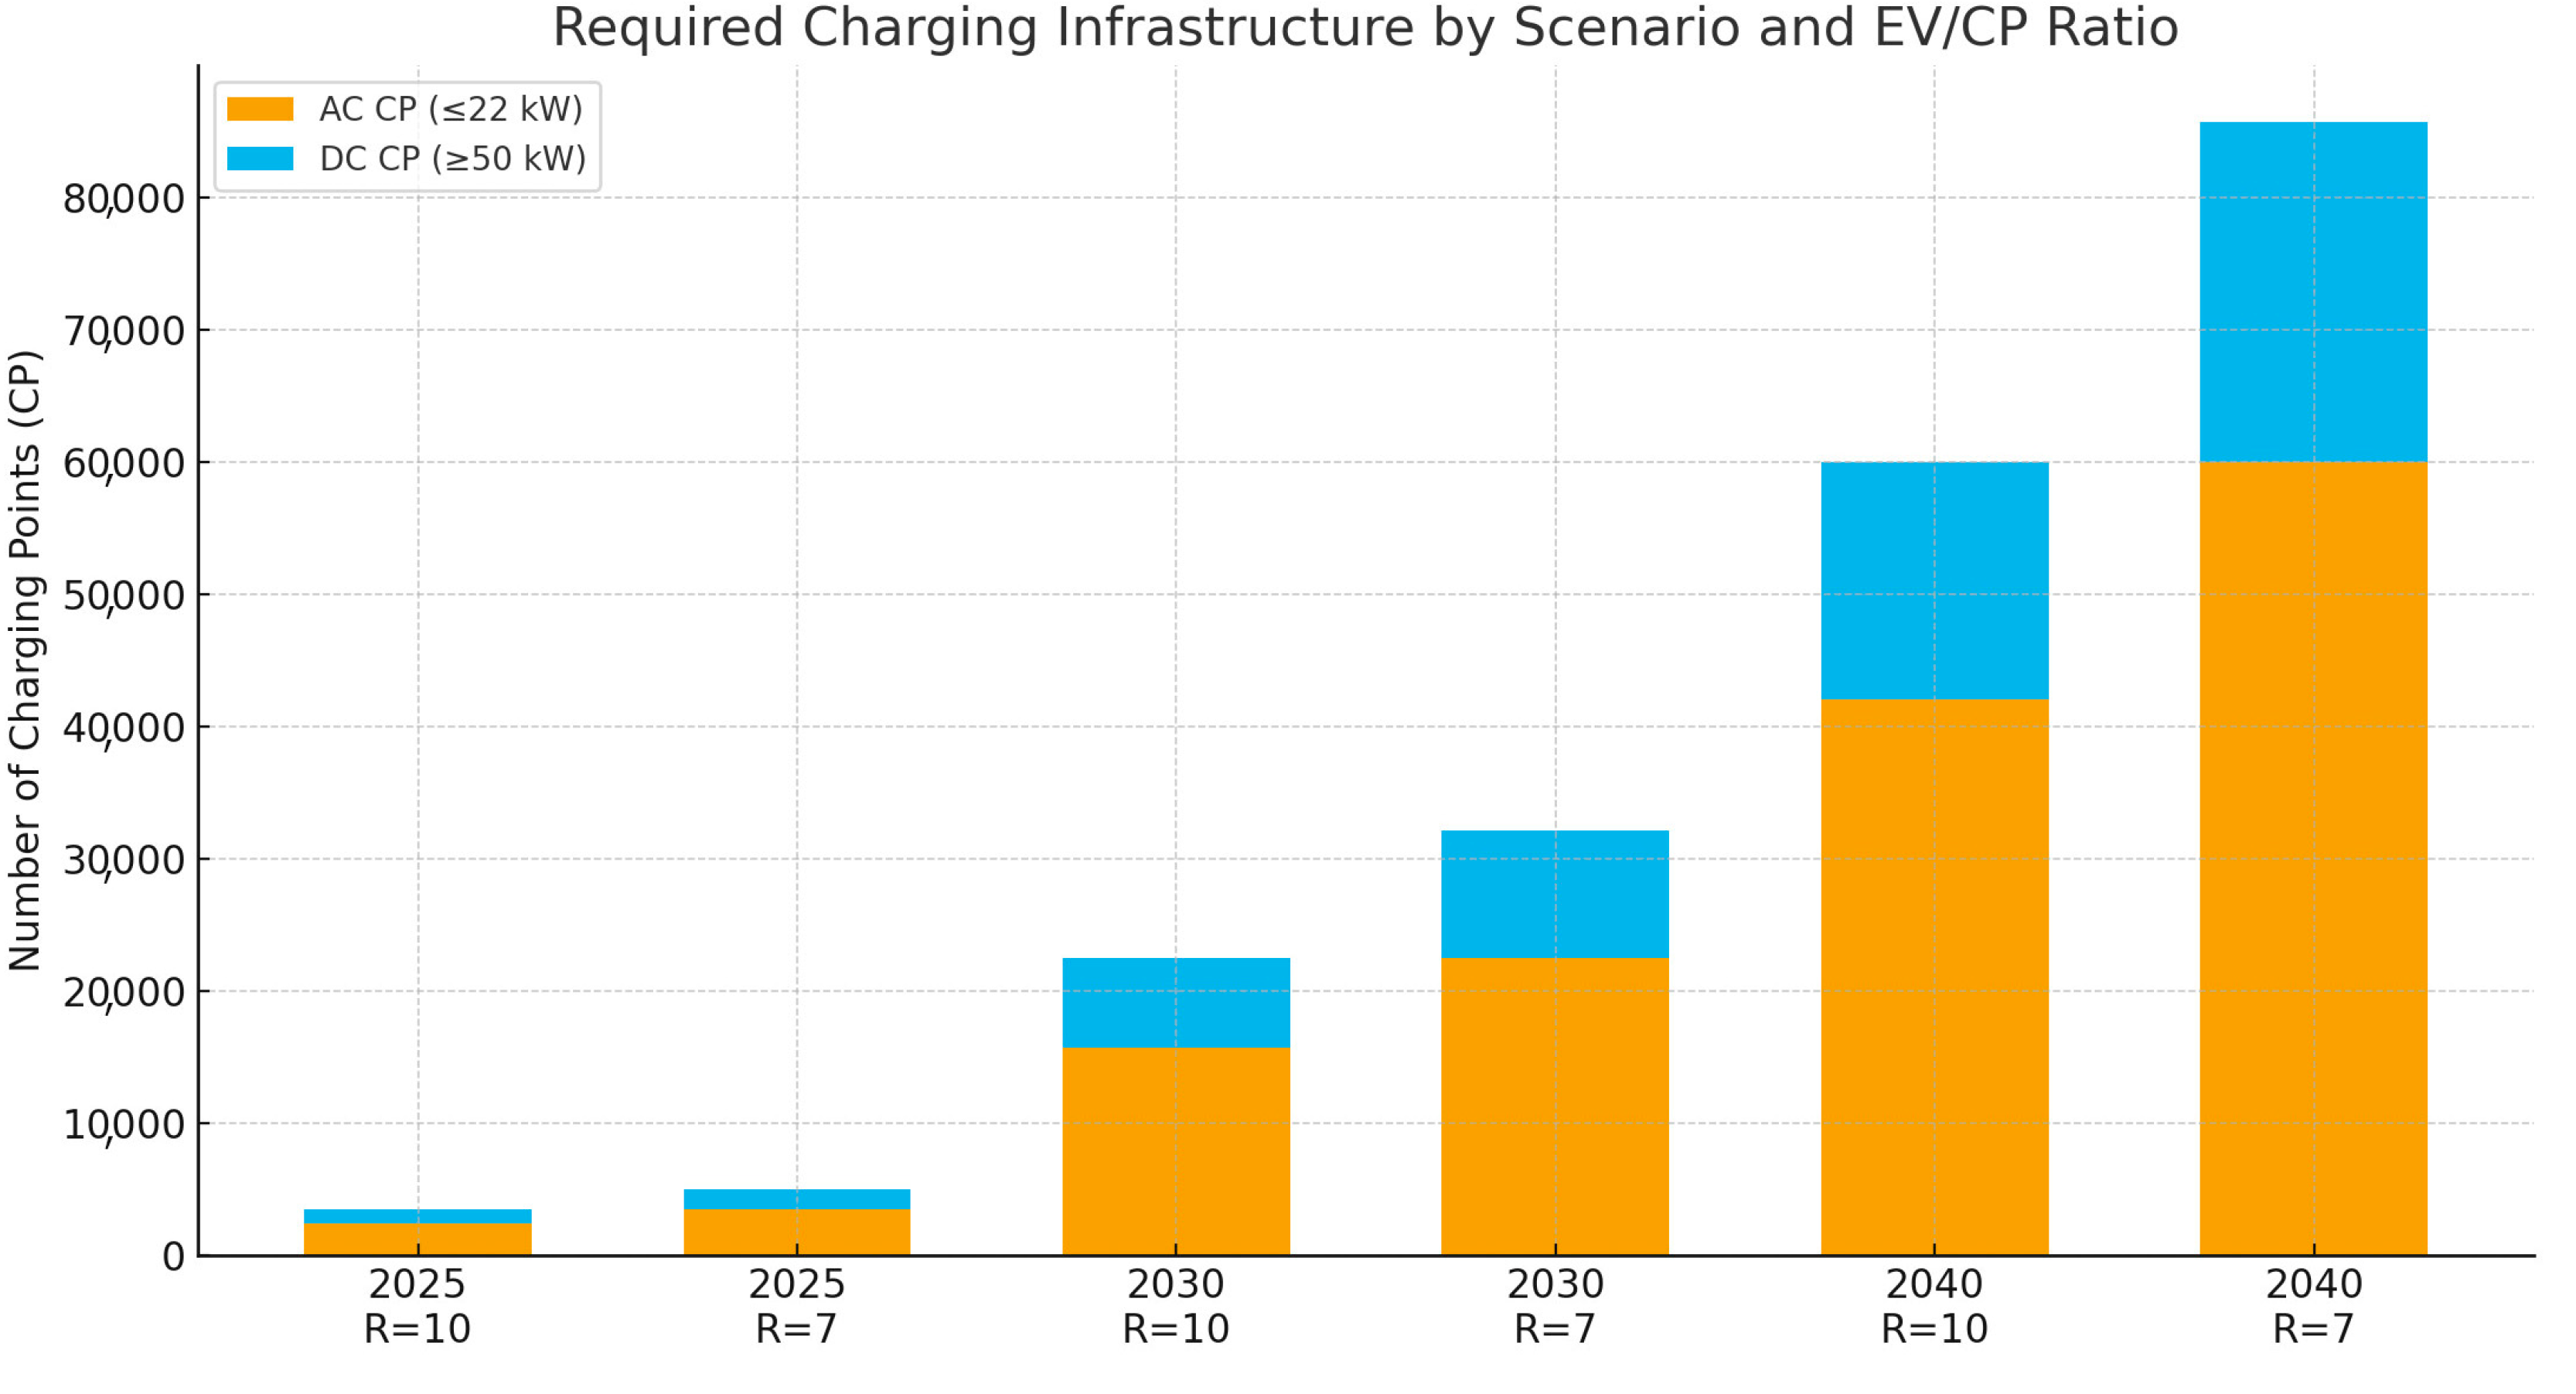
Required public charging infrastructure by scenario and EV/CP ratio (AC/DC split). Bars display the number of AC (≤22 kW) and DC (≥50 kW) charging points required in each scenario for service ratios R = 10 and R = 7. Source: authors.
Figure 14.
Required public charging infrastructure by scenario and EV/CP ratio (AC/DC split). Bars display the number of AC (≤22 kW) and DC (≥50 kW) charging points required in each scenario for service ratios R = 10 and R = 7. Source: authors.
Figure 15.
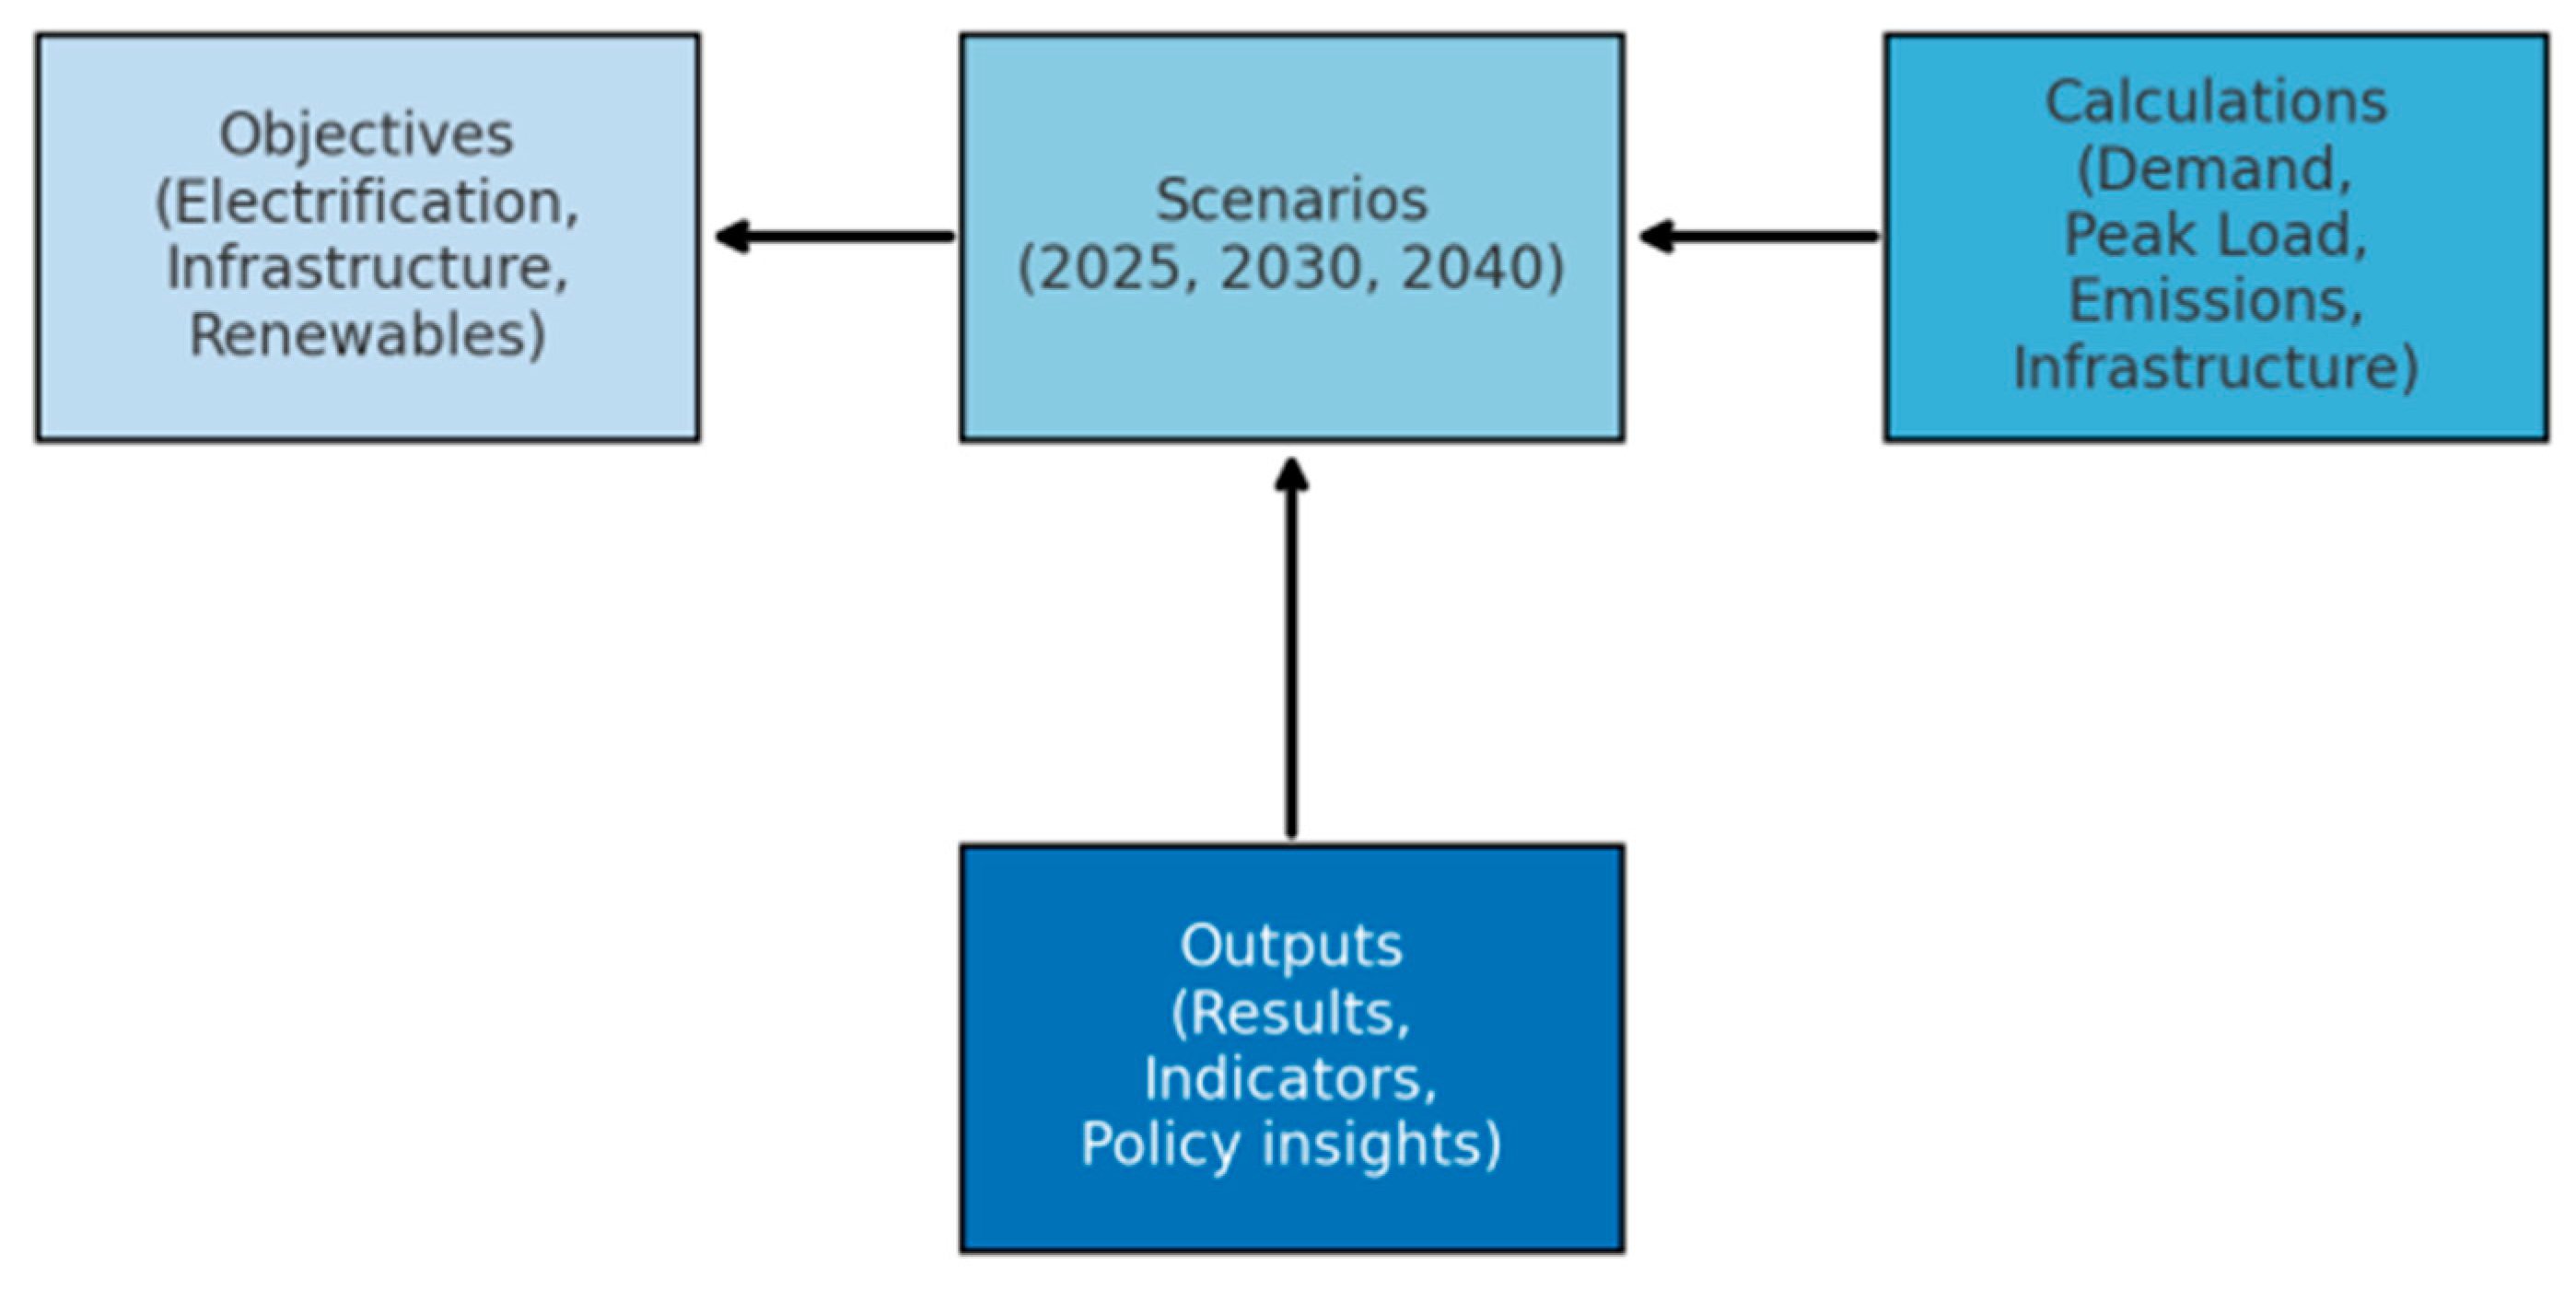
Transformation proposal: structured around three inputs—fleet electrification, charging infrastructure deployment, and renewable energy integration—which are evaluated through a scenario-based approach (2025, 2030, 2040). Source: authors.
Figure 15.
Transformation proposal: structured around three inputs—fleet electrification, charging infrastructure deployment, and renewable energy integration—which are evaluated through a scenario-based approach (2025, 2030, 2040). Source: authors.
Table 1.
Actual installed capacity and energy consumption in Canary Islands. Source: Authors.
Table 1.
Actual installed capacity and energy consumption in Canary Islands. Source: Authors.
| Island | Installed Capacity | Average Power Consumed | % Use |
|---|
| Gran Canaria | 1050 MW | 442 MW | 42% |
| Tenerife | 999 MW | 480 MW | 48% |
| Fuerteventura | 175 MW | 104 MW | 60% |
| Lanzarote | 125 MW | 86.7 MW | 70% |
| La Palma | 100 MW | 22.8 MW | 23% |
| La Gomera | 40 MW | 28.4 MW | 70% |
| El Hierro | 50 MW | 9.9 MW | 20% |
| Island | Inhabitants | Vehicles | BEV |
|---|
| Gran Canaria | 869,984 | 703,204 | 3500 |
| Tenerife | 959,189 | 798,041 | 4205 |
| Lanzarote | 163,230 | 141,936 | 600 |
| Fuerteventura | 126,676 | 101,755 | 500 |
| La Palma | 85,382 | 80,618 | 150 |
| La Gomera | 22,507 | 17,046 | 50 |
| El Hierro | 11,786 | 10,391 | 18 |
Table 3.
Evolution of the number of vehicles in the Canary Islands by type of energy, and expected numbers for 2030. Source: Authors, based on data collected by Instituto Canario de Estadística.
Table 3.
Evolution of the number of vehicles in the Canary Islands by type of energy, and expected numbers for 2030. Source: Authors, based on data collected by Instituto Canario de Estadística.
| Year | Total Vehicles | Gasoline (Except Hybrids) | Diesel (Except Hybrids) | Alternative Energy | Electricity |
|---|
| 2012 | 1,530,317 | 1,057,910 | 471,867 | 540 | 161 |
| 2013 | 1,520,930 | 1,042,390 | 477,481 | 1059 | 240 |
| 2014 | 1,534,171 | 1,042,776 | 489,766 | 1629 | 365 |
| 2015 | 1,566,038 | 1,059,295 | 504,453 | 2290 | 509 |
| 2016 | 1,613,731 | 1,084,341 | 524,027 | 5183 | 681 |
| 2017 | 1,673,226 | 1,122,064 | 544,598 | 6564 | 910 |
| 2018 | 1,726,969 | 1,157,299 | 560,358 | 9312 | 1346 |
| 2019 | 1,764,754 | 1,183,325 | 567,879 | 13,523 | 2132 |
| 2020 | 1,772,659 | 1,183,094 | 570,709 | 18,856 | 3383 |
| 2021 | 1,793,216 | 1,190,991 | 573,382 | 28,843 | 5276 |
| 2022 | 1,832,798 | 1,212,389 | 579,124 | 43,203 | 8024 |
| 2023 | 1,869,966 | 1,225,654 | 582,896 | 61,416 | 11,874 |
| 2024 | 1,900,791 | 1,240,717 | 592,987 | 66,960 | 12,932 |
| 2025 | 1,931,616 | 1,255,780 | 603,708 | 72,504 | 13,990 |
| 2026 | 1,962,441 | 1,270,843 | 613,169 | 78,048 | 15,048 |
| 2027 | 1,993,266 | 1,285,906 | 623,260 | 83,592 | 16,106 |
| 2028 | 2,024,091 | 1,300,969 | 632,391 | 89,136 | 17,164 |
| 2029 | 2,054,916 | 1,316,032 | 643,442 | 94,680 | 18,224 |
| 2030 | 2,085,741 | 1,331,095 | 653,533 | 100,224 | 19,280 |
Table 4.
Gas stations and charging stations (March 2025).
Table 4.
Gas stations and charging stations (March 2025).
| | Gas Stations | Charging Stations | <11 kW | 11 kW–50 kW | >50 kW |
|---|
| Gran Canaria | 75 | 329 | 130 | 120 | 79 |
| Tenerife | 85 | 396 | 194 | 138 | 64 |
| Lanzarote | 25 | 65 | 32 | 18 | 15 |
| Fuerteventura | 20 | 73 | 36 | 16 | 21 |
| La Palma | 15 | 42 | 16 | 23 | 3 |
| La Gomera | 5 | 19 | 5 | 5 | 9 |
| El Hierro | 3 | 11 | 2 | 7 | 2 |
Table 5.
Example of emissions calculation for a car with gasoline, diesel, and electric versions. The model chosen is the BMW 1 Series, as this vehicle is offered with all three engines. Source:
https://www.bmw.es (accessed on 24 April 2025). Please note that vehicle comparators were initially limited to a single compact model for cross-scenario consistency (pilot). This introduces selection bias; we therefore extend to three archetypes (B-hatch, C-compact, C-SUV) using official WLTP consumption ranges from IDAE. Results are reported per archetype and as a weighted average.
| Source | Power | Energy Consumption WLTP | CO2 Emissions |
|---|
| Gas | 136 hp | 6.4 L/100 km | 144 g/km |
| Diesel | 150 hp | 5 L/100 km | 131 g/km |
| Electric | 204 hp | 15.5 kWh/100 km | 0 g/km |
Table 6.
Comparative services provided by EV batteries and stationary BESSs. Source: Authors.
Table 6.
Comparative services provided by EV batteries and stationary BESSs. Source: Authors.
| Service | EV Batteries | Stationary BESS |
|---|
| Energy storage (load shifting) | Yes (through smart charging/V2G) | Yes (direct control, centralized dispatch) |
| Frequency regulation | Yes (aggregated fleets, V2G) | Yes (fast-response capability) |
| Voltage support | Yes (localized V2G) | Yes (large-scale voltage regulation) |
| Black-start/Emergency supply | Yes (vehicle-to-home/critical loads) | Yes (dedicated backup systems) |
| Mobility support | Yes (primary function of EVs) | No (non-mobile) |
| Distributed storage potential | Very high (millions of units possible) | Limited (site-specific installations) |
| Grid integration with renewables | High (when coordinated with smart grids) | High (direct coupling with PV/wind farms) |
Table 7.
Comparative data between Zealand and Canary Islands. Source: Authors.
Table 7.
Comparative data between Zealand and Canary Islands. Source: Authors.
| | Zealand | Canary Islands |
|---|
| Country | Denmark | Spain |
| Area | 7.031 km2 | 7.493 km2 |
| Population | 2.6 million | 2.2 million |
| Population density | 370 people/km2 | 294 people/km2 |
| Number of islands | 1 large island and smaller islands | 3 main islands and 5 smaller islands |
Table 8.
Summary of the key variables across the three scenarios, including the number of EVs, their share of the fleet, the share of renewable energy (RES) in the generation mix, the average grid carbon intensity, and the density of charging infrastructure expressed as the number of EVs per charging point (CP). Source: authors.
| Variable | Baseline (2025) | Medium-Term (2030) | Long-Term (2040) |
|---|
| Number of BEVs | ~35,000 | ~225,000 | >600,000 (majority fleet) |
| EV share of fleet | ~1.5% | ~10–12% | >70% |
| Renewable share (RES) | ~20% | ~60% | ~95–100% |
| Grid CO2 intensity (g/kWh) | 850 | 400–500 | <100 |
| CP density (EVs/CP) | ~20 | 7–10 | ≤7 |
Table 9.
Coverage radius of charging stations in islanded systems and their strategic implications. The table highlights the relationship between territorial scale, functional role of charging points, and potential co-location with conventional fuel stations and hydrogen hubs. Source: Authors.
Table 9.
Coverage radius of charging stations in islanded systems and their strategic implications. The table highlights the relationship between territorial scale, functional role of charging points, and potential co-location with conventional fuel stations and hydrogen hubs. Source: Authors.
| Coverage Radius (km) | Key Implications | Synergy with Gas Stations/Hydrogen Stations | Area of Influence (km2) |
|---|
| 0–5 | High density urban coverage; suitable for short commutes and tourism-oriented demand | Very high—co-location feasible with existing petrol stations and potential hydrogen hubs | 78.5 |
| 5–10 | Intermediate coverage enabling urban–periurban trips; essential for commuter flows | High—co-location at periurban gas stations, logistic hubs, shopping centres | 235.6 |
| 10–20 | Regional connectivity between municipalities; reduces range anxiety on larger islands | Moderate—fewer existing petrol stations; hydrogen co-location more strategic | 942.5 |
| 20+ | Critical for inter-island rural and low-density zones; requires strategic nodes at ports/airports | Low—sparse gas station presence; hydrogen hubs more critical for connections | >1256.6 |
Table 10.
Core variables—BEV stock, EV share, renewable share, grid carbon intensity, and EV/CP density—across three scenarios: providing a quantitative frame for infrastructure sizing and grid planning. Source: authors.
Table 10.
Core variables—BEV stock, EV share, renewable share, grid carbon intensity, and EV/CP density—across three scenarios: providing a quantitative frame for infrastructure sizing and grid planning. Source: authors.
| Variable | Baseline (2025) | Medium-Term (2030) | Long-Term (2040) |
|---|
| Number of BEVs | ~35,000 | ~225,000 | >600,000
(majority fleet) |
| EV share of fleet | ~1.5% | ~10–12% | >70% |
| Renewable share (RES) | ~20% | ~60% | ~95–100% |
| Grid CO2 intensity (g/kWh) | 850 | 400–500 | <100 |
| CP density (EVs/CP) | ~20 | 7–10 | ≤7 |
Table 11.
Annual EV electricity demand under low/central/high assumptions; these values are the basis for peak load and infrastructure calculations. Source: authors.
Table 11.
Annual EV electricity demand under low/central/high assumptions; these values are the basis for peak load and infrastructure calculations. Source: authors.
| Scenario | Case | EVs (Units) | Mileage (km/year) | Consumption (kWh/km) | Annual EV Demand (GWh) |
|---|
| 2025 (Baseline) | Low demand | 35,000 | 10,000 | 0.155 | 54.2 |
| 2025 (Baseline) | Middle demand | 35,000 | 11,000 | 0.175 | 67.4 |
| 2025 (Baseline) | High demand | 35,000 | 12,000 | 0.2 | 84 |
| 2030 (Medium-term) | Low demand | 225,000 | 10,000 | 0.155 | 348.8 |
| 2030 (Medium-term) | Middle demand | 225,000 | 11,000 | 0.175 | 433.1 |
| 2030 (Medium-term) | High demand | 225,000 | 12,000 | 0.2 | 540 |
| 2040 (Long-term) | Low demand | 600,000 | 10,000 | 0.155 | 930 |
| 2040 (Long-term) | Middle demand | 600,000 | 11,000 | 0.175 | 1155 |
| 2040 (Long-term) | High demand | 600,000 | 12,000 | 0.2 | 1440 |
Table 12.
Required public charging points for each scenario using EU service ratios R = 7–10 EV/CP. The table disaggregates AC (≤22 kW) and DC (≥50 kW) units and reports associated connected power. Results indicate ~22.5–32.1 k CP in 2030 (6.8–9.6 k DC) with ~0.85–1.21 GW connected, rising to 60–85.7 k CP in 2040 (18.0–25.7 k DC) with ~2.26–3.23 GW connected power. Source: authors.
| Scenario | EVs (Units) | R (EV/CP) | Total CP | AC CP (70%) | DC CP (30%) | AC Connected Power (MW) | DC Connected Power (MW) | Total Connected Power (MW) |
|---|
| 2025 (Baseline) | 35,000 | 7 | 5000 | 3500 | 1500 | 38.5 | 150 | 188.5 |
| 2025 (Baseline) | 35,000 | 10 | 3500 | 2450 | 1050 | 26.95 | 105 | 131.95 |
| 2030 (Medium-term) | 225,000 | 7 | 32,143 | 22,500 | 9643 | 247.5 | 964.3 | 1211.79 |
| 2030 (Medium-term) | 225,000 | 10 | 22,500 | 15,750 | 6750 | 173.25 | 675 | 848.25 |
| 2040 (Long-term) | 600,000 | 7 | 85,714 | 60,000 | 25,714 | 660 | 2571.4 | 3231.43 |
| 2040 (Long-term) | 600,000 | 10 | 60,000 | 42,000 | 18,000 | 462 | 1800 | 2262 |
