Abstract
Multiple ocular diseases frequently coexist in fundus images, while image quality is highly susceptible to imaging conditions and patient cooperation, often manifesting as blurring, underexposure, and indistinct lesion regions. These challenges significantly hinder robust multi-disease joint classification. To address this, we propose a novel framework, BiNeXt-SMSMVL (Bilateral ConvNeXt-based Structure-aware Multi-scale Multi-view Learning Network), that integrates structural medical biomarkers with deep semantic image features for robust multi-class fundus disease recognition. Specifically, we first employ automatic segmentation to extract the optic disc/cup and vascular structures, calculating medical biomarkers such as vertical/horizontal cup-to-disc ratio (CDR), vessel density, and fractal dimension as structural priors for classification. Simultaneously, a ConvNeXt-Tiny backbone extracts multi-scale visual features from raw fundus images, enhanced by SENet channel attention mechanisms to improve feature representation. Architecturally, the model performs independent predictions on left-eye, right-eye, and fused binocular images, leveraging multi-view ensembling to enhance decision stability. Structural priors and image features are then fused for joint classification modeling. Experiments on public datasets demonstrate that our model maintains stable performance under variable image quality and significant lesion heterogeneity, outperforming existing multi-label classification methods in key metrics including F1-score and AUC. Also, our approach exhibits strong robustness, interpretability, and clinical applicability.
1. Introduction
Color fundus photography is a non-invasive examination technique that captures planar color images of the retina, revealing critical structures such as the optic disc, macula, and retinal vasculature [1]. Typical fundus photographs encompass a 30°–50° field of view, enabling simultaneous observation of substantial retinal areas [2]. Fundus photography has been extensively implemented in ophthalmological disease screening and diagnosis due to its operational simplicity and cost-effectiveness. It is pivotal in large-scale telemedicine initiatives in resource-limited regions [3]. Through fundus images, clinicians and intelligent diagnostic systems can directly assess retinal health, facilitating early detection of vision-threatening conditions, including diabetic retinopathy, glaucoma, and age-related macular degeneration [4]. Furthermore, fundus imaging can reflect systemic health status, revealing manifestations of conditions such as hypertensive arterial sclerosis and diabetes mellitus [4]. The potential of glimpsing systemic pathology through a single fundus photograph has established it as a focal point in medical artificial intelligence research.
Nevertheless, color fundus imaging encounters several challenges during acquisition and analysis. Primarily, image quality is susceptible to acquisition conditions and patient factors, including uneven illumination, imprecise focusing, suboptimal patient cooperation, and lens opacities, all of which may result in image degradation [5]. Research indicates that under complex acquisition conditions, less than half of fundus photographs clearly demonstrate all essential structures [6]. Deterioration in image quality directly compromises the reliability of subsequent lesion detection and diagnosis, attracting growing research on fundus image quality assessment and enhancement (IQA/IQE) in recent years [7]. Additionally, variations in equipment and acquisition parameters may generate image discrepancies, complicating algorithmic generalization across diverse datasets [8]. A single fundus photograph may exhibit multiple pathologies, imposing heightened demands on automated diagnosis, and conventional methodologies typically focus on isolated conditions. In contrast, clinical reality often presents patients with concurrent retinal pathologies. Consequently, the simultaneous detection of multiple lesion categories within a single color photograph represents a critical research challenge [9].
To address these challenges, we propose BiNeXt-SMSMVL, a structure-enhanced binocular multi-scale multi-view classification model. Our principal innovations are threefold:
- We optimize fundus images using CLAHE (Contrast Limited Adaptive Histogram Equalization) and USM (Unsharp Masking) algorithms.
- We introduce a W-Net+ architecture for precise segmentation of fundus biomarkers.
- We develop a binocular multi-scale multi-view network that analyzes left-eye, right-eye, and fused bilateral images across multiple scales to enhance diagnostic accuracy and reliability.
2. Related Works
2.1. Segmentation and Quantitative Metrics of Retinal Structures
Critical anatomical structures provide essential biomarkers for retinal diseases, including the optic disc (OD), optic cup (OC), and retinal vasculature. Automated segmentation and quantification of these structures are fundamental for developing interpretable and robust diagnostic systems [10,11,12,13]. Recent advances in deep learning-based segmentation have evolved from classical CNNs to attention mechanisms and Transformers. The U-Net architecture serves as a foundational model, widely adopted for OD/OC and vessel segmentation through its encoder-decoder structure with skip connections [14]. Its variants address structure-specific challenges:
2.1.1. Optic Disc and Cup Segmentation
While standard U-Net effectively delineates OD boundaries, it often struggles with low-contrast structures like the OC. Enhanced approaches incorporate residual connections (ResU-Net) [15], multi-scale pathways (Multi-UNet) [16], or attention mechanisms (Attention U-Net) [17] to improve segmentation of blurred boundaries and small anatomical targets.
2.1.2. Retinal Vasculature Segmentation
Vessels exhibit complex morphological characteristics (e.g., elongated, tree-like branching patterns across multiple scales), posing challenges for conventional U-Nets in capturing both major trunks and fine capillaries. State-of-the-art solutions employ multi-scale context fusion through pyramid pooling [18], dilated convolutions [19], and deep supervision [20]. Specialized loss functions (Tversky loss, focal loss) further enhance sensitivity to microvasculature [21,22].
Attention mechanisms address low target-background contrast and blurred boundaries by focusing computation on salient regions:
- Channel Attention (SE module) [23]: Amplifies discriminative feature channels, improving detection of subtle morphological variations in OC segmentation.
- Spatial Attention (CBAM) [24]: Emphasizes critical spatial regions, enhancing edge discrimination capabilities.
- Joint Attention [25]: Integrates spatial-channel dependencies, significantly boosting segmentation robustness in lesion-compromised fundus images.
2.2. Quantitative Biomarker Extraction from Structural Segmentation
High-quality structural segmentation not only serves as the foundation for model inference but also provides a series of quantifiable and interpretable clinical indicators for fundus diseases. Current research extensively extracts key parameters from optic cup/disc (OC/OD) and retinal vascular structures to facilitate quantitative analysis of conditions such as glaucoma, hypertensive retinopathy, and diabetic retinopathy (DR) [26,27]. In the optic disc region, typical metrics include the cup width/height and disc width/height, which are used to calculate the vertical and horizontal cup-to-disc ratios (CDR_vertical, CDR_horizontal). Among these, vertical CDR is the most sensitive structural parameter for early glaucoma screening, with CDR >0.6 or an interocular difference >0.2 indicating high glaucoma risk [27].
For vascular structures, post-skeletonization processing enables extracting features such as vessel density, fractal dimension (FD), and average vessel width [28]. Vessel density reflects perfusion status and is commonly used in DR and glaucoma assessment. Fractal dimension quantifies vascular network complexity, with early-stage pathologies often leading to its reduction. Average vessel width variations can indicate abnormal vasoconstriction or dilation. Some studies further refine arteriovenous segmentation to compute arterial/venous density, width, and FD separately, enhancing diagnostic precision. For instance, hypertension may induce arterial narrowing (reduced width), while venous occlusion often accompanies venous dilation (increased width) and structural distortion (elevated FD). These structural indicators serve as intermediate variables, providing strong interpretability for disease classification models [29]. With advancements in model capabilities, researchers are gradually moving beyond independent structural processing and proposing unified modeling frameworks for multi-structure collaborative segmentation and analysis. For example, shared feature encoders can extract low-level visual features common to OD, OC, and vessels, followed by structure-specific decoding [30]. Such designs improve training efficiency and help models learn spatial correlations between structures.
Furthermore, many methods integrate structural segmentation, quantitative computation, and disease classification into end-to-end joint modeling [31]. By sharing intermediate features or employing multi-task loss learning, these models rely on structured intermediate variables during classification, enhancing prediction accuracy and interpretability.
2.3. Multi-Disease Classification via Deep Learning
Fundus images often exhibit multiple coexisting lesions, making traditional single-disease classification methods inadequate for clinical needs. Consequently, multi-disease joint classification has emerged as a research hotspot. This task is typically formulated as a multi-label classification or multi-task learning problem, with core challenges including lesion feature overlap, label incompleteness, class imbalance, and limited interpretability. Various approaches have been proposed (a comparative summary of representative methods is provided in Table 1). The most basic approach employs CNN-based multi-label classification models, using Sigmoid outputs to predict each disease’s presence independently. For instance, Islam et al. proposed a lightweight attention-enhanced CNN [32], achieving 94.27% accuracy and 86.08% F1-score on the ODIR dataset, demonstrating both efficiency and scalability. Some studies integrate graph convolutional networks (GCNs) to better capture label co-occurrence dependencies. Cheng et al.’s [33] GCN-based model significantly improved joint recognition of common fundus lesions (e.g., microaneurysms, hemorrhages, exudates).

Table 1.
Comparison of Existing Multi-Disease Classification Methods.
Multi-task learning (MTL) further enhances performance by simultaneously training disease classification and structural segmentation (e.g., optic disc/vessel segmentation), strengthening the model’s ability to learn structure-pathology correlations. This approach has been validated in multiple studies to improve accuracy and interpretability. For example, Hervella et al. combined optic disc/cup segmentation with glaucoma classification, enhancing discriminative power and emphasizing high-risk structural abnormalities [34]. To address spatial heterogeneity in lesion distribution, dual-branch architectures have become a popular design strategy: one branch processes global image features, while the other focuses on local regions of interest (e.g., optic disc, macula). This design is particularly suitable for the concurrent diagnosis of diseases with distinct anatomical targets (e.g., glaucoma, DR, AMD). The Fundus-DeepNet system, for instance, integrates binocular images, SE modules, and HRNet, achieving 88.56% F1-score and 99.76% AUC via an RBM classifier [35].
Transformer architectures, known for their superior global modeling capability, have also been adapted for multi-disease fundus classification. Lian et al.’s Retinal ViT [36] outperformed CNNs in AUC and F1 on the RFMiD dataset, demonstrating the Transformer’s advantage in modeling long-range dependencies among complex lesions. Transformers excel particularly in large-scale data or multi-disease co-occurrence tasks, offering strong performance for subtle and distributed lesions. Additionally, multi-modal fusion strategies, including structural segmentation maps, vessel graphs, optic disc ROIs, and other prior knowledge, have matured, surpassing pure image-based models and demonstrating superior generalization ability.
Despite advancements, persistent challenges include label scarcity, severe class imbalance, and insufficient modeling of structure-label mappings. Future directions should incorporate weak supervision, explicit structural priors, and human–AI collaborative frameworks to enhance clinical utility.
3. Methodology
We propose BiNeXt-SMSMVL (Bilateral ConvNeXt-based Structure-aware Multi-scale Multi-view Learning Network), a multi-task framework for joint diagnosis of retinal diseases through bilateral image analysis. As illustrated in Figure 1, the architecture employs a dual-stream heterogeneous design that simultaneously processes left and right fundus images to extract segmentation features for vasculature and optic disc/cup structures. Cross-attention mechanisms enable inter-ocular feature interaction and spatial alignment. The system integrates multi-scale representations spanning local lesions to global retinal context, with Squeeze-and-Excitation (SE) modules dynamically enhancing discriminative pathological features. Multi-level feature fusion is achieved through an enhanced ConvNeXt-Tiny backbone. By jointly optimizing disease classification and bilateral symmetry analysis, our framework concurrently diagnoses seven retinal pathologies (including diabetic retinopathy and glaucoma) while performing comparative biomarker analysis, significantly improving early lesion detection accuracy. Image preprocessing applies contrast-limited adaptive histogram equalization (CLAHE) exclusively to the luminance channel, enhancing local contrast while mitigating illumination inhomogeneity. A lightweight W-Net architecture segments critical anatomical structures (e.g., retinal vasculature and optic disc/cup), enabling computation of clinical biomarkers: cup-to-disc ratio (CDR), vascular fractal dimension (FD), vessel density (VD), and arteriole-to-venule ratio (AVR). Quantitative biomarkers are integrated into the BiNeXt-SMSMVL framework to establish mapping relationships between structural metrics and diagnostic predictions. The bilateral collaborative learning mechanism captures structural similarities and pathological differences between eyes. Also, a penalty loss function enforces consistency between bilateral overall labels and individual eye labels, thereby enhancing sensitivity to early-stage and mild lesions.
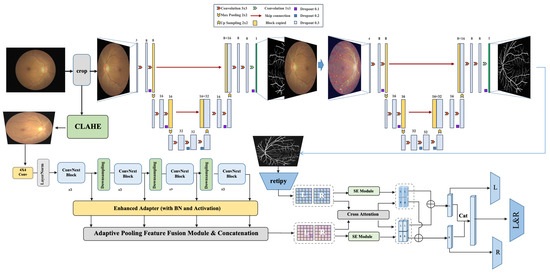
Figure 1.
The proposed multi-task multi-scale fundus disease diagnosis framework.
3.1. Data Pre-Processing and Augmentation
In fundus image analysis, distinguishing tissue structures and vascular morphology is critical for disease diagnosis. However, lighting and environmental conditions during imaging can degrade quality, obscuring fine details of microvessels and retinal tissues [6,7]. Among these issues, brightness imbalance is the most common. To improve fundus image quality, we applied contrast-limited adaptive histogram equalization (CLAHE) [37] to the brightness channel, enhancing contrast and clarity to highlight local details better and address brightness unevenness.
As shown in Figure 2, the process begins by converting the image from the RGB color space to the LAB color space. Next, the luminance channel (L) and the chrominance channels (A, B) are separated, and the CLAHE algorithm is applied only to the luminance channel (L) for contrast enhancement. The processed luminance channel is then recombined with the original chrominance channels, and the image is finally converted back to the RGB color space. This method significantly improves the quality of fundus images, making them more suitable for subsequent diagnostic analysis. In addition, we employed various image enhancement techniques, such as Ben’s color enhancement method, to further improve image quality. To standardize the numerical range of the images, we performed normalization and optionally applied it to the entire dataset. Gamma correction was also used to adjust the brightness and contrast of the images.

Figure 2.
The overall pipeline of data augmentation.
We implemented a series of data augmentation operations to enhance the model’s generalization capability, including random horizontal and vertical flipping. These techniques help the model learn the symmetrical features of the images and reduce dependency on image orientation [38]. Specifically, random affine transformations, such as rotation, translation, scaling, and shearing, enable the model to adapt to images from different perspectives and scales. Random color transformations, including brightness, contrast, saturation, and hue adjustments, simulate images under varying lighting conditions, enhancing color robustness. The Gaussian blurring reduces fine image details, encouraging the model to focus more on the overall structure of the image. Random erasing simulates potential occlusions in images, improving the model’s robustness to occlusions. The comparison between original and augmented images is shown in Figure 3.
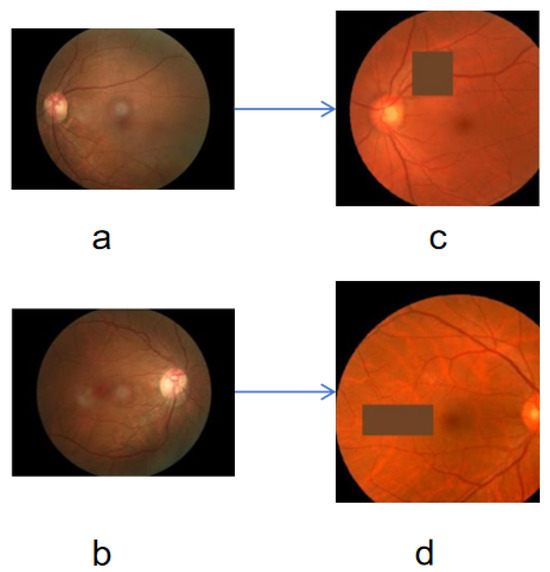
Figure 3.
Comparison before and after data augmentation, where the (a,b) are source images, the (c,d) are corresponding augmented images.
3.2. Vessel and Optic Disc/Cup Segmentation
Ophthalmic disease diagnosis models must embed specific medical knowledge frameworks to ensure alignment with clinical diagnostic pathways and enhance model interpretability. This study focuses on three key medical indicators for fundus diseases: the Cup-to-Disc Ratio (CDR) as a core metric for glaucoma screening, vessel tortuosity as a critical feature for diabetic retinopathy assessment, and the Arteriole-to-Venule Ratio (AVR) as a primary marker for hypertensive retinopathy [27,28]. We establish a bidirectional interpretability link between pathological mechanisms and computational models by explicitly extracting these clinically significant anatomical features. For instance, an increased CDR indicates the degree of optic nerve fiber atrophy. This medical knowledge-driven feature extraction strategy significantly improves the model’s clinical acceptability and provides a robust data foundation for subsequent multi-disease classification tasks.
Although many lightweight retinal vessel segmentation models demonstrate superior performance over complex architectures on specific datasets, their cross-domain generalization remains challenging when test data significantly deviates from the training distribution (e.g., images captured by different fundus camera models), segmentation accuracy often degrades substantially. To address this, we designed a Unsharp Masking (USM) module [39] that enhances high-frequency components in input images, which can be expressed as follows:
where (sharpness), (brightness compensation). The , where denotes the result of Gaussian blur and denotes the smooth level.
Figure 4 shows the comparison of images before and after USM processing. By observing the images, it is evident that USM processing effectively enhances the local contrast at vessel-background boundaries, enabling the encoder to more accurately capture texture features of key anatomical structures such as the optic disc contour and micro-vascular branches. This module achieves three key optimizations:
- a.
- Explicit Feature Enhancement: USM enhances high-frequency components of the image through Laplacian operator-equivalent operations, making it easier for W-Net to capture fine structures such as vessel boundaries and optic disc contours during the encoding stage.
- b.
- Improved Domain Adaptability: Brightness/color standardization reduces distribution shifts caused by imaging devices (e.g., different models of fundus cameras) or acquisition conditions (e.g., pupil dilation levels).
- c.
- Enhanced Model Robustness: By suppressing illumination inhomogeneity (e.g., central reflection artifacts) while enhancing anatomically relevant features, the module reduces the risk of model overfitting to irrelevant artifacts.
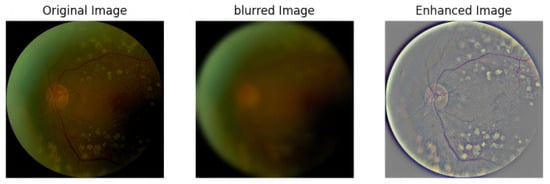
Figure 4.
Comparison before and after USM processing.
This module mitigates the risk of overfitting specific imaging patterns in the training data, providing reliable cross-domain adaptability for lesion screening and analysis. For vessel and optic disc/cup segmentation, we propose W-Net+, a multi-task segmentation model that integrates USM enhancement and attention-guided mechanisms, as illustrated in Figure 5. The model employs a dual-branch cross-entropy loss combined with cosine annealing learning rate scheduling (from to ) and multi-scale data augmentation, further strengthening its generalization capability under varying imaging conditions. Such a USM-enhanced W-Net+ framework improves segmentation accuracy and significantly enhances model stability in cross-dataset validation, providing a more reliable anatomical foundation for quantitative analysis of fundus lesions.
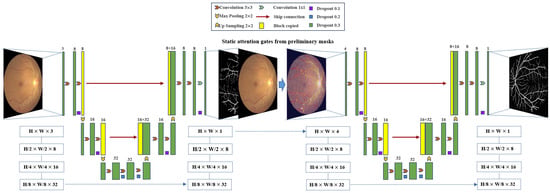
Figure 5.
The overall framework of the proposed W-Net+.
Specifically, the model consists of two cascaded U-Nets, where the first-layer U-Net network performs initial localization of blood vessels in the input fundus image, extracting multi-scale features through continuous downsampling and upsampling operations. In the network structure, each convolutional block consists of two convolutional layers, with the number of channels starting from 32 and doubling progressively to 128, then gradually decreasing to 32 through the upsampling path. Notably, the feature maps generated by the first-layer U-Net are used directly for coarse vessel segmentation and serve as a spatial attention mechanism to guide the second-layer U-Net network to focus on key anatomical regions. The second-layer network adopts a similar encoder-decoder structure but adds skip connections at each decoding stage to integrate shallow and deep features from the encoding path. By concatenating the original fundus image with the first-layer feature map in the channel dimension, an information-enhanced input is formed, effectively preserving the texture details of the original image and the vessel features extracted by the first-layer network. This cascaded design enables the second-layer U-Net to further refine vessel boundaries based on the coarse segmentation of the first layer. The entire model achieves high-precision segmentation of vessel boundaries with only 68,000 parameters (1–3 orders of magnitude lower than traditional models), featuring low computational complexity and fast inference speed. It is particularly suitable for clinical quantitative analyses such as vessel tortuosity calculations needed for retinopathy screening, and also provides ideal algorithmic support for resource-constrained portable fundus examination devices.
We chose a decoupled architecture over MTL [40] as it is both necessary—our complex ODIR-5K dataset lacks segmentation masks for dozens of rare pathologies—and strategically superior, allowing us to use robust, neutral anatomical priors (e.g., CDR) rather than disease-specific lesions.
3.3. Structure-Aware Bilateral Multi-Scale Disease Classification
While W-Net+ (Section 3.2) provides precise anatomical segmentation and clinically interpretable metrics (CDR, vessel tortuosity, AVR), preliminary experiments showed that using only these geometric features with traditional classifiers like AutoGluon achieved limited performance (60-65% accuracy) on hypertensive retinopathy and macular diseases. This is because geometric metrics alone cannot capture subtle color changes (hemorrhages, exudates) and texture patterns (drusen, edema) critical for these conditions. Therefore, we propose BiNeXt-SMSMVL, which integrates structural guidance from W-Net+ segmentation with multi-scale visual features and bilateral information to address these limitations. As shown in Figure 6, this approach combines the interpretability of medical metrics with the discriminative power of deep visual features for comprehensive disease classification. In practice, we applied the ConvNeXt-Tiny, as shown in Figure 7.
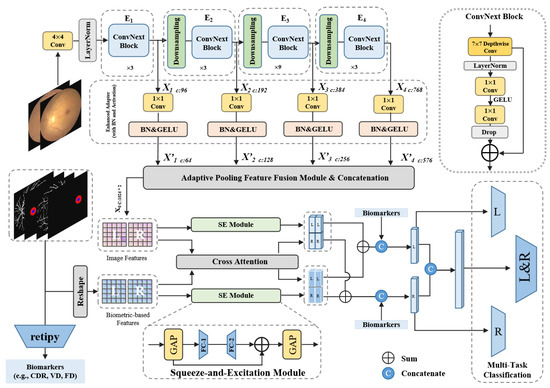
Figure 6.
Details of the proposed BiNeXt-SMSMVL architecture. The framework illustrates a multi-level fusion strategy. Deep ‘Image Features’ (from ConvNeXt via Adaptive Pooling Feature Fusion Module) and ‘Biometric-based Features’ (from reshaped W-Net+ masks) are processed in parallel by independent SE modules and a joint Cross-Attention module. The outputs are combined via element-wise addition. Finally, this attention-enhanced vector is concatenated with explicit ‘Numerical Biomarkers’ (from retipy) before being passed to the multi-task classification heads.
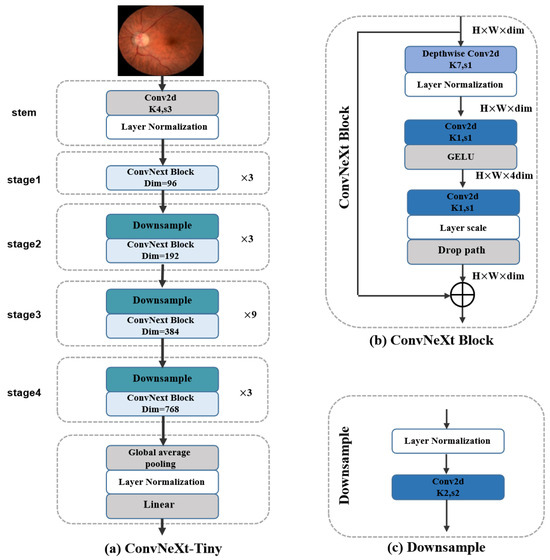
Figure 7.
Details of the (a) ConvNeXt-Tiny, (b) ConvNeXt Block, and the (c) Downsample modules.
The ConvNeXt-Tiny network architecture includes an image preprocessing module (stem) and four consecutive feature extraction stages. In these stages, the spatial dimensions of feature maps gradually decrease while the number of channels progressively increases, enabling the feature maps to capture increasingly broad feature receptive fields. Each stage consists of a downsampling layer shown in Figure 7c and ConvNeXt blocks shown in Figure 7b, where the downsampling layer is responsible for reducing image resolution, and the ConvNeXt blocks handle feature extraction. Compared to ResNet50, ConvNeXt-Tiny adjusts the stacking frequency of convolutional modules (from ResNet50’s 3,4,6,3 to ConvNeXt-Tiny’s 3,3,9,3), recombining previously extracted features to make the final features richer and more complex, which is highly advantageous for image classification tasks. Additionally, the ConvNeXt block draws on the grouped convolution technique from ResNeXt, achieving a better balance between model complexity and accuracy. The “shortcuts” in the network help gradients propagate backward during training, resulting in better models. ConvNeXt-Tiny also reduces the number of normalization layers to accelerate the training process and adopts layer normalization to decrease the model’s sensitivity to parameter initialization. Except for the first block, ConvNeXt-Tiny adds a downsampling layer in each block, which changes the dimensions of feature maps, enabling the network to extract more complex features.
Objects and structures in images exhibit different characteristics at various scales. For instance, small-scale features may contain detailed information (edges and textures), while large-scale features may contain overall structural information (such as shapes and contours). Combining features from different scales allows the model to simultaneously utilize both detailed and overall information, thereby comprehending image content more comprehensively. As shown in Figure 8, we applied a pre-trained ConvNeXt-Tiny model to extract multi-scale features. The model’s first four stages are extracted separately to form different feature extraction modules, and four convolutional layers are defined as a set of adapters to modify the output channel number of each stage for subsequent processing. This way, we can obtain feature maps of different scales from each stage when the input image passes through all four stages sequentially. Due to the adapters, the output channel numbers of the four stages are adapted to 64, 128, 256, and 576, respectively. Subsequently, adaptive average pooling is applied to each feature map, and finally, all pooled feature maps are concatenated along the channel dimension to obtain the final multi-scale feature map. To further enhance the network’s performance, we introduce the attention mechanism network SENet, as shown in Figure 9.
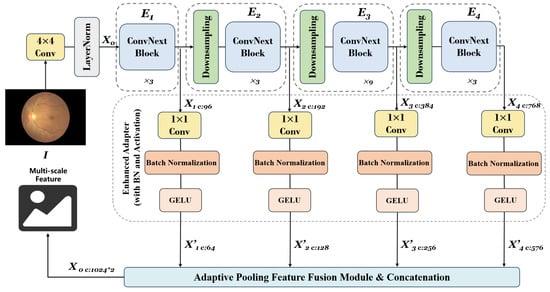
Figure 8.
Details of our proposed multi-scale feature fusion.
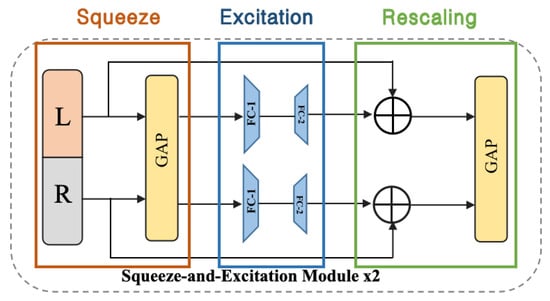
Figure 9.
Details of the Squeeze-and-Excitation (SE) layer.
By explicitly modeling interdependencies between channels to recalibrate channel features. The working principle of the SE layer can be divided into three phases: First, the squeeze phase is through Global Average Pooling (GAP); the spatial dimensions of each channel’s feature map are compressed into a single value so that each channel produces a feature representing the global information of that channel. Second, the excitation phase uses a fully connected layer (typically including a ReLU activation function and another fully connected layer) to learn dependencies between channels, generating weights representing each channel’s importance. Third, the re-scaling phase multiples the generated weights by the original channel feature maps to re-scale the feature maps, thereby enhancing important features and suppressing unimportant ones.
This multi-scale feature map (labeled ‘Image Features’ in Figure 6) serves as the primary visual input to our core fusion module. As detailed in Figure 6, our “structure-aware” framework processes anatomical information in parallel. The segmentation masks from W-Net+ are reshaped to create ‘Biometric-based Features’, which act as a spatial-morphological feature map. Both the ‘Image Features’ and the ‘Biometric-based Features’ are then processed by their own independent SE layer (Squeeze-and-Excitation layer), referencing the mechanism described in Figure 9, to enhance their respective channel-wise features. Concurrently, both feature sets are fed into a Cross-Attention module to model their interactions. In this module, we use the biometric features as the Query (Q) and the image features as the Key (K) and Value (V), guiding the model to learn the correlation between anatomical regions and visual pathologies. The outputs of these three modules (SE-Image, SE-Biometric, and Cross-Attention) are then combined via element-wise addition.
We constructed the multi-task classification head based on this fused representation, as shown in Figure 6. As a final fusion step, the retipy library extracts explicit Numerical Biomarkers (e.g., CDR, VD, FD) from the original masks. This 1D vector is concatenated (indicated by the ‘C’ icon in Figure 6) with the feature vector resulting from the element-wise addition. This final, comprehensive vector is then fed into three distinct classifiers for left-eye, right-eye, and binocular (L&R) classification. During training, we freeze the parameters of the shared feature extraction modules to ensure both left and right eye images benefit from a common feature extractor. This architecture allows the model to learn shared underlying patterns while the independent attention components and final classifier paths capture eye-specific diagnostic information.
3.4. Loss Function Design
Constructing or optimizing the loss function is a crucial component in model optimization. The loss function defines the difference or error between the model’s predicted and true values and is the objective that needs to be minimized during model training. A good loss function should accurately reflect the deficiencies in model performance and guide the model to learn the correct features. The binary cross-entropy loss function we use is a common loss function for binary classification problems. It measures the difference between the probability distribution predicted by the model and the true label distribution and is widely used in various classification tasks, such as image recognition. The formula for the binary cross-entropy loss function is as follows:
where represents the true label (0 or 1), and represents the probability predicted by the model. The binary cross-entropy loss function calculates the logarithmic difference between true and predicted labels. When the model’s predictions perfectly match the true labels, the cross-entropy loss is 0; the greater the discrepancy between the predicted probabilities and the true labels, the higher the loss value, which motivates the model to adjust parameters during training to reduce prediction errors. Below are the multi-task loss function formulas we adopted in our project, where (), (), and () represent the loss functions for the left eye, right eye, and binocular respectively, and () represents the overall model loss function.
To better optimize the model, we added a penalty term to the original binary cross-entropy loss function, resulting in the final loss function shown below:
The left and right eye labels should satisfy the following rules: when the first position (i.e., Normal) of both eye labels is 1, the first position of the binocular total label should also be 1. For the other seven positions (seven types of diseases), if either eye has a position value of 1, the corresponding position in the binocular total label should be 1. To encourage the binocular total label calculation to meet the above rules, we define a penalty term as follows:
where N is the total number of labels, represents the i-th binocular total label, and and represent the i-th left and right eye labels respectively. Specifically, the is the indicator function, which evaluates to 1 if the condition is true, and 0 otherwise.
The calculation method is as follows: For the first position of the label, if the logical AND result of the binocular total label and either eye’s label is inconsistent, then calculate the absolute difference; for the remaining seven positions of the label, if the binocular total label is inconsistent with the maximum value of either eye’s label, then calculate the difference. This design of penalty loss ensures that the model can correctly reflect the label relationship of binocular images during prediction, thereby improving the accuracy and consistency of the model. By adding this penalty term to the total loss, the model will be guided to follow these specific label rules during the training process. We chose the L1-like absolute difference (Equation (7)) as it directly enforces our deterministic logical ‘AND’/‘OR’ rules, unlike metrics such as KL divergence which are unsuited for this task. This penalty is intentionally designed as a soft constraint (optimized via in ablation study), guiding the model toward common symmetries while crucially retaining the flexibility to learn valid asymmetric disease presentations.
4. Experiments Results
4.1. Experimental Setup
All models were implemented using the PyTorch framework and trained on an Ubuntu 22.04 server equipped with an Intel i9 CPU and an NVIDIA RTX 3090 GPU (with 24 GB GPU memory, CUDA 12.4). For reproducibility, all random seeds were fixed. We utilized the ODIR-5K dataset, as shown in Figure 10, partitioning it into 80% for training and 20% for validation, and resized all images to a uniform resolution. To address the significant class imbalance inherent in this sparse multi-label dataset, we employed a weighted binary cross-entropy (BCE) loss function. For each category, the positive class was assigned a weight calculated from the ratio of negative to positive samples of training dataset, thereby increasing the penalty for misclassifying rare positive labels. This loss-weighting strategy was complemented by a comprehensive data augmentation pipeline, including a 50% probability swap of left and right eye images. Models were trained for a maximum of 100 epochs using a batch size of 8. We employed the AdamW optimizer with a weight decay of 0.01. The learning rate was initialized at and managed by a cosine annealing scheduler () that decayed it to a minimum of . To mitigate overfitting, we implemented an early stopping strategy with a patience of 20 epochs, monitoring the primary validation metric.
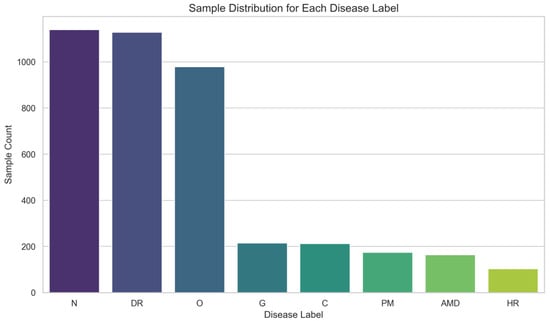
Figure 10.
Distribution of varied diseases.
4.2. Visual Results of Vessel Segmentation
Wnet+ was used to perform vessel segmentation on the samples in the dataset and identify arteries and veins, with results shown in Figure 11. Similarly, we used Wnet+ to segment the optic disc and cup structures, as shown in Figure 12.
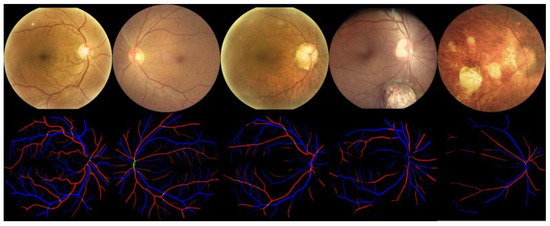
Figure 11.
Qualitative results of Artery/Vein (AV) segmentation. Arteries are indicated in red and veins are indicated in blue.
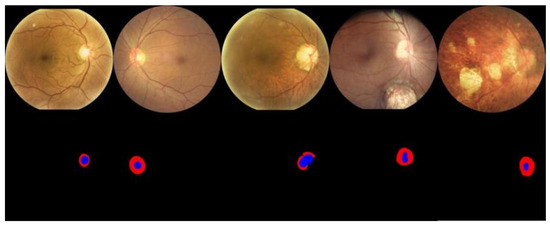
Figure 12.
Qualitative results of Optic Disc (OD) and Optic Cup (OC) segmentation. The optic cup is indicated in blue and the optic disc is indicated in red.
4.3. Validation of W-Net+ on the ODIR-5K Dataset
A critical point regarding our methodology is the validation of the segmentation module on the target classification dataset, ODIR-5K. We note that the ODIR-5K dataset provides no ground-truth segmentation masks for the optic disc, cup, or retinal vessels. Consequently, a direct quantitative performance evaluation (e.g., Dice, IoU) of W-Net+ on ODIR-5K is not feasible. To overcome this constraint, we employed a transfer-learning approach: the W-Net+ model was trained on the high-quality, annotated datasets (DRIVE, CHASE-DB1, HRF) and then applied to the ODIR-5K images to extract structural biomarkers.
The validity of this approach and the quality of the extracted biomarkers are supported by two strong lines of indirect evidence. First, the excellent cross-dataset generalization performance demonstrated in Table 2 confirms the robustness of the W-Net+ model. Second, the ablation study shows that the inclusion of these W-Net+ extracted biomarkers results in a significant performance increase for the downstream classification task. The full model (BiNeXtSMSMVL) achieved a Kappa score of 0.8472, whereas the model without these structural priors (BiNeXt+MSMVL) scored only 0.6798. This performance boost strongly indicates that the biomarkers extracted from ODIR-5K are accurate and clinically relevant.

Table 2.
Performance Comparison of Retinal Vessel Segmentation Methods on Benchmark Datasets. The best results are in bold.
4.4. Quantitative and Qualitative Comparison
To demonstrate the generalizability of the vessel segmentation algorithm, we conducted comparative experiments on the DRIVE [47], CHASE-DB1 [48], and HRF [49] datasets, with results shown in Table 2. From Table 2, we can see that in the test results of the three datasets (DRIVE, CHASE-DB1, and HRF), W-Net+ performs better than other models. Figure 13 shows a comparison of the effects of different models on the fundus image vessel segmentation task, with white lines representing the vessel structures detected by the algorithm. The first row shows the original fundus images, while the second row shows the vessel images segmented by various models.
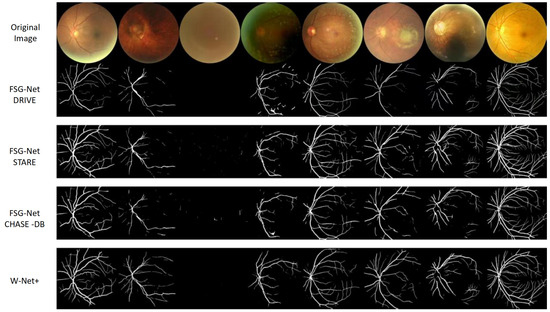
Figure 13.
Qualitative comparison of retinal vessel segmentation results.
We compared three versions of the FSG-Net model trained on different datasets with the W-Net+ model. These versions enhance segmentation accuracy through feature selection mechanisms. From the figure, the W-Net+ model outperforms other models in the vessel segmentation task because it can more clearly capture the fine structures of vessels, with segmentation results that are more precise and complete. The vessel structures have high continuity, clear details, smooth transitions, and essentially no breakages, indicating that W-Net+ has high accuracy and robustness when processing fundus image segmentation tasks.
To comprehensively present the effectiveness and superiority of the proposed model in multi-disease classification, we provide detailed performance evaluations of the model in multi-disease classification tasks, including the classification effects for different diseases, average classification metrics, comparisons with various other models, and the model’s performance under ablation experiments. Table 3 and Table 4 show the excellent performance of our proposed BiNeXtSMSMVL model in multi-disease classification tasks, with a micro-average accuracy as high as 0.96, indicating that the model’s prediction effect on the overall sample is very good. Table 5 shows the comparison of our BiNeXtSMSMVL model with various other models, and it can be seen that the BiNeXtSMSMVL model has extremely excellent performance in the four comparison standards of kappa, F1 score, Accuracy, and Micro-ACC. To further validate the rigor and stability of our results, addressing potential bias from a single 80/20 split, we also performed a comprehensive 5-fold cross-validation. These results are included in Table 5 as ’Ours 5-Fold’. The model demonstrates highly consistent performance across the folds, achieving an average Kappa score of 0.8444 and an F1-score of 0.9536. This confirms that our model’s superior performance is robust and not an artifact of a specific data partition.

Table 3.
Per-Disease Classification Metrics of the BiNeXtSMSMVL Model. The eight disease categories are: Normal (N), Diabetes (D), Glaucoma (G), Cataract (C), Age-related Macular Degeneration (A), Hypertension (H), Myopia (M), and Other Abnormalities (O).

Table 4.
Average performance of our BiNeXtSMSMVL.

Table 5.
Comparison of existing methods. The performance metrics for all baseline methods are cited directly from their original publications. The best results are in bold. Key metrics for our proposed method are reported as Value [95% Confidence Interval], with CIs calculated via bootstrapping.
4.5. Ablation Study
Table 6 shows the results of the BiNeXtSMSMVL model under ablation experiments, and it can be seen that after adding MVL (Multi-View Learning), MSL (Multi-Scale Learning), and structural enhancement modules to the BiNeXt model, the model’s performance has improved very significantly.

Table 6.
Ablation study.
To validate the contribution of the bilateral penalty term in our loss function (in Equation (7)) and to select the optimal hyperparameter , we conducted an ablation study. As shown in Table 7, we trained the model with different values of , ranging from 0.0 (no penalty) to 1.0. The results clearly demonstrate that the bilateral penalty provides a significant performance boost. When the penalty is removed ( = 0.0), performance is at its lowest (Kappa 0.8205). The model achieves its optimal performance at = 0.5 (Kappa 0.8472), which was used for all other experiments. This confirms that the soft constraint enforcing bilateral logic is a critical and beneficial component of our model.

Table 7.
Performance metrics at different values. The best results are in bold.
4.6. Generalizability Study
Furthermore, to validate the model’s generalizability and transferability to unseen data from different sources, we performed an external validation on the public EyePACS [59] dataset for the related task of DR grading. As shown in Table 8, our model achieves excellent performance. The results from both validations (stable cross-validation performance and high scores on EyePacs) jointly support the strong generalization capability of our proposed model.

Table 8.
Comparison of existing methods on EyePACS [59]. The best results are in bold.
4.7. Clinical Interpretability Analysis
To validate the clinical trustworthiness of BiNeXt-SMSMVL and ensure its decision-making process extends beyond a “black box” paradigm, we conducted a qualitative interpretability analysis using Gradient-weighted Class Activation Mapping (Grad-CAM). The resulting attention heatmaps, presented in Figure 14, visualize the image regions most influential to the model’s predictions for each of the eight disease categories. This analysis provides compelling visual evidence that the model’s focus is not based on spurious dataset artifacts but is instead grounded in clinically salient anatomical and pathological features. The heatmaps demonstrate that the model has learned to identify diagnostic criteria across the disease spectrum, from the key anatomical landmarks in normal images to the widespread structural obscurity indicative of severe cataracts.
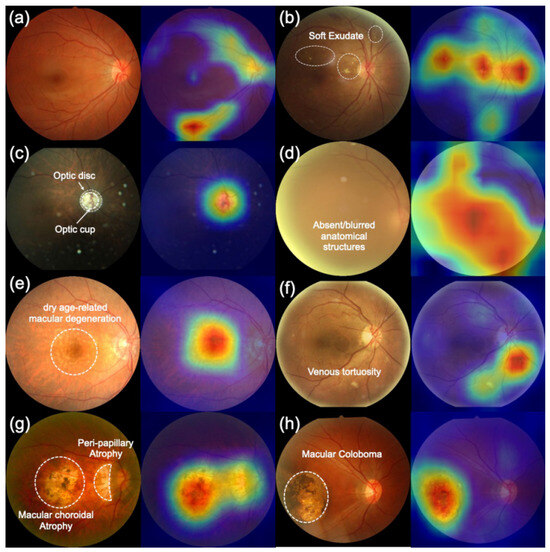
Figure 14.
Clinical interpretability heatmaps of the BiNeXt-SMSMVL model using Grad-CAM. The brighter areas (i.e., red and yellow) indicate higher importance to that prediction. (a) Normal, (b) Diabetic Retinopathy, (c) Glaucoma, (d) Cataract, (e) AMD, (f) Hypertension, (g) Myopia, and (h) Other Abnormalities. The left of each pair is the original image, and the right is the overlayed heatmap. Red areas indicate high-attention regions crucial for the model’s decision, demonstrating a strong focus on clinically relevant pathology.
This alignment with clinical practice is particularly evident in structure-sensitive diseases. For instance, in glaucoma cases, the model’s attention precisely localizes to the optic disc and cup region, which perfectly corroborates our framework’s architectural reliance on the cup-to-disc ratio (CDR) as a structural prior. Similarly, the model correctly identifies localized pathologies such as soft exudates in diabetic retinopathy, macular drusen in AMD, and peripapillary atrophy in pathological myopia. This analysis also revealed a current limitation: while effective for distinct lesions, the model’s focus on subtle, diffuse features, such as the fine vascular changes in hypertensive retinopathy, was less precise. This candid finding not only identifies a clear direction for future refinement but also enhances the overall trustworthiness of our model by transparently defining the boundaries of its current capabilities.
5. Discussion
In this work, our proposed BiNeXt-SMSMVL framework successfully integrates quantitative, clinically-interpretable biomarkers, extracted by a specialized W-Net+ segmentation module, with powerful semantic features from a ConvNeXt-Tiny backbone. This structure-aware design, augmented by a bilateral learning strategy with a custom logic-aware loss function, allows the model to move beyond a “black box” paradigm and make more reliable judgments in complex clinical scenarios. The efficacy of this approach is validated by our experimental results. On the challenging ODIR-5K multi-label dataset, our method achieves state-of-the-art performance, outperforming existing methods with a Kappa score of 0.8472 and an F1-score of 0.9600. Furthermore, rigorous ablation studies (Table 6) and external validation on the EyePACS dataset (Table 8) confirmed the significant contributions of our proposed components, particularly the structural priors and multi-view learning, and validated the model’s generalization capabilities.
Beyond quantitative metrics, the framework demonstrates significant advantages in clinical interpretability. As suggested by our Grad-CAM analysis (Figure 14), the model’s decision-making process is not based on spurious dataset artifacts but is instead grounded in clinically salient anatomical and pathological features. This alignment is particularly evident in structure-sensitive diseases. For instance, in glaucoma cases, the model’s attention precisely localizes to the optic disc and cup region, which perfectly corroborates our framework’s architectural reliance on the cup-to-disc ratio (CDR) as a structural prior. This transparency is fundamental for clinical trust and application.
While our framework demonstrates strong performance, a critical analysis of its operational boundaries reveals important limitations and provides context for future research. Firstly, our qualitative failure case analysis identified challenges in multi-label scenarios with imbalanced feature saliency. The framework demonstrated the most significant difficulty in reliably identifying Hypertensive Retinopathy (HR), particularly when it coexisted with other, more visually prominent diseases like Diabetic Retinopathy. This difficulty stems from both the inherent subtlety of HR-related lesions (e.g., arteriolar narrowing) and the model’s attention being captured by the dominant pathology (visualized in Figure 15), causing it to overlook the concurrent, subtle signs of HR. Secondly, a structural limitation pertains to data applicability. Our framework was specifically designed as a binocular system to leverage inter-eye correlations, enforced by our bilateral penalty loss. While this enriches the feature representation, it constrains the model’s direct applicability to datasets that provide paired left-right images, such as ODIR-5K. Consequently, the model cannot be directly deployed on common monocular datasets (e.g., RFMiD, Messidor-2) without significant architectural modifications. Finally, it is worth noting that during development, we found general-purpose foundation models like Med-SAM [65] to be suboptimal for the precise, fine-grained segmentation of retinal structures (e.g., optic cup IoU < 0.65). This finding motivated our development of the specialized W-Net+ architecture as a necessary foundation for reliable biomarker extraction.
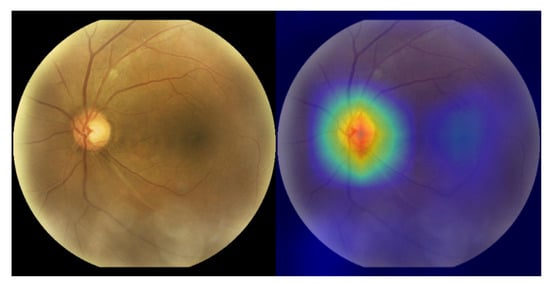
Figure 15.
Failure case analysis. The Grad-CAM heatmap (right) shows the model’s attention is captured by the highly salient features of the primary pathology (e.g., Glaucoma at the optic disc), causing it to fail to detect the more subtle, coexisting secondary pathology.
6. Conclusions
In this paper, we proposed the BiNeXt-SMSMVL framework, a novel structure-enhanced, bilateral, multi-scale, and multi-view learning network for robust fundus multi-disease classification. The core innovation of our work lies in the synergistic fusion of quantitative, clinically-interpretable structural priors, extracted by a specialized W-Net+ segmentation module, with powerful, multi-scale deep visual features from a ConvNeXt-Tiny backbone. Experimental results on the challenging ODIR-5K multi-label dataset demonstrate that our method achieves state-of-the-art performance, reaching a Kappa score of 0.8472 and an F1-score of 0.9600. This work validates the significant potential of integrating anatomical biomarkers with deep semantic representations to enhance diagnostic accuracy, interpretability, and robustness. Future work will focus on addressing remaining challenges such as label scarcity and class imbalance by incorporating weakly supervised mechanisms and human–AI collaborative systems, further advancing the clinical practicality of automated fundus disease diagnosis.
Author Contributions
Conceptualization, H.X.; Methodology, H.X. and M.W.; Investigation, H.X. and M.W.; Data Curation, X.G.; Project Administration, L.A.; Writing—original draft, R.G.; Writing—review & editing, L.A. and Y.W.; Visualization, R.G.; Funding acquisition, H.X. All authors have read and agreed to the published version of the manuscript.
Funding
This research was funded by Hangzhou Philosophy and Social Science Planning Project (No. M24YD052) and Zhejiang Provincial Department of Education Research Project (No. Y202455895).
Institutional Review Board Statement
Not applicable.
Data Availability Statement
The original data presented in the study are openly available in the following repositories: DRIVE (https://drive.grand-challenge.org/, (accessed on 12 May 2025)), CHASE-DB1 (https://huggingface.co/datasets/Zomba/CHASE_DB1-retinal-dataset, (accessed on 12 May 2025)), HRF (https://www5.cs.fau.de/research/data/fundus-images/, (accessed on 12 May 2025)), ODIR-5K (https://odir2019.grand-challenge.org/, (accessed on 12 May 2025)), and EyePACS (https://huggingface.co/datasets/bumbledeep/eyepacs, (accessed on 26 October 2025)).
Conflicts of Interest
The authors declare no conflicts of interest.
References
- Curtin, R. Ophthalmic photography: Retinal photography, angiography, and electronic imaging. Ophthalmic Surg. Lasers Imaging 2003, 34, 79–80. [Google Scholar] [CrossRef]
- Zhang, Z.; Deng, C.; Paulus, Y.M. Advances in structural and functional retinal imaging and biomarkers for early detection of diabetic retinopathy. Biomedicines 2024, 12, 1405. [Google Scholar] [CrossRef]
- Kumar, V.; Paul, K. Fundus imaging-based healthcare: Present and future. ACM Trans. Comput. Healthc. 2023, 4, 1–34. [Google Scholar] [CrossRef]
- Muniandy, T.; Thai, L.L.; Mahmood, M.H.; Lee, N.K. Feature Engineering Approach to Detect Retinal Vein Occlusion Using Ultra-Wide Field Fundus Images. In Proceedings of the 2023 4th International Conference on Artificial Intelligence and Data Sciences (AiDAS), Ipoh, Malaysia, 6–7 September 2023; pp. 366–370. [Google Scholar]
- Shen, Z.; Fu, H.; Shen, J.; Shao, L. Modeling and enhancing low-quality retinal fundus images. IEEE Trans. Med. Imaging 2020, 40, 996–1006. [Google Scholar] [CrossRef]
- Engelmann, J.; McTrusty, A.D.; MacCormick, I.J.; Pead, E.; Storkey, A.; Bernabeu, M.O. Detecting multiple retinal diseases in ultra-widefield fundus imaging and data-driven identification of informative regions with deep learning. Nat. Mach. Intell. 2022, 4, 1143–1154. [Google Scholar] [CrossRef]
- Li, H.; Li, H.; Ou, M.; Yu, X.; Zhang, X.; Niu, K.; Fu, H.; Liu, J. Fundus Image Quality Assessment and Enhancement: A Systematic Review. arXiv 2025, arXiv:2501.11520. [Google Scholar] [CrossRef]
- Li, N.; Li, T.; Hu, C.; Wang, K.; Kang, H. A benchmark of ocular disease intelligent recognition: One shot for multi-disease detection. In Proceedings of the Benchmarking, Measuring, and Optimizing: Third BenchCouncil International Symposium, Bench 2020, Virtual Event, 15–16 November 2020; Revised Selected Papers 3. Springer: Berlin/Heidelberg, Germany, 2021; pp. 177–193. [Google Scholar]
- Ding, W.; Sun, Y.; Ren, L.; Ju, H.; Feng, Z.; Li, M. Multiple lesions detection of fundus images based on convolution neural network algorithm with improved SFLA. IEEE Access 2020, 8, 97618–97631. [Google Scholar] [CrossRef]
- Liu, T.; Wagner, S.; Struyven, R.; Zhou, Y.; Williamson, D.; Romero-Bascones, D.; Lozano, M.G.; Pontikos, N.; Patel, P.J.; Borja, M.C.; et al. Retinal biomarkers for systemic diseases: An oculome-wide association study in 164,784 individuals. Investig. Ophthalmol. Vis. Sci. 2023, 64, 459. [Google Scholar]
- Neto, A.; Camera, J.; Oliveira, S.; Cláudia, A.; Cunha, A. Optic disc and cup segmentations for glaucoma assessment using cup-to-disc ratio. Procedia Comput. Sci. 2022, 196, 485–492. [Google Scholar] [CrossRef]
- Cheung, N.; Wong, T.Y. Retinal vessel analysis as a tool to quantify risk of diabetic retinopathy. Asia-Pac. J. Ophthalmol. 2012, 1, 240–244. [Google Scholar] [CrossRef]
- Jimenez-Carmona, S.; Alemany-Marquez, P.; Alvarez-Ramos, P.; Mayoral, E.; Aguilar-Diosdado, M. Validation of an automated screening system for diabetic retinopathy operating under real clinical conditions. J. Clin. Med. 2021, 11, 14. [Google Scholar] [CrossRef]
- Ronneberger, O.; Fischer, P.; Brox, T. U-net: Convolutional networks for biomedical image segmentation. In Proceedings of the Medical Image Computing and Computer-Assisted Intervention–MICCAI 2015: 18th International Conference, Munich, Germany, 5–9 October 2015; Proceedings, Part III 18. Springer: Berlin/Heidelberg, Germany, 2015; pp. 234–241. [Google Scholar]
- He, K.; Zhang, X.; Ren, S.; Sun, J. Deep residual learning for image recognition. In Proceedings of the IEEE Conference on Computer Vision and Pattern Recognition, Las Vegas, NV, USA, 27–30 June 2016; pp. 770–778. [Google Scholar]
- Zhou, Z.; Rahman Siddiquee, M.M.; Tajbakhsh, N.; Liang, J. Unet++: A nested u-net architecture for medical image segmentation. In Proceedings of the Deep Learning in Medical Image Analysis and Multimodal Learning for Clinical Decision Support: 4th International Workshop, DLMIA 2018, and 8th International Workshop, ML-CDS 2018, Held in Conjunction with MICCAI 2018, Granada, Spain, 20 September 2018; Proceedings 4. Springer: Berlin/Heidelberg, Germany, 2018; pp. 3–11. [Google Scholar]
- Oktay, O.; Schlemper, J.; Folgoc, L.L.; Lee, M.; Heinrich, M.; Misawa, K.; Mori, K.; McDonagh, S.; Hammerla, N.Y.; Kainz, B.; et al. Attention u-net: Learning where to look for the pancreas. arXiv 2018, arXiv:1804.03999. [Google Scholar] [CrossRef]
- Zhao, H.; Shi, J.; Qi, X.; Wang, X.; Jia, J. Pyramid scene parsing network. In Proceedings of the IEEE Conference on Computer Vision and Pattern Recognition, Honolulu, HI, USA, 21–26 July 2017; pp. 2881–2890. [Google Scholar]
- Yu, F.; Koltun, V. Multi-scale context aggregation by dilated convolutions. arXiv 2015, arXiv:1511.07122. [Google Scholar]
- Lee, C.Y.; Xie, S.; Gallagher, P.; Zhang, Z.; Tu, Z. Deeply-supervised nets. In Proceedings of the Artificial Intelligence and Statistics, San Diego, CA, USA, 9–12 May 2015; pp. 562–570. [Google Scholar]
- Salehi, S.S.M.; Erdogmus, D.; Gholipour, A. Tversky loss function for image segmentation using 3D fully convolutional deep networks. In Proceedings of the 8th International Workshop, MLMI 2017, Quebec City, QC, Canada, 10 September 2017; Springer: Berlin/Heidelberg, Germany, 2017; pp. 379–387. [Google Scholar]
- Lin, T.Y.; Goyal, P.; Girshick, R.; He, K.; Dollár, P. Focal loss for dense object detection. In Proceedings of the IEEE International Conference on Computer Vision, Venice, Italy, 22–29 October 2017; pp. 2980–2988. [Google Scholar]
- Hu, J.; Shen, L.; Sun, G. Squeeze-and-excitation networks. In Proceedings of the IEEE Conference on Computer Vision and Pattern Recognition, Salt Lake City, UT, USA, 18–23 June 2018; pp. 7132–7141. [Google Scholar]
- Woo, S.; Park, J.; Lee, J.Y.; Kweon, I.S. Cbam: Convolutional block attention module. In Proceedings of the European Conference on Computer Vision (ECCV), Munich, Germany, 8–14 September 2018; pp. 3–19. [Google Scholar]
- Vaswani, A.; Shazeer, N.; Parmar, N.; Uszkoreit, J.; Jones, L.; Gomez, A.N.; Kaiser, Ł.; Polosukhin, I. Attention is all you need. In Advances in Neural Information Processing Systems 30; Curran Associates, Inc.: Red Hook, NY, USA, 2017. [Google Scholar]
- Fu, H.; Cheng, J.; Xu, Y.; Wong, D.W.K.; Liu, J.; Cao, X. Joint optic disc and cup segmentation based on multi-label deep network and polar transformation. IEEE Trans. Med. Imaging 2018, 37, 1597–1605. [Google Scholar] [CrossRef]
- Joshua, A.O.; Mabuza-Hocquet, G.; Nelwamondo, F.V. Assessment of the cup-to-disc ratio method for glaucoma detection. In Proceedings of the 2020 International SAUPEC/RobMech/PRASA Conference, Cape Town, South Africa, 29–31 January 2020; pp. 1–5. [Google Scholar]
- Bates, R.; Irving, B.; Markelc, B.; Kaeppler, J.; Muschel, R.; Grau, V.; Schnabel, J.A. Extracting 3D vascular structures from microscopy images using convolutional recurrent networks. arXiv 2017, arXiv:1705.09597. [Google Scholar] [CrossRef]
- Wang, M.; Zhou, X.; Liu, D.N.; Chen, J.; Zheng, Z.; Ling, S. Development and validation of a predictive risk model based on retinal geometry for an early assessment of diabetic retinopathy. Front. Endocrinol. 2022, 13, 1033611. [Google Scholar] [CrossRef]
- Zhong, Y.; Chen, T.; Zhong, D.; Liu, X. Vessel Segmentation in Fundus Images with Multi-Scale Feature Extraction and Disentangled Representation. Appl. Sci. 2024, 14, 5039. [Google Scholar] [CrossRef]
- Mukherjee, S.; Nazemi, M.; Jonkers, I.; Geris, L. Use of computational modeling to study joint degeneration: A review. Front. Bioeng. Biotechnol. 2020, 8, 93. [Google Scholar] [CrossRef]
- Pektaş, M. Performance analysis of efficient deep learning models for multi-label classification of fundus image. Artif. Intell. Theory Appl. 2023, 3, 105–112. [Google Scholar]
- Cheng, Y.; Ma, M.; Li, X.; Zhou, Y. Multi-label classification of fundus images based on graph convolutional network. BMC Med. Inform. Decis. Mak. 2021, 21, 1–9. [Google Scholar] [CrossRef] [PubMed]
- Hervella, Á.S.; Rouco, J.; Novo, J.; Ortega, M. End-to-end multi-task learning for simultaneous optic disc and cup segmentation and glaucoma classification in eye fundus images. Appl. Soft Comput. 2022, 116, 108347. [Google Scholar] [CrossRef]
- Yin, M.; Soomro, T.A.; Jandan, F.A.; Fatihi, A.; Ubaid, F.B.; Irfan, M.; Afifi, A.J.; Rahman, S.; Telenyk, S.; Nowakowski, G. Dual-branch U-Net architecture for retinal lesions segmentation on fundus image. IEEE Access 2023, 11, 130451–130465. [Google Scholar] [CrossRef]
- Wang, D.; Lian, J.; Jiao, W. Multi-label classification of retinal disease via a novel vision transformer model. Front. Neurosci. 2024, 17, 1290803. [Google Scholar] [CrossRef] [PubMed]
- Chang, Y.; Jung, C.; Ke, P.; Song, H.; Hwang, J. Automatic contrast-limited adaptive histogram equalization with dual gamma correction. IEEE Access 2018, 6, 11782–11792. [Google Scholar] [CrossRef]
- Liu, H.; Jiang, P.; Tao, Z. Google is all you need: Semi-Supervised Transfer Learning Strategy For Light Multimodal Multi-Task Classification Model. arXiv 2025, arXiv:2501.01611. [Google Scholar]
- Yuan, X.; Wang, C.; Chen, X.; Wang, M.; Li, N.; Yu, C. IGFU: A Hybrid Underwater Image Enhancement Approach Combining adaptive GWA, FFA-Net with USM. IEEE Open J. Comput. Soc. 2024, 6, 294–306. [Google Scholar] [CrossRef]
- Wang, X.; Xu, M.; Zhang, J.; Jiang, L.; Li, L. Deep multi-task learning for diabetic retinopathy grading in fundus images. In Proceedings of the AAAI Conference on Artificial Intelligence, Virtual Event, 2–9 February 2021; Volume 35, pp. 2826–2834. [Google Scholar]
- Liskowski, P.; Krawiec, K. Segmenting retinal blood vessels with deep neural networks. IEEE Trans. Med. Imaging 2016, 35, 2369–2380. [Google Scholar] [CrossRef]
- Orlando, J.I.; Prokofyeva, E.; Blaschko, M.B. A discriminatively trained fully connected conditional random field model for blood vessel segmentation in fundus images. IEEE Trans. Biomed. Eng. 2016, 64, 16–27. [Google Scholar] [CrossRef]
- Shin, S.Y.; Lee, S.; Yun, I.D.; Lee, K.M. Deep vessel segmentation by learning graphical connectivity. Med. Image Anal. 2019, 58, 101556. [Google Scholar] [CrossRef]
- Zhao, Y.; Rada, L.; Chen, K.; Harding, S.P.; Zheng, Y. Automated vessel segmentation using infinite perimeter active contour model with hybrid region information with application to retinal images. IEEE Trans. Med. Imaging 2015, 34, 1797–1807. [Google Scholar] [CrossRef]
- Li, B.; Zhang, Y.; Ren, Y.; Zhang, C.; Yin, B. Lite-UNet: A lightweight and efficient network for cell localization. Eng. Appl. Artif. Intell. 2024, 129, 107634. [Google Scholar] [CrossRef]
- Galdran, A.; Anjos, A.; Dolz, J.; Chakor, H.; Lombaert, H.; Ayed, I.B. The little w-net that could: State-of-the-art retinal vessel segmentation with minimalistic models. arXiv 2020, arXiv:2009.01907. [Google Scholar]
- Staal, J.; Abràmoff, M.D.; Niemeijer, M.; Viergever, M.A.; Van Ginneken, B. Ridge-based vessel segmentation in color images of the retina. IEEE Trans. Med. Imaging 2004, 23, 501–509. [Google Scholar] [CrossRef]
- Fraz, M.M.; Remagnino, P.; Hoppe, A.; Uyyanonvara, B.; Rudnicka, A.R.; Owen, C.G.; Barman, S.A. An ensemble classification-based approach applied to retinal blood vessel segmentation. IEEE Trans. Biomed. Eng. 2012, 59, 2538–2548. [Google Scholar] [CrossRef]
- Budai, A.; Bock, R.; Maier, A.; Hornegger, J.; Michelson, G. Robust vessel segmentation in fundus images. Int. J. Biomed. Imaging 2013, 2013, 154860. [Google Scholar] [CrossRef]
- Cheng, Z.; Sun, H.; Takeuchi, M.; Katto, J. Learned image compression with discretized gaussian mixture likelihoods and attention modules. In Proceedings of the IEEE/CVF Conference on Computer Vision and Pattern Recognition, Seattle, WA, USA, 13–19 June 2020; pp. 7939–7948. [Google Scholar]
- Sitaula, C.; Hossain, M.B. Attention-based VGG-16 model for COVID-19 chest X-ray image classification. Appl. Intell. 2021, 51, 2850–2863. [Google Scholar] [CrossRef]
- Luo, D.; Shen, L. Vessel-net: A vessel-aware ensemble network for retinopathy screening from fundus image. In Proceedings of the 2020 IEEE International Conference on Image Processing (ICIP), Virtual, 25–28 October 2020; pp. 320–324. [Google Scholar]
- Bhati, A.; Gour, N.; Khanna, P.; Ojha, A. Discriminative kernel convolution network for multi-label ophthalmic disease detection on imbalanced fundus image dataset. Comput. Biol. Med. 2023, 153, 106519. [Google Scholar] [CrossRef]
- Xu, J.; Li, Y.; Xing, W. ADMM Training Algorithms for Residual Networks: Convergence, Complexity and Parallel Training. arXiv 2023, arXiv:2310.15334. [Google Scholar] [CrossRef]
- Liu, S.; Himel, G.M.S.; Wang, J. Breast Cancer Classification with Enhanced Interpretability: DALAResNet50 and DT Grad-CAM. IEEE Access 2024, 12, 196647–196659. [Google Scholar] [CrossRef]
- Hong, X.; Li, W.; Wang, C.; Lin, M.; Lu, S. Label attentive distillation for GNN-based graph classification. In Proceedings of the AAAI Conference on Artificial Intelligence, Vancouver, BC, Canada, 20–27 February 2024; Volume 38, pp. 8499–8507. [Google Scholar]
- Satorras, V.G.; Hoogeboom, E.; Welling, M. E (n) equivariant graph neural networks. In Proceedings of the International Conference on Machine Learning, Virtual, 18–24 July 2021; pp. 9323–9332. [Google Scholar]
- Fu, P.; Liang, X.; Luo, T.; Guo, Q.; Zhang, Y.; Qian, Y. Core-structures-guided multi-modal classification neural architecture search. In Proceedings of the Thirty-Third International Joint Conference on Artificial Intelligence, Jeju, Republic of Korea, 3–9 August 2024; IJCAI-24. Larson, K., Ed.; International Joint Conferences on Artificial Intelligence Organization: Menlo Park, CA, USA, 2024; pp. 3980–3988. [Google Scholar]
- Cuadros, J.; Bresnick, G. EyePACS: An adaptable telemedicine system for diabetic retinopathy screening. J. Diabetes Sci. Technol. 2009, 3, 509–516. [Google Scholar] [CrossRef]
- Yaqoob, M.K.; Ali, S.F.; Bilal, M.; Hanif, M.S.; Al-Saggaf, U.M. ResNet based deep features and random forest classifier for diabetic retinopathy detection. Sensors 2021, 21, 3883. [Google Scholar] [CrossRef] [PubMed]
- Hannan, A.; Mahmood, Z.; Qureshi, R.; Ali, H. Enhancing diabetic retinopathy classification accuracy through dual-attention mechanism in deep learning. Comput. Methods Biomech. Biomed. Eng. Imaging Vis. 2025, 13, 2539079. [Google Scholar] [CrossRef]
- Zhao, S.; Wu, Y.; Tong, M.; Yao, Y.; Qian, W.; Qi, S. CoT-XNet: Contextual transformer with Xception network for diabetic retinopathy grading. Phys. Med. Biol. 2022, 67, 245003. [Google Scholar] [CrossRef] [PubMed]
- Li, F.; Tang, S.; Chen, Y.; Zou, H. Deep attentive convolutional neural network for automatic grading of imbalanced diabetic retinopathy in retinal fundus images. Biomed. Opt. Express 2022, 13, 5813–5835. [Google Scholar] [CrossRef]
- Liu, Y.; Yao, D.; Ma, Y.; Wang, H.; Wang, J.; Bai, X.; Zeng, G.; Liu, Y. STMF-DRNet: A multi-branch fine-grained classification model for diabetic retinopathy using Swin-TransformerV2. Biomed. Signal Process. Control 2025, 103, 107352. [Google Scholar] [CrossRef]
- Ma, J.; He, Y.; Li, F.; Han, L.; You, C.; Wang, B. Segment anything in medical images. Nat. Commun. 2024, 15, 654. [Google Scholar] [CrossRef]
Disclaimer/Publisher’s Note: The statements, opinions and data contained in all publications are solely those of the individual author(s) and contributor(s) and not of MDPI and/or the editor(s). MDPI and/or the editor(s) disclaim responsibility for any injury to people or property resulting from any ideas, methods, instructions or products referred to in the content. |
© 2025 by the authors. Licensee MDPI, Basel, Switzerland. This article is an open access article distributed under the terms and conditions of the Creative Commons Attribution (CC BY) license (https://creativecommons.org/licenses/by/4.0/).