Article

Frequency-Aware Multi-Rate Resampling with Multi-Band Deep Supervision for Modular Speech Denoising

School of Computing and Artificial Intelligence, Hanshin University, Osan 18101, Republic of Korea
Electronics 2025, 14(22), 4523; https://doi.org/10.3390/electronics14224523
Submission received: 1 October 2025 / Revised: 11 November 2025 / Accepted: 11 November 2025 / Published: 19 November 2025
(This article belongs to the Special Issue Intelligent Signal Processing and Its Applications)

Abstract

Conventional waveform-based speech enhancement models prioritize temporal modeling, often neglecting the irreversible spectral information loss triggered by standard downsampling. Consequently, this study introduces a novel frequency-aware framework. The proposed approach incorporates a modular, multi-rate resampling module with principled anti-aliasing to precisely control each layer’s effective frequency band, complemented by a multi-band loss function for deep supervision. Integrating this module into a standard Wave-U-Net and an attention-enhanced variant confirmed its effectiveness. The findings show a significant improvement over the baseline, yielding an average Perceptual Evaluation of Speech Quality gain of 0.40, with further benefits when paired with an advanced temporal model at a permissible increase in computational complexity. Furthermore, tests on novel noise types validate the generalizability of the proposed principles, establishing structured frequency band allocation as a fundamental, modular design strategy for improving end-to-end models.

1. Introduction

High-quality speech signals are crucial for various modern intelligent systems, spanning high-fidelity audio restoration to real-time communication tools. However, ambient noise remains a major limitation in intelligent signal processing. Historically, the field relied on simplified statistical approaches like spectral subtraction [1] and Wiener filtering [2]. Although minimum mean-square error (MMSE) estimators [3] were more rigorous, their efficacy remained limited by assumptions about stationary noise, deteriorating performance in dynamic environments and introducing artifacts [1].
Early machine learning models like non-negative matrix factorization (NMF) [4] bridged the gap between conventional and modern methods by learning basis vectors directly from data, offering greater flexibility than their fixed statistical predecessors. Nevertheless, their linear structure constrained performance in highly complex, non-stationary noise environments, necessitating a paradigm shift.
The emergence of deep learning has transformed speech enhancement, creating two streams: Short-Time Fourier Transform (STFT)-based techniques, which operate on time-frequency magnitude but rely on noisy phase estimates [5], and end-to-end (E2E) models, which process raw waveforms directly with notable effectiveness [6]. These models learn complex and non-linear mappings from noisy to clean speech, enabling effective noise suppression without explicit assumptions. Architectures like Wave-U-Net [7] exemplify E2E’s effectiveness in multi-scale feature learning in the time domain, reducing reliance on STFT-phase assumptions.
Recent advancements in speech enhancement primarily stem from temporal modeling using recurrent neural networks (RNNs) [8] and self-attention mechanisms [9]. In addition, the field has advanced with other prominent streams over the last three years. These include diffusion and generative models that integrate denoising with high-fidelity restoration, sub-band and hybrid approaches that integrate full- and sub-band interactions, and waveform-based or low-latency systems for real-time efficiency, such as DeepFilterNet2, which emphasize computational efficiency without sacrificing perceptual quality [10,11,12,13,14,15,16,17].
Although these approaches are central to modern speech processing and have yielded substantial gains, a common, overlooked challenge remains: the irreversible loss of high-frequency spectral detail caused by standard downsampling techniques (strided convolutions) in several encoder–decoder architectures.
Instead of proposing another end-to-end backbone, this study introduces a novel, frequency-aware multi-rate resampling module. This module explicitly sets each layer’s passband and enforces principled anti-aliasing, mitigating irreversible spectral loss and aliasing-induced spectral distortion. To maximize effectiveness, we employ a complementary multi-band deep supervision strategy that emphasizes perceptually critical bands and suppresses residual artifacts. We demonstrate that our approach is backbone-agnostic and parameter-neutral, complements existing temporal modules, is robust against unseen noise, and performs favorably against representative same-type models like CleanUNet [9] and Conv-TasNet [18].
The primary objective is to propose and validate this modular approach rather than introducing a novel state-of-the-art model. The remainder of this paper is organized as follows. Section 2 reviews the limitations of existing models. Section 3 details the proposed framework. Section 4 outlines the validation setup. Section 5 reports the empirical results. Finally, Section 6 concludes with key findings.

2. Related Work

2.1. Wave-U-Net and the Focus on Temporal Modeling

E2E models operating directly on raw waveforms have garnered significant attention, with Wave-U-Net serving as a foundational architecture [6,7]. As Figure 1a illustrates, it adapts the U-Net’s symmetric encoder–decoder structure [19] to 1D audio. The encoder uses strided downsampling to extract hierarchical features, and the decoder mirrors this process, fusing multi-scale information via skip connections for precise reconstruction. In multi-rate digital signal processing, downsampling is ideally preceded by a low-pass anti-aliasing filter to prevent irreversible aliasing [20]. Section 2.3 analyzes the impact of omitting this filter and its interaction with temporal modules.
Accordingly, subsequent studies extend Wave-U-Net to capture longer-range temporal dependencies using methods like inserting an LSTM at the bottleneck to model sequential patterns [8] or applying attention to represent non-local relationships across the signal [9]. Although these mechanisms enhance temporal modeling and yield performance improvements, they remain constrained by artifacts introduced by early-stage decimation.

2.2. Comparison with Sub-Band and Hybrid Approaches

The proposed frequency-aware design differs from related sub-band and hybrid full/sub-band approaches in both objective and implementation. FullSubNet-style models operate in the STFT domain and explicitly utilize sub-bands and their cross-band interactions [21,22]; however, DTLN primarily processes STFT magnitudes in a two-stage pipeline without parallel sub-band decomposition [23]. In contrast, the proposed method works on raw waveforms and employs principled multi-rate resampling to develop a hierarchy where each layer has an explicitly controlled bandwidth [20]. Rather than parallel inter-band modeling [21,22], the emphasis is on layer-wise bandwidth allocation with explicit pre-decimation low-pass filtering [20], directly targeting aliasing and spectral loss due to conventional downsampling, a challenge orthogonal to primary sub-band research objectives [24].

2.3. Spectral Information Loss from Downsampling

Although temporal enhancements are effective, encoder–decoder architectures relying on strided decimation reduce the internal sampling rate of each branch, thereby limiting its maximum representable frequency (Nyquist–Shannon sampling theorem [24]; Figure 1b). When high-frequency content is not preserved via skip paths or parallel high-rate branches, the necessary low-pass filtering before decimation discards energy above the new Nyquist limit [20]; if anti-aliasing is insufficient, this energy folds back as aliasing [20]. In both situations, information outside the reduced band is lost, degrading cues crucial for clarity and intelligibility. Hence, we adopt the original Wave-U-Net as the baseline configuration to isolate and quantify the contribution of the proposed frequency-aware module [6,7].

2.4. Recent Advancements (2022–2025)

Recent research in speech enhancement has evolved along three closely related directions that frame our contribution. Sub-band and hybrid full/sub-band models integrate band-aware processing with full-band context; for example, TF-GridNet integrates global information with sub-band attention [11] and band-split RNN variants refine high-fidelity enhancement by operating on band-structured representations [12]. Our method stands out by assigning layer-wise bandwidths via principled resampling with anti-aliasing, addressing aliasing and irreversible spectral loss stemming from conventional downsampling.
A separate line of research explores diffusion and other generative models, exhibiting competitive quality and generalization in speech enhancement. Recent designs minimize sampling steps to improve practicality [10,16]; however, iterative reverse processes increase latency and implementation complexity. Conversely, our approach is discriminative and single-pass, focusing on front-end spectral integrity that can support both generative and non-generative backbones.
Research on waveform domain has also emphasized runtime efficiency and low latency. Foundational time-domain systems like Conv-TasNet established strong baselines for streaming separation [18], and subsequent designs (CleanUNet [9] and Hybrid Demucs [13]) improved the quality–efficiency trade-off via architectural and training innovations. Accordingly, our module is backbone-agnostic and parameter-neutral: it introduces a fixed, modest computational budget while delivering consistent gains in PESQ [25] and STOI [26], remaining compatible with resource-efficient systems.

3. Proposed Model Architecture

3.1. Design Principle and Overall Structure

We define the noisy mixture as y [ n ] = s [ n ] + d [ n ] , where s [ n ] and d [ n ] denote the clean target signal and additive noise, respectively. The network estimates s ^ n from y [ n ] , aiming to maximally match s [ n ] . For brevity, the time-sample index is omitted when the context is clear.
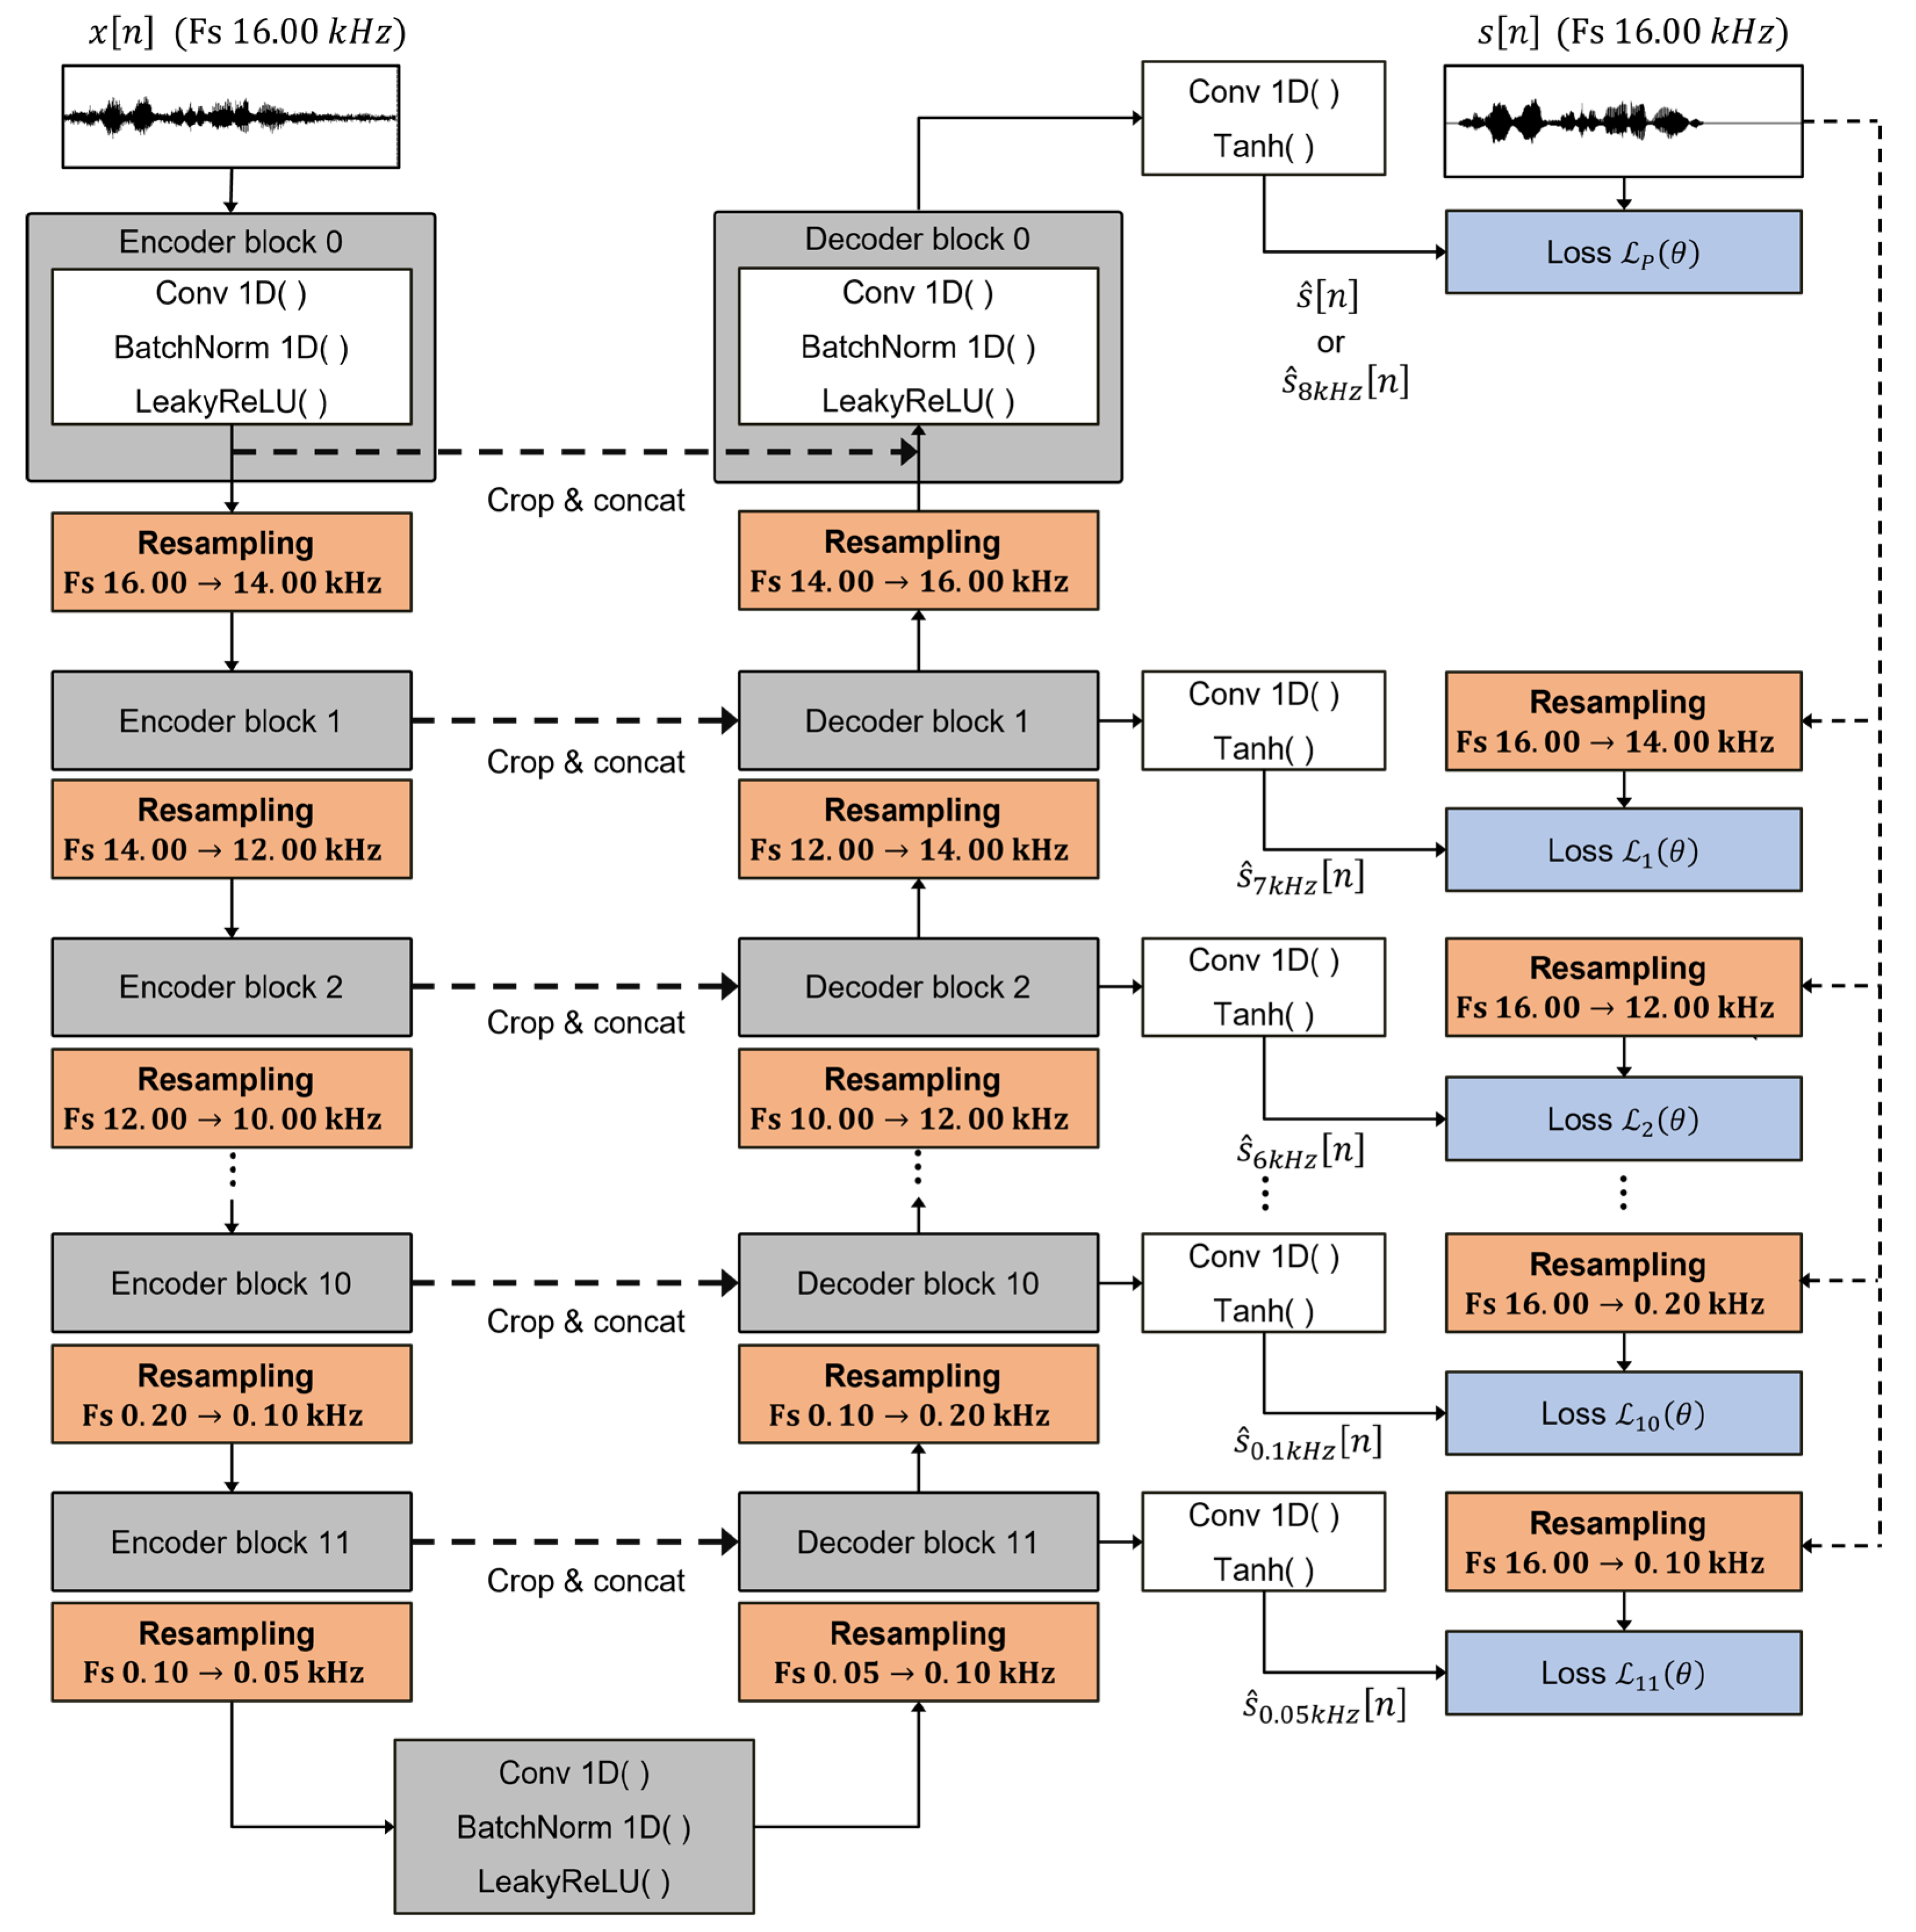
The proposed framework (Figure 2) constructs a frequency-aware hierarchy by explicitly controlling each layer’s passband. We achieve this by inserting a frequency-aware multi-rate resampling module (PR2) and applying a multi-band deep supervision strategy (PR3). The PR2 module applies principled anti-aliased decimation and anti-imaging interpolation, following the internal sampling-rate schedule detailed in Table 1. This minimizes aliasing-induced spectral distortion early, allowing subsequent modules to operate on cleaner representations. The PR3 stage then refines residual artifacts by emphasizing perceptually critical bands.
This architecture’s flow differs from conventional U-Nets. In the encoder path, the signal passes through an encoder block (Conv/BN/LeakyReLU) followed by PR2 resampling, which decimates the signal ([ConvBlock] [Resample] order). In the decoder path, the flow is reversed: the signal is first upsampled by PR2, then processed by the decoder block, which also receives the skip connection. PR3 taps compute auxiliary losses at intermediate stages. This sequential process provides explicit, layer-wise passband control. Figure 2 (accompanying note) details the specific hyperparameters, resampling configuration, and resulting feature lengths for reproducibility.

3.2. Multi-Rate Resampling Module

To precisely control the frequency band at each layer, we substitute the strided convolutions and their upsampling counterparts with a resampling module based on multi-rate signal processing techniques [20]. We investigate two variants of this module to experimentally validate the importance of principled anti-aliasing.
The first variant, PR1, functions as a controlled baseline designed to explicitly illustrate aliasing effects. It implements resampling by a rational factor I / D using a naive two-step process. First, the input signal x n (where n denotes the input sample index) is up-sampled by a factor of I to generate an intermediate signal ν m (where m is the intermediate index):
ν m = x m / I ,         if   m   is   a   multiple   of   I 0   ,         otherwise                    
Subsequently, the intermediate signal ν m is downsampled by a factor of D to generate the final output y k (where k represents the output index) by retaining only every D -th sample according to the expression:
y k = ν k · D .
Although this process attains the target frequency bands in Table 1, omitting a pre-decimation anti-aliasing low-pass filter is likely to cause substantial spectral aliasing [20].
Conversely, the second variant, PR2, mitigates these artifacts using a rigorously designed anti-aliasing filter. This module employs a windowed-sinc low-pass prototype to theoretically minimize aliasing, defined as:
h l = 2 f c s i n c 2 π f c l N 1 2 w l ,     0 l < N ,
where N , l , w l , and f c represent the filter length, index for the filter taps, a window function, and normalized cutoff relative to this resampling stage’s input rate, respectively. To suppress aliasing from decimation and imaging during interpolation, the cutoff is set to:
f c = 1 2   m a x ( I , D )
Interpolation, filtering, and decimation are integrated into a single operation to yield y k :
y k = l = 0 N 1 h l x I k D l
where x I denotes x n upsampled by a factor of I . Equation (5) is algebraically equivalent to upsampling, applying the filter h l , and then decimation by D .
Table 1 summarizes the layer-wise internal sampling rate and corresponding effective frequency bands for the conventional Wave-U-Net and our proposed design. The values are based on a 16-kHz input sampling rate and scale linearly for others. In the conventional model, the “internal rate” (Table 1) reflects the equivalent rate from stride-two downsampling in the encoder, with the effective band at each level being half that rate under ideal anti-aliasing [24]. This shows the progressive reduction of high-frequency content with depth.
In the proposed design, each level regulates its internal rate via explicit resampling with an anti-aliasing filter [20]. The internal rates are scheduled as 16.00, 14.00, 12.00, 10.00, 8.00, 6.00, 4.00, 2.00, 1.50, 1.00, 0.50, and 0.20 kHz. The corresponding effective bands are 8.00, 7.00, 6.00, 5.00, 4.00, 3.00, 2.00, 1.00, 0.75, 0.50, 0.25, and 0.10 kHz. This schedule preserves more mid- and high-frequency information in upper layers while progressively narrowing bandwidth near the bottleneck, where coarse low-frequency structure suffices.
Regarding the architecture’s depth, the diagram sometimes refers to “11 encoder and 11 decoder blocks” by excluding the input level. Our schedule comprises 12 levels, indexed 0–11 (Table 1), which aligns with both the internal sampling-rate plan and channel progression (24–288). This depth effectively balances the receptive field and band-allocation fidelity for 16-kHz inputs. Deeper or shallower variants could be used to target different trade-offs between computation and quality.

3.3. Multi-Band Deep Supervision

Although the PR2 module establishes a frequency-aware architecture, an effective training strategy is essential to preserve multi-scale representation fidelity. Consequently, we introduce a multi-band loss that applies deep supervision [27] at intermediate decoder stages. Rather than utilizing the Speech Intelligibility Index (SII) as a training metric, we leverage its band-importance guidance to select the supervised bands [28]. The resulting model, (PR3), combines the PR2 architecture with this targeted training strategy. The total PR3 training loss is a weighted combination of the primary and auxiliary losses:
L t o t a l = 1 α L p r i m a r y + α L a u x ,
where α 0 ,   1 governs the balance between the two loss terms and is set to 0.2 in our experiments; when auxiliary supervision is not applied, α is set to 0 . Here, we define the two loss components. The primary loss, L p r i m a r y , applied to the final output, is the negative scale-invariant signal-to-distortion ratio (SI-SDR) [29] applied to the final output:
L p r i m a r y = S I S D R ( s ^ , s ) .
The auxiliary loss, L a u x , is defined as a weighted sum of SI-SDR losses (denoted L j ) calculated at K 1 intermediate decoder outputs, providing targeted supervision:
L a u x = j = 1 K 1 λ j L j , 0 ,
where L j = S I S D R ( s ^ ( j ) , s ( j ) ) represents the negative SI-SDR computed at the j-th intermediate reconstruction. K denotes the total number of supervised decoder stages, including the final output. The choice of intermediate taps is task-specific and independent of the frequency schedule in Table 1. Guided by SII-based band importance [28], we prioritize bands centered at approximately 0.25, 0.50, 0.75, and 4.00 kHz by setting their corresponding λ j to 1.0 and 0 for all others.
The full-length estimated s ^ n and clean s [ n ] signals are represented as vectors s ^ and s , respectively. Subsequently, SI-SDR is defined with a small constant ε for numerical stability as:
S I S D R ( s ^ , s ) = 10 l o g 10 s t a r g e t 2 e r e s 2 + ε ,
with
s t a r g e t = s ^ , s s 2 s , e r e s = s ^ s t a r g e t ,
where s t a r g e t and e r e s represent the projection of the estimated signal onto the clean target vector and residual error orthogonal to the target, respectively.

3.4. Analysis of the Proposed Framework

Table 2 summarizes the computational complexity of the proposed framework, highlighting the trade-off between the computational investment and perceptual quality. Computational requirements are quantified using Giga Floating-point Operations (GFLOPs) and Real-Time Factor (RTF).
The proposed resampling module incurs a fixed computational cost of ~33 GFLOPs measured at 16 kHz (Table 2), representing a significant increase over the lightweight Wave-U-Net baseline. However, the absolute cost remains practical for most applications. The final RTF of 0.0142 is well below the real-time processing threshold (RTF < 1), which indicates throughput faster than real time on that setup. Because RTF measures throughput, not algorithmic latency, a fast non-causal system can still be unsuitable for low-latency streaming.
These perceptual improvements are achieved without increasing the model’s parameter count, offering a fixed computational increase that delivers substantial quality gains. This observation aligns with establishing upper-bound potential under a non-causal setting. Adapting the module to a computationally optimized causal design for low-latency applications is a key avenue for future research.

4. Experimental Setup

4.1. Experimental Design, Datasets, and Metrics

To provide a scientifically rigorous evaluation, we conducted a controlled ablation study using two baseline models. The first, the original Wave-U-Net [6], functioned as a testbed for isolating spectral aliasing. The second, an attention-enhanced Wave-U-Net with a shuffle attention module [30] at the bottleneck, assessed the proposed approach’s modularity and complementary benefits.
To test for complementarity, we included an attention block at the bottleneck to strengthen temporal context modeling [30]. Although this temporal module does not constitute the proposed study’s novelty, it serves as a representative temporal enhancement. The resulting models evaluated herein include the baseline Wave-U-Net, Model A (Baseline + Attention modules), Model B (Baseline + PR2/PR3 modules), and Model C (Attention + PR2/PR3 modules).
Experiments utilized clean speech from the TIMIT database [31] and noise from the NOISEX-92 database [32]. All audio was resampled to 16 kHz. The training set comprised 4620 clean speech utterances from the TIMIT-TRAIN partition. The validation set was created by holding out 10% of these training utterances at the speaker level to prevent speaker overlap. The test set used speakers from the standard TIMIT-TEST partition, ensuring all test speakers were disjoint from those in the training and validation sets.
Training mixtures were constructed dynamically. For each clean utterance, we randomly selected one of the six noise types (babble, f16, factory, pink, Volvo, and white) from NOISEX-92. We also selected a signal-to-noise ratio (SNR) uniformly from the set {−10, −5, 0, 5, 10, 15} dB. Given a clean signal s [ n ] and a randomly cropped noise segment d [ n ] , the noise was scaled to the target SNR via RMS energy matching to produce the mixture: y [ n ] = s [ n ] + γ d [ n ] , where γ = n s [ n ] 2 n d [ n ] 2 · 10 S N R / 10 . Validation and test mixtures were achieved via the same procedure with their respective data splits. This process ensures a balanced range of difficulty, with a uniform SNR histogram and equal probability for all six noise categories.
Performance was rigorously evaluated using two standard objective metrics: PESQ [25] and STOI [26]. PESQ, following the ITU-T P.862 standard, correlates with perceived speech quality. For 16-kHz narrow-band signals, these scores typically span from approximately 1 to 4.5. STOI estimates intelligibility on a scale of 0–1, where values closer to 1 indicate better intelligibility. Here, we report “improvement” relative to the unprocessed noisy signal; otherwise, we report absolute scores. We specify in each figure and table caption whether the values are absolute or relative and the SNR ranges over which the aggregation is performed.

4.2. Implementation Details

Our implementation adopts the Wave-U-Net backbone architecture (Figure 2). Figure 2 (accompanying note) presents the specific architectural hyperparameters, including kernel sizes, channel counts, activation functions, and the precise resampling configuration (window function, filter width, and rolloff) for clarity and reproducibility. Optimization employs Adam with a fixed learning rate. Table 3 summarizes other key training hyperparameters not included in the core architecture.
All experiments were run on three NVIDIA A40 GPUs in a multi-GPU configuration. However, the RTF measurement context (Table 2) was conducted on a single GPU. We report the operating system, software stack versions, hardware, and controls for randomness and determinism. Unless otherwise noted, all training and evaluation adopted FP32 precision. The employed operating system and language runtime were Ubuntu 22.04 LTS and Python 3.10.12, respectively. Our deep learning stack comprised PyTorch 2.7.1 with CUDA 12.6. We utilized three NVIDIA A40 GPUs (48-GB memory each) for all multi-GPU training and inference. For randomness and determinism, we set a global seed of 1337, set torch.backends.cudnn.benchmark to False, and enabled deterministic algorithms via torch.use_deterministic_algorithms. For data loading, we used eight workers with persistent workers and pin memory enabled. The precision was FP32, with Automatic Mixed Precision disabled. Our RTF protocol utilized a batch size of 1, an input length of 1.024 s, and was averaged over 100 trials on a single GPU.

5. Results and Discussion

We evaluated three training losses, including mean squared error (MSE), weighted SDR (wSDR) [29], and SI-SDR [29], to determine the criterion for all experiments. Using the baseline Wave-U-Net, we trained models with each loss function and averaged results across all test conditions. With an average PESQ of 2.12, SI-SDR yielded the highest perceptual quality, outperforming wSDR (2.09) and MSE (2.03). Therefore, SI-SDR was adopted for all subsequent experiments.

5.1. Performance Analysis of Proposed Methods

5.1.1. Effect of Principled Resampling with Anti-Aliasing

To contextualize performance gains, we first evaluated the absolute quality of the unprocessed noisy signals. On average, these signals achieved STOI and PESQ values of 0.749 and 1.467, respectively, with PESQ varying across noise types from 1.266 (white noise) to 1.938 (Volvo noise). Although this variability in intelligibility and quality establishes a challenging baseline, the standard Wave-U-Net achieved a substantial initial enhancement, averaging 0.882 and 2.25 in STOI and PESQ, respectively.
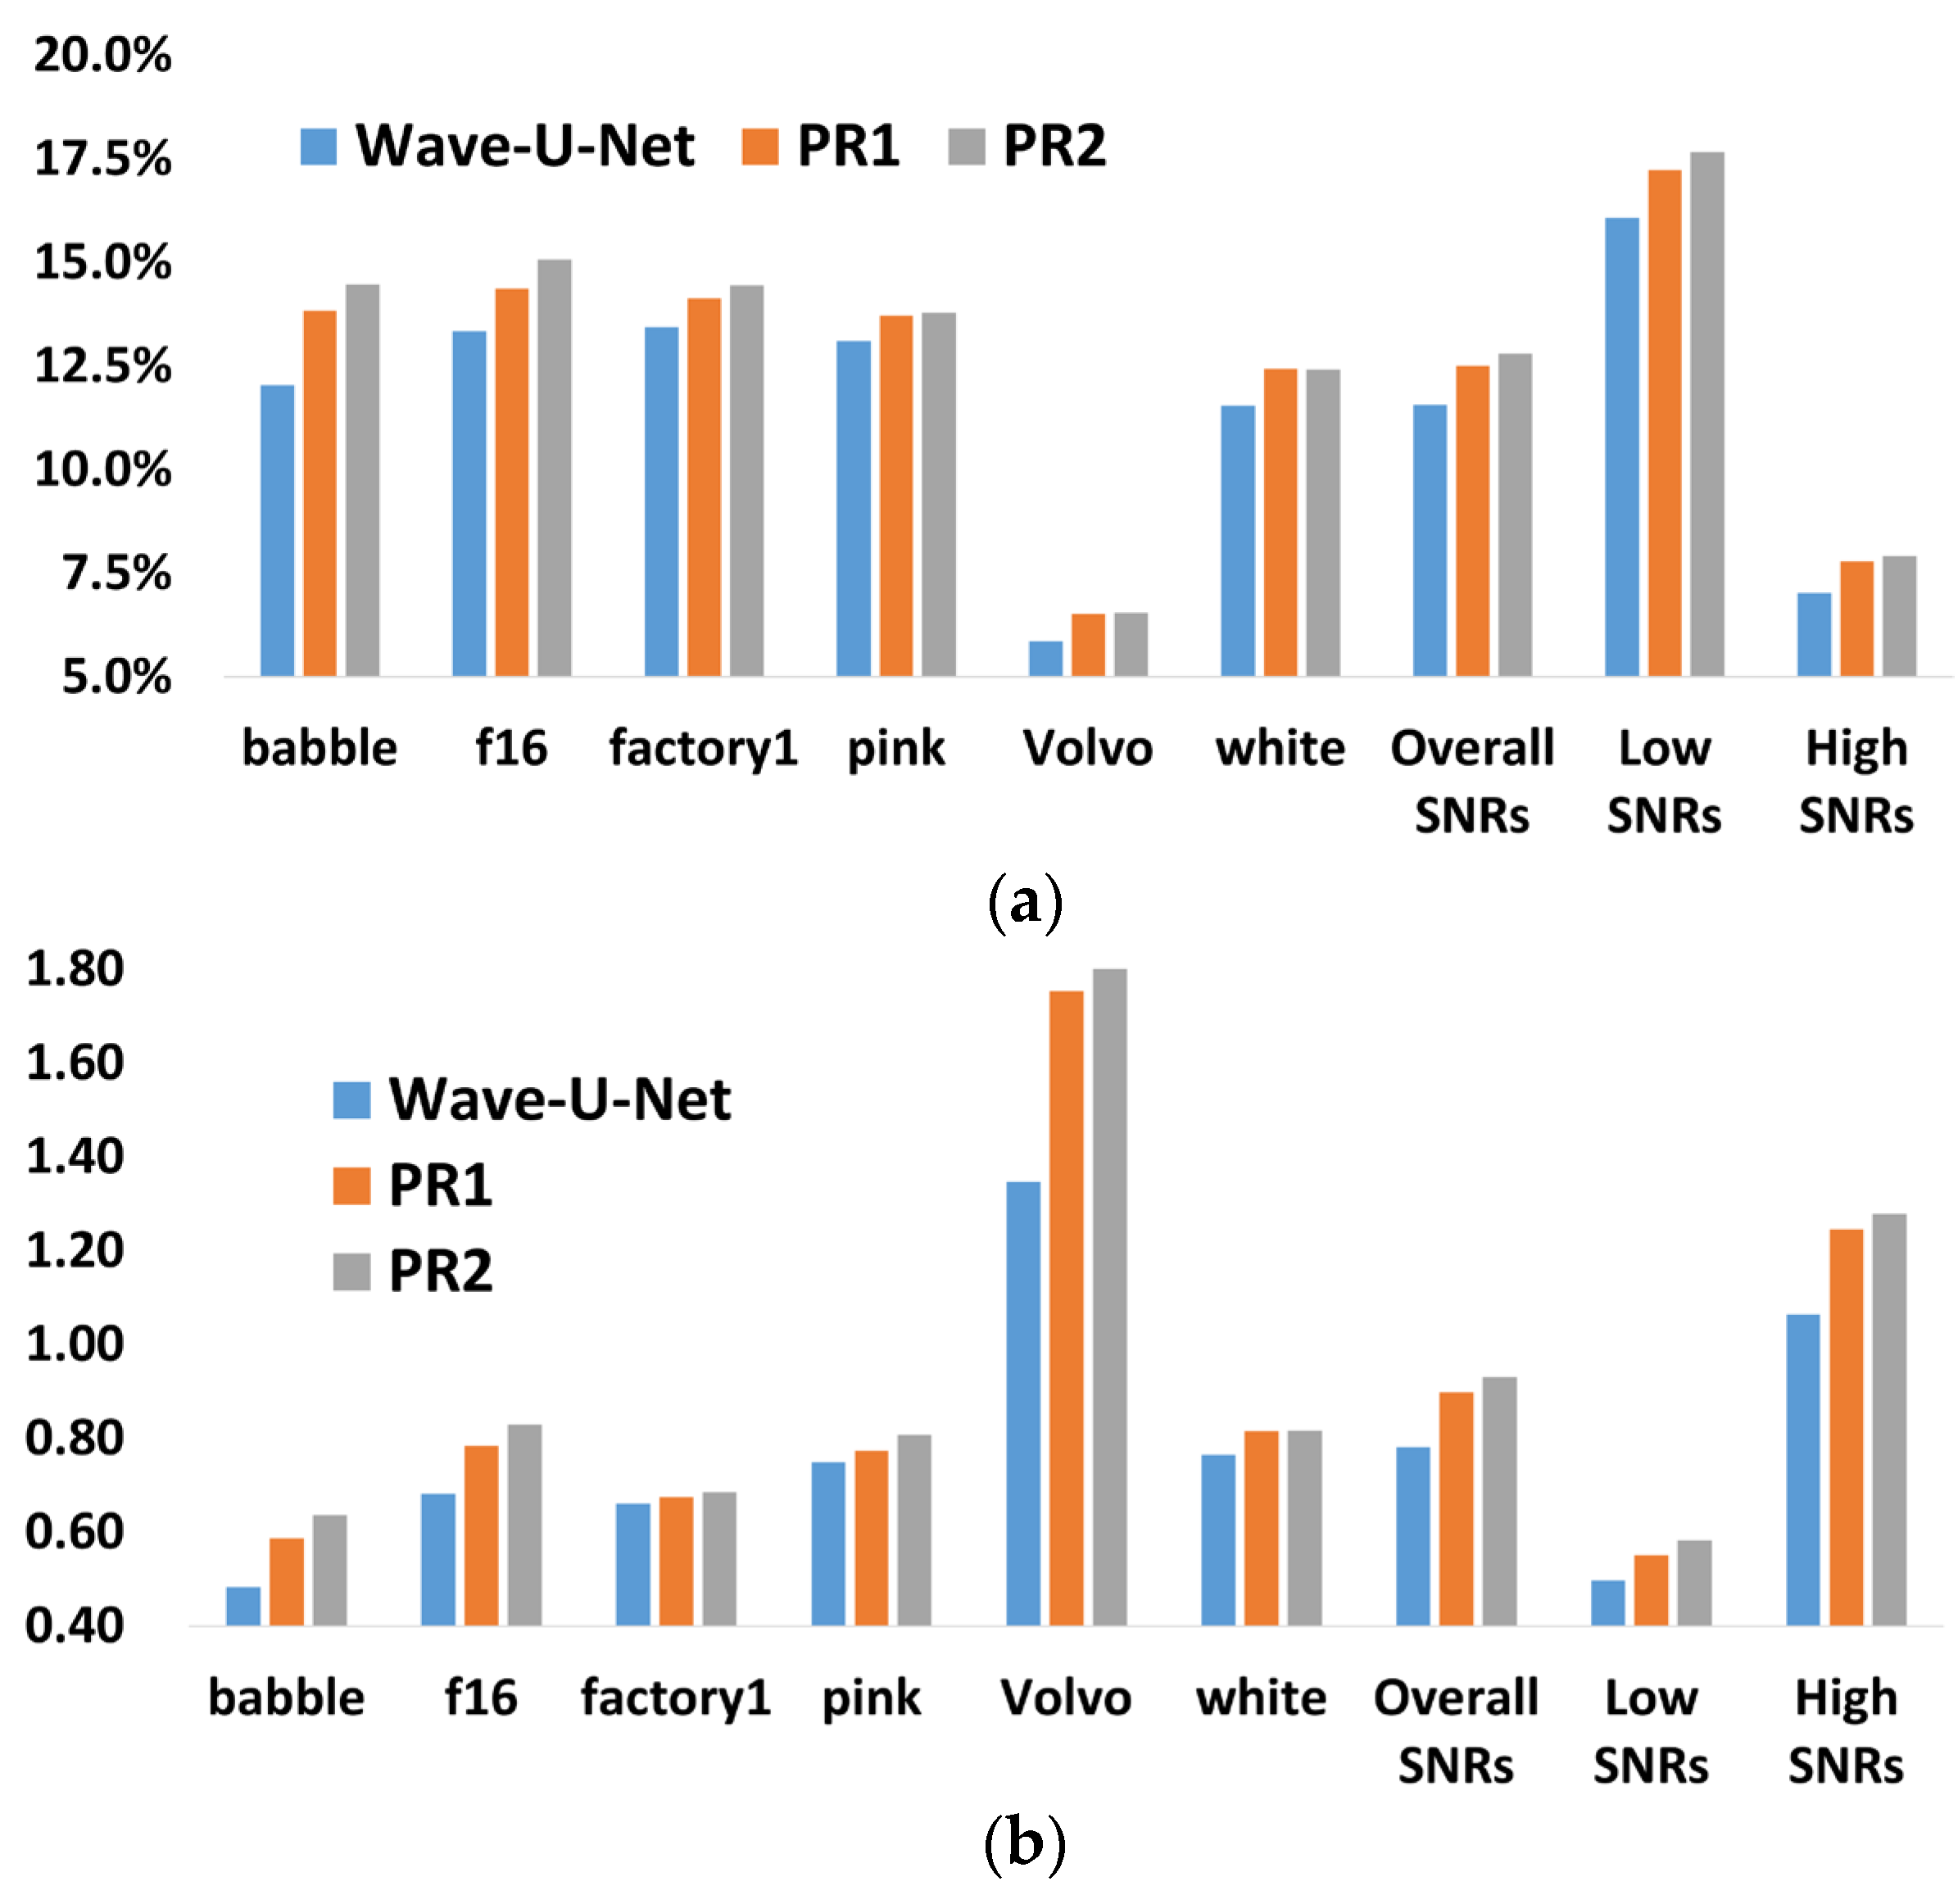
Figure 3 illustrates each model’s enhancement relative to the original noisy signal. The labels “Low SNRs” and “High SNRs” correspond to −10–0 dB and 5–15 dB, respectively. The baseline (Wave-U-Net) achieves a significant gain; however, PR1 and PR2 outperform it across all conditions, with the most significant advantage observed at “Low SNRs,” demonstrating superior robustness against heavy noise. PR1, employing naive resampling, already outperforms the baseline Wave-U-Net, highlighting the crucial role of effective frequency bands in denoising.
PR2, which employs sinc interpolation-based resampling, outperforms the other two models. Its consistent gains reflect the effectiveness of an anti-aliasing filter in mitigating the aliasing effects that limit PR1, thus confirming that principled anti-aliasing enhances time-domain feature fidelity and reduces spectral distortion.
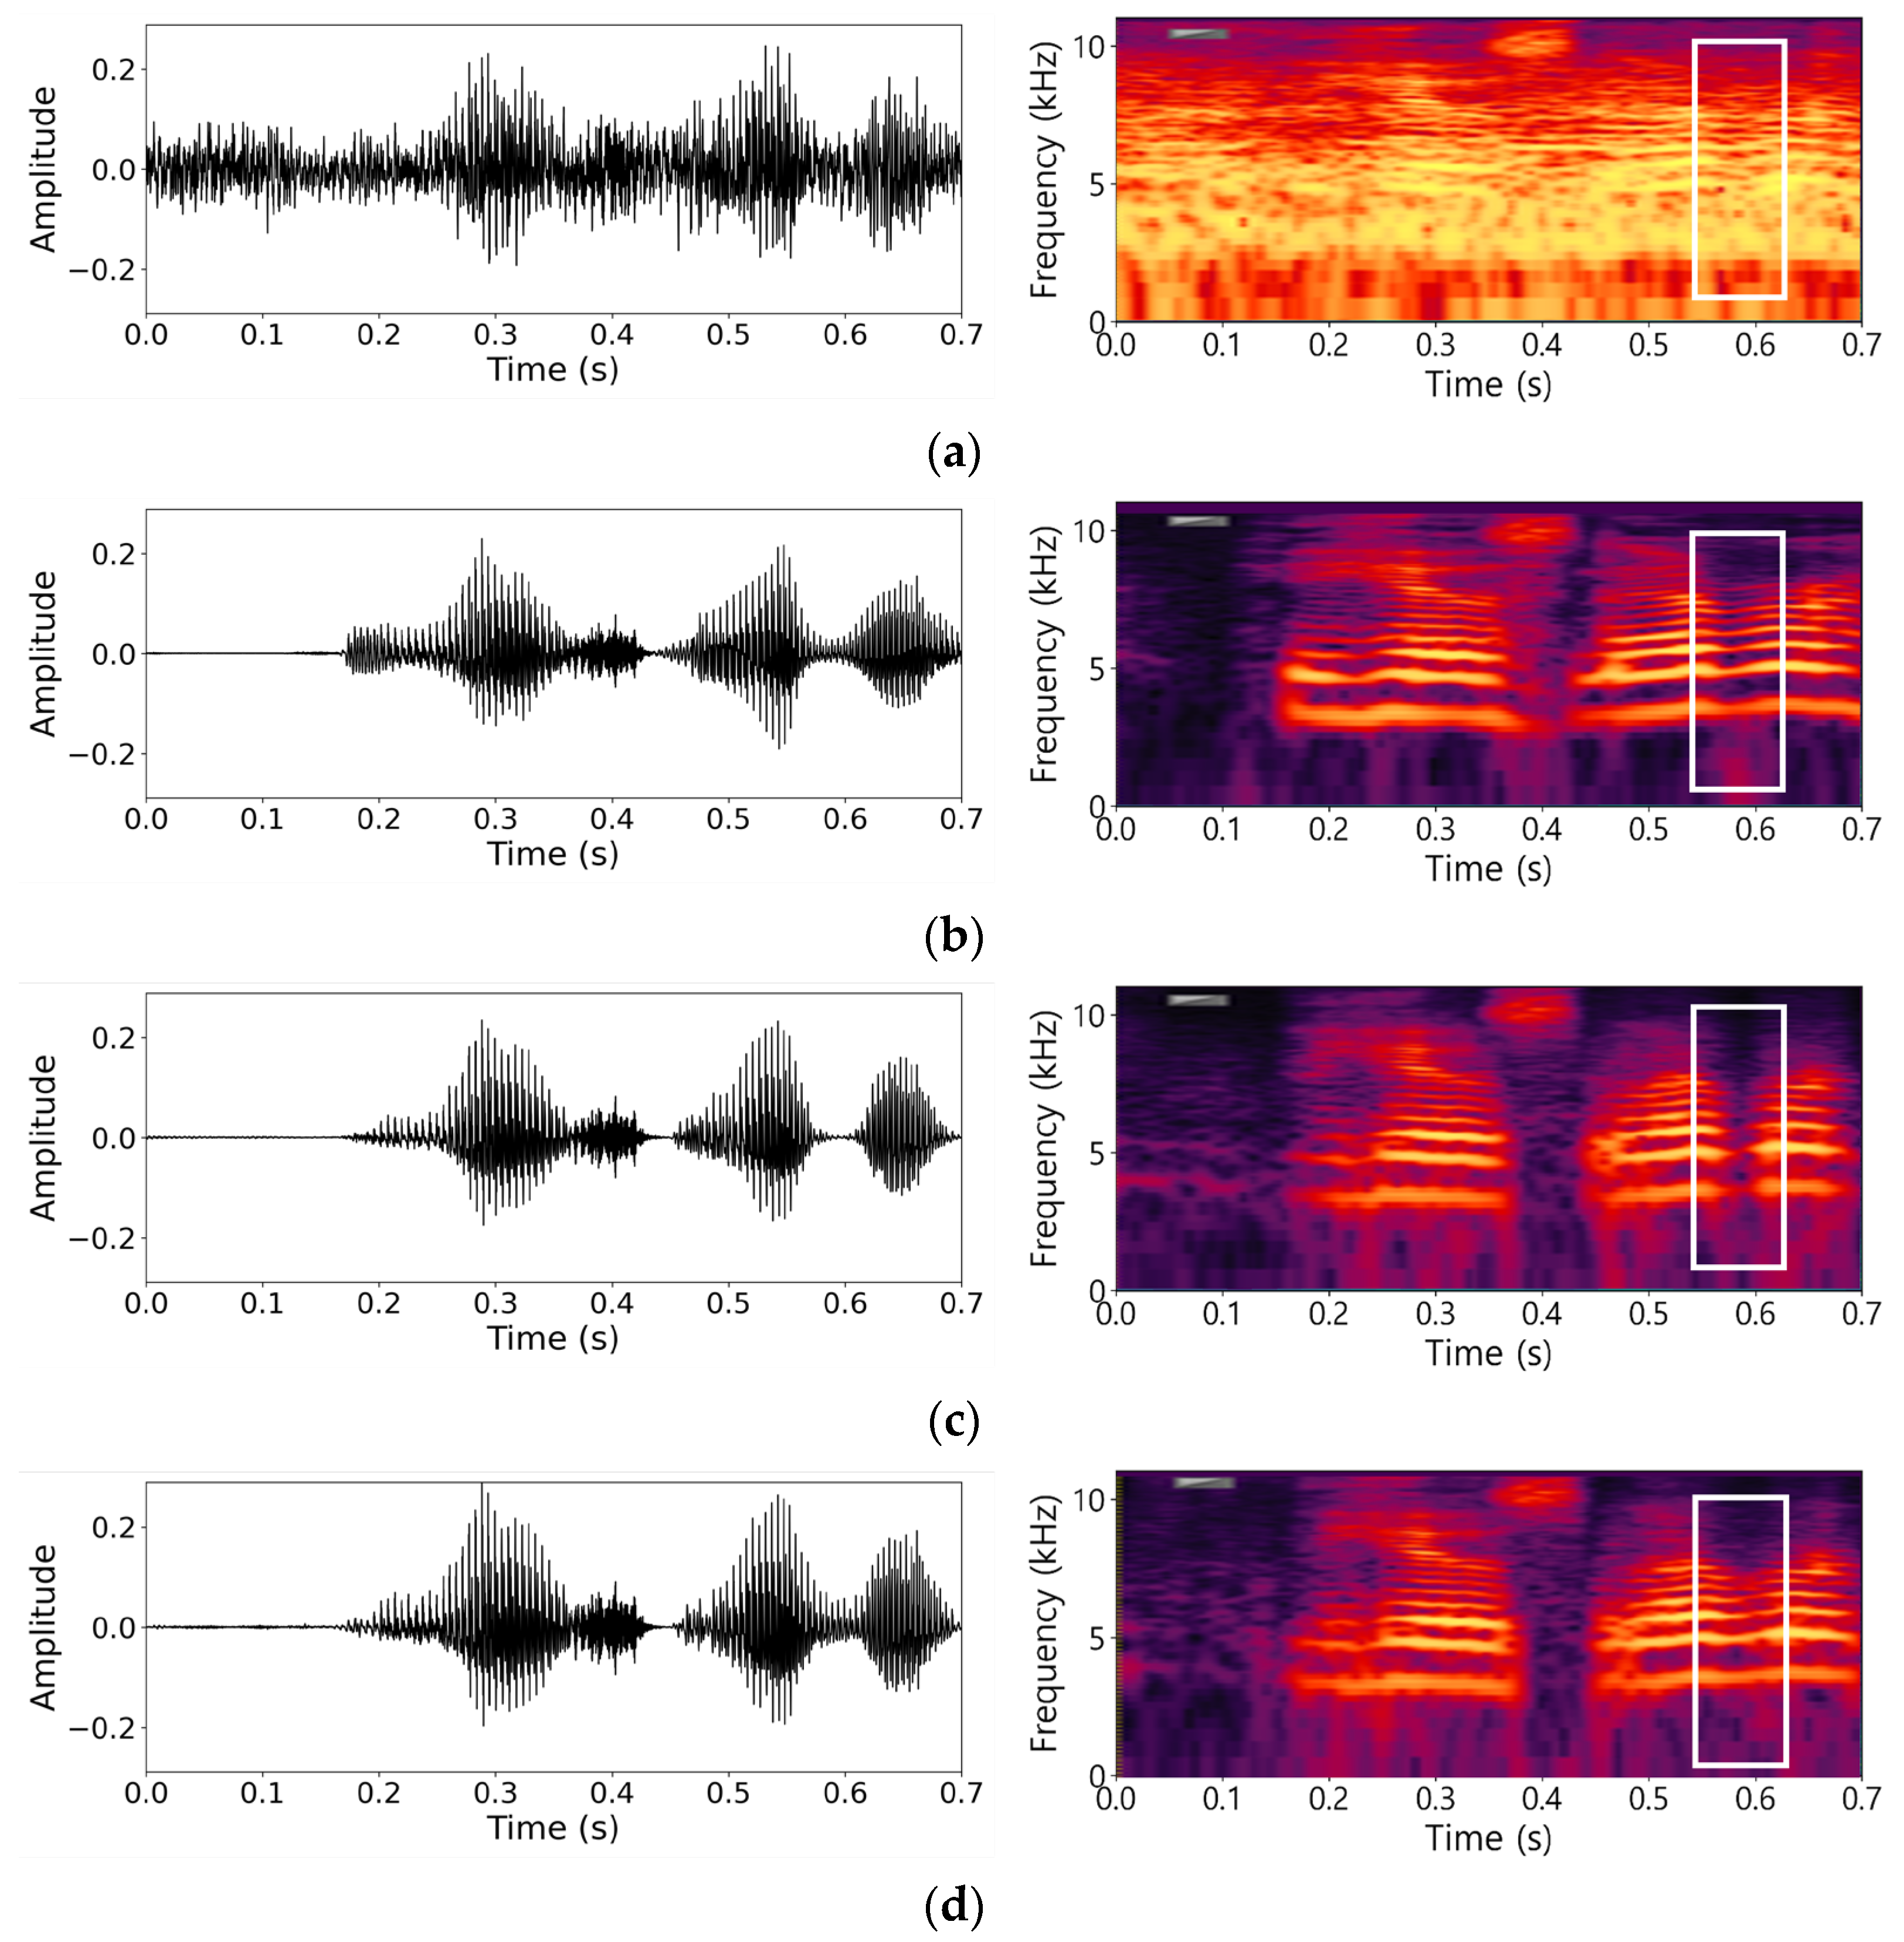
Figure 4 provides a qualitative comparison of denoising performance for 0-dB babble noise, presenting log-magnitude spectrograms. The figure illustrates the noisy input (a), clean target (b), conventional Wave-U-Net output (c), and proposed PR2 output (d). A close inspection reveals the superiority of our approach in two key areas.
First, the harmonic structure appears as distinct horizontal lines in the clean target (b). The proposed PR2 output (d) preserves this structure with significant clarity, closely resembling the clean target. Conversely, the baseline output (c) exhibits considerable spectral distortion in the form of smearing artifacts between these harmonics, indicating a loss of spectral fidelity. The proposed PR2 output significantly suppresses this distortion, presenting a cleaner representation.
This visual evidence demonstrates that the proposed principled anti-aliasing approach effectively prevents spectral folding and distortion. This enhanced spectral integrity directly correlates with higher perceived quality (improved PESQ scores) and clearer speech representation (improved STOI scores).
Furthermore, a comparative analysis of the time-domain plots (Figure 4, left column) supports this finding. Both the Baseline Wave-U-Net (c) and PR2 (d) outputs effectively suppress gross noise; however, the Baseline (c) retains structural distortion, which forms residual artifacts. In contrast, the PR2 module demonstrates reduced distortion of the original speech components. This is evident as the PR2 output (d) more closely tracks the overall shape of the clean target’s amplitude envelope (b) compared to the Baseline Wave-U-Net (c), thus validating our design’s focus on signal integrity.

5.1.2. Effect of Multi-Band Deep Supervision

Having established the importance of principled resampling with PR2, we evaluate the additional impact of the PR3 multi-band deep supervision strategy. Guided by SII-based band importance [28], the auxiliary loss is computed over four perceptually salient bands centered at 4.00, 0.75, 0.50, and 0.25 kHz. Concretely, we supervise the decoder outputs whose effective passbands most closely cover these centers; under the current schedule in Table 1, this corresponds to levels 4, 8, 9, and 10, respectively. The band weights are set to λ j = 1.0 for these taps and 0 otherwise, and we set the mixing coefficient in Equation (6) to α = 0.2 .
Table 4 and Table 5 compare the multi-band loss-based approach (PR3) with the single- loss approach (PR2), presenting absolute scores across low SNR conditions (−10–0 dB; main values) and high SNR conditions (5–15 dB; value in parentheses). A detailed analysis reveals that PR3 impacts STOI minimally, indicating that the multi-band loss did not improve intelligibility within our setup. Conversely, PR3 consistently improves PESQ across most conditions, suggesting that it primarily impacts perceived audio quality.
PR3 yields greater PESQ improvements, particularly under the high SNR conditions (values in parentheses) across several noise types, including factory, pink, and white. This pattern indicates that the multi-band loss functions as a fine-tuner, refining the model’s output, to suppress residual artifacts in perceptually critical frequency bands once the primary signal structure is restored.
An exception is the slight PESQ degradation for the stationary Volvo noise at the low SNR condition. Unlike broadband stationary noise like white noise, Volvo noise concentrates energy in persistent harmonic components within the low-to-mid frequency regions. At low SNR values, noise harmonics overlap with the frequency bands emphasized by the auxiliary loss, potentially causing the model to retain noise as speech and slightly degrade perceived quality. This effect is absent at high SNRs, where the speech dominates and minimizes such ambiguity.

5.2. Further Analysis and Robustness

To demonstrate that the frequency-aware framework represents a generalizable principle and not a solution confined to a specific architecture or dataset, we conducted three additional experiments evaluating its modularity, robustness, and comparative performance.
First, we validated modularity and potential synergy (Table 6). This test compares three models: Model A (Baseline + Attention), Model B (Baseline + our PR3 module), and Model C (Baseline + Attention + PR3). The findings indicate that Model A’s temporal enhancement and Model B’s frequency enhancement both surpass the original baseline, validating their effectiveness. Model B preserves speech intelligibility similar to the attention-enhanced baseline while achieving superior perceptual quality, underscoring the importance of spectral fidelity. Crucially, Model C, which integrates the proposed module with the attention-enhanced Wave-U-Net, outperforms Model A across both metrics. This reflects the complementary functions of the two modules: the frequency-aware module mitigates spectral distortions and the attention module subsequently captures temporal dependencies more accurately on this refined representation. This result highlights the core trade-off between computational investment and perceptual quality. For instance, under equal parameters, the proposed PR3 module (Model B) improves PESQ by +0.40 over the baseline (Table 6) at a fixed compute increase (Table 2). This quantifies a favorable trade-off, as the model remains real-time on our GPU (RTF = 0.0142) while achieving significant perceptual gains.
Second, after verifying architectural robustness, we investigated robustness against unseen acoustic environments. To evaluate generalization beyond NOISEX-92, we conducted a snapshot test on two non-stationary noise types from the Deep Noise Suppression Challenge dataset [33], without any retraining. The absolute scores decline under these more challenging noises (Table 7); however, Model B consistently outperforms the original baseline. These results indicate that the frequency-aware optimization leverages a generalizable denoising principle, resisting overfitting to the training noises and maintaining robustness in realistic acoustic scenarios.
Third, for an exhaustive comparison with same-type methods, we expanded our evaluation to include two representative waveform-based models: CleanUNet [9] and Conv-TasNet [18]. We trained and tested these models under the same conditions as our own. Table 8 summarizes the performance measured by the improvement in STOI (STOI) and PESQ (PESQ) over the noisy input.
Table 8 reveals two key findings. First, the internal ablation (Baseline vs. PR3) confirms our module’s innovation. By adding only our frequency-aware module and multi-band supervision, the PESQ improves significantly from 0.78 to 0.97, while maintaining the same parameter count as the baseline Wave-U-Net.
Second, the external comparison indicates that our final model (PR3) performs favorably against both representative “same-type” models. However, this comparison must be understood in the context of the models’ design objectives, particularly causality. The proposed framework, built on the non-causal Wave-U-Net [6], is optimized for high-fidelity offline processing, enabling it to maximize the entire signal context. In contrast, both CleanUNet and Conv-TasNet are causal models, specifically designed for low-latency, real-time streaming operations. This constrains them to utilizing only past information. Therefore, our non-causal model’s superior performance (0.97 PESQ) over CleanUNet (0.92) and Conv-TasNet (0.73) is expected, as it leverages the full signal context. This comparison validates that our modular, non-causal approach is highly effective for high-fidelity tasks, and it clearly demonstrates that this performance gain stems from our novel frequency-aware design.
Finally, linking innovation to design decisions, the observed gains in both Table 6 and Table 8 align with the design in Table 1. By explicitly scheduling internal sampling rates and enforcing pre-decimation low-pass and post-interpolation anti-imaging filters, the PR2 and PR3 models preserve mid and high-frequency cues that are otherwise lost or aliased under standard strided sampling. Subsequently, multi-band supervision in PR3 targets residual artifacts in perceptually weighted bands, elucidating the additional PESQ gains (Table 4 and Table 5) without increasing parameters (Table 2).

6. Conclusions

This study addressed the spectral information loss inherent in waveform-based speech enhancement caused by standard downsampling methods. Our main contribution is a validated, modular approach for spectral optimization, which integrates a principled resampling module with a multi-band deep supervision strategy.
Evaluations on the standard Wave-U-Net and its attention-enhanced version demonstrate the proposed framework’s key advantages. First, the frequency-aware approach achieves performance comparable to models that exclusively target temporal patterns by reducing signal distortion directly. Second, it functions as a versatile, complementary module that enhances performance when integrated with attention-based models. Tests on novel noise types verify robust generalization, achieved with a modest and practical computational overhead, highlighting a favorable performance–efficiency trade-off.
These findings establish frequency-aware design as a fundamental component for future E2E models alongside temporal modeling. In addition, its modularity allows integration with advanced architectures. A crucial next step is adapting the resampling module to a causal configuration for real-time applications like online communication and hearing aids.

Funding

This research was supported by the National Research Foundation of Korea (NRF) grant funded by the Korean government (MSIT) (NRF-2022R1A2C2010614).

Data Availability Statement

The original contributions presented in this study are included in the article. Further inquiries can be directed to the corresponding author.

Conflicts of Interest

The author declares no conflict of interest.

References

  1. Boll, S.F. Suppression of Acoustic Noise in Speech Using Spectral Subtraction. IEEE Trans. Acoust. Speech Signal Process. 1979, 27, 113–120. [Google Scholar] [CrossRef]
  2. Scalart, P.; Vieira, J. Speech Enhancement Based on a Priori SNR Estimation. In Proceedings of the International Conference on Acoustics, Speech, and Signal Processing (ICASSP), Atlanta, GA, USA, 9 May 1996; pp. 629–632. [Google Scholar]
  3. Ephraim, Y.; Malah, D. Speech Enhancement Using a Minimum Mean-Square Error Short-Time Spectral Amplitude Estimator. IEEE Trans. Acoust. Speech Signal Process. 1984, 32, 1109–1121. [Google Scholar] [CrossRef]
  4. Wang, D.; Chen, J. Supervised Speech Separation Based on Deep Learning: An Overview. IEEE/ACM Trans. Audio Speech Lang. Process. 2018, 26, 1702–1726. [Google Scholar] [CrossRef] [PubMed]
  5. Choi, H.S.; Kim, J.H.; Huh, J.; Kim, A.; Ha, J.W.; Lee, K. Phase-Aware Speech Enhancement with Deep Complex U-Net. In Proceedings of the ICLR 2019, New Orleans, LA, USA, 6–9 May 2019; pp. 1–20. [Google Scholar]
  6. Stoller, D.; Ewert, S.; Dixon, S. Wave-U-Net: A Multiscale Neural Network for End-to-End Audio Source Separation. arXiv 2018, arXiv:1806.03185. [Google Scholar]
  7. Macartney, C.; Weyde, T. Improved Speech Enhancement with the Wave-U-Net. arXiv 2018, arXiv:1811.11307. [Google Scholar] [CrossRef]
  8. Défossez, A.; Synnaeve, G.; Adi, Y. Real-Time Speech Enhancement in the Waveform Domain. In Proceedings of the Interspeech 2020, Shanghai, China, 25–29 October 2020; pp. 3291–3295. [Google Scholar]
  9. Kong, Z.; Ping, W.; Dantrey, A.; Catanzaro, B. Speech Denoising in the Waveform Domain with Self-Attention. arXiv 2022, arXiv:2202.07790. [Google Scholar] [CrossRef]
  10. Lu, Y.J.; Wang, Z.Q.; Watanabe, S.; Richard, A.; Yu, C.; Tsao, Y. Conditional Diffusion Probabilistic Model for Speech Enhancement. In Proceedings of the ICASSP 2022, Singapore, 23–27 May 2022; pp. 7402–7406. [Google Scholar]
  11. Wang, Z.Q.; Cornell, S.; Choi, S.; Lee, Y.; Kim, B.-Y.; Watanabe, S. TF-GridNet: Integrating Full- and Sub-Band Modeling for Speech Separation. arXiv 2022, arXiv:2211.12433. [Google Scholar] [CrossRef]
  12. Yu, J.; Chen, H.; Luo, Y.; Gu, R.; Weng, C. High Fidelity Speech Enhancement with Band-split RNN. In Proceedings of the Interspeech 2023, Dublin, Ireland, 20–24 August 2023. [Google Scholar]
  13. Défossez, A. Hybrid Spectrogram and Waveform Source Separation. arXiv 2021, arXiv:2111.03600. [Google Scholar]
  14. Schröter, H.; Escalante-B, A.N.; Rosenkranz, T.; Maier, A. DeepFilterNet: A Low-Complexity Speech Enhancement Framework for Full-Band Audio Based on Deep Filtering. In Proceedings of the ICASSP 2022, Singapore, 22–27 May 2022; pp. 7492–7496. [Google Scholar]
  15. Dubey, H.; Aazami, A.; Gopal, V.; Naderi, B.; Braun, S.; Cutler, R.; Ju, A.; Zohourian, M.; Tang, M.; Gamper, H.; et al. ICASSP 2023 Deep Noise Suppression Challenge. IEEE Open J. Signal Process 2024, 5, 725–737. [Google Scholar] [CrossRef]
  16. Gonzalez, P.; Tan, Z.; Østergaard, J.; Jensen, J.; Alstrøm, T.S.; May, T. Investigating the Design Space of Diffusion Models for Speech Enhancement. IEEE/ACM Trans. Audio Speech Lang. Process 2024, 32, 4486–4500. [Google Scholar] [CrossRef]
  17. Schröter, H.; Rosenkranz, T.; Escalante-B, A.N.; Maier, A. DeepFilterNet: Perceptually Motivated Real-Time Speech Enhancement. arXiv 2023, arXiv:2305.08227. [Google Scholar]
  18. Luo, Y.; Mesgarani, N. Conv-TasNet: Surpassing Ideal Time–Frequency Magnitude Masking for Speech Separation. IEEE/ACM Trans. Audio Speech Lang. Process. 2019, 27, 1256–1266. [Google Scholar] [CrossRef] [PubMed]
  19. Ronneberger, O.; Fischer, P.; Brox, T. U-Net: Convolutional Networks for Biomedical Image Segmentation. In Proceedings of the MICCAI 2015, Munich, Germany, 5–9 October 2015; pp. 234–241. [Google Scholar]
  20. Crochiere, R.E.; Rabiner, L.R. Multirate Digital Signal Processing; Prentice-Hall: Englewood Cliffs, NJ, USA, 1983. [Google Scholar]
  21. Hao, X.; Su, X.; Horaud, R.; Li, X. FullSubNet: A Full-Band and Sub-Band Fusion Model for Real-Time Single-Channel Speech Enhancement. In Proceedings of the ICASSP 2021, Toronto, ON, Canada, 6–11 June 2021; pp. 6633–6637. [Google Scholar]
  22. Chen, J.; Rao, W.; Wang, Z.; Wu, Z.; Wang, Y.; Yu, T.; Shang, S.; Meng, H. Speech Enhancement with Fullband-Subband Cross-Attention Network. In Proceedings of the Interspeech 2022, Incheon, Republic of Korea, 18–22 September 2022; pp. 976–980. [Google Scholar]
  23. Westhausen, N.L.; Meyer, B.T. Dual-Signal Transformation LSTM Network for Real-Time Noise Suppression. In Proceedings of the Interspeech 2020, Shanghai, China, 25–29 October 2020; pp. 2477–2481. [Google Scholar]
  24. Shannon, C.E. Communication in the Presence of Noise. Proc. IRE 1949, 37, 10–21. [Google Scholar] [CrossRef]
  25. ITU-T Rec. P.862; Perceptual Evaluation of Speech Quality (PESQ), An Objective Method for End-to-End Speech Quality Assessment of Narrowband Telephone Networks and Speech Codecs. International Telecommunication Union–Telecommunication Standardization Sector: Geneva, Switzerland, 2001.
  26. Taal, C.H.; Hendriks, R.C.; Heusdens, R.; Jensen, J. A Short-Time Objective Intelligibility Measure for Time–Frequency Weighted Noisy Speech. In Proceedings of the ICASSP 2010, Dallas, TX, USA, 14–19 March 2010; pp. 4214–4217. [Google Scholar]
  27. Lee, C.Y.; Xie, S.; Gallagher, P.; Zhang, Z.; Tu, Z. Deeply-Supervised Nets. In Proceedings of the Eighteenth International Conference on Artificial Intelligence and Statistics, San Diego, CA, USA, 9–12 May 2015; pp. 562–570. [Google Scholar]
  28. ANSI S3.5-1997; Methods for Calculation of the Speech Intelligibility Index. ANSI: New York, NY, USA, 1997.
  29. Roux, J.L.; Wisdom, S.; Erdogan, H.; Hershey, J.R. SDR—Half-Baked or Well Done? In Proceedings of the ICASSP 2019, Brighton, UK, 12–17 May 2019; pp. 626–630. [Google Scholar]
  30. Zhang, Q.L.; Yang, Y.B. SA-Net: Shuffle Attention for Deep Convolutional Neural Networks. In Proceedings of the ICASSP 2021, Toronto, ON, Canada, 6–11 June 2021; pp. 2235–2239. [Google Scholar]
  31. Garofolo, J.S.; Lamel, L.F.; Fisher, W.M.; Fiscus, J.G.; Pallett, D.S.; Dahlgren, N.L.; Zue, V. DARPA TIMIT Acoustic-Phonetic Continuous Speech Corpus CD-ROM. NIST Speech Disc 1–1.1; NIST: Gaithersburg, MD, USA, 1993. [Google Scholar]
  32. Varga, A.; Steeneken, H.J.M. Assessment for Automatic Speech Recognition: II. NOISEX-92: A Database and an Experiment to Study the Effect of Additive Noise on Speech Recognition Systems. Speech Commun. 1993, 12, 247–251. [Google Scholar] [CrossRef]
  33. Reddy, C.K.A.; Gopal, V.; Cutler, R.; Beyrami, E.; Cheng, R.; Dubey, H.; Matusevych, S.; Aichner, R.; Aazami, A.; Braun, S.; et al. The Interspeech 2020 Deep Noise Suppression Challenge: Datasets, Subjective Testing Framework, and Challenge Results. In Proceedings of the Interspeech 2020, Shanghai, China, 25–29 October 2020; pp. 2492–2496. [Google Scholar]
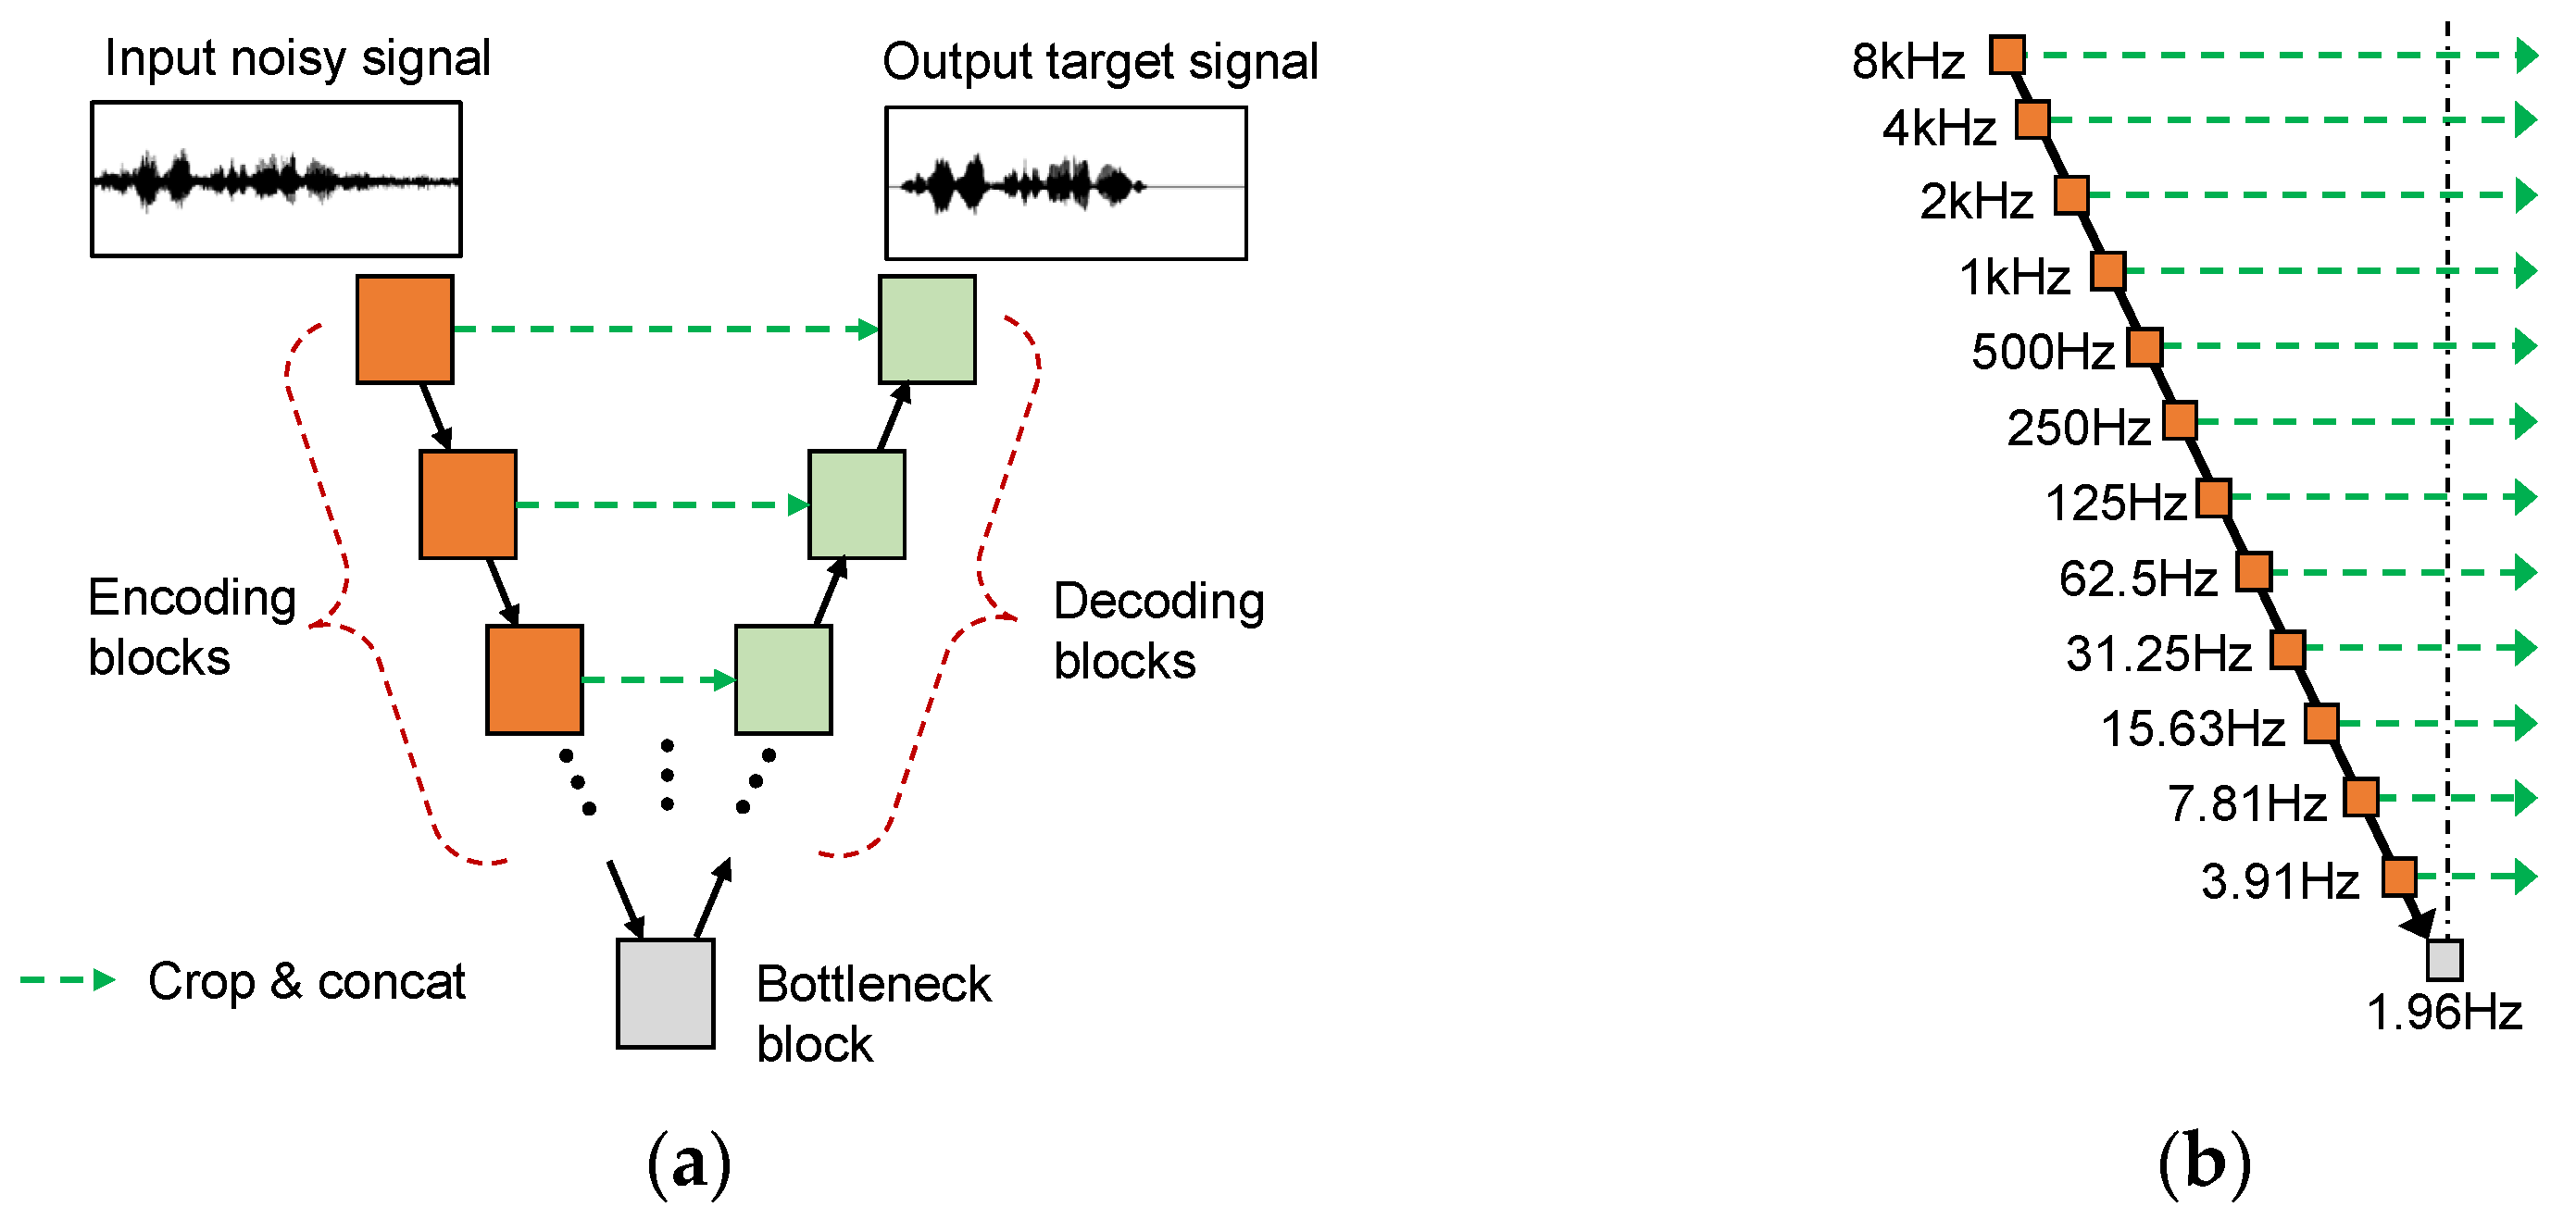
Figure 1. Conceptual illustration of standard Wave-U-Net architecture, highlighting the associated spectral information loss problem. (a) Encoder–decoder architecture with skip connections. (b) Progressive reduction of the effective frequency band at each encoder downsampling stage that causes high-frequency information loss.
Electronics 14 04523 g001
Figure 2. Block diagram of the proposed frequency-aware Wave-U-Net incorporating principled multi-rate resampling (PR2) and multi-band deep supervision (PR3). Section 3.1 provides detailed sequential walkthrough. Note: For reproducibility, key hyperparameters include encoder kernel size 15, decoder kernel size 5, channels 24–288, and LeakyReLU slope 0.1. Resampling utilizes sinc interpolation (Hann window, width: 6, rolloff: 0.99) with the standard cutoff f c =   1 2   m a x ( I , D ) . For a 16,384-sample input, approximate per-level feature lengths are 16,384, 14,336, 12,288, 10,240, 8192, 6144, 4096, 2048, 1536, 1024, 512, and 256 samples.
Electronics 14 04523 g002
Figure 3. Enhancement performance compared to unprocessed noisy input, showing (a) STOI and (b) PESQ score improvements (STOI, PESQ) for the baseline (Wave-U-Net), PR1, and PR2 variants across different noise types.
Electronics 14 04523 g003
Figure 4. Qualitative comparison of denoising performance at 0-dB babble noise. (a) Noisy input; (b) Clean target; (c) Baseline Wave-U-Net output; (d) Proposed PR2 output. Section 5.1.1 provides a comprehensive analysis.
Electronics 14 04523 g004
Table 1. Layer-wise internal sampling rates and effective frequency bands for the conventional and proposed Wave-U-Net. All values are in kHz, with the effective band defined as half of the internal sampling rate.
Encoder–Decoder LevelConventional
Fs
Conventional
Effective Band
Proposed
Fs
Proposed
Effective Band
016.008.0016.008.00
18.004.0014.007.00
24.002.0012.006.00
32.001.0010.005.00
41.000.508.004.00
50.500.256.003.00
60.250.1254.002.00
70.1250.06252.001.00
80.06250.03131.500.75
90.03130.01561.000.50
100.02000.01000.500.25
110.01000.00500.200.10
Table 2. Overview of the computational complexity analysis. RTF is measured on an NVIDIA A40 GPU using a 1.024-s input (16 384 samples at 16 kHz).
ModelParameters (M)GFLOPsRTF
Baseline Wave-U-Net10.134.920.0042
Proposed (PR1)10.1338.280.0048
Proposed (PR2)10.1338.180.0142
Proposed (PR3)10.1338.180.0142
Table 3. Network architecture and training hyperparameters.
HyperparameterSetting
OptimizerAdam
Learning Rate5 × 10−4 (fixed)
Adam Betas(0.9, 0.999)
Batch Size32
Max Epochs1200
Early Stopping Patience300
Encoder Kernel Size15
Decoder Kernel Size5
Activation FunctionLeakyReLU (slope = 0.1)
Final Activation FunctionTanh
Encoder Channels24, 48,..., 288
Table 4. Absolute STOI scores (maximum 1.0) for PR2 and PR3 across six noise types. Values denote the score averaged over Low SNR conditions (–10–0 dB), with the score for High SNR conditions (5–15 dB) presented in parentheses.
MethodsNoise Conditions
BabbleF16FactoryPinkVolvoWhite
PR20.720
(0.960)
0.761
(0.964)
0.734
(0.955)
0.752
(0.957)
0.977
(0.994)
0.789
(0.955)
PR30.719
(0.962)
0.767
(0.966)
0.730
(0.958)
0.752
(0.959)
0.977
(0.994)
0.796
(0.956)
Table 5. Absolute PESQ scores (maximum 4.5) for PR2 and PR3 across six noise types. Values denote the score averaged over Low SNR conditions (–10–0 dB), with the score for High SNR conditions (5–15 dB) presented in parentheses.
MethodsNoise Conditions
BabbleF16FactoryPinkVolvoWhite
PR21.301
(2.642)
1.444
(2.718)
1.327
(2.529)
1.382
(2.604)
3.257
(4.112)
1.405
(2.513)
PR31.335
(2.674)
1.477
(2.752)
1.351
(2.610)
1.418
(2.656)
3.231
(4.150)
1.443
(2.612)
Table 6. Performance comparison of the combined effectiveness of the temporal enhancement module (Model A) and proposed frequency-aware module (Model B). All scores are averaged across all test conditions.
ModelDescriptionSTOIPESQ
BaselineOriginal Wave-U-Net0.8822.25
Model ABaseline + Attention Module (Temporal)0.9152.58
Model BBaseline + Proposed Module (Frequency-Aware)0.9112.65
Model CBaseline + Attention + Proposed (Combined)0.9262.77
Note: Metrics are mean absolute scores over all test conditions, as described in Section 4.1. The SNR set includes −10, −5, 0, 5, 10, and 15 dB. The adopted noise set is from NOISEX-92, which includes babble, f16, factory, pink, Volvo, and white noise, mixed with TIMIT test utterances.
Table 7. Robustness evaluation on unseen non-stationary noise conditions, demonstrating that the proposed method (Model B) generalizes effectively beyond the training dataset.
Noise TypeModelSTOIPESQ
Typing NoiseBaseline0.781.85
Model B0.822.01
Siren NoiseBaseline0.751.79
Model B0.791.95
Note: Noise types are non-stationary “Typing” and “Siren” clips from a DNS-style corpus, utilized as a held-out snapshot test without any retraining. Reported numbers are mean absolute scores at the same SNR set used in Table 6.
Table 8. Comparative analysis of STOI and PESQ (improvement scores) against same-type waveform models on NOISEX-92 test.
ModelSTOI (Avg.)PESQ (Avg.)
Baseline (Wave-U-Net)0.1160.78
PR1 0.1250.90
PR2 0.1280.93
PR30.1290.97
CleanUNet 0.1200.92
Conv-TasNet 0.1130.73
Disclaimer/Publisher’s Note: The statements, opinions and data contained in all publications are solely those of the individual author(s) and contributor(s) and not of MDPI and/or the editor(s). MDPI and/or the editor(s) disclaim responsibility for any injury to people or property resulting from any ideas, methods, instructions or products referred to in the content.