Article

Dynamic Platoon Re-Sequencing for Electric Vehicles Based on Bootstrapped DQN

College of Computer and Information Engineering, Nanjing Tech University, Nanjing 211816, China
*
Author to whom correspondence should be addressed.
Electronics 2025, 14(22), 4417; https://doi.org/10.3390/electronics14224417
Submission received: 10 October 2025 / Revised: 31 October 2025 / Accepted: 3 November 2025 / Published: 13 November 2025

Abstract

The energy consumption imbalance among electric vehicles (EVs) within a fixed platoon primarily originates from the distinct aerodynamic drag forces at different positions. This imbalance further causes practical challenges, such as inconsistent battery degradation rates and divergent charging durations. To tackle these challenges, dynamically adjusting the platoon formations during the journey is essential, which requires identifying the optimal vehicle sequences at designated re-sequencing points. In this research, we formulate the Optimal Re-Sequencing (ORS) problem as a multi-objective optimization problem that minimizes the imbalance of energy consumption, ensures a minimum remaining state of charge (SOC) for energy security, and penalizes excessive formation changes to maintain stability. To solve this optimization problem, we propose a deep reinforcement learning (DRL) framework based on Bootstrapped Deep Q-Networks. This framework integrates multi-head Q-value estimation and prioritized experience replay mechanisms to improve exploration efficiency and learning stability. Through simulation experiments based on a modeled Suzhou–Nanjing route, our proposed approach achieves a final SOC standard deviation of 0.00524, representing a 47% reduction compared with existing works, demonstrating superior efficiency and effectiveness in achieving fair energy consumption across EV platoons.

1. Introduction

Platooning refers to a group of vehicles traveling cooperatively in close formation [1], which is supported by Vehicle-to-Vehicle (V2V) communication and autonomous driving technologies. In recent research, platooning has shown a significant potential to improve traffic throughput [2,3], road safety [4,5], and energy efficiency [6] by reducing aerodynamic drag. Beyond single-platoon coordination, recent developments in large-scale cooperative traffic management—such as the HAC3 framework [7] and multi-agent reinforcement learning (MARL) approaches for dynamic routing—reflect a growing trend toward hierarchical and adaptive decision-making across multiple traffic layers and control scales. Most existing studies on platoon control are based on fixed platoon strategies, where vehicle positions in the platoon remain unchanged during operation [8,9]. In this framework, researchers have explored a variety of control mechanisms, including intervehicle spacing [10], predictive energy management [11], trajectory optimization [12], and speed planning [13,14,15]. Experimental studies have reported energy savings of 6–10% compared to vehicles without platooning [16]. In addition, advanced ecological controllers increase these savings to approximately 21% [17]. Although fixed platooning can effectively reduce overall energy consumption, it does not consider position-dependent disparities in energy use [18]. This imbalance arises from position-dependent aerodynamic exposure: leading vehicles face higher energy consumption due to greater drag, while trailing vehicles benefit from drafting effects, which substantially reduces their aerodynamic load [19,20]. As a result, such position-dependent disparities in energy consumption gradually lead to heterogeneous levels of SOC between EVs, and the EV with the lowest remaining SOC often constrains the range of the EV platoon.
To reduce the impact of position-dependent disparities in energy consumption, recent studies have explored non-fixed platoon methods, allowing vehicles to change their positions dynamically [21,22,23,24]. Ref. [21] proposed a multi-vehicle self-organized cooperative control strategy that uses a Distributed Model Predictive Control (DMPC) algorithm to merge local platoons into the target platoon as a whole, improving merging efficiency and stability. Ref. [22] developed two sequence change algorithms, named Fuel Amount Heuristic and Traveling Time Heuristic, that can dynamically reorder vehicles based on remaining fuel or elapsed time, extending the platoon driving range by approximately 3–9%. Ref. [18] introduced five re-sequencing optimization methods that significantly cut runtime and enhance energy balance compared to fixed-platoon strategies. Despite these advances, several limitations remain. First, most approaches emphasize energy fairness but overlook the dynamic and uncertain nature of real traffic. In congested conditions, limited road space and increased collision risk often render re-sequencing infeasible, and strategies relying solely on instantaneous decisions cannot ensure platoon stability or safety. Recent studies on adaptive energy management have shown improved robustness under complex driving environments by employing environment-aware multi-objective optimization [25], suggesting that adaptive decision-making could enhance stability under such uncertain conditions. However, such adaptive mechanisms have not yet been integrated into cooperative platooning. Second, the minimum remaining SOC between vehicles is rarely explicitly monitored, although it is critical to ensuring fleet-level energy security and to prevent a single low-energy vehicle from destabilizing the formation. Finally, most existing experiments focus only on small platoons, typically consisting of four vehicles, which restricts understanding of scalability and operational complexity in large fleets.
In response to these challenges, we formulate the dynamic platooning task as a multi-objective ORS problem, in which EVs adjust their positions at designated checkpoints to improve energy balance and formation stability. The optimization jointly considers SOC fairness, minimum remaining energy, and platoon stability to achieve balanced energy consumption across all vehicles. To address this problem, we develop a DRL-based control framework that learns adaptive re-sequencing strategies through interaction with the environment. This framework improves both energy efficiency and formation stability at the fleet level.
The main contributions of this paper are summarized as follows:
(1)
We extend the ORS problem in ref. [18] to a multi-objective framework that jointly minimizes SOC deviation, maximizes the minimum remaining SOC, and improves formation stability. This extension turns the original single-objective model into a fleet-level coordination scheme that explicitly balances fairness, energy assurance, and stability.
(2)
We adopt a Bootstrapped DQN with a redesigned reward function that adds an SOC-ranking action at the final re-sequencing stage. Compared with the standard DQN in ref. [23], this design encourages structured exploration and clearer reward guidance, improving convergence and reducing training complexity.
(3)
We benchmark the framework against multiple DRL and heuristic baselines under realistic road and energy profiles. Unlike earlier DRL-based platoon studies limited to small-scale or fixed action spaces, our approach scales to large, combinatorial coordination problems. It achieves low SOC deviation and high minimum SOC, improving both fairness and fleet-level resilience.
The remainder of this paper is organized as follows. Section 2 defines the formulation of the multi-objective ORS problem. Section 3 introduces the proposed DRL framework. Section 4 presents the experimental setup and performance analysis.

2. Problem Formulations

We consider a homogeneous platoon consisting of N EVs ( N 2 ), indexed by the set V = { 1 , 2 , , N } . The platoon travels a total distance d, through M re-sequencing checkpoints along the route. Let d 0 , d 1 , , d M 1 denote the cumulative distances from the starting point to each of the M checkpoints, where d 0 = 0 represents the point of departure. The corresponding arrival times of the lead vehicle at these checkpoints are indicated by t 0 , t 1 , , t M 1 , and  t f represents the arrival time of the entire platoon at its final destination. The vehicle sequence can be adjusted at checkpoints to balance energy consumption. The sequence of vehicle positions during each segment is represented by a position matrix P R N × M , where the entry P i j { 1 , 2 , , N } indicates the position of vehicle i during the j-th platoon segment. Here, i = 1 , , N and j = 1 , , M . The SOC of vehicle i at time t j is indicated by s i ( t j ) and evolves according to the dynamics described in ref. [18]:
s i ( t j ) = s i ( t j 1 ) δ Λ 1 e P i j j d j d j 1 .
This SOC model follows the formulation in ref. [18]. δ is the baseline energy consumption rate per unit distance and Λ denotes the battery capacity. The aerodynamic reduction parameters e P i j j [ 0 , 1 ) represents the reduction rate in electricity usage associated with the P i j -th position in the platoon, which are taken from drag measurements in ref. [26] and used directly in our simulations. The overall SOC state vector at time t j is defined as s ( t j ) = [ s 1 ( t j ) , , s N ( t j ) ] T . To express the cumulative energy consumption, we define an energy consumption matrix C [ C i j j ] for all vehicles and phases, where each entry is given by:
C i j j = s i ( t j 1 ) s i ( t j ) .
In this work, we assume that
e P i 2 j j e P i 1 j j , if P i 1 j < P i 2 j .
Equivalently, vehicles positioned further back benefit from a stronger drag-reduction effect. This assumption is adopted for analytical convenience, while the main results remain valid even without it, requiring only a change in notation.
Based on the above formulation, to enhance both energy efficiency and formation robustness in platoon coordination, we define the optimization problem from the perspectives of fairness, energy security, and formation stability:
(1)
Fairness: Minimize the standard deviation of the final SOCs σ s ( t f ) to ensure balanced energy consumption in all vehicles.
(2)
Energy security: Maximize the remaining SOC min s ( t f ) , because the vehicle with the lowest remaining energy determines both the charging time and the endurance of the entire platoon.
(3)
Formation stability: Minimize instability during the re-sequencing process, measured by the L1-norm of differences between consecutive formations, defined as
I = j = 1 M 1 P ( : , j ) P ( : , j + 1 ) 1 .
Based on the above optimization goals, we extend the ORS problem proposed in ref. [18] to the following multi-objective optimization problem, defined as follows.
max P F ( s ( t f ) ) σ s ( t f ) , min ( s ( t f ) ) , I , s . t . ( 1 ) , s i ( t f ) 0 , i { 1 , , N } , P i j { 1 , , N } , P i 1 j P i 2 j , i 1 i 2 , j = 1 , , M .

3. Algorithm Design for Dynamic Platoon Re-Sequencing

To address the multiobjective ORS problem introduced in Section 2, we develop a DRL framework that models vehicle re-sequencing as a sequential decision-making task. Specifically, the framework is organized into two parts: an environment simulation module and a DRL agent module. The environment maintains the state of the platoon, updates the SOC according to the position-dependent consumption matrix, and provides rewards based on fairness, energy security, and stability. The DRL agent observes the state, selects actions from the defined action space, and is trained using the Bootstrapped DQN [27] combined with prioritized experience replay to enhance exploration efficiency and training stability. Unlike the conventional ε -greedy exploration strategy, which often suffers from low sample efficiency and weak generalization, Bootstrapped DQN maintains an ensemble of independently initialized value heads. At the beginning of each episode, one head is randomly sampled for policy evaluation and update, approximating Thompson sampling and enabling diverse exploration. This ensemble mechanism provides uncertainty-aware decision making and improves convergence stability in the ORS environment. This interaction process is formalized as a Markov Decision Process (MDP) and implemented in a customized OpenAI Gym environment. The details of the state space, action space, and reward function are described in the following subsections.

3.1. Agent Modeling and Environment Design

3.1.1. State Space

A customized Gym-compatible environment is constructed to emulate the platooning dynamics of N homogeneous EVs over M re-sequencing stages. At each stage j, vehicles can be re-sequenced according to their position-dependent energy efficiency. The hybrid system state combines both energy status and temporal information, defined as
S ( t j ) = [ s 1 ( t j ) , s 2 ( t j ) , , s N ( t j ) , l ] ,
where s i ( t j ) denotes the SOC of vehicle i at stage j, and l = M j is the number of remaining re-sequencing opportunities. Each s i ( t j ) is normalized to the range [ 0 , 1 ] , where s i ( t j ) = 1 indicates a fully charged battery and s i ( t j ) = 0 represents complete depletion. Hence, the state vector has dimension N + 1 .

3.1.2. Action Space

At each re-sequencing stage, the agent selects a new platoon formation from the action space A based on the current environmental state to perform re-sequencing. The action space A consists of two parts: (i) all permutations of the vehicle set { 1 , 2 , , N } , denoted by A perm = Perm ( 1 , 2 , , N ) with N ! actions, where each action corresponds to a specific platoon formation; and (ii) one additional SOC-ranking action π SOC = argsort ( s ( t j ) ) , which assigns vehicles in descending order of their SOC so that high-energy vehicles take the leading positions. The complete action set is therefore
A = A perm { π SOC } , | A | = N ! + 1 ,
where π SOC is admissible only in the final stage, and any premature execution is penalized as an illegal action. Each action specifies a new formation that directly determines the subsequent position-dependent energy consumption according to (2). It is noted that the factorial growth of the action space with respect to N may lead to high computational complexity for large-scale platoons; however, in practical deployments this issue can be mitigated by restricting the action candidates or adopting hierarchical coordination to maintain tractable decision making.

3.1.3. Reward Function

Building on the standard deviation minimization framework proposed in ref. [23] and the SOC ranking optimality proven in Theorem 2 of ref. [18], we design a multi-objective stage-wise reward function that primarily minimizes the standard deviation of final SOCs σ ( s ( t f ) ) , while also preserving min ( s ( t f ) ) and maintaining formation stability. A special SOC ranking action is enabled exclusively at the final re-sequencing stage and is positively rewarded. The reward function is formulated as follows:
r = α σ s ( t f ) + β min s ( t f ) γ I + ζ , j = M , λ , if the DRL agent takes an illegal action .
where α , β , γ , ζ , and  λ are used to balance fairness, energy assurance, formation stability, final-stage bonus, and penalty for illegal actions, respectively.

3.2. Policy Architectures

Exploration Improvement Strategy

Efficient exploration is essential in high-dimensional discrete action spaces. To move beyond simple ϵ -greedy or NoisyNet-based perturbations, we employ Bootstrapped DQN [27]. This choice allows our policy design to capture uncertainty and encourage structured exploration. The architecture consists of a shared feature extractor followed by multiple independent output heads. At the start of each episode, one head k is sampled and used consistently for both action selection and Q-value evaluation:
a = arg max a Q ( k ) ( s , a ; θ k ) ,
where θ k are the parameters of the k-th head. This mechanism approximates Thompson sampling by introducing head-specific stochasticity across episodes. The ensemble of heads thus provides uncertainty-aware decision making and improves temporal consistency during exploration. Compared with conventional ϵ -greedy, this strategy enables more structured exploration, which is particularly beneficial in ORS tasks characterized by latent state dependencies and delayed feedback.

3.3. Experience Replay Strategy

To improve sample efficiency and accelerate policy learning, we adopt prioritized experience replay (PER) as part of the training framework. Instead of uniformly sampling transitions from the replay buffer, PER selects experiences with higher temporal-difference (TD) errors more frequently, guiding the agent to focus on samples that are more likely to improve the Q-function approximation. For a given transition k, its sampling probability is computed as:
p ( k ) = pri k m pri m ,
where the priority score is defined as pri k = | δ k | + ϕ . Here, δ k denotes the TD error for transition k, and  ϕ is a small positive constant added to avoid zero probability and ensure that all samples retain a non-zero chance of being selected.
To implement efficient priority-based sampling and updates, we employ the SumTree structure, which supports O ( log N ) time complexity for both sampling and priority adjustment, where N is the buffer size. This prioritization focuses training updates on high-error regions of the state–action space, thereby accelerating convergence and enhancing stability in the ORS environment.

3.4. Computational Complexity

The overall training complexity of the proposed Bootstrapped DQN framework can be analyzed in terms of three major components: (1) the forward and backward propagation of K bootstrap heads, (2) prioritized experience replay sampling and updates implemented using a SumTree structure, and (3) environment interactions and state updates. For each training step, the computational cost is approximately O ( K P + B log N buf ) , where K is the number of bootstrap heads, P is the number of parameters per head, B is the batch size, and  N buf is the size of the replay buffer. Over T training steps, the total complexity becomes O ( T · ( K P + B log N buf ) ) . Although the ensemble design introduces a linear factor K, the complexity remains in the same order of magnitude as a standard DQN implementation while providing improved exploration efficiency and learning stability.
The detailed training procedure of the proposed Bootstrapped DQN-based dynamic platoon re-sequencing framework is provided in Appendix A.

4. Experiments

4.1. Experiment Setting

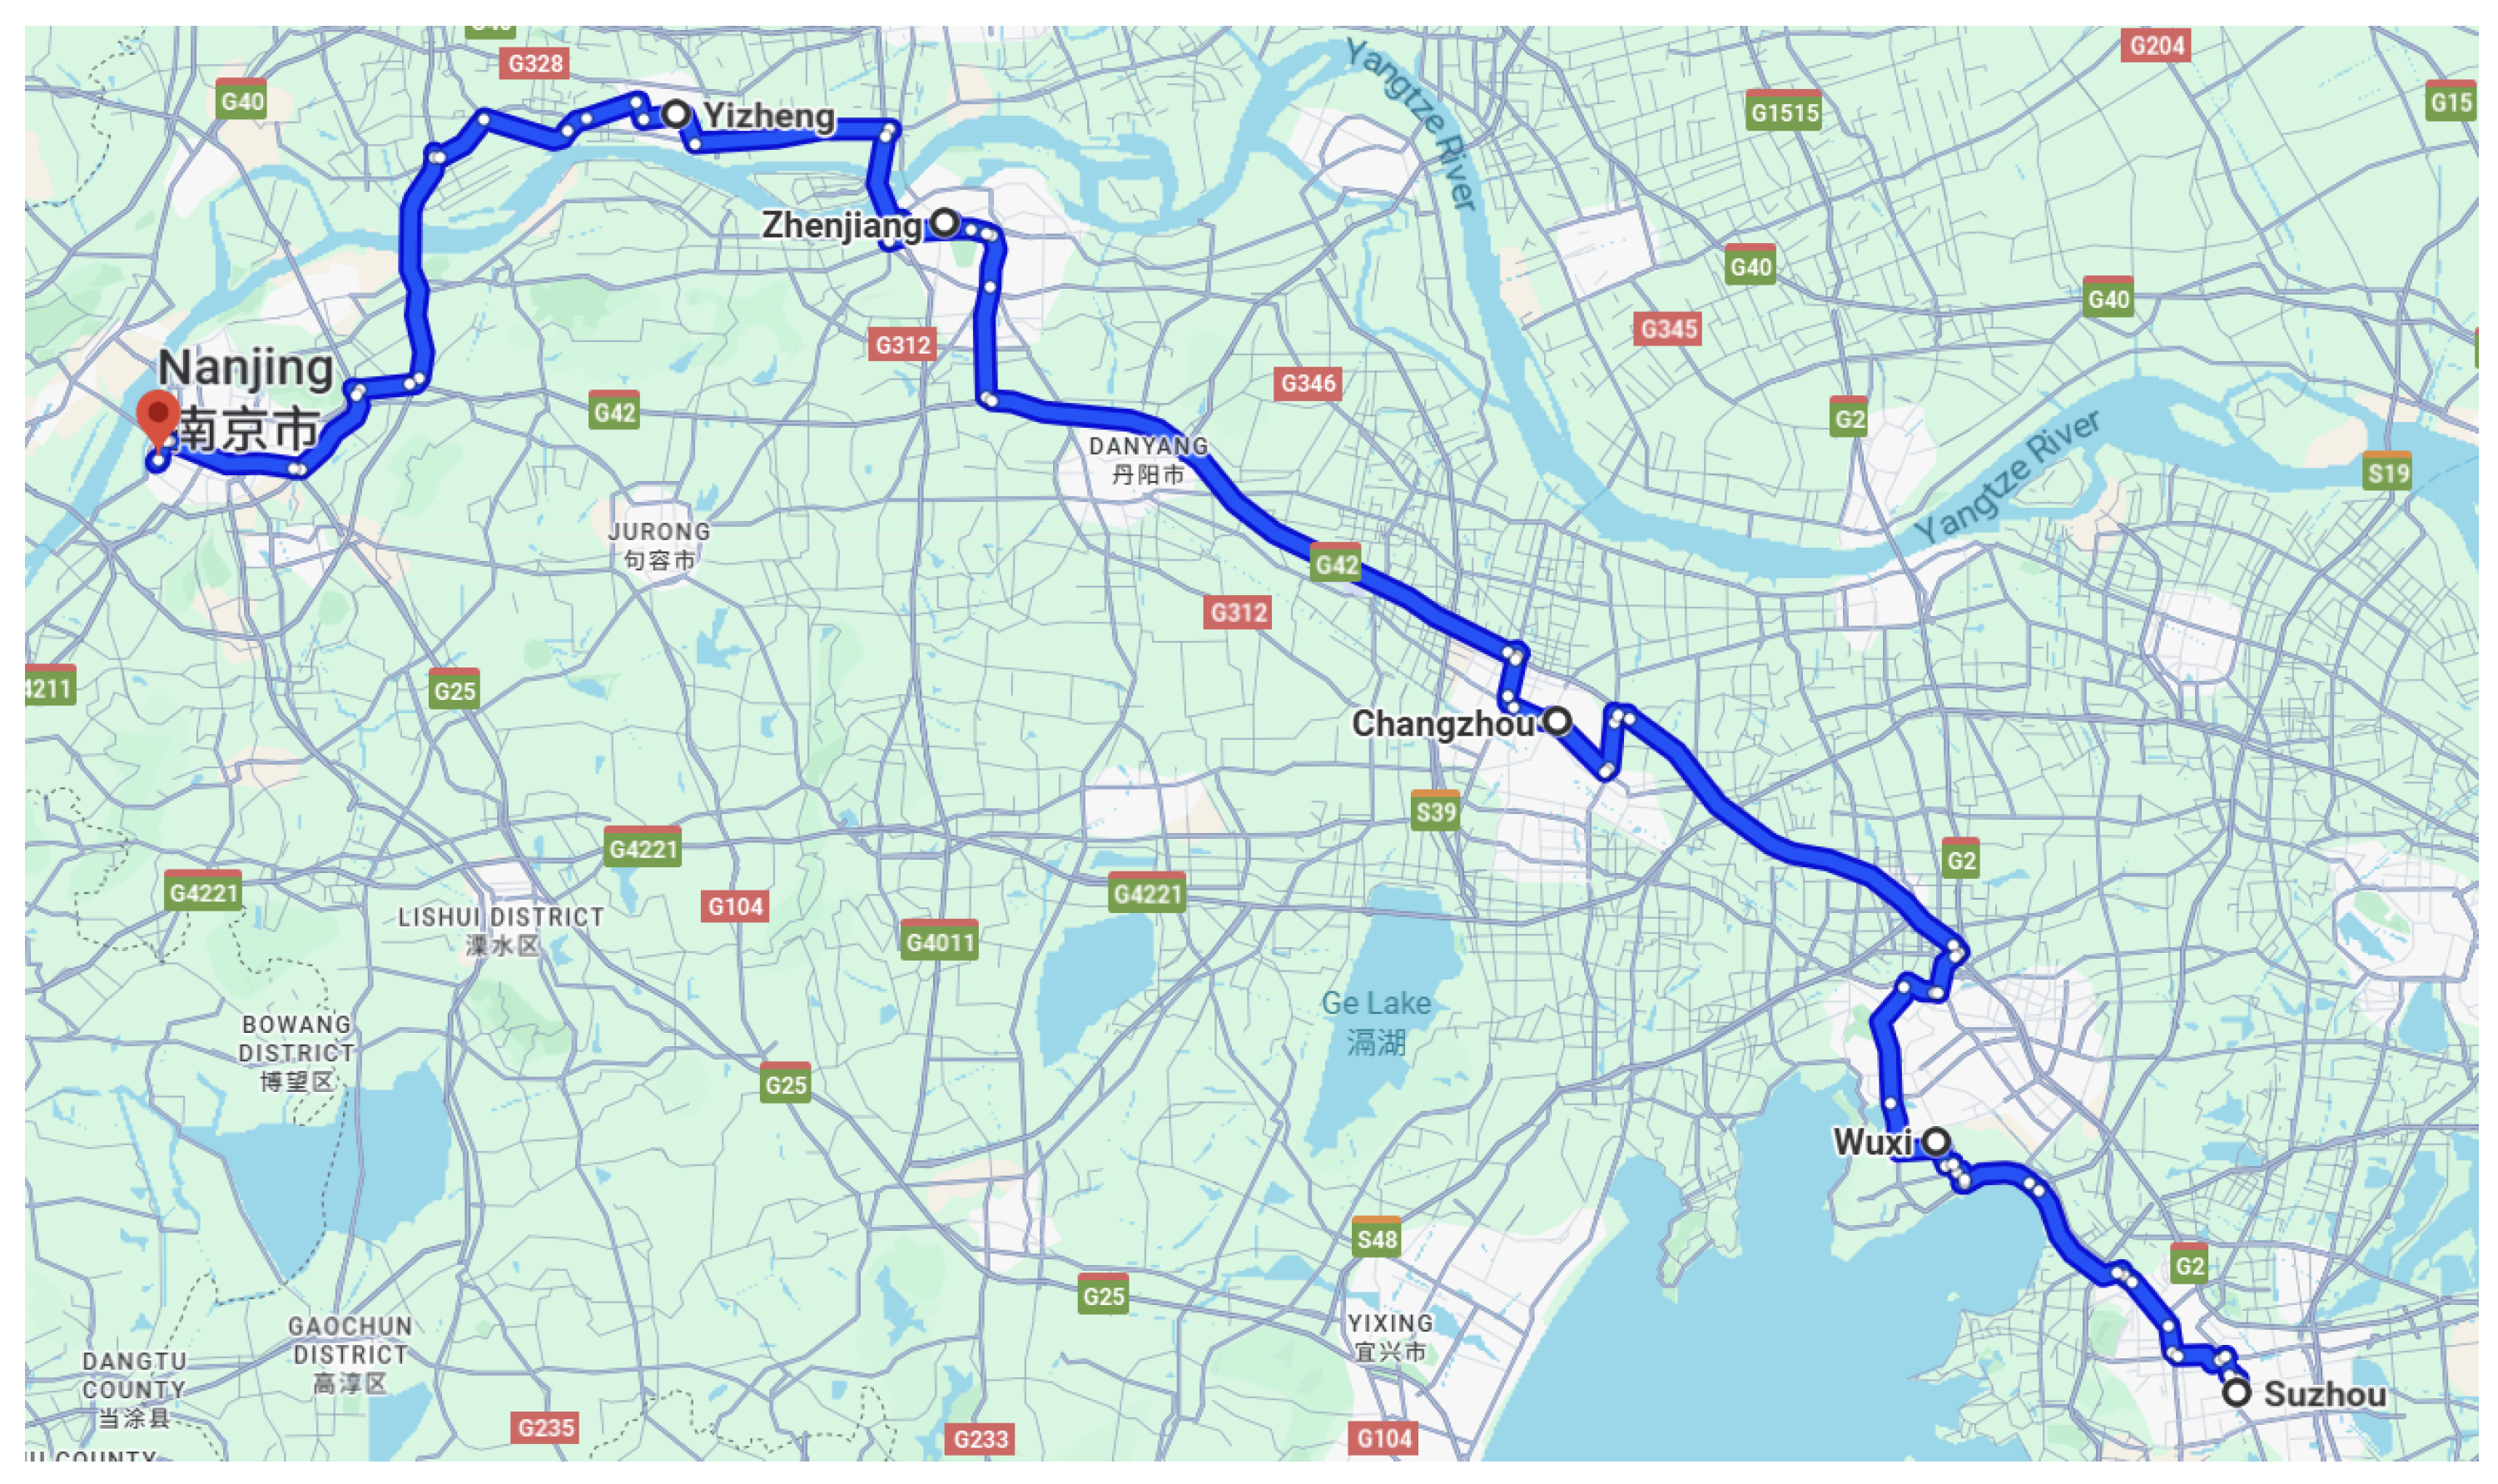
A simulated platoon of five fully charged Tesla EVs travels along a modeled Suzhou–Nanjing route, as shown in Figure 1. The route parameters are derived from realistic geographic and energy consumption data. The average energy-consumption rate is set to δ = 340 Wh / mile , and each vehicle has a battery capacity of Λ = 85 kWh . Most previous studies use four-vehicle platoons [23]. Here, we set the platoon size to N = 5 , which expands the action space by about five times while keeping the computational cost manageable. This setting allows richer positional interactions—especially among mid-platoon vehicles—and creates a more representative dynamic re-sequencing scenario. It also produces a smoother, more statistically meaningful SOC distribution across vehicle positions, making the evaluation of energy balance clearer. In addition, the larger action space encourages more diverse policy exploration during DRL training, improving the generalization of the learned policy. When the platoon size exceeds six, however, the factorial growth of permutation-based actions makes the search space excessively large and the training time impractical. Thus, N = 5 provides a practical trade-off between behavioral richness and computational feasibility. All vehicles are assumed to maintain ideal V2V communication for state sharing, so that the analysis can focus on control policy learning and energy coordination.
The platoon is allowed to reconfigure its formation at five designated re-sequencing stages between six checkpoints along the route: Suzhou ( d 0 = 0 ), Wuxi ( d 1 = 26.2 ), Changzhou ( d 2 = 71.7 ), Zhenjiang ( d 3 = 123.8 ), Yizheng ( d 4 = 149.2 ), and Nanjing ( d 5 = 196.6 ). The total route length is approximately 196.6 miles.
Based on the aerodynamic position parameters reported in ref. [26], the electricity usage reduction rates are set as
e 1 j = 0.043 , e 2 j = 0.10 , e 3 j = 0.14 .
Since aerodynamic measurements beyond the third vehicle are not available in the existing literature and the incremental aerodynamic benefit beyond the third position is relatively small, we assume
e 4 j = e 5 j = 0.14 .
Thus, the consumption matrix C is constructed according to Equation (2) as follows:
C = 0.1048 0.1747 0.1996 0.0972 0.1818 0.0991 0.1652 0.1887 0.0919 0.1719 0.0951 0.1586 0.1810 0.0882 0.1650 0.0951 0.1586 0.1810 0.0882 0.1650 0.0951 0.1586 0.1810 0.0882 0.1650 .
The simulation is executed on an NVIDIA GeForce RTX 5090 (32 GB GDDR7) using the parameters listed in Table 1. Before fixing the final reward coefficients, we ran preliminary experiments to explore the typical ranges of the three objectives: SOC standard deviation, minimum remaining SOC, and formation stability. Because both σ ( s ( t f ) ) and min ( s ( t f ) ) naturally fall within [0, 1], the stability metric I was normalized to the same scale. A balanced reward configuration was then chosen to maintain stable optimization among the three objectives. To avoid the agent’s over-reliance on the SOC-ranking action, the terminal bonus ζ and penalty λ were kept as small constants.

4.1.1. Parameter Sensitivity Analysis

To validate the chosen parameter configuration, sensitivity analyses were performed to assess how key factors influence learning performance. Specifically, we examined the impact of the number of bootstrap heads in the Bootstrapped DQN and the reward coefficients α , β , and  γ . The sensitivity tests for the number of heads were conducted over 20,000 training episodes, while those for the reward coefficients were each performed over 5000 episodes. These analyses confirmed that the selected configuration achieves a stable trade-off among fairness, energy assurance, and formation stability.
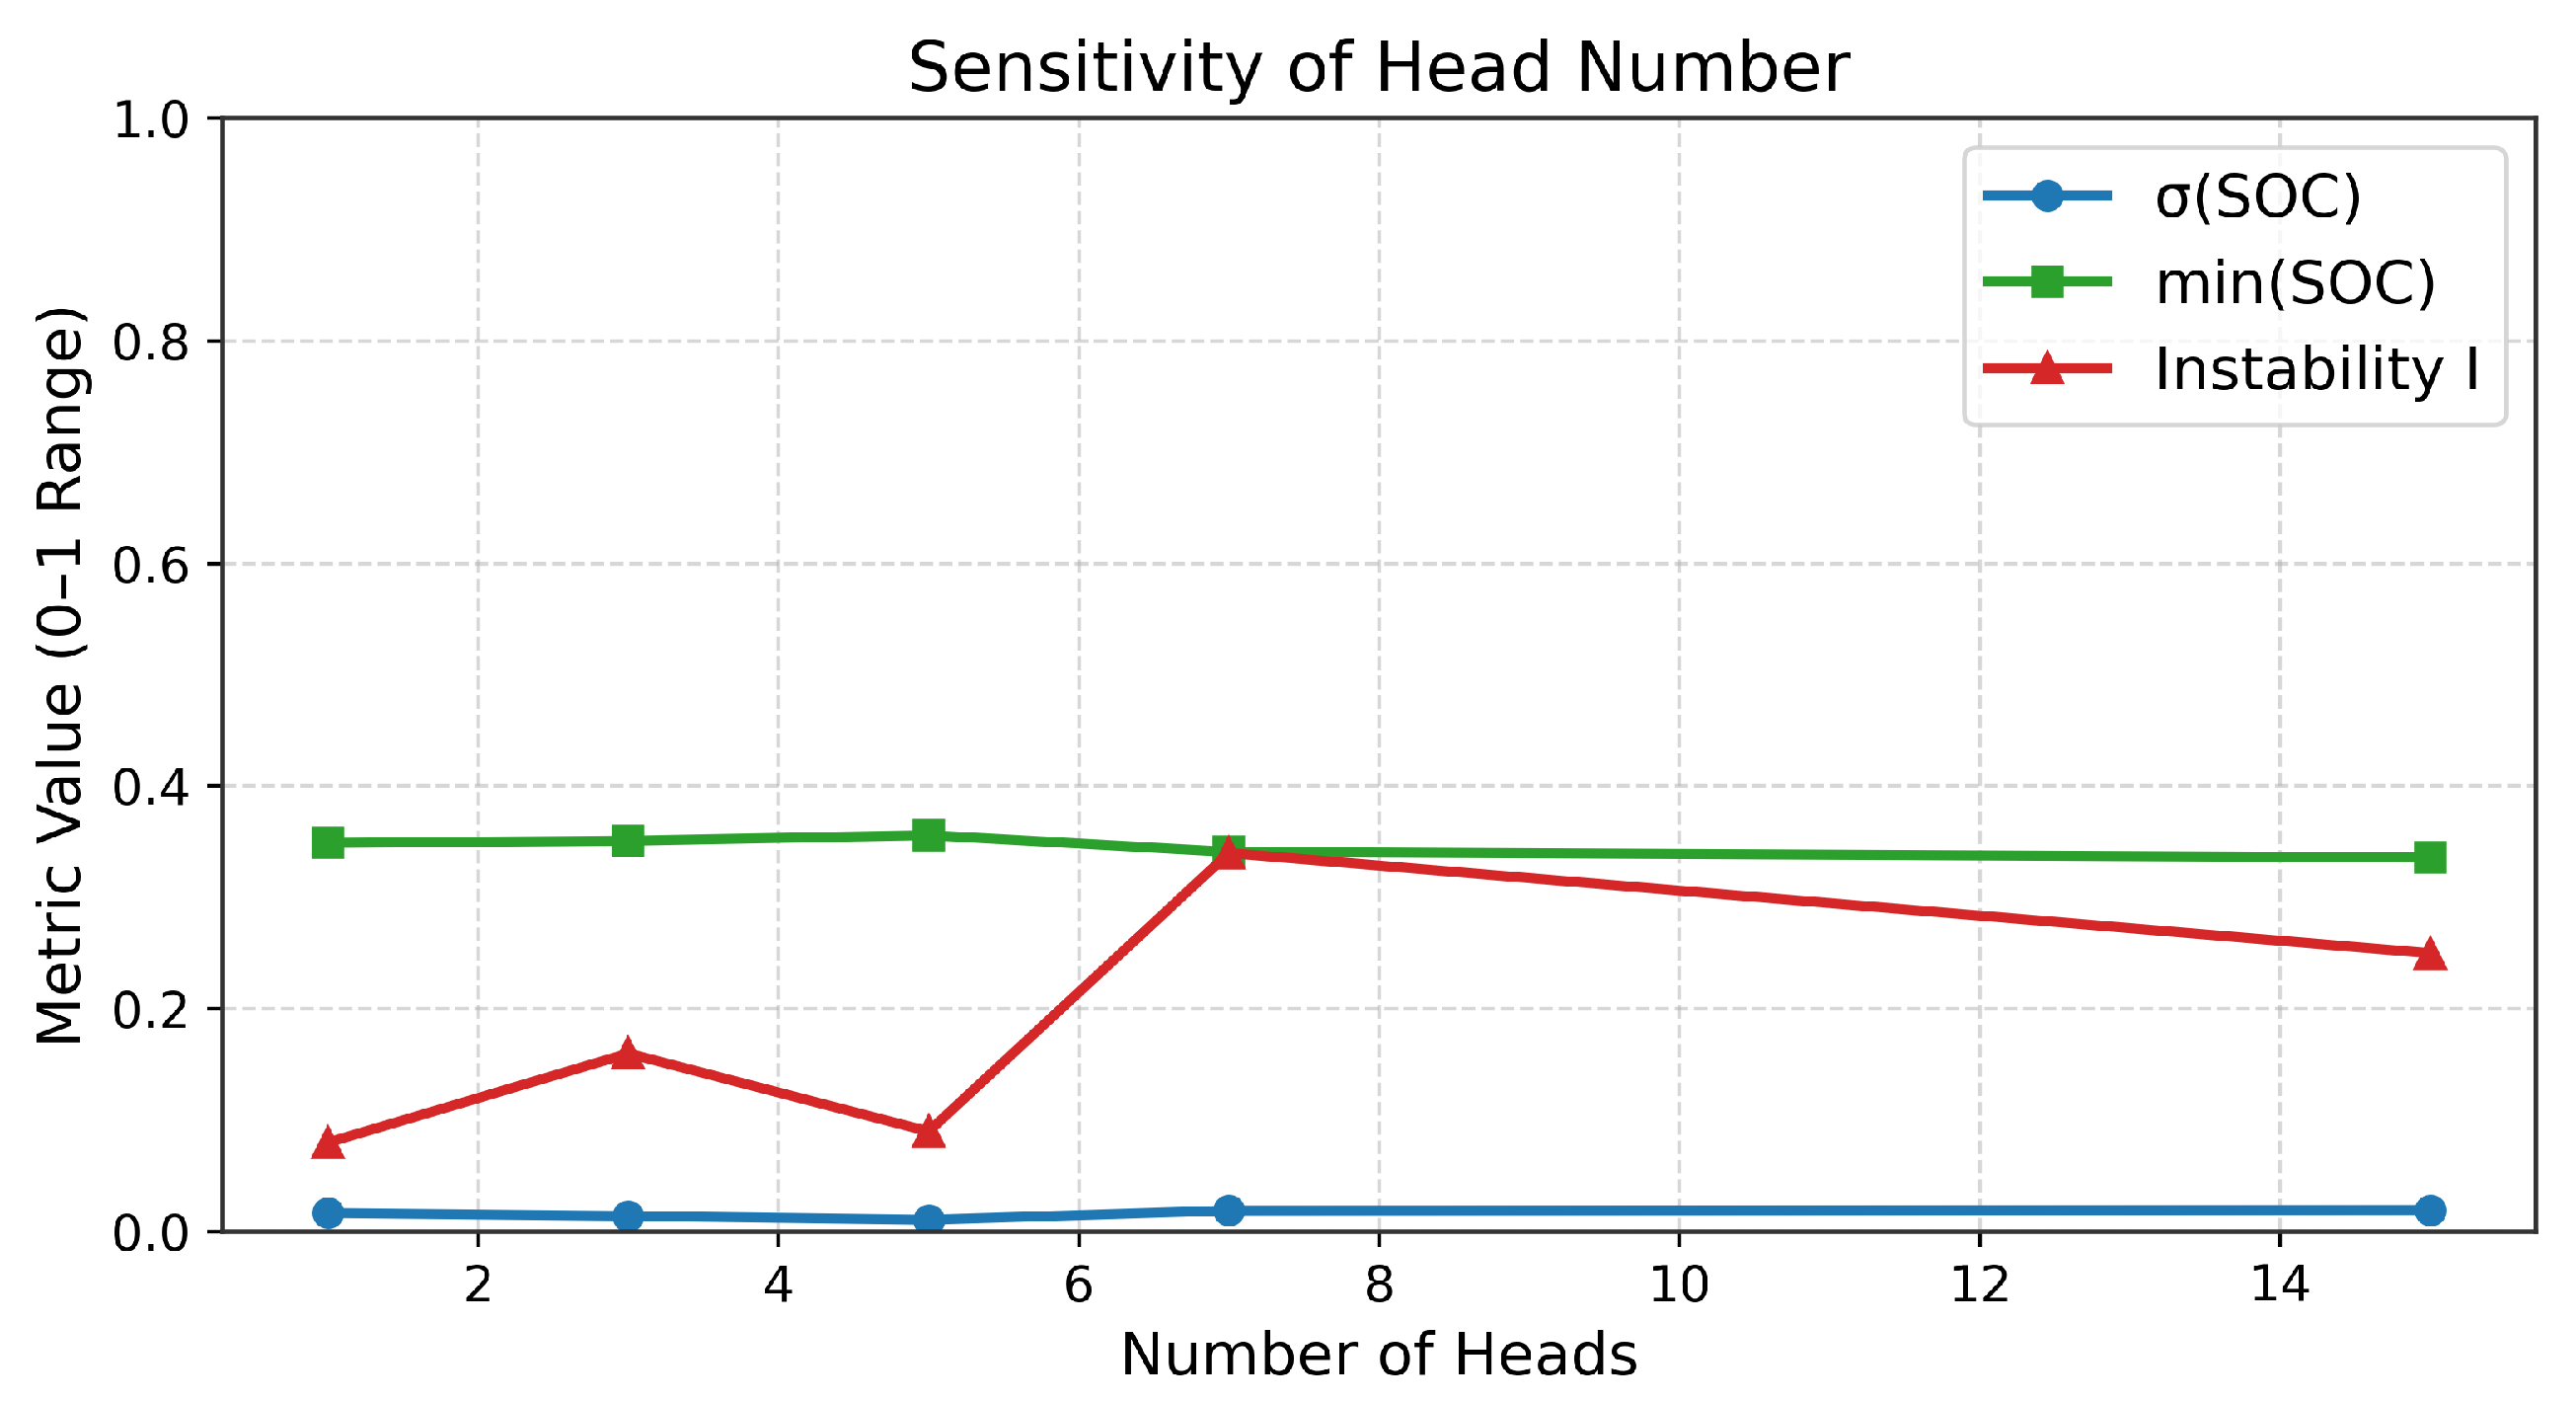
This sensitivity analysis was conducted to study how the number of bootstrap heads ( N head ) affects the learning performance of the Bootstrapped DQN. As shown in Table 2 and Figure 2, the results indicate that increasing N head improves exploration at first, but too many heads may lead to unstable value estimation. The configuration with N head = 5 achieves balanced performance in terms of SOC deviation, minimum SOC, stability, and average reward. This value is therefore adopted in the main experiments.
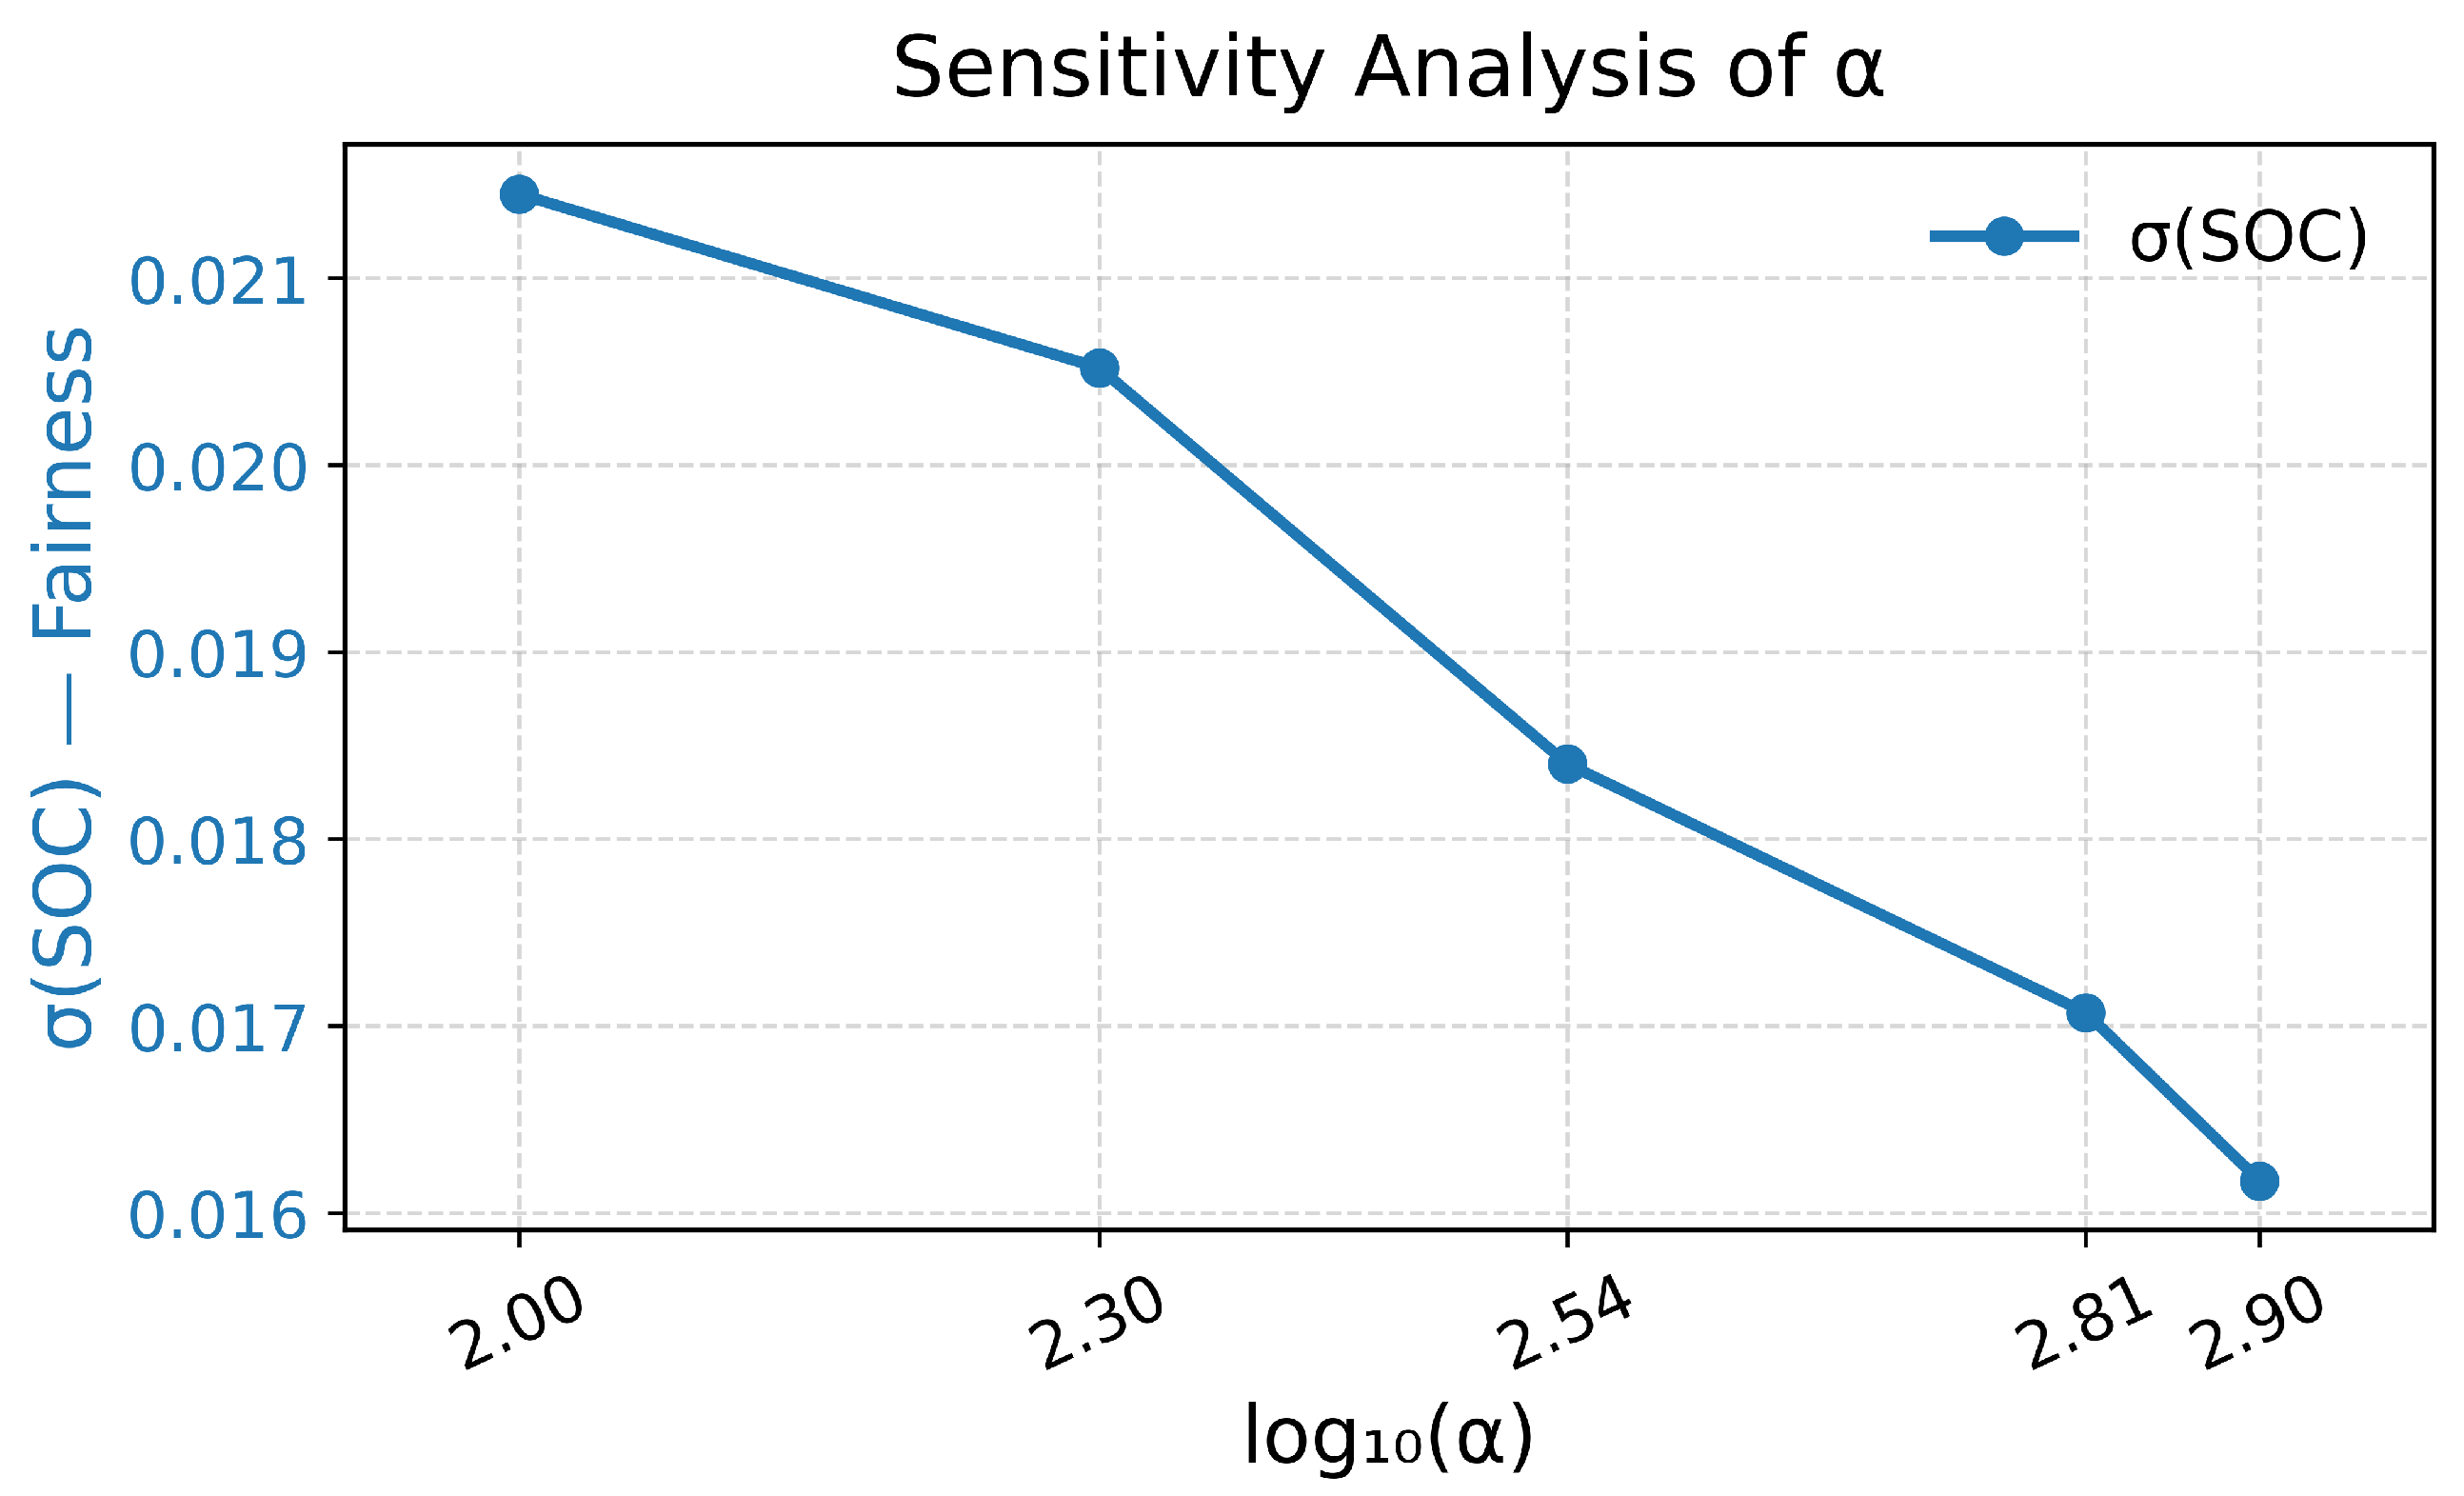
This sensitivity analysis evaluates the effect of the fairness weight α on learning performance. As shown in Table 3 and Figure 3, the SOC standard deviation σ ( SOC ) decreases monotonically as α increases, indicating that a larger weight improves energy fairness among vehicles. Considering convergence stability and computational cost, a moderate value of α was used in the main experiments to maintain a reasonable balance between fairness and overall performance.
This sensitivity analysis evaluates the effect of the energy assurance weight β on overall performance. As shown in Table 4 and Figure 4, the minimum remaining SOC increases gradually as β grows, indicating that a stronger emphasis on energy assurance improves the fleet’s energy security. Beyond moderate values, the improvement becomes marginal, suggesting that a moderate β provides sufficient energy protection without noticeably affecting other objectives. The adopted configuration already enables the model to handle the minimum SOC objective effectively, ensuring adequate energy assurance without additional tuning.
This sensitivity analysis investigates how the stability weight γ influences formation control. As shown in Table 5 and Figure 5, increasing γ consistently reduces the instability metric I , indicating that stronger penalization of formation changes improves stability. The reduction is steep when γ increases from 0 to 25 and becomes more gradual beyond 40, suggesting diminishing returns at higher values. The chosen moderate γ thus provides sufficient stability improvement while keeping formation adjustments responsive and efficient.

4.1.2. Baseline Algorithms

For comparative evaluation, four representative DQN variants are selected as baselines: the standard DQN [28,29], Double DQN [30], Dueling DQN [31], and a static SOC-based ranking heuristic [18]. All baseline algorithms are trained under identical simulation conditions to ensure fair comparison.

4.2. Evaluation Metrics

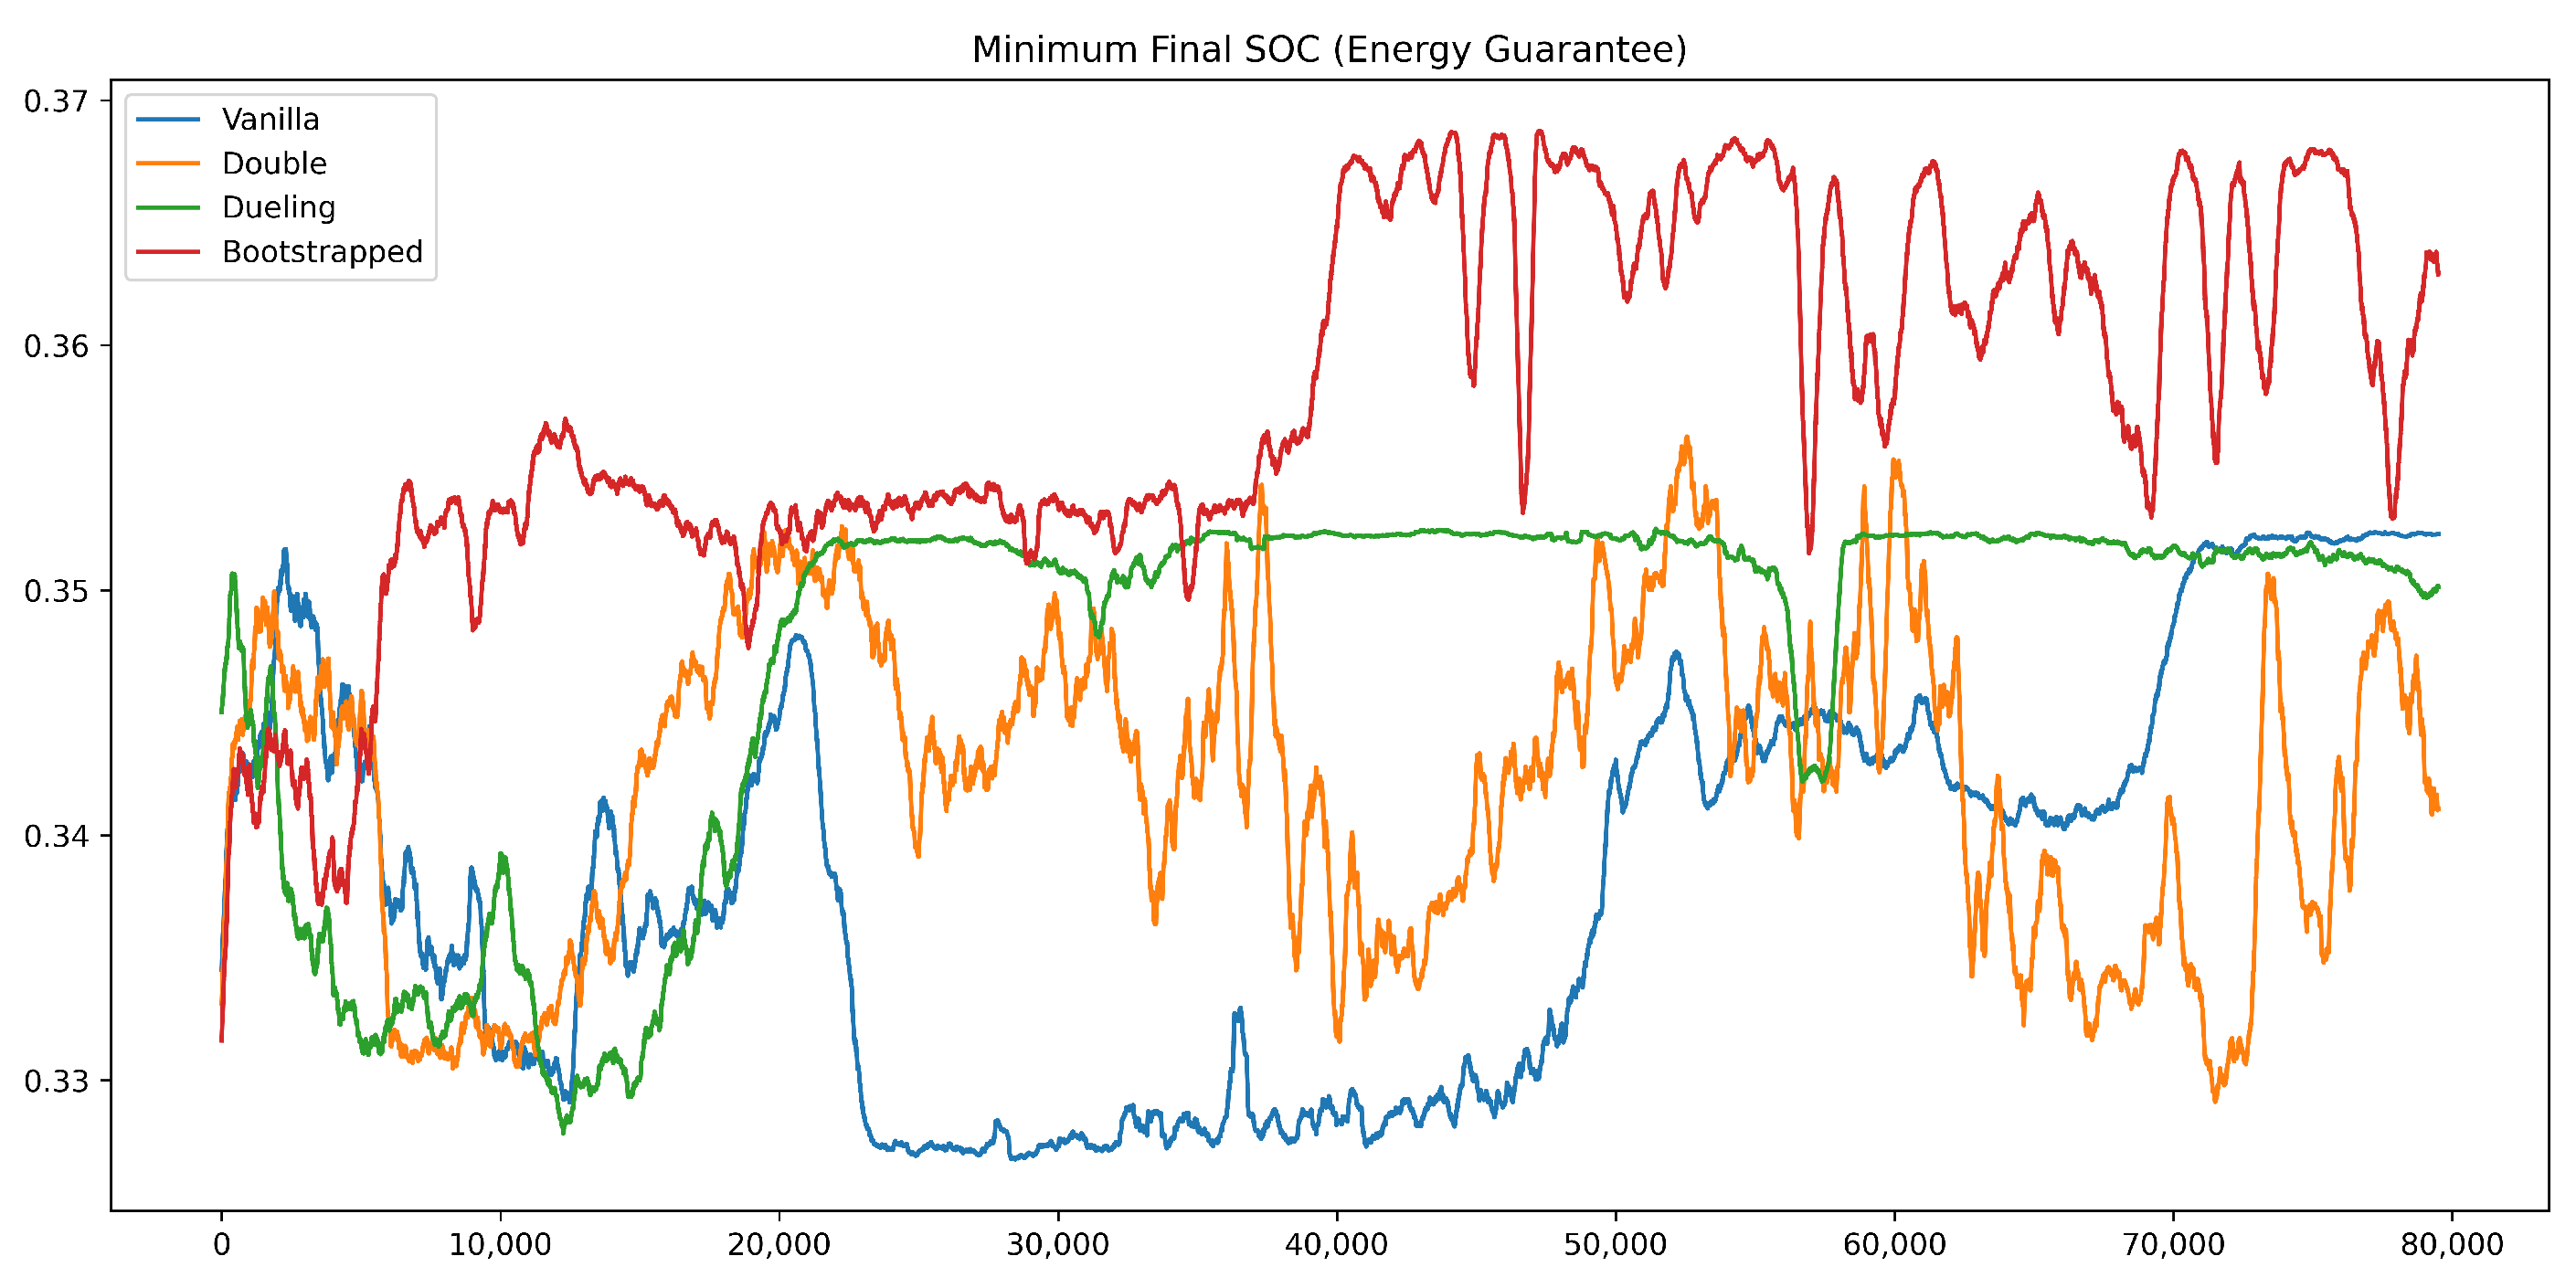
We evaluate the scheduling performance of the proposed algorithm in terms of fairness, policy stability, formation stability, computational efficiency, and energy guarantee. Fairness is quantified by the SOC standard deviation σ s ( t f ) ; policy stability by the return standard deviation σ ( R ) ; formation stability by the stability metric I , where a smaller I indicates higher stability; computational efficiency by the average inference time; and energy guarantee by the minimum remaining SOC min s ( t f ) . These metrics were continuously monitored during training to verify the convergence and stability of each algorithm. As shown in Figure 6, Figure 7, Figure 8, Figure 9 and Figure 10, the trajectories of Q-values, average returns, SOC deviation, minimum SOC, and formation stability together depict the overall training and validation process. The Bootstrapped DQN converged rapidly—within about 10,000 episodes—while maintaining the highest average return and the lowest SOC deviation, highlighting its superior learning efficiency and fairness performance.

4.3. Training Process

To evaluate the policy stability of our algorithm, we take Vanilla DQN, Double DQN, Dueling DQN and SOC ranking algorithms as the baseline algorithms. The training results are shown below.
Figure 6 shows the Q-value trajectories during training. The Bootstrapped DQN quickly rises to a plateau around 12 and then gradually decreases toward 6, remaining consistently higher than those of the other methods despite slight oscillations. Vanilla DQN exhibits a smooth transition from negative to positive values with moderate fluctuations. Double DQN fluctuates widely and often crosses zero, suggesting unstable learning in the later stages. Dueling DQN stays at a low level without sustained improvement, indicating weak value estimation capability. These observations confirm that Bootstrapped DQN achieves faster and more stable value learning than the other baseline algorithms.
Figure 7 shows the evolution of the average return during training. The Bootstrapped DQN rises rapidly after about 10,000 episodes and maintains a high return thereafter, with minor oscillations that reflect active yet stable exploration. Vanilla DQN improves gradually and stabilizes at positive values in the later stage. Double DQN exhibits large fluctuations and frequently drops below zero, suggesting unstable policy learning. Dueling DQN remains close to zero throughout most of the training, showing limited progress. Compared with the other DQN variants, Bootstrapped DQN achieves both faster convergence and smoother learning dynamics.
Figure 8 shows the evolution of the SOC standard deviation during training. The Bootstrapped DQN converges rapidly and consistently maintains the lowest deviation, stabilizing near 0.005 after about 10,000 episodes. This behavior demonstrates that its policy achieves the most balanced energy consumption across the fleet. Vanilla DQN also reduces SOC variance but converges more slowly and less steadily. In contrast, Double DQN and Dueling DQN stay at much higher levels—around 0.015 and 0.017—indicating weaker capability in maintaining fairness among vehicles. Overall, Bootstrapped DQN exhibits clear superiority in ensuring equitable energy distribution within the platoon.
Figure 9 shows the evolution of the minimum remaining SOC during training. The Bootstrapped DQN rapidly raises the minimum SOC to about 0.36 within 20,000 episodes and keeps it at the highest level thereafter, reflecting a strong capability for maintaining energy reserves. Vanilla DQN improves more gradually and eventually reaches a similar level with mild fluctuations. Double DQN oscillates sharply and often drops below 0.345, whereas Dueling DQN stays nearly flat around 0.348. Taken together, these observations show that Bootstrapped DQN provides the most reliable energy assurance across the training process.
Figure 10 shows the evolution of the formation stability metric I during training. Double DQN maintains the highest instability throughout, while Dueling DQN achieves the lowest I after convergence. Bootstrapped DQN and Vanilla DQN stay between the two extremes, keeping moderate stability levels. Among all methods, Bootstrapped DQN reaches a steady and balanced performance, indicating stable coordination without excessive formation changes.
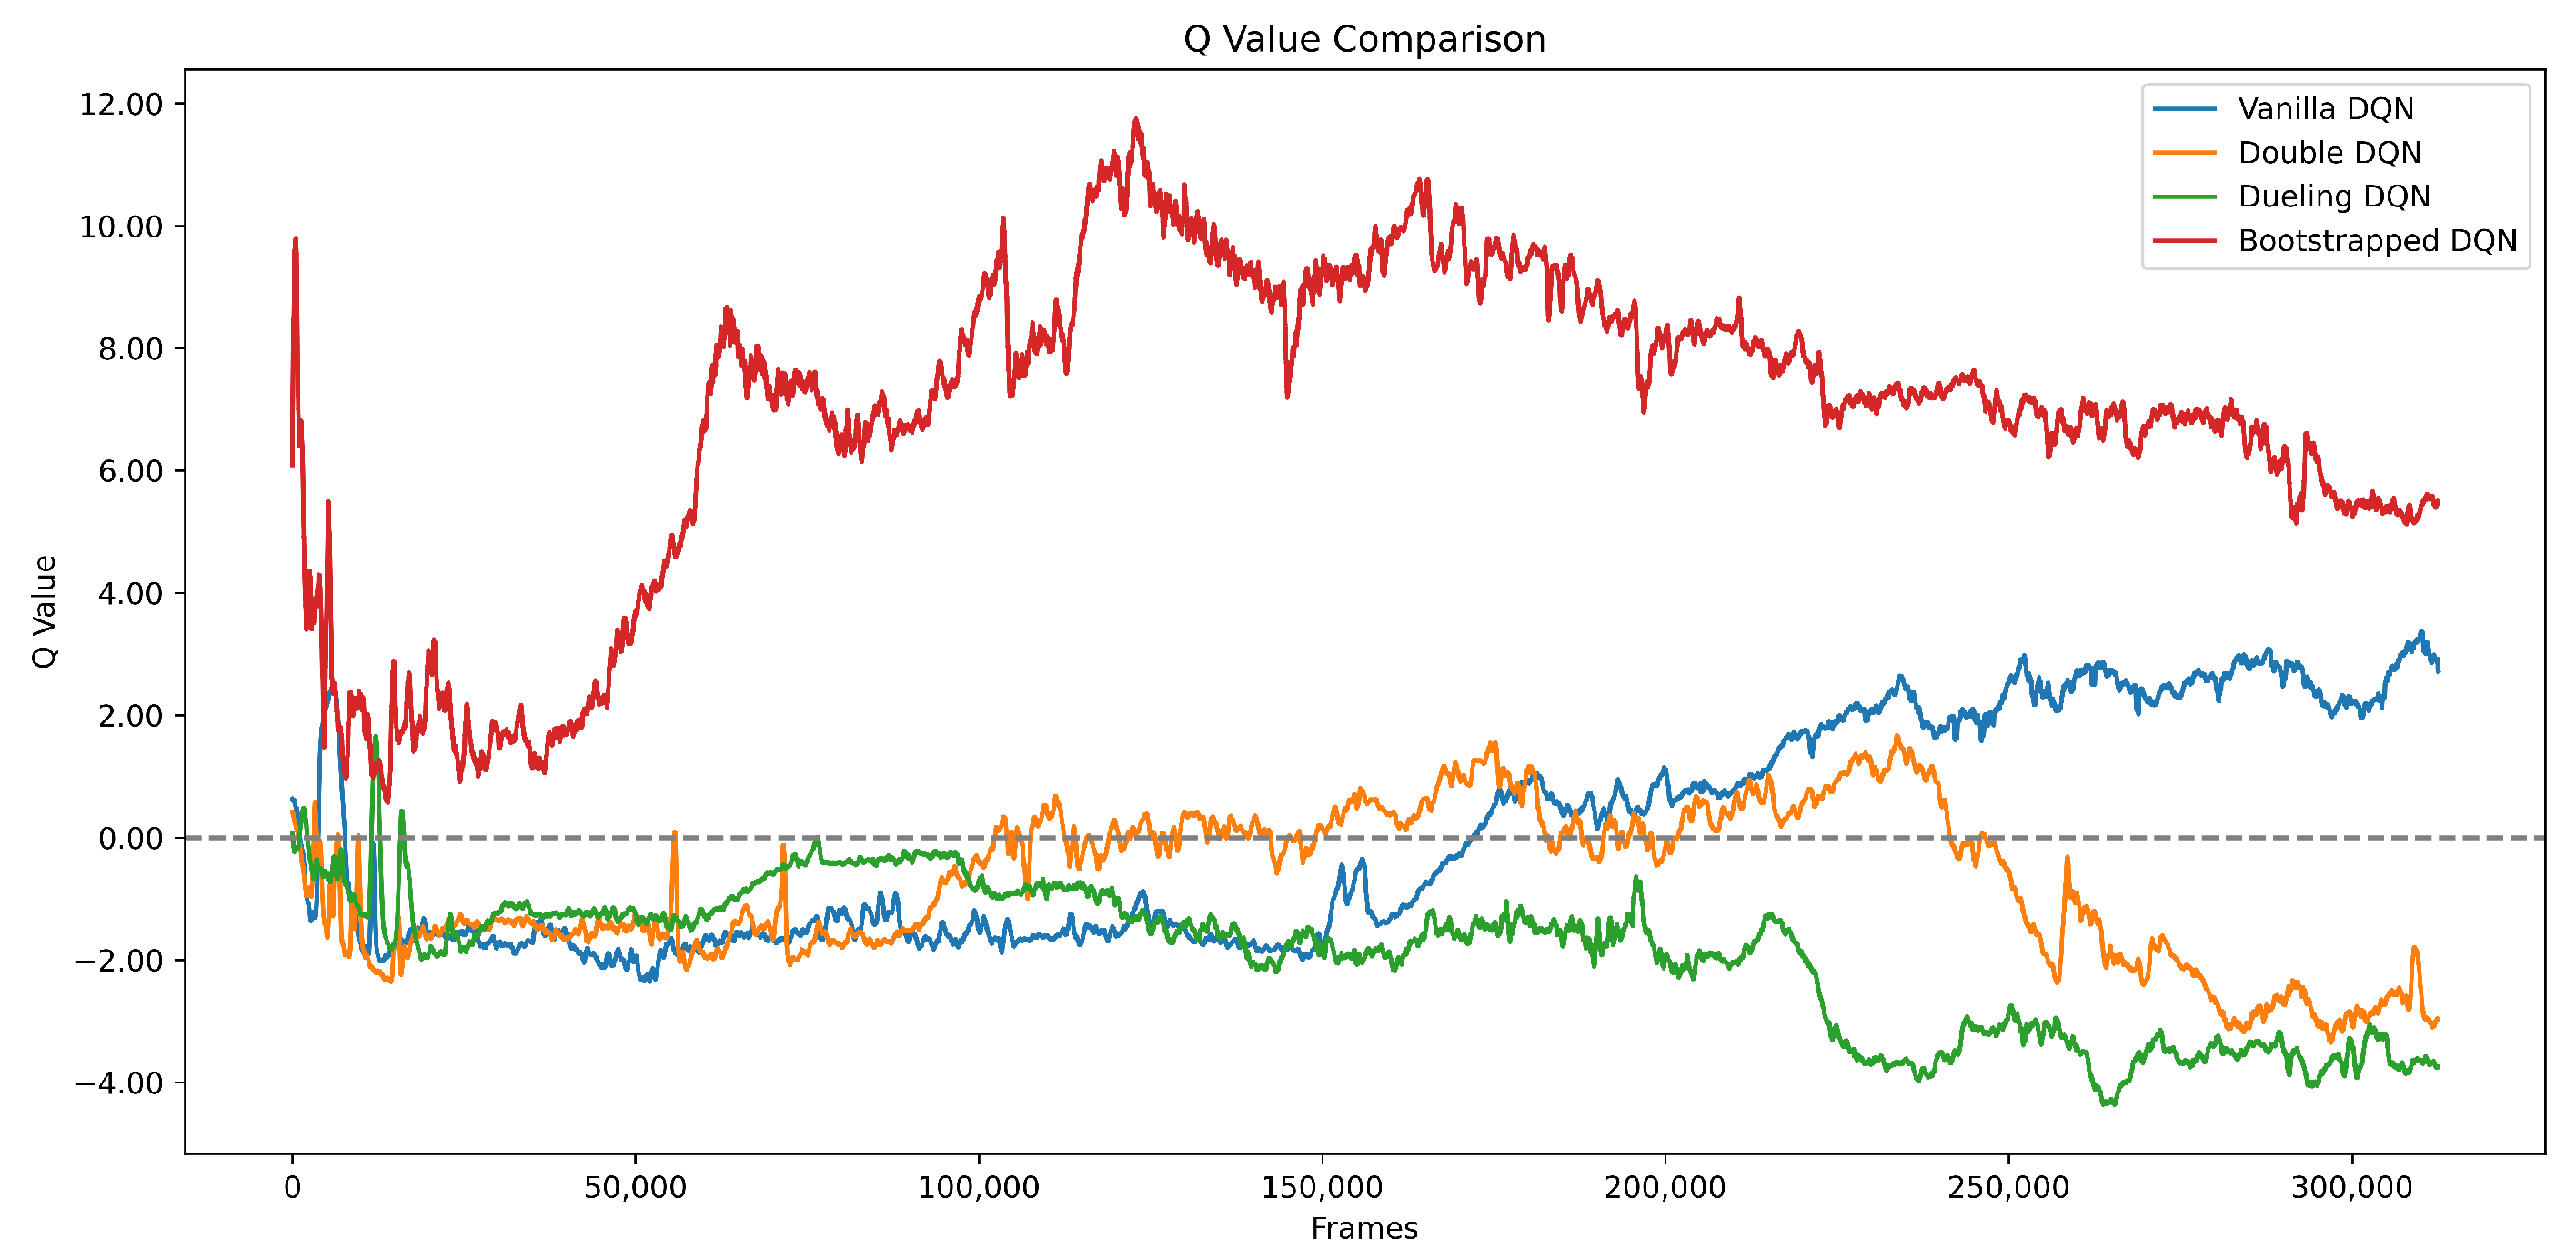
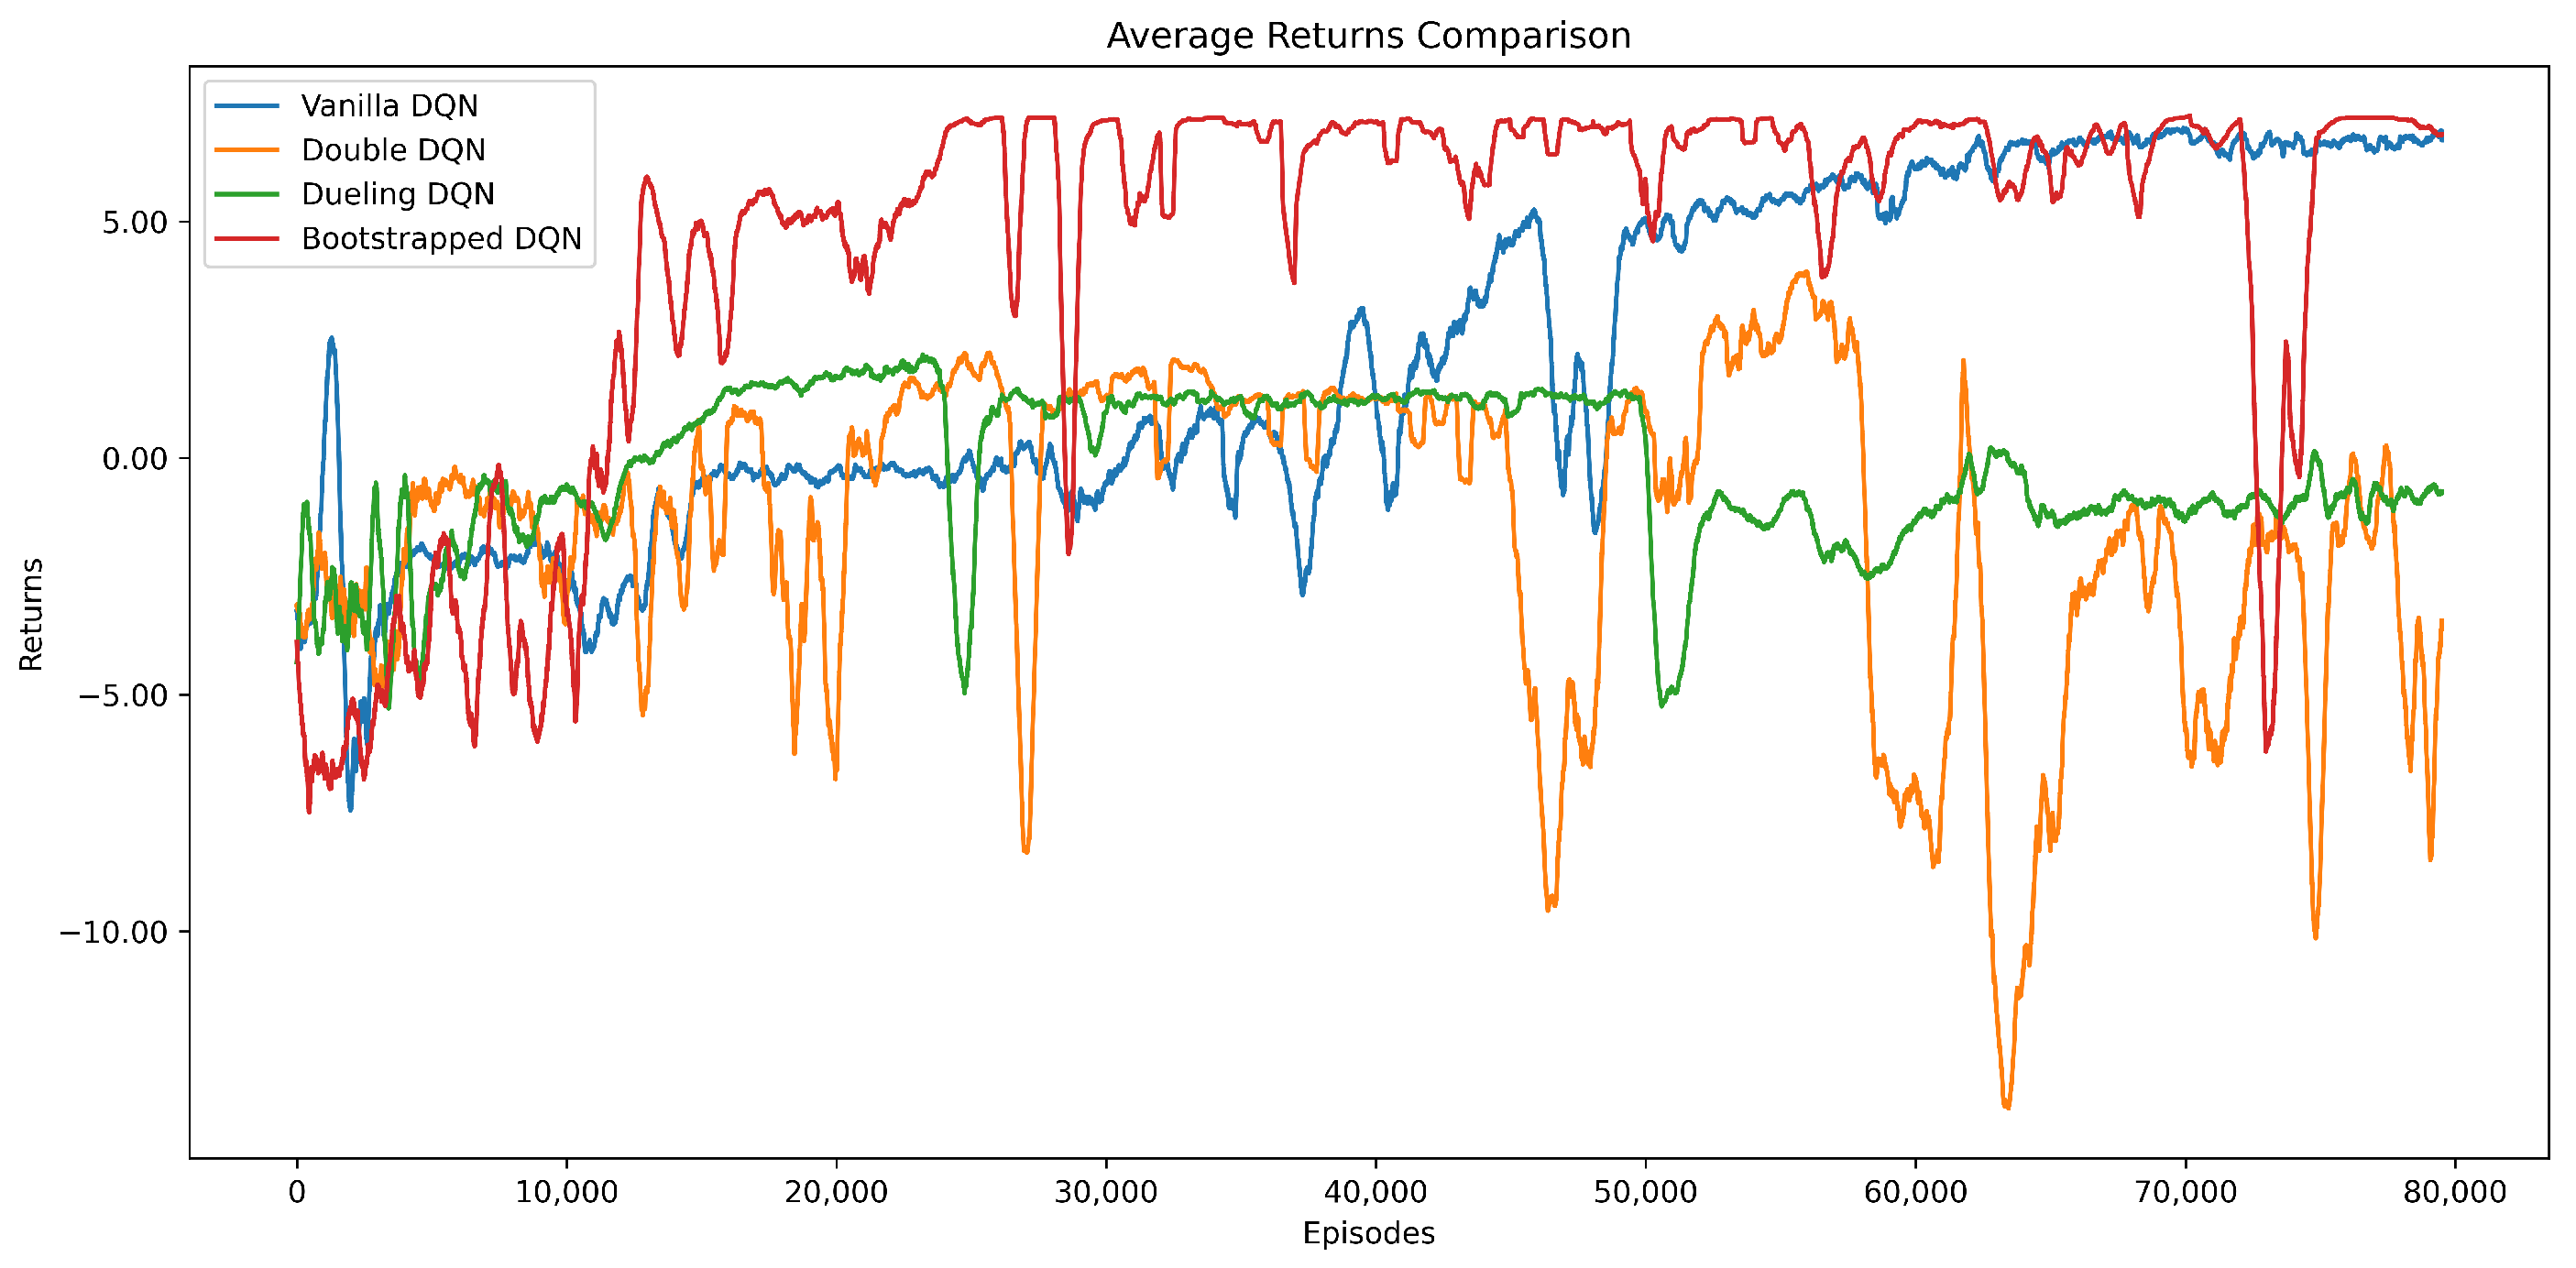
To evaluate the impact of reward design, we construct a simplified environment by removing penalties for illegal actions and bonuses for SOC-based ranking, disabling explicit reward guidance during training.
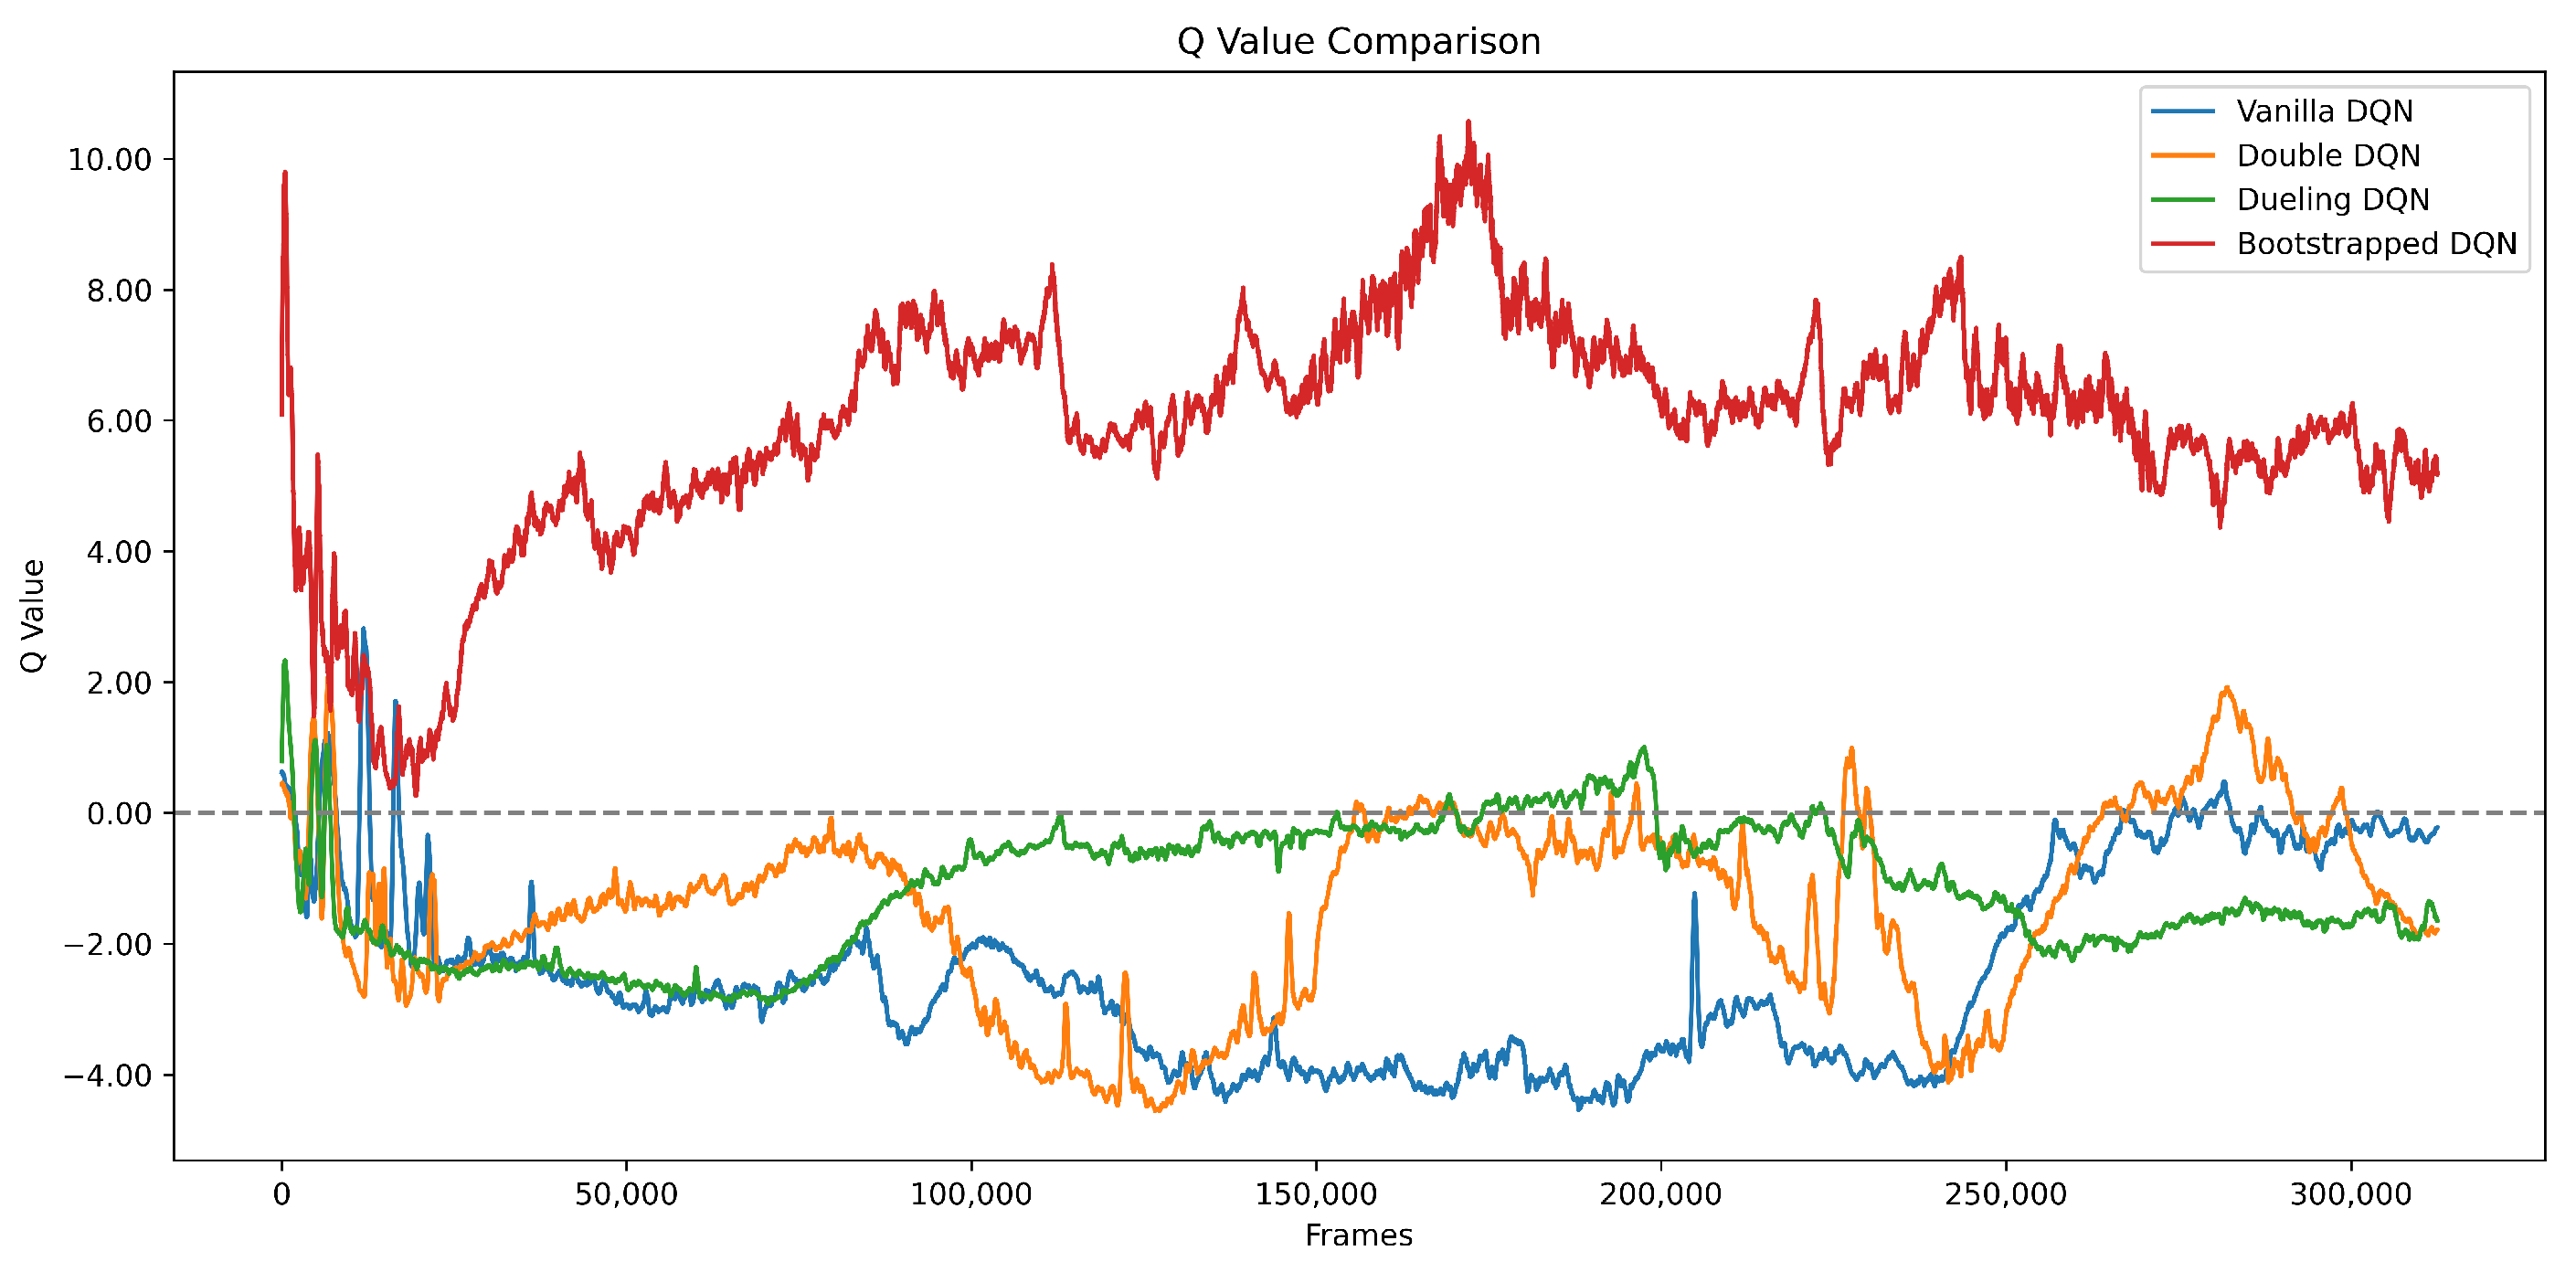
Figure 11 shows the Q-value trajectories during training without reward shaping. The Bootstrapped DQN increases rapidly between 20,000 and 60,000 frames and then stabilizes near 6, staying above the other algorithms throughout the process. Vanilla DQN remains mostly negative with only minor improvement toward the end. Double DQN fluctuates sharply around zero and does not reach convergence, whereas Dueling DQN achieves brief early gains followed by a gradual decline. Overall, Bootstrapped DQN preserves stable value estimation even in the absence of explicit reward guidance.
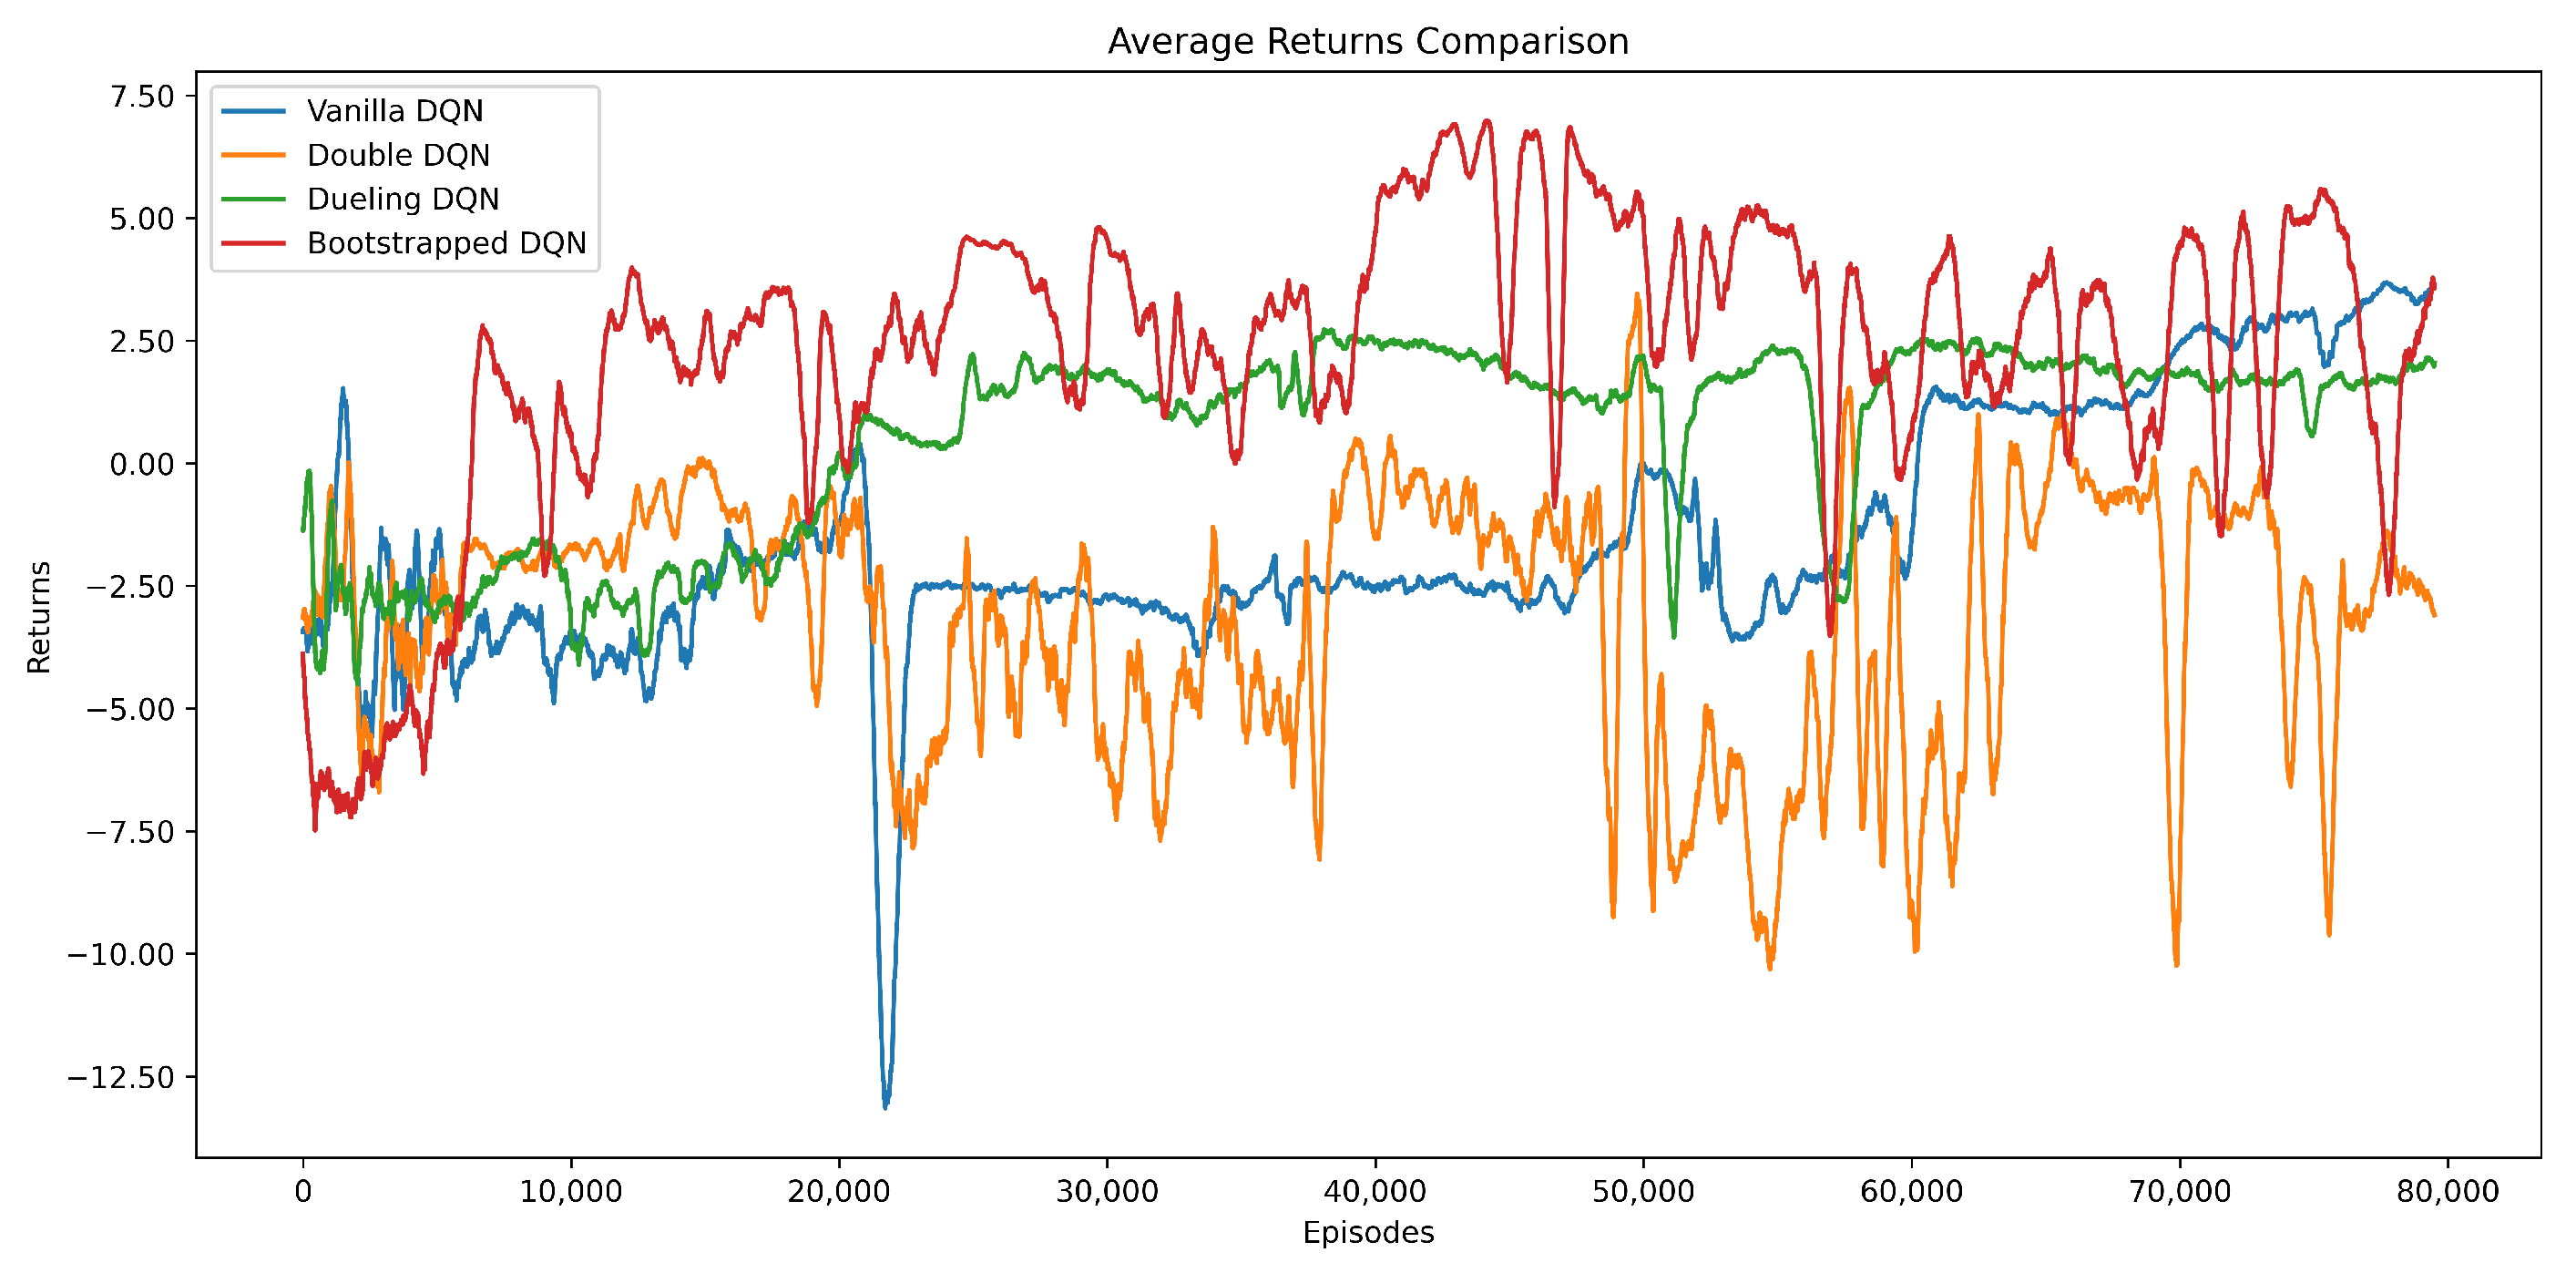
Figure 12 shows the evolution of the average return during training without reward shaping. The Bootstrapped DQN rises steadily after about 40,000 episodes and stabilizes around 4–5, showing clear convergence and consistently higher returns than the other methods. Vanilla DQN gradually improves in the later stage and levels off near 2–3. Dueling DQN stays relatively flat around 1.5–2.5 with limited progress, whereas Double DQN oscillates strongly and often drops below zero. Even without reward shaping, Bootstrapped DQN maintains smooth learning dynamics and stable policy improvement throughout training.
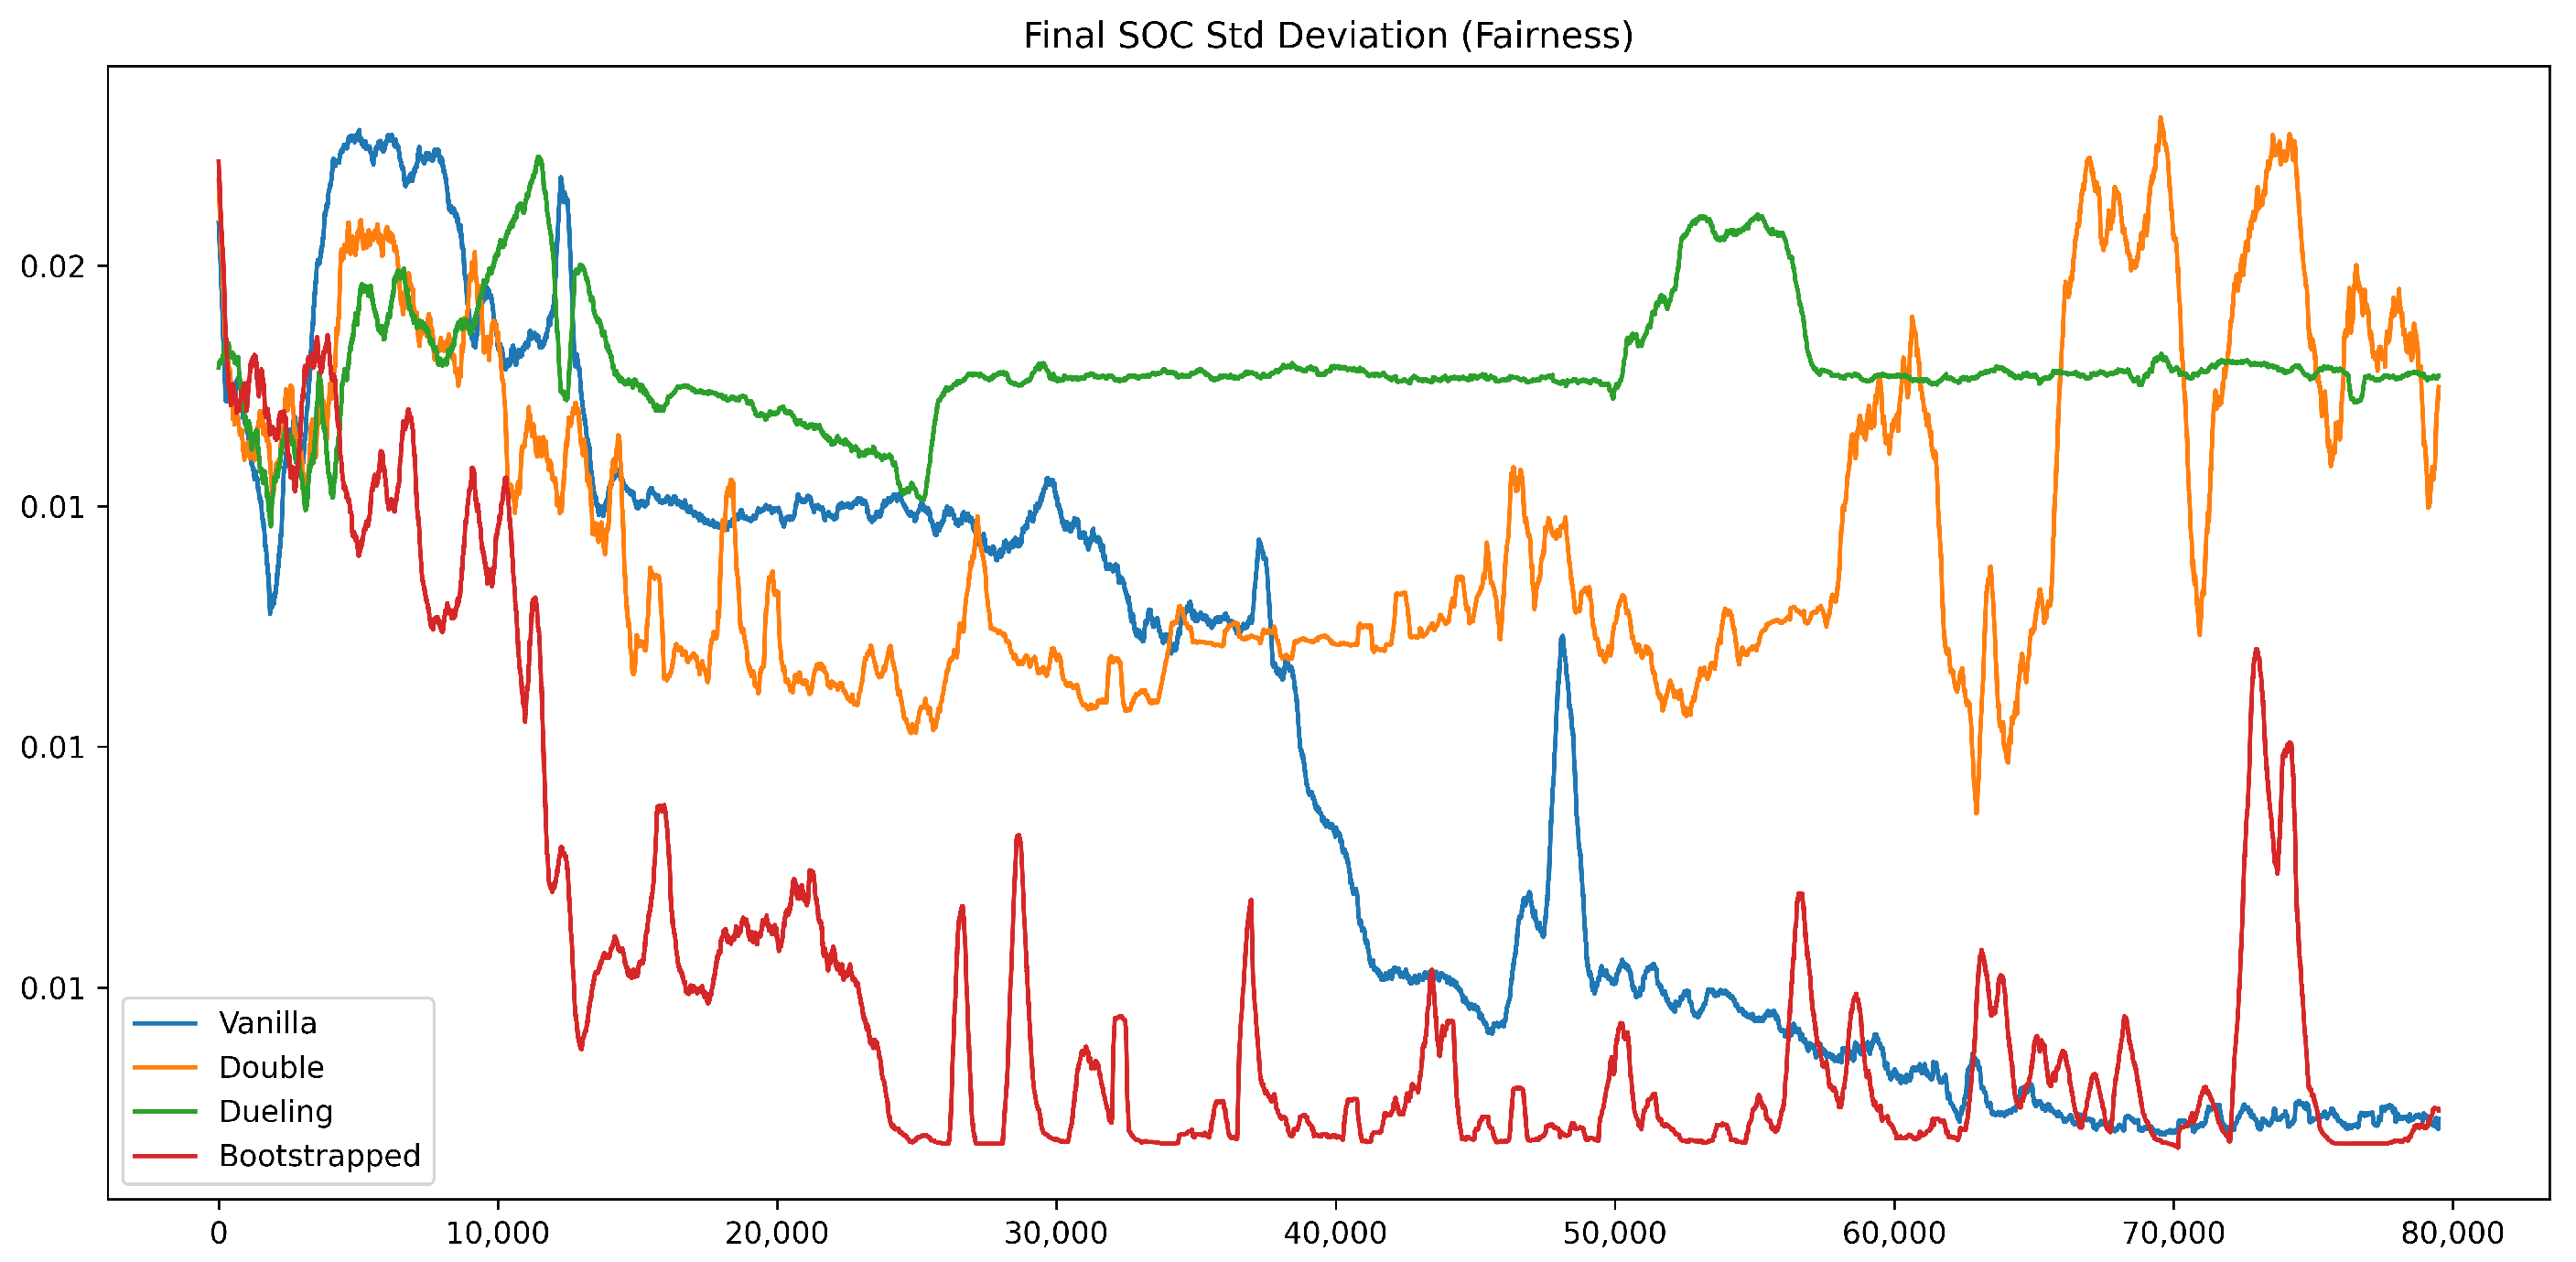
Figure 13 shows the convergence of the SOC standard deviation during training without reward shaping. The Bootstrapped DQN decreases rapidly and stabilizes around 0.008, reaching the lowest deviation among all algorithms. Vanilla DQN remains near 0.010 with mild fluctuations. Double DQN stays at the highest level between 0.021 and 0.025, showing strong volatility, whereas Dueling DQN stays relatively steady around 0.016 without further decline. Bootstrapped DQN still achieves the most balanced energy distribution among vehicles under this simplified training condition.
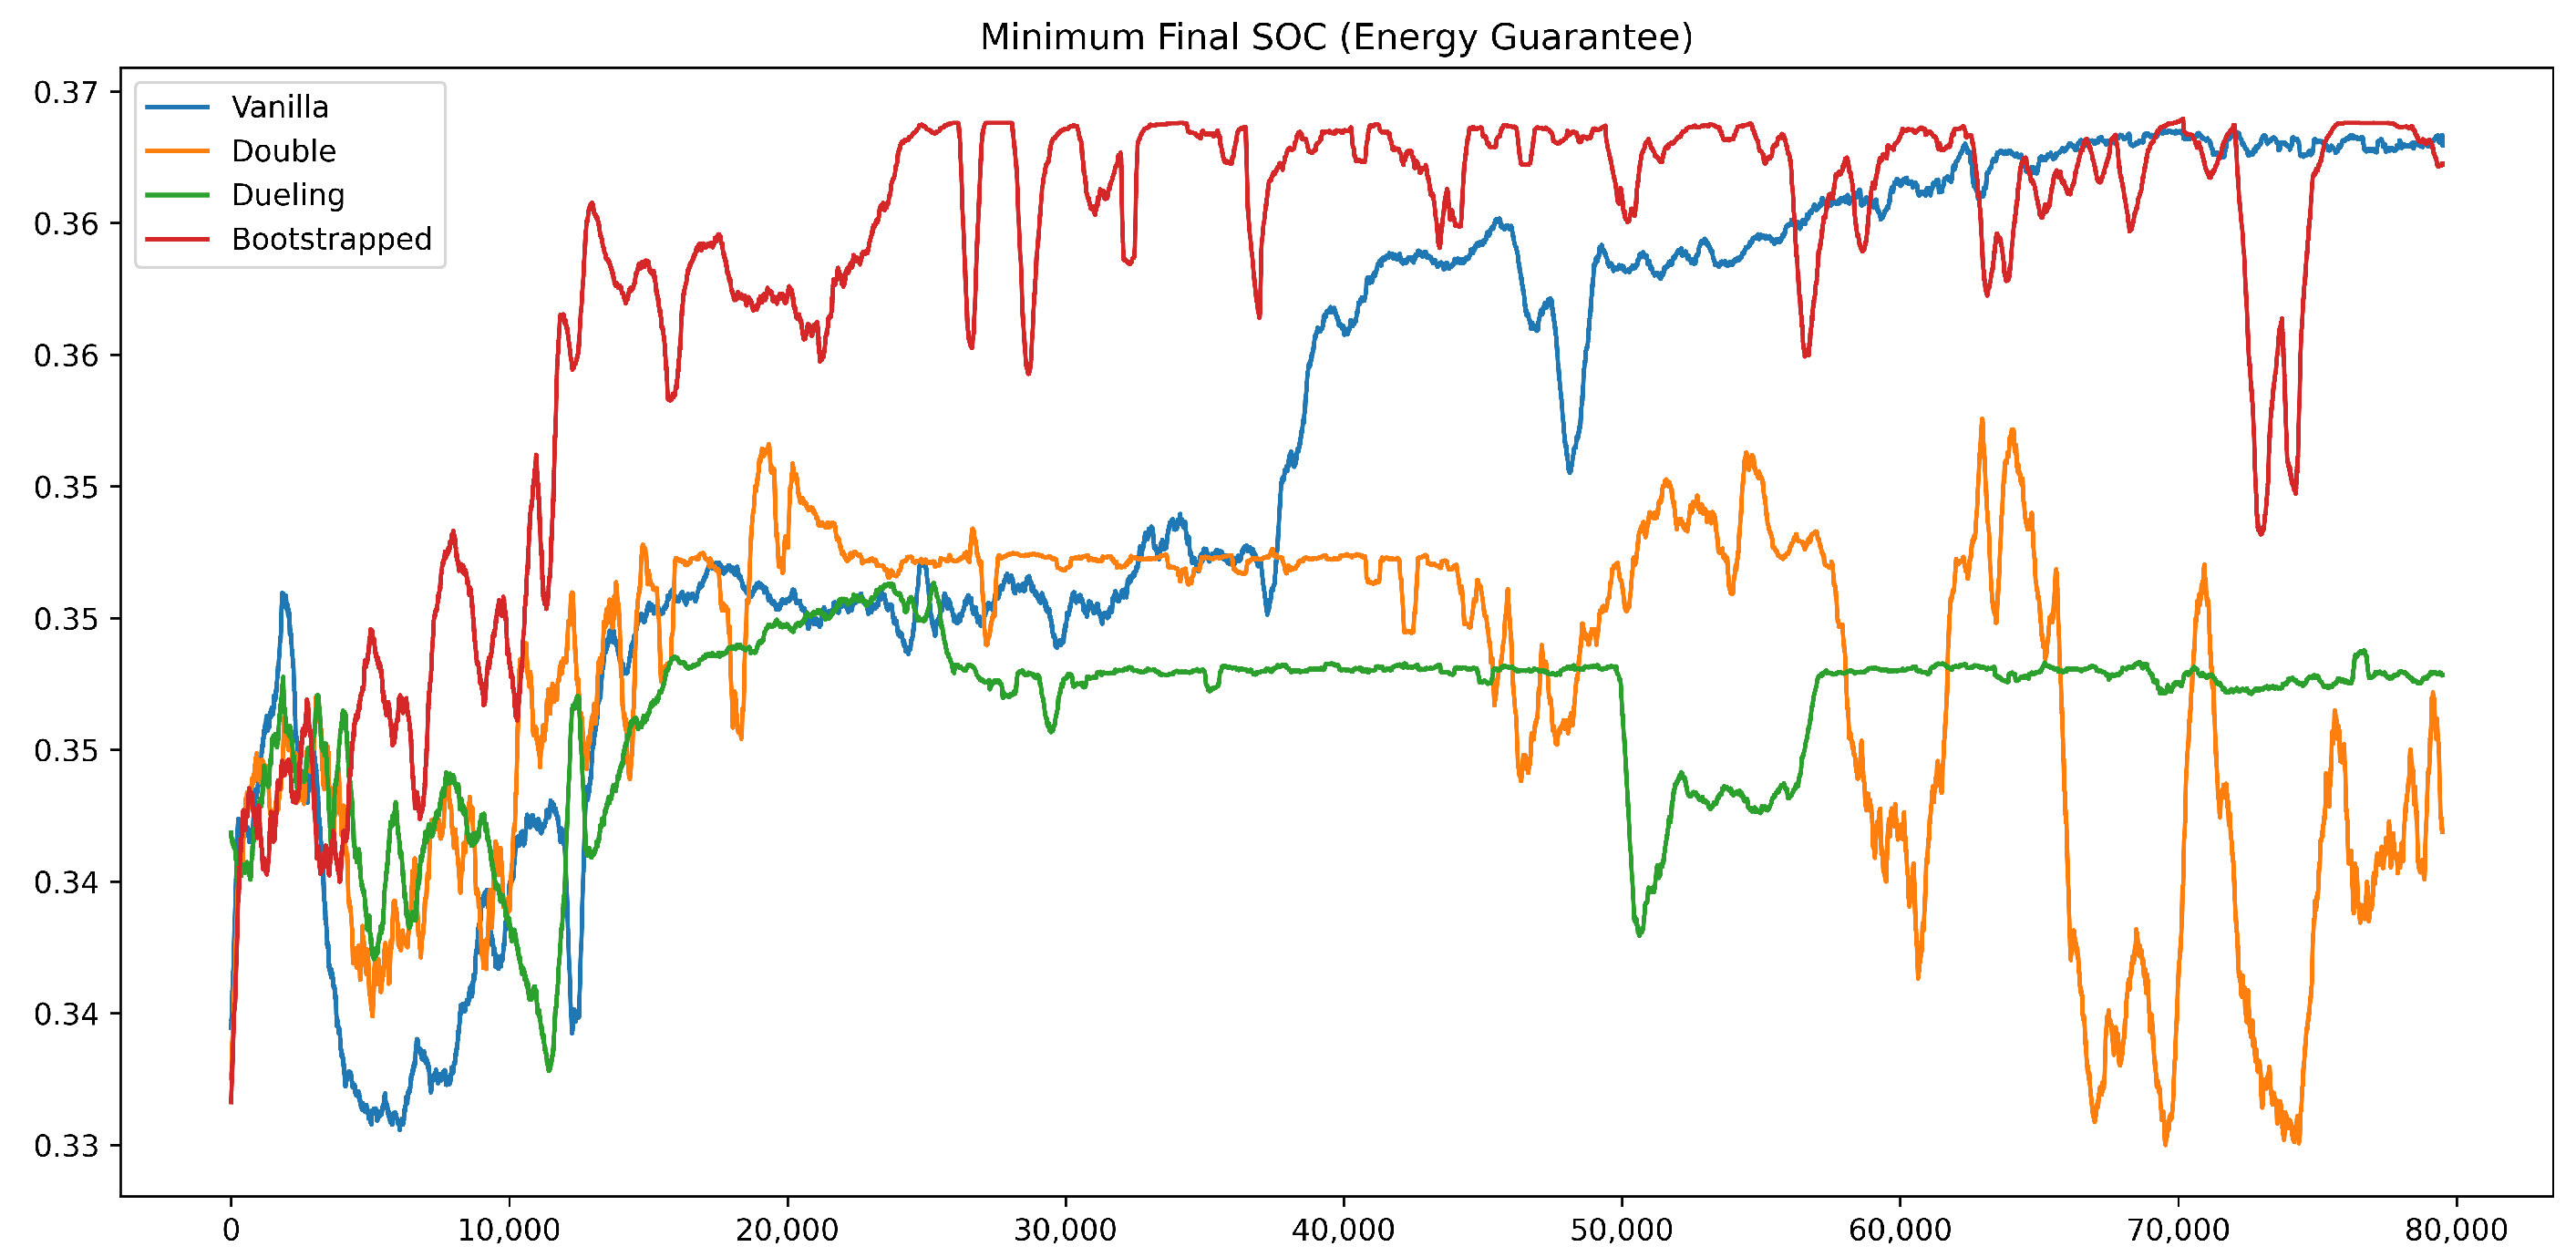
Figure 14 depicts the evolution of the minimum remaining SOC during training without reward shaping. The Bootstrapped DQN rises rapidly between 10,000 and 40,000 episodes and stabilizes around 0.365, maintaining the top trajectory throughout. Dueling DQN remains steady near 0.350, Vanilla DQN declines to about 0.330 before recovering, and Double DQN fluctuates heavily below 0.33. Throughout the training, Bootstrapped DQN maintains the highest and most stable minimum SOC among all approaches.
Figure 15 illustrates the evolution of the formation stability metric I during simulation training without reward shaping. Dueling DQN exhibits the most stable yet overly conservative behavior. Double DQN shows the highest instability, reflecting erratic decision making in the absence of explicit penalties. Bootstrapped DQN and Vanilla DQN maintain moderate stability levels, balancing steadiness and adaptability. These results demonstrate that Bootstrapped DQN preserves robust coordination performance even without reward guidance.
Based on the above analysis, the removal of reward shaping leads to clear degradation of fairness and energy guarantee across all methods, consistent with Theorem 2 in [18]. Nevertheless, Bootstrapped DQN retains comparatively stronger robustness, achieving higher remaining SOC and lower standard deviation than other algorithms, even though its performance is weaker than in the shaped setting. This robustness highlights its adaptability to sparse or poorly designed rewards and its potential for practical use in platoon control.

4.4. Convergence and Stability Analysis

The convergence behavior of the proposed Bootstrapped DQN framework is illustrated in Figure 6, Figure 7, Figure 8, Figure 9, Figure 10, Figure 11, Figure 12, Figure 13, Figure 14 and Figure 15. As shown in Figure 6 and Figure 7, Bootstrapped DQN rapidly converges to a high Q-value plateau of 12 and consistently maintains higher returns than the baseline algorithms, indicating fast and stable learning. Figure 8 and Figure 9 further show that the SOC standard deviation and the minimum remaining SOC converge to steady values of 0.005 and 0.36 after 10,000 and 20,000 episodes, respectively, revealing balanced energy consumption and reliable energy assurance across the fleet. Regarding formation stability, Figure 10 indicates that Bootstrapped DQN maintains a moderate instability level ( I = 0.13 ), achieving a desirable trade-off between robustness and flexibility.
To evaluate the influence of reward design, Figure 11, Figure 12, Figure 13, Figure 14 and Figure 15 present the results obtained without explicit reward shaping. Although convergence becomes slower in this ablation setting, Bootstrapped DQN still achieves the highest Q-values and returns, the lowest SOC deviation (0.008), and a moderate stability index ( I = 0.14 ), demonstrating that the proposed framework remains robust even under weaker reward guidance.

4.5. Numerical Results

We compare four DRL algorithms with a conventional SOC-ranking heuristic [18]. The results are reported in Table 6 for the main experiment and in Table 7 for the ablation study where penalty and reward terms are removed.
As shown in Table 6, Vanilla DQN and Double DQN show a limited improvement in fairness, while stability I values remain relatively high, indicating weaker scheduling robustness. Dueling DQN exhibits a relatively stable return trajectory, but this stability is achieved at the expense of fairness and minimum SOC, suggesting that energy guarantees are compromised. Bootstrapped DQN, in contrast, provides the most balanced trade-off. It achieves the lowest SOC deviation, thereby ensuring fairness across the fleet, while simultaneously maintaining the highest minimum SOC and moderate formation stability. Although its inference time is slightly longer than the other DRL algorithms, the difference remains negligible for practical applications. The SOC-ranking heuristic, serving as a theoretical benchmark, unsurprisingly achieves the lowest standard deviation by design. However, its extremely poor performance in terms of minimum SOC and stability highlights its impracticality for real-world platoon control. Overall, Bootstrapped DQN provides near-optimal fairness together with robustness and strong energy guarantees, demonstrating superior applicability in real-world EV platoon management.
As shown in Table 7, removing penalties and SOC-based ranking rewards leads to a noticeable degradation across all methods. Fairness deteriorates notably compared with the shaped setting, while the minimum SOC values also decrease, reflecting weaker energy guarantees. However, stability remains relatively unaffected. Among the four algorithms, the Bootstrapped DQN demonstrates the highest resilience, achieving the lowest SOC deviation, the highest minimum SOC, and moderate stability despite the absence of reward shaping. These results highlight that reward shaping terms effectively guide training. The Bootstrapped DQN demonstrates strong robustness and adaptability under sparse or poorly designed reward signals, making it a reliable option for real-world platoon scheduling where reward functions may be incomplete or difficult to design precisely.
5. Conclusions

This paper proposed a Bootstrapped DQN framework for energy-balanced coordination in electric vehicle platoons, formulating the re-sequencing task as a multi-objective optimization problem that simultaneously considers fairness, energy guarantee, and formation stability. The framework integrates multi-head exploration, value bootstrapping, and prioritized experience replay to enhance convergence efficiency and robustness. Simulation experiments conducted on a modeled Suzhou–Nanjing route demonstrated that the proposed method consistently outperforms Vanilla, Double, and Dueling DQN, achieving the lowest SOC deviation and the highest minimum SOC while maintaining moderate stability. Compared with the SOC-ranking heuristic, which ensures theoretical fairness but suffers from poor stability and energy assurance, Bootstrapped DQN achieves a more practical trade-off between fairness and applicability. Furthermore, ablation studies confirmed the effectiveness of reward shaping in improving fairness and stability, while highlighting the robustness of Bootstrapped DQN under sparse reward signals. The current framework has been evaluated under simplified conditions, considering a homogeneous five-vehicle platoon and assuming ideal communication without latency or packet loss. The present simulations do not incorporate complex real-world traffic dynamics such as congestion, cut-ins, or diverse driving behaviors, which could influence platoon coordination. Future work will extend the framework to heterogeneous and larger-scale platoons, integrate realistic traffic and communication conditions, and include comparative evaluations with other advanced reinforcement learning and heuristic algorithms such as A2C to further assess scalability and robustness.

Author Contributions

Conceptualization, B.Z. and S.G.; methodology, B.Z. and S.G.; software, B.Z.; validation, B.Z. and S.G.; writing—original draft preparation, B.Z. and S.G.; writing—review and editing, B.Z. and S.G.; supervision, S.G. All authors have read and agreed to the published version of the manuscript.

Funding

This work was supported by the Nanjing Overseas Scholars’ Science and Technology Innovation Program and the Natural Science Foundation of the Jiangsu Higher Education Institutions of China Program under Grant 25KJB120003, and thus the support is acknowledged.

Data Availability Statement

The datasets used and/or analyzed during the current study are available from the corresponding author upon reasonable request.

Conflicts of Interest

The authors declare no conflict of interest.

Nomenclature

t j Time instant when the lead vehicle passes the j-th re-sequencing checkpoint.
t f Time instant when the fleet reaches its destination.
σ ( s ( t f ) ) Standard deviation of final SOC values.
s ( t f )       SOC vector of all EVs at final time t f .
d j       Cumulative distance from the departure point to the j-th re-sequencing checkpoint.
P i j       Position of EV i during the j-th platooning phase.
P      Position matrix of platoon formations, P [ P i j ] .
δ       Baseline electricity usage rate per unit distance.
Λ       Maximum battery capacity.
s i ( t )       SOC of EV i at time t.
e P i j j       Electricity usage reduction rate of EV i at position P i j in phase j.
C      Electricity consumption matrix.
C i j j       Electricity consumption of EV i at position P i j in phase j.
π f       Final platoon formation.
I       Formation stability metric.

Appendix A

Algorithm A1 Dynamic Platoon Re-Sequencing Training Algorithm
1:
Step 1: Environment Initialization
2:
Input: Number of vehicles N, number of re-sequencing stages M, energy consumption matrix Δ , and reward parameters α , β , γ , ζ , λ .
3:
Generate action set A containing all N ! permutations and one SOC-ranking action.
4:
Define state space S = [ s 1 , , s N , l ] .
5:
Initialize s = [ 1 , , 1 ] , l = M , and initial formation π 0 .
6:
Step 2: Training and Policy Update Module
7:
for each episode do
8:
   Reset environment to initial state S 0 = [ s , l ] .
9:
   for each stage j = 1 , , M  do
10:
     Select action a j from policy π .
11:
     if  a j is SOC ranking action then
12:
        if  j = M  then
13:
          Apply SOC ranking (vehicles sorted by descending SOC).
14:
        else
15:
          Mark as illegal and replace with default permutation.
16:
          Apply penalty λ .
17:
        end if
18:
     else
19:
        Apply permutation π j corresponding to a j .
20:
     end if
21:
     Update SOC according to Δ and current formation.
22:
     Update state S j + 1 = [ s , l 1 ] .
23:
     if  j < M  then
24:
        Apply penalty if necessary.
25:
     else
26:
        Compute σ ( s ) , min ( s ) , and instability I .
27:
        Assign reward r j = α σ ( s ) + β min ( s ) γ I .
28:
        if final action is SOC ranking then
29:
          Add reward bonus ζ to r j .
30:
        end if
31:
        Add penalty if illegal SOC ranking was attempted earlier.
32:
     end if
33:
     Store transition ( S j , a j , r j , S j + 1 ) in replay buffer.
34:
   end for
35:
   Update policy and value networks using prioritized replay samples.
36:
end for
37:
Output: Optimized re-sequencing policy π * and cumulative reward R * .

References

  1. Luo, Q.; Li, J.; Zhang, H. Drag coefficient modeling of heterogeneous connected platooning vehicles via BP neural network and PSO algorithm. Neurocomputing 2022, 484, 117–127. [Google Scholar] [CrossRef]
  2. Li, K.; Wang, J.; Zheng, Y. Cooperative formation of autonomous vehicles in mixed traffic flow: Beyond platooning. IEEE Trans. Intell. Transp. Syst. 2022, 23, 15951–15966. [Google Scholar] [CrossRef]
  3. Fernandes, P.; Nunes, U. Multiplatooning leaders positioning and cooperative behavior algorithms of communicant automated vehicles for high traffic capacity. IEEE Trans. Intell. Transp. Syst. 2015, 16, 1172–1187. [Google Scholar] [CrossRef]
  4. Chen, S.; Hu, J.; Shi, Y.; Zhao, L.; Li, W. A vision of C-V2X: Technologies, field testing, and challenges with Chinese development. IEEE Internet Things J. 2020, 7, 3872–3881. [Google Scholar] [CrossRef]
  5. Hong, C.; Shan, H.; Song, M.; Zhuang, W.; Xiang, Z.; Wu, Y.; Yu, X. A joint design of platoon communication and control based on LTE-V2V. IEEE Trans. Veh. Technol. 2020, 69, 15893–15907. [Google Scholar] [CrossRef]
  6. Tsugawa, S.; Kato, S.; Aoki, K. An automated truck platoon for energy saving. In Proceedings of the 2011 IEEE/RSJ International Conference on Intelligent Robots and Systems (IROS), San Francisco, CA, USA, 25–30 September 2011; pp. 4109–4114. [Google Scholar] [CrossRef]
  7. Chang, Y.; Ren, Y.; Jiang, H.; Fu, D.; Cai, P.; Cui, Z.; Li, A.; Yu, H. Hierarchical adaptive cross-coupled control of traffic signals and vehicle routes in large-scale road network. Comput.-Aided Civ. Infrastruct. Eng. 2025. [Google Scholar] [CrossRef]
  8. Li, S.E.; Zheng, Y.; Li, K.; Wu, Y.; Hedrick, J.K.; Gao, F.; Zhang, H. Dynamical Modeling and Distributed Control of Connected and Automated Vehicles: Challenges and Opportunities. IEEE Intell. Transp. Syst. Mag. 2017, 9, 46–58. [Google Scholar] [CrossRef]
  9. Hua, M.; Chen, D.; Jiang, K.; Zhang, F.; Wang, J.; Wang, B.; Zhou, Q.; Xu, H. Communication-efficient MARL for Platoon Stability and Energy-Efficiency Co-Optimization in Cooperative Adaptive Cruise Control of CAVs. IEEE Trans. Veh. Technol. 2025, 74, 6076–6087. [Google Scholar] [CrossRef]
  10. Jia, D.; Lu, K.; Wang, J. A disturbance-adaptive design for VANET-enabled vehicle platoon. IEEE Trans. Veh. Technol. 2014, 63, 527–539. [Google Scholar] [CrossRef]
  11. Ma, F.; Yang, Y.; Wang, J.; Liu, Z.; Li, J.; Nie, J.; Shen, Y.; Wu, L. Predictive energy-saving optimization based on nonlinear model predictive control for cooperative connected vehicles platoon with V2V communication. Energy 2019, 189, 116120. [Google Scholar] [CrossRef]
  12. Lacombe, R.; Gros, S.; Murgovski, N.; Kulcsár, B. Distributed eco-driving control of a platoon of electric vehicles through Riccati recursion. IEEE Trans. Intell. Transp. Syst. 2023, 24, 3048–3063. [Google Scholar] [CrossRef]
  13. Guo, G.; Wang, Q. Fuel-efficient en route speed planning and tracking control of truck platoons. IEEE Trans. Intell. Transp. Syst. 2019, 20, 3091–3103. [Google Scholar] [CrossRef]
  14. Li, M.; Cao, Z.; Li, Z. A Reinforcement Learning-Based Vehicle Platoon Control Strategy for Reducing Energy Consumption in Traffic Oscillations. IEEE Trans. Neural Netw. Learn. Syst. 2021, 32, 5309–5322. [Google Scholar] [CrossRef] [PubMed]
  15. Prathiba, S.B.; Raja, G.; Dev, K.; Kumar, N.; Guizani, M. A Hybrid Deep Reinforcement Learning for Autonomous Vehicles Smart-Platooning. IEEE Trans. Veh. Technol. 2021, 70, 13340–13350. [Google Scholar] [CrossRef]
  16. Lee, W.J.; Kwag, S.I.; Ko, Y.D. The optimal eco-friendly platoon formation strategy for a heterogeneous fleet of vehicles. Transp. Res. Part D Transp. Environ. 2021, 90, 102664. [Google Scholar] [CrossRef]
  17. Bonnet, C.; Fritz, H. Fuel Consumption Reduction in a Platoon: Experimental Results with Two Electronically Coupled Trucks at Close Spacing; SAE Technical Paper 2000-01-3056; SAE International: Amsterdam, The Netherlands, 2000. [Google Scholar] [CrossRef]
  18. Guo, S.; Meng, X. Optimal resequencing of connected and autonomous electric vehicles in battery SOC-aware platooning. IEEE Trans. Transp. Electrif. 2025, 11, 9298–9305. [Google Scholar] [CrossRef]
  19. Zabat, M.; Stabile, N.; Farascaroli, S.; Browand, F. The Aerodynamic Performance of Platoons: A Final Report; Technical Report UCB-ITS-PRR-95-35, California PATH Research Report; University of California: Berkeley, CA, USA, 1995. [Google Scholar]
  20. Shladover, S.E.; Desoer, C.A.; Hedrick, J.K.; Tomizuka, M.; Walrand, J.; Zhang, W.B.; McMahon, D.H.; Peng, H.; Sheikholeslam, S.; McKeown, N. Automated vehicle control developments in the PATH program. IEEE Trans. Veh. Technol. 1991, 40, 114–130. [Google Scholar] [CrossRef]
  21. Zhang, M.; Wang, C.; Zhao, W.; Liu, J.; Zhang, Z. A Multi-Vehicle Self-Organized Cooperative Control Strategy for Platoon Formation in Connected Environment. IEEE Trans. Intell. Transp. Syst. 2025, 26, 4002–4018. [Google Scholar] [CrossRef]
  22. Srisomboon, I.; Lee, S. A Sequence Change Algorithm in Vehicle Platooning for Longer Driving Range. In Proceedings of the 2021 International Conference on Information Networking (ICOIN), Jeju Island, Republic of Korea, 13–16 January 2021; pp. 24–27. [Google Scholar] [CrossRef]
  23. Liu, M.; Peng, C.; Guo, S.; Xiao, L.; Shi, B.; Peng, Y. Optimal re-sequencing of electric vehicle platoons based on deep reinforcement learning. In Proceedings of the 2024 IEEE International Conference on Systems, Man, and Cybernetics, Kuching, Malaysia, 6–10 October 2024; pp. 4250–4255. [Google Scholar] [CrossRef]
  24. Guo, S.; Meng, X.; Farasat, M. Energy Efficient and Battery SOC-Aware Coordinated Control of Connected and Autonomous Electric Vehicles. In Proceedings of the 2022 American Control Conference (ACC), Atlanta, GA, USA, 8–10 June 2022; pp. 4707–4712. [Google Scholar] [CrossRef]
  25. He, L.; Mo, H.; Zhang, Y.; Wu, L.; Tang, J. Adaptive energy management strategy for extended range electric vehicles under complex road conditions based on RF-IGWO and MGO algorithms. Energy 2025, 328, 136500. [Google Scholar] [CrossRef]
  26. Lu, X.Y.; Shladover, S.E. Automated truck platoon control and field test. In Road Vehicle Automation; Springer: Berlin/Heidelberg, Germany, 2014; pp. 247–261. [Google Scholar] [CrossRef]
  27. Osband, I.; Blundell, C.; Pritzel, A.; Van Roy, B. Deep exploration via bootstrapped DQN. In Proceedings of the 30th International Conference on Neural Information Processing Systems (NeurIPS), Barcelona, Spain, 5–10 December 2016; pp. 4033–4041. [Google Scholar]
  28. Mnih, V.; Kavukcuoglu, K.; Silver, D.; Graves, A.; Antonoglou, I.; Wierstra, D.; Riedmiller, M. Playing Atari with deep reinforcement learning. arXiv 2013, arXiv:1312.5602. [Google Scholar] [CrossRef]
  29. Mnih, V.; Kavukcuoglu, K.; Silver, D.; Rusu, A.A.; Veness, J.; Bellemare, M.G.; Graves, A.; Riedmiller, M.; Fidjeland, A.K.; Ostrovski, G.; et al. Human-level control through deep reinforcement learning. Nature 2015, 518, 529–533. [Google Scholar] [CrossRef] [PubMed]
  30. van Hasselt, H.; Guez, A.; Silver, D. Deep reinforcement learning with double Q-learning. In Proceedings of the 30th AAAI Conference on Artificial Intelligence, Phoenix, AZ, USA, 12–17 February 2016; pp. 2094–2100. [Google Scholar] [CrossRef]
  31. Wang, Z.; Schaul, T.; Hessel, M.; van Hasselt, H.; Lanctot, M.; de Freitas, N. Dueling network architectures for deep reinforcement learning. In Proceedings of the 33rd International Conference on Machine Learning, New York, NY, USA, 19–24 June 2016; pp. 1995–2003. [Google Scholar]
Figure 1. Platoon route from Suzhou to Nanjing.
Electronics 14 04417 g001
Figure 2. Sensitivity analysis of heads.
Electronics 14 04417 g002
Figure 3. Sensitivity of α (log scale).
Electronics 14 04417 g003
Figure 4. Sensitivity analysis of parameter β (log scale).
Electronics 14 04417 g004
Figure 5. Sensitivity analysis of parameter γ p .
Electronics 14 04417 g005
Figure 6. Q-value trajectories during training.
Electronics 14 04417 g006
Figure 7. Average return over training episodes.
Electronics 14 04417 g007
Figure 8. Final standard deviation of SOC across the fleet.
Electronics 14 04417 g008
Figure 9. Minimum remaining SOC observed per episode.
Electronics 14 04417 g009
Figure 10. Average stability during training.
Electronics 14 04417 g010
Figure 11. Q-value trajectories without reward shaping.
Electronics 14 04417 g011
Figure 12. Average return without reward shaping.
Electronics 14 04417 g012
Figure 13. Final standard deviation of SOC without reward shaping.
Electronics 14 04417 g013
Figure 14. Minimum remaining SOC without reward shaping.
Electronics 14 04417 g014
Figure 15. Average stability without reward shaping.
Electronics 14 04417 g015
Table 1. System and Reward Parameters.
ParameterValue
Hidden dimension128
Learning episodes80,000
Replay buffer size50,000
Discount factor0.98
Learning rate0.002
Exploration rate0.01
Batch size128
Minimum sample size1000
Soft update factor0.01 → 0.005 → 0.001
Smoothing factor0.005
Priority replay factor0.6
Prioritized replay (init/incr)0.4/ 1 × 10 5
Mask probability (PER)0.8
Number of heads (Bootstrapped DQN)5
Fairness weight α 500
Remaining SOC reward β 30
Instability penalty γ 30
SOC ranking bonus ζ 3
Illegal action penalty λ 5
Table 2. Sensitivity analysis of the number of bootstrap heads ( N head ).
N head σ ( SOC ) min ( SOC ) I
10.016550.3490.08
30.013970.3510.16
50.010530.3560.09
70.018850.3410.34
150.019320.3360.25
Table 3. Sensitivity analysis of the fairness weight α .
α σ (SOC)
1000.02145
2000.02052
3500.01840
6500.01707
8000.01617
Table 4. Sensitivity analysis of the energy assurance weight β .
β Min SOC
150.342
250.346
450.346
600.348
650.350
Table 5. Sensitivity analysis of the stability weight γ (log scale).
γ I
00.49
150.37
250.35
400.18
550.16
Table 6. Comparison of DRL algorithms and SOC ranking heuristic.
Algo σ ( R ) σ ( s ) I Min SOCTime (s)
Vanilla DQN4.82880.009860.12150.35630.00056
Double DQN4.71250.014630.15260.34740.00039
Dueling DQN3.07400.017900.056580.34650.00076
Bootstrapped DQN5.05940.005240.12720.36320.00112
SOC RankingN/A0.004661.80000.28360.00026
Table 7. Performance in the ablation experiment.
Algo σ ( R ) σ ( s ) I Min SOCTime (s)
Vanilla DQN3.90720.019850.0057870.33820.00077
Double DQN4.89070.017360.015700.34220.00073
Dueling DQN3.24190.016350.0055790.34750.00099
Bootstrapped DQN5.21010.008460.14040.00145
Disclaimer/Publisher’s Note: The statements, opinions and data contained in all publications are solely those of the individual author(s) and contributor(s) and not of MDPI and/or the editor(s). MDPI and/or the editor(s) disclaim responsibility for any injury to people or property resulting from any ideas, methods, instructions or products referred to in the content.