1. Introduction
With the rapid development of 5G technology, especially the widespread application of high-frequency 5G bands, 5G cellular networks are being deployed globally. High-frequency transmission significantly enhances the data transfer rates, meeting the increasing demands of users, while also supporting large-scale device connectivity and low-latency communication [
1,
2]. This technology has been widely applied in high-speed internet access, internet of things (IoT) device connectivity, and the realization of emerging technologies such as smart cities and autonomous driving [
3,
4,
5].
However, high-frequency 5G bands face significant challenges, such as severe path loss and insufficient coverage, which may limit their application in complex environments [
6,
7]. To address these issues, flexible antenna technology, particularly pinching-antennas based on dielectric waveguides, has gradually become an important technology for enhancing 5G network performance. Pinching-antennas are realized by applying small dielectric particles along the waveguide, which allows dynamic alteration of the signal propagation path, thereby improving signal transmission efficiency [
8,
9,
10]. Due to their flexible installation and low cost, pinching-antennas effectively compensate for the limitations of traditional antennas in high-frequency transmission, and thus attract much attention in their application in complex scenarios such as wireless sensor networks and urban dense environments that require efficient signal transmission [
11,
12]. In addition, to further extend network coverage and address the challenges posed by high-frequency transmission, a relay station (RS) is introduced at the edge of the base station (BS) coverage. The inclusion of the RS not only effectively extends the communication distance but also significantly enhances the coverage of the 5G network, ensuring stable signal transmission, especially in complex environments.
In the performance analysis of the communication networks, Poisson point process (PPP) is used as a tool to model the spatial distribution of nodes in large-scale networks, helping to describe the spatial distribution of all devices [
13]. In wireless communication, multipath fading channels are caused by signals encountering reflectors or obstacles during propagation [
14]. The Nakagami-
m fading model is a commonly used and typical model for describing multipath fading channels, suitable for modeling signal attenuation in 5G high-frequency transmission links and dielectric waveguide links [
15]. In complex environments and multi-hop transmission scenarios, stochastic network calculus (SNC) serves as an effective analytical method, which is particularly important. By considering service capabilities, traffic arrivals, and other factors, SNC provides a statistical delay analysis framework for the system, thus offering theoretical support for network optimization [
16].
Considering the complexity of 5G networks, particularly in multi-hop transmission processes between high-frequency transmission links and dielectric waveguide links, accurately analyzing the end-to-end delay for a two-hop link becomes crucial. To effectively evaluate network latency, time-division multiple-access (TDMA) technology is widely used for resource allocation [
17]. By dividing the available bandwidth into time slots and assigning them to different user equipments (UEs), TDMA ensures that multiple users can share the same channel and avoid interference [
18]. Combined with pinching-antennas, the system can dynamically adjust the signal propagation path based on network load, further reducing communication delays. However, the application of pinching antennas in 5G communication is still in its early stages [
19]. The existing studies mainly focused on single-hop, fixed-node deployment scenarios [
9,
19], with limited systematic research on their application in multi-hop links. Most of these studies innovatively applied pinching-antennas in various scenarios, but limited attention has been given to their impact on delay performance. In contrast, we introduce pinching-antennas for delay performance analysis and systematically studies their end-to-end delay performance in 5G cellular networks, particularly in the context of multi-hop links. Therefore, the contribution of this paper lies in filling this research gap, providing valuable performance analysis for the deployment of pinching-antennas in complex network architectures, offering significant practical implications.
As far as we know, few works have analyzed the delay performance of pinching-antennas in 5G cellular networks. The main contributions of this paper are as follows:
We propose a pinching-antenna-assisted 5G cellular network model, which effectively extends the communication range by introducing an RS at the edge of the BS coverage area.
We construct a two-hop transmission model with 5G high-frequency transmission links and dielectric waveguide links, and derive the statistical characteristics of the service processes for the two-hop transmission links.
We apply SNC to derive the end-to-end delay, and evaluate the network performance through comprehensive delay analysis.
These contributions provide theoretical support for performance optimization in 5G cellular networks and offer practical solutions for signal transmission issues in high-interference and large-scale areas, enhancing the network performance and stability.
The paper is organized as follows.
Section 2 describes the system model.
Section 3 details the mathematical preliminaries. In
Section 4, delay analysis is presented. The numerical results are presented in
Section 5. Finally,
Section 6 concludes this work.
2. System Model
In this work, we focus on the end-to-end data transmission of a pinching-antenna-assisted 5G cellular network. To avoid the severe path loss of high-frequency 5G bands and ensure high coverage of 5G BSs, we adopt a 5G RS at the edge of BSs’ coverage to prolong the effective communication distance. The RS is equipped with a pinching antenna, which is realized by applying small dielectric particles on a waveguide. The desired signals of UEs located within the RS’s coverage can be transmitted through the outside of the pinching location, which is deployed right next to UEs, as in
Figure 1. The flexible installation and low cost (dielectric waveguide) of pinching antennas compensate for the inherent vice of 5G high-frequency transmission, i.e., low coverage and high cost (dense deployment and large transmission power).
In such network, we assume that all BSs are modeled as a homogeneous PPP
. To enhance the end-to-end performance of UE transmission, the RS need to access to the BS
which provides the best link quality. Without loss of generality, this BS is referred to as the nearest one of the RS. Denoting the distance between the RS and
as a random variable
R, the probability distribution function (PDF) is given as
. Upon receiving the signals from
, the RS will relay them to its serving UEs via a TDMA manner. Pinching-antenna-assisted RS’s coverage area is assumed to be a square with side length
D in the
plane, and
M UEs are uniformly distributed within it. The waveguide is assumed to be placed parallel to the
x-axis with the height of
d, as in
Figure 1. The perfect channel state information is assumed to be known since it is crucial for pinch positioning.
Obviously, end-to-end data transmission appears a two-hop link, i.e., BS-RS-UE. For the first stage, the 5G link between
and the RS is assumed to follow the Nakagami-
m fading, of which the channel gain
is a Gamma random variable with PDF
. Thus, the signal-to-noise ratio (SNR)
and data rate
are
where
and
are the transmitting power and bandwidth of
, and
is the noise power.
For the second stage, i.e., the RS-UE transmission process, we focus on a typical randomly located UE
, of which the location is denoted by
. For dielectric waveguide,
’s corresponding pinching antenna can be easily deployed next to it. For notation simplicity, we denote the location of this corresponding pinching antenna as
. The small-scale fading coefficient
is also assumed to follow Nakagami-
m fading. Thus, the SNR and data rate of the RS-UE link are given by
where
and
are the transmission power and bandwidth of the RS, respectively.
is due to the use of TDMA.
In this work, we focus on the two-hop downlink data transmission across the typical UE , its corresponding RS and the nearest BS . The end-to-end delay performance of this process will be evaluated via SNC, which will be briefly introduced in the following section.
3. Mathematical Preliminaries
The two-hop transmission process introduced previously appears as a two-hop tandem queue. To characterize the nature of this kind of queue, i.e., the output of the first queue is the input of the second queue, we will apply SNC in the SNR domain in this work. In bit domain SNC, the three main components of any queue are cumulative arrival, service and departure processes. During any duration , with the unit being milliseconds (ms), we denote them as , and , respectively, where , and are the incremental processes. Obviously, in Equations (2) and (4) are service incremental processes of wireless channels.
However, the logarithmic operators make it difficult to express the statistical characteristics of the service incremental process in a closed-form. Thus, we transform these bit-domain processes into the SNR domain, and we have
. This transformation makes performance bounds analysis tractable through the Chernoff’s inequality, i.e.,
, where
x and free parameter
are positive variables and
is the Mellin transform of any nonnegative bivariate stochastic process
. To fully utilize this inequality,
algebra is adopted in SNC in the SNR domain. For any two random variables
and
in the SNR domain, convolution and deconvolution operators are defined as [
20]
where
u represents a random value within the arbitrary time period
, with the unit being milliseconds (ms), ⊗ and ⊘ represent the
convolution and deconvolution operators, respectively.
These two operators help make the end-to-end performance analysis tractable for queue analysis. For
, their Mellin transforms are bounded in [
20] by
With the above intermediate information and the dynamic server property of SNC, the departure process can be lower bounded by
. By comparing the cumulative arrival and departure processes, the queuing performance is bounded by
The main reason we adopt SNC approach in this work is that the concatenation property of SNC makes it easy to calculate the performance of tandem queues. Specifically, for our two-stage tandem queue, the equivalent service capability can be bounded by the convolution of two original processes as . The end-to-end delay analyzed via SNC in the SNR domain can be given in the following lemma.
Lemma 1.
The end-to-end delay of our two-stage BS-RS-UE transmission is upper bounded by Proof. With the concatenation property of SNC, we have
where step (a) is give by Equation (
6) and (b) follows from the rule of the sum of geometric series. Since the Mellin transform is bounded by Equation (
9), we proceed to derive the delay bound.
It is noteworthy that the result in Equation (
9) is based on an optimized
θ. The calculation for sum operator of geometric series need to satisfy the stability condition that
,
and
. □
It is observed from Lemma 1 that the end-to-end delay of a two-stage tandem queue depends on the Mellin transforms of arrival and two service incremental processes. In this work, we consider a Poisson arrival process with an average of
. It can be equivalently characterized in the SNR domain as
Then, the focus of this article is the quantization and derivation of the Mellin transforms of two service processes, which will be given in the following section.
4. Delay Analysis
In this section, we proceed to quantify the service capability of both BS-RS link and RS-UE link. Since our delay performance is a so-called “steady-state” queue metric, we need to take all random variables into consideration, including randomly spatial distribution and dynamic channel characteristics. Now, we first investigate the capture of BS-RS link.
4.1. The Service Capability of BS-RS Link
Equation (
2) provides the instantaneous service rate of BS-RS link in bit domain. For further analysis, we need to transform it into SNR domain. We have
With the definition of Mellin transform, the Mellin transform of
is
According to Equation (
13), the priority among priorities is the derivation of
. To calculate this PDF, we need to capture the cumulative distribution function (CDF)
first. The main results are provided in the following lemma.
Lemma 2.
The CDF and PDF of are Proof.
where
. The PDF can be calculated by differentiating the CDF and we have
which completes the proof. □
Since the statistical characteristics of has been provided in Lemma 2, the service capability of BS-RS link is given in the following lemma.
Lemma 3.
The Mellin transform of can be derived directly by inserting in Equation (14) into Equation (13). With the intermediate result shown in Lemma 3, we still have to capture the Mellin transform of according to Lemma 1, which will be presented in the next subsection.
4.2. The Service Capability of the RS-UE Link
Similarly to the Mellin transform given by Equation (
13), the Mellin transform of
is
Still, we focus on the CDF and PDF of . The main difference between the BS-RS and RS-UE link characteristics is the spatial distribution. In the former one, the BSs follows the PPP distribution, while in the latter one, the UEs are located randomly in a square. Take this into consideration, we can easily obtain the following results.
Lemma 4.
The CDF and PDF of are Proof. Based on the definition of CDF, we have
where in the last step, we utilize the Gauss–Chebyshev quadrature.
,
, and the PDF
can be calculated by differentiating
as
which completes the proof. □
Thus, the service capability of RS-UE link is given in the following lemma.
Lemma 5.
The Mellin transform of can be derived directly by inserting in Equation (18) into Equation (17). 4.3. Delay Analysis of the End-to-End BS-RS-UE Transmission
For our pinching-antenna-assisted cellular network, the Mellin transforms of arrival process (Equation (
11)) and two service processes (Lemmas 3 and 5) have been calculated. These transforms reveal the statistical characteristics of the queue parameters. Since all analysis focuses on a typical UE, which is randomly distributed within the coverage area of a pinching-antenna-assisted RS, we take all stochastic variables into consideration, including random spatial distribution and dynamic channel status. For certain UEs with known locations, the Mellin transform can be analyzed similarly without considering the distance distribution.
According to the concatenation property of SNC, the end-to-end delay upper bound is provided in the following theorem.
Theorem 1.
The delay upper bound of the BS-RS-UE transmission is given by Lemma 1, where is given by Equation (11), is provided in Lemma 3, and is presented by Lemma 5. The delay upper bound of our two-stage BS-RS-UE transmission has been provided in Theorem 1. The result is derived for a typical UE, which also represents the average performance of all UEs in the network. The delay upper bound provides insights for the network deployment, traffic control and resource allocation for our pinching-antenna-assisted cellular networks under certain delay requirements.
5. Numerical Results
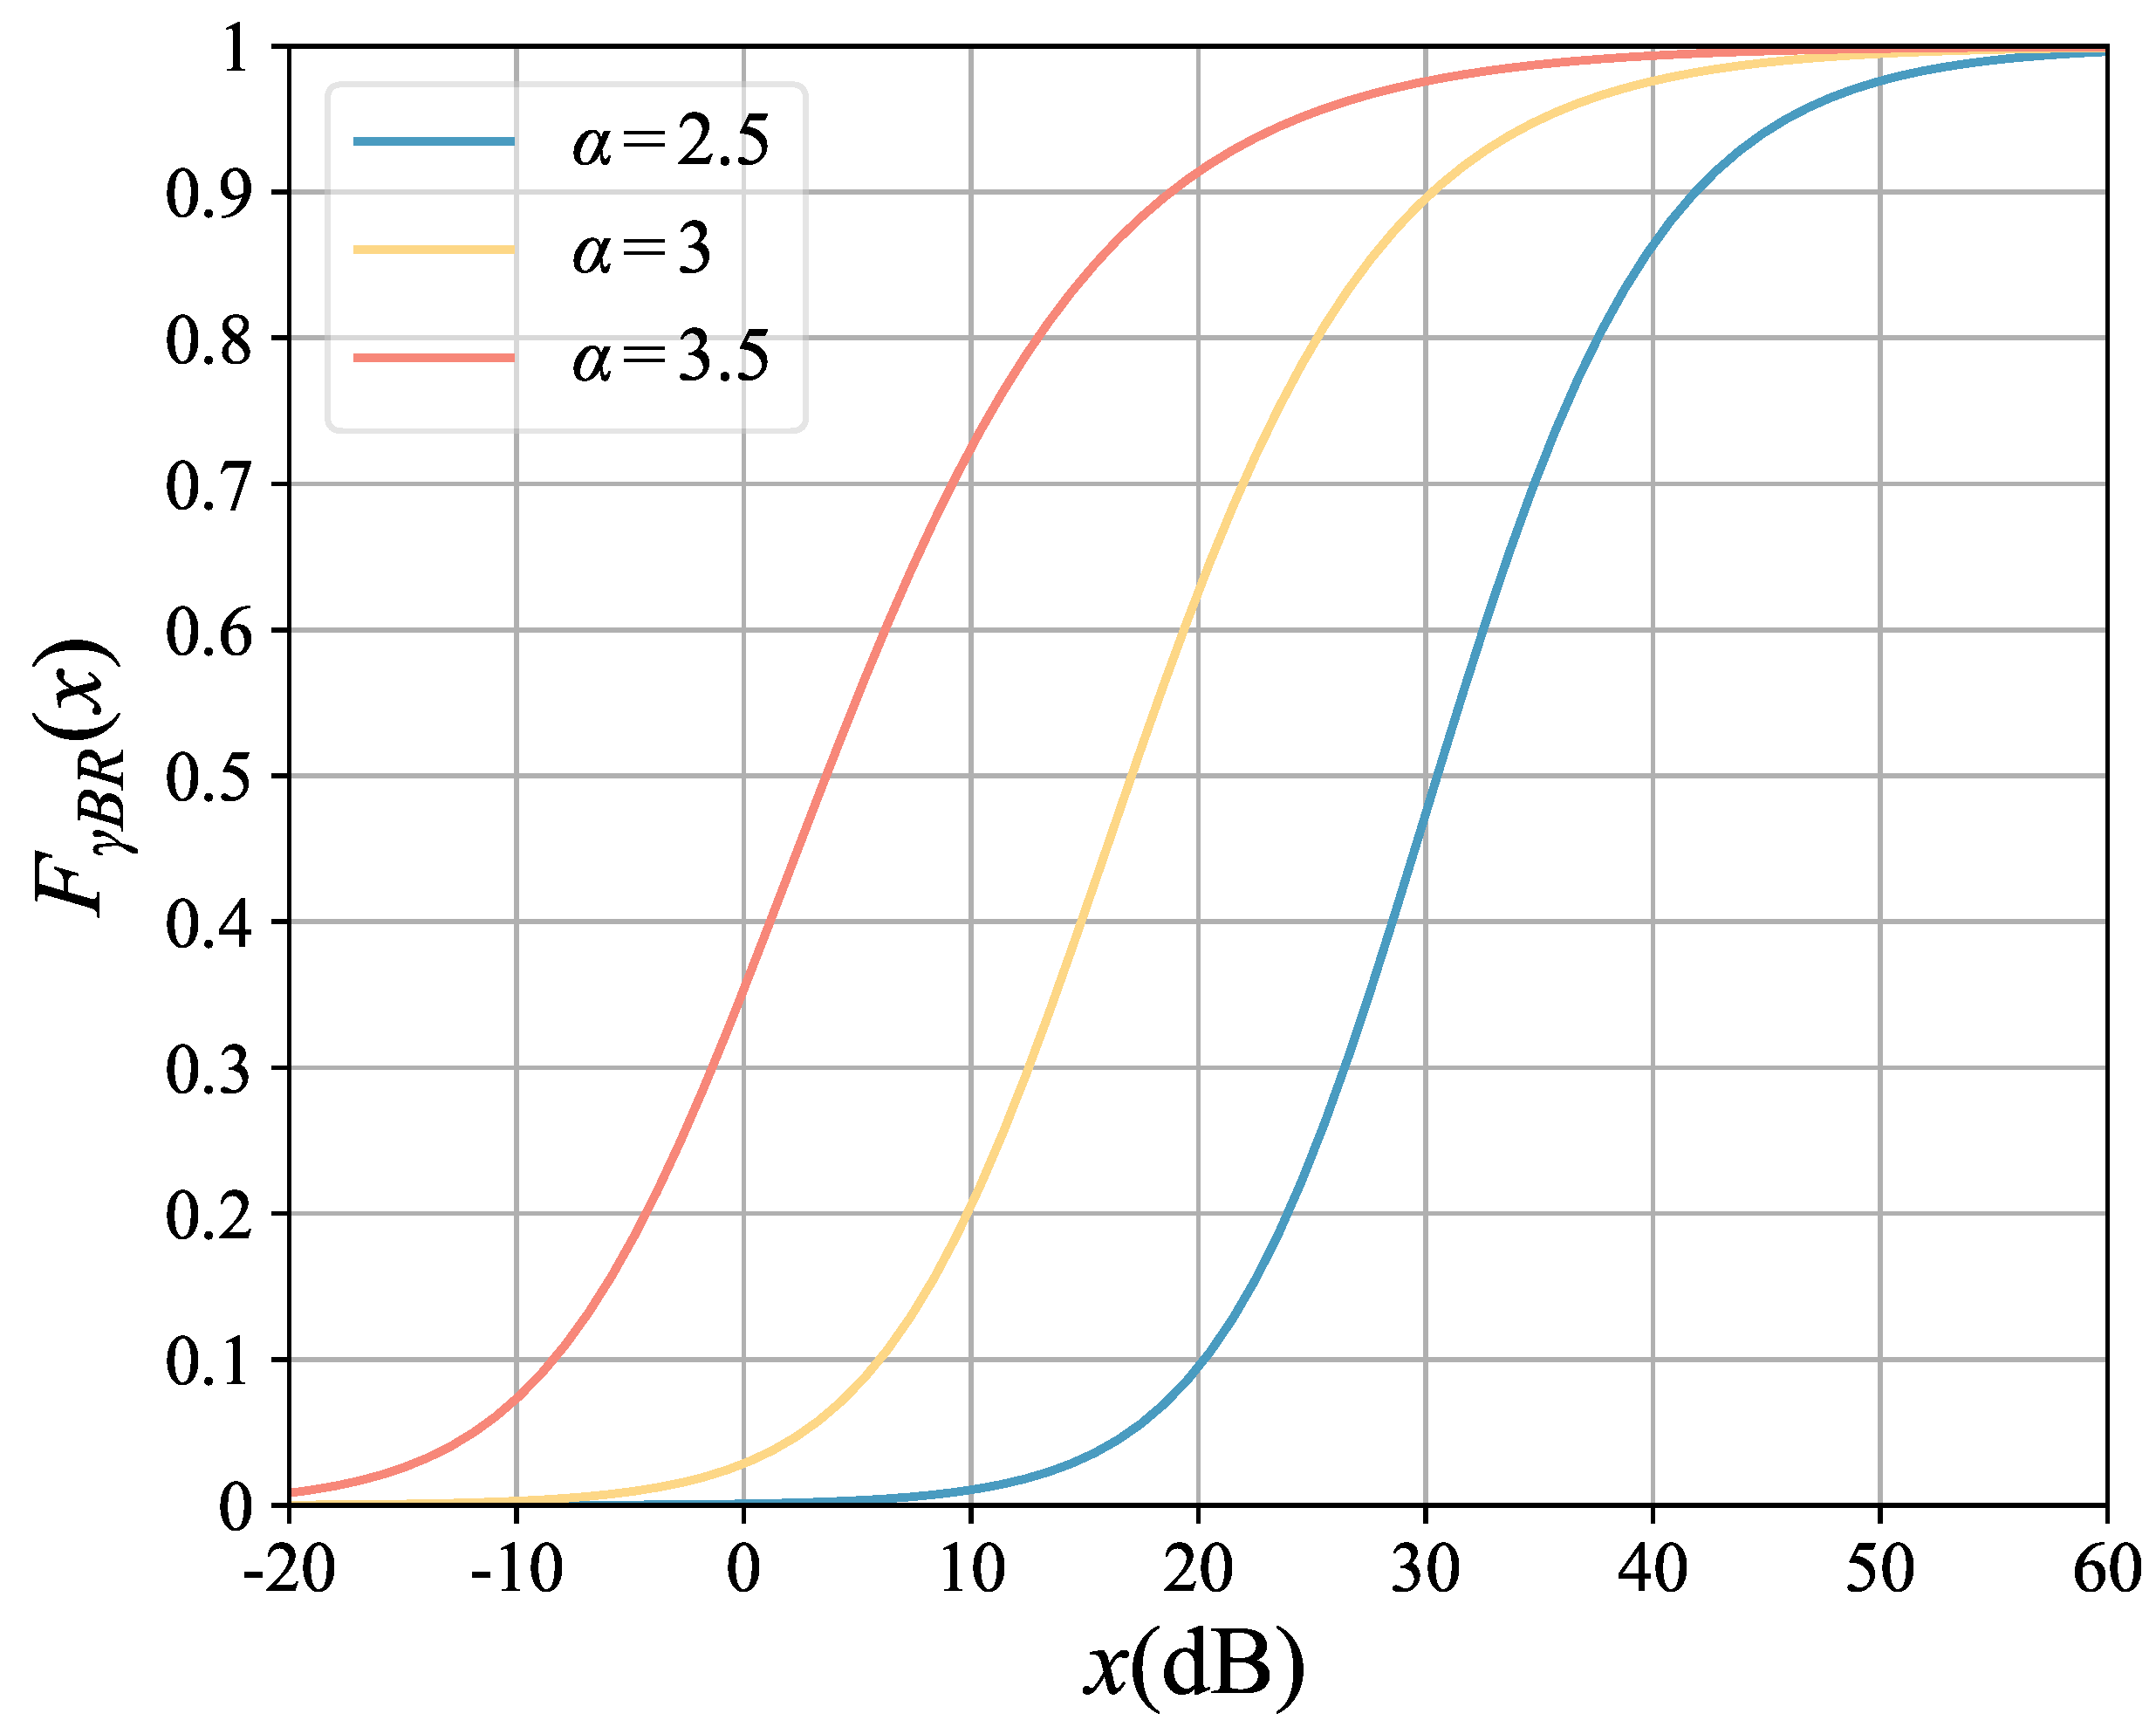
The numerical results of the derived upper bound will be presented in this section to evaluate the impact of various network parameters on the performance bound. The main parameters are given in the title of
Figure 2 on the top of this page.
In
Figure 2 and
Figure 3, we plot the CDF
and
for the network, which are provided in Lemmas 2 and 4. In
Figure 2, we observe that the CDF appears the increasing function of
x. It is reasonable due to the essential property of CDF. Furthermore, we observe that as the value of path loss exponent
increases, the CDF value enlarges. To express this phenomena, we adopt a metric, i.e., coverage probability, which can be written as
. A larger
indicates a severer path loss and more terrible performance, which lowers the network coverage. With the relationship of CDF and coverage, it enlarges the value of the CDF.
In
Figure 3, at the top of this page, we mainly test the impact of square size on the CDF of the RS-UE link. Still, we adopt the coverage metric to illustrate the impact for this figure. A larger area means a longer average communication distance for the RS-UE link. This will lower the network coverage and result in a larger value of CDF.
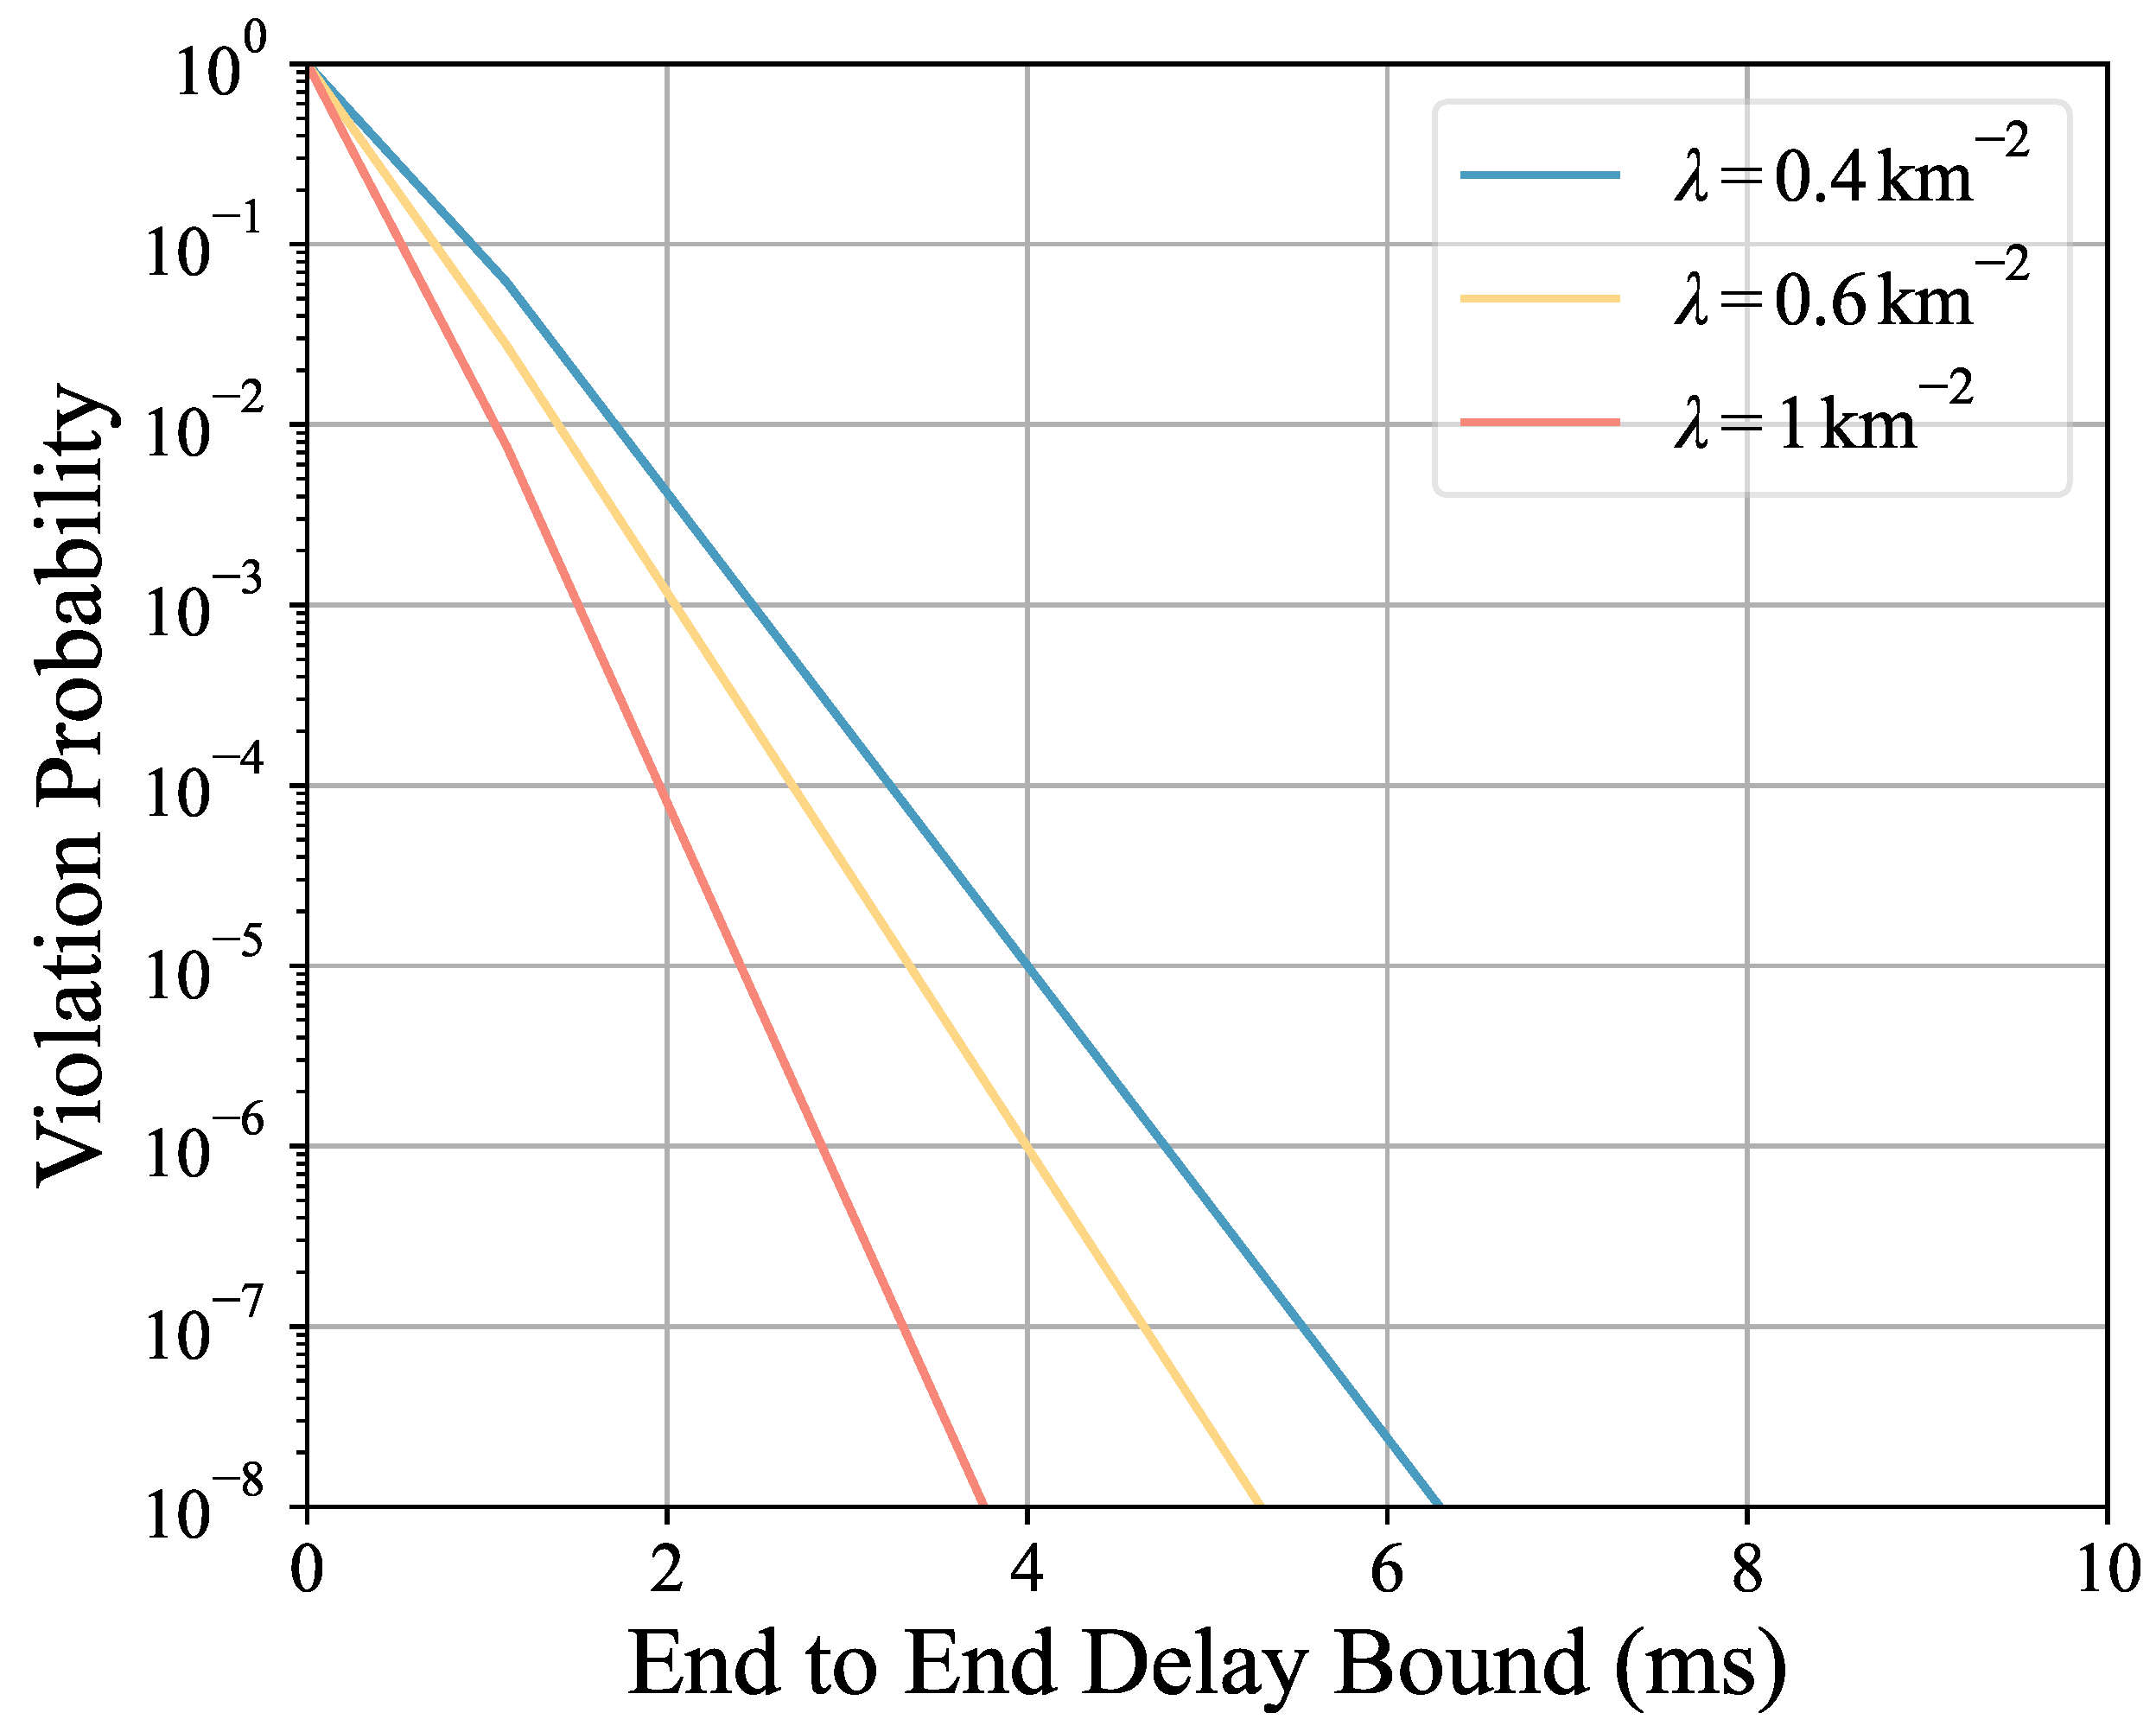
The delay bound is provided in
Figure 4. First, we observe that the delay bound is a decreasing function of violation probability. It is obvious since for a dynamic delay, a higher violation constraint means the delay bound has less chance to envelop the real delay. Thus, it results in a higher delay bound. The difference of
just affects the BS-RS link. Larger
indicates a shorter average communication distance between the BS and RS, and a better link quality. This will result in a lower delay bound.
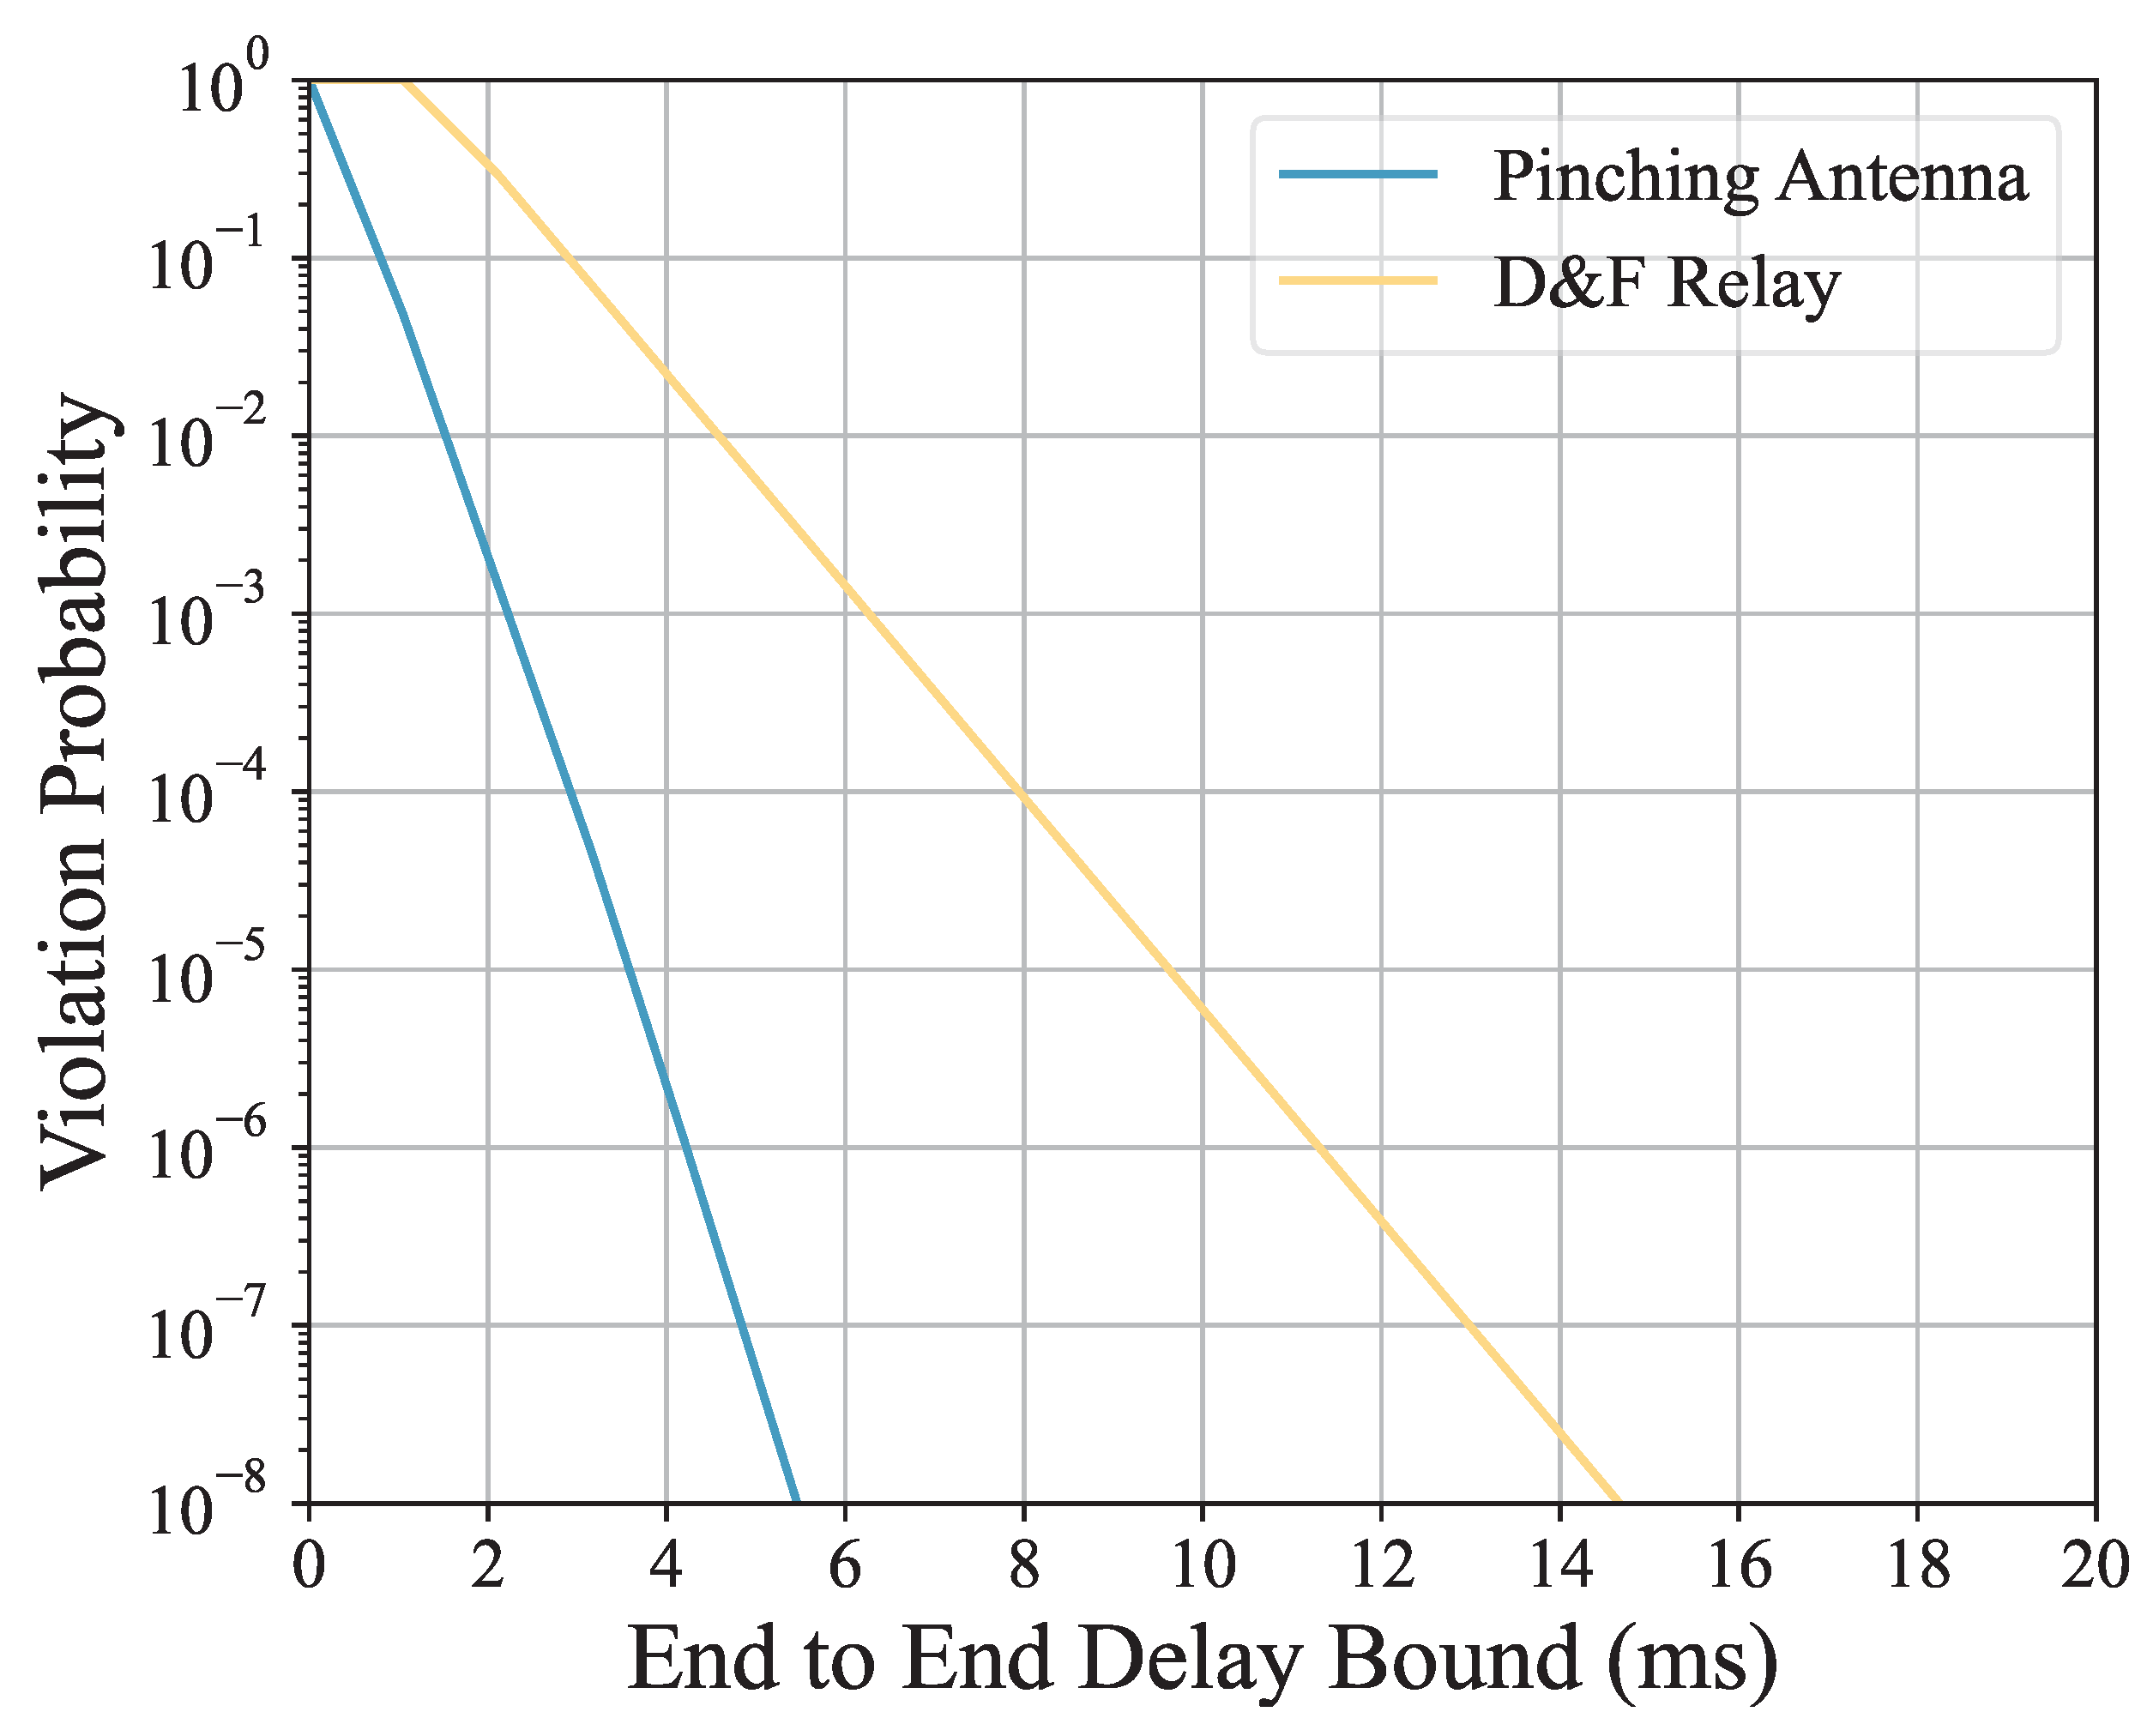
Figure 5 compares the violation probability of the end-to-end delay performance between the pinching-antenna-assisted 5G cellular network and the traditional decode and forward relay (D&F relay). It can be observed that, under the same delay bound, the violation probability of the pinching-antenna scheme is significantly lower than that of the traditional D&F relay scheme. This is because the pinching-antenna optimizes signal quality through directional transmission, reducing the delay caused by high-frequency attenuation and complex transmission links. In contrast, the traditional D&F relay scheme is more affected by signal attenuation, resulting in a higher violation probability under the same delay bound.


