Article

An Explainable Fault Diagnosis Algorithm for Proton Exchange Membrane Fuel Cells Integrating Gramian Angular Fields and Gradient-Weighted Class Activation Mapping

1
School of Automotive Engineering, Shandong Jiaotong University, Jinan 250357, China
2
School of Mechanical and Electrical Engineering, Weifang University of Science and Technology, Weifang 262700, China
*
Author to whom correspondence should be addressed.
Electronics 2025, 14(22), 4401; https://doi.org/10.3390/electronics14224401
Submission received: 17 October 2025 / Revised: 7 November 2025 / Accepted: 11 November 2025 / Published: 12 November 2025
(This article belongs to the Special Issue Advances in Electric Vehicles and Energy Storage Systems)

Abstract

Reliable operation of proton exchange membrane fuel cells (PEMFCs) is crucial for their widespread commercialization, and accurate fault diagnosis is the key to ensuring their long-term stable operation. However, traditional fault diagnosis methods not only lack sufficient interpretability, making it difficult for users to trust their diagnostic decisions, but also one-dimensional (1D) feature extraction methods highly rely on manual experience to design and extract features, which are easily affected by noise. This paper proposes a new interpretable fault diagnosis algorithm that integrates Gramian angular field (GAF) transform, convolutional neural network (CNN), and gradient-weighted class activation mapping (Grad-CAM) for enhanced fault diagnosis and analysis of proton exchange membrane fuel cells. The algorithm is systematically validated using experimental data to classify three critical health states: normal operation, membrane drying, and hydrogen leakage. The method first converts the 1D sensor signal into a two-dimensional GAF image to capture the temporal dependency and converts the diagnostic problem into an image recognition task. Then, the customized CNN architecture extracts hierarchical spatiotemporal features for fault classification, while Grad-CAM provides visual explanations by highlighting the most influential regions in the input signal. The results show that the diagnostic accuracy of the proposed model reaches 99.8%, which is 4.18%, 9.43% and 2.46% higher than other baseline models (SVM, LSTM, and CNN), respectively. Furthermore, the explainability analysis using Grad-CAM effectively mitigates the “black box” problem by generating visual heatmaps that pinpoint the key feature regions the model relies on to distinguish different health states. This validates the model’s decision-making rationality and significantly enhances the transparency and trustworthiness of the diagnostic process.

1. Introduction

To address the global energy crisis and increasing environmental concerns, transitioning to sustainable energy infrastructure is critical [1,2,3]. Proton exchange membrane fuel cells (PEMFCs) are a promising technology for a carbon-neutral future, offering high energy efficiency [4], substantial power density [5], and zero greenhouse gas emissions [6]. They hold potential for diverse applications, including transportation, stationary power systems, and portable electronics [7,8,9,10]. Nevertheless, challenges in operational reliability and durability, driven by system faults, limit their widespread adoption [11,12]. Developing robust and accurate fault diagnosis methods is crucial to improve performance, ensure safety, and lower maintenance costs [13,14].
Fault diagnosis in PEMFCs is primarily categorized into two approaches: model-based and data-driven methods [15,16]. The model-based approach detects faults by constructing a precise physical or mathematical model of the fuel cell system and analyzing deviations between predicted and actual measurements [17,18]. For instance, Esmaili et al. [19] utilized an enhanced segmented model to assess water management failures under varying current distributions, observing that two-phase pressure drops at high current densities correlate with output voltage trends, suggesting pressure drop as a key indicator of water management issues. Similarly, Lee et al. [20] introduced a hierarchical fault diagnosis method to address sudden and performance-degrading faults, confirming the effectiveness of the model-based approach. Yang et al. [21] proposed an advanced state observer using a linear parameter variation model to estimate internal system states and component faults simultaneously. However, model-based methods face challenges due to the complexity of fuel cell systems and uncertainties in parameters, making accurate modeling difficult [22,23].
The data-driven approach uses historical operating data and machine learning algorithms to directly learn fault characteristic patterns from the data to perform fault diagnosis without building complex physical models [24,25,26]. In traditional data-driven, Han et al. [27] used the possibility fuzzy c-mean algorithm to screen samples under Gaussian noise dynamic conditions and used the artificial bee colony algorithm to optimize the penalty factor c and kernel function parameter g in the support vector machine (SVM) model. The results show that this method can effectively diagnose PEMFC faults in small-scale, nonlinear, and high-dimensional scenarios. In order to reduce the reliance of traditional data-driven methods on artificial features, some scholars have focused on fault diagnosis based on deep learning methods. Gu et al. [28] proposed a long short-term memory (LSTM) network model based on a fuel cell system on an embedded platform, which can effectively diagnose fuel cell flooding failures and thus optimize water management under different vehicle operating conditions. Deng et al. [29] used a traditional convolutional neural network (CNN) with a residual structure and a CNN optimized based on the mini-batch gradient descent and adaptive moment estimation algorithms. However, although the data-driven methods based on deep learning can automatically learn features, their “black box” characteristics make the diagnostic decision process opaque. It should be pointed out that the above data-driven methods are all based on the diagnosis of one-dimensional (1D) signals. Overall, data-driven approaches are good at learning complex failure modes directly from data and show high accuracy and robustness in dealing with nonlinear and high-dimensional problems, thus providing effective and adaptable solutions for ensuring the reliable operation of fuel cell systems [30,31,32].
Although significant progress has been made in PEMFC fault diagnosis research, some challenges still exist: (1) The core challenge of the existing diagnostic paradigm based on 1D signals lies in the feature engineering stage, which not only relies heavily on the prior knowledge of experts for manual intervention, but is also susceptible to noise interference, thus limiting the generalization ability of the model in practical application. (2) Neural network models often have “black box” characteristics and lack interpretability, which reduces their acceptability and feasibility of deployment in application scenarios with high safety requirements.
To tackle the challenges of human intervention and model interpretability, this study introduces a novel diagnostic algorithm based on Gramian angular field (GAF) and CNN, with an enhanced explainable artificial intelligence (AI) component, as shown in Figure 1. The core method involves converting 1D time-series signals into two-dimensional (2D) GAF images, allowing a high-performance 2D-CNN to automatically extract features and perform classification efficiently. We chose GAF over other 2D representations (such as wavelet spectrograms or short-time Fourier transforms) because it uniquely encodes temporal dependencies and correlations within a spatial structure by representing time against itself. While time–frequency methods also create 2D images, they often still require manual feature extraction (e.g., energy from specific frequency bands) to be effective. GAF, however, creates a holistic image that allows a 2D-CNN to automatically learn these complex patterns directly, fulfilling our objective of eliminating the manual feature extraction and expert knowledge required by traditional 1D methods. To enhance the transparency and interpretability of the model’s decision process, we integrate gradient-weighted class activation mapping (Grad-CAM), a visualization technique that highlights the critical regions of the input signal most influential for a given diagnosis. As a post hoc interpretability method, Grad-CAM is ideal for explaining the decisions of an already-trained CNN model by analyzing its gradient information, rather than modifying the model’s intrinsic architecture. The main contributions of this paper are summarized as follows:
(1)
A new GAF-CNN algorithm is proposed, which can convert 1D time-series signals into two-dimensional GAF images without manual feature extraction and reliance on prior knowledge.
(2)
To solve the problem of model interpretability, we integrate the Grad-CAM technology to visualize the working principle and decision-making process of the neural network in the fault classification model. Given our GAF-based image classification approach, Grad-CAM is the most suitable method for providing visual localization to validate that the CNN is focusing on relevant spatiotemporal patterns within the 2D image.
(3)
The proposed algorithm is systematically validated using experimental data for critical fault types, including membrane drying and hydrogen leakage, demonstrating its superior diagnostic accuracy and interpretability compared to other baseline methods.
The remainder of this paper is structured as follows: Section 2 outlines the fuel cell system description and examines the target fault types in detail. Section 3 offers a thorough theoretical overview of the proposed GAF-CNN and Grad-CAM algorithms, including mathematical formulations and implementation specifics. Section 4 displays the experimental results and compares them with existing methods. Section 5 provides the study’s conclusions.

2. Fuel Cell System and Failure Types

2.1. Fuel Cell System

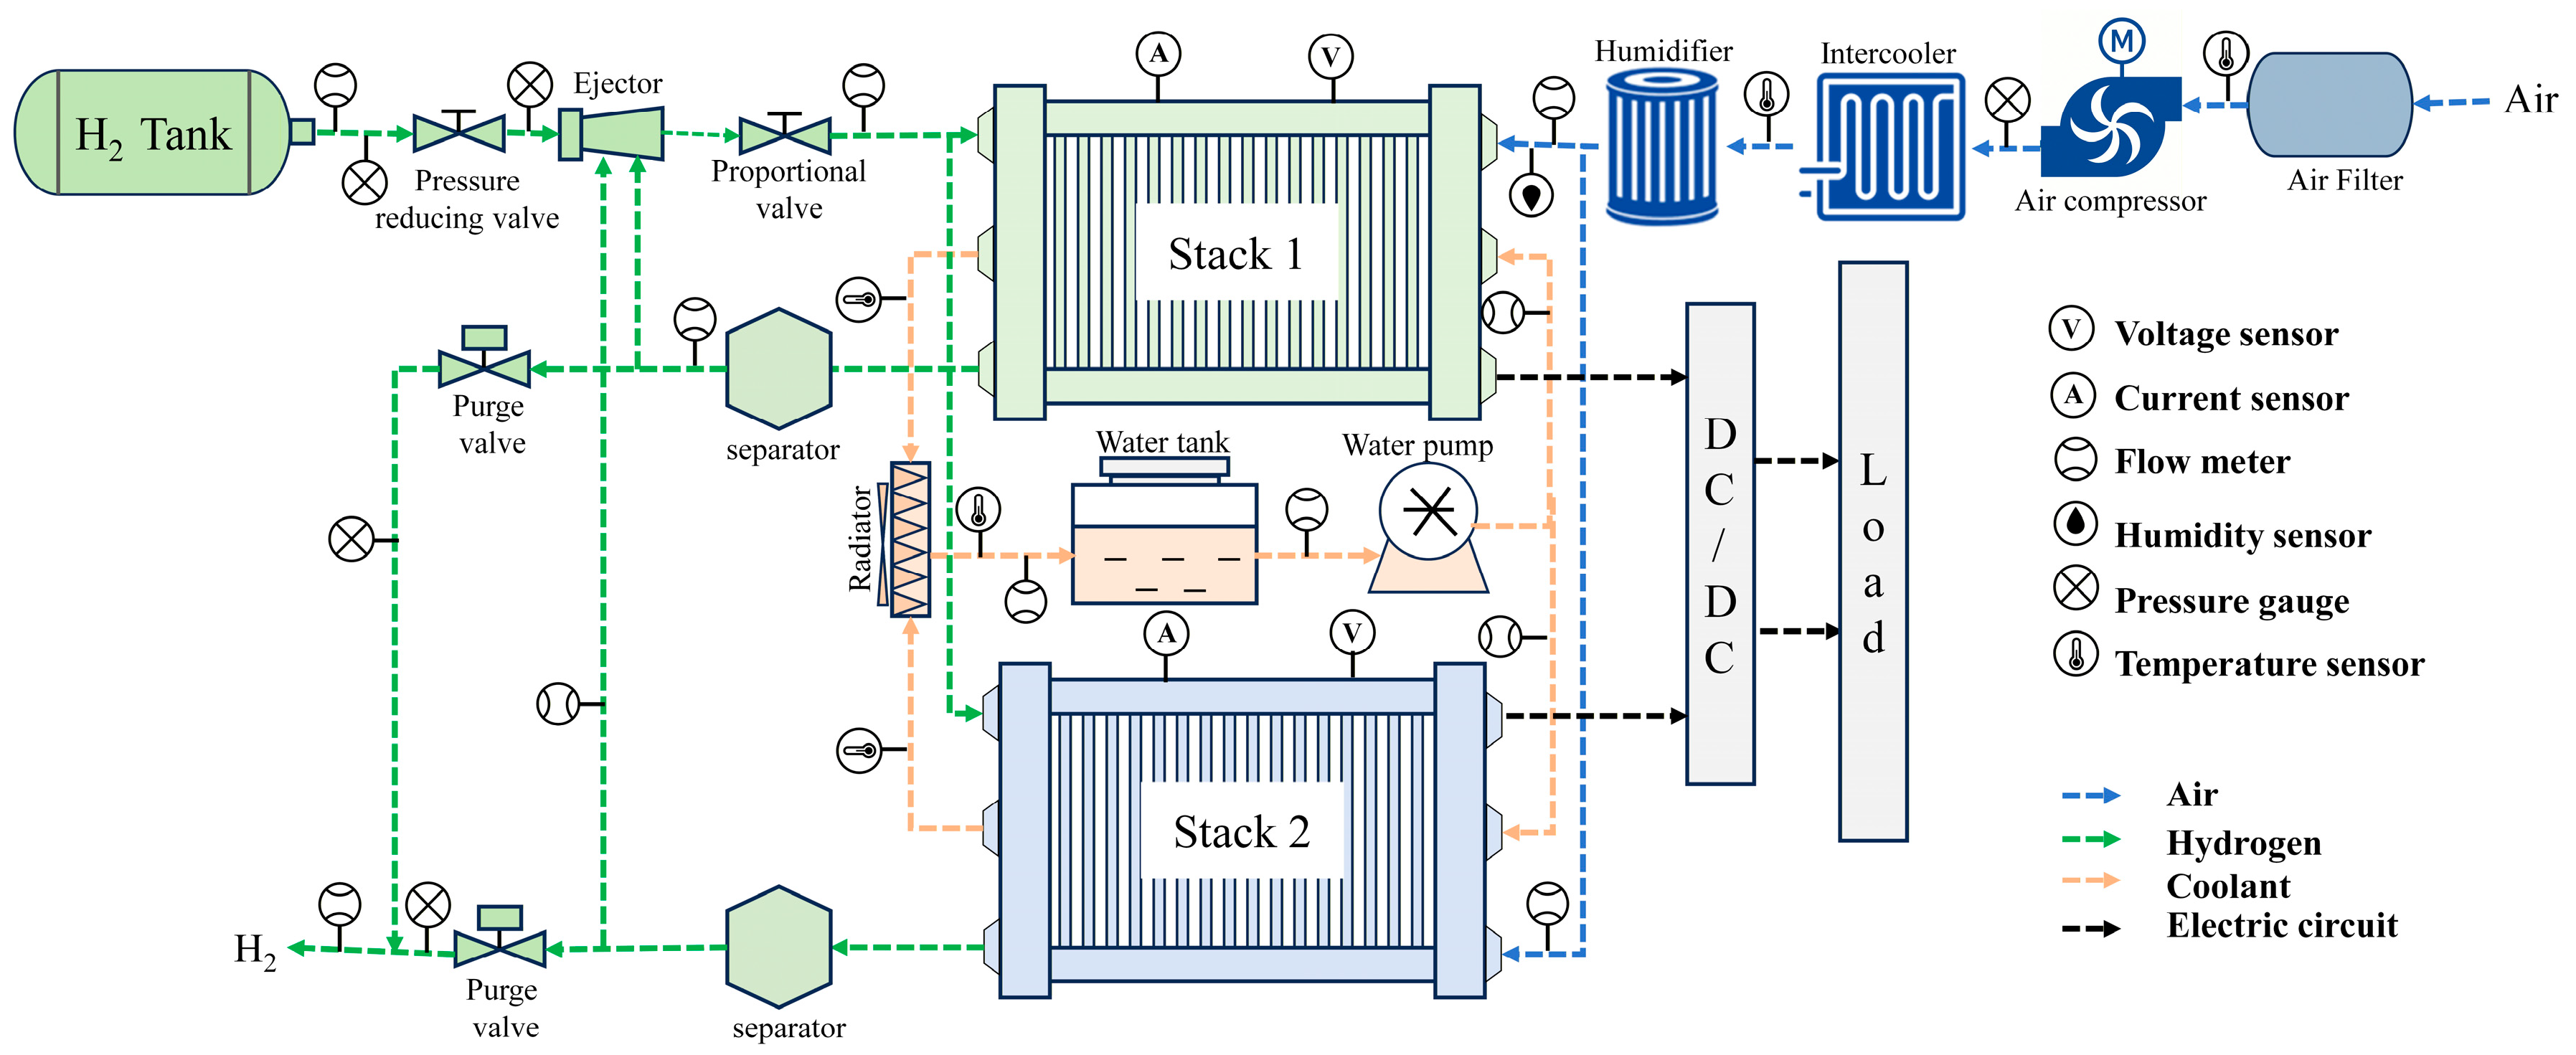
This study uses a 100 kW evaporative cooling PEMFC (EC-PEMFC) system, manufactured by Intelligent Energy in Loughborough, UK, as the fault diagnosis object [33]. The system adopts a dual-stack structure, and each stack consists of 300 single cells connected in series. During the operation of the system, hydrogen and air are, respectively, introduced into the anode and cathode of the stack, and electrochemical reactions occur at the cathode to produce water and electricity. To regulate the water and heat balance in the stack, the system dissipates the heat produced by the stack via a water circulation loop, ensuring stable operation within the ideal temperature range. The general layout of the EC-PEMFC system is presented in Figure 2.
To monitor the PEMFC’s real-time operational state, sensors placed at various points in the fuel cell system continuously collect data on 20 state variables. The parameters for these sensors are detailed in Table 1.

2.2. Failure Types

2.2.1. Hydrogen Leakage

Hydrogen leakage represents a critical failure mode in PEMFCs, where molecular hydrogen unintentionally escapes through defects in pipelines, fittings, or sealing interfaces within the anode gas supply subsystem [34]. This leakage reduces the available reactant at the anode catalyst layer, hindering the hydrogen oxidation reaction and leading to a drop in cell performance under specific load conditions [35]. Persistent leakage further accelerates the degradation of the carbon support structure due to localized overpotential and carbon corrosion, which fosters the agglomeration and detachment of platinum nanoparticles [36]. These factors collectively lead to a significant decrease in the electrochemically active surface area, affecting the long-term durability and reliability of the fuel cell system. Additionally, the buildup of leaked hydrogen in confined spaces raises serious safety issues related to flammability and explosion risks [37].

2.2.2. Membrane Drying

Membrane dehydration, also referred to as membrane drying, is a prevalent degradation mechanism in PEMFCs that arises when the polymer electrolyte membrane lacks sufficient water content to maintain adequate proton conductivity [38]. As proton transport within the membrane is highly dependent on its hydration state, insufficient membrane water content leads to a pronounced increase in ohmic resistance and a concomitant decline in cell voltage [39]. Prolonged exposure to dehydration conditions, particularly under high-temperature or low-humidity operating environments, may induce mechanical stress and microstructural damage within the membrane, including crack formation and pinhole development [40]. Such physical degradation can result in hydrogen and oxygen crossover, which not only compromises system efficiency but also poses risks of internal short-circuiting [41]. Therefore, membrane hydration control is essential for ensuring stable operation and preserving the electrochemical integrity of the cell.
To ensure reliable assessment of model performance in the context of safety-critical fuel cell systems, the dataset (sourced from the public repository associated with reference [33]) comprising 3300 labeled samples (1100 normal, 1100 hydrogen leakage, and 1100 membrane drying) was partitioned into training and testing subsets using a 60:40 stratified split. Each sample represents a 300 s (5 min) time-series window, collected at a 1 Hz sampling frequency. This yielded 1980 training samples and 1320 testing samples, with 440 instances per class in the test set. The chosen split strikes a balance between providing sufficient data for robust feature extraction and ensuring a statistically meaningful evaluation on unseen samples. Furthermore, stratified random sampling was applied to maintain class distribution consistency across subsets, which is essential for preventing data leakage and for enabling fair and generalizable model validation.

3. The Proposed GAF-CNN and Grad-CAM Algorithm

3.1. Overview of the Proposed Algorithm

To address the challenges of effective feature representation and model interpretability in fuel cell fault diagnosis, this paper proposes a novel end-to-end algorithm that synergistically integrates time-series encoding, deep feature extraction, and visual explanation. Specifically, 1D time-series signals are first transformed into 2D GAF images to capture temporal dependencies within a spatial representation. These images are then fed into a CNN, which automatically learns hierarchical features for accurate fault classification. To enhance model transparency, Grad-CAM is employed to generate visual explanations, highlighting the regions that contribute most to the model’s decisions.

3.2. Gramian Angular Field

The GAF transformation encodes time-series data as images while preserving temporal dependencies. Given a univariate time-series X = x 1 , x 2 , , x n , where xᵢ represents the sensor measurement at time step i and n denotes the signal length, the transformation proceeds as follows:
First, normalize the time-series to [−1, 1]:
x ˜ i = 2 ( x i x min ) x max x min 1
where x ˜ i the normalized value, xₘᵢₙ and xₘₐₓ represent the minimum and maximum values in the original time-series, respectively.
Then, encode the normalized values as angles:
φ i = arccos ( x ˜ i ) , x ˜ i 1 , 1
where φᵢ is the angular representation of the i-th time point.
Finally, construct the Gramian angular summation field (GASF):
G i j = cos ( φ i + φ j ) = x ˜ i x ˜ j V ( 1 x ˜ i 2 ) V ( 1 x ˜ j 2 )
where V is the feature map pre-activation output.
The resulting GASF matrix G ∈ ℝⁿˣⁿ is symmetric with diagonal elements preserving original temporal information and off-diagonal elements capturing temporal correlations between different time points.

3.3. Convolutional Neural Network

The CNN architecture extracts hierarchical features from GASF images through the following operations:
Convolution: For layer l with input X ( l 1 ) :
Z k ( l ) ( i , j ) = m p q W k m ( l ) ( p , q ) X m ( l 1 ) ( i + p , j + q ) + b k ( l )
where Z k ( l ) ( i , j ) is the pre-activation value at spatial position ( i , j ) in the k-th output channel, W k m ( l ) denotes the learnable convolutional kernels, p, q denote spatial coordinates within the convolutional layer, and b k ( l ) is the bias term.
Batch normalization:
Z ^ k ( l ) = γ k Z k ( l ) μ k σ k 2 + ϵ + β k
where γ k and β k are learnable scale and shift parameters, μ k and σ k 2 are the mean and variance of the batch, and ϵ is a small constant for numerical stability.
Classification: The final layer produces class probabilities:
p c = e x p ( z c ) j = 1 C e x p ( z j )
where C is the number of fault classes (normal, hydrogen leakage, and membrane drying), and z c represents the logit for class c.
Training: The model minimizes cross-entropy loss:
L = c = 1 C y c log ( p c )
where y c is the one-hot encoded ground truth label for class c.

3.4. Gradient-Weighted Class Activation Mapping

Grad-CAM provides visual explanations by computing importance weights for each feature map. For target class c and feature map A k :
Compute neuron importance weights via backpropagation:
α k c = 1 Z i j y c A i j k
where α k c represents the importance of feature map k for predicting class c, Z is the total number of spatial locations, and y c / A i j k is the gradient of class score y c with respect to activation A i j k .
Generate class activation map:
L G r a d C A M c = R e L U ( k α k c A k )
where ReLU focuses only on features with positive influence, and K is the total number of feature maps.
Create visualization:
V = λ n o r m ( L G r a d C A M c ) + ( 1 λ ) G
where G is the input GASF image, λ 0 , 1 is a transparency factor controlling the balance between heatmap and original image, and normalizes the heatmap to [0, 1].

3.5. Fault Diagnosis of EC Fuel Cell System Based on GAF-CNN and Grad-CAM

Based on the GAF-CNN and Grad-CAM approach for fault diagnosis in PEMFC systems, the diagnostic process is depicted in Figure 3 and follows the specific steps as follows:
(1)
Time-series data under three health states (normal, hydrogen leakage, and membrane drying) were collected from a 100 kW EC-PEMFC system using 20 sensors, standardized.
(2)
The 1D signals were converted into 2D GASF images using the GAF method to preserve temporal dependencies, and split into training and testing sets.
(3)
A CNN model was trained on GASF images to automatically extract features and classify system health states.
(4)
Model performance was evaluated on the test set to accurately identify fault types.
(5)
Grad-CAM was applied to generate class activation maps highlighting the key regions influencing model decisions.
(6)
Heatmaps were overlaid on the original GASF images to visually interpret diagnostic outcomes and enhance model transparency.

4. Results and Discussion

4.1. Evaluation Indicators

To assess the performance of fuel cell fault diagnosis models, four evaluation metrics are utilized: accuracy, precision, recall, and F1-score. For each operational state category of the fuel cell system, fundamental metrics are established as follows: True Positives (TP) represent instances where the model correctly identifies positive cases; True Negatives (TN) denote instances where the model accurately predicts negative cases; False Positives (FP) indicate cases where the model erroneously classifies negative samples as positive; and False Negatives (FN) refer to cases where the model incorrectly categorizes positive samples as negative.
Accuracy indicates the fraction of correctly predicted samples out of the total number of samples in the dataset. Precision assesses the proportion of samples correctly identified as positive among those predicted as positive by the model. Recall measures the proportion of actual positive samples accurately recognized as positive by the model.
A c c u r a c y = T P + T N T P + T N + F P + F N P r e c i s i o n = T P T P + F P R e c a l l = T P T P + F N
F1-score represents the harmonic mean of precision and recall, offering a balanced evaluation that considers both the model’s accuracy and completeness.
F 1 _ S c o r e = 2 × ( P r e c i s i o n × R e c a l l ) P r e c i s i o n + R e c a l l

4.2. Diagnostic Results and Discussion

Figure 4 displays the scatter plot of the GAF-CNN model’s diagnosis results, where the horizontal axis denotes the sample number and the vertical axis indicates the category label. Detailed information on the category label is available in Table 2. Analysis of the scatter plot reveals that most points align with their respective correct fault categories, indicating the GAF-CNN model achieves high diagnostic accuracy on both training and test sets. As shown in Figure 4a, in the training set, one hydrogen leakage sample and five membrane drying samples were misclassified as normal. In the test set, as depicted in Figure 4b, two membrane drying fault samples were also misdiagnosed as normal.
In order to evaluate the performance of the model proposed in this paper, this paper comprehensively compares three classic classification models: SVM, LSTM, and CNN. To ensure a fair and reproducible comparison, all models were configured based on common practices and refined for optimal performance. All neural network models (GAF-CNN, 1D-CNN, and LSTM) were trained using the Adam optimizer with a learning rate of 0.001, a batch size of 32, and the CrossEntropyLoss function. Training was conducted for a maximum of 100 epochs, utilizing an early stopping mechanism with a patience of 10 based on validation loss. The specific architectures were as follows: The GAF-CNN (Proposed) consisted of two convolutional blocks (Block 1: 32 3 × 3 filters; Block 2: 64 3 × 3 filters), each followed by BatchNorm, ReLU, and 2 × 2 Max Pooling, with a fully connected (FC) block including a Dense layer (128 units, ReLU) and a Dropout layer (0.5). The 1D-CNN (Baseline) used three 1D convolutional blocks (Block 1: 32 7 × 1 filters; Block 2: 64 5 × 1 filters; Block 3: 128 3 × 1 filters), each with BatchNorm and ReLU, followed by an Adaptive Average Pooling layer, and an FC block with a Dense layer (64 units, ReLU) and Dropout (0.5). The LSTM (Baseline) consisted of two stacked LSTM layers with a hidden size of 128 and a dropout rate of 0.2. The SVM (Baseline) used a standard Support Vector Classifier (SVC) with a Radial Basis Function (RBF) kernel, a C value of 1.0, and ‘scale’ for the gamma parameter.
Figure 5 shows the confusion matrix of each model on the test set. As shown in Figure 5a, the SVM model shows significant misclassification, especially for class 1 (mistaking it for class 0) and class 2 (mistaking it for class 0). Figure 5b reveals that the LSTM model has the poorest performance, with 31 instances of class 1 and 77 instances of class 2 being incorrectly predicted as class 0. The CNN model in Figure 5c performs better, but still struggles with correctly identifying class 2, misclassifying 24 instances. In contrast, Figure 5d demonstrates the superior performance of the proposed GAF-CNN model. It achieves perfect classification for classes 0 and 1, with only two minor misclassifications for class 2. This clearly indicates that the proposed model has the highest diagnostic accuracy and the strongest generalization ability among the compared models.
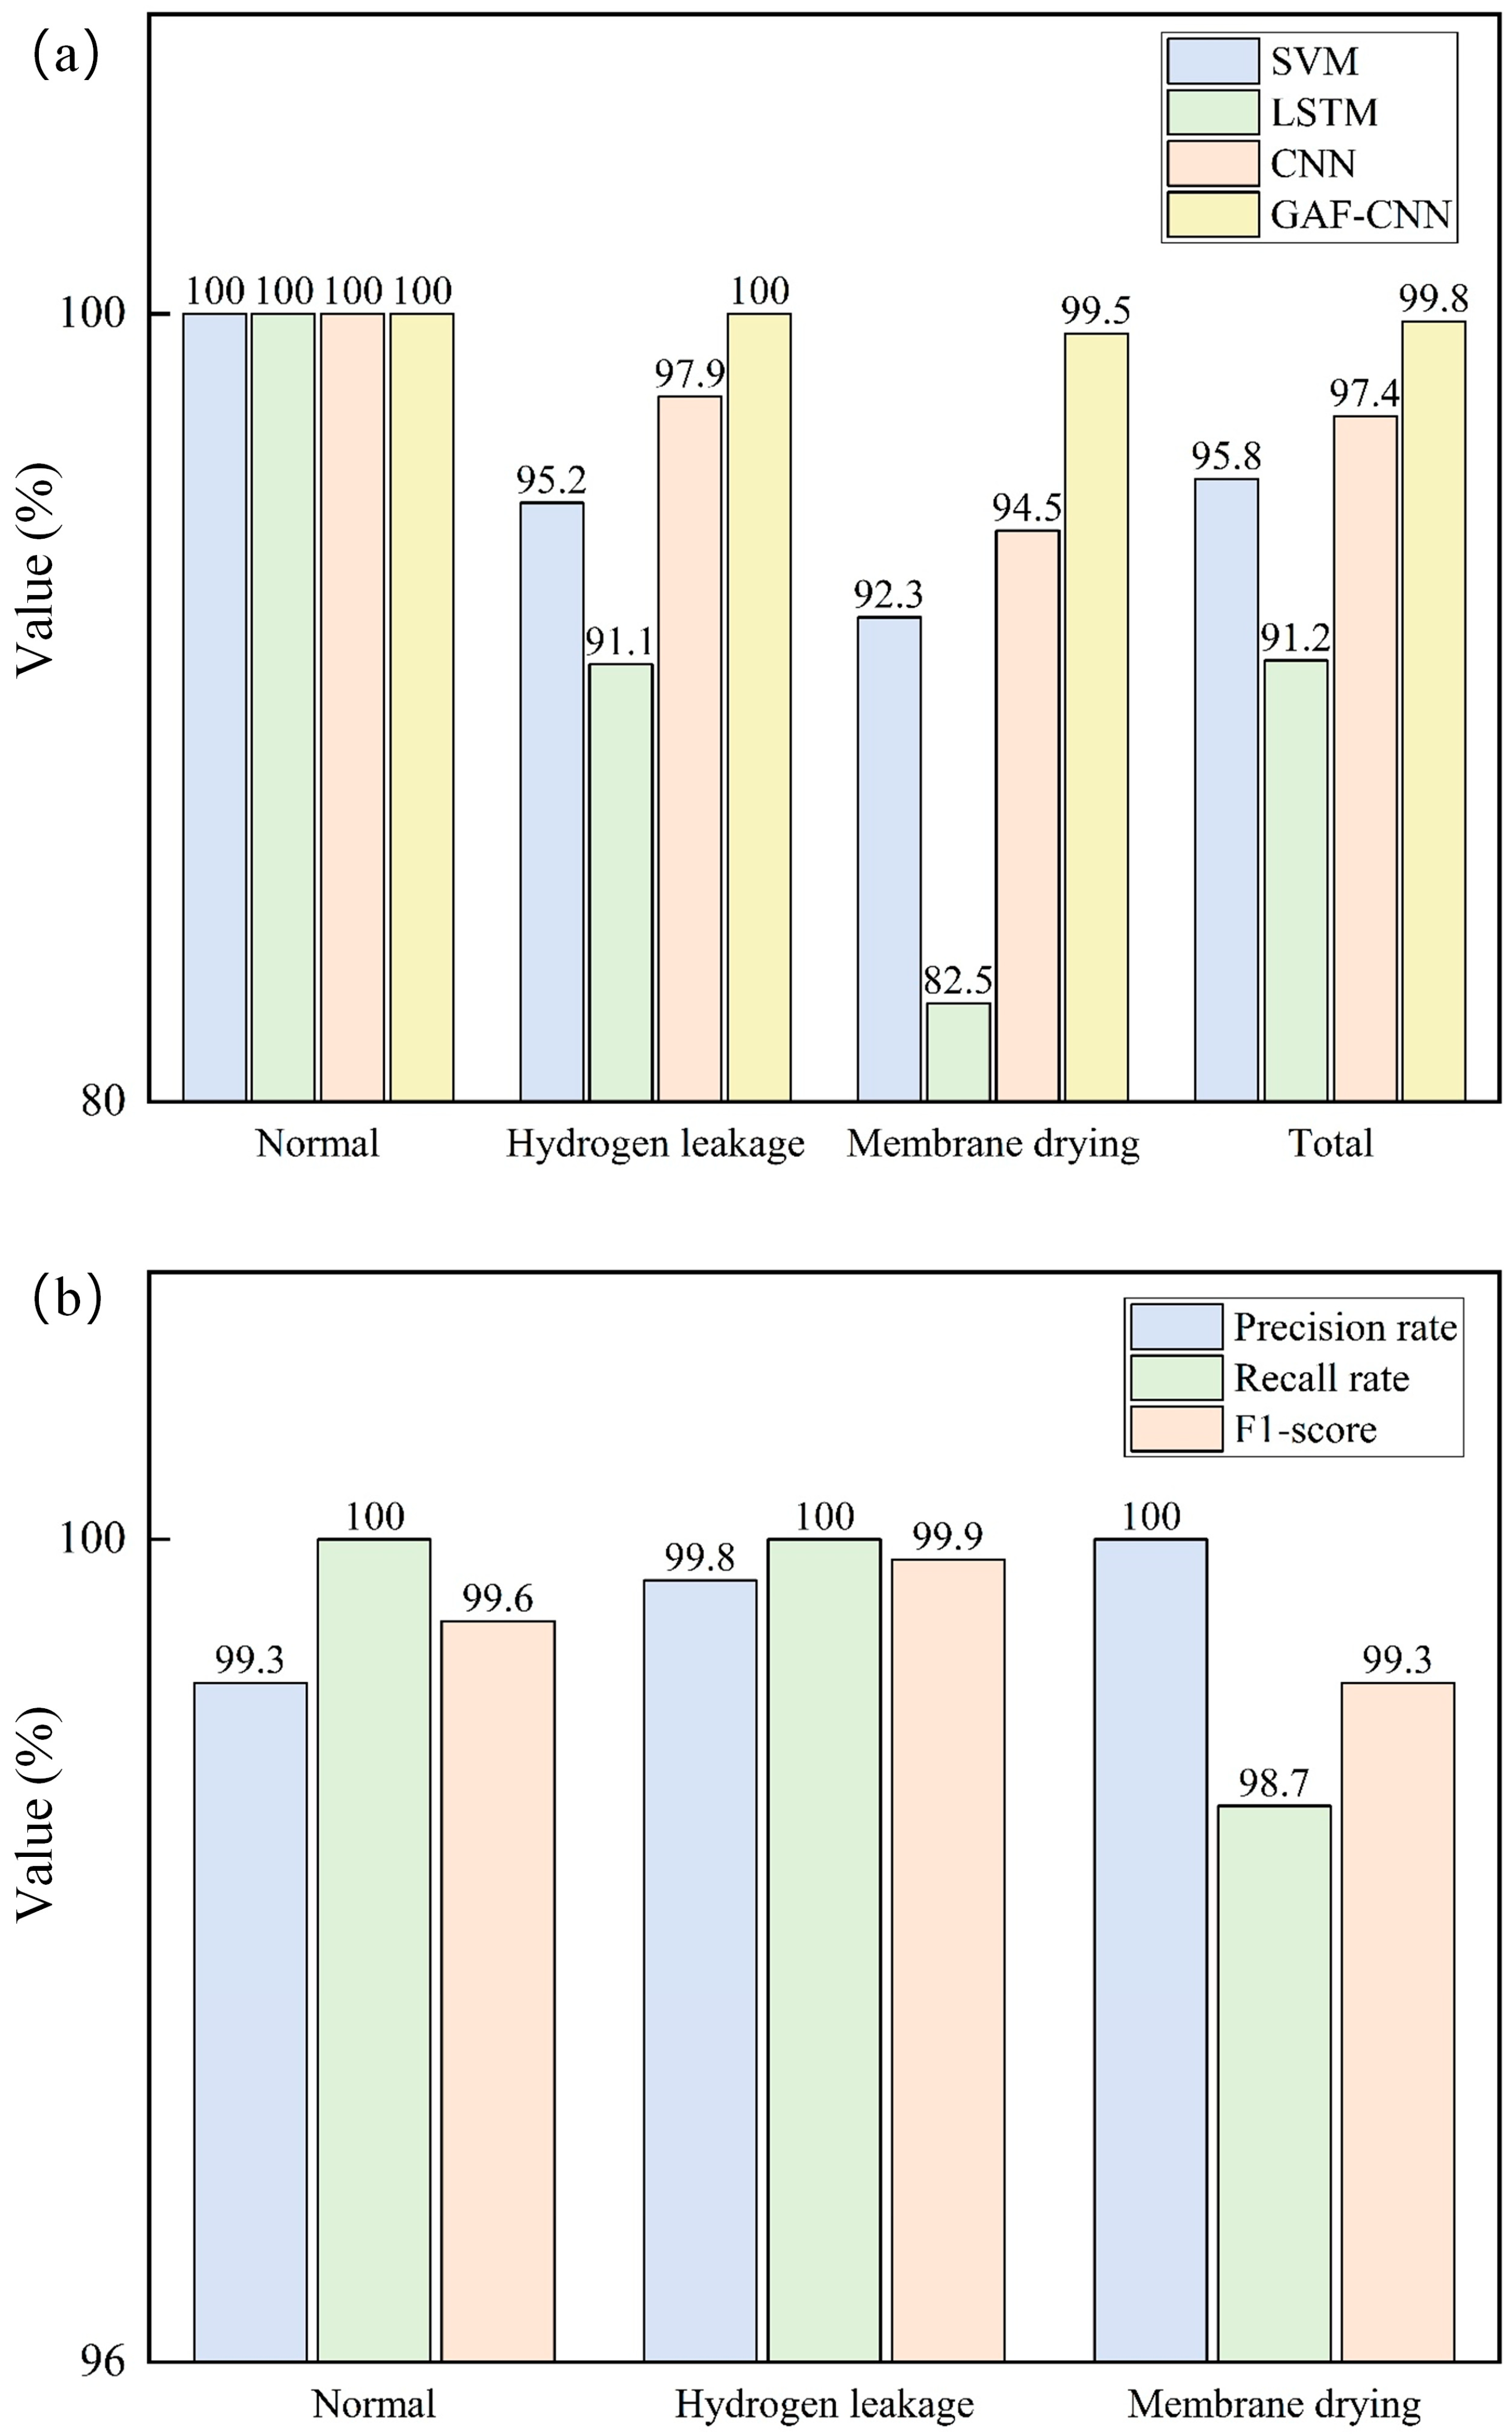
The effectiveness of the proposed model was assessed to confirm its diagnostic capability, with results illustrated in Figure 6. Figure 6a displays the classification accuracy across different algorithms, indicating that SVM reached 95.8%, LSTM attained 91.2%, CNN achieved 97.4%, and GAF-CNN recorded the highest accuracy at 99.8%. This reflects improvements of 4.18%, 9.43%, and 2.46% over SVM, LSTM, and traditional CNN, respectively. These comparisons suggest that the model presented here is well-suited for fuel cell fault classification. Figure 6b presents the accuracy, recall, and F1-score for the three health status conditions of the fuel cell system, all exceeding 98.7%, demonstrating the model’s robust performance in fuel cell fault classification.

4.3. Analysis Using Grad-Cam

To enhance the interpretability of the model and gain a deeper understanding of the decision-making process of the GAF-CNN model, this study used the Grad-CAM technique. By applying Grad-CAM to the second convolutional block of the model, heatmaps can be generated to visually display the input feature regions that contribute most to a specific fault classification. When these heatmaps are superimposed on the original GAF images, they can clearly reveal the basis for the model’s diagnostic decisions.
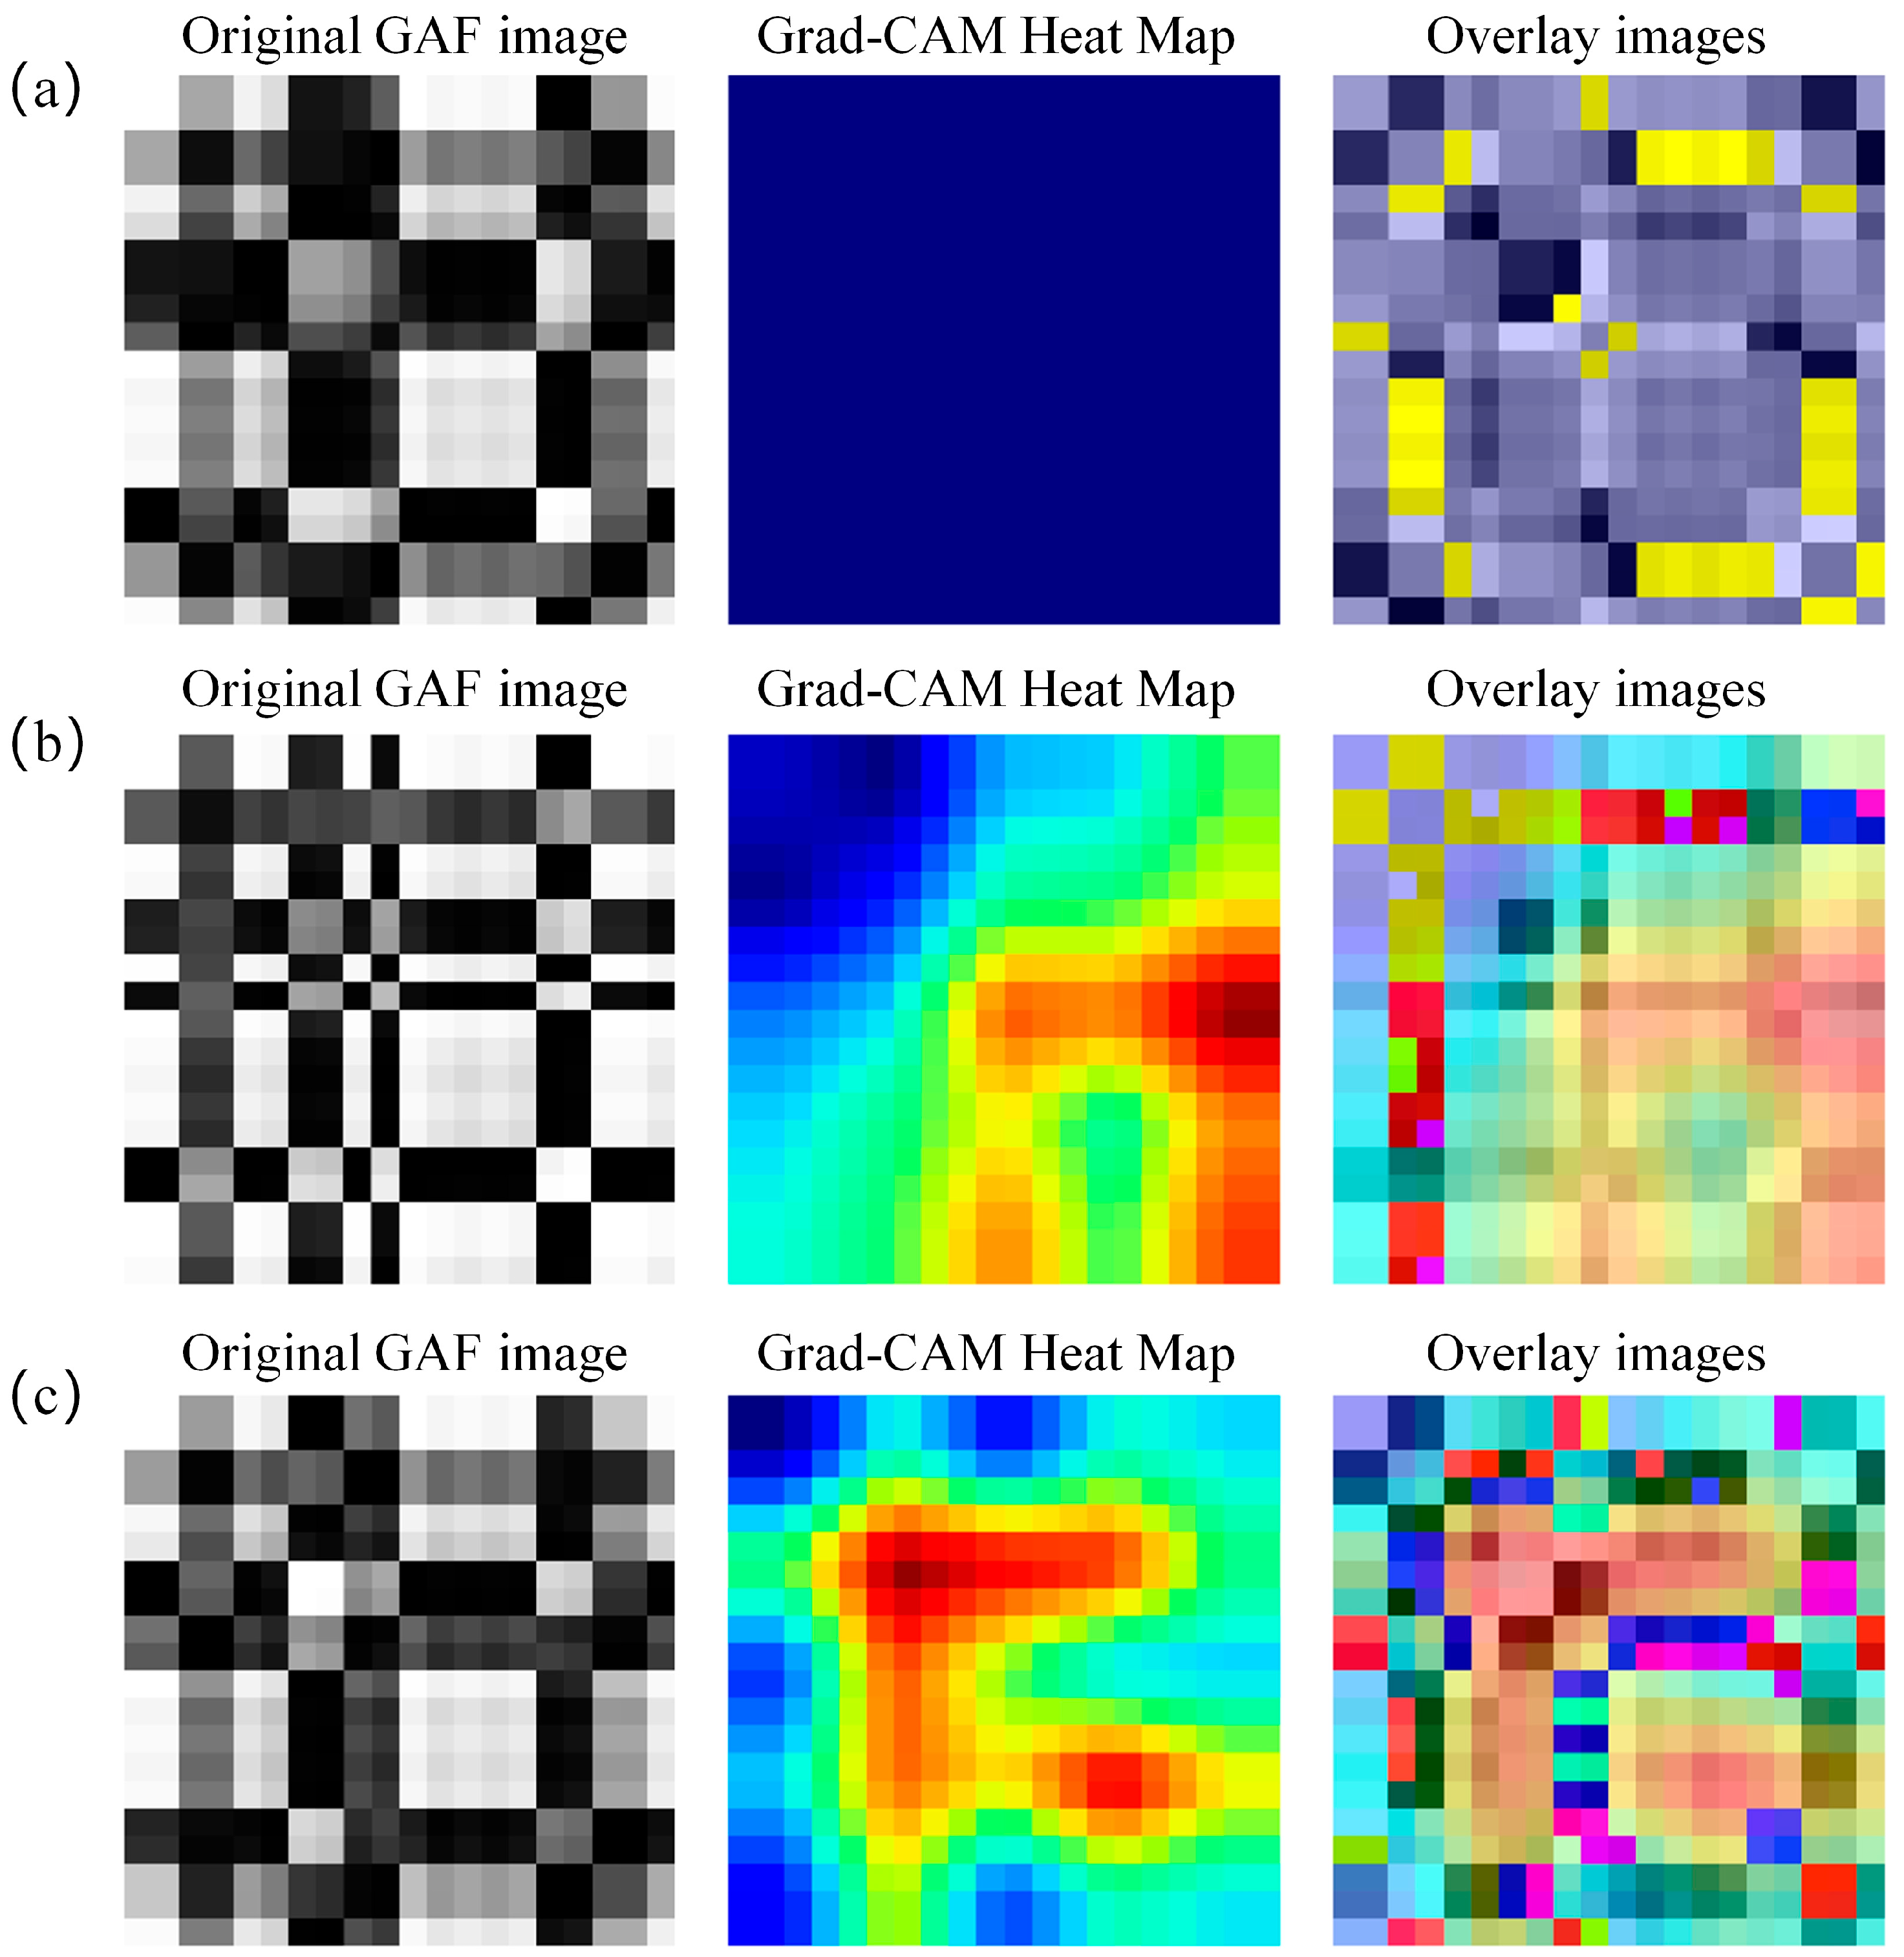
Figure 7 shows the Grad-CAM visualization results when the model correctly classifies the three states of normal, hydrogen leakage, and membrane dryness. In samples correctly classified as normal, the heatmap generated by Grad-CAM appears dark blue, indicating very limited or no activation areas. This indicates that under normal conditions, there are no significant fault features in the input signal, and the model does not detect strong abnormal patterns in any specific area of the GAF image, as shown in Figure 7a. When the model correctly identifies the hydrogen leak fault, the heatmap shows obvious bright yellow activation areas in specific areas. This indicates that the model has learned to associate the unique temporal patterns represented by these specific areas in the GAF image with hydrogen leak faults, as shown in Figure 7b. Similarly, for the correct diagnosis of the membrane drying fault, the heatmap also highlights the key areas on the GAF image. The pattern and location of the activated areas are different compared to the hydrogen leak, which proves that the GAF-CNN model can successfully extract and distinguish the complex spatiotemporal features unique to different fault types, as shown in Figure 7c.
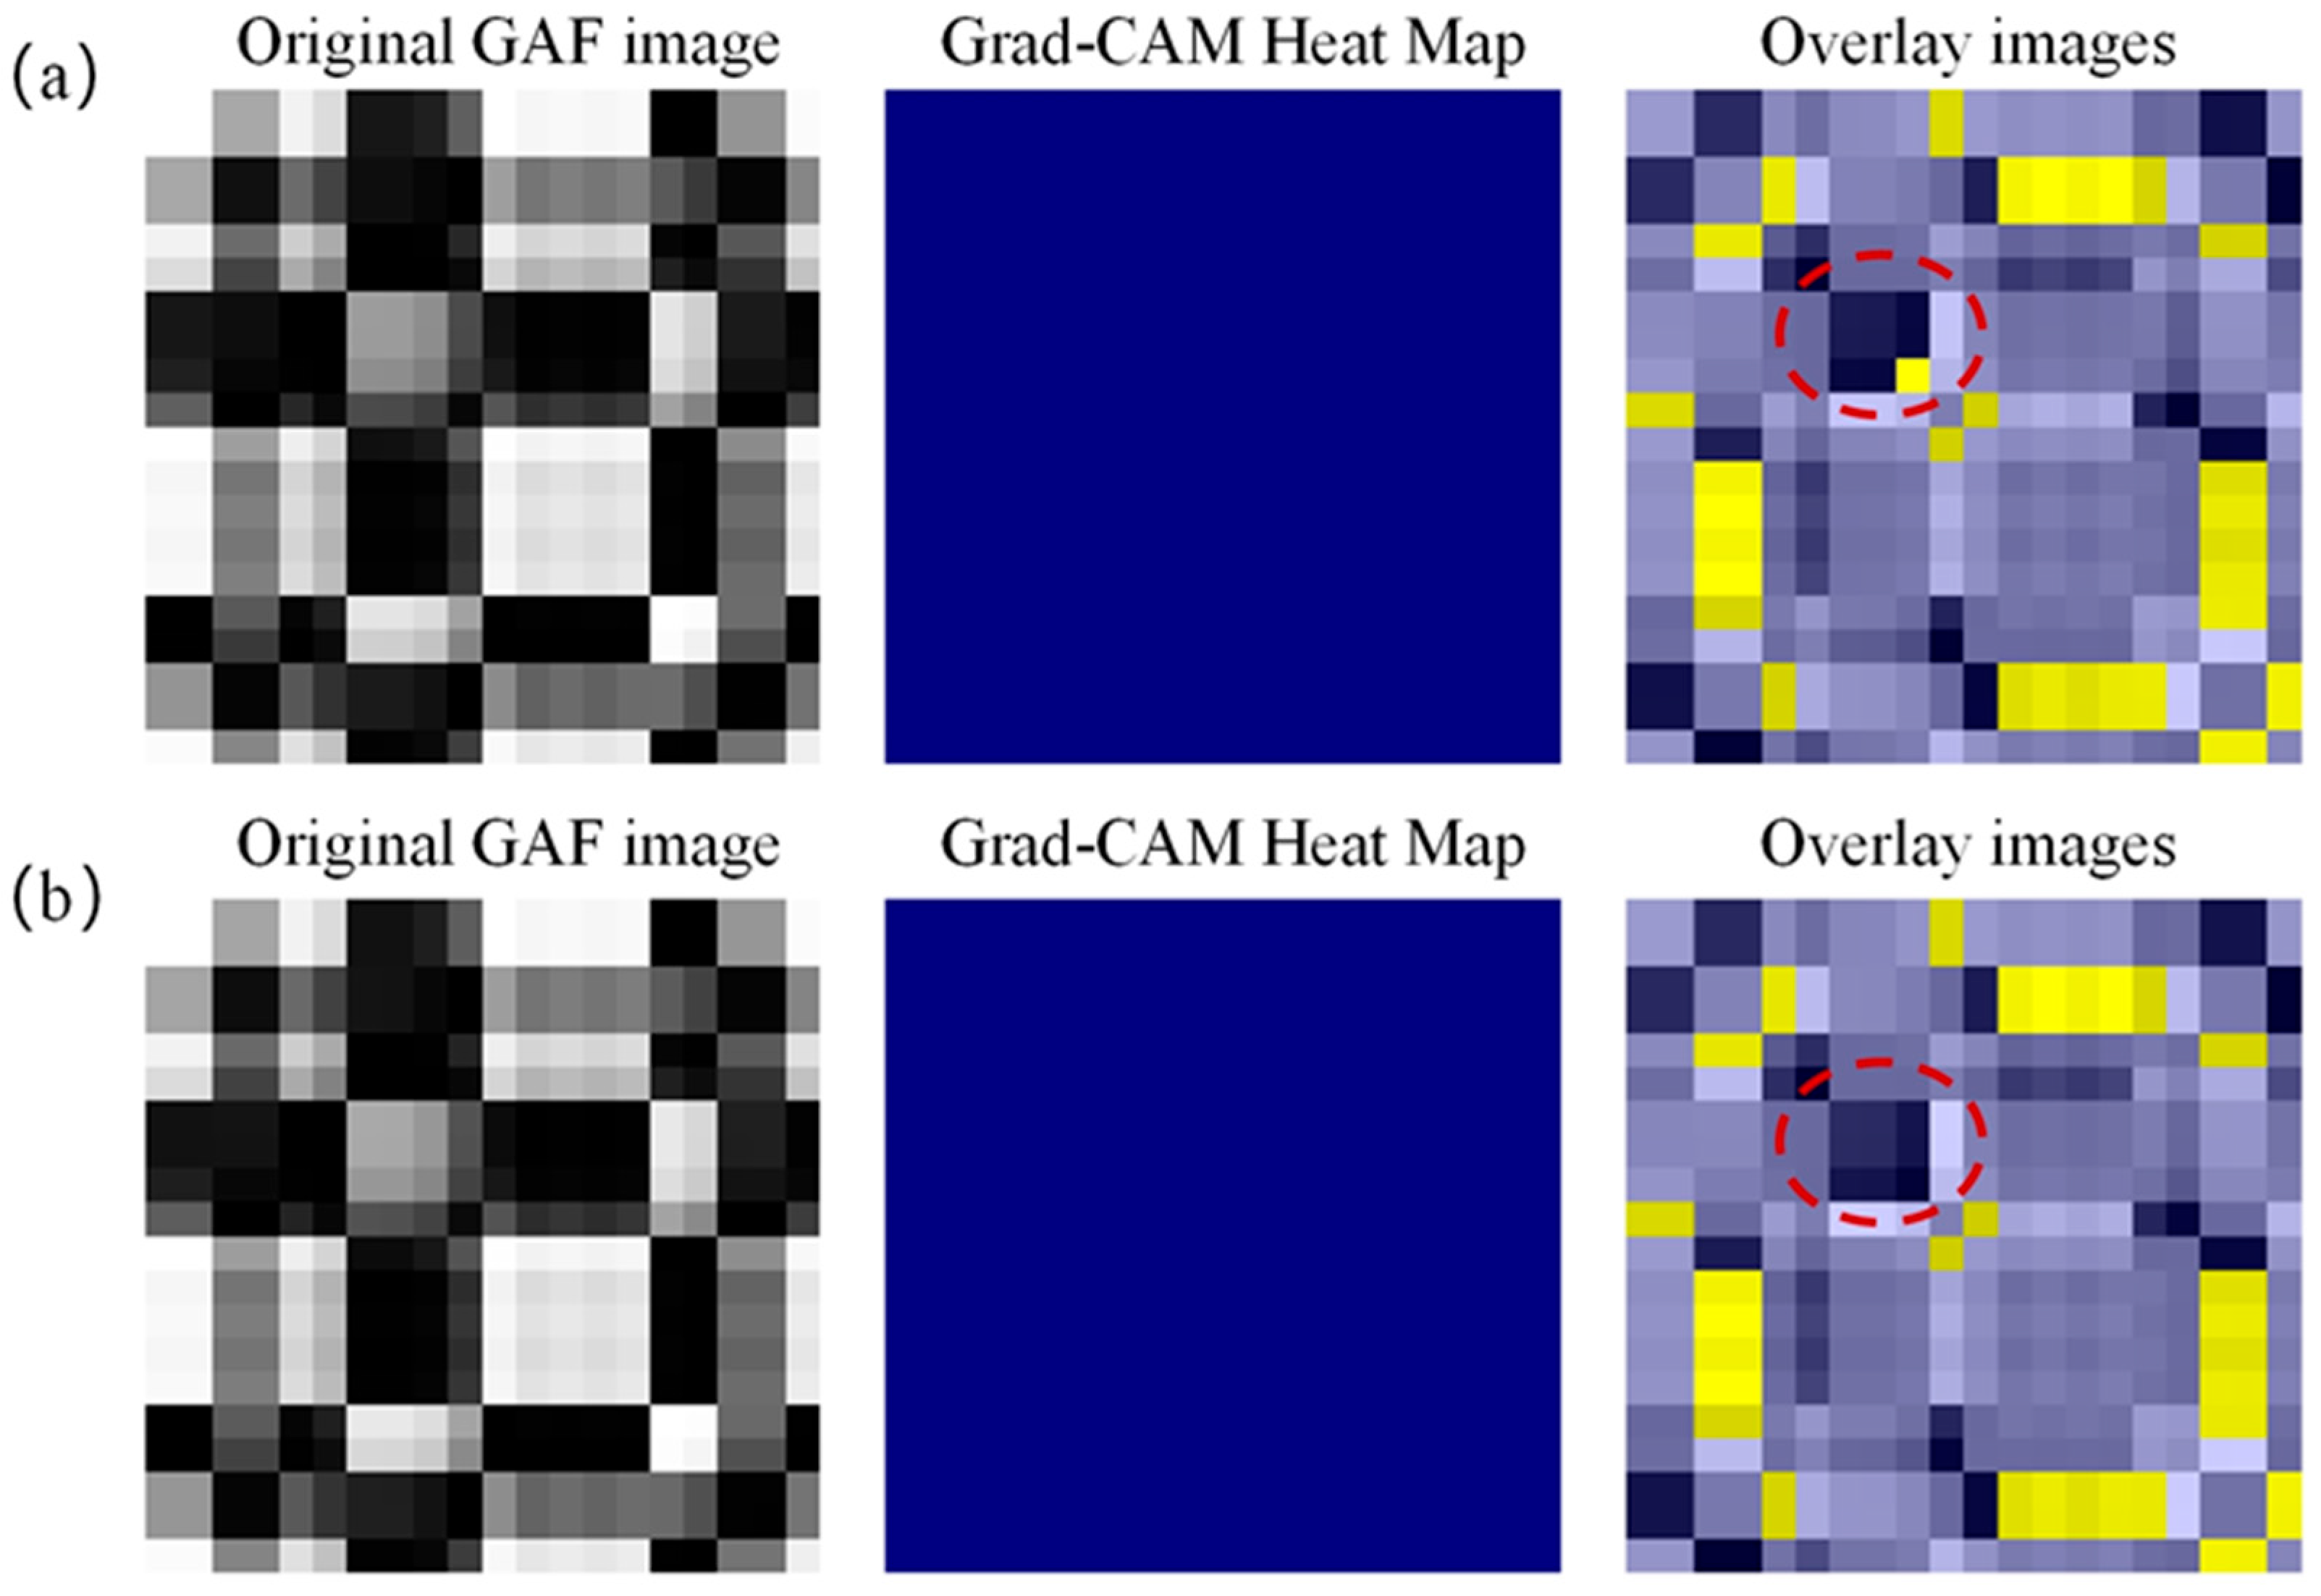
In addition to analyzing successful cases, Grad-CAM also provides insights into the model’s misdiagnosis cases. Figure 8 shows the analysis of two membrane drying fault samples that were misdiagnosed as normal. Close inspection of the overlay images in Figure 8a, b confirms that they represent two different samples. However, despite the true label of both samples being membrane drying, the heatmap generated by Grad-CAM shows almost no activation regions, and its visual features are very similar to the heatmap of the normal state in Figure 7a. This similarity to the normal state reveals the cause of the misclassification: the model failed to capture discriminative features sufficient to identify membrane drying defects in the GAF images, and therefore classified them as normal.
The visual interpretations in Figure 7 and Figure 8 provide concrete evidence of the model’s decision logic. Specifically, the absence of activation in the normal state (Figure 7a) confirms the model’s ability to identify fault-free operation, while the distinct activation regions in hydrogen leakage and membrane drying samples (Figure 7b,c) indicate that the CNN captures unique spatiotemporal fault patterns. Moreover, the misclassified samples in Figure 8 exhibit heatmaps similar to the normal state, explaining the cause of misdiagnosis and highlighting potential areas for model improvement. These detailed visual interpretations validate that the Grad-CAM effectively opens the “black box” of the CNN, transforming abstract network decisions into interpretable fault-specific reasoning.

5. Conclusions

This study introduces and validates a novel PEMFC fault diagnosis method. The method successfully performs fault identification and isolation by classifying the system state into one of three distinct categories: normal operation, hydrogen leakage, or membrane drying. The method converts 1D time-series signals from a 100 kW EC-PEMFC system into 2D GAF images, transforming the diagnostic challenge into an image recognition task. A customized CNN extracts hierarchical features for classification. To address the working principle and decision-making process of deep learning in fault diagnosis, Grad-CAM is integrated to provide visualization and model decision explanation. This GAF-CNN and Grad-CAM approach significantly improves diagnostic accuracy and model transparency. The main findings are as follows:
(1)
The GAF-CNN model achieved a 99.8% accuracy on the test set, outperforming baseline models like SVM, LSTM, and 1D CNN (with accuracies of 95.8%, 91.2%, and 97.4%, respectively), showing clear advantages in classifying (i.e., identifying and isolating) normal, hydrogen leakage, and membrane drying states. Evaluation metrics (precision, recall, F1-score) were all above 98.7%, demonstrating strong classification ability and robustness.
(2)
By introducing Grad-CAM technology, this study successfully solved the “black box” problem of deep learning models. The generated visual heatmap, as demonstrated in the analysis in Section 4.3 (Figure 7 and Figure 8), can clearly reveal the key data feature areas on which the model makes specific diagnoses (such as hydrogen leaks or membrane drying). This not only verifies the rationality of the model’s decisions but also provides deep insights into the underlying mechanisms of failure. In addition, the analysis of misclassified samples also intuitively shows why the model fails to effectively capture discriminative features in specific cases, pointing out the direction for further optimization of the model.
Although our proposed GAF-CNN model achieves a high diagnostic accuracy of 99.8%, it still has some limitations. First, the dataset used in this study only includes three health states (normal, hydrogen leakage, and membrane dryness), while actual PEMFC system failure modes are far more complex and numerous. Second, the model’s validation data comes from a specific 100 kW EC-PEMFC system, and whether it can be directly generalized to other system architectures or highly dynamic real-world operating environments requires further validation. Therefore, our future work will focus on expanding the dataset to include more failure types and severity levels, and will emphasize evaluating and improving the model’s adaptability and robustness across different PEMFC systems and application scenarios.

Author Contributions

Conceptualization, X.S. and H.G.; methodology, S.W. (Shuo Wang); software, J.Z. (Jinming Zhang); validation, J.Z. (Jinming Zhang), J.Z. (Jiaming Zhou) and H.G.; formal analysis, H.G.; investigation, X.S.; resources, X.S.; data curation, J.Z. (Jinming Zhang); writing—original draft preparation, X.S.; writing—review and editing, X.S. and F.Y.; visualization, J.Z. (Jiaming Zhou); supervision, J.Z. (Jiaming Zhou) and S.W. (Shuaihua Wang); project administration, J.Z. (Jiaming Zhou) and F.Y.; funding acquisition, J.Z. (Jinming Zhang) and J.Z. (Jiaming Zhou). All authors have read and agreed to the published version of the manuscript.

Funding

Weifang University of Science and Technology High-level Talent Research Start-up Fund Project (KJRC2023001), Campus-Level Project of Weifang University of Science and Technology (2023KJ02 and 2023KJ03), and Weifang City Science and Technology Development Plan Project (College and University Section) (2024GX031 and 2025GX037).

Data Availability Statement

The data are available from the corresponding author upon reasonable request.

Conflicts of Interest

The authors declare that they have no known competing financial interests or personal relationships that could have appeared to influence the work reported in this paper.

References

  1. Belaïd, F.; Al-Sarihi, A.; Al-Mestneer, R. Balancing climate mitigation and energy security goals amid converging global energy crises: The role of green investments. Renew. Energy 2023, 205, 534–542. [Google Scholar] [CrossRef]
  2. Harichandan, S.; Kar, S.K.; Bansal, R.; Mishra, S.K. Achieving sustainable development goals through adoption of hydrogen fuel cell vehicles in India: An empirical analysis. Int. J. Hydrogen Energy 2023, 48, 4845–4859. [Google Scholar] [CrossRef]
  3. Rao, A.; Kumar, S.; Karim, S. Accelerating renewables: Unveiling the role of green energy markets. Appl. Energy 2024, 366, 123286. [Google Scholar] [CrossRef]
  4. Li, Q.; Wang, H.; Wang, T.; Li, X.; Liu, Y.; Chen, W.; You, Z. Online diagnosis method of water management faults based on hybrid-frequency electrochemical impedance spectroscopy for PEMFC. IEEE Trans. Transp. Electrif. 2024, 11, 2707–2716. [Google Scholar] [CrossRef]
  5. Wei, Z.; Shi, H.; Dong, Z.; Zhang, C.; He, H. Water Failure Diagnosis of PEMFC in Actual Operating Conditions with High-Frequency Impedance Features. IEEE Trans. Power Electron. 2024, 40, 7414–7422. [Google Scholar] [CrossRef]
  6. Abedin, T.; Pasupuleti, J.; Paw, J.K.S.; Tak, Y.C.; Mahmud, M.; Abdullah, M.P.; Nur-E-Alam, M. Proton exchange membrane fuel cells in electric vehicles: Innovations, challenges, and pathways to sustainability. J. Power Sources 2025, 640, 236769. [Google Scholar] [CrossRef]
  7. Jia, C.; Liu, W.; He, H.; Chau, K. Superior energy management for fuel cell vehicles guided by improved DDPG algorithm: Integrating driving intention speed prediction and health-aware control. Appl. Energy 2025, 394, 126195. [Google Scholar] [CrossRef]
  8. Jia, C.; Liu, W.; He, H.; Chau, K.-T. Health-conscious energy management for fuel cell vehicles: An integrated thermal management strategy for cabin and energy source systems. Energy 2025, 333, 137330. [Google Scholar] [CrossRef]
  9. Lu, D.; Hu, D.; Wang, J.; Wei, W.; Zhang, X. A data-driven vehicle speed prediction transfer learning method with improved adaptability across working conditions for intelligent fuel cell vehicle. IEEE Trans. Intell. Transp. Syst. 2025, 26, 10881–10891. [Google Scholar] [CrossRef]
  10. Lu, D.; Yi, F.; Hu, D.; Li, J.; Yang, Q.; Wang, J. Online optimization of energy management strategy for FCV control parameters considering dual power source lifespan decay synergy. Appl. Energy 2023, 348, 121516. [Google Scholar] [CrossRef]
  11. Guo, Z.; Ma, R.; Ma, H.; Li, Z.; Xiong, P.; Jiang, W.; Zhou, Y. An Online Fault Diagnosis Method for PEMFC Based on Output Voltage and Transfer Convolutional Neural Network. IEEE Trans. Ind. Electron. 2025, 72, 8039–8048. [Google Scholar] [CrossRef]
  12. Yue, M.; Zhang, X.; Teng, T.; Meng, J.; Pahon, E. Recursive performance prediction of automotive fuel cell based on conditional time series forecasting with convolutional neural network. Int. J. Hydrogen Energy 2024, 56, 248–258. [Google Scholar] [CrossRef]
  13. Zhang, C.; Zhang, Y.; Wang, L.; Deng, X.; Liu, Y.; Zhang, J. A health management review of proton exchange membrane fuel cell for electric vehicles: Failure mechanisms, diagnosis techniques and mitigation measures. Renew. Sustain. Energy Rev. 2023, 182, 113369. [Google Scholar] [CrossRef]
  14. Ma, T.; Zhang, Z.; Lin, W.; Yang, Y.; Yao, N. A review on water fault diagnosis of a proton exchange membrane fuel cell system. J. Electrochem. Energy Convers. Storage 2021, 18, 030801. [Google Scholar] [CrossRef]
  15. Xing, Y.; Wang, B.; Gong, Z.; Hou, Z.; Xi, F.; Mou, G.; Du, Q.; Gao, F.; Jiao, K. Data-driven fault diagnosis for PEM fuel cell system using sensor pre-selection method and artificial neural network model. IEEE Trans. Energy Convers. 2022, 37, 1589–1599. [Google Scholar] [CrossRef]
  16. Tian, J.; Xiong, R.; Shen, W.; Lu, J. Data-driven battery degradation prediction: Forecasting voltage-capacity curves using one-cycle data. EcoMat 2022, 4, e12213. [Google Scholar] [CrossRef]
  17. Quan, R.; Liang, W.; Wang, J.; Li, X.; Chang, Y. An enhanced fault diagnosis method for fuel cell system using a kernel extreme learning machine optimized with improved sparrow search algorithm. Int. J. Hydrogen Energy 2024, 50, 1184–1196. [Google Scholar] [CrossRef]
  18. Hu, J.; Bian, X.; Wei, Z.; Li, J.; He, H. Residual statistics-based current sensor fault diagnosis for smart battery management. IEEE J. Emerg. Sel. Top. Power Electron. 2021, 10, 2435–2444. [Google Scholar] [CrossRef]
  19. Esmaili, Q.; Nimvari, M.E.; Jouybari, N.F.; Chen, Y.-S. Model based water management diagnosis in polymer electrolyte membrane fuel cell. Int. J. Hydrogen Energy 2020, 45, 15618–15629. [Google Scholar] [CrossRef]
  20. Lee, W.-Y.; Oh, H.; Kim, M.; Choi, Y.-Y.; Sohn, Y.-J.; Kim, S.-G. Hierarchical fault diagnostic method for a polymer electrolyte fuel cell system. Int. J. Hydrogen Energy 2020, 45, 25733–25746. [Google Scholar] [CrossRef]
  21. Yang, D.; Wang, Y.; Chen, Z. Robust fault diagnosis and fault tolerant control for PEMFC system based on an augmented LPV observer. Int. J. Hydrogen Energy 2020, 45, 13508–13522. [Google Scholar] [CrossRef]
  22. Karyofylli, V.; Danner, Y.; Raman, K.A.; Kungl, H.; Karl, A.; Jodat, E.; Eichel, R.-A. Sensitivity analysis and uncertainty quantification in predictive modeling of proton-exchange membrane electrolytic cells. J. Power Sources 2024, 600, 234209. [Google Scholar] [CrossRef]
  23. Li, K.; Hong, J.; Zhang, C.; Liang, F.; Yang, H.; Ma, F.; Wang, F. Health state monitoring and predicting of proton exchange membrane fuel cells: A review. J. Power Sources 2024, 612, 234828. [Google Scholar] [CrossRef]
  24. Yi, F.; Sun, Y.; Zhang, J.; Zhou, J.; Zhang, C.; Yu, W.; Gong, H. Early flooding fault diagnosis method of fuel cell based on feature amplification transformer. Int. J. Hydrogen Energy 2025, 119, 13–24. [Google Scholar] [CrossRef]
  25. Wang, Z.; Gao, Y.; Yu, J.; Tian, L.; Yin, C. Data-driven fault diagnosis of PEMFC water management with segmented cell and deep learning technologies. Int. J. Hydrogen Energy 2024, 67, 715–727. [Google Scholar] [CrossRef]
  26. Chen, Y.; Zhang, J.; Zhai, S.; Hu, Z. Data-driven modeling and fault diagnosis for fuel cell vehicles using deep learning. Energy AI 2024, 16, 100345. [Google Scholar] [CrossRef]
  27. Han, F.; Tian, Y.; Zou, Q.; Zhang, X. Research on the fault diagnosis of a polymer electrolyte membrane fuel cell system. Energies 2020, 13, 2531. [Google Scholar] [CrossRef]
  28. Gu, X.; Hou, Z.; Cai, J. Data-based flooding fault diagnosis of proton exchange membrane fuel cell systems using LSTM networks. Energy AI 2021, 4, 100056. [Google Scholar] [CrossRef]
  29. Deng, X.; Ren, Y.; Zhao, Z.; Lian, H.; Du, D. Fault diagnosis of proton exchange membrane fuel cells based on CNN neural network. In Proceedings of the 2023 CAA Symposium on Fault Detection, Supervision and Safety for Technical Processes (SAFEPROCESS), Yibin, China, 22–24 September 2023; IEEE: New York, NY, USA, 2023; pp. 1–6. [Google Scholar]
  30. Mahesh, T.; Chandrasekaran, S.; Ram, V.A.; Kumar, V.V.; Vivek, V.; Guluwadi, S. Data-driven intelligent condition adaptation of feature extraction for bearing fault detection using deep responsible active learning. IEEE Access 2024, 12, 45381–45397. [Google Scholar] [CrossRef]
  31. Cao, F.; Tang, Z.; Zhu, C.; He, X. Data-driven hierarchical collaborative optimization method with multi-fidelity modeling for aerodynamic optimization. Aerosp. Sci. Technol. 2024, 150, 109206. [Google Scholar] [CrossRef]
  32. Chen, X.; Jin, X.; Huang, Z. Stability and reliability analysis of nonlinear stochastic system using data-driven dimensional analysis method. Mech. Syst. Signal Process. 2024, 212, 111299. [Google Scholar] [CrossRef]
  33. Mao, L.; Jackson, L.; Dunnett, S. Fault diagnosis of practical polymer electrolyte membrane (PEM) fuel cell system with data-driven approaches. Fuel Cells 2017, 17, 247–258. [Google Scholar] [CrossRef]
  34. Hong, J.; Yang, J.; Weng, Z.; Ma, F.; Liang, F.; Zhang, C. Review on proton exchange membrane fuel cells: Safety analysis and fault diagnosis. J. Power Sources 2024, 617, 235118. [Google Scholar] [CrossRef]
  35. Xu, L.; Xu, L.; Shao, Y.; Zhang, X.; Hu, Z.; Li, J.; Ouyang, M. Effects of hydrogen dilution on performance and in-plane uniformity of large-scale PEM fuel cell with low anode catalyst loading. Appl. Energy 2025, 379, 124992. [Google Scholar] [CrossRef]
  36. Lei, J.; Wang, Z.; Zhang, Y.; Ju, M.; Fei, H.; Wang, S.; Fu, C.; Yuan, X.; Fu, Q.; Farid, M.U.; et al. Understanding and resolving the heterogeneous degradation of anion exchange membrane water electrolysis for large-scale hydrogen production. Carbon Neutrality 2024, 3, 25. [Google Scholar] [CrossRef]
  37. Zhao, H.; Li, W.; Wang, X.; Liu, M.; Zhang, C. Safety analysis of a hydrogen-electric coupling system in confined space. Int. J. Hydrogen Energy 2025, 119, 294–308. [Google Scholar] [CrossRef]
  38. Arun, M.; Giddey, S.; Joseph, P.; Dhawale, D.S. Challenges and mitigation strategies for general failure and degradation in polymer electrolyte membrane-based fuel cells and electrolysers. J. Mater. Chem. A 2025, 13, 11236–11263. [Google Scholar] [CrossRef]
  39. Vandenberghe, F.; Micoud, F.; Schott, P.; Morin, A.; Lafforgue, C.; Chatenet, M. Low-loaded catalyst layers for proton exchange membrane fuel cell dynamic operation part 1: Experimental study. Electrochim. Acta 2025, 511, 145364. [Google Scholar] [CrossRef]
  40. Niu, M.; Gao, Y.; Pan, Q.; Zhang, T. Review on factors of voltage consistency and inconsistent degradation in proton exchange membrane fuel cells. Ionics 2024, 30, 2433–2458. [Google Scholar] [CrossRef]
  41. Ma, M.; Shen, L.; Zhao, Z.; Guo, P.; Liu, J.; Xu, B.; Zhang, Z.; Zhang, Y.; Zhao, L.; Wang, Z. Activation methods and underlying performance boosting mechanisms within fuel cell catalyst layer. eScience 2024, 4, 100254. [Google Scholar] [CrossRef]
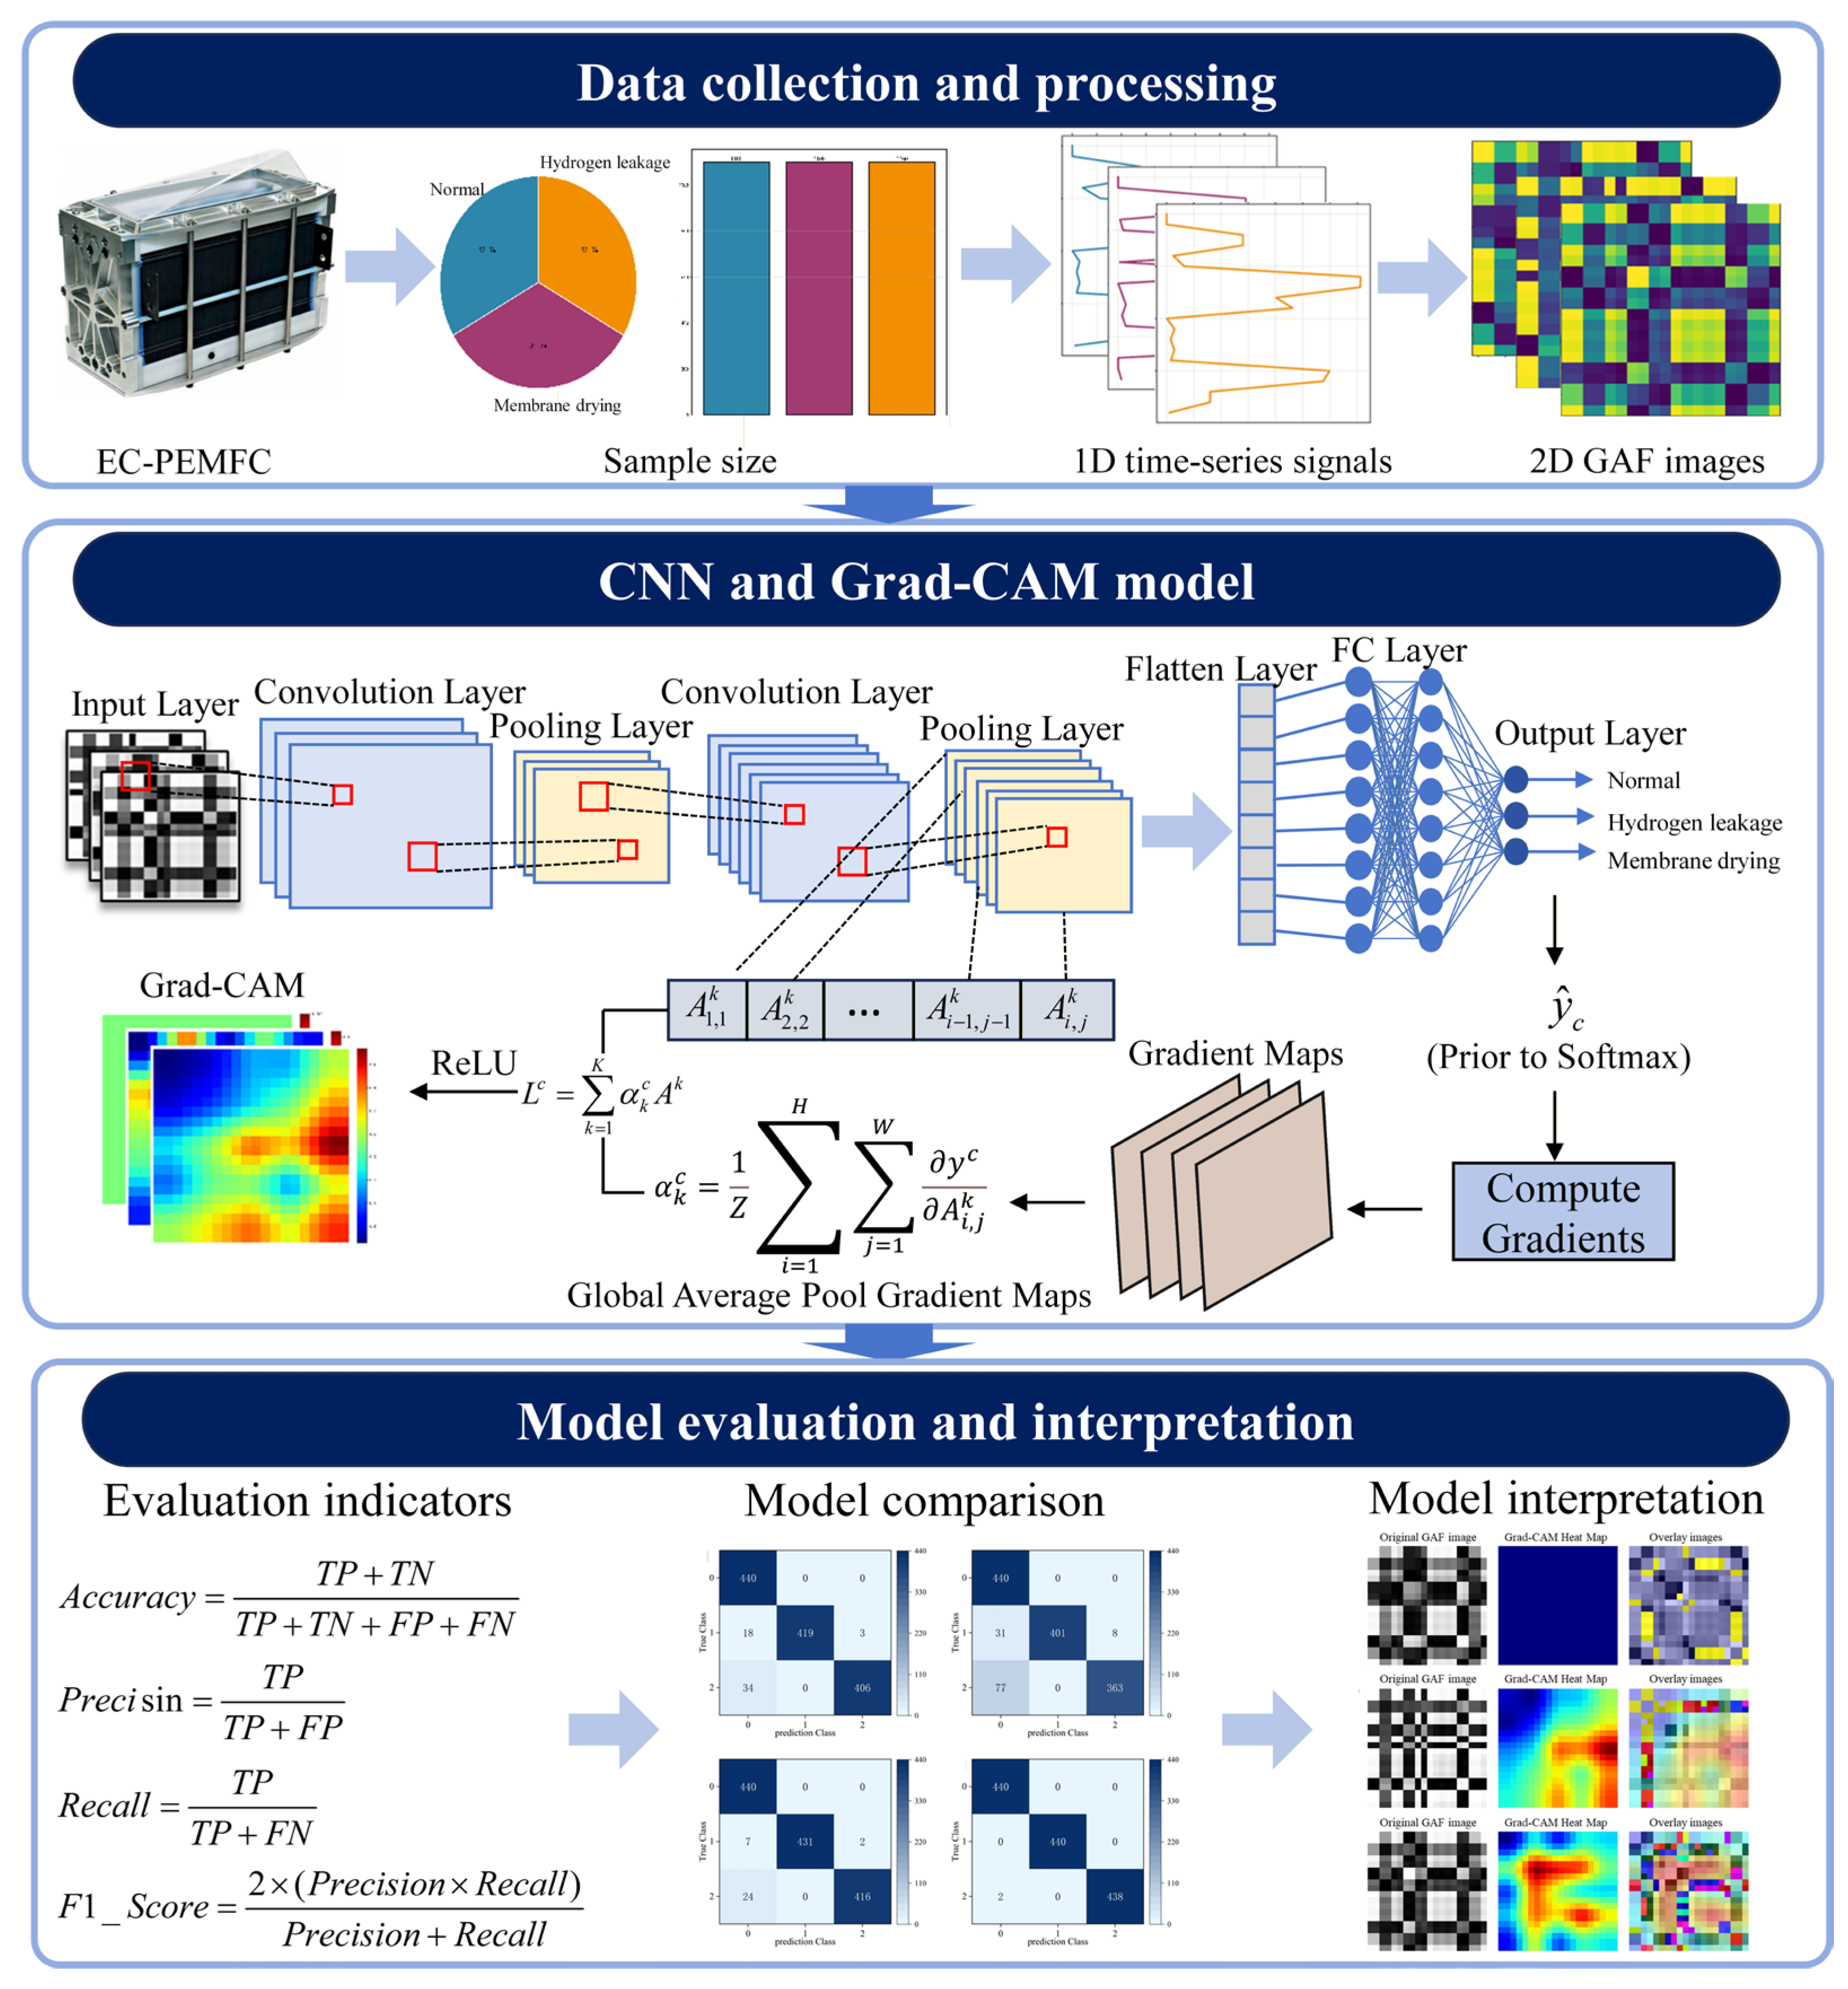
Figure 1. Schematic diagram of the proposed GAF-CNN diagnostic algorithm with an explainable AI component.
Electronics 14 04401 g001
Figure 2. The general layout of the EC-PEMFC system.
Electronics 14 04401 g002
Figure 3. Fuel cell fault diagnosis process.
Electronics 14 04401 g003
Figure 4. Fault diagnosis model test results of GAF-CNN: (a) classification results of training samples; (b) classification results of testing samples.
Electronics 14 04401 g004
Figure 5. Confusion matrix comparison of SVM, LSTM, CNN, and GAF-CNN models: (a) SVM model; (b) LSTM model; (c) CNN model; (d) GAF-CNN model.
Electronics 14 04401 g005
Figure 6. Performance Evaluation of fault diagnosis models: (a) accuracy of various algorithm classifications; (b) precision, recall, and F1-score of the model in this study.
Electronics 14 04401 g006
Figure 7. Grad-CAM heatmap of correct classification in different health states: (a) correctly classifies normal; (b) correctly classifies hydrogen leak; (c) correctly classifies membrane drying.
Electronics 14 04401 g007
Figure 8. Grad-CAM heatmap of misclassified samples: (a) the first misclassified sample; (b) the second misclassified sample.
Electronics 14 04401 g008
Table 1. Sensor measurement parameters.
VariablesUnitVariablesUnit
Anode Exhaust Pressure #1mbarCathode stoichiometryN/A
Anode Exhaust Pressure #2mbarCathode Exhaust Temperature #2°C
Cathode Exhaust Pressure #1mbarCathode supply Temperature #2°C
Cathode Exhaust Pressure #2mbarCathode Exhaust Temperature #1°C
CurrentACathode supply Temperature #1°C
Anode reactant flowSLPMCoolant supply temperature°C
Anode supply pressure #1mbarCoolant supply pressure #1mbar
Anode supply pressure #2mbarCoolant supply pressure #2mbar
Air inlet flowSLPMCoolant flow supply #1SLPM
Cathode supply Pressure #1mbarCoolant flow supply #2SLPM
Table 2. Sample numbers in each health state.
Health StateLabelSample Number
(For Training)
Sample Number
(For Testing)
Normal state0660440
Hydrogen leakage1660440
Membrane drying2660440
Disclaimer/Publisher’s Note: The statements, opinions and data contained in all publications are solely those of the individual author(s) and contributor(s) and not of MDPI and/or the editor(s). MDPI and/or the editor(s) disclaim responsibility for any injury to people or property resulting from any ideas, methods, instructions or products referred to in the content.