Abstract
An early and precise diagnosis is essential for successful intervention in Alzheimer’s disease (AD), a progressive neurological illness. In this study, we present a deep learning-based framework for multiclass classification of AD severity levels using MRI neuroimaging data. The framework integrates multiple convolutional and transformer-based architectures with a novel hybrid hyperparameter optimization strategy; Snake+EVO surpasses conventional optimizers like Genetic Algorithms and Particle Swarm Optimization by skillfully striking a balance between exploration and exploitation. A private clinical dataset yielded a classification accuracy of 99.81%for the optimized CNN model, while maintaining competitive performance on benchmark datasets such as OASIS and the Alzheimer’s Disease Multiclass Dataset. Ensemble learning further enhanced robustness by leveraging complementary model strengths, and Grad-CAM visualizations provided interpretable heatmaps highlighting clinically relevant brain regions. These findings confirm that hybrid optimization combined with ensemble learning substantially improves diagnostic accuracy, efficiency, and interpretability, establishing the proposed framework as a promising AI-assisted tool for AD staging. Future work will extend this approach to multimodal neuroimaging and longitudinal modeling to better capture disease progression and support clinical translation.
1. Introduction
Alzheimer’s disease (AD) is the most common cause of dementia and a chronic, progressive neurological illness that usually affects the elderly [1,2,3]. Its symptoms include memory loss, cognitive decline, and difficulty performing daily tasks, all of which drastically lower patients’ quality of life [4,5,6]. The global prevalence of AD is rising alarmingly, with projections estimating that by 2050, over 131 million individuals will suffer from AD and related dementias [7,8,9]. The economic expenses of AD are predicted to surpass USD 2 trillion annually by 2030 [10], making it one of the most urgent public health issues of the twenty-first century [11,12]. This rapid rise places a significant strain on healthcare systems and society. There is currently no therapy to halt or reverse the progression of the disease; therefore, therapeutic options are still limited [13]. However, research suggests that early detection and timely intervention can delay the onset of severe symptoms and improve patient outcomes. Since clinical symptoms and biomarker patterns greatly overlap, one of the main obstacles in diagnosing AD is differentiating between early-stage AD, moderate cognitive impairment (MCI), and normal cognitive aging [14,15]. The inability to predict with precision which people will develop AD highlights the need for sophisticated, data-driven diagnostic technologies that can offer automated, precise, and early classification of AD phases [16,17]. Advancements in healthcare informatics and neuroimaging have transformed early AD detection, enabling non-invasive methods to study brain structural and functional changes [18]. Among neuroimaging techniques, Magnetic Resonance Imaging (MRI) is widely used for assessing brain atrophy, hippocampal volume loss, and ventricular enlargement, which are hallmark indicators of AD-related neurodegeneration [19]. Researchers and physicians can detect small changes in the brain linked to various phases of AD thanks to MRI’s high-resolution imaging of brain tissue structures [20]. However, the manual interpretation of MRI scans is highly time-consuming, requiring expert radiologists to analyze and extract meaningful features [21]. Furthermore, distinguishing healthy brain tissue from early-stage neurodegeneration is complex, as MCI and early AD exhibit subtle differences that can be challenging to detect through traditional manual analysis. Early detection methods for AD necessitate AI and deep learning systems owing to current diagnostic limits that require improvement. This study develops an ensemble deep learning technique to classify multiple categories of Alzheimer’s disease by processing MRI neuroimaging scans. A comparison between individual deep learning models (CNN, MobileNet and Xception) and an ensemble learning method, which unites multiple prediction outputs to optimize diagnosis accuracy, takes place in this research. Our model optimization includes the integration of Snake Optimization and EVO as hybrid evolutionary-based optimization algorithms that help adjust hyperparameters for improved model operational efficiency and stability. Our approach utilizes Grad-CAM for explaining deep learning-based diagnosis through visualization of significant brain regions that affect predictions, which adds both interpretability and clinical relevance to the diagnostic process.
The proposed framework demonstrates excellent results when tested against two benchmark MRI datasets, with the goal of identifying AD stages among Non-Demented to Moderate Demented categories. Furthermore, to strengthen the validity and reliability of our methodology, we extended the study by incorporating a real-world private hospital dataset alongside the ADNI benchmark. This addition ensures that our framework generalizes effectively across both controlled research datasets and heterogeneous clinical imaging data. In addition, we integrated a Vision Transformer (ViT) into the model comparison, providing a transformer-based baseline that complements CNN architectures and highlights the adaptability of our framework to cutting-edge deep learning paradigms.
Overall, the research outcome supports the development of AI-based Alzheimer’s disease diagnostic tools, which enable automated early diagnosis and enhance clinical determination capabilities. By validating the approach on multiple datasets and expanding the model spectrum, this study confirms the robustness and generalizability of the proposed ensemble and optimization framework, thereby advancing early Alzheimer’s disease classification through deep learning, ensemble learning, and hybrid optimization techniques to provide neurologists and radiologists with faster and more accurate diagnostic support.
2. Related Works
This section presents a comprehensive overview of recent advancements in Alzheimer’s disease diagnosis using deep learning and machine learning techniques. We begin by reviewing key state-of-the-art studies that address various challenges in AD classification through diverse methodologies, models, and datasets. This is followed by an analysis of existing research gaps, highlighting the limitations in scalability, interpretability, generalization, and optimization. These insights provide the foundation for positioning our proposed framework as a robust and innovative contribution to the field.
2.1. Literature Review
Numerous recent studies have demonstrated the growing effectiveness of deep learning and machine learning techniques in the automated diagnosis of Alzheimer’s disease (AD), especially using neuroimaging data. The authors in this paper [22] demonstrate how deep learning techniques aid computer-aided diagnosis systems for detecting Alzheimer’s disease (AD) through neuroimaging data analysis. Researchers conduct their study because AD diagnosis remains difficult because of complex pathology and treatment limitations to provide better clinical image analysis support. The research presents a deep-ensemble system that automatically identifies dementia stages in brain images through model comparison of different deep learning frameworks. Their research method delivered outstanding diagnostic accuracy across different MRI and fMRI datasets through binary AD discrimination with 98.51% success and multiclass dementia assessment with 98.67%. The exceptional performance and ability of their approach to handle multiple datasets suggests this method demonstrates pioneering capabilities, which will provide great potential value for future clinical applications and expansion to new imaging techniques. The authors of [23] introduced CNN-Conv1D-LSTM as well as HReENet to help identify individuals with Alzheimer’s disease. The CNN-Conv1D-LSTM model achieves feature extraction with CNNs before passing inputs to a Conv1D-LSTM classifier for sequence learning, and HReENet performs better by generating predictions from both CNNs and LSTM and CNN-Conv1D-LSTM components collectively. The research presents a cross-validation framework, which evaluates both CNN-Conv1D-LSTM and standalone LSTM and CNNs against each other. The study reports excellent results showing that CNN-Conv1D-LSTM produced 98.75% accuracy and HReENet delivered 99.97% accuracy. The research presents ALZ-IS, which serves as an online diagnostic system that supports medical personnel during the identification process for AD. The study shows the ensemble approach as a reliable method for AD detection, which offers strong performance potential in terms of early and precise identification of AD. A transfer learning-based approach for AD diagnosis using MRI data is described in this research [24]. The study makes use of transfer learning because early and precise diagnosis requires modification of model weights to extract relevant data from MRI scans. The developed features enable pre-trained model training before parameters go through an ensemble classifier enhancement process. MRI scans from AD patients and healthy subjects were evaluated through the ensemble approach, which yielded a diagnosis accuracy of 95%. The research shows that transfer learning functions effectively to enhance AD detection capacities, which could result in improved patient care combined with improved clinical management procedures. A study [25] examines how to classify Alzheimer’s patients using neuroimaging data analysis and machine learning algorithms and ensemble-based models. A research study uses ADNI data to analyze various machine learning models such as Decision Tree (DT), Random Forest (RF), Naïve Bayes (NB), K-Nearest Neighbor (K-NN), and Support Vector Machine (SVM) in different variations together with Gradient Boost (GB), Extreme Gradient Boosting (XGB) and Multi-Layer Perceptron Neural Network (MLP-NN). The combination of XGB, DT, and SVM with a polynomial kernel (XGB + DT + SVM) delivers outstanding results because it surpasses other algorithms while reaching 95.75% accuracy levels through hyperparameter optimization. K-fold cross-validation, Friedman’s rank test, and the t-test are statistical evaluations that show the efficacy and dependability of the suggested solution. Research demonstrates that AI-powered computer-aided diagnosis systems enhance early diagnosis and classification of AD, as they provide better clinical support. A deep learning methodology for AD multilevel classification through MRI is introduced in this paper [26]. The research utilizes transfer learning with VGG16 to perform classification of subjects among the Non-Demented, Very Mild Demented, Mild Demented and Moderate Demented categories. Pre-trained weights obtained from ImageNet enable the proposed method to function efficiently with a restricted dataset without requiring elaborate training. The proposed method reaches 99% accuracy, which outperforms all prior research findings. The study makes use of Grad-CAM heatmaps, which identify specific brain regions for better interpretation of findings. Future research plans to add PET and fMRI modalities for improving performance while the proposed method proves its effective outcome. A novel ensemble deep learning system for Alzheimer’s disease multiclass diagnosis is introduced in research [27] that uses MRI scans. This study tackles the shortcomings of single CNN design and small data restrictions by combining predictions from many pre-trained networks, such as DenseNet-121, EfficientNet-B7, ResNet-50, and VGG-19, with a custom CNN. The implementation of the model averaging ensemble method as part of the stacking ensemble technique demonstrates improved generalization together with reduced overfitting. Tests conducted with two ADNI datasets yielded prominent results whereby the method reached 99.96% and 98.90% accuracy beyond what existing benchmark models could achieve. The detection results from ensemble learning demonstrate superior effectiveness in AD diagnosis and show promise for better class definition and early disease detection. In the study [28], a deep learning detection system for Alzheimer’s disease is demonstrated using MRI scan analysis and the optimized EfficientNet-B5 model. Training the model on the Augmented Alzheimer’s MRI Dataset V2 allows it to detect tiny medical patterns that indicate disease conditions. This deep CNN-based diagnostic system shows excellent adaptability and accuracy in detection while reaching 96.64% verification accuracy. The research demonstrates that deep learning delivers excellent results in medical image analysis for early Alzheimer’s disease detection. These research findings establish this approach’s direct medical use because it brings better disease control and improved health outcomes for patients. In addition to estimating confidence measures for illness detection, the paper [29] presents a deep learning framework for identifying the stages of Alzheimer’s disease in individuals. This research adopts a convolutional neural network (CNN) to analyze extensive data, including cognitive assessment results and tau-PET and MRI neuroimaging outcomes, as well as medical history records and APoE genotype and patient demographics, rather than applying deep learning techniques to group-level data with reduced information variety. The model uses softmax-based confidence metrics to measure the accuracy levels of its class evaluation processes. During leave-one-out cross-validation, the CNN produced accurate classifications of 83–85% across healthy control and ASD/AD groups along with corresponding confidence levels between 78 and 83%. The model achieved enhanced correct prediction confidence by using optimal softmax temperature value adjustments, which improved certainty distinctions. AI-driven AD diagnosis benefits from this approach through improved confidence, which can also apply to other medical classification functions that need decision confidence. The study [30] shows how deep convolutional generative adversarial networks (DCGANs) may be used to synthesize brain PET images in three stages of Alzheimer’s disease, moderate cognitive impairment, and normal control. The proposed method addresses the difficulty of obtaining extensive labeled medical data by creating high-quality synthetic data, which supports automated disease diagnosis systems. The model evaluation included both quantitative metrics such as peak signal-to-noise ratio (PSNR) and structural similarity index measure (SSIM) along with qualitative assessment, leading to substantial scores for all three stages of disease. The VGG16-based classification model that processed synthetic images reached 72% accuracy, whereas its AD F1-score reached 0.83 alongside CN at 0.53 and MCI at 0.65. Synthetic images produced through this approach match real PET scans to levels that make them useful for augmenting neurodegenerative disease diagnosis datasets. The proposed model development targets three-dimensional imaging through three-dimensional GANs for improved diagnostic capability, although model simplicity and data acquisition expenses will decrease. A deep learning method that uses MRI brain image analysis to identify the various phases of Alzheimer’s disease is demonstrated in the paper [31]. Due to limited access to medical information and accuracy issues, the clinical usage of deep learning methods for AD identification is still limited. The research uses a stacked ensemble of combined pre-trained deep learning models for transfer learning to achieve better classification results despite facing these challenges. The research team tested its proposed method on the Kaggle Alzheimer’s dataset and reached 97.8% accuracy in their results. Research results show deep learning offers potential for automated AD diagnosis through systems that aim to decrease healthcare worker involvement while producing better diagnostic accuracy. Visual presentation of the results together with deep learning model demonstration enables routine medical practice to integrate deep learning systems for better disease identification capabilities. The research document [32] uses machine learning and deep learning methods to identify Alzheimer’s disease through structural brain change analysis for memory disorder diagnosis. The researchers studied VGG16 alongside Inception V3 because large medical image datasets were scarce when extracting deep features from brain MRI images. PCA serves to decrease the size of features collected from the analysis. The classification procedure is carried out by the three machine learning algorithms: support vector machines, AdaBoost, and random forests. Utilizing Inception V3 features through random forest classification, the suggested model obtained the greatest accuracy scores of 73.4% on the Kaggle dataset and 77.0% on the ADNI dataset. The proposed model establishes better results than current techniques that detect AD during its early stages. The paper [33] describes the development of MultiAz-Net as an ensemble-based deep learning model for AD diagnosis through the incorporation of PET and MRI fused images. The research develops a single model to support AD detection through the integration of multi-source information between PET and MRI scans to benefit diagnosis precision. This methodology conducts image fusion and feature extraction and classification as its main sequential operations. The efficient parameter optimization of neural network design occurs through implementation of the Multi-Objective Grasshopper Optimization Algorithm (MOGOA). The developed model conducts its evaluation process through four classification challenges, which include three binary tasks together with one multi-class task using Alzheimer neuroimaging data accessible to the public. The MultiAz-Net reached 92.3% accuracy during multi-class classification, which surpassed current model performance levels. Early AD detection benefits from the model, which connects MRI and PET scan anatomical and metabolic information. Researchers in [34] proposed a hybrid model combining Convolutional Neural Networks (CNNs) with Particle Swarm Optimization (PSO) to enhance MRI-based classification of brain disorders, including Alzheimer’s disease and tumors; while CNNs perform well in medical imaging, tuning their hyperparameters remains challenging. To overcome this, PSO was used to optimize CNN configurations. Tested on three benchmark datasets (ADNI, Kaggle, and a brain tumor set), the model achieved high accuracy scores of 98.50%, 98.83%, and 97.12%, confirming its diagnostic effectiveness.
Researchers in [35] proposed a two-stage hybrid method, PSO-ALLR, to improve Alzheimer’s disease classification by reducing irrelevant features. In the initial phase, adaptive LASSO logistic regression is used for fine-tuning local selection after Particle Swarm Optimization (PSO) completes global feature selection to remove duplication. Using 197 MRI samples from the ADNI database, the approach was tested and showed efficacy in refining diagnostic characteristics with classification accuracies of 96.27% (AD vs. HC), 84.81% (MCI vs. HC), and 76.13% (cMCI vs. sMCI).
In order to better classify people with Alzheimer’s disease (AD), moderate cognitive impairment (MCI), and cognitively normal people, researchers in [36] suggested combining a genetic algorithm with a stacking-based ensemble model. Unlike previous studies that mainly distinguished between healthy and AD groups without optimizing biomarkers or hyperparameters, this approach focuses on fine-tuning both. Using four traditional classifiers and genetic algorithm-based optimization, the model achieved strong performance with 96.7% accuracy, 97.9% precision, 96.5% recall and a 97.1% F1-score. Table 1 provides insight into limitations of current models.

Table 1.
Comparativesummary of recent studies on Alzheimer’s disease classification.
2.2. Research Gaps
Even though current research has made great strides in using machine learning and deep learning methods to classify Alzheimer’s disease (AD), a number of issues still need to be resolved. A common shortcoming lies in the reliance on either single-model architectures or fixed ensemble strategies, which may lack the robustness and adaptability required for real-world clinical deployment. For instance, while ensemble methods such as those proposed in [22,27] demonstrated high accuracy, they often neglect optimization of hyperparameters across diverse datasets, which can result in reduced generalization when applied to new or imbalanced data. Similarly, models such as CNN-Conv1D-LSTM and HReENet in [23] focus primarily on sequential learning without offering interpretability or explainability features crucial for clinical trust. Moreover, several approaches, including transfer learning-based models [24,26], show promising performance but fail to integrate advanced optimization techniques, potentially limiting their performance ceiling. Additionally, although some studies utilize Grad-CAM for interpretability, this is not consistently applied across all architectures, leaving a gap in model transparency. Synthetic data generation via GANs, as explored in [30], addresses data scarcity but introduces risks of data bias and lacks thorough clinical validation.
Furthermore, the work in [34] successfully applies PSO for CNN hyperparameter tuning, achieving high classification accuracy. Its performance claims are limited, though, because it does not compare its outcomes to those of other well-known optimization methods like Bayesian optimization or Genetic Algorithms. Similarly, the PSO-ALLR approach in [35] focuses on feature selection and classification but remains confined to traditional machine learning pipelines, lacking integration with deep learning methods that may yield stronger representational power. The study in [36] combines stacking with a Genetic Algorithm for classifier tuning but relies solely on traditional classifiers and handcrafted features, omitting the use of deep feature representations from CNNs or transformers. Furthermore, ref. [34] applies PSO for CNN hyperparameter tuning with strong accuracy but lacks comparison with other optimizers like Genetic Algorithms or Bayesian methods. Ref. [35] uses PSO-ALLR for feature selection but remains limited to traditional ML, without leveraging deep learning’s representational power. Ref. [36] integrates stacking with a Genetic Algorithm but relies solely on traditional classifiers, excluding deep features from CNNs or transformers.
Most critically, few works integrate evolutionary-based optimization algorithms with ensemble deep learning models to enhance both performance and stability. These gaps highlight the need for a unified framework that combines the strengths of multiple architectures, employs robust hybrid optimization methods, and ensures model interpretability—an approach this study aims to fulfill.
3. Proposed Method
The proposed deep learning approach creates a structured system to achieve precise Alzheimer’s disease classification across multiple datasets (Figure 1). The initial stage of the method includes obtaining and preparing MRI data, where images are resized to standardized dimensions and pixel values are normalized to lie within [0,1] for stable training. The classification process requires categorical labels to be converted into one-hot encoded vectors, enabling multi-class operations.
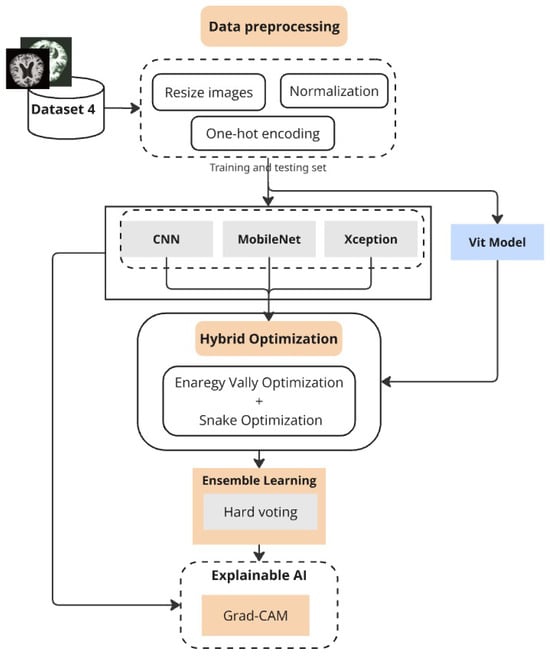
Figure 1.
Proposed framework combining preprocessing, optimized deep models, ensemble learning, and Grad-CAM.
Our platform makes use of a number of deep learning architectures, such as Vision Transformers (ViT), Xception, MobileNet, and Convolutional Neural Networks (CNN). These models serve as feature extractors and classifiers but are trained and evaluated independently to assess their individual strengths. The superiority of each model varies across datasets: while MobileNet shows competitive performance on lighter datasets, CNN demonstrates superior accuracy on larger clinical data. To ensure robust generalization, K-fold and GroupKFold cross-validation strategies are employed, the latter being crucial when subject-level grouping is necessary to prevent data leakage.
To enhance classification performance, we developed an ensemble model that integrates CNN, MobileNet, and Xception through hard voting, thereby harmonizing the strengths of multiple architectures. Hyperparameter optimization of both single models and the ensemble is conducted using a hybrid strategy that combines Energy Valley Optimization (EVO) and Snake Optimization. This dual approach identifies optimal values for parameters such as dropout rates and batch sizes, effectively balancing predictive performance with computational efficiency. Grad-CAM visualization is further employed to interpret model predictions by highlighting brain regions most influential in classification, which improves clinical trust and interpretability.
Along with the smaller MRI dataset and the standard benchmarking on the Alzheimer’s Disease Multiclass Dataset, we extended evaluation to the OASIS-3 dataset and a private clinical MRI dataset gathered in Libya. The inclusion of OASIS ensures scientifically sound subject-wise evaluation using GroupKFold to avoid patient-level leakage, while the private dataset validates the framework under real-world clinical conditions. We also incorporated the widely recognized ADNI dataset for further benchmarking against established research baselines. These additions, along with the exploration of additional deep learning models such as ViT, significantly strengthen the reliability and comprehensiveness of our study. Overall, the proposed hybrid optimization and ensemble framework not only achieve high classification accuracy but also provide interpretability and strong generalizability across diverse datasets.
3.1. Data Overview
3.1.1. Alzheimer’s Disease Dataset
The first dataset, the Alzheimer’s Disease Multiclass Dataset, is a sizable collection of MRI pictures intended for categorization of the course of Alzheimer’s disease using machine learning. It originally contained 44,000 MRI scans, categorized into four severity levels: NonDemented, Very Mild Demented, Mild Demented, and Moderate Demented. Each image is skull-stripped and preprocessed to remove non-brain tissue, ensuring a clean and standardized dataset for deep learning applications. In our work, we utilize a subset of 33,984 images, distributed across the four categories as follows: NonDemented (9600 images), Mild Demented (8960), Very Mild Demented (8960), and Moderate Demented (6464). The dataset is ideal for training and assessing deep learning models due to its balanced distribution and structured labeling, which allows for precise classification of Alzheimer’s disease severity and promotes improvements in computer-aided diagnosis.
3.1.2. MRI Dataset
The second dataset includes training and testing MRI pictures labeled as "Mild Demented", "Non-Demented", and "Very Demented". It has two folders; the original folder contains original MRI data, and the second one contains augmented images to provide better generalization to the model. Images are fed using the input shape (224, 224, 3), and preprocessing is applied to the images, which are one of the required input formats defined on the architecture. The annotated dataset is a reliable ground truth for developing and evaluating machine learning-based models that automatically classify Alzheimer’s disease and contains 3714 diverse images.
3.1.3. OASIS-3 Dataset
To further strengthen the generalizability and scientific soundness of our framework, we additionally evaluated our models on the Open Access Series of Imaging Studies (OASIS-3) dataset. OASIS-3 is a well-established neuroimaging repository that contains longitudinal magnetic resonance imaging (MRI) data from over 1000 subjects, ranging from cognitively normal individuals to patients with Mild Cognitive Impairment (MCI) and Alzheimer’s disease. The dataset includes T1-weighted 3D MRI scans with detailed clinical and demographic information.
For the purpose of this study, we extracted 2D slices from the 3D scans following standard preprocessing steps (skull stripping, intensity normalization, resizing to ), and organized them into clinically relevant severity categories. To avoid patient-level data leakage, we employed GroupKFold cross-validation, ensuring that all slices from the same subject were assigned exclusively to a single fold (either training, validation, or test). This procedure prevents overestimation of performance due to the presence of correlated slices across folds.
By including OASIS-3 alongside the Alzheimer’s Disease Multiclass Dataset, the MRI Dataset, and the private Libyan clinical dataset, we provide a more comprehensive and rigorous evaluation of the proposed framework across both public benchmarks and real-world clinical data.
3.1.4. Private Clinical MRI Dataset
In addition to the two publicly available datasets, we incorporated a third dataset consisting of real-world MRI scans collected from a private hospital in Libya. Three categories—Non Demented, Mild Demented, and Very Demented—are applied to clinically annotated MRI images in these dataset. To protect patient privacy, all scans were anonymized. To guarantee comparability with public datasets, preprocessing techniques, including intensity normalization and skull-stripping, were used. Due to ethical and institutional restrictions, these datasets cannot be made publicly available. Nevertheless, it provides an important independent test bed for validating the generalizability of the proposed framework in a real clinical environment.
3.2. Data Preprocessing
Data preprocessing constitutes an essential process to achieve quality data consistency for deep learning model training. The methodology uses a set of preprocessing methods to normalize MRI images between various datasets through resizing images and implementing normalization procedures and converting labels into numerical formats. The applied transformations improve model generalization in addition to boosting the learning process efficiency.
3.2.1. Image Resizing
Deep learning models require pixel images for input, and therefore we normalize all images to this fixed resolution to achieve compatibility with MobileNet and Xception. The dimension adjustments preserve essential imaging elements but establish identical patterns among the various clinical datasets [37,38].
3.2.2. Normalization
The pixel intensity scales of MRI images appear between 0 and 255, and they exist in grayscale and RGB data formats. The training process benefits from min-max scaling normalization of pixel values to establish as their range for better numerical stability and accelerated convergence [39].
where
- I represents the original pixel intensity;
- and denote the minimum and maximum intensity values in the dataset;
- is the normalized pixel intensity.
This normalization ensures that all images have a uniform scale, preventing large variations in pixel values from affecting the learning process.
3.2.3. Label Encoding
The deep learning model needs numerical data inputs from the classifier’s multiple disease type categories. The conversion method we chose for categorical labels is the binary vector approach through one-hot encoding. Among the collection of C different classes, we use a coding system to transform the y label into a set of numerical values.
If there were four categories, for example: Moderate Demented (MOD), Mild Demented (MD), Very Mild Demented (VMD), and Non-Demented (ND), a label like Mild Demented (MD) would be encoded as follows:
3.3. Modeling
The study uses three deep learning networks—the Convolutional Neural Network (CNN), MobileNet, and Xception—to assess and classify MRI data for Alzheimer’s disease. The selection of these models took place because they revealed excellent proficiency for medical imaging data analysis, thus providing optimal results for disease state discrimination. Multiple architectural models exist with varying complexity levels because they enhance the understanding of alternative defensive approaches for diagnosing Alzheimer’s.
3.3.1. Convolutional Neural Network (CNN)
The researchers use a standard Convolutional Neural Network (CNN) for baseline testing because this previously successful method works well with medical image analysis [40]. Multiple convolutional layers in CNNs extract increasing levels of spatial features from images, which help detect abnormal tissue patterns showing signs of Alzheimer’s disease [41]. The network includes convolutional layers activated by ReLU, which are followed by max-pooling layers that perform spatial downsampling and finally connected layers for creating classifications [42]. Model generalization receives added benefits from dropout regularization and batch normalization, which work together to prevent overfitting issues. The computational efficiency of CNNs allows their optimal application to extract low-to-mid-level features from MRI scans, thus making them essential for our ensemble framework.
The proposed CNN architecture used in this study is structured to balance accuracy and training efficiency by applying a compact yet effective configuration. It includes two convolutional layers with max pooling, followed by dense layers and a high dropout rate to avoid overfitting. The model is optimized using the Adam optimizer with categorical crossentropy loss for multi-class classification. The full parameter configuration is shown in Table 2.

Table 2.
CNN architecture parameters and configuration.
3.3.2. MobileNet
Our method involves the integration of MobileNet because it enables high-accuracy classification combined with computational efficiency in mobile and embedded applications. MobileNet uses depthwise separable convolutions to split standard convolutions into two sequential parts that decrease the trainable parameter count without sacrificing model effectiveness. MobileNet provides remarkable efficiency for medical image classification because of its design, which performs well when applied to resource-limited environments. Global average pooling enhances the network architecture by reducing overfitting because it summarizes feature maps prior to classification. MobileNet provides effective high-resolution MRI processing alongside fast inference speeds because of its efficient feature extraction abilities [43].
In the proposed MobileNet-based architecture, we fine-tuned a pretrained MobileNet model by freezing the majority of its layers while allowing the last two layers to remain trainable. This strategy leverages pretrained ImageNet knowledge while permitting targeted adaptation to MRI data. The model is extended with four dense layers of gradually decreasing size, interleaved with dropout layers to enhance regularization and prevent overfitting. A final softmax output layer with four units enables multi-class classification across Alzheimer’s disease stages. Table 3 outlines the full parameter configuration used for training the model.

Table 3.
MobileNet architecture parameters and configuration.
3.3.3. Xception
The Xception architecture, featuring improved versions of the Inception model, serves our study because it recognizes complex image patterns while reducing computational redundancy. Xception implements extreme inception as its basis by substituting standard convolutions with depthwise separable convolutions together with residual connections [44]. The network design enables effective learning of spatial patterns between channels, thus achieving better results in classification tasks. Medical studies show that features extracted by Xception perform better than traditional convolutional neural networks because high intra-class variation is present across Alzheimer’s disease stages [45]. During backpropagation the efficient gradient flow becomes possible when skip connections are implemented, which subsequently enhances model convergence and training stability.
The detailed configuration of the proposed Xception-based model, including architectural components, hyperparameters, and training settings, is summarized in Table 4. The Xception model is initialized with ImageNet weights, with all layers frozen except the last two to retain generalized features while enabling fine-tuning on Alzheimer’s MRI scans. After flattening the base model’s output, the architecture includes a series of densely connected layers with gradually reduced dimensions (2048 to 128 units), each followed by dropout layers for regularization. This hierarchical design enables progressive abstraction of features while preventing overfitting. The final dense layer uses Softmax activation for multi-class classification. The configuration provides a balance between expressive capacity and training stability, making it suitable for modeling complex neurodegenerative patterns associated with Alzheimer’s disease.

Table 4.
Xception architecture parameters and configuration.
Each of these architectures makes a distinct contribution to our research by providing a balance between classification accuracy, feature extraction depth, and computational efficiency. Our goal is to determine the best model for classifying Alzheimer’s disease by comparing CNN, MobileNet, and Xception on a variety of datasets. We will then include these models into an ensemble learning framework to improve predictive performance.
3.3.4. Vision Transformer (ViT)
We included the Vision Transformer (ViT) architecture in our analysis in addition to CNN-based models. ViT has lately become a potent substitute for convolutional networks in medical image analysis because it uses self-attention processes instead of localized convolutions to simulate global context and long-range dependencies [46]. This characteristic is especially beneficial for Alzheimer’s disease classification, where subtle structural changes across different brain regions may span larger receptive fields than traditional convolutional filters can capture.
The ViT model partitions each MRI image into fixed-size patches (e.g., ), linearly projects them into embeddings, and processes the resulting sequence through multiple transformer encoder layers. Each encoder block consists of multi-head self-attention, layer normalization, and feed-forward sublayers, allowing the network to capture global spatial correlations effectively. A classification token is appended to the sequence, and its final state after the encoder layers is used for stage classification through a fully connected Softmax layer. Dropout and stochastic depth regularization are applied to mitigate overfitting.
For training, we initialized ViT with ImageNet-pretrained weights to leverage transfer learning, freezing the majority of layers while fine-tuning the final transformer block and classification head on MRI data. The final model configuration has a hidden dimension of 768 and 12 transformer layers with 12 attention heads each. AdamW was used to maximize training by categorical cross-entropy loss. To summarize the setup specifics, see Table 5.

Table 5.
ViT architecture parameters and configuration.
The inclusion of ViT in our comparative analysis provides a transformer-based benchmark against CNN architectures. By modeling global interactions across MRI slices, ViT offers complementary strengths to convolutional networks, and its integration enables a more comprehensive evaluation of Alzheimer’s disease classification frameworks.
3.4. Ensemble Learning
Ensemble learning is a machine learning paradigm that aims to improve predictive performance and model generalization by aggregating the outputs of multiple base learners [47]. Ensemble approaches integrate the predictions of various models rather than depending on a single classifier to improve classification robustness and minimize the shortcomings of individual learners, particularly in complicated tasks like classifying the stages of Alzheimer’s disease (AD) using MRI data. Ensemble strategies can be broadly categorized into bagging, boosting, and voting-based methods, with voting being especially effective in multiclass classification problems. In this work, we employ a probabilistic soft voting ensemble approach, which combines the strengths of three distinct deep learning architectures: Convolutional Neural Networks (CNN), MobileNet, and Xception. Each of these models was independently trained on the same input dataset using K-fold cross-validation, with MobileNet and Xception leveraging pre-trained weights from ImageNet to improve feature extraction. Hyperparameters were fine-tuned for each model using evolutionary-based optimization strategies—specifically, dropout rates and dense layer dimensions were adapted to balance generalization and overfitting. For instance, the MobileNet configuration included dense layers with 2048, 1024, and 512 units and a dropout rate of 0.1 to 0.5, while Xception was extended with flattened outputs and four dense layers (2048, 1024, 256, and 128 units) interleaved with dropout layers of 0.3 and 0.5.
To aggregate the predictions, we compute the softmax probability vector for each model . The final ensemble prediction is determined by averaging the softmax outputs from all models and selecting the class with the maximum average probability, as shown by the equation that follows:
where in our instance and is the expected probability of class j from model i. This strategy ensures that each model contributes equally to the final decision while leveraging their complementary strengths. The ensemble method yields improved classification performance by reducing variance and enhancing stability across folds. The detailed implementation logic of our voting mechanism is outlined in Algorithm 1, which demonstrates the steps of model prediction, averaging of softmax scores, and final decision computation. This ensemble approach proves especially effective in distinguishing between closely related Alzheimer’s disease stages, as it reduces misclassification rates and enhances interpretability when combined with Grad-CAM visualizations.
| Algorithm 1 Ensemble Voting Strategy for Multi-Model Prediction Aggregation |
|
3.5. K-Fold Cross-Validation
Machine learning, along with deep learning models, achieves performance assessment and generalization verification through K-fold cross-validation as a statistical evaluation method that specializes in small sample scenarios. The study implements K-fold cross-validation to determine the reliability and consistency of the CNN, MobileNet, and Xception models used for Alzheimer’s disease classification. During K-fold cross-validation, the information in the dataset is uniformly divided into K segments while the training operates on K-1 segments to validate performance against the remaining segment. For K times the process must run, thereby ensuring that each data point performs validation exactly once. The evaluation of model performance occurs through an average of results obtained from multiple folds, which ensures both overfitting prevention and the delivery of extensive evaluation parameters [48,49].
The proposed hard voting ensemble approach:
- Combines CNN MobileNet and Xception for feature extraction [50];
- Uses majority voting to aggregate model outputs [51];
- Minimizes bias and enhances generalization across data patterns [52];
- Improves stability and reduces overfitting for small or imbalanced datasets.
3.6. Energy Valley Optimization (EVO)
Energy Valley Optimization (EVO) works as a metaheuristic optimization algorithm based on physical systems, which uses energy minimization to achieve solution convergence through the analogy of particles resting in the lowest valley [53]. The optimization system efficiently navigates search areas between exploration and exploitation activities due to its balanced operation of diversification and intensification, which makes it ideal for optimizing deep learning model hyperparameters. EVO performs optimization of dropout rate and batch size hyperparameters in CNN and MobileNet and Xception models to guarantee that the ensemble network reaches its best performance for Alzheimer’s disease detection. The algorithm improves search precision through an iterative process that applies candidate solution evaluations to modify parameters through energy descent methods while simultaneously improving convergence speed. EVO delivers superior adaptability along with search flexibility through its method compared to conventional gradient-based optimization methods, which suits search requirements of deep learning architectures that display multiple local minima within their loss landscape. The inclusion of EVO in our optimization system enables enhanced accuracy alongside shorter processing time and elevated generalization skills in our ensemble model, which creates upgraded Alzheimer’s disease detection capabilities. As shown in Algorithm 2, the Energy Valley Optimization (EVO) algorithm adaptively explores search space to minimize objective energy efficiently.
| Algorithm 2 Energy Valley Optimization (EVO) |
|
3.7. Snake Optimization
The Snake Optimization Algorithm (SOA) represents a metaheuristic optimization approach that follows natural snake movements during their habitat searches. Through its operational model, the technique duplicates the manner in which snakes navigate environments, along with their capability to adjust routes and optimize their journey path for reaching targets. Through these two core behaviors, the algorithm enables exploration through random movements by its search agents (snakes) while performing exploitation through solution-refining movements [54]. Our research employs Snake Optimization to optimize deep learning model hyperparameters through adjustments of dropout rates and batch sizes for CNN, MobileNet and Xception networks. The algorithm supports the ensemble model to strike an equilibrium between its accuracy and generalization abilities by dynamically managing parameters for the entire training duration [55]. Snake Optimization improves upon conventional gradient-based optimization through adaptive search strategies that enhance the escape of inferior solutions [56]. The deep learning task benefits extensively from hyperparameter tuning because of this effective approach. Integration of Snake Optimization within our ensemble model improves both accuracy results and speeds up convergence rate while maintaining generalization abilities across different datasets.As shown in Algorithm 3, the Snake Optimization Algorithm (SOA) adaptively updates solutions through guided movements toward the global optimum efficiently.
| Algorithm 3 Snake Optimization Algorithm (SOA) |
|
3.8. Snake with Energy Valley Optimization (EVO) Hybrid Approach
The Snake with Energy Valley Optimization (EVO) hybrid approach is a sophisticated metaheuristic technique intended to improve deep learning model performance by efficiently adjusting hyperparameters; while traditional optimization methods such as grid search or random search often suffer from local minima entrapment and computational inefficiency, the Snake + EVO hybrid mechanism capitalizes on the exploration strength of the Snake Optimization Algorithm and the convergence capabilities of EVO to achieve superior global optimization outcomes. Snake Optimization mimics the adaptive movement behavior of snakes navigating toward a food source in dynamic environments. It incorporates sinusoidal search patterns, allowing candidate solutions to traverse the search space with flexibility and high diversity. This feature greatly improves the algorithm’s capacity to break out of local optima and investigate intriguing areas. In contrast, EVO is rooted in energy descent principles from physical systems, where particles settle into the lowest energy valleys through iterative adjustments. EVO introduces intensification, allowing refined exploitation of the best solutions via Gaussian perturbations. When combined, the Snake component introduces randomness and diverse directionality, while EVO strengthens convergence through focused refinement of elite solutions. Together, this synergy ensures a balanced optimization process that maintains both global exploration and local exploitation across iterations.
The proposed Snake + EVO hybrid optimization algorithm operates by first initializing a population of candidate hyperparameter sets—each represented by a tuple containing values for the number of convolutional filters, dropout rate, and batch size. During each iteration, the algorithm updates candidate solutions in two stages. First, the Snake component introduces movement through a sinusoidal vector relative to the best-known solution. This exploratory phase enables the population to navigate complex loss landscapes and avoid premature convergence. Subsequently, EVO fine-tunes these positions by applying Gaussian-based descent toward the best candidate, facilitating rapid convergence with high precision. Fitness evaluation is conducted by training a CNN with the candidate hyperparameters and measuring validation loss on the test set. At each step, solutions are clipped within defined bounds to ensure feasibility. If a new candidate exhibits improved performance, it replaces its predecessor. After a fixed number of iterations, the optimal configuration yielding the lowest validation loss is selected as the final solution. This hybrid approach enhances model generalization, stabilizes training, and improves classification reliability, particularly in medical image classification tasks like Alzheimer’s disease detection, where hyperparameter optimization significantly influences learning dynamics and prediction accuracy. The detailed formulation of this approach is formally described in Algorithm 4, which outlines each computational step from initialization to final convergence. As shown in Algorithm 4, the Snake + EVO hybrid optimization adaptively tunes hyperparameters, combining exploration and exploitation for optimal performance.
| Algorithm 4 Snake + EVO Hybrid Optimization for Hyperparameter Tuning |
|
3.9. Grad-CAM
Gradient-weighted Class Activation Mapping (Grad-CAM), an explainability technique, allows users to see where areas of a picture influence deep learning models during decision-making. The planned method generates a heatmap that shows essential image areas through the target class gradients that reach the last convolutional layer [57]. The application of Grad-CAM to MRI scans evaluated by CNN, MobileNet, and Xception allows our study to identify which brain regions most affect Alzheimer’s disease classification decisions. Through this method we achieve a more transparent and dependable ensemble learning approach, which provides medical practitioners and researchers with easy-to-understand visual models for interpretation of system decisions. Our deep learning models benefit from Grad-CAM integration because they maintain both high accuracy and trustworthy, explainable functionality to gain wider medical application adoption.
4. Model Performance Evaluation
To guarantee the dependability of deep learning models in medical imaging applications, including the categorization of Alzheimer’s disease (AD), it is crucial to assess their performance. In this study, we use standard evaluation metrics—Accuracy, Precision, Recall, F1-score, and Area Under the ROC Curve (AUC-ROC)—to assess and compare the classification effectiveness of CNN, MobileNet, Xception, and their ensemble variant. These metrics allow for a comprehensive analysis of model behavior in terms of correctness, sensitivity to class imbalance, and discriminative ability [58,59,60].All experiments were conducted using Python 3.10 on the Google Colab Pro environment (Google LLC, Istanbul, Türkiye), which provides a consistent computational setup with access to GPU acceleration. This setup ensured reliable execution of all deep learning experiments, reproducible training performance, and efficient model evaluation under uniform hardware and software conditions.
4.1. Accuracy
Accuracy (ACC) quantifies the proportion of correctly predicted samples among all predictions. It is defined as
where
- TP–true positives (correctly classified positive cases),
- TN—true negatives (correctly classified negative cases),
- FP—false positives (incorrectly classified as positive),
- FN—false negatives (missed positive cases).
Although accuracy provides a general indicator of correctness, it can be deceptive in datasets that are unbalanced and exhibit a dominant class [61].
4.2. Precision
Precision (PRE), or Positive Predictive Value (PPV), measures the proportion of correctly identified positive predictions as follows:
High precision reflects a low rate of false positives, which is critical in medical applications where misdiagnosing healthy individuals could lead to unnecessary stress and treatment [62].
4.3. Recall
Recall (REC), the True Positive Rate (TPR), sometimes referred to as Sensitivity, evaluates the model’s capacity to identify every real positive case as follows:
A high recall reduces the risk of missing Alzheimer’s cases but may increase the false positive rate. Therefore, precision and recall should be interpreted together [63].
4.4. F1-Score
The F1-score provides a balance between recall and precision by taking the harmonic mean of the two as follows:
It is especially useful in class-imbalanced scenarios by considering both types of misclassifications—false positives and false negatives [64].
4.5. Area Under the Receiver Operating Characteristic Curve (AUC-ROC)
The model’s capacity to differentiate between classes across all decision thresholds is assessed using the AUC-ROC statistic. TPR is plotted against FPR using the Receiver Operating Characteristic (ROC) curve, and the area under the curve (AUC) is defined as follows:
where
- TPR (Recall) = .
- FPR = .
An AUC close to 1.0 indicates strong discriminative performance, while an AUC near 0.5 suggests performance no better than random guessing [65]. Using a combination of these metrics allows for a more reliable and nuanced evaluation of model performance. This comprehensive assessment also supports effective hyperparameter tuning and ensemble optimization for improved Alzheimer’s disease classification.
5. Results and Discussions
5.1. Results of the Alzheimer’s Disease Dataset
5.1.1. CNN
Predictive classification for Alzheimer’s disease proves strong throughout different dementia stages, as shown in Table 6 precision, recall and F1-score evaluation metrics. The model maintains an 88% accuracy level, indicating successful classification of a large number of instances. Results demonstrate that the Moderate Demented category displays the best classification outcomes because 97% of predictions were correct, 100% of cases were accurate, and the F1-score reached 0.98. The Mild Demented class received a recall score of 0.92, yet the precision score remained at 0.80, indicating that the model detected most real cases with some increased probability of false positives. An F1-score of 0.88 along with an F1-score of 0.81 indicates strong but slightly lower classification consistency for the NonDemented and Very Mild Demented classes, respectively. The AUC-ROC curve allows experts to better evaluate how well the model discriminates amongst different classes. The analysis reveals through the curve that the model achieves high rates of correctly identifying different dementia conditions while maintaining minimal false positive outcomes. As shown in Figure 2 the Moderate Demented cohort stands out as the most easily distinguished class according to classification results, which achieved a 1.00 recall value, thus leading to no false negative errors. A minimal degree of misclassification occurs between the Mild Demented and Very Mild Demented classes according to their overlapping curves that match their reduced recall values. The model shows outstanding classification performance across every class based on the macro-average F1-score result of 0.88, which indicates its dependable capability for Alzheimer’s disease diagnosis.

Table 6.
Classification report of CNN fold2.
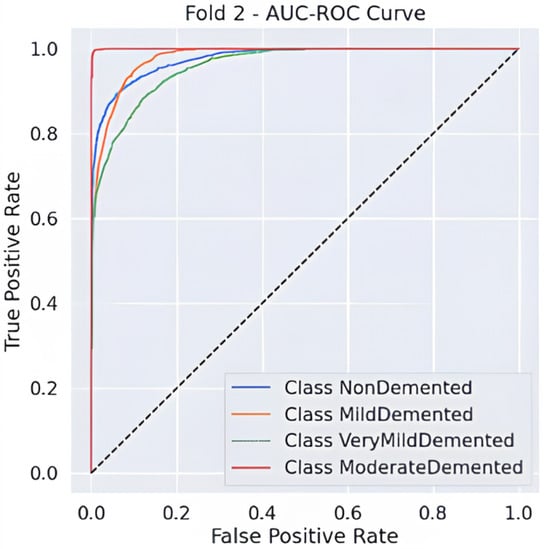
Figure 2.
AUC-ROC Curve.
5.1.2. MobileNet
Results of classification, Table 7 show that the model achieves 81% accuracy by correctly distinguishing various stages of Alzheimer’s disease. According to the classification results, the group with moderate dementia performed the best, with a precision of 0.96, a recall of 1.00, and an F1-score of 0.98. This demonstrates correct detection of almost every dementia case while maintaining zero false negative outcomes. The model effectively recognizes Mild-Demented cases through its precision score of 0.88 and recall score of 0.84, thus creating a favorable ratio between correct identifications and rejected false positives. The Very-Mild-Demented class presents moderate precision at 0.65 and high recall at 0.76, indicating the model detects most cases and tends to mix up instances with neighboring dementia categories. Early Alzheimer’s presentations share diagnostic features with normal patients, resulting in an F1-score of 0.75 through a precision value of 0.82 and a recall rate of 0.70 for non-dementia cases.

Table 7.
Classification report of MobileNet fold 3.
As shown in Figure 3 and Figure 4, throughout 10 epochs the model demonstrates effective learning behavior as accuracy patterns show steady improvement, reaching approximately 80% success rate for training and validation cases. The loss curves present a descending trend as training and validation loss decreases starting from its initial high range towards 0.4 point values. The smooth decline of the validation loss demonstrates good generalization capabilities by the model while preventing severe overfitting effects. The accuracy and loss-curve analysis shows signs that moderate regularization techniques would stabilize the overall training procedure. Model performance demonstrates excellent Alzheimer’s disease classification capabilities according to dementia class recall metrics and balanced F1-score results, and smooth training metric convergence patterns could achieve better outcomes if it improves its effectiveness between the VeryMildDemented and NonDemented category classification.
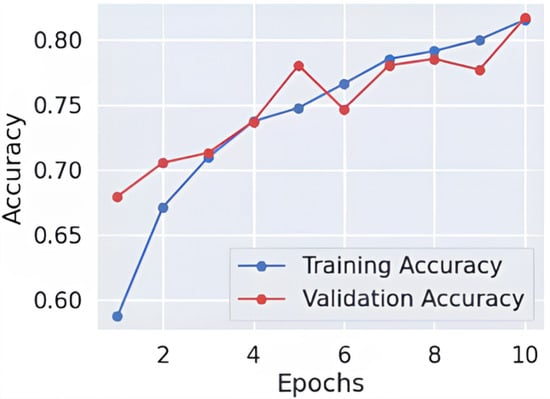
Figure 3.
Learning curve-fold 3.
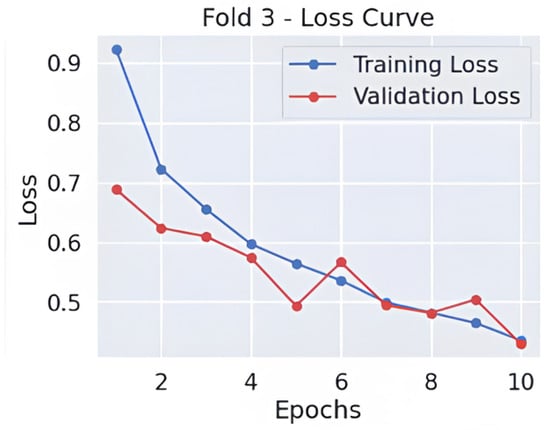
Figure 4.
Loss curve-fold 3.
5.1.3. Xception
The model delivers robust diagnostic results for Alzheimer’s disease categories and reaches 86% accuracy and a 0.87 macro-average F1-score, as shown in Table 8, which indicates good predictive balance. The Moderate Demented class reaches the most successful classification results with precision at 0.98 and recall at 0.99, as well as F1-score at 0.98, that demonstrates high accuracy rates for this group. The Mild Demented class demonstrates excellent model performance as the F1-score reaches 0.89, which indicates that most mild dementia cases are detected alongside low false positives. The Very Mild Demented class shows moderate accuracy between detection and recall through its F1-score of 0.78 while continuing to experience some classification overlap with adjacent categories. The NonDemented class shows a recall rate of 0.78 because some normal cases end up being wrongly identified as early-stage dementia cases, which confirms the clinical difficulty of distinguishing normal cognitive aging from mild impairment.

Table 8.
Classification report of Xception.
The comprehensive evaluation by AUC-ROC curves Figure 5, demonstrates robust discrimination because every class demonstrates curves that move toward the upper left corner, where true positives (TPR) achieve high rates while false positives (FPR) remain low. The Moderate Demented group exhibits the highest level of distinct segregation in the results, which corresponds to its remarkable recall score of 0.99, measuring near-perfect identification of genuine cases. An overlap exists between the Very Mild Demented and Mild Demented curves in the ROC analysis because clinical assessments show these two stages share some level of diagnostic uncertainty. The NonDemented class shows the minimum split between groups even though it maintains high overall performance in this analysis. The obtained results demonstrate that the model shows good generalizability through its high predictive accuracy with strong detection capabilities for dementia types and distinct decision regions, making it an effective Alzheimer’s disease diagnostic tool.
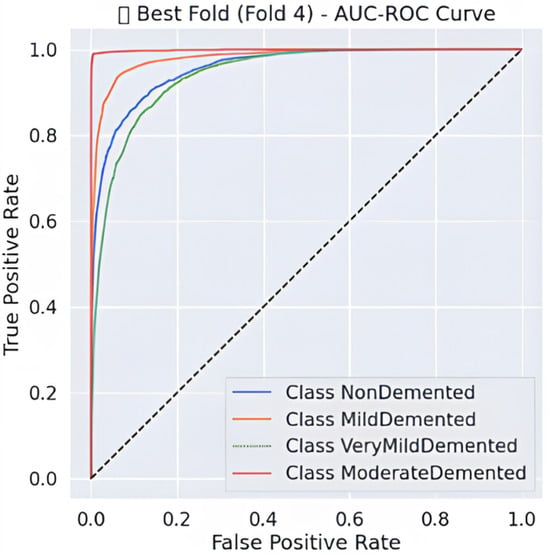
Figure 5.
AUC-ROC Curve-fold 4.
5.1.4. Hard Voting Ensemble
The hard voting ensemble model, Table 9 provides exceptional classification results by achieving 93% accuracy together with a 0.93 macro-average F1-score, which shows its strong predictive ability across all Alzheimer’s disease stages. All Moderate Demented instances underwent perfect classification since the model reached complete precision and recall and an F1-score of 1.00 while avoiding any misidentification. The Mild Demented class classification reaches values of 0.91 precision, 0.97 recall and 0.94 F1-score due to its ability to identify almost all genuine mild dementia cases with few incorrect classifications. By functioning at F1-scores of 0.91 and 0.88, the model demonstrates its capacity to properly categorize Non-Demented and Very Mild Demented cases with precision and recall balanced against each other. All classes show uniformly high recall rates within the ensemble model, which proves its ability to reduce false negative outcomes essential to medical diagnosis because it prevents misdiagnosing Alzheimer’s disease.

Table 9.
Classification report of hard voting ensemble.
The ensemble model, Figure 6 demonstrates outstanding classification potential through its AUC-ROC curves because all classes show nearly perfect performance at the top-left corner, indicating both high sensitivity and decreased false positives. A perfect recall value of 1.00 is attained by the Moderate Demented class, resulting in a nearly perfect ROC curve that shows a high model capacity to distinguish this category from other groups. The curves for the Mild and Very Mild Demented classes separate effectively due to their high precision and recall scores, but there remains some degree of overlap between these dementia progression stages. Weak dementia cases are incorrectly placed into the NonDemented class with a recall score of 0.88 while retaining high discrimination capabilities. Hard voting ensemble methodology demonstrates enhanced diagnostic reliability through better error reduction, which establishes nearly perfect specificity and sensitivity values and confirms it as an effective clinical decision tool for Alzheimer’s diagnosis.
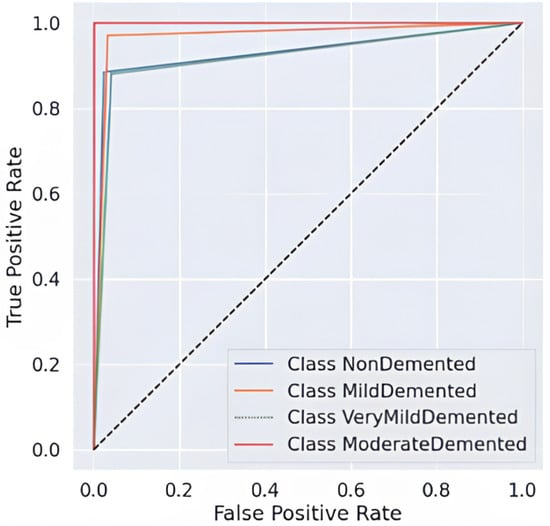
Figure 6.
AUC-ROC Curve of ensemble model.
5.1.5. Hybrid Optimization (Snake + EVO)
By integrating the Snake Optimization Algorithm (SOA) with Energy Valley Optimization (EVO), the hybrid optimization approach significantly enhances classification performance, achieving 90% accuracy and a macro-average F1-score of 0.90. As shown in Table 10, using CNN as the base model, this optimization ensures precise classification, particularly for Moderate Demented cases, where it attains near-perfect precision, recall, and F1-score of 0.99, eliminating misclassification between dementia categories. The model effectively distinguishes Very Mild Demented and Mild Demented cases, achieving F1-scores of 0.88 and 0.85, respectively, while minimizing errors. Additionally, it demonstrates an impressive F1-score of 0.91 for differentiating dementia patients from healthy individuals, despite some minor confusion between normal cognitive health and early-stage dementia. The high recall values across all classes confirm the optimization’s effectiveness in correctly identifying nearly all actual dementia cases.

Table 10.
Classification report of the hybrid optimization.
The AUC-ROC curve, shown in Figure 7, provides strong evidence of the proposed model’s ability to distinguish between different stages of Alzheimer’s disease. Each colored curve represents the ROC performance for a specific class: NonDemented, Very Mild Demented, Mild Demented, and Moderate Demented. The Moderate Demented class achieves a perfect AUC of 1.00, reflecting flawless classification with no false positives. The NonDemented and Mild Demented classes both reach high AUC scores of 0.98, indicating excellent discrimination with minimal misclassification. The Very Mild Demented class also performs well with an AUC of 0.96, though it shows slight overlap with adjacent stages, likely due to clinical similarities. The model’s strong generalization ability is demonstrated by the sharp increase in the True Positive Rate (TPR) and the continuously low False Positive Rate (FPR) across all classes. The incorporation of Snake + EVO hybrid optimization significantly boosts the classification performance and stability of the MobileNet architecture. Figure 7 visually confirms the effectiveness of our optimized model in handling multi-class Alzheimer’s disease classification with high precision and reliability.
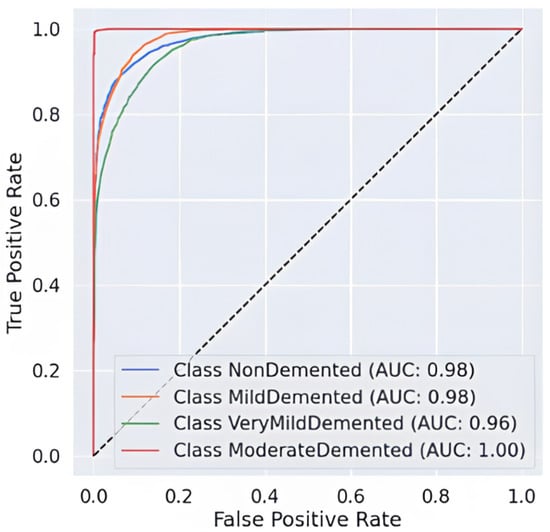
Figure 7.
AUC-ROC Curve of the hybrid optimization.
5.1.6. Comparison Results in the Alzheimer’s Disease Dataset
Due to its balanced precision and recall values at 0.93 and 92.80% accuracy with an F1-score of 0.93, the Ensemble Model, Table 11, is at the top of the performance evaluation. Hybrid optimization through Snake + EVO tuning makes CNN achieve 90.02% accuracy while also outperforming its baseline version, which had 87.22% accuracy. The Snake + EVO process produces superior generalization performance and error reduction in the optimized CNN model with a precision value of 0.91 and a recall value of 0.90. The Xception model demonstrates limited generalization capability in Alzheimer’s classification by reaching 86.82% accuracy, although possessing high architectural performance. The lightweight MobileNet model demonstrates 81.72% model accuracy along with 0.88 precision due to its ability to make reliable predictions but its difficulty in properly classifying all necessary cases.

Table 11.
Comparison results.
The study confirms ensemble learning delivers superior performance than independent models since it combines multiple architectural types to generate enhanced accuracy with dual robustness features. Through Snake + EVO, the CNN model achieved results that were marginally poorer than the ensemble performance while displaying important advantages for deep learning performance enhancement. The generalization level of CNN matches Xception, although CNN demonstrates a marginally superior performance. The accuracy performance of MobileNet remains sub-optimal when compared to other models in medical applications, yet this model exhibits strong efficiency, which benefits real-time operations. The optimized ensemble technique demonstrates the best combination of accuracy together with recall and stability, which ultimately makes it an optimal method for Alzheimer’s disease diagnosis.
5.1.7. Grad-CAM Results
The Grad-CAM visualization, which is shown in Figure 8, provides important information about how interpretable the model’s classification procedure for Alzheimer’s disease is; while the image on the right overlays a heatmap that highlights the brain regions most important to the model’s prediction, the image on the left displays the original MRI scan. Warm colors (red/yellow) indicate areas with strong activation, suggesting these regions significantly contributed to the classification, whereas cooler colors (blue/green) represent areas with minimal influence.
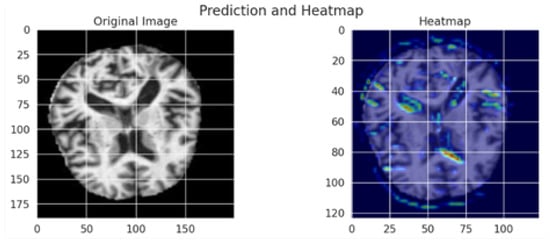
Figure 8.
Grad-CAM visualization of an MRI scan using the optimized MobileNet model.
The model’s capacity to concentrate on clinically relevant aspects is further supported by the fact that the highlighted regions match important anatomical biomarkers of Alzheimer’s disease, such as cortical atrophy and ventricular enlargement. This visualization supports transparent and explainable AI in medical diagnosis, allowing clinicians to interpret and validate the deep learning model’s outputs with greater confidence. The use of Grad-CAM enhances the trustworthiness of the proposed framework, making it more suitable for practical clinical integration.
5.2. Results of the MRI Dataset
5.2.1. CNN
The CNN conductive model, Table 12 and Figure 9 produces reliable Alzheimer’s disease detection through its 94% accuracy rate and 0.94 macro-average F1-score. The Mild Demented class demonstrates exceptional performance because the model obtains 0.98 recall and 0.95 F1-score, which indicates high efficiency in case identification with minimal incorrect negative results. A strong classification ability is reflected through the Very Demented class, which demonstrates an F1-score of 0.94. Even though the Non-Demented class reaches high precision levels (0.95), it reveals moderate limitations in recall (0.88) due to possible early dementia misclassifications. The AUC-ROC curve demonstrates excellent model performance because all classes achieve perfect discrimination through their rising true positive rates when false positive rates remain low. The experimental results validate the CNN model’s function as an accurate and trustworthy predictor because it successfully distinguishes dementia stages with precise and consistent findings.

Table 12.
Classification report of CNN.
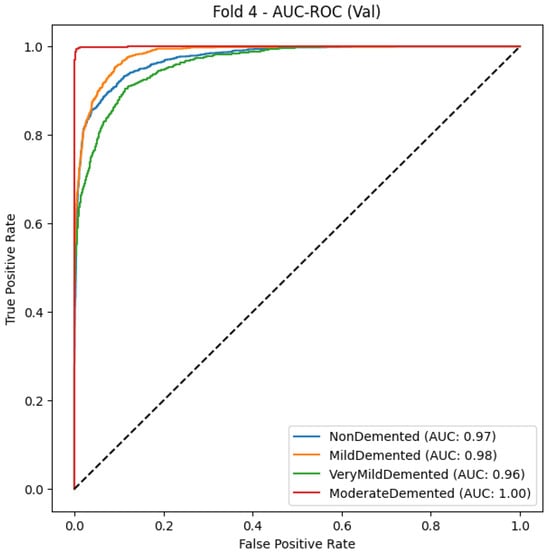
Figure 9.
CNN Model AUC-ROC Curve for multiclass Alzheimer’s classification (Fold 4).
5.2.2. MobileNet
As shown in Table 13 and Figure 10, MobileNet obtains an F1-score of 0.97, macro-average precision of 0.97, and macro-average recall of 0.96, indicating good classification accuracy, as it can correctly classify different stages of dementia. With Mild Demented and Non-Demented having an F1-score of 0.97, which denotes a very dependable classifier with extremely low false positive and false negative rates, the total performance across all categories is good. For the Very Demented class, though the recall is somewhat lower (0.94), the precision score is still excellent at 0.98, demonstrating that the model reliably identifies accurate cases of advanced dementia while avoiding misclassifying errors. Likewise, both the AUC-ROC curves provide additional evidence for the strong discriminative power of the MobileNet model, producing steep curves for all classes, demonstrating a high true positive rate (TPR) for minimum false positive rates (FPR), which is in line with the model’s ability to distinguish between classes of cognitive health. MobileNet is an efficient and lightweight deep learning model able to reliably predict outcomes by accurately abating the tradeoff between precision and recall as confirmed through a consistently high accuracy (0.97).

Table 13.
Classification report of MobileNet.
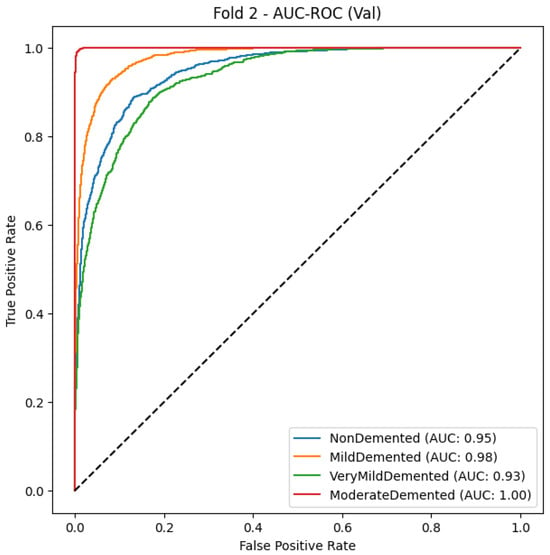
Figure 10.
MobileNetModel AUC-ROC Curve for multiclass Alzheimer’s classification (Fold 2).
5.2.3. Xception
As seen in Table 14 and Figure 11, the Xception model is a powerful classifier with an F1-score of 0.86 and macro-average precision and recall of 0.87 and 0.85, respectively. This indicates that Xception can generalize across various dementia types. The greatest recall is for the Mild Demented class (0.92), meaning that the model is very capable of identifying early-stage dementia cases, and indeed its precision is quite high (0.86), although cases may still be misclassified with others. The Non-Demented class also has an adequate model quality, but specifically its precision is relatively high (0.89), while its recall (0.80) is a bit lower, which possibly means that there are also some healthy people filtered as dementia patients. The Very Demented class also yields a balanced F1-score of 0.84 with limited cross-classification, most likely because of similar clinical features across stages of the disease. All classes exhibit good discrimination ability with a high true-positive rate (TPR) at a low false-positive rate (FPR), which is further supported by the AUC-ROC curve. Nevertheless, the curves seem to overlap between early dementia and healthy individuals. The Xception deep learning framework also achieved good results in accurately classifying MRI images despite the small number of misclassified images.

Table 14.
Classification report of Xception.
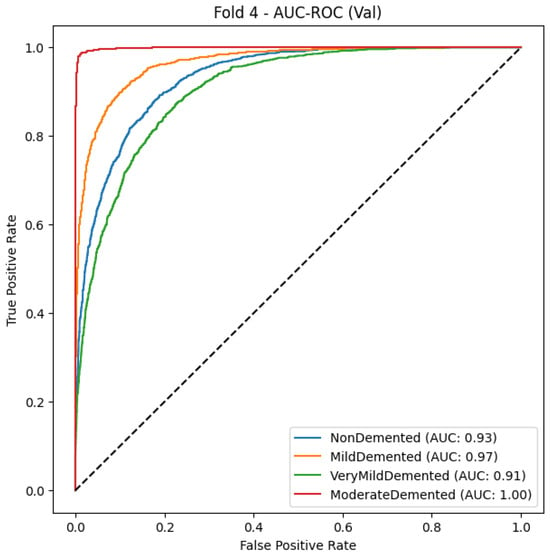
Figure 11.
Xception Model AUC-ROC Curve for Alzheimer’s stage classification.
5.2.4. Hard Voting Ensemble
For the identification of Alzheimer’s disease stages, a hard voting ensemble demonstrated its exceptional classification capabilities with F1-score values of 0.98 and macro-average precision/recall of 0.98. The model demonstrates in Table 15 and Figure 12 a near-perfect Non-Demented classification performance since precision and recall reach 0.99, which leads to minimal wrong predictions. Data reveals that both the Mild Demented class demonstrates a recall score of 0.99 as well as an F1-score of 0.98, which verifies its precise capacity to find mild dementia conditions. The recall rate for the Very Demented class stands at 0.95, but the precision value remains high at 0.99, which reduces incorrect positive detections. The AUC-ROC curves demonstrate the high discriminative capability of the ensemble model since all curves approach the upper left area that indicates excellent true positive results with few false positive results. The ensemble model exhibits superior generalization potential, shown by its ability to rise sharply toward perfect TPR with zero FPR across all disease classes, which demonstrates its effectiveness in minimizing diagnostic errors in Alzheimer’s disease detection.

Table 15.
Classification report of hard voting ensemble.
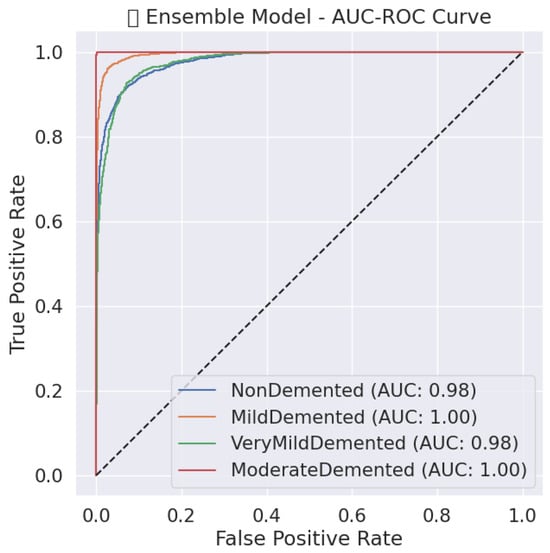
Figure 12.
Ensemble model AUC-ROC Curve for Alzheimer’s stage classification.
5.2.5. MobileNet Snake + EVO
MobileNet’s performance-optimized SOA model and EVO exhibit nearly flawless classification performance, with an F1-score of 0.99 and macro-average precision and recall of 0.99. As shown in Table 16 and Figure 13. The model achieves excellent precision and recall over all classes, with the Non-Demented class achieving a recall of 1.00, meaning all healthy cases are correctly identified. Likewise, an F1-score of 0.99 for the Mild Demented and Very Demented classes indicates that the model is very dependable and that misclassification mistakes are minimal. The optimized MobileNet model demonstrates great discriminatory capability in its AUC-ROC curve, with all classes having nearly perfect separation of true positive and false positive instances, supporting optimal stability in classification. The profound increase in the TPR at a near-zero FPR for all classes indicates that the use of Snake + EVO hybrid optimization significantly improved the fine-tuning of the model’s hyperparameters, resulting in better accuracy and increased generalization ability. The outcomes show that the MobileNet model, when combined with machine learning-based optimization techniques, has the potential to be a quick and computationally effective framework for Alzheimer’s disease categorization.

Table 16.
Classification report of MobileNet Snake+EVO.
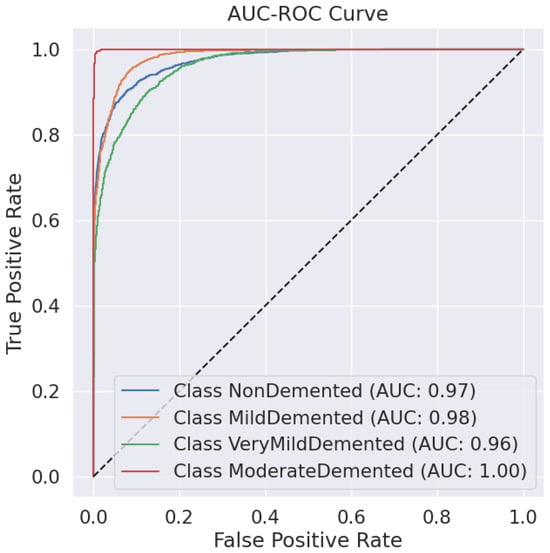
Figure 13.
AUC-ROC Curve for each Alzheimer’s disease class using the optimized MobileNet model (Snake + EVO).
5.2.6. Comparison
The MobileNet Optimized (Snake + EVO) model, Table 17, achieves an accuracy of 99.33% and an F1-score of 0.99, making it the best-performing model with almost flawless outcomes. The Ensemble model demonstrates remarkable performance by merging multiple architectures at 98.12% accuracy because it uses different deep learning models to achieve balanced precision/recall of 0.98. The standard MobileNet model reaches 96.77% accuracy, although it shows superior classification capability despite its lightweight size. Features extracted by MobileNet’s depthwise separable convolution layers achieve a better combination of computational efficiency and feature extraction than CNN-based models due to their superior performance at 94.08% accuracy. Xception delivers sufficient performance levels but reaches an accuracy of 86.41% and a recall of 0.85, making it less generalizable than other considered models. The MobileNet Optimized with the Snake + EVO configuration shows the best combination of high accuracy and efficient computation while maintaining stable classification results compared to other models in Alzheimer’s disease diagnosis.

Table 17.
Results comparison.
5.2.7. Grad-CAM
Grad-CAM visualizations generate an interpretable representation to show how the model determines Alzheimer’s disease diagnoses from MRI scans. As shown in Figure 14, an original brain image appears on the left, and a right-hand view shows the Grad-CAM heatmap, which spotlights prominent brain regions for model classification. High importance areas appear in red and yellow regions, thus suggesting that the model attends to ventricular enlargement and cortical atrophy, which serve as indicators of neurodegenerative deterioration. The blue and green regions of the map indicate lower activation compared to yellow and red zones, which demonstrates minimal involvement during the prediction process. The visual presentation demonstrates that the deep learning model bases its predictions on significant anatomical indicators, which boosts both the explainability and trustworthiness of classification assessments.
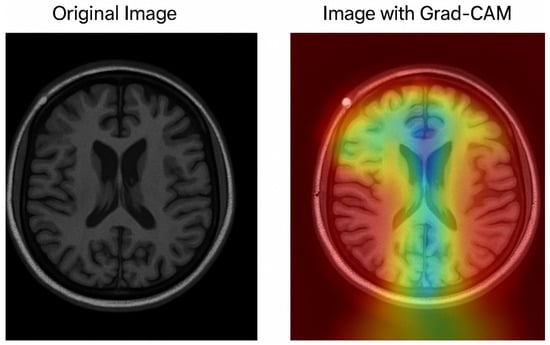
Figure 14.
Grad-CAM visualization of an MRI scan using the optimized MobileNet model.
The assessment between datasets demonstrates significant performance distinctions between different models. The Ensemble model demonstrates the most successful accuracy rate of 92.80% in Dataset 1, above the CNN Optimized (Snake + EVO) model, which reaches 90.02%. This indicates that evolutionary optimization helps maximize accuracy. Dataset 2 demonstrates how MobileNet Optimized (Snake + EVO) achieves the best accuracy at 99.33% due to its superior generalization capabilities on this particular dataset. Evaluation results indicate Dataset 2 enables more stable performance for the Xception and standard CNN architectures since CNN obtained 94.08% accuracy in Dataset 2 and 87.22% in Dataset 1. MobileNet demonstrated an improvement from its Dataset 1 low performance (81.72%) to reach 96.77% in Dataset 2 due to its capability to adapt after receiving optimized hyperparameters. The findings demonstrate that ensemble techniques together with hybrid optimization methods improve model performance, which results in MobileNet Optimized delivering the best classification reliability in Dataset 2.
5.3. Evaluation on Multiple Datasets and Generalizability
To strengthen the robustness and reproducibility of our findings, we extended our experiments to two distinct datasets: (i) the publicly available OASIS MRI dataset, which provides cross-sectional 2D brain MRI slices across multiple stages of Alzheimer’s disease, and (ii) a private hospital dataset collected in Libya, consisting of clinically validated MRI scans. The latter dataset was utilized only for further validation of the suggested methodology and is not publicly available due to institutional privacy limitations.
5.3.1. Results on the OASIS Dataset
To minimize possible data leakage, the suggested framework was initially assessed on the OASIS dataset using stratified cross-validation with group-aware splitting. The performance of the baseline and optimized models. The ensemble model achieved the highest accuracy of 91.77%, followed by the optimized CNN (Snake+EVO) at 88.73%. MobileNet and Xception achieved 80.09% and 85.49% accuracy, respectively, while the vanilla CNN reached 86.94%.The models’ ability to generalize was enhanced via ensemble integration and hyperparameter modification, as these findings attest.
5.3.2. Results on the Private Hospital Dataset
To ensure that the models generalize beyond public datasets, we validated the framework on a real-world dataset collected at a Libyan hospital. On this dataset, the optimized CNN with Snake+EVO achieved a final validation accuracy of 99.81% and provided a classification report that displayed flawless F1-scores, recall, and precision for every AD category. The baseline CNN also achieved 99.22% accuracy, MobileNet 98.42%, ViT 95.43%, and Xception 91.75%. These results highlight the robustness of the framework in clinical practice settings.
5.3.3. Discussion
The performance differences between the two datasets can be attributed to data quality and annotation consistency; while the OASIS dataset provides valuable benchmarking opportunities, it is limited to 2D slices, which may introduce subject-level leakage risks if not carefully split. In contrast, the private clinical dataset comprises well-curated MRI studies, leading to improved generalization and higher classification accuracy. Importantly, by validating on both a public and a private dataset, we demonstrate that the proposed hybrid optimization and ensemble-based framework can achieve high reliability in both research and clinical contexts.As shown in Table 18, the extended performance comparison highlights model accuracy, efficiency, and computational complexity on the ADNI dataset. Table 19 shows the extended evaluation demonstrates superior performance of the optimized CNN (Snake+EVO) on the private hospital dataset.

Table 18.
Extended performance comparison on the ADNI dataset.

Table 19.
Extended performance comparison on the private hospital dataset (Libya).
To better understand the decision-making process of our models, we employed Grad-CAM visualization on both benchmark and clinical datasets. As illustrated in Figure 15, for the ADNI dataset, the optimized CNN model (Snake+EVO) successfully highlights cortical and ventricular regions that are clinically relevant in Alzheimer’s disease diagnosis. The generated heatmaps confirm that the network attends to meaningful brain structures rather than irrelevant background noise, thus supporting the validity of its predictions.
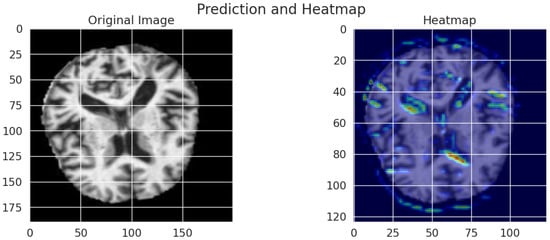
Figure 15.
Grad-CAM visualization results on the ADNI dataset. The left panel shows the original MRI slice, while the right panel presents the corresponding heatmap highlighting discriminative brain regions leveraged by the CNN Optimized (Snake+EVO) model for classification.
In contrast, Figure 16 presents Grad-CAM results obtained from the private hospital dataset (Libya). Here, the heatmaps are overlaid directly on the MRI slices, clearly identifying regions associated with neurodegeneration in real-world data. This visualization not only demonstrates the robustness of the proposed framework across heterogeneous datasets but also enhances its clinical interpretability, reinforcing trust in AI-assisted Alzheimer’s disease classification.
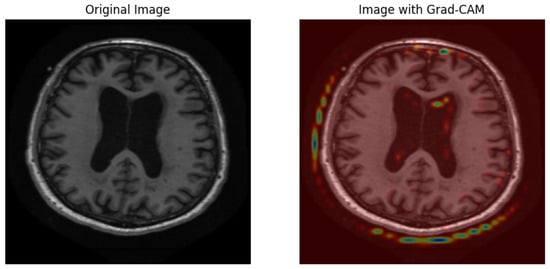
Figure 16.
Grad-CAM visualization results on the private hospital dataset (Libya). The left panel displays the original MRI image, while the right panel overlays the Grad-CAM heatmap on the brain scan, providing interpretability of the model’s decision-making process in real-world clinical data.
5.4. Comparative Evaluation with Related Works
To contextualize the effectiveness of our proposed framework, we compared its performance against recent state-of-the-art approaches in Alzheimer’s disease classification. Table 20 summarizes the results. The suggested CNN Optimized (Snake + EVO) model outperformed current techniques in terms of accuracy and robustness, achieving the highest classification accuracy of 99.81% on the private clinical MRI dataset. For example, the hybrid CNN + PSO model reported by Ibrahim et al. [34] reached accuracies between 97.12% and 98.83% across multiple datasets, while Cui et al. [35] obtained up to 96.27% accuracy with a PSO-ALLR approach on a limited ADNI subset. Similarly, Khoei et al. [36] achieved 96.7% using a stacking ensemble with genetic algorithm optimization. In contrast, our Snake+EVO strategy consistently produced lower validation loss compared to GA and PSO, indicating a superior balance between exploration and exploitation in hyperparameter search. Furthermore, by combining hybrid optimization with deep CNNs, our framework avoids the reliance on handcrafted features that limits traditional machine learning pipelines, while also incorporating interpretability through Grad-CAM visualizations to highlight clinically relevant brain regions. We acknowledge that the dual optimization and ensemble process introduces additional computational overhead and that broader validation on large-scale public datasets remains necessary to fully establish generalization. Nonetheless, the proposed framework demonstrates clear advancements over prior works in terms of classification accuracy, interpretability, and optimization strategy, underscoring its potential for supporting AI-assisted Alzheimer’s disease diagnosis in clinical practice.

Table 20.
Comparison of the proposed model with related works.
5.4.1. Statistical Validation via Mean ± Standard Deviation Analysis
We calculated the mean and standard deviation for accuracy and F1-score over several runs to guarantee statistical rigor when assessing the classification performance of the suggested models. Table 21 summarizes the aggregated results for five key models.

Table 21.
Model performance (mean ± standard deviation).
These results reinforce several key conclusions regarding model performance and stability. The optimized CNN model outperformed its baseline counterpart, with accuracy improving from 85.45% to 88.73%, highlighting the effectiveness of the proposed Snake + EVO hybrid optimization strategy in enhancing classification reliability. MobileNet, although lightweight and efficient, recorded the lowest accuracy and F1-score among the evaluated models. Nevertheless, it exhibited commendable stability, with a relatively small standard deviation indicating consistent performance across validation folds.
Xception demonstrated superior performance compared to MobileNet and closely approached the results of the baseline CNN. This suggests its strength in capturing complex spatial patterns from MRI data, making it a viable option for medical image classification tasks. Among all models, the ensemble approach yielded the best results, achieving the highest accuracy (91.77%) and F1-score (91.79%). The lack of deviation in its results is attributed to the deterministic nature of hard voting, which combines multiple predictions into a single robust output.
Overall, the low standard deviations observed for CNN, MobileNet, and Xception indicate that the models performed reliably across cross-validation folds, with variability remaining under 1%. These findings confirm that integrating ensemble learning with evolutionary optimization leads to improved classification performance and model generalization. Such a strategy enhances the robustness and clinical applicability of deep learning-based systems for Alzheimer’s disease diagnosis.
5.4.2. Statistical Significance Analysis
To validate whether the observed differences in model performance are statistically significant, we performed pairwise comparisons using p-values derived from independent t-tests. The results are reported for both accuracy and F1-score metrics.
For accuracy, the comparison between MobileNet and CNN yielded a p-value of 0.0002, indicating a statistically significant difference. Likewise, Xception significantly outperformed MobileNet (p = 0.0022), confirming its superior performance. The fact that the difference between CNN and Xception was not statistically significant (p = 0.2821) indicates that their accuracy performance is equivalent.
For the F1-score, MobileNet again performed significantly worse than CNN (p = 0.0001), while Xception achieved statistically higher scores than MobileNet (p = 0.0008). Interestingly, Xception also significantly outperformed CNN in F1-score, as shown by a p-value of 0.0029, indicating that although accuracy was similar, Xception yielded more balanced performance across precision and recall.
These findings confirm that the improvements observed—particularly through the use of CNN optimization and the ensemble method—are not only numerically superior but also statistically robust. The results reinforce the reliability and discriminative power of the proposed models and support the adoption of ensemble and hybrid-optimized frameworks for clinical decision support in Alzheimer’s disease classification.
5.5. K-Fold Cross-Validation Results
The models were evaluated using GroupKFold (grouped by patient_id). Table 22 summarizes the five-fold cross-validation performance for each model.

Table 22.
Five-fold cross-validation results of CNN, MobileNet, Xception, and Vi.
To further evaluate the robustness of our models, we conducted a 5-fold cross-validation on the ADNI dataset. As summarized in Table 23, the CNN model achieved the best overall performance with an average accuracy of 88.17% and an F1-score of 88.16%, outperforming both MobileNet (85.06% accuracy, 84.88% F1) and ViT (72.49% accuracy, 72.16% F1). These findings show how well CNN handles structural MRI data, but MobileNet showed competitive performance with high recall in the classes of mild and moderate dementia. ViT, although performing lower compared to CNN and MobileNet, provided a useful baseline for transformer-based approaches. The consistency of these results across folds confirms the stability of our evaluation and the reliability of CNN as the strongest model on the ADNI dataset.

Table 23.
Five-fold cross-validation results on ADNI Dataset.
5.6. Comparison with Recent Advances and Future Directions
In addition to classical optimization techniques such as Particle Swarm Optimization (PSO) and Genetic Algorithms, the recent literature in Alzheimer’s disease diagnosis has increasingly shifted towards transformer-based and multimodal architectures. Vision Transformers (ViTs) and their medical adaptations (e.g., Swin Transformer, TransMed) have demonstrated superior capacity for capturing long-range spatial dependencies in neuroimaging data, thereby outperforming conventional CNN backbones in some benchmarks. Furthermore, multimodal fusion models that integrate structural MRI with complementary information such as PET imaging, genetic biomarkers, or clinical cognitive scores are gaining traction, as they exploit complementary modalities to enhance diagnostic reliability.
Our study did not explicitly compare against these state-of-the-art paradigms, focusing instead on CNN backbones and metaheuristic hyperparameter optimization; while the proposed hybrid Snake+EVO and ensemble learning strategies significantly improved CNN-based performance, future work should incorporate transformer-based medical imaging architectures and multimodal fusion frameworks as baselines. Such comparisons would provide a stronger demonstration of generalizability and situate our approach within the most recent trends in Alzheimer’s disease computer-aided diagnosis.
5.7. Dynamic Assessment of Disease Progression
The present study addresses Alzheimer’s disease (AD) as a static classification task, distinguishing among four discrete stages (Non-Demented, Very Mild Demented, Mild Demented, and Moderate Demented). However, in clinical practice, the dynamic nature of disease evolution is of critical importance. Predictive modeling of disease progression trajectories, including predicting the probability of transitioning from mild cognitive impairment (MCI) to Alzheimer’s dementia, has been the subject of recent research. Approaches in this direction often exploit longitudinal neuroimaging, repeated cognitive assessments, or survival analysis frameworks to model temporal risk. Other studies employ recurrent neural networks, temporal convolutional architectures, or deep survival models to capture progression patterns over time.
While our framework achieves high accuracy in cross-sectional staging, it does not capture the temporal dimension of disease development. Future extensions should incorporate longitudinal datasets and dynamic modeling techniques in order to provide early prognostic insights, which are especially valuable for clinical trial stratification and personalized intervention planning.
6. Conclusions
Alzheimer’s disease (AD) is a progressive neurodegenerative disorder where early and accurate diagnosis is essential for effective clinical intervention. In this work, we presented a deep learning framework for the multiclass classification of AD severity levels from MRI neuroimaging data. Our approach integrated multiple convolutional and transformer-based architectures and applied a novel hybrid hyperparameter optimization strategy combining Snake Optimization and Energy Valley Optimization (Snake+EVO). This strategy proved highly effective in balancing exploration and exploitation, outperforming traditional optimizers such as Genetic Algorithms and Particle Swarm Optimization. On a private clinical MRI dataset, the optimized CNN model maintained competitive results on public datasets like OASIS and the Alzheimer’s Disease Multiclass Dataset, while achieving a classification accuracy of 99.81%. Ensemble learning further improved robustness by leveraging the complementary strengths of multiple models. In addition, Grad-CAM visualizations provided interpretable heatmaps that highlighted clinically relevant brain regions, enhancing the framework’s potential utility in real-world practice.
The findings confirm that hybrid optimization and ensemble learning substantially improve diagnostic accuracy, efficiency, and interpretability, establishing our framework as a promising AI-assisted tool for AD staging. Nevertheless, the study has limitations, including reliance on 2D MRI slices and the absence of longitudinal modeling for disease progression trajectories. Future research will extend this work by incorporating multimodal neuroimaging (e.g., PET, fMRI), integrating longitudinal patient data to predict conversion risks such as MCI-to-AD, and exploring advanced explainability methods beyond Grad-CAM. Moreover, deploying and validating the proposed system within healthcare infrastructures will be a critical step toward clinical translation and adoption.
Author Contributions
Conceptualization, A.M.R.A. and O.A.; methodology, A.M.R.A.; software, A.M.R.A.; validation, A.M.R.A. and O.A.; formal analysis, A.M.R.A.; investigation, A.M.R.A.; resources, O.A.; data curation, A.M.R.A.; writing—original draft preparation, A.M.R.A.; writing—review and editing, A.M.R.A. and O.A.; visualization, A.M.R.A.; supervision, O.A.; project administration, O.A.; funding acquisition, O.A. All authors have read and agreed to the published version of the manuscript.
Funding
This research received no external funding.
Institutional Review Board Statement
Ethical review and approval were waived for this study because it uses publicly available datasets (OASIS-3, ADNI, and Kaggle Alzheimer’s Disease Multiclass Dataset) that have already obtained ethical clearance and participant consent from their original sources. The private clinical dataset from Libya was anonymized and de-identified in compliance with institutional privacy regulations. No new data were collected, and no human or animal subjects were directly involved in this research.
Data Availability Statement
The publicly available datasets analyzed during this study can be found at: OASIS-3 (https://www.oasis-brains.org/), ADNI (http://adni.loni.usc.edu/), and Kaggle Alzheimer’s Disease Multiclass Dataset (https://www.kaggle.com/). The private clinical MRI dataset from Libya is not publicly available due to ethical and privacy restrictions. Code and trained model weights are available from the corresponding author upon reasonable request.
Conflicts of Interest
The authors declare no conflicts of interest.
References
- Sengoku, R. Aging and Alzheimer’s disease pathology. Neuropathology 2020, 40, 22–29. [Google Scholar] [CrossRef]
- Sehar, U.; Rawat, P.; Reddy, A.P.; Kopel, J.; Reddy, P.H. Amyloid beta in aging and Alzheimer’s disease. Int. J. Mol. Sci. 2022, 23, 12924. [Google Scholar] [CrossRef]
- Saragea, P.D. Alzheimer’s Disease (AD): Environmental Modifiable Risk Factors. Int. J. Multidiscip. Res. 2024, 6, 1–12. [Google Scholar]
- Cipriani, G.; Danti, S.; Picchi, L.; Nuti, A.; Di Fiorino, M. Daily functioning and dementia. Dement. Neuropsychol. 2020, 14, 93–102. [Google Scholar] [CrossRef] [PubMed]
- Landeiro, F.; Mughal, S.; Walsh, K.; Nye, E.; Morton, J.; Williams, H.; Ghinai, I.; Castro, Y.; Leal, J.; Roberts, N.; et al. Health-related quality of life in people with predementia Alzheimer’s disease, mild cognitive impairment or dementia measured with preference-based instruments: A systematic literature review. Alzheimer’s Res. Ther. 2020, 12, 1–14. [Google Scholar] [CrossRef] [PubMed]
- Kumar, A.; Sidhu, J.; Lui, F.; Tsao, J.W. Alzheimer disease. In StatPearls [Internet]; StatPearls Publishing: Petersburg, FL, USA, 2024. Available online: https://www.ncbi.nlm.nih.gov/books/NBK499922/ (accessed on 15 January 2025).
- Ganatra, M.; Suthar, D.; Prajapati, D.; Zala, G. Genetic Intervention and Alzheimer’s Disease: Dazzling New Dawns on Alzheimer’s Horizon. J. Alzheimer’s Dis. Res. 2024, 15, 123–130. [Google Scholar] [CrossRef]
- Health, T.L.P. Reinvigorating the public health response to dementia. Lancet Public Health 2021, 6, e696. [Google Scholar] [CrossRef]
- Vardy, T.C. How to Avoid or Control Neurological Disorders. EC Neurol. 2020, 12, 73–89. [Google Scholar] [CrossRef]
- Alzheimer’s Association. 2016 Alzheimer’s disease facts and figures. Alzheimer’s Dement. 2016, 12, 459–509. [Google Scholar] [CrossRef]
- Garry, S.; Checchi, F. Armed conflict and public health: Into the 21st century. J. Public Health 2020, 42, e287–e298. [Google Scholar] [CrossRef]
- Goldsteen, R.L.; Goldsteen, R.; Goldsteen, K.; Dwelle, T. Introduction to Public Health: Promises and Practices; Springer Publishing Company: Berlin/Heidelberg, Germany, 2024. [Google Scholar] [CrossRef]
- Meganck, R.M.; Baric, R.S. Developing therapeutic approaches for twenty-first-century emerging infectious viral diseases. Nat. Med. 2021, 27, 401–410. [Google Scholar] [CrossRef]
- Uysal, G.; Ozturk, M. Classifying early and late mild cognitive impairment stages of Alzheimer’s disease by analyzing different brain areas. In Proceedings of the 2020 Medical Technologies Congress (TIPTEKNO), Antalya, Turkey, 19–20 November 2020; pp. 1–4. [Google Scholar] [CrossRef]
- Lee, J. Mild cognitive impairment in relation to Alzheimer’s disease: An investigation of principles, classifications, ethics, and problems. Neuroethics 2023, 16, 16. [Google Scholar] [CrossRef]
- Kasula, B.Y. A machine learning approach for differential diagnosis and prognostic prediction in Alzheimer’s disease. Int. J. Sustain. Dev. Comput. Sci. 2023, 5, 1–8. [Google Scholar]
- Kale, M.B.; Wankhede, N.L.; Pawar, R.S.; Ballal, S.; Kumawat, R.; Goswami, M.; Khalid, M.; Taksande, B.G.; Upaganlawar, A.B.; Umekar, M.J.; et al. AI-driven innovations in Alzheimer’s disease: Integrating early diagnosis, personalized treatment, and prognostic modelling. Ageing Res. Rev. 2024, 101, 102497. [Google Scholar] [CrossRef] [PubMed]
- Nazir, A.; Assad, A.; Hussain, A.; Singh, M. Alzheimer’s disease diagnosis using deep learning techniques: Datasets, challenges, research gaps and future directions. Int. J. Syst. Assur. Eng. Manag. 2024, 1–35. [Google Scholar] [CrossRef]
- Zhao, G.; Zhang, H.; Xu, Y.; Chu, X. Research on magnetic resonance imaging in diagnosis of Alzheimer’s disease. Eur. J. Med. Res. 2024, 29, 632. [Google Scholar] [CrossRef]
- Arumugam, J.; Prasanna Venkatesan, V.; Beigh, T. MRI-Based Biomarker in the Diagnosis of Alzheimer’s Disease Using Attention-UNet. SN Comput. Sci. 2025, 6, 211. [Google Scholar] [CrossRef]
- Islam, J.; Zhang, Y. Brain MRI analysis for Alzheimer’s disease diagnosis using an ensemble system of deep convolutional neural networks. Brain Inform. 2018, 5, 2. [Google Scholar] [CrossRef]
- Loddo, A.; Buttau, S.; Di Ruberto, C. Deep learning based pipelines for Alzheimer’s disease diagnosis: A comparative study and a novel deep-ensemble method. Comput. Biol. Med. 2022, 141, 105032. [Google Scholar] [CrossRef]
- Ayus, I.; Gupta, D. A novel hybrid ensemble based Alzheimer’s identification system using deep learning technique. Biomed. Signal Process. Control 2024, 92, 106079. [Google Scholar] [CrossRef]
- Mahmud, T.; Barua, K.; Barua, A.; Das, S.; Basnin, N.; Hossain, M.S.; Andersson, K.; Kaiser, M.S.; Sharmen, N. Exploring Deep Transfer Learning Ensemble for Improved Diagnosis and Classification of Alzheimer’s Disease. In Proceedings of the International Conference on Brain Informatics, Hoboken, NJ, USA, 1–3 August 2023; pp. 109–120. [Google Scholar] [CrossRef]
- Khan, Y.F.; Kaushik, B.; Chowdhary, C.L.; Srivastava, G. Ensemble model for diagnostic classification of Alzheimer’s disease based on brain anatomical magnetic resonance imaging. Diagnostics 2022, 12, 3193. [Google Scholar] [CrossRef]
- Raju, M.; Thirupalani, M.; Vidhyabharathi, S.; Thilagavathi, S. Deep learning based multilevel classification of Alzheimer’s disease using MRI scans. In Proceedings of the IOP Conference Series: Materials Science and Engineering; IOP Publishing: Bristol, UK, 2021; Volume 1084, p. 012017. [Google Scholar] [CrossRef]
- Reza, M.S.; Kabir, M.M.J.; Mollah, M.A.R. Improving Alzheimer’s Disease Diagnosis on Brain MRI Scans with an Ensemble of Deep Learning Models. In Proceedings of the 2023 International Conference on Artificial Intelligence for Innovations in Healthcare Industries (ICAIIHI), Raipur, India, 29–30 December 2023; Volume 1, pp. 1–6. [Google Scholar] [CrossRef]
- Singh, R.; Prabha, C.; Dixit, H.M.; Kumari, S. Alzheimer Disease Detection using Deep Learning. In Proceedings of the 2023 International Conference on Self Sustainable Artificial Intelligence Systems (ICSSAS), Erode, India, 18–20 October 2023; pp. 1–6. [Google Scholar] [CrossRef]
- Alausa, A.S.; Sanchez-Bornot, J.M.; Asadpour, A.; McClean, P.L.; Wong-Lin, K.; (ADNI), A.D.N.I. Alzheimer’s Disease Classification Confidence of Individuals using Deep Learning on Heterogeneous Data. In Proceedings of the UK Workshop on Computational Intelligence, Belfast, UK, 2–4 September 2024; pp. 208–218. [Google Scholar] [CrossRef]
- Sajjad, M.; Ramzan, F.; Khan, M.U.G.; Rehman, A.; Kolivand, M.; Fati, S.M.; Bahaj, S.A. Deep convolutional generative adversarial network for Alzheimer’s disease classification using positron emission tomography (PET) and synthetic data augmentation. Microsc. Res. Tech. 2021, 84, 3023–3034. [Google Scholar] [CrossRef]
- Madhumitha, T.; Nikitha, M.; Chinmayi Supraja, P.; Sitakumari, K. Classification of Alzheimer’s Disease Using Stacking-Based Ensemble and Transfer Learning. In Proceedings of the International Conference on Computer Vision, High-Performance Computing, Smart Devices, and Networks, Kakinada, India, 28–29 December 2022; pp. 179–191. [Google Scholar] [CrossRef]
- Saim, M.; Feroui, A. Classification and Diagnosis of Alzheimer’s Disease based on a combination of Deep Features and Machine Learning. In Proceedings of the 2022 7th International Conference on Image and Signal Processing and their Applications (ISPA), Mostaganem, Algeria, 8–9 May 2022; pp. 1–6. [Google Scholar] [CrossRef]
- Ismail, W.N.; PP, F.R.; Ali, M.A. A meta-heuristic multi-objective optimization method for Alzheimer’s disease detection based on multi-modal data. Mathematics 2023, 11, 957. [Google Scholar] [CrossRef]
- Ibrahim, R.; Ghnemat, R.; Abu Al-Haija, Q. Improving Alzheimer’s disease and brain tumor detection using deep learning with particle swarm optimization. AI 2023, 4, 551–573. [Google Scholar] [CrossRef]
- Cui, X.; Xiao, R.; Liu, X.; Qiao, H.; Zheng, X.; Zhang, Y.; Du, J. Adaptive LASSO logistic regression based on particle swarm optimization for Alzheimer’s disease early diagnosis. Chemom. Intell. Lab. Syst. 2021, 215, 104316. [Google Scholar] [CrossRef]
- Khoei, T.T.; Labuhn, M.C.; Caleb, T.D.; Hu, W.C.; Kaabouch, N. A stacking-based ensemble learning model with genetic algorithm for detecting early stages of Alzheimer’s disease. In Proceedings of the 2021 IEEE International Conference on Electro Information Technology (EIT), Virtual, 13–15 May 2021; pp. 215–222. [Google Scholar]
- Danon, D.; Arar, M.; Cohen-Or, D.; Shamir, A. Image resizing by reconstruction from deep features. Comput. Vis. Media 2021, 7, 453–466. [Google Scholar] [CrossRef]
- Saponara, S.; Elhanashi, A. Impact of image resizing on deep learning detectors for training time and model performance. In Proceedings of the Applications in Electronics Pervading Industry, Environment and Society, Pisa, Italy, 21–22 September 2021; Springer: Berlin/Heidelberg, Germany, 2021; pp. 10–17. [Google Scholar] [CrossRef]
- Simkó, A.; Löfstedt, T.; Garpebring, A.; Nyholm, T.; Jonsson, J. A generalized network for MRI intensity normalization. arXiv 2019, arXiv:1909.05484. [Google Scholar] [CrossRef]
- Kshatri, S.S.; Singh, D. Convolutional neural network in medical image analysis: A review. Arch. Comput. Methods Eng. 2023, 30, 2793–2810. [Google Scholar] [CrossRef]
- Anwar, S.M.; Majid, M.; Qayyum, A.; Awais, M.; Alnowami, M.; Khan, M.K. Medical image analysis using convolutional neural networks: A review. J. Med. Syst. 2018, 42, 226. [Google Scholar] [CrossRef]
- Sarvamangala, D.R.; Kulkarni, R.V. Convolutional neural networks in medical image understanding: A survey. Evol. Intell. 2022, 15, 1–22. [Google Scholar] [CrossRef]
- Howard, A.G.; Zhu, M.; Chen, B.; Kalenichenko, D.; Wang, W.; Weyand, T.; Andreetto, M.; Adam, H. MobileNets: Efficient convolutional neural networks for mobile vision applications. arXiv 2017, arXiv:1704.04861. [Google Scholar] [CrossRef]
- Alshalan, R.; Al-Khalifa, H. A deep learning approach for automatic hate speech detection in the Saudi Twittersphere. Appl. Sci. 2020, 10, 8614. [Google Scholar] [CrossRef]
- Alkurdi, D.A.; Cevik, M.; Akgundogdu, A. Advancing Deepfake Detection Using Xception Architecture: A Robust Approach for Safeguarding against Fabricated News on Social Media. Comput. Mater. Contin. 2024, 81, 4285–4305. [Google Scholar] [CrossRef]
- Dosovitskiy, A.; Beyer, L.; Kolesnikov, A.; Weissenborn, D.; Zhai, X.; Unterthiner, T.; Dehghani, M.; Minderer, M.; Heigold, G.; Gelly, S.; et al. An Image Is Worth 16×16 Words: Transformers for Image Recognition at Scale. arXiv 2020, arXiv:2010.11929. [Google Scholar] [CrossRef]
- Dietterich, T.G. Ensemble learning. Handb. Brain Theory Neural Netw. 2002, 2, 110–125. [Google Scholar]
- Lumumba, V.W.; Kiprotich, D.; Makena, N.; Kavita, M.; Mpaine, M. Comparative Analysis of Cross-Validation Techniques: LOOCV, K-Folds Cross-Validation, and Repeated K-Folds Cross-Validation in Machine Learning Models. Am. J. Theor. Appl. Stat. 2024, 13, 127–137. [Google Scholar] [CrossRef]
- Nti, I.K.; Nyarko-Boateng, O.; Aning, J. Performance of machine learning algorithms with different K values in K-fold cross-validation. Int. J. Inf. Technol. Comput. Sci. 2021, 13, 61–71. [Google Scholar] [CrossRef]
- Özaltın, Ö. Early Detection of Alzheimer’s Disease from MR Images Using Fine-Tuning Neighborhood Component Analysis and Convolutional Neural Networks. Arab. J. Sci. Eng. 2025, 50, 7781–7800. [Google Scholar] [CrossRef]
- Simic, M. Hard vs. Soft Voting Classifiers. Baeldung Comput. Sci. 2024. Available online: https://www.baeldung.com/cs/hard-vs-soft-voting-classifiers (accessed on 15 January 2025).
- Atif, M.; Anwer, F.; Talib, F. An ensemble learning approach for effective prediction of diabetes mellitus using hard voting classifier. Indian J. Sci. Technol. 2022, 15, 1978–1986. [Google Scholar] [CrossRef]
- Azizi, M.; Aickelin, U.A.; Khorshidi, H.; Baghalzadeh Shishehgarkhaneh, M. Energy valley optimizer: A novel metaheuristic algorithm for global and engineering optimization. Sci. Rep. 2023, 13, 226. [Google Scholar] [CrossRef]
- Gong, G.; Fu, S.; Huang, H.; Huang, H.; Luo, X. Multi-strategy improved snake optimizer based on adaptive lévy flight and dual-lens fusion. Clust. Comput. 2025, 28, 268. [Google Scholar] [CrossRef]
- Bao, X.; Kang, H.; Li, H. An improved binary snake optimizer with gaussian mutation transfer function and hamming distance for feature selection. Neural Comput. Appl. 2024, 36, 9567–9589. [Google Scholar] [CrossRef]
- Peng, L.; Yuan, Z.; Dai, G.; Wang, M.; Li, J.; Song, Z.; Chen, X. A Multi-strategy Improved Snake Optimizer Assisted with Population Crowding Analysis for Engineering Design Problems. J. Bionic Eng. 2024, 21, 1567–1591. [Google Scholar] [CrossRef]
- Selvaraju, R.R.; Cogswell, M.; Das, A.; Vedantam, R.; Parikh, D.; Batra, D. Grad-CAM: Visual explanations from deep networks via gradient-based localization. Int. J. Comput. Vis. 2020, 128, 336–359. [Google Scholar] [CrossRef]
- Naidu, G.; Zuva, T.; Sibanda, E.M. A review of evaluation metrics in machine learning algorithms. In Proceedings of the Computer Science On-line Conference; Springer: Berlin/Heidelberg, Germany, 2023; pp. 15–25. [Google Scholar] [CrossRef]
- Bae, D.; Ha, J. Performance Metric for Differential Deep Learning Analysis. J. Internet Serv. Inf. Secur. 2021, 11, 22–33. [Google Scholar] [CrossRef]
- Saxena, A.; Bishwas, A.K.; Mishra, A.A.; Armstrong, R. Comprehensive Study on Performance Evaluation and Optimization of Model Compression: Bridging Traditional Deep Learning and Large Language Models. arXiv 2024, arXiv:2407.15904. [Google Scholar] [CrossRef]
- Foody, G.M. Challenges in the real world use of classification accuracy metrics: From recall and precision to the Matthews correlation coefficient. PLoS ONE 2023, 18, e0291908. [Google Scholar] [CrossRef]
- Tharwat, A. Classification assessment methods. Appl. Comput. Inform. 2021, 17, 168–192. [Google Scholar] [CrossRef]
- Miao, J.; Zhu, W. Precision–recall curve (PRC) classification trees. Evol. Intell. 2022, 15, 1545–1569. [Google Scholar] [CrossRef]
- Sathyanarayanan, S.; Tantri, B.R. Confusion matrix-based performance evaluation metrics. Afr. J. Biomed. Res. 2024, 27, 4023–4031. [Google Scholar] [CrossRef]
- Owusu-Adjei, M.; Ben Hayfron-Acquah, J.; Frimpong, T.; Abdul-Salaam, G. Imbalanced class distribution and performance evaluation metrics: A systematic review of prediction accuracy for determining model performance in healthcare systems. PLoS Digit. Health 2023, 2, e0000290. [Google Scholar] [CrossRef]
Disclaimer/Publisher’s Note: The statements, opinions and data contained in all publications are solely those of the individual author(s) and contributor(s) and not of MDPI and/or the editor(s). MDPI and/or the editor(s) disclaim responsibility for any injury to people or property resulting from any ideas, methods, instructions or products referred to in the content. |
© 2025 by the authors. Licensee MDPI, Basel, Switzerland. This article is an open access article distributed under the terms and conditions of the Creative Commons Attribution (CC BY) license (https://creativecommons.org/licenses/by/4.0/).