Article

Real-Time Detection and Segmentation of Oceanic Whitecaps via EMA-SE-ResUNet

1
College of Oceanography and Ecological Science, Shanghai Ocean University, Shanghai 201306, China
2
College of Underwater Acoustic Engineering, Harbin Engineering University, Harbin 150001, China
*
Author to whom correspondence should be addressed.
Electronics 2025, 14(21), 4286; https://doi.org/10.3390/electronics14214286 (registering DOI)
Submission received: 25 September 2025 / Revised: 21 October 2025 / Accepted: 22 October 2025 / Published: 31 October 2025

Abstract

Oceanic whitecaps are caused by wave breaking and are very important in air–sea interactions. Usually, whitecap coverage is considered a key factor in representing the role of whitecaps. However, the accurate identification of whitecap coverage in videos under dynamic marine conditions is a tough task. An EMA-SE-ResUNet deep learning model was proposed in this study to address this challenge. Based on a foundation of residual network (ResNet)-50 as the encoder and U-Net as the decoder, the model incorporated efficient multi-scale attention (EMA) module and squeeze-and-excitation network (SENet) module to improve its performance. By employing a dynamic weight allocation strategy and a channel attention mechanism, the model effectively strengthens the feature representation capability for whitecap edges while suppressing interference from wave textures and illumination noise. The model’s adaptability to complex sea surface scenarios was enhanced through the integration of data augmentation techniques and an optimized joint loss function. By applying the proposed model to a dataset collected by a shipborne camera system deployed during a comprehensive fishery resource survey in the northwest Pacific, the model results outperformed main segmentation algorithms, including U-Net, DeepLabv3+, HRNet, and PSPNet, in key metrics: whitecap intersection over union (IoUW) = 73.32%, pixel absolute error (PAE) = 0.081%, and whitecap F1-score (F1W) = 84.60. Compared to the traditional U-Net model, it achieved an absolute improvement of 2.1% in IoUW while reducing computational load (GFLOPs) by 57.3% and achieving synergistic optimization of accuracy and real-time performance. This study can provide highly reliable technical support for studies on air–sea flux quantification and marine aerosol generation.

1. Introduction

As direct surface manifestations of breaking waves, oceanic whitecaps serve as key indicators for air–sea interactions. They exert profound influences on the global climate system, air–sea flux, and remote sensing retrieval studies [1]. Whitecaps consist of bubble clouds entrained during wave breaking and surface foam patches. Their coverage (Whitecap Coverage, W) is not only closely correlated with wind speed, wave parameters, atmospheric stability, and oceanic dynamic processes [2] but also significantly impacts ocean shortwave albedo and microwave radiative properties. Early studies established empirical nonlinear relationships between wind speed and whitecap coverage [3]. Subsequent studies have further demonstrated that factors such as air–sea interface stability [4], wave age [5], and turbulent dissipation [6] critically affect the thresholds and spatial distribution of whitecap formation. Recently, the introduction of the wind-wave Reynolds number parameter [7] and multi-scale physical frameworks [8] underscore the central role of whitecap coverage in air–sea energy exchange. Consequently, precise quantification of whitecap coverage is not only essential for ocean dynamics but also a critical requirement for refining climate models and remote sensing retrieval algorithms.
At the technical level, the quantification of whitecap coverage relies on high-resolution image acquisition and processing. Current main observation methods encompass three categories: (1) in situ observation, which offers high spatial resolution while being susceptible to illumination interference [9]; (2) optical remote sensing, which enables broad coverage yet is hindered by cloud obstruction [10,11]; and (3) microwave remote sensing, which provides all-weather capability at the expense of coarse spatial resolution [12,13]. Among the aforementioned methods, in situ observation is widely regarded as the benchmark approach for studying whitecap generation and evolution processes due to its high spatiotemporal resolution. After acquiring whitecap images, traditional methods extract whitecap regions using threshold segmentation techniques. Although these methods perform well under stable lighting conditions, they face three key challenges in dynamic marine environments: firstly, uneven sea surface illumination (e.g., solar glint, cloud shadows) causes threshold selection instability [14]; secondly, the sensitivity to spatial quantization errors in adaptive thresholding may reduce segmentation accuracy for whitecap regions [15]; thirdly, dependence on manual intervention (e.g., manual threshold adjustment) hinders adaptation to automated large-scale data processing [16]. Recent studies have explored motion-based and multi-sensor segmentation methods to improve whitecap detection [17,18], yet robust performance in complex scenes remains challenging.
To address the limitations of traditional image processing methods and leverage the potential of rapidly advancing deep learning, this study proposes an enhanced ResUNet model named EMA-SE-ResUNet, based on the residual network (ResNet)-50 [19] encoder and U-Net [20] decoder architecture. The model optimizes performance through efficient multi-scale attention (EMA) [21] and squeeze-and-excitation network (SENet) [22] modules to achieve automated, high-precision extraction of whitecap coverage in complex marine environments.
The contributions of this paper are as follows.
  • An enhanced EMA-SE-ResUNet model that integrates EMA and SENet modules to improve feature representation, model stability, and the extraction of subtle whitecap edges under varying sea conditions.
  • A dynamic data augmentation and joint loss strategy that enhances model generalization and balances edge accuracy with region completeness.
  • On shipborne video datasets, the proposed model demonstrates superior robustness and generalization compared with traditional algorithms. It also achieves higher segmentation accuracy than other deep learning models, including the baseline U-Net, providing reliable technical support for whitecap-related meteorological and oceanographic studies.

2. Related Work

2.1. Whitecaps Detection and Coverage Estimation

Early efforts to quantify whitecap coverage relied on manual or simple threshold-based image analysis. This approach later evolved into automated digital methods, such as the fixed-threshold method of Monahan and O’Muircheartaigh [1]. Later, adaptive techniques like the adaptive whitecap extraction (AWE) [9], adaptive thresholding segmentation (ATS) [9], and iterative between-class variance (IBCV) [23] incorporated illumination correction and morphological refinement to improve robustness. Despite these advances, performance degrades under strong sun glint, shadowing, or low contrast.
Recent studies have proposed new segmentation approaches, such as analyzing whitecap motion velocity in visible-light images via particle image velocimetry (PIV) combined with brightness temperature thresholding in infrared images [17], and postprocessing methods based on optical flow trajectories at dual sampling rates to isolate actual whitecaps from false-positive components in images [18]. However, robust segmentation in complex scenes remains challenging.
Therefore, leveraging machine learning models can address the lack of generalizable whitecap segmentation in sea surface images under diverse lighting and sea state conditions, enabling accurate whitecap delineation across a wide range of environments.

2.2. Deep Learning for Marine Image Segmentation

With the emergence of deep learning, marine image segmentation has transitioned from handcrafted to data-driven approaches. In oceanographic applications, U-Net has been employed in areas such as oil spill segmentation [24], sea ice segmentation [25], marine pollutant segmentation [26], and marine animal segmentation [27]. However, these targets are typically larger and more contiguous than whitecaps. The extreme sparsity and fragmentation of whitecaps demand specialized architectural enhancements. Despite these advances, few studies have specifically tailored deep learning architectures for the fine-grained, transient characteristics of oceanic whitecaps. Therefore, this study proposes an enhanced EMA-SE-ResUNet architecture to achieve accurate and efficient segmentation under complex sea surface conditions.
The U-Net architecture, originally developed for biomedical image segmentation, has become a de facto standard for semantic segmentation owing to its symmetric encoder–decoder structure and skip connections that effectively preserve spatial details. To further improve gradient flow in deeper networks, variants such as ResUNet—which integrates a ResNet encoder into the U-Net framework—have been proposed. The underlying ResNet mitigates the vanishing gradient problem through residual learning, thereby enhancing the model’s feature representation capabilities.
Attention mechanisms offer a promising direction for enhancing segmentation performance in complex marine scenes. The SENet adaptively recalibrates channel-wise feature responses. The EMA module achieved superior performance at lower computational cost by leveraging grouped convolutions and a cross-spatial dynamic weight allocation strategy, making it particularly suitable for fine-grained and sparse targets like oceanic whitecaps.

3. Data and Methods

3.1. Data

The training dataset employed in this study was collected using a Sony FDR-AXP35 digital camera deployed aboard the RV Songhang, a research vessel operated by Shanghai Ocean University, during a comprehensive fishery resources survey conducted in the open sea of the northwest Pacific Ocean from June to July 2024. The imaging equipment was utilized to perform multiple batches of stationary continuous capturing between 08:00 and 18:00 on 9 June and 26 July, covering a range of lighting conditions and sea states.
As shown in Figure 1, whitecaps captured by the imaging platform exhibit diverse morphology and scattered distribution, with their edges difficult to capture accurately. In most cases, whitecaps occupy an extremely low proportion of the frame. Moreover, when the capturing angle is large, the background of whitecaps in the field of view encompasses not only the sea surface but also the sky. The water color captured by the lens, influenced by lighting and other factors, further exhibited significant variations. These factors substantially increase the complexity of whitecap segmentation.

3.2. Dataset Generation

The dataset construction process comprises two components, with detailed procedures outlined as follows:
  • Data Construction: Video sequences exhibiting optimal illumination and high signal-to-noise ratios were first filtered. Keyframes were extracted using a systematic equidistant sampling strategy, and images with high whitecap coverage density were selected based on expert annotation. Using threshold-based segmentation as the baseline, whitecap regions underwent targeted discrimination and refined manual correction, followed by the removal of sky portions potentially misclassified by the threshold method, ensuring training sample masks achieved pixel-accurate annotations of whitecap coverage. Ultimately, a standardized dataset containing 1100 samples was constructed and partitioned into training, validation, and test sets—with 900, 100, and 100 samples, respectively—with the test set used to evaluate the model’s performance.
  • Data Preprocessing: Multidimensional data augmentation techniques were applied, including random affine transformation operations in spatial dimension (rotation: ±10°, scaling: ±20%, horizontal/vertical flipping) and introduced HSV channel perturbations in spectral augmentation (hue: ±0.1, saturation: ±0.7, value: ±0.3). Input dimensions were unified via grayscale padding to a fixed resolution, with semantic labels undergoing one-hot encoding, and pixel values were normalized to [0, 1] using min-max scaling. Standardized image tensors and their corresponding binarized annotation matrices were finally generated, establishing a high-quality data foundation for model training.

3.3. Evaluation Metrics

Common metrics for evaluating model performance include the intersection over union (IoU) and F1-score. Given that this study focused on whitecap segmentation in a sea surface image binary classification task where whitecaps typically occupy an extremely small proportion of the frame, whitecap IoU (IoUW) and whitecap F1-score (F1W) were adopted as primary evaluation criteria. Furthermore, since the objective was to extract whitecap coverage, a specialized metric named pixel absolute error (PAE) was introduced to assess coverage extraction accuracy. This metric directly reflects segmentation precision in whitecap coverage quantification, with its computational formulas defined in Equations (1)–(3):
I o U w = T P w T P w + F P w + F N w
F 1 w = 2 T P w 2 T P w + F P w + F N w
P A E = 1 N i = 1 N | R T i R P i |
where TPW (True Positive) represents the number of correctly predicted whitecap pixels; FPW (False Positive) denotes the number of misclassified background pixels predicted as whitecaps; FNW (False Negative) indicates the number of undetected whitecap pixels; N is the total number of whitecaps; R T i is the true whitecap coverage ratio (ranging from 0 to 1) for the i-th sample; and R P i is the predicted whitecap coverage ratio (ranging from 0 to 1) for the i-th sample.
Additionally, the number of parameters (Params) and the computational complexity in terms of GFLOPs are reported to characterize the model’s memory footprint and arithmetic intensity, respectively. Inference speed is further quantified in frames per second (FPS), measured under the experimental setup and hardware configuration employed in this work.

4. Model and Training Parameters

To address the challenges of complex morphology and blurred edges in oceanic whitecap segmentation tasks, this study explored an effective method for model optimization through systematic comparative experiments and theoretical analysis.
First, a base architecture termed ResUNet was constructed using ResNet-50 as the encoder and U-Net as the decoder. Light-weighted improving modules were selected and integrated. The embedding effects of large selection kernel (LSK) [28], squeeze-and-excitation network (SENet), bottleneck attention module (BAM) [29], simple, parameter-free attention module (SIMAM) [30], and efficient multi-scale attention (EMA) were tested on the encoder side (ResNet-50), while the optimization potential of EMA, convolutional block attention module (CBAM) [31], BAM, context anchor attention (CAA) [32], and SENet was evaluated on the decoder side (U-Net).
All experiments were set to unified training configurations (i.e., input size, loss function, optimization strategy, etc.). Module performance was validated via ablation studies on multiple representative modules (detailed debugging processes omitted; see Table 1 and Table 2 for results). Five popular modules were introduced at two specific positions in both U-Net and ResNet architectures, with baseline (unimproved) results listed in the first row of each table. Performance was assessed using three metrics, with changes relative to the baseline calculated (↑ denotes larger values are better; ↓ denotes smaller values are better). As shown in Table 1, among the improvement modules evaluated on the ResNet side, the SIMAM module demonstrated the poorest overall performance, while the EMA module achieved the best performance, particularly at the skip in the ResNet bottleneck position. Similarly, Table 2 reveals that on the U-Net side, the CAA module exhibited the weakest comprehensive performance, whereas the SENet module delivered the most effective results, especially when integrated at the U-Net pre-upsampling position.
Additional experimental findings beyond tabular data reveal that homogeneous module combinations (e.g., EMA + EMA) exhibit no significant advantages; conversely, heterogeneous combinations effectively integrate complementary features across modules. Notably, the SENet module performed well in the individual improved decoder. Furthermore, it can form a pronounced cascading enhancement effect when sequentially applied after EMA-optimized encoder features (i.e., EMA at the encoder + SENet at the decoder). Based on these findings, the EMA attention module and SENet module were selected as core improvement components, with optimal deployment positions identified as follows: the EMA module was applied to skip connections in ResNet, while the SENet module was deployed before the upsampling layers in the U-Net decoder.

4.1. Main Structure of EMA-SE-ResUNet

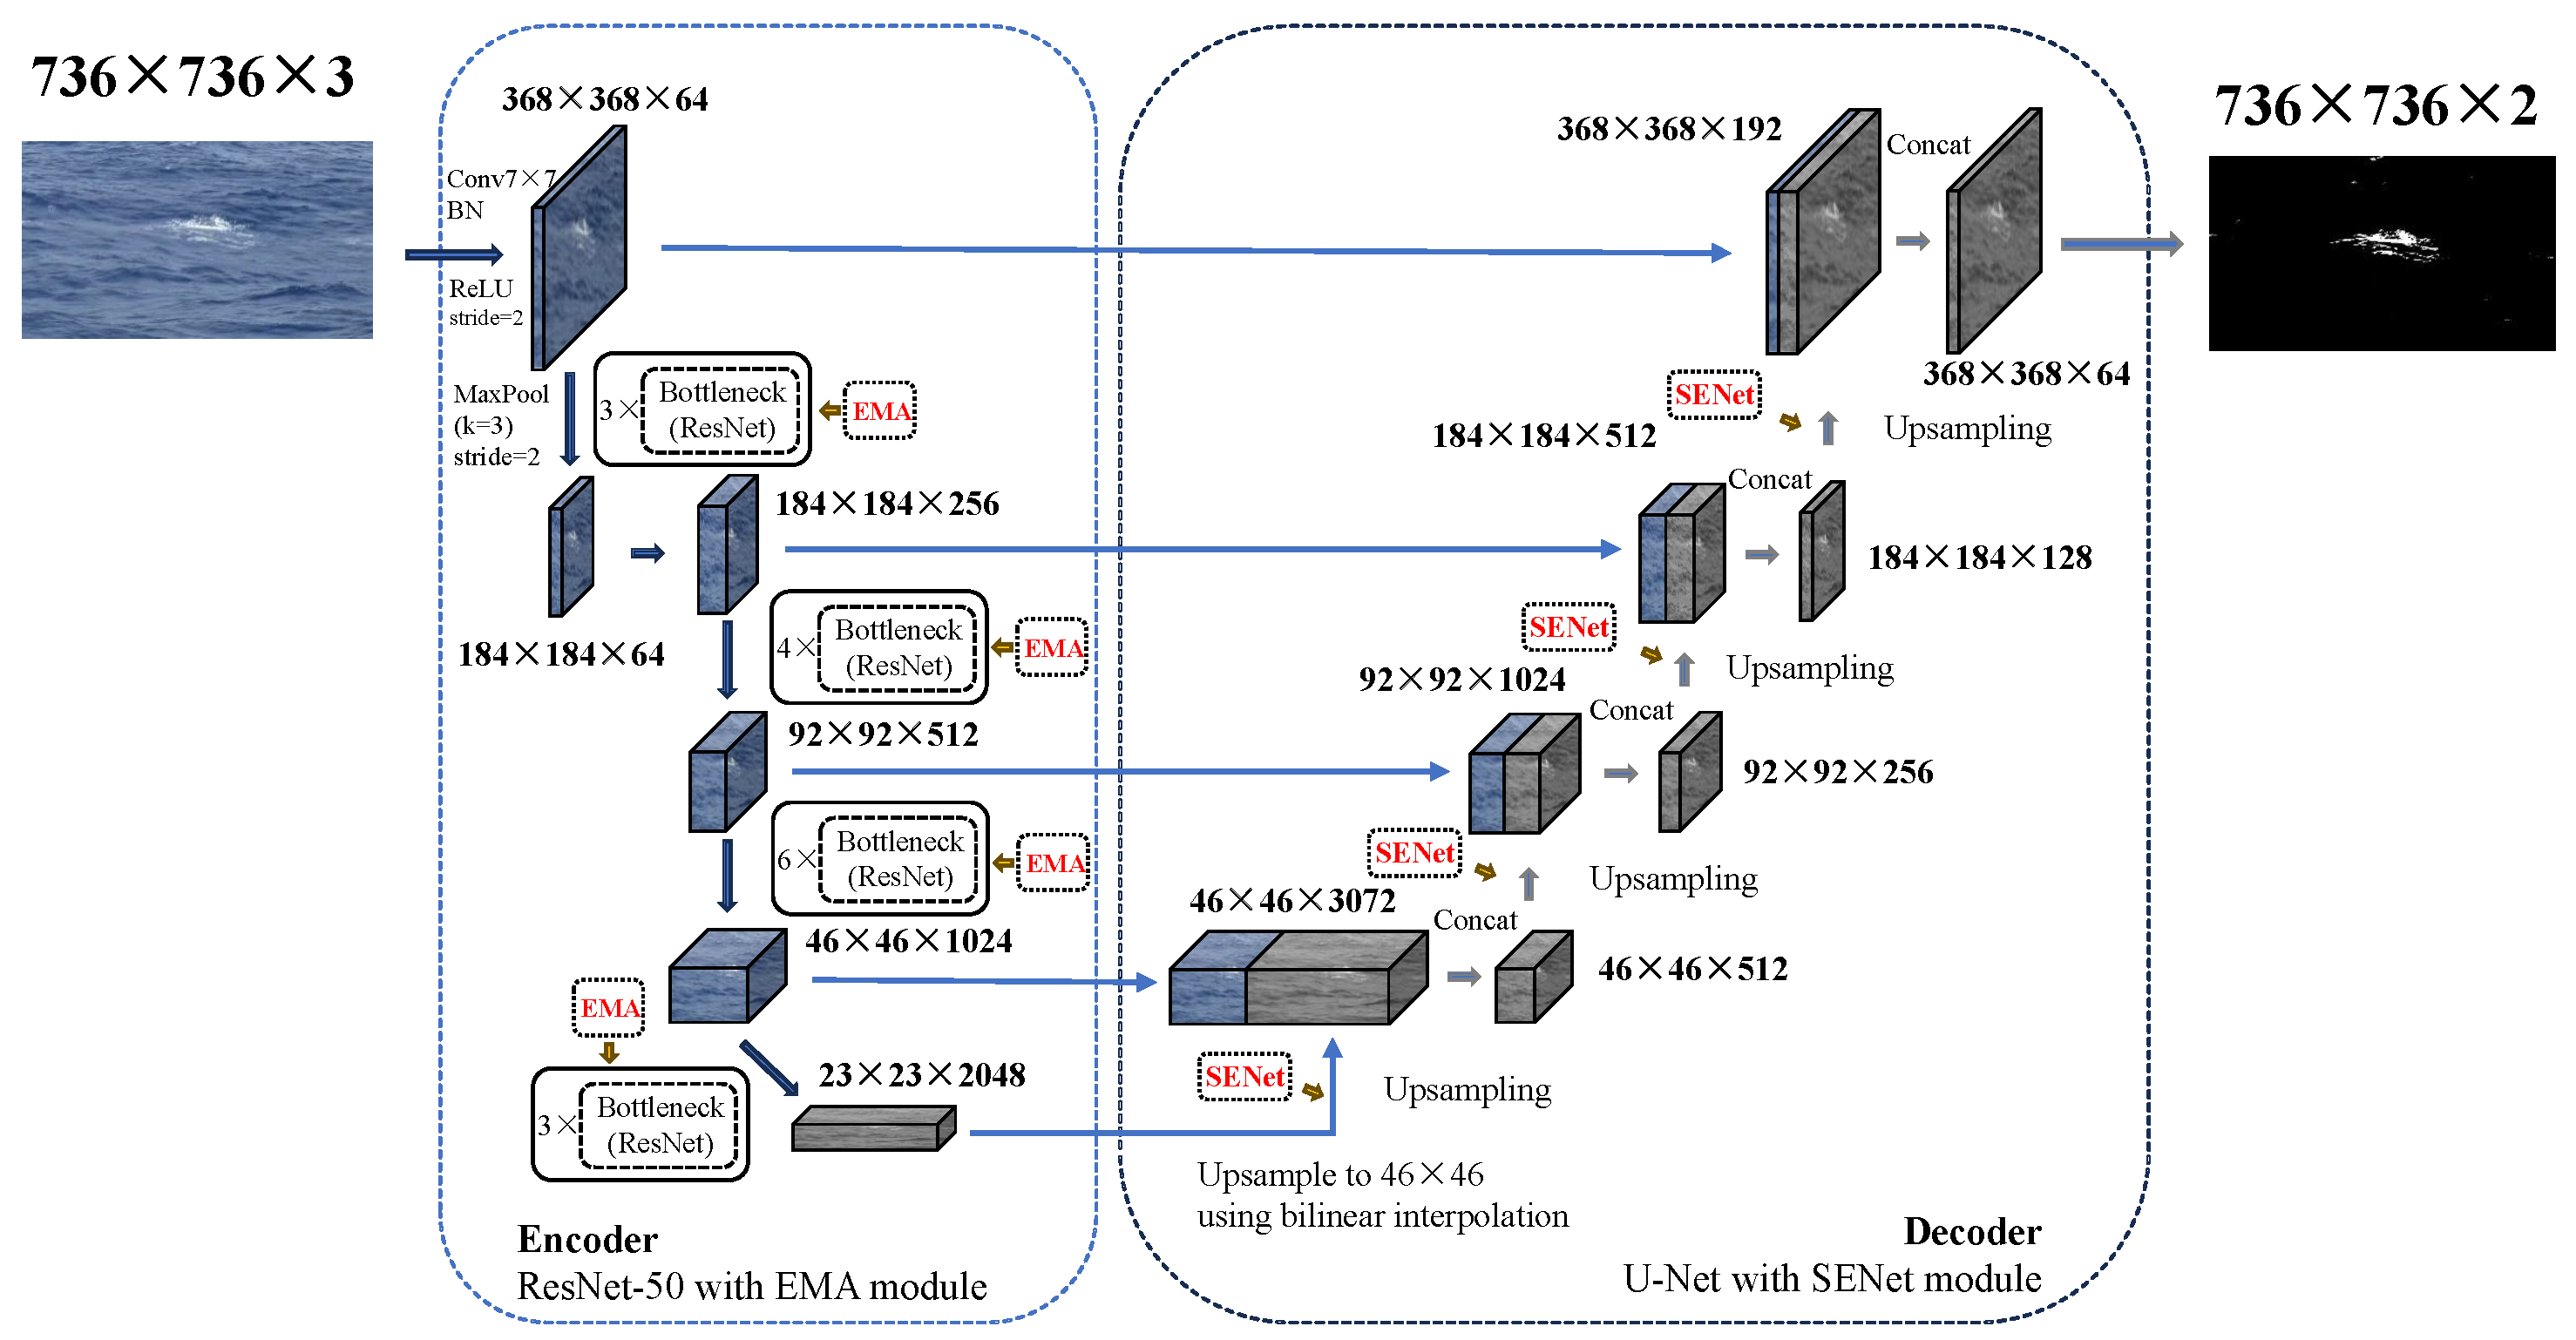
The architecture of the model EMA-SE-ResUNet is depicted in Figure 2. Initially, the input multiple oceanic whitecap images of size 736 × 736 × 3 were processed through two steps, i.e., a 7 × 7 convolutional layer and a max-pooling layer, reducing their dimensions to 184 × 184 × 64. The encoder, which is based on the ResNet-50 architecture, utilizes a series of bottleneck blocks to reduce the number of parameters while constructing a deep network. At various hierarchical levels, the EMA module is integrated to enhance multi-scale feature extraction capabilities. The decoder employs a U-Net structure, starting from the deepest feature map of size 23 × 23 × 2048. Resolution is gradually restored through bilinear interpolation, and after each upsampling step, the SENet module is applied to optimize channel weights and feature fusion. Furthermore, at each upsampling stage, feature maps from corresponding hierarchical levels of the encoder are concatenated through a Concat operation, preserving detailed information and enabling multi-scale feature fusion. This model effectively enhances the capabilities of capturing and expressing details in ocean images. A resolution of 736 × 736 pixels is adopted for input data to retain as much detail as possible from the original images while keeping computational costs manageable. When input images are non-rectangular or do not meet the required dimensions, gray padding is applied to resize them to the specified rectangular dimensions. This approach ensures consistent input sizes for batch processing and minimizes potential distortion or information loss caused by resizing.

4.2. Detailed Improvement Strategy

4.2.1. EMA-Enhanced ResNet

ResNet is a groundbreaking model architecture in deep learning, whose core innovation lies in the introduction of a residual learning mechanism. This mechanism constructs residual modules through cross-layer skip connections, enabling direct propagation of low-level feature information during backpropagation. This effectively alleviates the gradient degradation problem in deep network training, thereby supporting the training of networks exceeding hundreds of layers.
Despite significantly reducing computational load compared to U-Net when utilized as an encoder, ResNet tends to neglect dependencies between distant pixels when constructing deep hierarchical architectures. This limitation becomes particularly prominent in scenarios involving extremely low whitecap coverage (typically less than 0.02%), in which the insufficient response of skip connections to sparse targets results in subtle whitecap patches being prone to being undetected. Furthermore, whitecaps exhibit a patchy regional distribution in images, characterized by blurred edges and variable morphology. In dynamic marine environments, whitecaps are easily confused with wave textures (e.g., similar texture interference in wave-dense regions). Due to its fixed receptive field, the traditional ResNet architecture has problems in effectively distinguishing whitecaps from background noise, leading to segmentation errors.
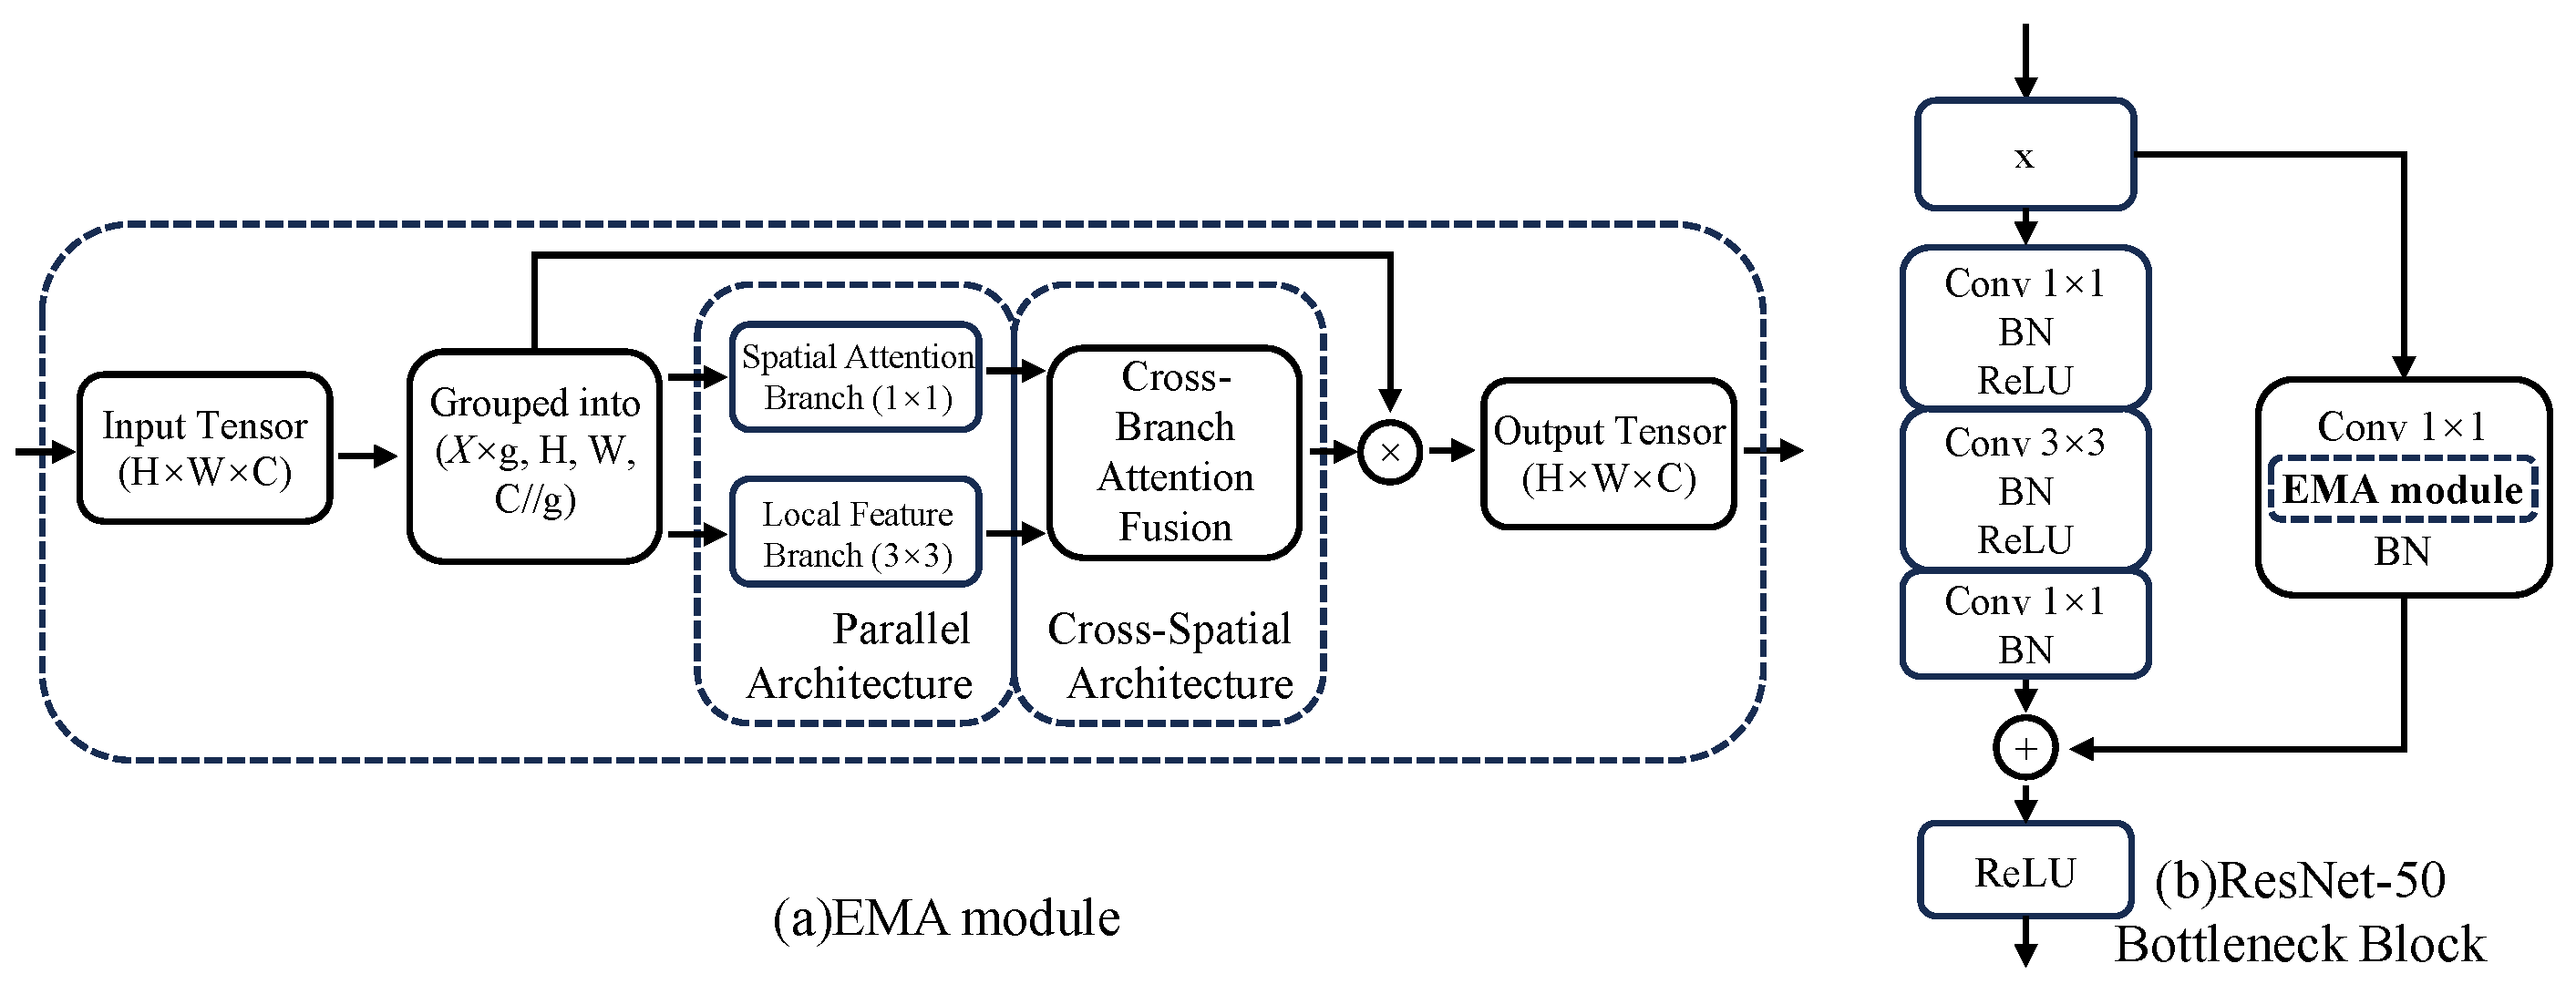
In order to address the limitations of the traditional ResNet architecture in the task of oceanic whitecaps segmentation, the efficient multi-scale attention mechanism [21] was introduced in this study. The EMA module enhanced feature representation in key regions through a cross-spatial dynamic weight allocation strategy, as illustrated in Figure 3a.
Specifically, the core innovations of the EMA module lie in the following three aspects:
  • Channel grouping mechanism: The input feature layer X is partitioned into g groups of sub-features along the channel dimension (in this work, g = 32). Each group of sub-features is denoted as
    [ X i ] = [ X 0 , X i , , X g 1 ] , X i R c g × H × W
    where C is the number of channels, and H and W represent the height and width of the feature map, respectively.
  • Grouped parallel paths: Feature extraction is performed through parallel paths. The 1 × 1 branch preserves large-scale semantic information of input features (e.g., the overall region of patches), while the 3 × 3 branch focuses on local details (e.g., edge sharpness and morphological structures of whitecaps), establishing multi-granularity perception across spatial dimensions.
  • Cross-spatial dynamic weight allocation: Spatial attention weight maps are generated via Softmax to highlight the saliency of whitecap regions. The weighted features are then fused with the original skip connection features, enabling cross-regional semantic information propagation (e.g., dispersed whitecap patches and edge context).
Figure 3b describes the location of the EMA module improvement in ResNet, where the module is embedded within the skip connection structure of ResNet. This positional optimization has the advantage that it will not significantly increase the overall computational overhead while simultaneously enhancing the core operation of ResNet. EMA optimizes feature representation through grouped parallel paths (including 1 × 1 and 3 × 3 convolutional branches), in which the 1 × 1 branch preserves large-scale semantic information of input features (e.g., the overall region of patches), and the 3 × 3 branch focuses on local details (e.g., edge sharpness and morphological structures of whitecaps), establishing multi-granularity perception across spatial dimensions. Coupled with a cross-spatial dynamic weight allocation mechanism of EMA (e.g., attention maps generated via Softmax), this design enhances the feature-propagation efficacy of each skip residual structure. Consequently, every bottleneck module in ResNet-50 can extract residual features more accurately while learning original feature information. This improvement significantly enhances the model’s ability to distinguish whitecap patches, achieving more precise edge segmentation and sparse target recall, particularly in noise-dense scenarios. Experimental results demonstrate that EMA is the most impactful core enhancement module in the proposed model.

4.2.2. SENet-Enhanced U-Net

U-Net is a deep convolutional neural network based on a symmetric encoder–decoder architecture. Its unique cross-layer skip connection mechanism effectively fuses high-resolution details from the encoder with semantic information from the decoder, mitigating the spatial information loss commonly encountered by traditional networks in image segmentation. In recent years, U-Net has also been widely adopted in numerous semantic segmentation scenarios beyond the medical image segmentation domain, establishing itself as a benchmark framework in the field of image processing.
As the decoder, U-Net receives key positional tensors from the ResNet encoder and performs decoding. The model fuses shallow details (e.g., whitecap edge information) propagated from the encoder with deep semantic features through skip connections, while progressively recovering image resolution via upsampling. However, the direct concatenation (Concat) operation may induce channel redundancy or feature conflicts, thereby impairing the expression of critical information.
In order to enhance the capability of critical information extraction, it is essential to further improve the precision of the U-Net decoder through module enhancements, particularly when the ResNet encoder has already been optimized with the EMA module. After systematic experimental screening, the study ultimately focuses on the SENet module [22]. As illustrated in Figure 4a, this module generates channel weights through a squeeze-and-excitation mechanism, determining the importance of channels based on these weights and capturing inter-channel correlations to identify key information more accurately in images. The module comprises three components: squeeze, excitation, and rescaling, forming a reinforced channel network structure for the whitecap feature. The squeeze operation Fsq is expressed as
Z c = F s q ( u c ) = 1 H × W i H j W u c ( i , j )
where u c denotes the input feature map for channel c, and H and W represent the height and width of the feature map, respectively.
The excitation component Fex is designed to learn nonlinear inter-channel relationships and enhance feature attention. It is defined as
s = F e x ( z , W ) = σ ( g ( z , W ) ) = σ ( W 2 δ ( W 1 z ) )
where s denotes the channel attention feature, z the global descriptor vector aggregated across all channels, W the network parameters, and W 1 and W 2 the weight matrices of the first and second fully connected layers. σ ( · ) denotes the sigmoid activation function, and δ ( · ) represents the ReLU activation function.
After obtaining the channel weight vector through SENet computation, the Scale (rescaling) operation multiplies these weight vectors element-wise with the corresponding 2D matrices of the original feature map channels. Subsequently, all weighted feature maps are summed across channels to produce the final output:
X ˜ c = F s c a l e ( u c , s c ) = s c · u c
In Equation (7), X ˜ c denotes the final output feature map, uc the input feature map for channel, sc the channel-specific scalar weight generated by SENet, and Fscale the element-wise multiplication operation applied between each feature map uc and its corresponding weight scalar sc.
The integration strategy of SENet-enhanced U-Net is illustrated in Figure 4b, where the SENet module serves as a cascaded optimization component complementing the EMA-enhanced ResNet to further advance segmentation accuracy. Specifically, SENet performs channel reweighting on features transferred from the encoder before the upsampling layer, prioritizing channels highly relevant to whitecaps (e.g., those encoding high-response edge features) while suppressing noise channels (e.g., those capturing wave textures). Concretely, SENet dynamically calibrates channel weights via its squeeze-and-excitation mechanism, that is, the squeeze operation compresses spatial information into channel-wise descriptors through global average pooling, capturing cross-regional dependencies. Subsequently, the excitation operation employs two fully connected layers to learn nonlinear inter-channel relationships and generate attention weights within the [0, 1] interval. Finally, the rescaling operation X ˜ c = s c · u c enhances critical channels associated with whitecaps while suppressing background noise channels, thereby amplifying responses in whitecap-relevant features. Experimental results confirm that this approach yields measurable accuracy gains.

4.2.3. Synergy Between EMA and SENet

The heterogeneous complementary mechanism of EMA (optimizing the encoder) and SENet (optimizing the decoder) achieves cascaded enhancement through dual-dimensional optimization across spatial and channel domains. At the encoder side, the EMA module extracts multi-scale features via grouped parallel paths, captures long-range spatial dependencies using adaptive pooling, and dynamically allocates weights to enhance the salient expression of whitecap edges while suppressing wave textures and illumination noise. The optimized skip connections then transfer low-level detail features with full multi-scale semantic information to the decoder. At the decoder side, the SENet module performs channel reweighting on these features through squeeze-and-excitation. Global average pooling compresses spatial information into channel-wise descriptors, and fully connected layers learn nonlinear inter-channel relationships, thereby accentuating key channels (e.g., edge responses) associated with whitecaps and suppressing noise channels. These modules form a dual noise-suppression mechanism that significantly improves the model’s perceptual accuracy for whitecap edges and sparse targets through operations in the spatial dimension (EMA) and channel dimension (SENet), achieving high accuracy with low computation across the entire model.

4.3. Loss Function and Training Configuration

For segmenting small targets such as oceanic whitecaps, a joint training strategy employing weighted Focal Loss and Dice Loss is adopted to enhance model performance through dual-perspective optimization. The Focal Loss formulation, given in Equation (8), incorporates class-specific weights to adaptively focus classification confidence on sparse whitecap pixels, thereby mitigating the challenge of extreme sample imbalance:
L Focal = 1 K k = 1 K α w c k 1 p c k w c k γ log ( p c k )
where K is the total number of samples, α = 0.5 and γ = 2 are hyperparameters, c k the true category label of the k-th sample, w c k the category weight (1 for background, 10 for whitecaps), and p c k the predicted probability of sample k belonging to its true category.
The Dice Loss, defined in Equation (9), enhances the geometric continuity of whitecap edges at the region-wise intersection-over-union level and suppresses fragmentation errors in small-target segmentation:
L Dice = 1 1 N i = 1 N ( 1 + β 2 ) T P W + ϵ ( 1 + β 2 ) T P W + β 2 F N W + F P W + ϵ
where N denotes the total number of whitecaps, β is set to 1, and the smoothing term ϵ is set to 10 5 .
The total loss is the direct sum of the weighted Focal Loss and Dice Loss, as defined in Equation (10):
L Total = L Dice + L Focal
The synergistic combination of these loss functions overcomes the trade-off limitation inherent in traditional single-loss functions between sensitivity to small targets and boundary precision. This approach is particularly suitable for the robust extraction of ocean features characterized by weak edges and low coverage, such as sea spray.
During the training phase, sea surface input images were resized to 736 × 736 pixels. The batch size was set to 4, and training spanned 200 epochs. Stochastic gradient descent (SGD) was employed for model optimization, with the learning rate scheduled via cosine annealing decay. The initial learning rate was set to 10 2 .

5. Results and Analysis

5.1. Training Environment

Model training was conducted on the Windows 11 operating system using Python 3.10.15 and the PyTorch 2.3.1+cu121 framework, with an Intel® Core™ i7-13700 processor (2.10 GHz), an NVIDIA Tesla T10 GPU with 16 GB of video memory, and 32 GB of system RAM.

5.2. Model Performance Evaluation

In this study, the ablation experiments were conducted based on the baseline U-Net [20]. The encoder of U-Net was replaced with ResNet-50 [19] to construct ResUNet, and three improved variants were further developed: ResUNet enhanced with only the EMA [21] module (EMA-ResUNet), ResUNet enhanced with only the SENet [22] module (SE-ResUNet), and ResUNet enhanced with both modules simultaneously (EMA-SE-ResUNet). For comparison, several well-known segmentation networks, including DeepLabv3+ [33], PSPNet [34], HRNet [35], and the baseline U-Net, were also employed. Both ablation studies and comparative experiments were conducted to validate the superiority of the proposed model. In the ablation studies, all models adopted identical training protocols and parameter configurations, with minor adjustments to batch size due to computational load variations. For fair comparison, all experiments strictly maintained consistent hyperparameters, which included 200 training epochs, random weight initialization, uniform input size (736 × 736), identical image preprocessing pipelines, consistent loss functions, and the SGD optimizer with matching learning rate decay strategies (initial learning rates were appropriately tuned per model architecture). Given that whitecaps typically occupy extremely low frame coverage (0–6%), with most samples in this dataset below 0.02%, even marginal improvements in IoUW were both statistically significant and practically crucial.
As analyzed in the ablation study illustrated in Table 3, the ResUNet model, which was constructed using U-Net as the baseline model and ResNet-50 as its encoder, resulted in a 57.87% reduction in computational load (GFLOPs) with a tiny reduction in accuracy. Although the parameter counts were increased by 1.403M and GFLOPs by 5.266, the model capability significantly improved after integrating the EMA and SENet modules, indicating a sound balance between model precision and efficiency. The EMA-enhanced ResUNet (EMA-ResUNet) improved IoUW by 2.22% over the baseline ResUNet. The IoUW was elevated to 73.32% and F1W to 84.60% after further integrating the SENet module, validating enhanced recall for sparse small targets. The PAE was further optimized to 0.081%, indicating a substantial reduction in positioning errors for whitecap edge pixels.
As demonstrated by the heatmap comparative analysis in Figure 5, the EMA-SE-ResUNet model exhibits significant advantages in oceanic whitecap segmentation. Compared to other popular models, our approach showcases superior saliency-focusing capability: its thermal response is highly concentrated in true whitecap regions (red zones), with sharp boundaries that align closely with the actual spatial distribution of whitecaps. The model exhibits a narrow thermal transition zone (rapid shift from red to dark blue), indicating precise edge segmentation. This capability accurately captures primary whitecap structures and achieves high spatial specificity even in challenging scenarios involving extremely low-coverage targets, weak edges, and noise interference.
Specific comparisons reveal the following facts: (1) U-Net covers major whitecap regions but shows insufficient response to subtle features (e.g., fine structures in Groups A, C, E), reflecting limitations in detailed segmentation. (2) Deeplabv3+ suffers from overly dispersed thermal responses due to its fixed receptive field, leading to localized over-activation in wave-dense areas (e.g., the upper-left of Group E) and universally elevated background responses. (3) PSPNet displays extensive low-confidence responses (blue-dominated) with blurred whitecap edges and overall poor thermal sensitivity. (4) HRNet improves overall coverage through multi-scale feature fusion yet shows weak responses in micro-target regions (e.g., image corners), underperforming relative to EMA-SE-ResUNet.
Regarding robustness in complex scenes, EMA-SE-ResUNet suppresses thermal responses effectively in non-whitecap areas (background remains dark blue) through the synergistic enhancement of EMA and SENet modules. This significantly mitigates the thermal “spillover” commonly observed in other models. Simultaneously, it amplifies feature responses for sparse whitecaps, enabling micro-targets (e.g., dispersed foam patches) to manifest as high-confidence punctate foci (red regions) in heatmaps.
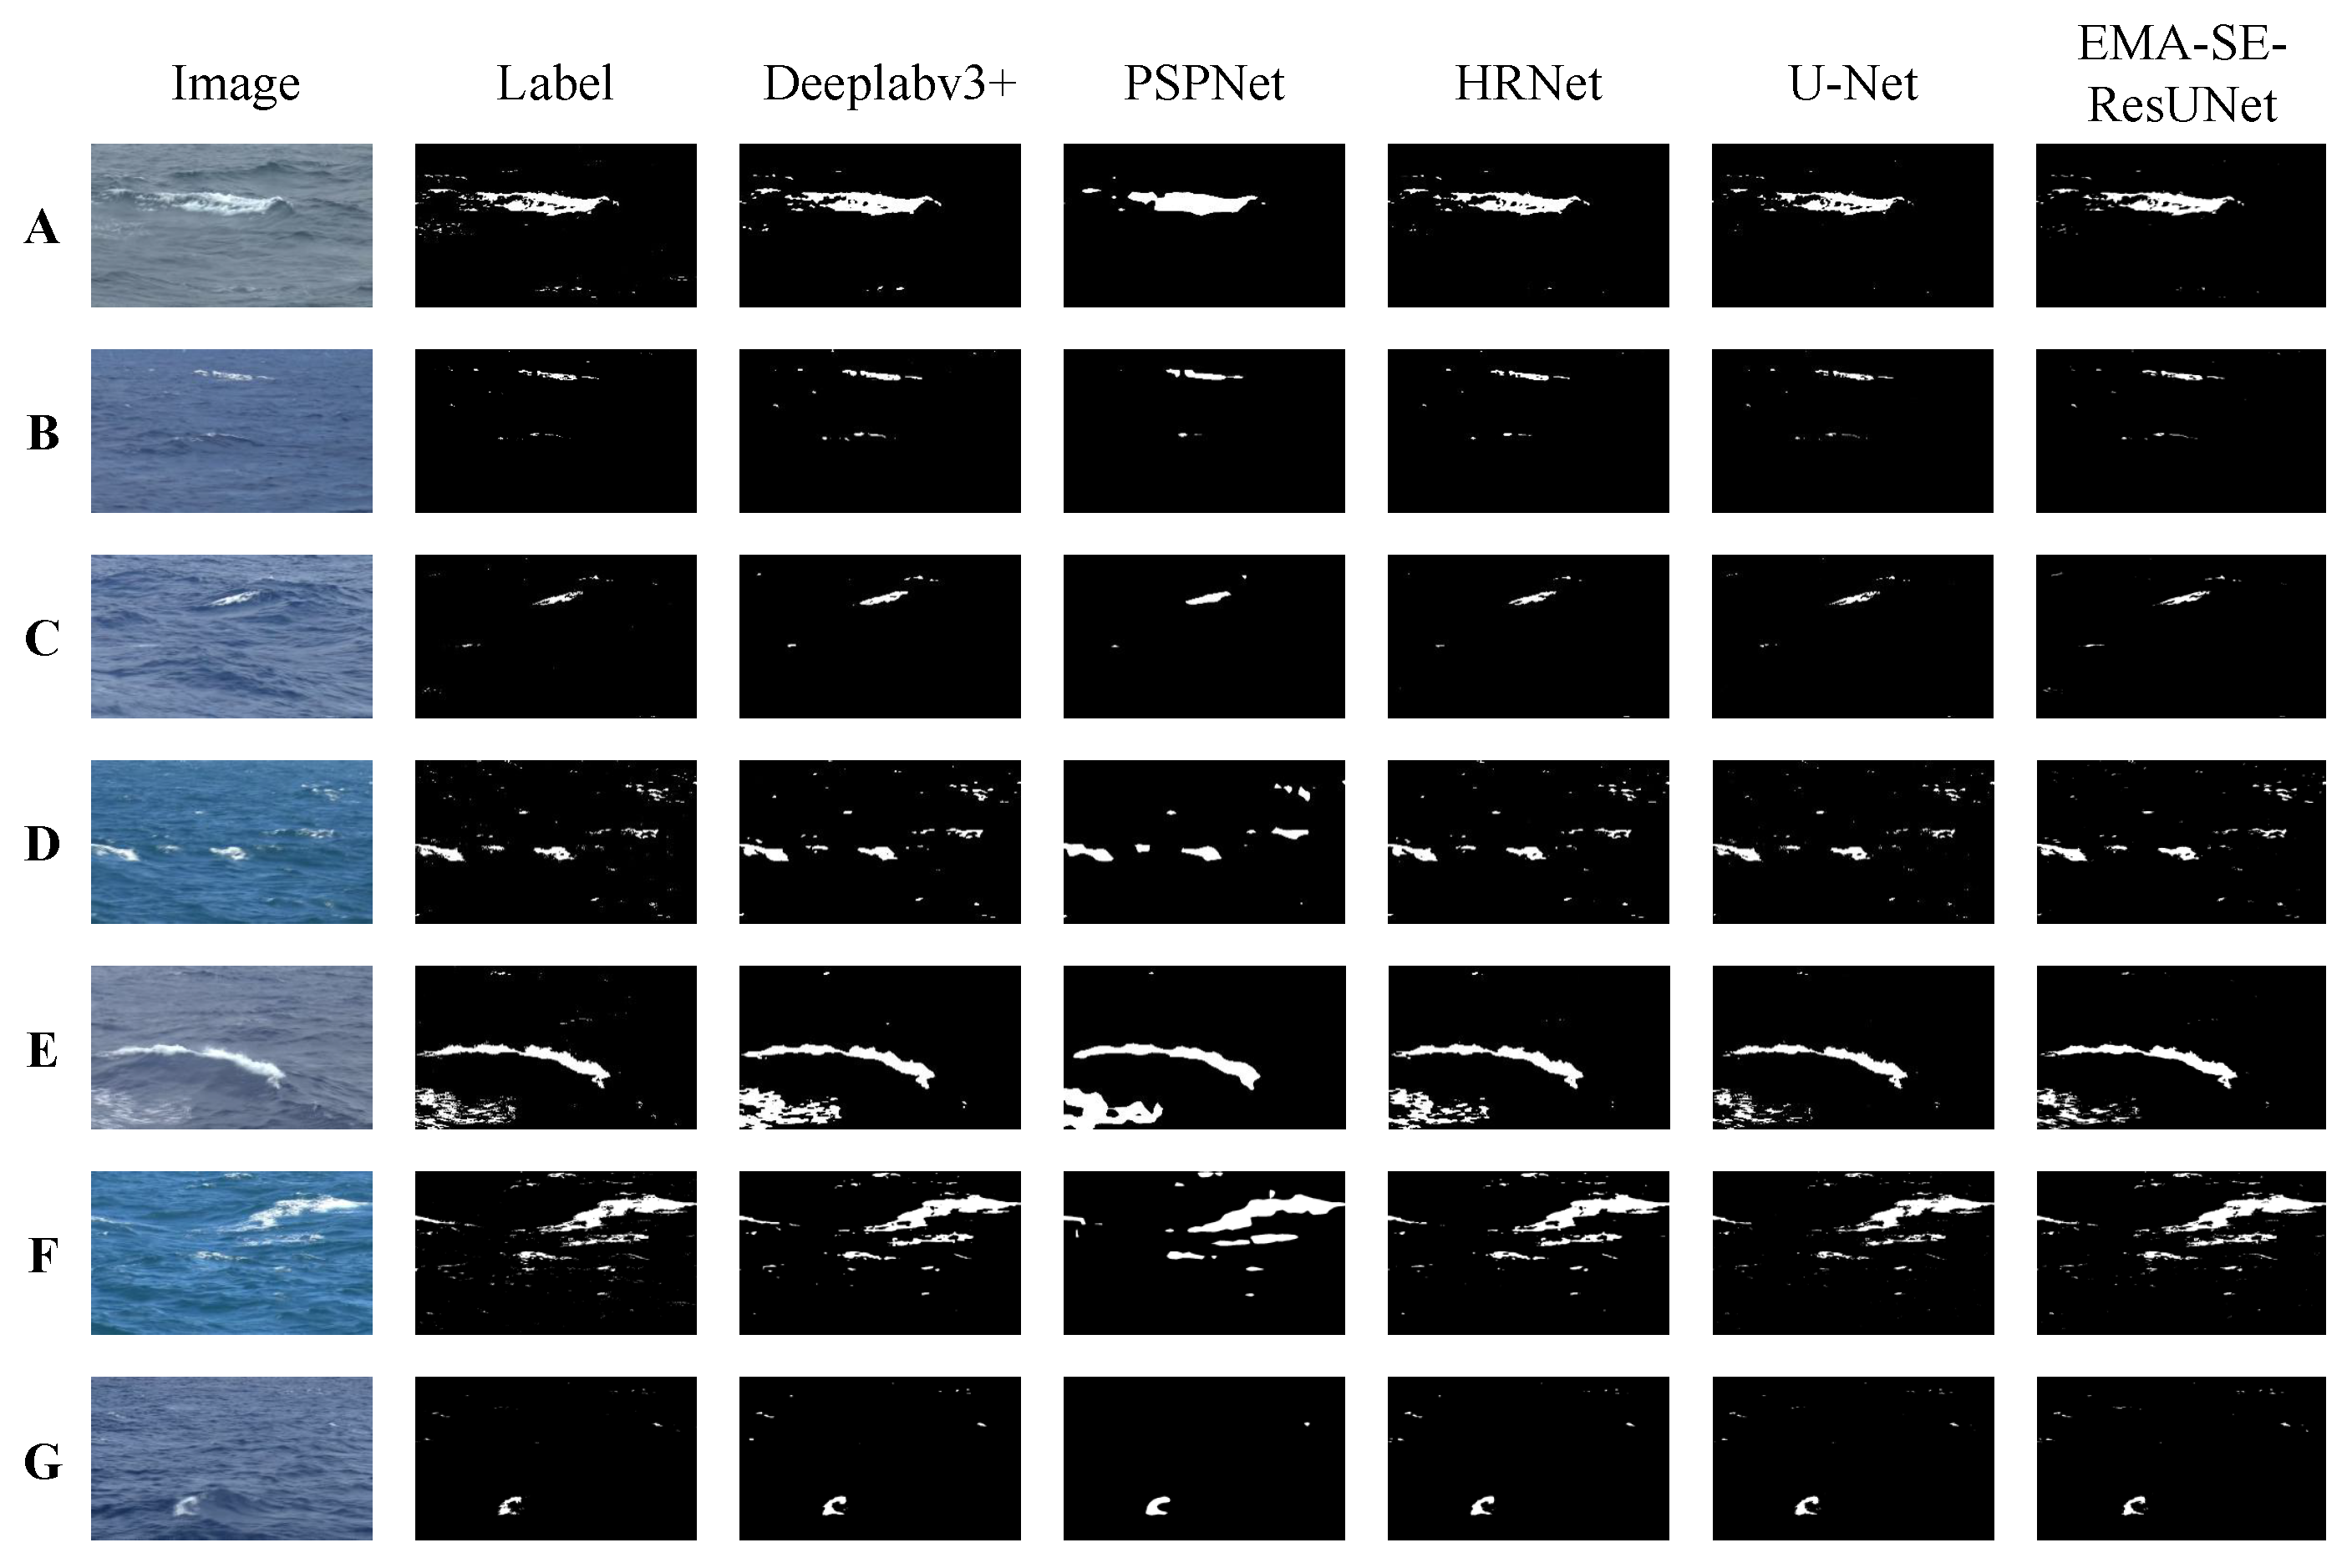
Figure 6 shows the visualization of segmentation results across models. The proposed EMA-SE-ResUNet demonstrates exceptional scene reconstruction capabilities in oceanic whitecap segmentation tasks, despite complex wave morphology variations and diverse lighting conditions. It identifies micro-scale whitecap features effectively while preserving edge integrity. Although the baseline U-Net achieves high overall segmentation accuracy, it exhibits limitations in extracting subtle textures and localizing edge pixels, primarily failing to capture fine-grained features across comparative groups. DeepLabv3+, constrained by its fixed receptive field, frequently produces local over-segmentation (false positives) and under-segmentation (false negatives). For instance, evident misclassifications occur in the central whitecap region of Group A and the sparse whitecap area in the lower-left corner of Group E. PSPNet, limited by its pyramid pooling strategy, only achieves coarse-grained boundary recognition, resulting in blurred edges across all groups. In dense wave regions, it suffers from adhesive segmentation due to interference from adjacent whitecaps, yielding suboptimal performance. While HRNet enhances segmentation through multi-resolution feature fusion, it still exhibits localized misjudgments, such as omitting subtle whitecaps on the left side of Group A.
In contrast, EMA-SE-ResUNet excels across multiple sea surface images; for example, sparse whitecap features in the lower-left corner of Group F are most accurately reproduced compared to all other models, and complex large-area whitecaps in the lower-left corner of Group E achieve high-fidelity reconstruction. The visual results confirm that the proposed model delivers superior performance in both micro-scale whitecap identification and large-scale extraction. The accuracy of pixel-level positioning for whitecaps under complex marine conditions was significantly improved through the combination of multi-scale feature enhancement of EMA and channel attention optimization of SENet, outperforming existing popular algorithms in edge sharpness and sparse-target continuity.
Although the proposed EMA-SE-ResUNet demonstrates clear advantages over other models, certain limitations remain when compared with the ground truth labels. Specifically, some sparse whitecap regions were still not accurately identified — for instance, the upper-left portion of image Group D was missed. This reflects the inherent difficulty of detecting extremely sparse and transient whitecaps and highlights one of the current limitations of our approach.
In the comparative analysis presented in Table 4, the proposed EMA-SE-ResUNet model demonstrates significant advantages in oceanic whitecap segmentation, particularly excelling at segmenting vanishingly small targets such as whitecaps. Compared to popular segmentation models, EMA-SE-ResUNet outperforms on multiple metrics. Its cascaded multi-scale feature enhancement strategy mitigates the loss of fine-grained details in small targets caused by fixed receptive fields (e.g., in DeepLabv3+) or pyramid pooling (e.g., in PSPNet). The IoUW (Whitecap Intersection over Union) achieves 73.32%, substantially surpassing DeepLabv3+, PSPNet, and HRNet, with a 2.1% absolute gain over U-Net, highlighting its exceptional capability to capture small-target features. The PAE is reduced to 0.081%, lower than all comparative models, confirming effective control over pixel-level positioning errors. Notably, the model also exhibits superior computational efficiency, with the Total GFLOPs being only 42.7% of U-Net’s, and its parameter count is lower than HRNet and DeepLabv3+, demonstrating that the lightweight design reduces computational costs while maintaining accuracy, aligning with real-time monitoring requirements.
To further verify the reliability of the performance improvements, a statistical significance test was conducted between the proposed EMA-SE-ResUNet and the baseline U-Net. The results revealed that the differences were statistically significant (p < 0.05) across all key metrics. Specifically, the IoUW (mean = 58.54 vs. 56.68, p = 0.0001) and F1W (mean = 71.81 vs. 69.88, p = 0.0001) of EMA-SE-ResUNet were significantly higher than those of U-Net, while the PAE (mean = 0.08 vs. 0.12, p = 0.0287) was significantly lower. These results confirm that the proposed model achieves statistically significant improvements in segmentation accuracy and error reduction over the baseline.

5.3. Evaluation of Whitecap Coverage Extraction

In practical applications for whitecap coverage extraction, perspective transformation must first be applied to the images to correct distortions or tilts induced by the capturing angle. This process assumes the presence of an approximately rectangular object within the image. Through computation of its four corners and mapping to a standard rectangle, the true area proportion is recovered. A simplified schematic of this distortion correction is illustrated in Figure 7.
By applying simple calibration to the collected data and processing the model outputs using the same calibration method, the whitecap coverage within the corrected images and its corresponding ground truth values were calculated. Scatter plots for the test set were then generated, and key statistical metrics, including root mean square error (RMSE) and the coefficient of determination (R2), were computed. As shown in Figure 8, EMA-SE-ResUNet demonstrated the highest extraction accuracy in coverage quantification, achieving an RMSE of 0.0016% and an R2 of 0.9654.

5.4. Summary of Model Analysis

Experimental results demonstrate that the proposed EMA-SE-ResUNet model achieves highly accurate edge positioning and maintains near-perfect recall for sparse whitecaps during segmentation. Compared to the baseline U-Net, it achieves an absolute improvement of 2.1% in IoUw and a significant reduction in PAE, verifying robust handling of complex backgrounds. Concurrently, the substantial decrease in computational load (GFLOPs) and high fidelity in whitecap coverage extraction render it highly suitable for shipborne real-time systems. Furthermore, the model exhibits superior generalization and segmentation performance relative to other popular segmentation models.
Through structural innovation and task-specific adaptations, the proposed model synergistically breaks the trade-off between accuracy and efficiency in sparse small-target segmentation, thereby offering a novel technical framework for fine-grained analysis of marine vessel-based imagery and remote sensing data.

5.5. Discussion

The current study is limited by the imaging equipment, which introduces significant noise into captured images, and non-negligible errors persist during label annotation. Consequently, subsequent research requires enhanced imaging capabilities. Additionally, future work should explore the generalization of the model across multi-sensor data. Although the model achieves pixel-level segmentation, it does not explicitly incorporate physical parameters governing whitecap generation (e.g., wind-wave Reynolds number). Future efforts could enhance the physical interpretation of the model through multimodal inputs (e.g., anemometer wind speed data, wave buoy measurements) and integrate physical models to further refine the dynamic prediction accuracy of whitecap coverage. Subsequent studies may also conduct comprehensive research by correlating whitecap coverage metrics (calculated after perspective correction) with diverse hydrological data (e.g., wind speed), performing integrated analyses to establish a more holistic framework for investigating whitecap generation and evolution dynamics.

6. Conclusions

This study achieved precise segmentation of whitecap coverage in complex marine environments by constructing the dual-end enhanced EMA-SE-ResUNet model, which integrates the ResNet-50 residual network with a U-Net encoder–decoder architecture. Experimental results demonstrate the following:
  • While ResUNet reduces computational load with only tiny accuracy loss, the introduction of EMA and SENet modules significantly enhances model robustness, providing an effective refinement strategy for whitecap segmentation.
  • The proposed model exhibits strong robustness across diverse lighting conditions and wave morphology variations, enabling accurate detection and segmentation of small whitecap features while efficiently focusing on critical target regions.
  • The model outperforms popular algorithms in key metrics such as IoUW and PAE, while reducing GFLOPs by 57.87% compared to traditional U-Net. It also supplies high-fidelity whitecap coverage extraction, balancing accuracy with real-time efficiency. Under the current runtime environment, it achieves real-time processing at 10.17 frames per second (with potential for further acceleration in higher-configuration systems), meeting the energy-efficiency demands of long-term monitoring onboard research vessels.
These results establish a vital methodology for accurately extracting the key parameters of whitecap coverage from marine imagery and provide an efficient technical tool for ocean–atmosphere interaction research, particularly in satellite remote sensing retrieval, air–sea flux parameterization, and related domains.

Author Contributions

Conceptualization, W.C. and Y.W.; methodology, W.C.; formal analysis, Y.W.; investigation, W.C.; data curation, W.C. and Y.W.; writing—original draft preparation, W.C.; writing—review and editing, Y.W.; visualization, X.C.; supervision, X.C. All authors have read and agreed to the published version of the manuscript.

Funding

This work was funded by the National Natural Science Foundation of China (41976174, 41606196), the Project on the Survey and Monitor-Evaluation of Global Fishery Resources sponsored by the Ministry of Agriculture and Rural Affairs, and the Shanghai University Teachers’ Practice Program in Industry-University-Research Collaboration (A1-2007-25-000408).

Data Availability Statement

The data supporting this study have been deposited in Zenodo and can be accessed at https://doi.org/10.5281/zenodo.15799357.

Conflicts of Interest

The authors have no relevant financial or non-financial interests to disclose.

References

  1. Monahan, E.C.; O’Muircheartaigh, I.G. Whitecaps and the passive remote sensing of the ocean surface. Int. J. Remote Sens. 1986, 7, 627–642. [Google Scholar] [CrossRef]
  2. Bortkovskii, R.S.; Novak, V.A. Statistical dependencies of sea state characteristics on water temperature and wind-wave age. J. Mar. Syst. 1993, 4, 161–169. [Google Scholar] [CrossRef]
  3. Callaghan, A.; de Leeuw, G.; Cohen, L.; O’Dowd, C.D. Relationship of Oceanic Whitecap Coverage to Wind Speed and Wind History. Geophys. Res. Lett. 2008, 35, L23609. [Google Scholar] [CrossRef]
  4. Baker, C.M.; Moulton, M.; Palmsten, M.L.; Brodie, K.; Nuss, E.; Chickadel, C.C. Remotely Sensed Short-Crested Breaking Waves in a Laboratory Directional Wave Basin. Coast. Eng. 2023, 183, 104327. [Google Scholar] [CrossRef]
  5. Lafon, C.; Piazzola, J.; Forget, P.; Despiau, S. Whitecap coverage in coastal environment for steady and unsteady wave field conditions. J. Mar. Syst. 2007, 66, 38–46. [Google Scholar] [CrossRef]
  6. Schwendeman, M.; Thomson, J. Observations of whitecap coverage and the relation to wind stress, wave slope, and turbulent dissipation. J. Geophys. Res. Oceans 2015, 120, 8346–8363. [Google Scholar] [CrossRef]
  7. Brumer, S.E.; Zappa, C.J.; Brooks, I.M.; Tamura, H.; Brown, S.M.; Blomquist, B.W.; Cifuentes-Lorenzen, A. Whitecap coverage dependence on wind and wave statistics as observed during SO GasEx and HiWinGS. J. Phys. Oceanogr. 2017, 47, 2211–2235. [Google Scholar] [CrossRef]
  8. Deike, L. Mass transfer at the ocean–atmosphere interface: The role of wave breaking, droplets, and bubbles. Annu. Rev. Fluid Mech. 2022, 54, 191–224. [Google Scholar] [CrossRef]
  9. Callaghan, A.H.; White, M. Automated processing of sea surface images for the determination of whitecap coverage. J. Atmos. Ocean. Technol. 2009, 26, 383–394. [Google Scholar] [CrossRef]
  10. Zhao, B.; Lu, Y.; Ding, J.; Jiao, J.; Tian, Q. Discrimination of oceanic whitecaps derived by sea surface wind using Sentinel-2 MSI images. J. Geophys. Res. Oceans 2022, 127, e2021JC018208. [Google Scholar] [CrossRef]
  11. Yin, Z.; Lu, Y. Optical Quantification of Wind-Wave Breaking and Regional Variations in Different Offshore Seas Using Landsat-8 OLI Images. J. Geophys. Res. Atmos. 2025, 130, e2024JD041764. [Google Scholar] [CrossRef]
  12. Anguelova, M.D.; Webster, F. Whitecap coverage from satellite measurements: A first step toward modeling the variability of oceanic whitecaps. J. Geophys. Res. Oceans 2006, 111, C3. [Google Scholar] [CrossRef]
  13. Qi, J.; Yang, Y.; Zhang, J. Global Prediction of Whitecap Coverage Using Transfer Learning and Satellite-Derived Data. Remote Sens. 2025, 17, 1152. [Google Scholar] [CrossRef]
  14. Liu, X.; Zhang, S.; Li, M.; Dang, C. Study on Comparison, Improvement and Application of Whitecap Automatic Identification Algorithm. Semicond. Optoelectron. 2017, 38, 758–761. [Google Scholar] [CrossRef]
  15. Al-Lashi, R.S.; Webster, M.; Gunn, S.R.; Czerski, H. Toward omnidirectional and automated imaging system for measuring oceanic whitecaps coverage. J. Opt. Soc. Am. A 2018, 35, 515–521. [Google Scholar] [CrossRef]
  16. Wang, Y.; Sugihara, Y.; Zhao, X.; Nakashima, H.; Eljamal, O. Deep Learning-Based Image Processing for Whitecaps on the Ocean Surface. J. Japan Soc. Civ. Eng. Ser. B2 (Coast. Eng.) 2020, 76, I_163–I_168. [Google Scholar] [CrossRef]
  17. Yang, X.; Potter, H. A Novel Method to Discriminate Active from Residual Whitecaps Using Particle Image Velocimetry. Remote Sens. 2021, 13, 4051. [Google Scholar] [CrossRef]
  18. Hu, X.; Yu, Q.; Meng, A.; He, C.; Chi, S.; Li, M. Using Optical Flow Trajectories to Detect Whitecaps in Light-Polluted Videos. Remote Sens. 2022, 14, 5691. [Google Scholar] [CrossRef]
  19. He, K.; Zhang, X.; Ren, S.; Sun, J. Deep residual learning for image recognition. In Proceedings of the IEEE Conference on Computer Vision and Pattern Recognition, Las Vegas, NV, USA, 27–30 June 2016; pp. 770–778. [Google Scholar] [CrossRef]
  20. Ronneberger, O.; Fischer, P.; Brox, T. U-net: Convolutional networks for biomedical image segmentation. In Medical Image Computing and Computer-Assisted Intervention—MICCAI 2015, Proceedings of the 18th International Conference, Munich, Germany, 5–9 Octobe 2015; Springer: Cham, Switzerland, 2015; pp. 234–241. [Google Scholar] [CrossRef]
  21. Ouyang, D.; He, S.; Zhang, G.; Luo, M.; Guo, H.; Zhan, J.; Huang, Z. Efficient multi-scale attention module with cross-spatial learning. In Proceedings of the 2023 IEEE International Conference on Acoustics, Speech and Signal Processing (ICASSP), Rhodes Island, Greece, 4–10 June 2023; pp. 1–5. [Google Scholar] [CrossRef]
  22. Hu, J.; Shen, L.; Sun, G. Squeeze-and-excitation networks. In Proceedings of the IEEE Conference on Computer Vision and Pattern Recognition, Salt Lake City, UT, USA, 18–23 June 2018; pp. 7132–7141. [Google Scholar] [CrossRef]
  23. Bakhoday-Paskyabi, M.; Reuder, J.; Flügge, M. Automated measurements of whitecaps on the ocean surface from a buoy-mounted camera. Methods Oceanogr. 2016, 17, 14–31. [Google Scholar] [CrossRef]
  24. Shaban, M.; Salim, R.; Abu Khalifeh, H.; Khelifi, A.; Shalaby, A.; El-Mashad, S.; Mahmoud, A.; Ghazal, M.; El-Baz, A. A deep-learning framework for the detection of oil spills from SAR data. Sensors 2021, 21, 2351. [Google Scholar] [CrossRef]
  25. Ren, Y.; Li, X.; Li, Z.; Liu, B.; Wang, C.; Zhang, H. Development of a dual-attention U-Net model for sea ice and open water classification on SAR images. IEEE Geosci. Remote Sens. Lett. 2021, 19, 4010205. [Google Scholar] [CrossRef]
  26. Kikaki, K.; Kakogeorgiou, I.; Hoteit, I.; Karantzalos, K. Detecting Marine Pollutants and Sea Surface Features with Deep Learning in Sentinel-2 Imagery. ISPRS J. Photogramm. Remote Sens. 2024, 210, 39–54. [Google Scholar] [CrossRef]
  27. Yan, T.; Wan, Z.; Deng, X.; Zhang, P.; Liu, Y.; Lu, H. MAS-SAM: Segment Any Marine Animal with Aggregated Features. arXiv 2024, arXiv:2404.15700. [Google Scholar] [CrossRef]
  28. Li, Y.; Hou, Q.; Zheng, Z.; Cheng, M.M.; Yang, J.; Li, X. Large selective kernel network for remote sensing object detection. In Proceedings of the IEEE/CVF International Conference on Computer Vision, Paris, France, 1–6 October 2023; pp. 16794–16805. [Google Scholar] [CrossRef]
  29. Park, J.; Woo, S.; Lee, J.Y.; Kweon, I.S. BAM: Bottleneck attention module. arXiv 2018. [Google Scholar] [CrossRef]
  30. Yang, L.; Zhang, R.Y.; Li, L.; Xie, X. SIMAM: A simple, parameter-free attention module for convolutional neural networks. In Proceedings of the 38th International Conference on Machine Learning, Virtual, 18–24 July 2021; pp. 11863–11874. [Google Scholar]
  31. Woo, S.; Park, J.; Lee, J.Y.; Kweon, I.S. CBAM: Convolutional block attention module. In Proceedings of the European Conference on Computer Vision (ECCV), Munich, Germany, 8–14 September 2018; pp. 3–19. [Google Scholar] [CrossRef]
  32. Cai, X.; Lai, Q.; Wang, Y.; Wang, W.; Sun, Z.; Yao, Y. Poly kernel inception network for remote sensing detection. In Proceedings of the IEEE/CVF Conference on Computer Vision and Pattern Recognition, Seattle, WA, USA, 16–22 June 2024; pp. 27706–27716. [Google Scholar] [CrossRef]
  33. Chen, L.C.; Zhu, Y.; Papandreou, G.; Schroff, F.; Adam, H. Encoder-decoder with atrous separable convolution for semantic image segmentation. In Proceedings of the European Conference on Computer Vision (ECCV), Munich, Germany, 8–14 September 2018; pp. 801–818. [Google Scholar] [CrossRef]
  34. Zhao, H.; Shi, J.; Qi, X.; Wang, X.; Jia, J. Pyramid scene parsing network. In Proceedings of the IEEE Conference on Computer Vision and Pattern Recognition, Honolulu, HI, USA, 21–26 July 2017; pp. 2881–2890. [Google Scholar] [CrossRef]
  35. Sun, K.; Xiao, B.; Liu, D.; Wang, J. Deep high-resolution representation learning for human pose estimation. In Proceedings of the IEEE/CVF Conference on Computer Vision and Pattern Recognition, Long Beach, CA, USA, 15–20 June 2019; pp. 5693–5703. [Google Scholar] [CrossRef]
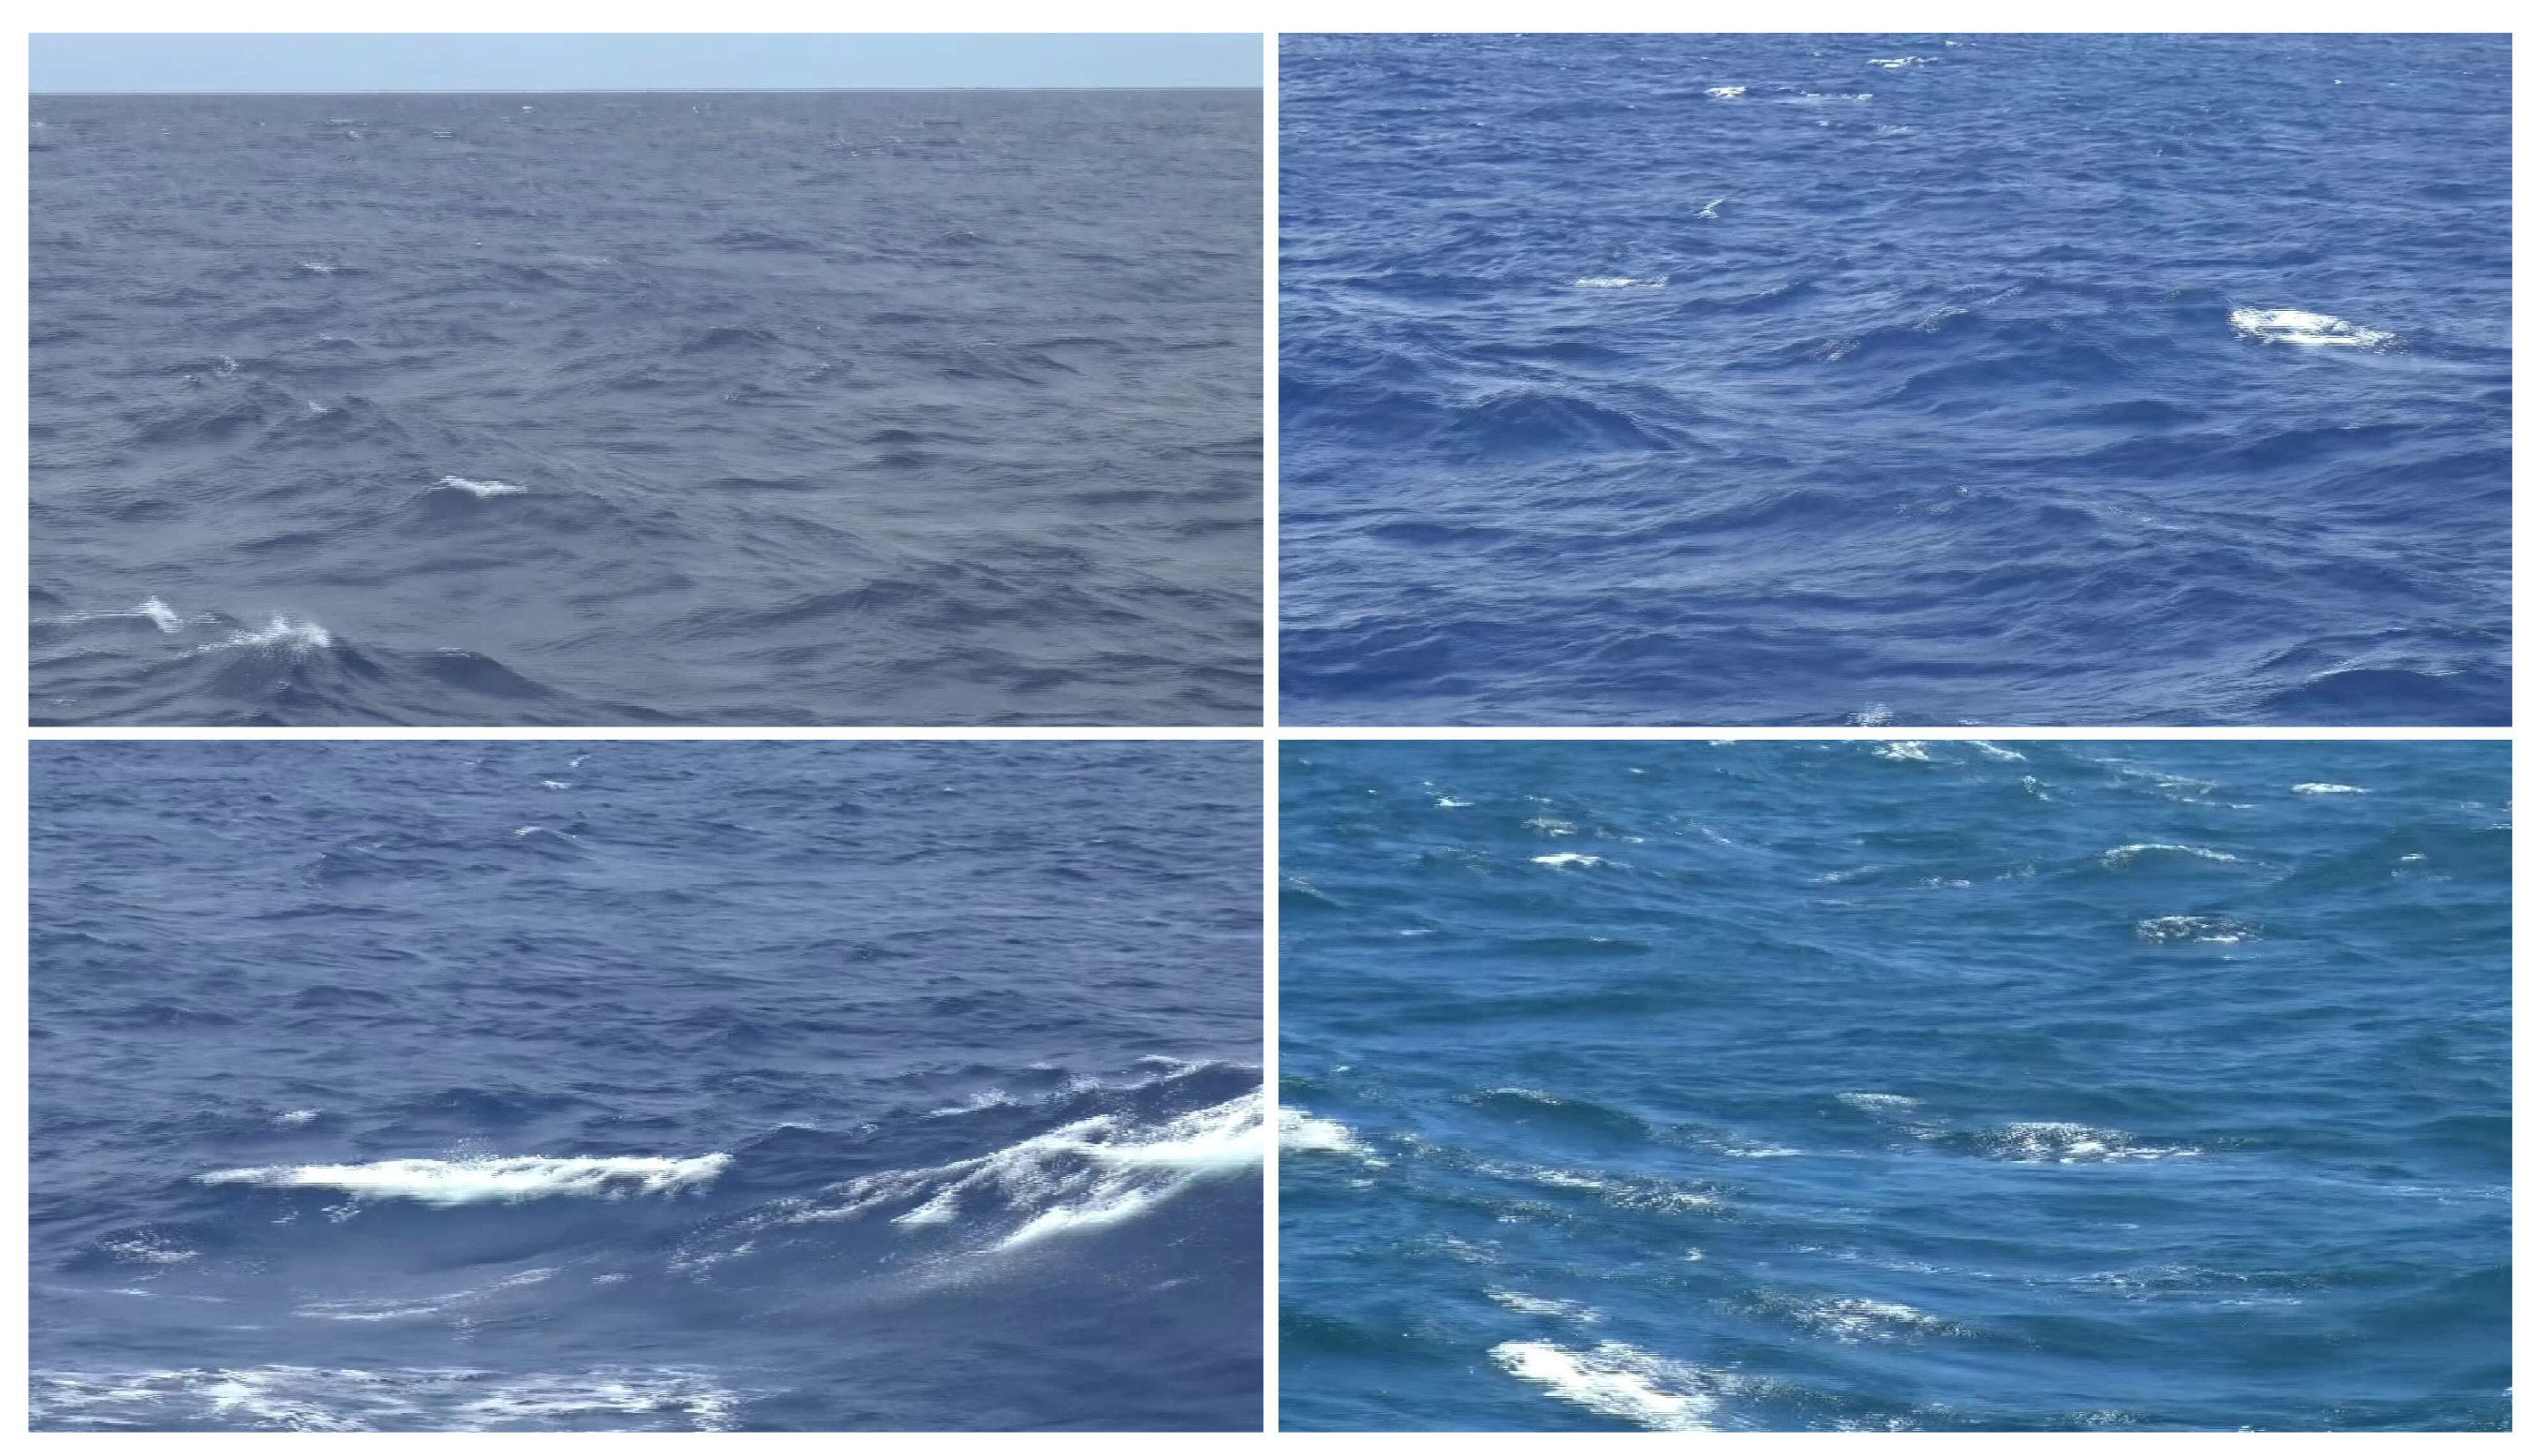
Figure 1. Typical images of captured whitecaps.
Electronics 14 04286 g001
Figure 2. Flowchart of EMA-SE-ResUNet, illustrating its primary operational workflow.
Electronics 14 04286 g002
Figure 3. EMA-enhanced ResNet Scheme. (a) Structure of the EMA module. The input tensor is split into channel groups, followed by processing through parallel architecture and a cross-spatial architecture, and then fused to produce the output. (b) Schematic diagram of the ResNet bottleneck structure with the EMA module embedded at the skip connection.
Electronics 14 04286 g003
Figure 4. SENet—enhanced U-Net scheme: (a) structure of the SENet module, (b) U-Net upsampling architecture with the SENet module embedded at the pre-upsampling stage.
Electronics 14 04286 g004
Figure 5. Model heatmap comparison showing probability distributions of whitecap extraction across different models, reflecting each model’s sensitivity to whitecap regions. Column 1: original images; columns 2–6: outputs from Deeplav3+, PSPNet, HRNet, U-Net, and EMA-SE-ResUNet, respectively. Color gradients represent probability (red: high sensitivity; blue: low sensitivity). Multiple comparison examples (AG) are provided to demonstrate model performance variations.
Electronics 14 04286 g005
Figure 6. Visual comparison of segmentation outputs across models. Column 1: original images; column 2: ground truth labels (white: whitecap; black: background); columns 3–7: outputs from Deeplav3+, PSPNet, HRNet, U-Net, and EMA-SE-ResUNet, respectively, with white regions indicating segmented whitecaps and black regions as background. Multiple comparative examples (AG) demonstrate performance variations in whitecap extraction under diverse conditions.
Electronics 14 04286 g006
Figure 7. Schematic diagram of simplified distortion correction, with model-calculated results highlighted in red.
Electronics 14 04286 g007
Figure 8. Comparison of whitecap coverage extraction results across different models. Subplots (ae) correspond to (a) Deeplabv3+, (b) HRNet, (c) PSPNet, (d) U-Net, and (e) EMA-SE-ResUNet. Each subplot displays scatter points comparing model-predicted whitecap coverage (W, %) versus ground truth values (W, %), with data density normalized and represented on a logarithmic color scale.
Electronics 14 04286 g008
Table 1. Comparisons of improved performance of modules on the ResNet side. (✓ indicates the improved component, // denotes the baseline model, and bold font highlights the best performance.)
ModuleImprovement Location IoUw
(%) ↑
Gain
(%) ↑
PAE
(%) ↓
Gain
(%) ↓
FLOPs
(G) ↓
Gain
(G) ↓
ResNet
Bottleneck
Junction
Skip in
ResNet
Bottleneck
ResUNet//70.75//0.108//381.239//
+LSK70.950.20.1130.005496.618115.379
+LSK70.39−0.360.1190.011410.28929.05
+SENet71.550.80.102−0.006381.3630.124
+SENet71.81.050.104−0.004381.2730.034
+BAM70.7−0.050.107−0.001393.41612.177
+BAM71.170.420.1090.001384.2893.05
+SIMAM69.90−0.850.1120.004381.239<0.001
+SIMAM71.460.710.102−0.006381.239<0.001
+EMA72.071.320.096−0.012401.77720.538
+EMA72.97 2.220.081−0.027386.3855.146
Table 2. Comparisons of improved performance of modules on the U-Net side. (✓ indicates the improved component, // denotes the baseline model, and bold font highlights the best performance.)
ModuleImprovement Location IoUw
(%) ↑
Gain
(%) ↑
PAE
(%) ↓
Gain
(%) ↓
FLOPs
(G) ↓
Gain
(G) ↓
U-Net
Pre-
Upsampling
U-Net
Post-
Upsampling
ResUNet//70.75//0.108//381.239//
+EMA71.801.050.101−0.007405.80824.569
+EMA71.450.70.106−0.002382.621.381
+CBAM71.480.730.103−0.005381.3970.158
+CBAM71.280.530.104−0.004381.3070.068
+BAM71.590.840.103−0.005395.83214.593
+BAM70.03−0.720.1280.02382.0520.813
+CAA67.75−3.00.1390.031555.713174.474
+CAA70.72−0.030.1140.006391.1229.883
+SENet71.841.090.098−0.01381.3590.12
+SENet71.60.850.099−0.009381.2720.033
Table 3. Ablation study on model components.
ModelIoUW (%) ↑F1W (%) ↑PAE (%) ↓FLOPs (G) ↓Params (M) ↓FPS ↑
U-Net71.22 ± 19.7683.19 ± 19.910.115 ± 0.225904.95331.0447.9
ResUNet70.75 ± 20.2682.87 ± 20.610.108 ± 0.221381.23943.93711.04
EMA-ResUNet72.97 ± 18.6084.37 ± 18.460.086 ± 0.163386.38543.99210.12
SE-ResUNet71.84 ± 19.0783.61 ± 19.050.099 ± 0.247381.35945.28510.83
EMA-SE-ResUNet73.32 ± 18.2384.60 ± 18.040.081 ± 0.156386.50545.34010.17
FPS values were measured under the experimental setup and hardware configuration used in this study. Results in columns 2–4 are reported as mean ± standard deviation, reflecting variability across test samples. ↑: higher is better; ↓: lower is better.
Table 4. Comparisons of different models.
ModelIoUW (%) ↑F1W (%) ↑PAE (%) ↓FLOPs (G) ↓Params (M) ↓FPS ↑
Deeplabv3+64.93 ± 17.8778.34 ± 18.860.138 ± 0.285344.76054.7099.54
PSPNet48.94 ± 20.1465.71 ± 25.390.197 ± 0.486244.60546.70713.55
HRNet65.23 ± 19.4578.96 ± 20.770.117 ± 0.274387.79765.8478.94
U-Net71.22 ± 19.7683.19 ± 19.910.115 ± 0.225904.95331.0447.9
EMA-SE-ResUNet73.32 ± 18.2384.60 ± 18.040.081 ± 0.156386.50545.34010.17
FPS values were measured under the experimental setup and hardware configuration used in this study. Results in columns 2–4 are reported as mean ± standard deviation, reflecting variability across test samples. ↑: higher is better; ↓: lower is better.
Disclaimer/Publisher’s Note: The statements, opinions and data contained in all publications are solely those of the individual author(s) and contributor(s) and not of MDPI and/or the editor(s). MDPI and/or the editor(s) disclaim responsibility for any injury to people or property resulting from any ideas, methods, instructions or products referred to in the content.