Article

CardioResp Device: Hardware and Firmware of an Embedded Wearable for Real-Time ECG and Respiration in Dynamic Settings

by
Mahfuzur Rahman
1,* and
Bashir I. Morshed
2
1
Department of Electrical and Computer Engineering, Rose-Hulman Institute of Technology, Terre Haute, IN 47803, USA
2
Department of Computer Science, Texas Tech University, Lubbock, TX 79409, USA
*
Author to whom correspondence should be addressed.
Electronics 2025, 14(21), 4276; https://doi.org/10.3390/electronics14214276
Submission received: 15 September 2025 / Revised: 25 October 2025 / Accepted: 28 October 2025 / Published: 31 October 2025

Abstract

Monitoring electrocardiogram (ECG) and respiration continuously and non-invasively is essential for managing cardiopulmonary health. An effective wearable device can be used to regularly monitor key vitals, reducing the need for clinical visits. In this work, we propose a custom device for real-time continuous ECG by inkjet printed (IJP) dry electrodes and respiration monitoring by using a novel single 6-axis inertial measurement unit (IMU). The proposed system can extract the heart rate (HR) and respiration rate (RR) during static and dynamic postures. The respiration process implements a quaternion-based update and multiple filtering stages to estimate the signal. The custom device uses Bluetooth protocol to send the raw and processed data to a mobile application. The RR is investigated in stationary, i.e., sitting and standing, and dynamic, i.e., walking, running, and cycling, postures. The proposed device is evaluated with commercial Go Direct® respiration belt from Vernier® for RR and offers an overall accuracy of 99.3% and 98.6% for static and dynamic conditions, respectively. The wearable also offers 98.9% and 97.9% accuracy for HR measurements, respectively, in static and active postures when compared with the Kardia® device. Furthermore, the device is assessed in an ambulatory monitoring setup in both indoor and outdoor environments. The low-power wearable consumes an average of only 7.4 mA of current during data processing. The device performs effectively and efficiently in both stationary and active states, offering a low complexity, portable solution for real-time monitoring. The proposed system can benefit from the continuous monitoring and early detection of pulmonary and cardio-respiratory health issues.

1. Introduction

Long-term and effective personal health monitoring has been challenging as the rapidly increasing population outpaces the number of medical professionals. With the advancement of medical science, many critical diseases are being resolved nowadays, which results in a higher life expectancy. This also introduces a new challenge to ensure well-being services to everyone, especially when the elderly population is supposed to exceed 2 billion by 2050 [1]. To cope with increasing demands, traditional medical services are not enough [2]. Wearable medical devices work as the best solution to personalized and long-term health tracking to overcome challenges [3]. Internet of Things (IoT) devices have proven the capability to detect and monitor vital signs both in indoor and outdoor setups [4,5]. Several IoT wearables are present that can effectively process major physiological signals such as electrocardiography (ECG), electroencephalography (EEG), respiration, body temperature, human activity, etc. [6,7,8,9]. Recent advances in wireless technology and AI-driven edge computing have enabled IoT-based wearables to transmit data reliably over long ranges while enhancing their computational performance for smart connected healthcare systems [10,11,12,13]. Taking this to the further edge, TinyML-based models are recently being implemented on low-resource wearable devices [14]. Advancements in sensor materials and technology have led to wearable devices suitable for important biomarker discovery [15,16]. A combination of these technologies can enable IoT-based devices to solve more sophisticated problems in healthcare, like a drug delivery system for critical and chronic diseases [17,18].
Cardiopulmonary diseases require the simultaneous monitoring of ECG and respiration signals. The health professionals aim at reliable multimodal monitoring for pre- and post-operative patients. Heart rate (HR) and respiration rate (RR) were monitored for 26 patients recovering from major abdominal cancer surgery [19]. The wearable was used to monitor more than 100 h of vital signs in an intensive care unit (ICU). Another study involved vital sign monitoring from 10 patients in a post-surgical ICU [20]. The cardiac patch on the chest continuously recorded a single-lead ECG and employed its algorithm to derive RR. These studies indicate that continuous and multimodal monitoring is important for disease tracking. Many of these traditional devices lack robust real-time processing capabilities and simultaneous monitoring. Specifically, for daily monitoring, multimodal sensing is crucial, as it provides an in-depth health status to the physician. Commercial textile patch sensors are available which can simultaneously monitor HR and RR with a correlation coefficient (r) of ∼0.86 [21]. However, patch sensors come with greater thickness, less flexibility and need to be tightly attached to the skin. As a result, it can still create discomfort for long-term daily monitoring. Recently, dry ECG electrodes have become popular for their flexible and long-term sensing capability. A study included 30 min of data acquisition during resting and exercise periods for 25 adult participants [22]. The dry electrodes provided superior performance over traditional gel electrodes for long-term monitoring. However, metal dry electrodes have limitations due to their inflexibility and discomfort during long-term monitoring. Additionally, the skin-printed dry electrodes have a thickness of about 100 µm, which can still cause skin irritation. This work introduces a custom device that incorporates the inkjet printed (IJP) dry electrodes for ECG measurement. The IJP electrodes provide better flexibility and comfort, and are only ∼2 µm thick and work even after 100 k bending cycles [23]. The proposed system offers real-time on-device processing of ECG and respiration by using IJP electrodes and a single inertial measurement unit (IMU) sensor, respectively.
Respiration signal is one of the vital physiological signals for human body management. Continuous, precise monitoring of breathing patterns is essential for effective tracking of a broad spectrum of pulmonary and cardio-pulmonary health conditions [24,25]. Every respiratory phase contains subsequent inhale and exhale phases that intake oxygen and release carbon dioxide, respectively [26]. RR is the measure of the number of inhalations and exhalations in one minute. Normal RR is within the range of 12 to 20 breaths per minute (BrPM). RR varies with age, being higher in infants and the elderly than in younger individuals [27]. An abnormal breathing pattern indicates several potential health concerns, including bradypnea, tachypnea, chronic obstructive pulmonary disease (COPD), and asthma [28,29,30]. Thus, continuous monitoring of the respiration phases is significant for physiological well-being. The traditional clinical setup uses capnography, spirometry, and impedance pneumography-based methods for extracting respiratory behavior. Most of these approaches rely on bulky, costly equipment and require skilled healthcare personnel to operate [9]. This makes setups inflexible for continuous, daily monitoring.
In respiratory monitoring, numerous non-invasive approaches have been explored, including capacitive sensors, IMU-based systems, impedance pneumography, ECG-derived respiration, and AI-driven predictive models [31,32]. Capacitive sensors mostly focus on capturing the dielectric variations that change with respect to thorax–abdomen expansion [33]. The impedance pneumography technique captures the impedance changes around the thorax–abdomen region. The technique uses skin electrodes to capture the impedance that refers to the air volume in the lungs and surrounding body tissues, organs, and moisture in the sensing area [34,35,36]. In addition to occupying more body surface area, these electrodes may cause skin irritation and overlap with other sensors in multimodal monitoring. ECG-derived respiration (EDR) is growing in popularity because it requires minimal additional sensors [37]. However, the method encounters accuracy issues, respiration being extracted as a secondary signal, especially during irregular breathing patterns or body movements [38]. Several non-contact-based methods are also available for breathing pattern monitoring such as ultra-wideband radars, high-resolution cameras, and acoustic breath signal construction [39,40,41]. These methods also provide multiple disadvantages like computation and power overload, multi-subject interference, and sensitivity to motion artifact.
The inertial measurement unit (IMU) sensors, with suitable placement, can effectively capture thoracic and abdominal movements caused by the breathing pattern [42,43]. Several works indicate that the IMU placed in the abdominal wall, or thorax–abdomen region, provides higher correlation with breathing pattern [44,45,46]. A chest-worn IMU can also be implemented for continuous monitoring [47]. IMU data can be affected by non-respiratory movement during dynamic states and may require careful signal processing [48,49]. Artificial intelligence (AI) can also be integrated with IMU data to enhance the system’s performance [50]. Meanwhile, AI-based respiratory predictive models can provide high accuracy but demand significant computational resources, complicating real-time implementation on wearable, low-power platforms [51,52]. Because IMUs are sensitive to posture and movement, most studies focus on static monitoring. Recent multi-sensor IMU systems capture respiration during motion but increase bulk, reduce wearability and efficiency, and often lack real-time on-device processing for ambulatory use.
This work proposes a novel wearable device using a single 6-axis IMU to deliver continuous, real-time respiratory monitoring during both stationary and mobile activities. The wearable is placed on the thorax–abdomen wall to detect respiratory-induced movements. The 3-axis accelerometer and 3-axis gyroscope provide variations in linear and angular motions. The proposed method is assessed with respect to a commercial device as a reference in multiple static and dynamic conditions. Compared to bioimpedance-based respiration monitoring, a single IMU-based approach eliminates the need for additional respiratory-related electrodes, sensor nodes, and circuit components. In addition to the respiration signal, the wearable can capture and process ECG, pulse oximeter (PO), and body temperature data in real time. All signal processing is performed on-device, and both the raw sensor data and extracted signal features are streamed via Bluetooth to a companion mobile app. As a result, the system delivers an exceptionally portable, efficient, and low-complexity solution with minimal latency, making it ideal for real-time applications. Finally, the device’s performance is discovered in ambulatory settings across diverse body postures and movements, both indoors and outdoors. The proposed on-device processing performs accurately and reliably in different conditions and is suitable for simultaneous, long-term monitoring of physiological signs.
The paper is organized as follows: Section 2 discusses the recent contributions in wearable technology for respiration monitoring. Section 3 provides a description of hardware-firmware co-design, signal processing blocks for ECG, breathing, peripheral capillary oxygen saturation (SpO2), and body temperature signals. Section 4 presents the experimental protocols and setup. Section 5 provides a detailed performance analysis of the wearable in static, dynamic, and ambulatory conditions. Section 6 discusses the scope and limitations of the proposed wearable technology, and Section 7 concludes the work with future considerations and opportunities.

2. Related Work

Most recently, non-invasive techniques are becoming popular among wearable cardiac and respiration monitoring. Non-invasive techniques are mainly divided into contact and non-contact based methods. Contact-based non-invasive cardio-respiratory monitoring includes mainly IJP, skin printed patch, capacitive, humidity, bioimpedance, and IMU sensors. Among the non-contact-based methods, ultrasonic sensors are usually used.
Dry ECG electrodes are suitable for long-term continuous monitoring. Traditional metal and gel electrodes are not suitable for long-term monitoring, as they can cause skin irritation and can leave skin rash when peeled off. A dry and flexible IJP electrode can provide better comfort and less noise during ambulatory condition [23]. IJP technology offers reduced thickness compared to other concurrent flexible dry electrodes such as skin printed electrode patches. Alsharif et al. employs ECG biopatches using the multi-material direct-ink-writing (DIW) method to print silver/silver chloride (Ag/AgCl) dry ink on a paper substrate [53]. The dry electrodes have a thickness of 500 µm. For continuous and ambulatory monitoring, the IJP Silver nanoparticle ink provides greater conductivity than Ag/AgCl and greater biocompatibility than other conductive inks. The proposed device implements the IJP electrodes which are ∼2 µm thin and work without any performance degradation after 100 k cycles of bending test [23]. A contactless respiratory monitoring is presented by Jeng et al., where a 16-channel 2D ultrasound microphone array is used to capture the RR [54]. The system benefits, as no worn sensors are required, but it suffers from high power consumption. Moreover, the signal-to-noise ratio (SNR) varies with fast movement and increasing distance. A contact-based approach can a provide low-power solution and improved SNR. Grover et al. present a novel self-powered sensor that leverages single crystals of imidazolium perchlorate (IMP) for dual-purpose humidity and respiration monitoring [55]. The resulting device offers a wide relative humidity detection range (11–90% RH) with a response time of 75 s and a recovery time of 18 s. A key challenge of this method is the slow humidity response, limiting real-time breath-by-breath resolution.
A flexible textile capacitive sensor can be an alternative method to monitor the breathing signal. Ali et al. introduce a capacitive sensor that showed 99.39% accuracy in breath counts [56]. While the sensor shows resistance to noise, the work is only limited to the control settings. Also, the sensor requires an additional oscillator circuit that adds more complexity and components to the hardware. OptiBreathe introduces an in-ear wearable earbud that uses photoplethysmography (PPG) signals to continuously monitor key respiratory biomarkers: RR and tidal volume [57]. OptiBreathe achieves a mean absolute error (MAE) of only 1.96 breaths/min for RR. Despite its capability for daily monitoring, the PPG-based method suffers from sensitivity to individual differences that necessitates calibration or proper algorithm selection for every user.
Berkebile et al. explore the feasibility of using a small wearable impedance patch to estimate tidal volumes and respiratory timing parameters [35]. A compact 5.1 × 5.1 cm tetrapolar electrode patch is placed on the sternum to measure multi-frequency bioimpedance changes during breathing. Fourteen healthy subjects are tested across static and dynamic conditions. The patch’s RR has a mean absolute percentage error (MAPE) of 0.93% relative to the spirometer, vs. 0.74% for the full setup. Likewise, the patch extracts mean inspiratory and expiratory times with errors <6%, only marginally above the <4.5% error of the reference method. The work analyzes the subjects in an offline condition, saving data on an SD card. Moreover, dynamic postures are not validated against the reference. A real-time bioimpedance patch is developed by [36] that provides RR in static and dynamic conditions. The measured RR remains within 98% accuracy of the ground-truth reference in both static and dynamic conditions. The bioimpedance method depends highly on variable skin impedance, which requires the proper calibration of excitation frequencies. Moreover, the patch-based sensor can be uncomfortable for long-term body-worn conditions.
IMU sensors can offer a low complexity, user-friendly approach to extract breathing dynamics. ResPara-Net introduces a deep learning-based system that uses a single inertial measurement unit (IMU) on the torso to continuously estimate a person’s respiratory waveform [52]. The work implements a deep convolutional neural network (CNN) in MATLAB® R2024a (The MathWorks, Inc., Natick, MA, USA) to extract the RR. The performance is quantified for 12, 16, 28 BrPM, and the average RMSE is achieved at 0.12–0.14 BrPM. Moreover, the normalized MAE between the predicted and actual respiration waveforms is under 4% across all subjects. However, the implementation is completed offline and is not verified for dynamic conditions. The feasibility of the IMU sensor for respiration monitoring in both static and dynamic states is presented by [58]. The work places three IMUs over the thorax and abdomen to capture respiratory kinematics, and a third on the lower back to isolate trunk movement. The system achieves a 99% accuracy with a 1D-CNN model when all three sensors are used. This work indicates that IMU can be used to estimate respiratory behavior in both static and dynamic scenarios. The demonstrated work is not explored for real-time monitoring, which could add more viability to the system. Another work introduces a respiration monitoring system that tackles the challenge of motion artifacts by using a distributed IMU approach [49]. The system introduces an array of sensors on the chest and another on the lower back to concurrently capture respiratory movements and overall trunk motion. The system is tested on healthy subjects in static and dynamic conditions using Xsens DOT IMUs for data collection and an impedance pneumography device as the reference standard. Across different activities, the respiration signals from the IMUs have an RMSE less than 0.8 BrPM and a correlation coefficient greater than 0.7 with the reference signal.
Although IMUs provide a low-complexity, low-power solution for wearable respiratory monitoring, the use of multiple IMUs can reduce the system’s flexibility, usability, and user acceptance over long-term monitoring. Hence, developing a single IMU based low-complexity approach for long-term respiratory monitoring is still essential.

3. System Architecture and Methods

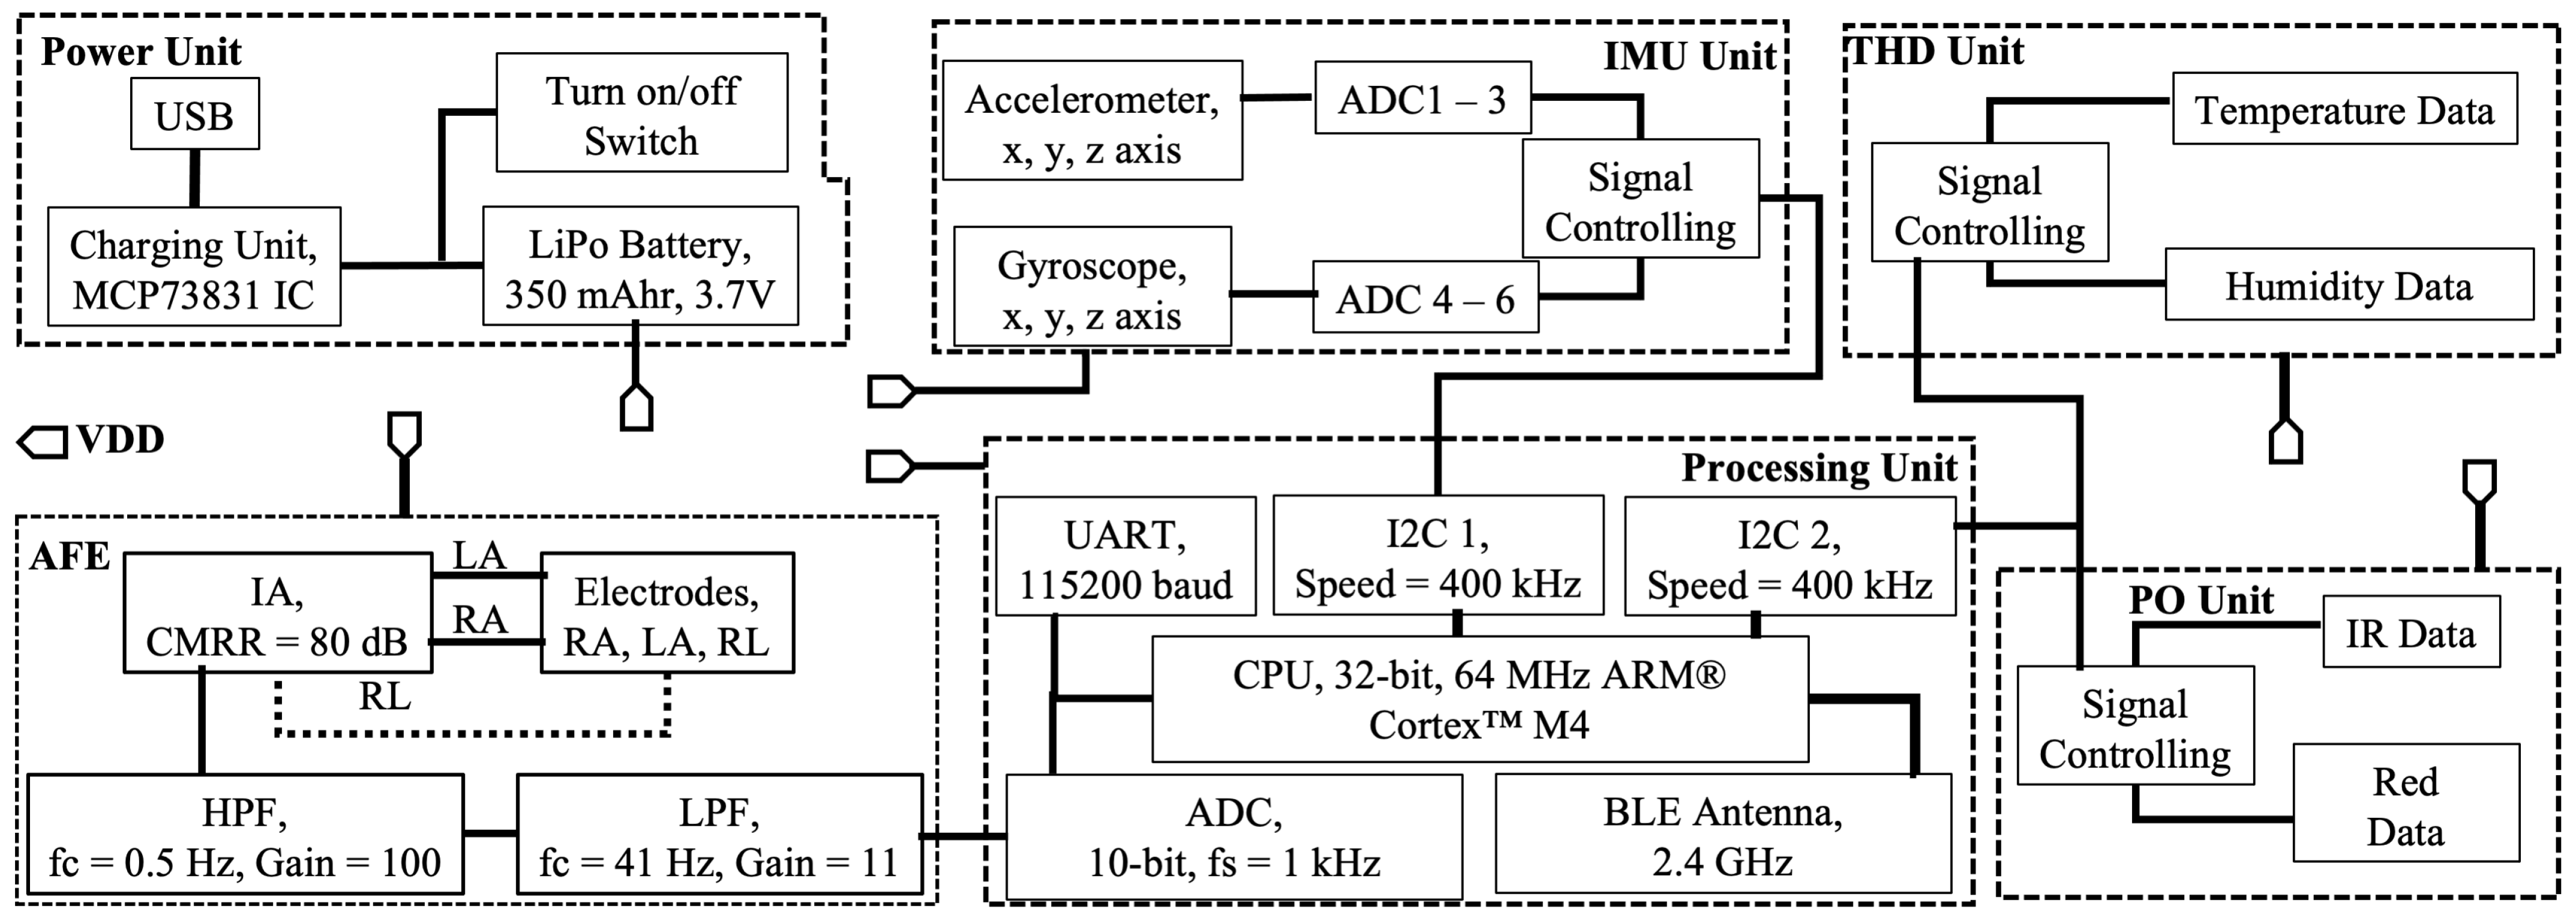
Figure 1 shows the overall system architecture of the custom wearable. The proposed wearable system consists of four front-end sensors: ECG, IMU, PO, and a temperature sensor for continuous and simultaneous data acquisition. The custom device captures and processes sensor data to extract multiple morphological features in real time, and transmits raw and processed data via BLE. In this section, the overall architecture of the proposed wearable system is presented. Novel signal processing blocks and algorithms are also discussed in this section.

3.1. Hardware Design

The custom device contains a printed circuit board (PCB) that houses the circuitry for the ECG analog front end (AFE), the IMU, and the two-wire interfaces (TWI) to SpO2, and the temperature sensor. The wearable has three main components: sensors and circuits, a processing unit, and a data transmission unit. Figure 2 provides an overview of key hardware components inside the custom device.

3.1.1. ECG AFE

The ECG data are taken from the chest using dry electrodes manufactured using IJP technology. The sensors are fabricated by silver nanoparticle ink on top of a polyimide substrate in a lab environment. The ECG electrodes are circular shape with a diameter of 19 mm and have a thickness of 2 ± 0.5 µm. The electrodes offer better performance compared to traditional dry and flexible electrodes providing an SNR of ∼22 dB and a resistivity of 15.8 ± 3 m Ω /sq [23]. The electrodes are silver epoxy to connect to the wires of an audio jack. The audio jack then connects to the custom PCB. The analog front end (AFE) of ECG contains an instrumentation amplifier (IA), AD8232 (Analog Devices, Wilmington, MA, USA) chip to capture the biopotential for cardiac activities [59]. Three IJP electrodes are placed on the chest to obtain the Lead I ECG. Figure 3a–c shows the corresponding signal processing circuitry to produce a noise-free cardiac signal. The AFE circuits mainly contain biasing, high-pass filtering (HPF), and low-pass filtering (LPF). The left-arm (LA) and right-arm (RA) electrodes are connected to the positive and negative terminals of the IA, respectively. The reference electrode (RL) is attached near the throat, and the corresponding signal is fed to the right leg drive amplifier in AD8232 to reduce the unwanted interferences and improve the common mode rejection capability.
The IA amplifies the small ECG signals by a gain factor of 100 while rejecting electrode offsets of ∼300 mV. To achieve this, an integrator circuit is formed around the output of IA (IA_OUT) to feed any near DC signals back into the IA so that the electrode offsets are rejected. The circuit also acts as an HPF that minimizes the effect of slow-moving signals such as baseline wander. The 2-pole RC network of the HPF circuit contains an additional compensator resistor (R_comp = 1.4 M Ω ) that adds additional rejection to lower-frequency signals. The cutoff frequency of the HPF (fcHPF) is 0.5 Hz, calculated by the following equation:
fc HPF = 10 2 π R 1 R 2 C 1 C 2
Equation (1) is 10 times the traditional formula because of the internal gain of 100 provided by the IA. The LPF takes the input from the high-pass stage and implements a 2-pole filtering with a cutoff frequency of fcLPF = 41 Hz. The LPF cutoff and gain are calculated as follows:
fc LPF = 1 2 π R 1 R 2 C 1 C 2
G a i n = 1 + R 3 R 4
The LPF stage adds an additional gain of 11, which makes the overall gain 1100. As the cardiac signal is in the mV range, a reasonable gain factor of 1100 is chosen to better amplify the ECG signal. The 0.5–41 Hz filter range removes baseline drift, muscle artifact, and power line noise, preserving all important ECG waveform components for accurate and stable heart-signal analysis.

3.1.2. IMU

Breathing signal is captured by an MPU-6050 (InvenSense Inc., San Jose, CA, USA)-based IMU sensor [60]. The IMU sensor provides 6-axis accelerometer and gyroscope data for precise movement of the abdominal region. Figure 3d presents the IMU circuit implemented in the PCB. The address (AD0) pin is set high to set the IMU address 0 × 69. Two 10 k Ω (Remington Industries, Johnsburg, IL, USA) resistors are connected to the serial clock (SCL) and serial data (SDA) lines to actively drive the lines low. The MPU-6050 uses an inter-integrated circuit (I2C) communication protocol at 400 kHz speed to transfer data to the processing unit. The IMU sensitivity is set to ±16 g and ±2000°/s for accelerometer and gyroscope axes, respectively. The processing unit provides two I2C instances simultaneously. The IMU sensor uses the I2C instance-1 from the microcontroller unit (µC).

3.1.3. PO and Temperature Sensor

Figure 3e provides the connection architecture for the pulse oximeter (PO) and temperature sensor. Both of the sensors use the I2C instance-2 from the µC unit with 400 kHz. The infrared (IR) and red LED data are captured from the Max30101 sensor (Maxim Integrated, San Jose, CA, USA) to process the SpO2 [61]. The temperature data is captured from the Si702 sensor (Silicon Laboratories Inc., Austin, TX, USA) [62]. The PO and temperature sensor are placed on the ear lobe and chest, respectively. The IR and red LEDs are run at a 3 mA current level.

3.1.4. Processing Unit

The processing unit consists of a system on chip (SoC) with a 32-bit 64 MHz ARM® Cortex M4 (Arm Ltd., Cambridge, UK) CPU encapsulated with a 2.4 GHz BLE radio [63]. Figure 4 represents the interconnection between major components of the system and the processing unit. In addition to two I2C instances, the µC unit also enables the analog-to-digital converter (ADC) unit for cardiac data processing. The ADC has a 10-bit resolution and samples ECG data at a 1 kHz rate. In addition to ADC, the processing unit initiates two separate timers for ADC sampling and BLE connectivity. The BLE antenna is also incorporated with the SoC for data transmission and reception (Tx-Rx). Finally, a Lithium Polymide (Lipo) power management circuit controlled by the MCP 73831 IC (Microchip Technology, Chandler, AZ, USA) is also incorporated with a µC unit to use a rechargeable battery. A Lipo (Pkcell LP552530) of 350 mAhr, 3.7 V capacity is used to power the device. The size of the device is ∼50 mm × 60 mm × 20 mm.

3.2. Firmware Design

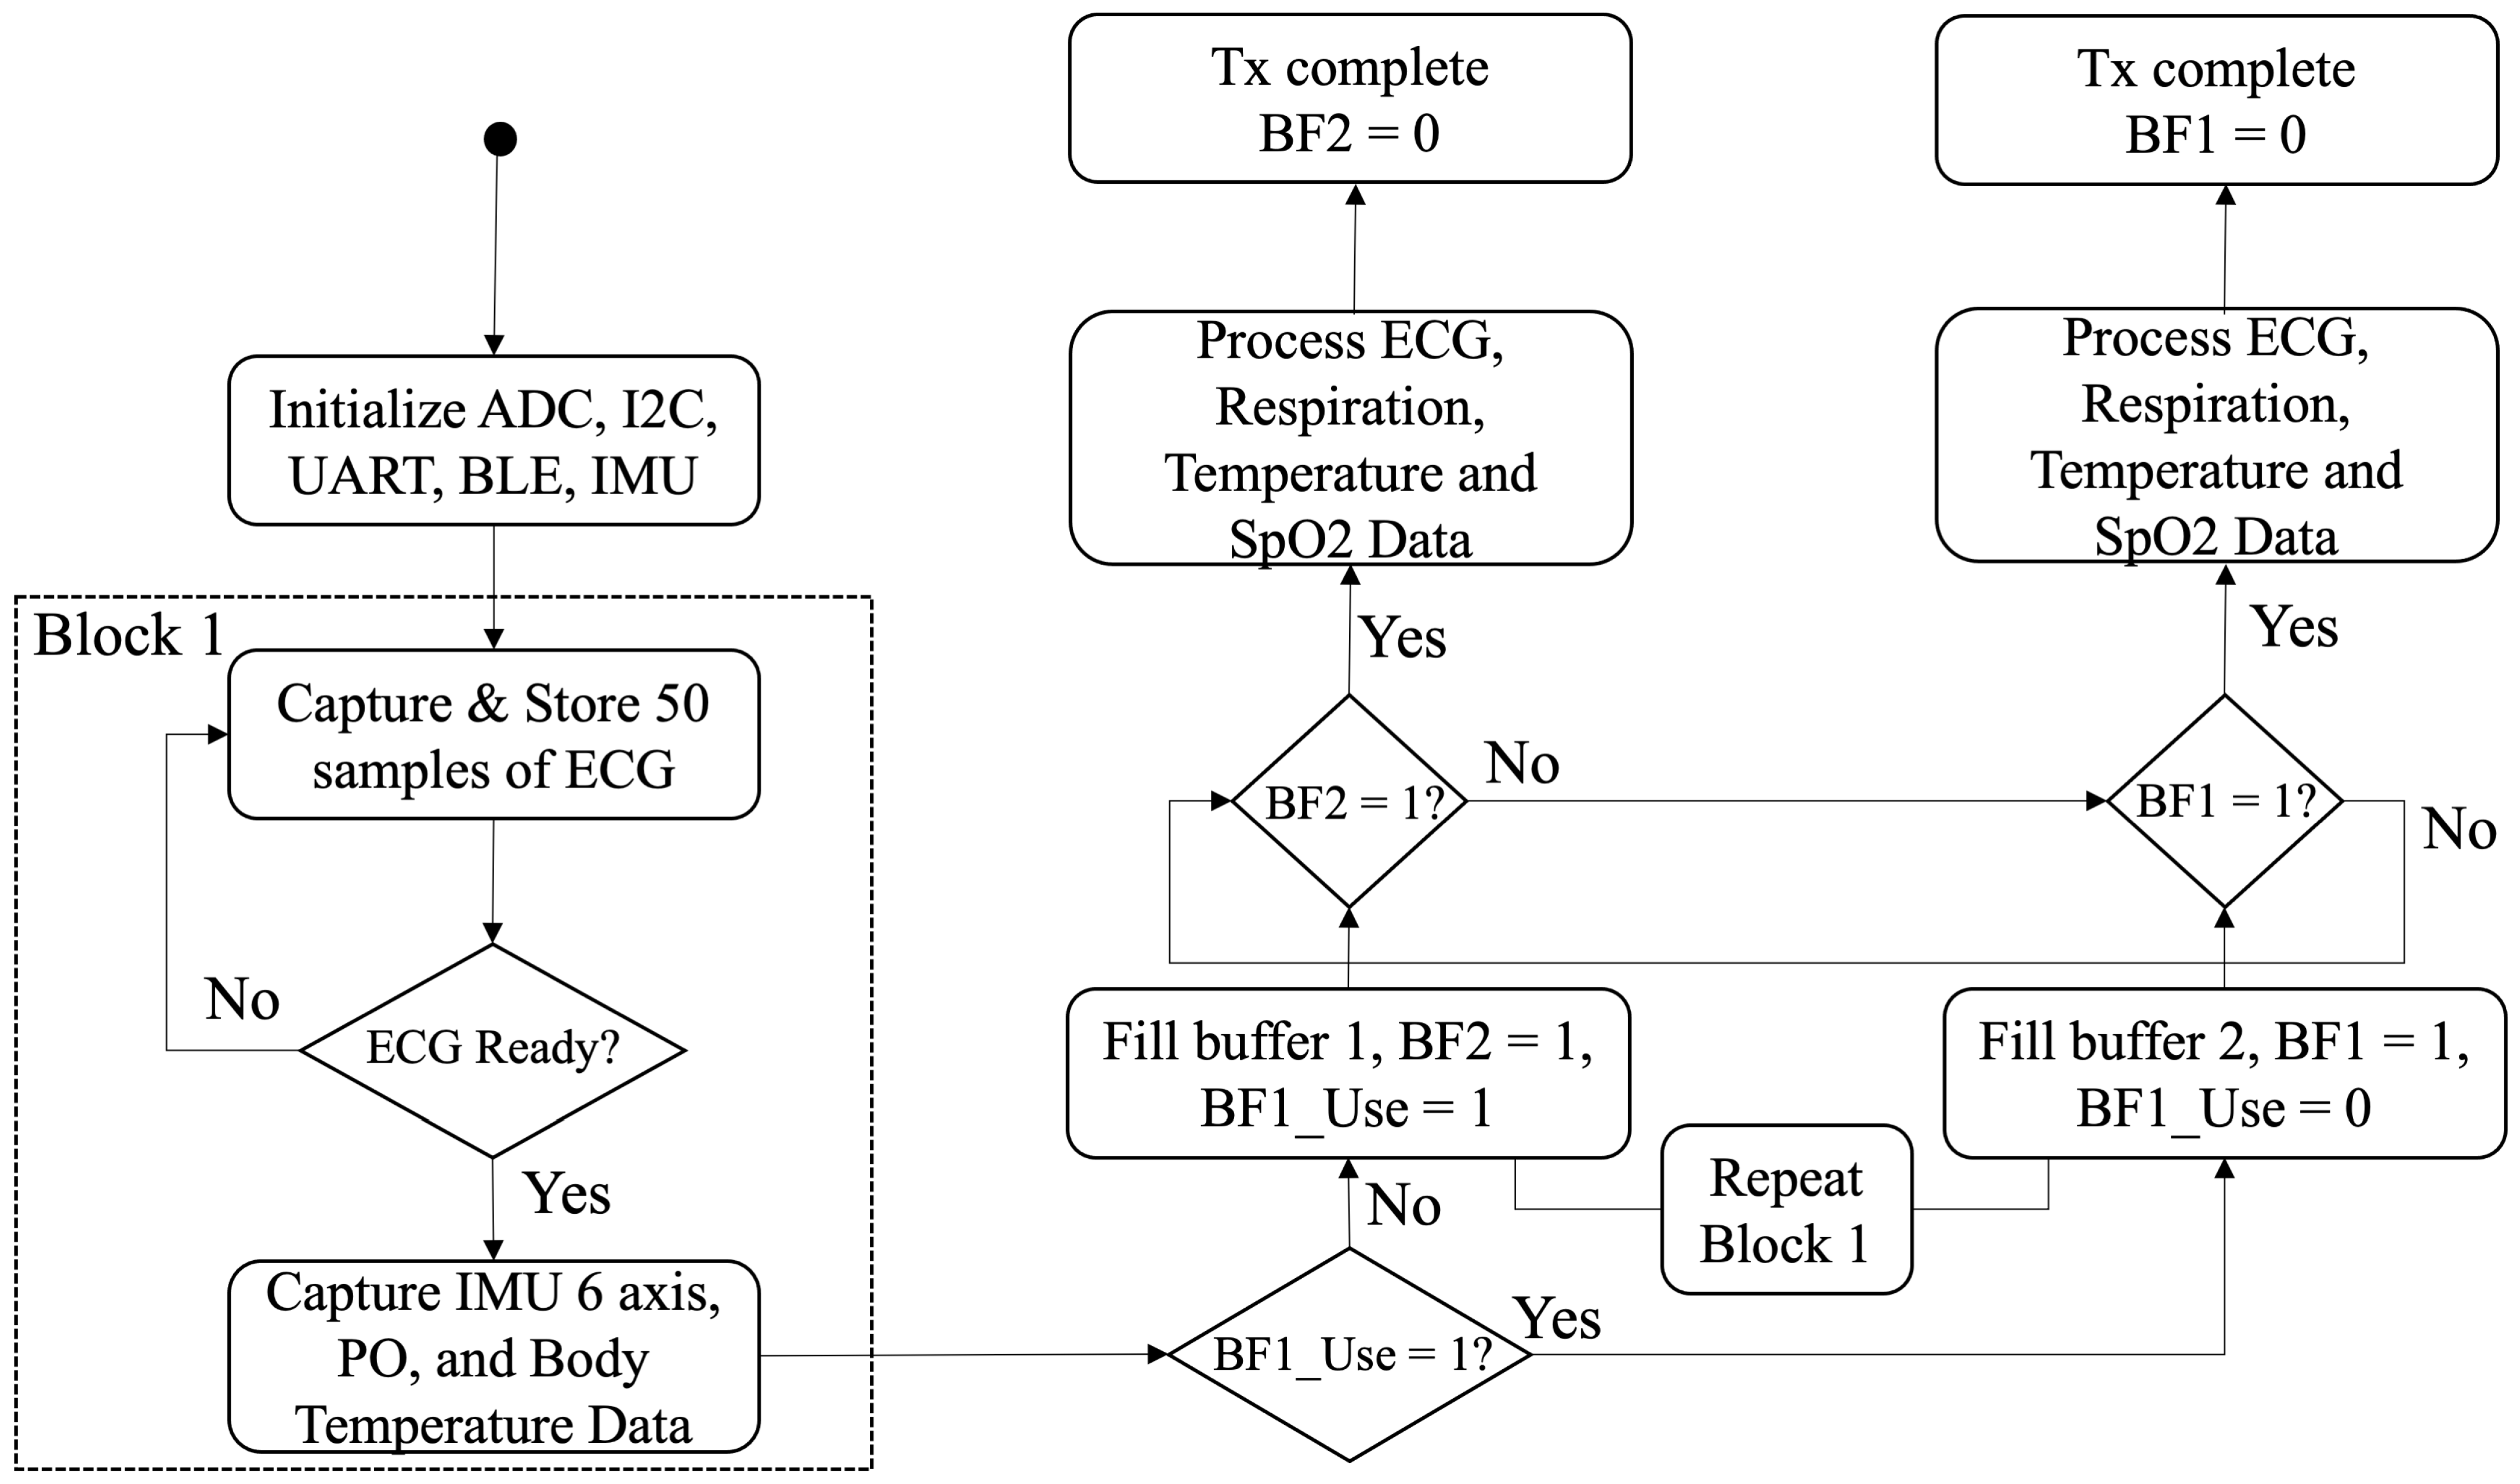
The firmware is designed to process ECG, breathing, SpO2, and temperature data simultaneously. The firmware is programmed into the 32-bit ARM® Cortex BLE SoC. Figure 5 presents the overall firmware processing. ECG data are sampled at 1 kHz and processed by the ADC unit. A timer interrupt is used to sample ECG data at every 1 ms. After every 50 ECG samples (corresponding to 50 ms), an event is generated from the ADC to indicate that the ECG buffer is full and ready to store in the mutex buffers. After every 50 ECG samples are stored in the buffer, IMU, PO, and temperature sensors communicate through I2C protocol and provide corresponding data. During each of the 50 ms intervals, 1 sample of each 6-axis IMU, PO, and temperature data are stored in the mutex buffer, which makes the corresponding sampling interval 20 Hz. Block 1 of Figure 5 repeats every 50 ms and stores the data in available mutex buffers. The ECG samples from ADC and all I2C sensor samples are saved in the memory using the direct memory access (DMA) technique for fast and efficient operation.
Two mutex buffers are implemented, where each of them stores and processes 10 s of ECG, breathing signal, red, and IR LED data, and temperature data correspondingly. The two buffers, BF1 and BF2, continuously check the flags. If BF1 is full, it is sent for signal processing and BLE transmission (Tx), and BF2 is used to fill up the new data. The process repeats in turn. Once the BLE Tx is complete, the corresponding buffer becomes empty and ready to store new data. Each of the mutex buffers holds 23,600 bytes of sensor data. The size of the firmware application is ∼47 KB. The amount of data stored in the mutex buffers can be expressed by the following equation:
Buffersize ( Bytes ) = ECG bytes + IMU bytes + PO bytes + Temp bytes
where ECGbytes, IMUbytes, PObytes, and Tempbytes are 20,000, 2400, 800, and 400 bytes, respectively. The signal processing is initiated once the buffer is full with 10 s of data. Corresponding signal processing blocks are discussed in the following.

3.2.1. ECG Signal Processing

Once the ECG data are collected from the AFE, a timer interrupt is used to sample the raw data at a 1 kHz rate. After every 50 ECG samples, an ADC event is generated, and data are saved in the ECG buffer. The ADC processing uses a direct memory access (DMA) technique so that the data transfer is efficient. The mutex buffers keep storing, until they store 10,000 ECG samples. Once 10 s of data is available, the raw ECG signal is processed on-device to extract ECG morphological features. Figure 6 shows processing steps for the raw ECG signal. The processing starts with a smoothing filter of a 21 window size. The smoothed signal goes through a first-order derivative filter. The signal is squared and further processed with a moving window integrator of 21 windows. From the integrated signal, the R peak indexes are calculated. Consequently, P and T peaks are detected, and corresponding signal-specific features are calculated. The process can return HR, R, P, T amplitudes, and R-R intervals.

3.2.2. IMU Processing

The custom PCB incorporates an IMU unit that captures the linear and angular motion. Figure 7a shows the placement of the IMU on the thorax–abdomen. The figure indicates the accelerometer and gyroscope movement and rotation with respect to the abdominal wall. The accelerometer Z axis, az, is perpendicular to the abdominal wall and significantly captures the respiratory movement compared to other axes. During continuous breathing, inhale and exhale, the movement of the abdominal wall is captured by the 6-axis IMU.
Figure 7b shows the respiration signal processing stages. Raw 3-axis accelerometer and 3-axis gyroscope are ax, ay, az, gx, gy, and gz, respectively. These raw data are processed by a second-order infinite impulse response (IIR) bandpass filter with a cutoff frequency of 0.2 to 0.6 Hz. The filtered signal is further processed to calculate the quaternion values. The quaternions are 4D geometric objects to represent a 3D space. The quaternions are more numerically stable estimates. They provide smooth and continuous orientation of the body [64]. From quaternions, roll, pitch, and yaw are estimated. Corrected ax, ay, and az are calculated from the angular rotation matrix. The accelerometer data are then passed through a smoothing filter of 21 windows. The respiratory peak is detected from the smoothed az signal, and the corresponding RR is calculated in breaths per minute (BrPMs).
A zero-phase IIR band-pass filtering is implemented by cascading second-order Butterworth high-pass and low-pass biquads respectively and using a forward–reverse approach. The direct form I biquad IIR filter is given by the following equation:
y [ n ] = a 0 x [ n ] + a 1 x [ n 1 ] + a 2 x [ n 2 ] b 1 y [ n 1 ] b 2 y [ n 2 ]
where y[n] is the filter output, and x[n] is the input sample. a0, a1, and a2 are feed forward coefficients. b1 and b2 are feedback coefficients. Traditional IIR filters are prone to phase distortion. To minimize the effect of phase distortion, a zero-phase approach is utilized by applying forward-reverse filtering. The forward-reverse filtering follows the following equations:
v [ n ] = DF 1 x [ n ]
w [ n ] = DF 1 v [ N 1 n ]
z [ n ] = w [ N 1 n ]
where v[n] denotes the forward filtered signal, w[n] represents the backward filtered signal, and z[n] is the output of the zero-phase filtering phase. N is the number of samples, which is equal to 200 for each of the six IMU axes. DF1() represents one pass of a direct form I biquad filter.
Butterworth high-pass and low-pass filter coefficients are calculated separately from the sampling rate and cutoff frequencies. For high-pass, the filter coefficients are calculated as follows:
a 0 = 1 D , a 1 = 2 D , a 2 = 1 D , b 1 = 2 ( c 2 1 ) D , b 2 = 1 2 c + c 2 D
where c and D are frequency pre-wrapping terms. The c and D are calculated from the cutoff frequency (fc = 0.2 Hz) and sampling frequency (fc = 20 Hz) by the following equation:
c = tan π f c f s , D = 1 + 2 c + c 2
Similarly, for low-pass, the cutoff frequency is set to fc = 0.6 Hz. The filter coefficients are calculated from frequency wrapping terms K and Q, given by the following equations:
a 0 = K 2 Q , a 1 = 2 K 2 Q , a 2 = K 2 Q , b 1 = 2 ( K 2 1 ) Q , b 2 = 1 2 K + K 2 Q
K = tan π f c f s , Q = 1 + 2 K + K 2
The raw IMU signals are cascaded by a zero-phase high-pass filter followed by a zero-phase low-pass filter. The following equation defines the cascading process:
y [ n ] = LPF HPF ( x [ n ] )
Proper orientation tracking is estimated from quaternion vectors. A quaternion-based sensor fusion method is used to estimate orientation from gyroscope and accelerometer data. The quaternion-based update is given by the following equation:
q ˙ = 1 2 q 0 ω x ω y ω z
where q is the current quaternion and q ˙ is the updated quaternion. The quaternion consists of four coordinates: q 0 ˙ , q 1 ˙ , q 2 ˙ , q 3 ˙ , which are calculated by the following equations:
q ˙ 0 = 1 2 q 1 ω x q 2 ω y q 3 ω z ,
q ˙ 1 = 1 2 q 0 ω x + q 2 ω z q 3 ω y ,
q ˙ 2 = 1 2 q 0 ω y q 1 ω z + q 3 ω x ,
q ˙ 3 = 1 2 q 0 ω z + q 1 ω y q 2 ω x
The gradient of the cost function is calculated by vector s. This calculates the difference between the expected gravity direction from the quaternion and the measured acceleration data. The following equation gives the definition of vector s:
s = s 0 s 1 s 2 s 3
s 0 = 2 q 0 q 2 q 3 q 1 a x ,
s 1 = 2 q 0 q 3 + q 1 q 2 a y ,
s 2 = 2 1 2 q 1 2 q 2 2 a z ,
s 3 = 0
A small gain constant, β (0.2), is applied over the vector s to get the updated quaternion derivative, q ˙ i . This controls how much the correction from the accelerometer influences the update. The following equation defines the quaternion derivative update:
q ˙ i q ˙ i β s i , i = 0 , 1 , 2 , 3 .
A Euler integrator is then applied to the derivative over a time step T and normalized over the unit length. The step prevents error accumulation due to numerical integration. The steps are given by the following equations:
q i [ n + 1 ] = q i [ n ] + q ˙ i T ,
q q q .
From the updated quaternion coordinates, the raw, pitch, and yaw values are calculated. The corresponding equations are given as follows:
ϕ = atan2 2 ( q 0 q 1 + q 2 q 3 ) , 1 2 ( q 1 2 + q 2 2 ) ,
θ = arcsin 2 ( q 0 q 2 q 3 q 1 ) ,
ψ = atan2 2 ( q 0 q 3 + q 1 q 2 ) , 1 2 ( q 2 2 + q 3 2 )
where ϕ , θ , and ψ represent the raw, pitch, and yaw, respectively. The 3-axis accelerometer data are then corrected by subtracting the gravitational component. This provides clean data that is more suitable for respiration monitoring. The following equations provide the definition of the accelerometer axis correction:
a x , corr = a x g sin θ ,
a y , corr = a y g sin ϕ cos θ ,
a z , corr = a z g cos ϕ cos θ
Finally, a smoothing filter with a window size of 21 is applied over the corrected accelerometer data before respiratory peak detection. The following equation defines the smoothing process:
x ˜ [ n ] = 1 21 k = n 10 n + 10 x [ k ]
where x [ k ] and x ˜ [ n ] are the input signal at sample k and the smoothed output at sample n, respectively. As the quaternion approach represents rotation as a unified 4D vector, it allows smooth and consistent interpolation between orientations without distortion. This benefits the quaternion method to maintain an accurate estimation of respiratory signals in dynamic conditions.

3.2.3. PO Processing

The PO sensor is attached to the ear lobe and provides red and IR LED data. The data are sampled at a 20 Hz rate. Figure 8 refers to the overall PO processing steps. To extract the SpO2, at first, a DC removal filter is applied on the raw LED data, given by the following equations:
w [ n ] = x [ n ] + α w [ n 1 ]
DCremoved [ n ] = w [ n ] w [ n 1 ]
where x[n] is the input sample and w[n] is the running sum variable. Leakage factor α is set to 0.90. DCremoved[n] is calculated from w[n] states. The process goes through recursive accumulation and subtraction and acts like a leaky integrator filter. This design removes DC offsets and slow-moving signals or drifts from the signals.
A mean difference filter immediately follows to track how much a sample deviates from the recent local average. This is useful in detecting slow trends in the signal and benefits from adaptive baseline tracking. The following equation defines the mean difference filtering stages:
sum [ n ] = sum [ n 1 ] v [ n N ] + M [ n ] ,
avg [ n ] = sum [ n ] min ( n , N ) ,
MD [ n ] = avg [ n ] M [ n ]
where M[n] is the input to the mean difference filter, v[i] is the circular buffer of the past N samples, and MD[n] is the output of the mean difference filtering. A second-order IIR LPF is applied with a cutoff frequency, fc, equal to 5 Hz. The following equations give the filter definitions where x[n] is the current sample, v0 [n] and v1 [n] are immediate filter states, and y[n] is the filter output:
v 0 [ n ] = v 1 [ n 1 ] ,
v 1 [ n ] = Bx [ n ] + A v 0 [ n ] ,
y [ n ] = v 0 [ n ] + v 1 [ n ]
A and B are filter coefficients with the following constants:
B = 2.4523727525 × 10 1 , A = 0.5095254495
Corresponding root mean square (RMS) values are calculated for IR and red LEDs. A ratio, R, is calculated from the logarithm of base e of the RMS values. The following equations provide the process of R calculation:
RMS IR = 1 W k = 0 W 1 y IR [ k ] 2 ,
RMS RED = 1 W k = 0 W 1 y RED [ k ] 2 ,
IR = ln RMS IR ,
RED = ln RMS RED ,
R = RED × 650 IR × 950
where RMSIR, RMSRED are the RMS values, respectively. Ratio, R, is calculated from l IR and l RED , which are logarithms of base e of corresponding RMS signals. y IR , y RED are the low-pass outputs over one window. The value of R is used to calculate the SpO2 level from the following equation:
SpO 2 = 45.060 R 2 + 30.354 R + 94.845

3.2.4. BLE Transmission

The BLE data Tx starts once the buffer is filled and all signal processing is done. Every 10 s, 62 different BLE packets are sent to the mobile application. Table 1 provides a detailed description of the packet organization and size for the firmware. A BLE GATT Nordic UART service (NUS) is used to transmit the raw and processed data to the mobile application. The BLE advertising period is set to 3 min. After 3 min of an inactive period, the device goes to sleep to save power consumption. Otherwise, the device keeps transmitting data continuously until any interruption in power or from the user. To make the BLE Tx/Rx more robust, both data speeds of 1 Mbps and 2 Mbps are enabled from the device. The custom peripheral can automatically connect to any accepted BLE central devices up to a speed of 2 Mbps. The device implements a low-power and balanced connection interval of 50 ms for data Tx/Rx. The maximum transmission unit (MTU) is set to 403 bytes to enable data transmission for 400 bytes of BLE packets. To ensure that the BLE Tx is not overflowing the BLE Tx queue, the Tx queue size is increased to 75 units to avoid any packet loss.

4. Experimental Protocols and Validation

Experimental data are taken from 10 healthy subjects. The subjects are 5 males and 5 females with ages ranging from 24 to 35. For each subject, Test 1 and Test 2 are carried out. A reference commercial device, Go Direct® (Vernier Software & Technology, Beaverton, OR, USA) respiration monitoring belt is used to validate the performance of the proposed system during Test 1 and Test 2. The commercial device provides respiration data through its commercial mobile application Graphical Analysis® v6.0.0 (Vernier Software & Technology, Beaverton, OR, USA). For ECG, the Kardia® (AliveCor Inc., Mountain View, CA, USA) device is used to validate the cardiac monitoring. Table 2 gives an overview of each of the tests. Test 3 is set up in an indoor and outdoor environment for ambulatory monitoring. A brief description of each test is given as follows.

4.1. Test 1

Test 1 is performed under stationary conditions in sitting and standing postures. Both sitting and standing postures have similar four phases. In phase 1, the subject breaths at a 30 BrPM rate for 1 min. Then it is followed by 24, 20, and 12 BrPM for 1.25, 1.5, and 1.25 min, respectively. To ensure a proper breathing rate, a PowerPoint slide with continuous inhale and exhale periods is maintained. The commercial reference devices are placed accordingly at the same time to capture cardiac and breathing movement. The total time duration for test 1 is 5 min for each subject.

4.2. Test 2

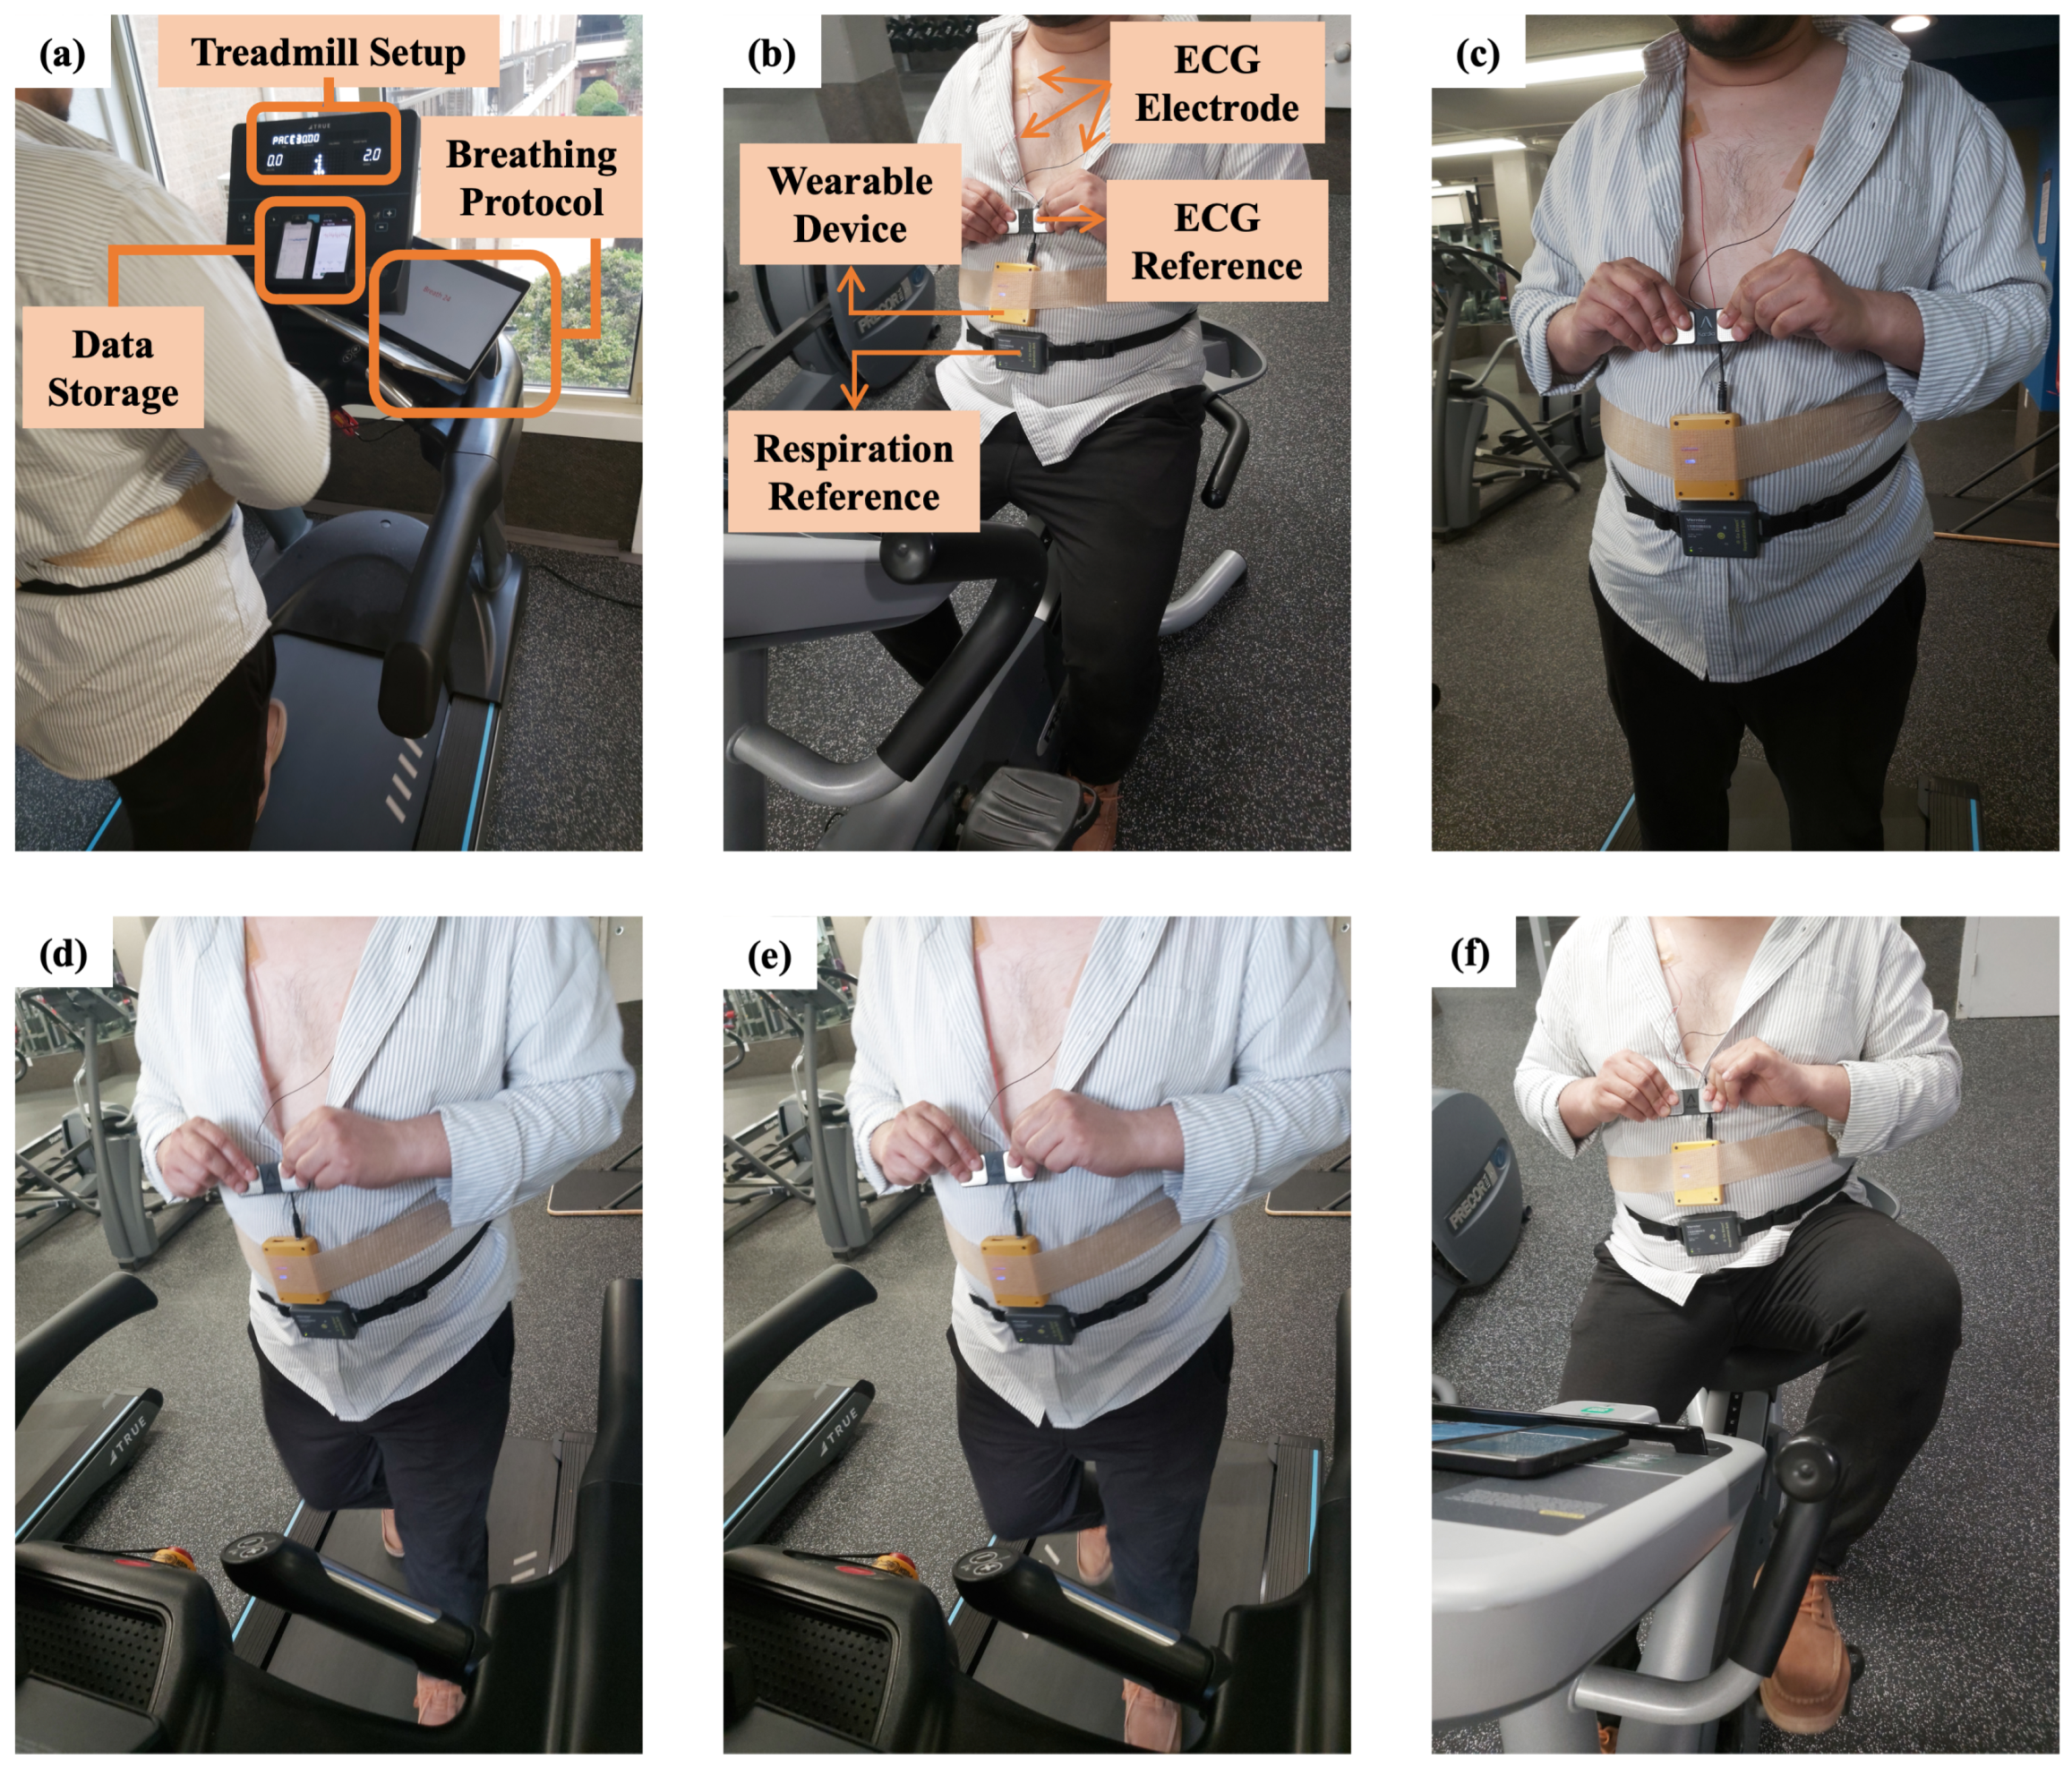
Test 2 is performed on dynamic conditions. During Test 2, participants are instructed to walk at 2 mph, run between 3 and 3.5 mph, and cycle at speeds ranging from 6 to 8 mph. All three dynamic postures are performed indoors on a treadmill. To ensure better reliability of the validation process, a fixed RR of 20 BrPM is encouraged on the subject during dynamic testing conditions. Each of the dynamic states is validated against the reference device and lasts for 5 min for each subject. It is more challenging to maintain a controlled and constant RR during running conditions. Thus, we only encourage the participants to breathe at 20 BrPM during the running condition. Moreover, cardiac validation is performed on 5 out of 10 subjects, as holding the reference device during activities is cumbersome. Figure 9 shows the test setups for different postures. The project has Institutional Review Board (IRB) approval (Texas Tech University IRB approved IRB2020-783), and consent is taken from all subjects.

4.3. Test 3

During Test 3, the device is tested in an ambulatory setup in indoor and outdoor environments. Test 3 lasts for 20 min and is tested on 2 subjects. Test 3 begins with the subject sitting indoors, followed by indoor walking, stair stepping, outdoor sitting and walking, and concludes with a return to the starting point involving further stair climbing.

5. Results

In this section, the performance results of the proposed system are presented. Test 1 and Test 2 results are presented in comparison with the reference device. Also, Test 3 outcomes are presented with simultaneous physiological data. The wearable device performance measures are also shown in this section. Three matrices are used to quantify the respiratory monitoring: MAE, mean absolute percentage error (MAPE), and accuracy. The corresponding equations are given as follows:
MAE = 1 N i = 1 N y ¯ i y i
MAPE = 1 N i = 1 N | y ¯ i y i | y i
Accuracy = 1 MAPE · 100 %
where y ¯ i and y i are RR from the proposed and reference device, respectively.

5.1. Hardware-Level Performance

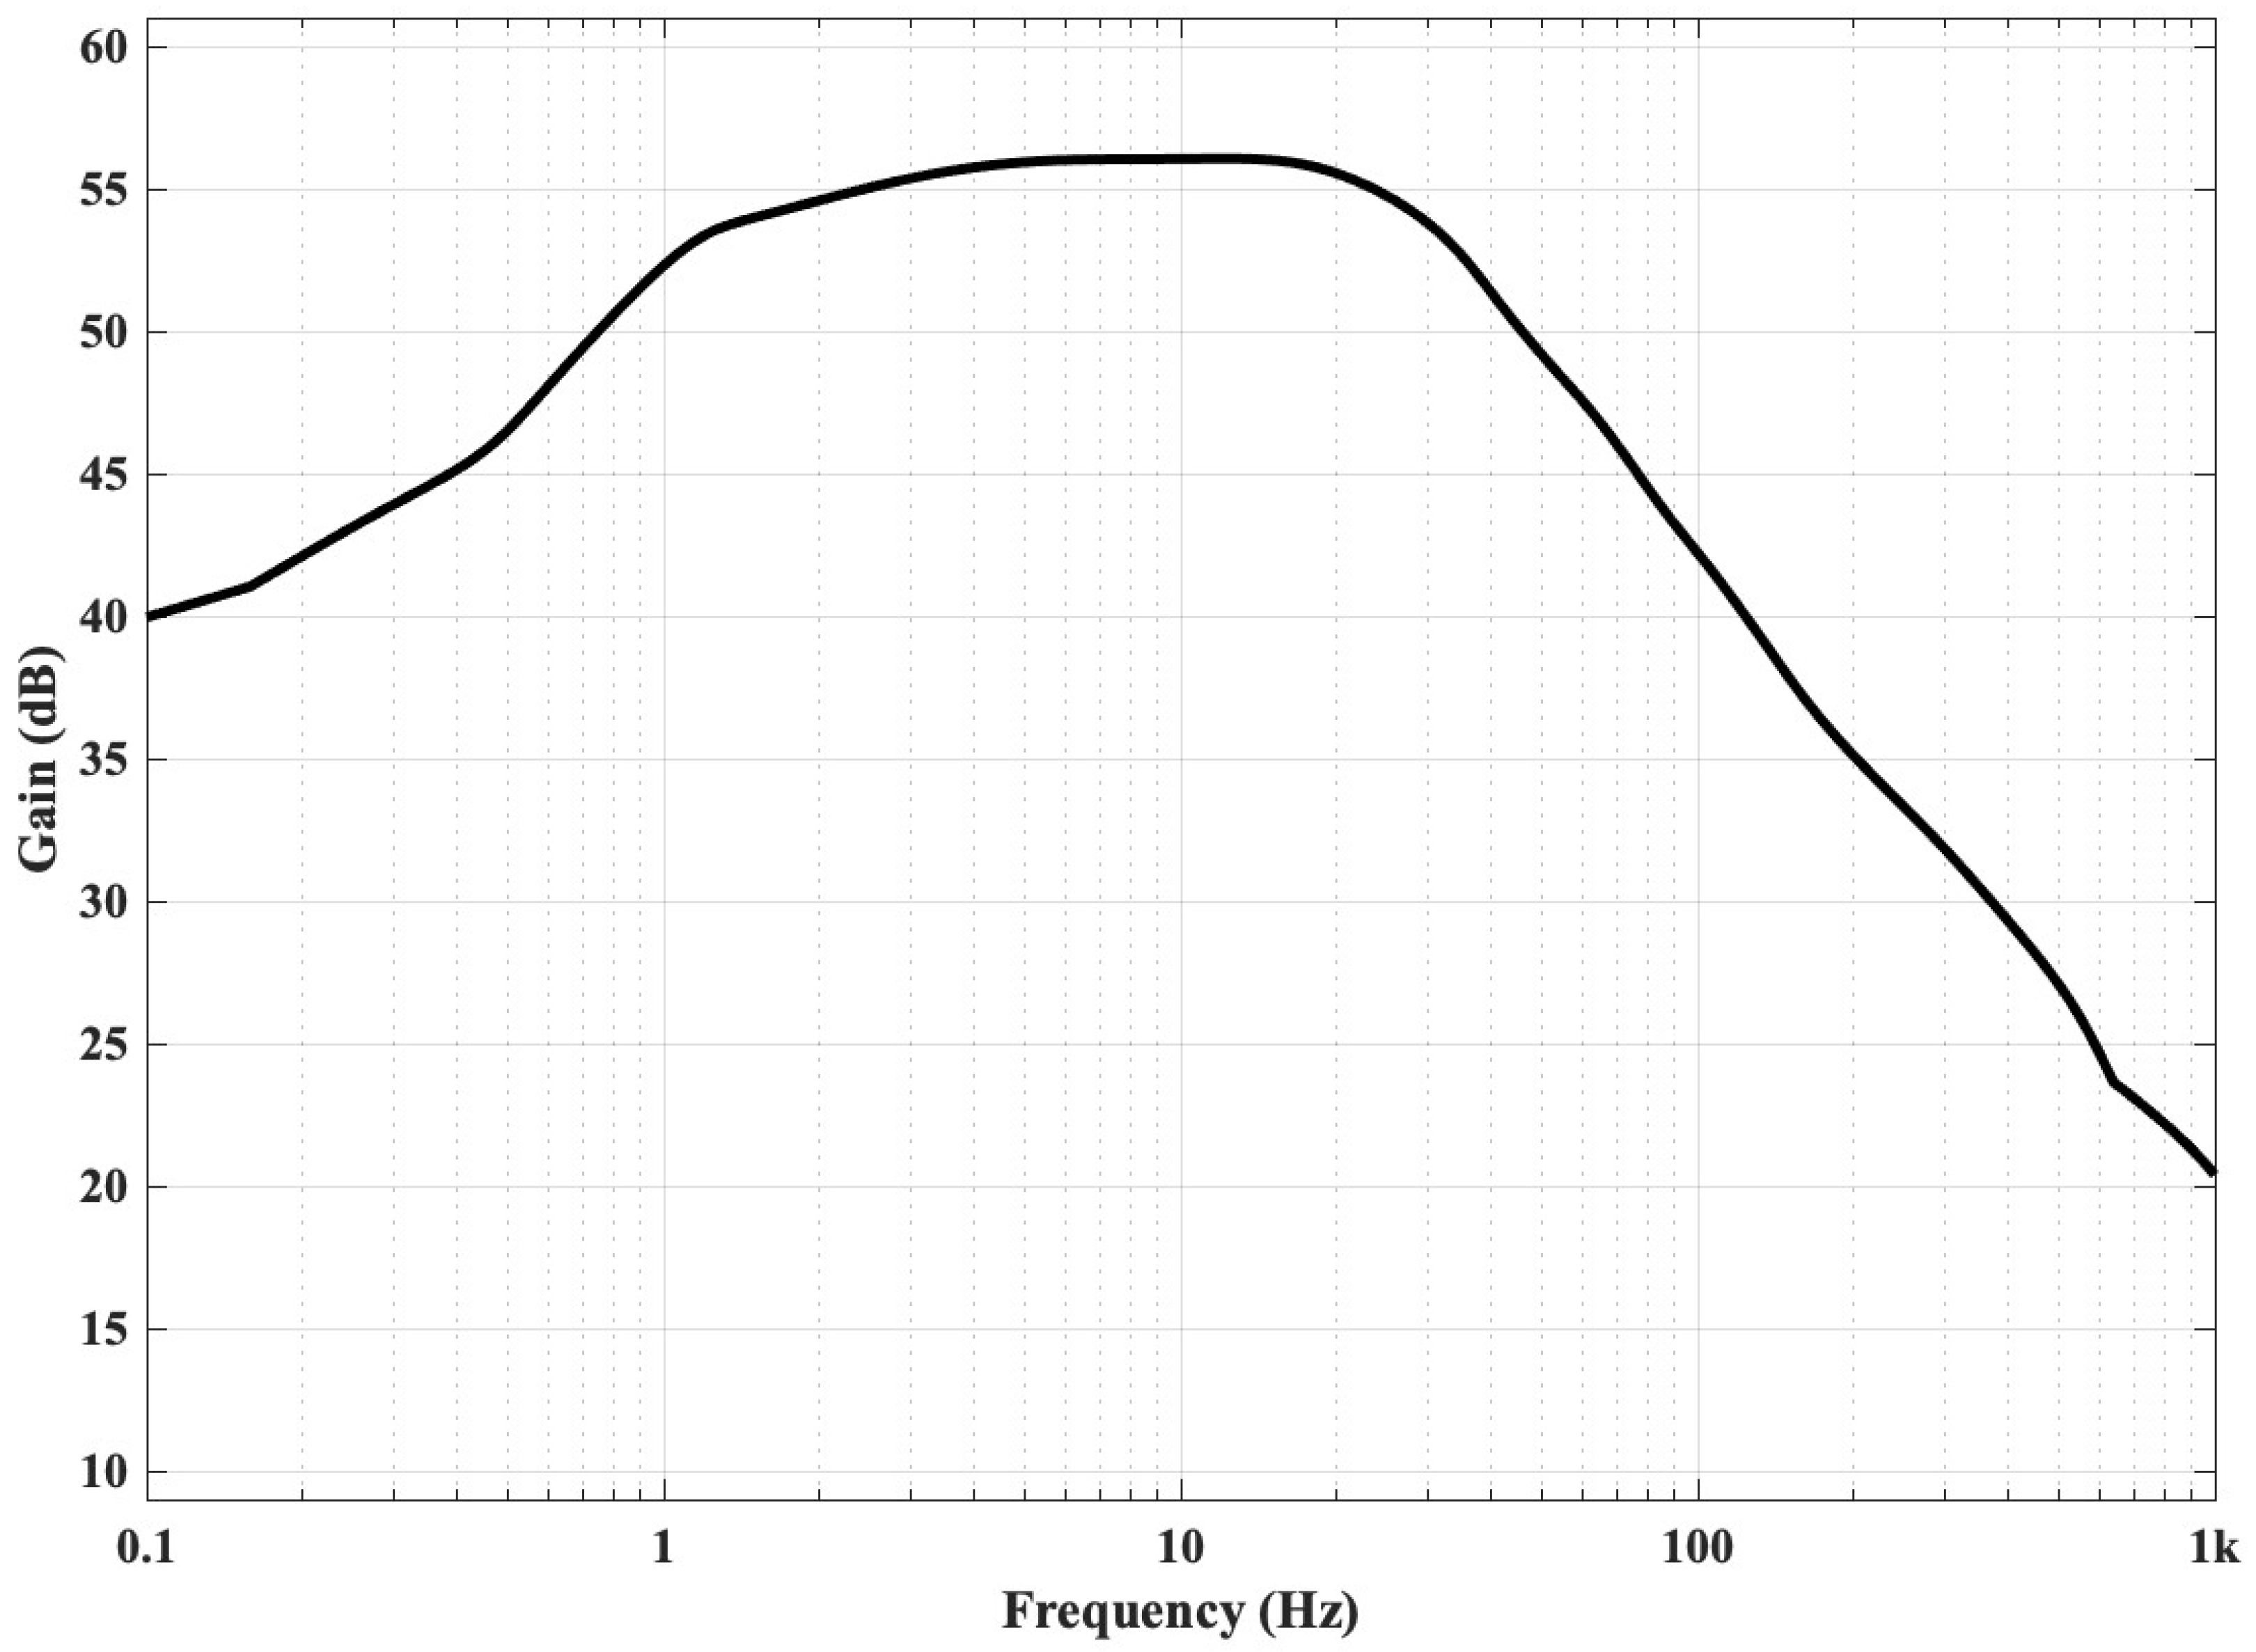
Figure 10 presents the gain response of the ECG AFE circuit. The AFE circuit is designed to have an overall gain of 1100 (V/V) or ∼60 dB. The real-time performance is measured using a signal generator and an oscilloscope (Model Rigol MS05104). The maximum gain is achieved at 56 dB. The overall gain is above 50 dB for a frequency range between 0.7 Hz and 40 Hz, following the AFE filtering range (0.5–41 Hz).
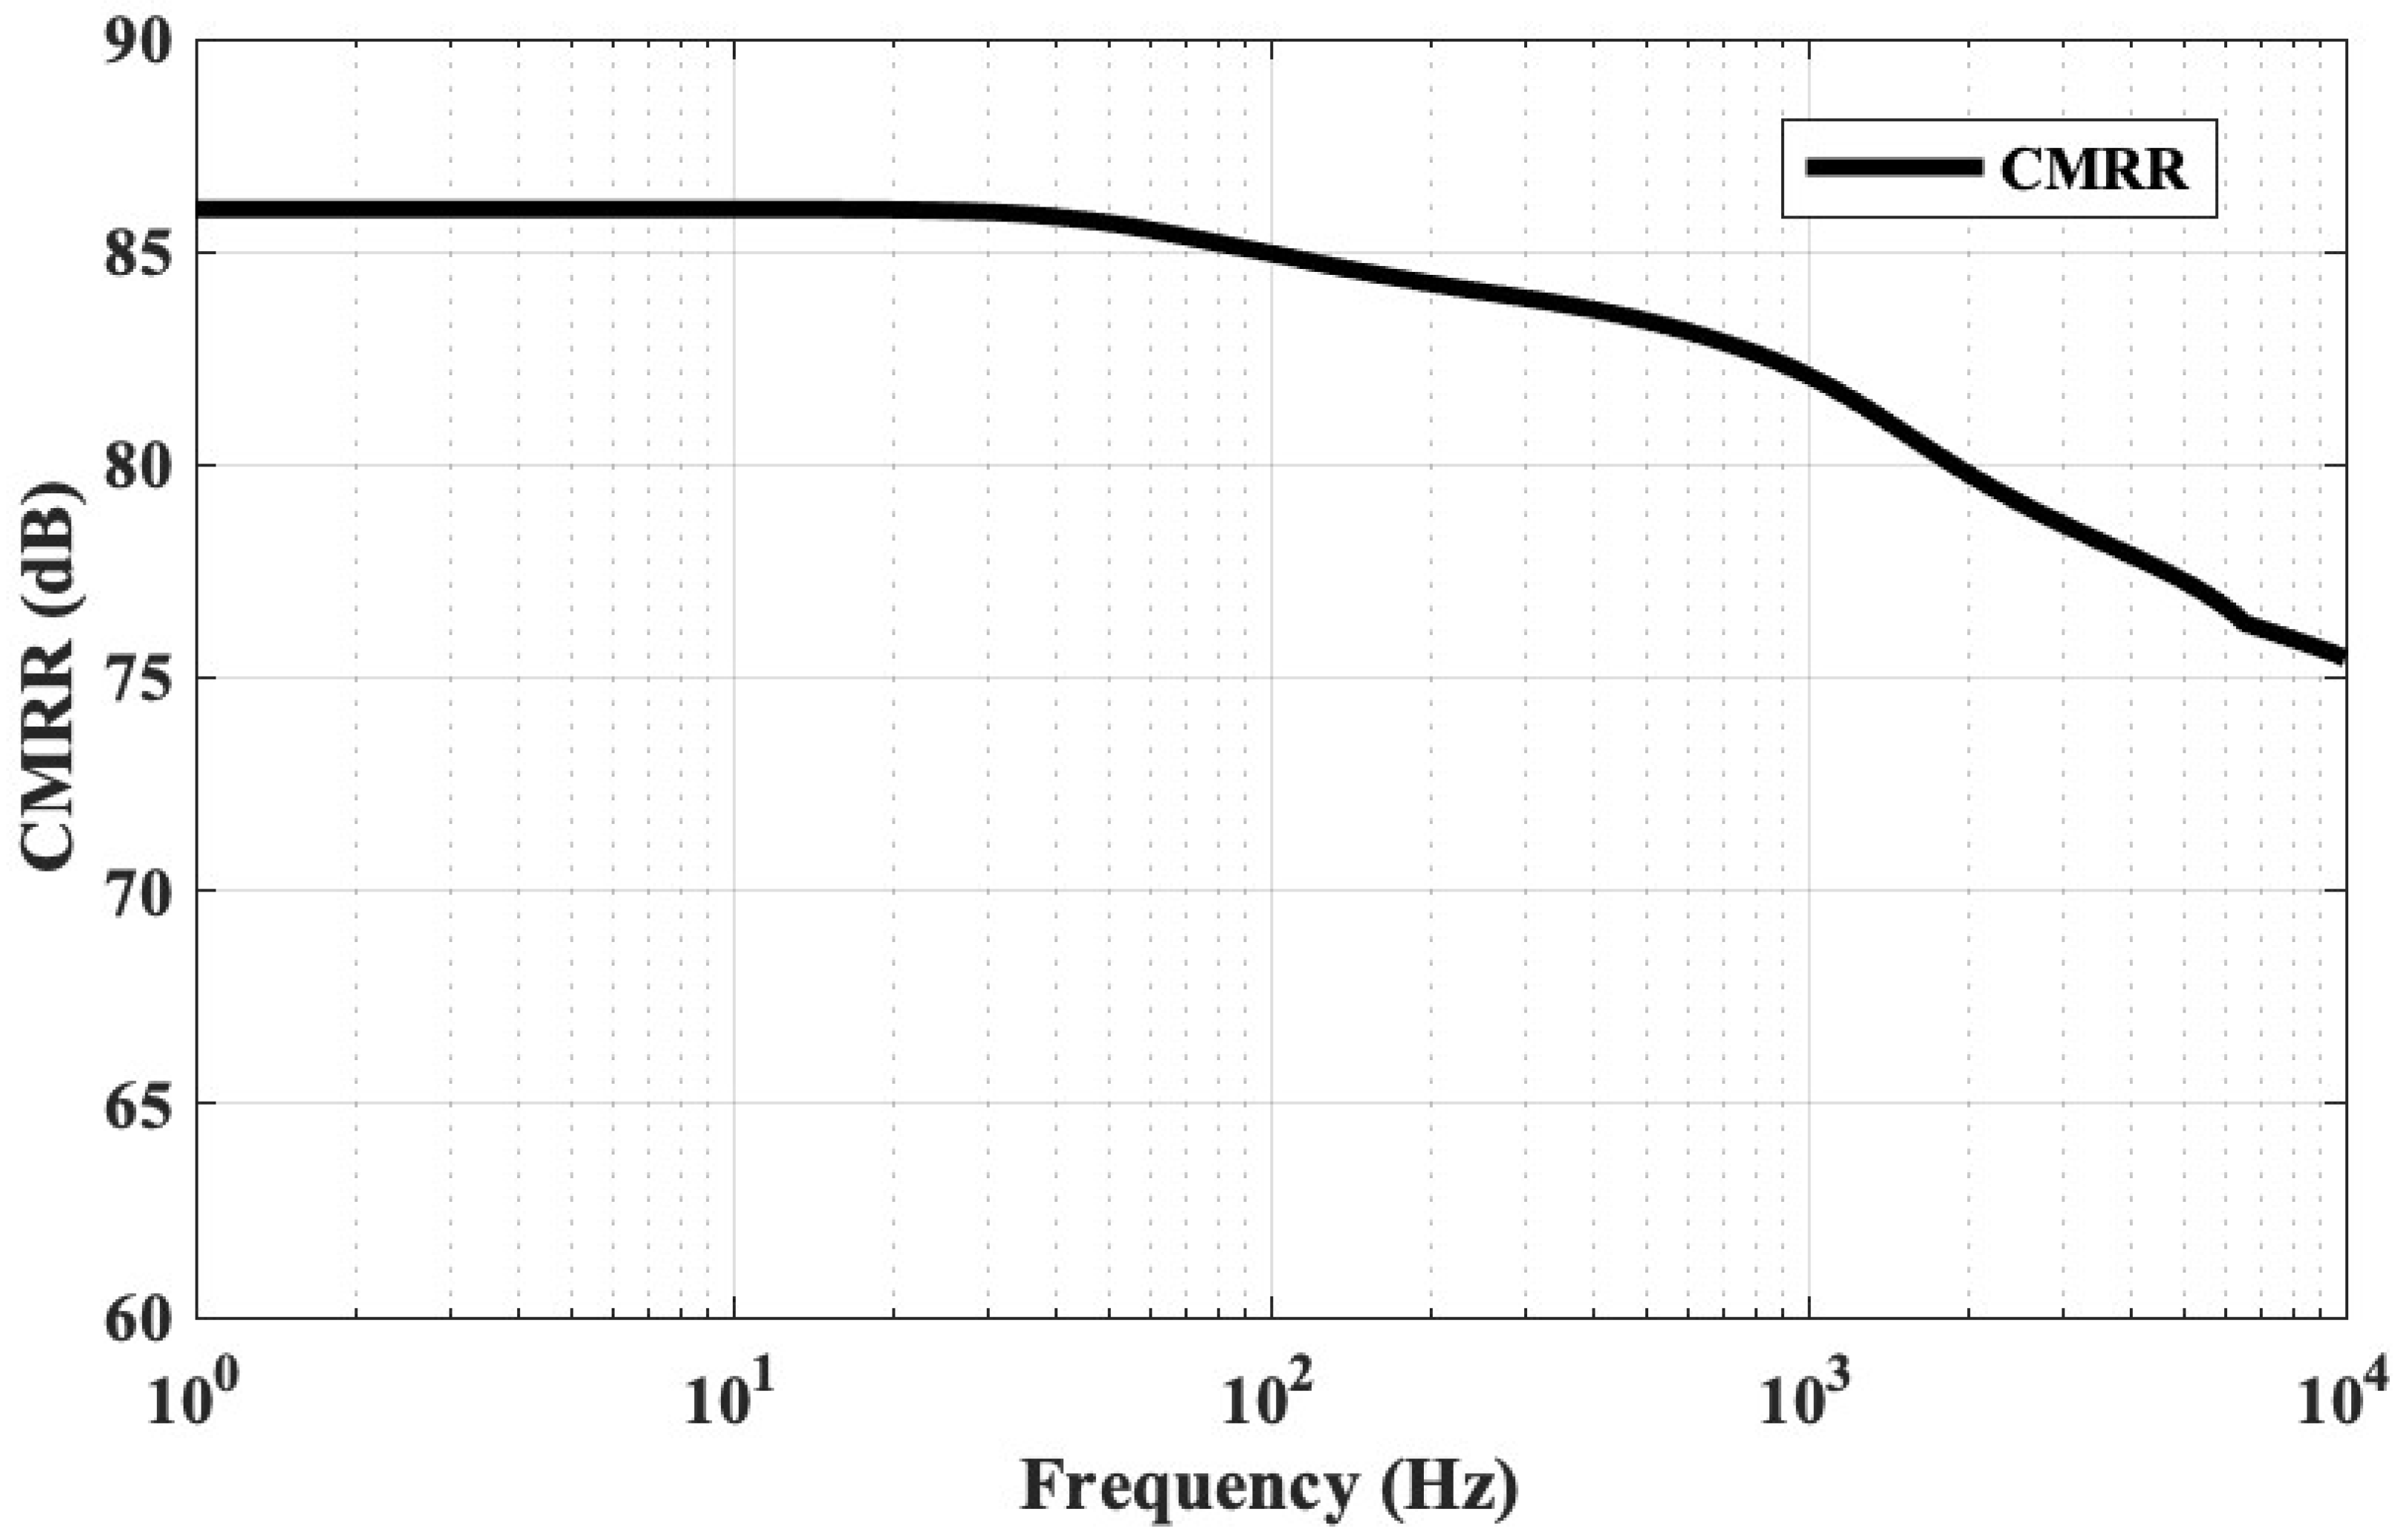
Figure 11 depicts the performance of the IA used for ECG. The design provides a considerably high common mode rejection ration (CMRR) of ∼86 dB. To calculate the CMRR, common mode and differential mode voltage is fed from the signal generator to the custom device. The corresponding output voltage is captured from the oscilloscope to estimate common mode and differential mode gain. Finally, the CMRR is calculated from the following equation:
CMRR = 20 log 10 A d A cm
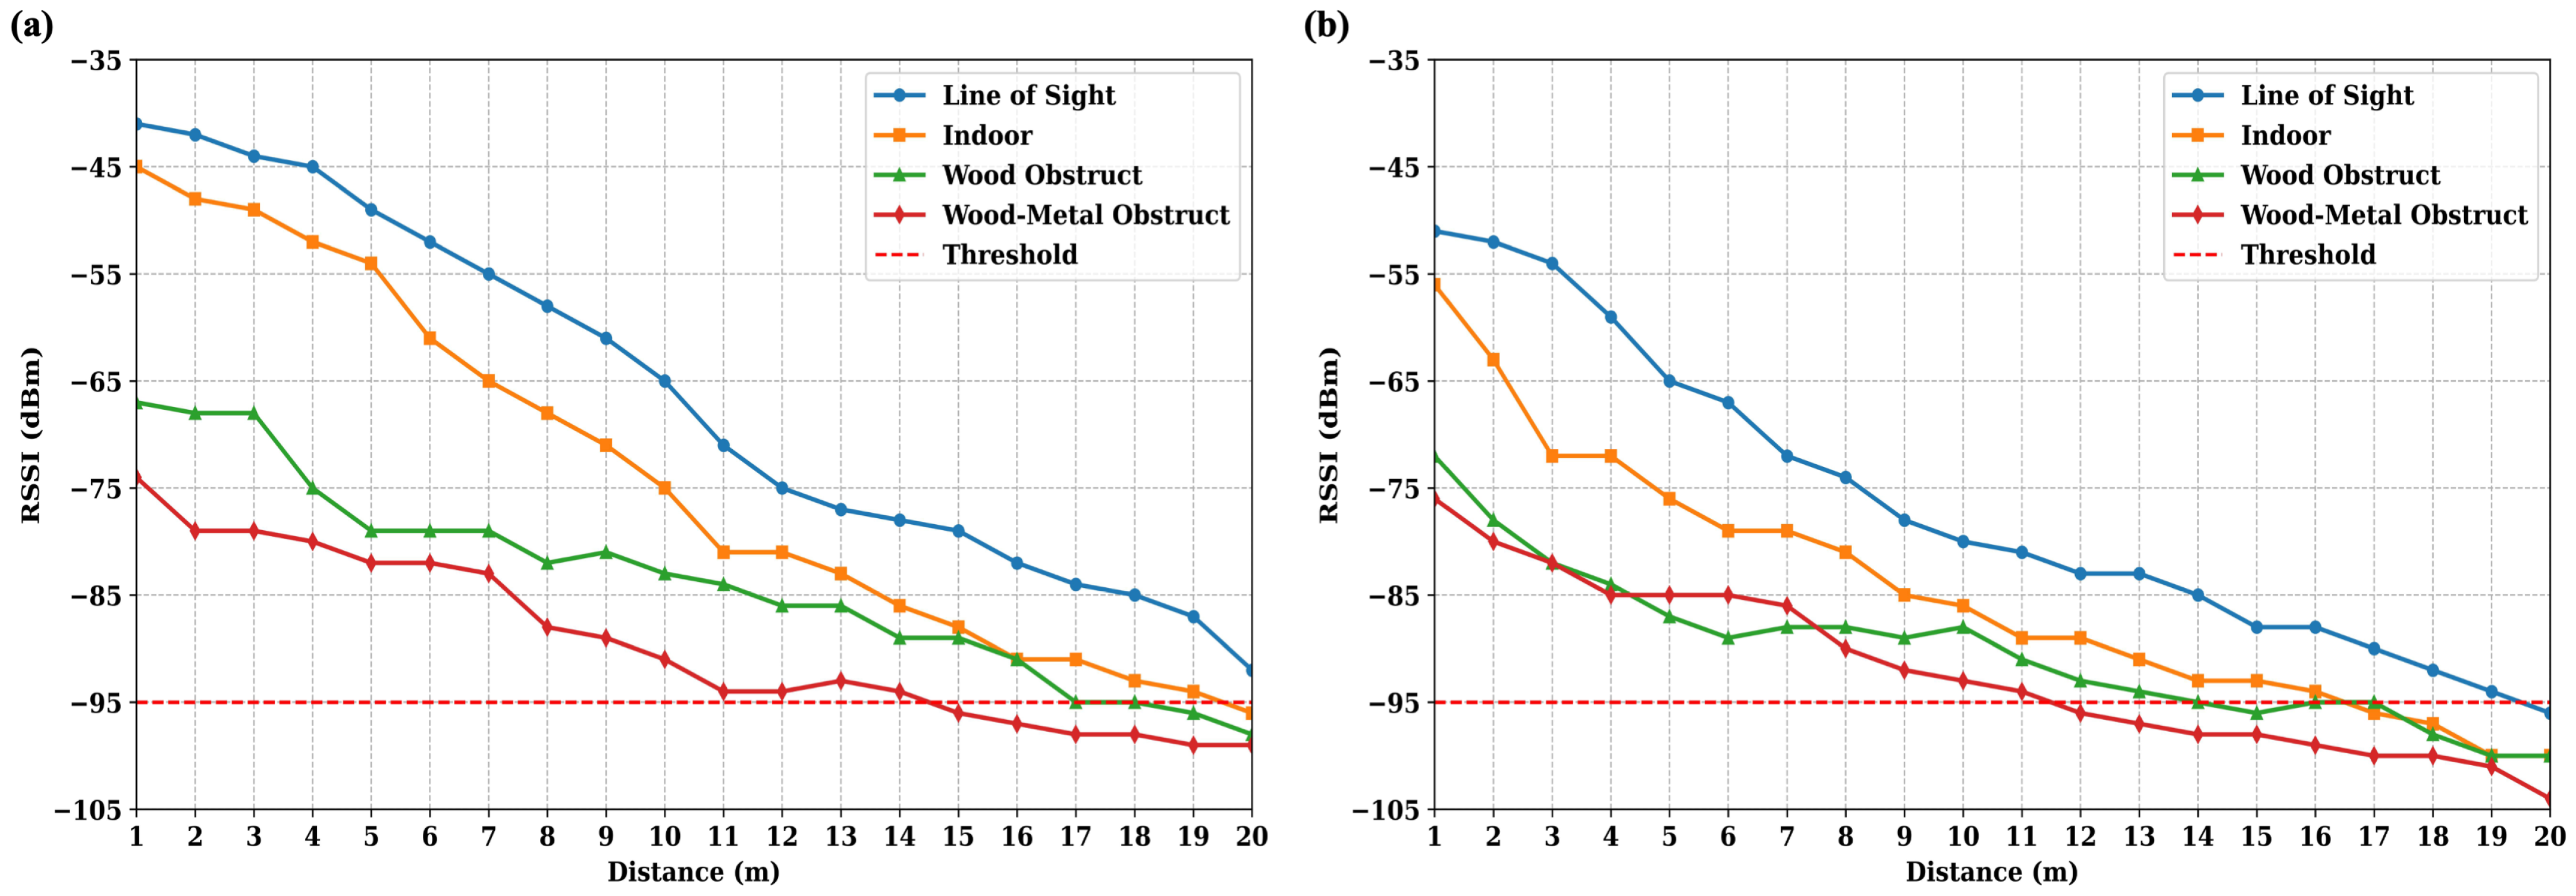
where Acm and Ad are common mode and differential mode gains, respectively. The performance of the received signal strength (RSSI) for the custom wearable is compared against 1 Mbps and 2 Mbps BLE speed. The BLE transmission range varies depending on the type of obstruction and the different data rates. Figure 12 presents the RSSI performance over a distance of up to 20 m. Four types of obstruct variation are used to check the performance. The line-of-sight (LOS) protocol has no obstruction between the device and the phone. It provides the best signal strength over a longer distance. In an indoor setup, the device is placed in a Lab environment, and the mobile phone position is varied accordingly. For wood and wood–metal obstacles, the device is placed on the other side of a wooden and wood–metal door, respectively. The wood–metal obstruct gives the weakest signal. All RSSI values are measured from the commercial nRF Connect® v2.7.14 (Nordic Semiconductor ASA, Trondheim, Norway) application. A threshold line at −95 dBm is drawn in Figure 12. Below −95 dBm, the BLE connection is found unstable, and BLE Tx is not considered reliable.
Table 3 provides the power consumption statistics for the proposed wearable. To measure the current, voltage is measured across a 1 Ω resistor connected in series with the Lipo battery. The BLE parameters are varied in terms of speed, connection interval, and sleep mode to measure the current consumption. From Table 3, it is observed that, without sleep mode, the device consumes an average of ∼16 mA current. The performance improves sharply with sleep mode while consuming only ∼7 mA current. The wearable is able to transmit at both 1 and 2 Mbps speeds. The wearable draws a similar level of average current, Iavg, for 1 Mbps and 2 Mbps speeds. The 2 Mbps scheme offers lower on-air time than 1 Mbps but draws more instantaneous current. The maximum current (Imax) during BLE transmission is slightly higher for a 2 Mbps speed. Finally, the BLE connection interval is changed from 20 ms to 50 ms duration. For lower connection intervals, such as 20 or 40 ms, the BLE tends to consume more power. The higher connection intervals require more time to complete the transmission of all subsequent BLE packets. To fit the data transmission well within a 10 s buffering period, a balanced connection interval scheme of 50 ms is chosen for the wearable. The current consumption shown in the table includes the processing of ECG, respiration, SpO2, and temperature.
Table 4 provides the processing latency for different blocks of the firmware. The ECG processing block includes the data storage, conversion, and HR processing algorithms. This block consumes a processing time of 59.3 ms for every 10 s of data. Similarly, the respiration processing block takes 1.4 ms, where processing includes the processing of 6-axis data, filtering, and RR calculation. PO processing takes 0.55 ms, which processes the red and IR LED data and calculates SpO2. The temperature processing only takes 0.02 ms. The dual mutex buffer ensures that the data processing latency is handled properly while storing real-time data.

5.2. Cardiac and Respiration Processing Performance

The processing of the ECG signal for R peak detection is shown in Figure 13. The raw ECG data is taken from the AFE. These data are already bandpass filtered within a range of 0.5 Hz to 41 Hz, followed by Figure 3. The ECG processing block further smooths the raw data from the AFE unit by a smoothing window size of 21. The smoothed data is then squared and differentiated. The differentiated data is integrated again by a window size of 21. From the integrated data, the R peak locations are calculated. The firmware processing also applies an adaptive thresholding for P and T peak detection.
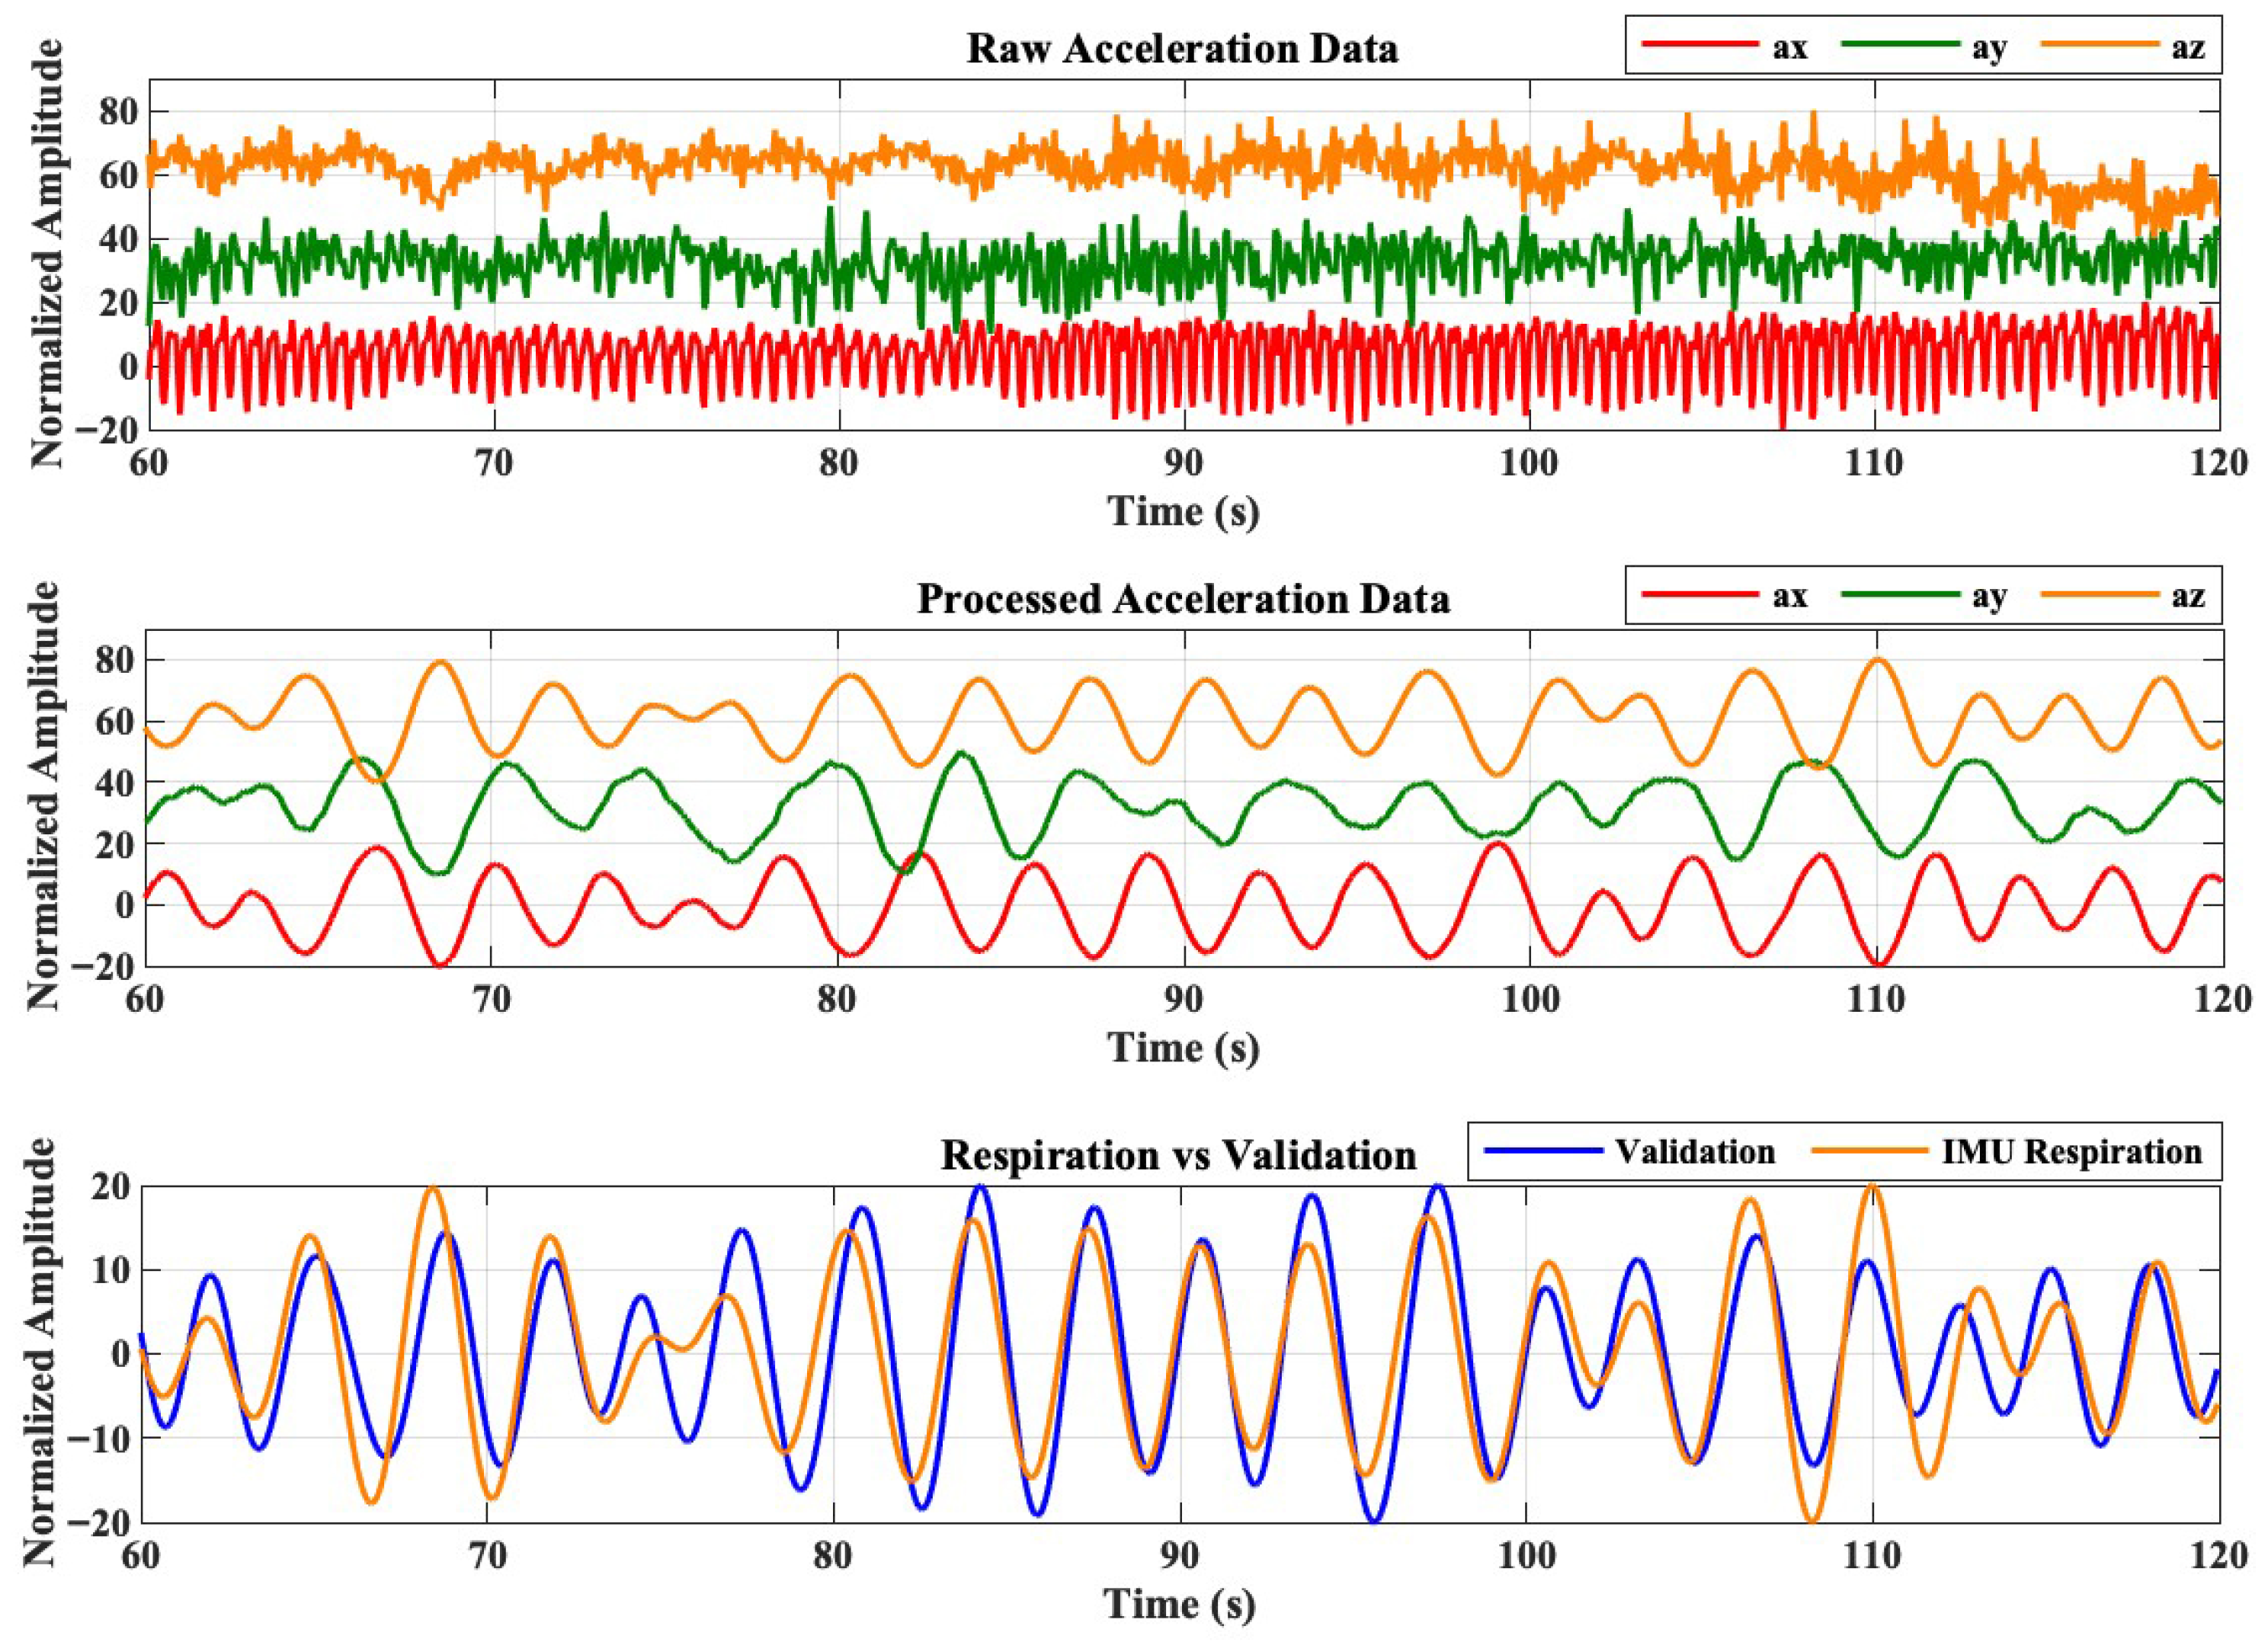
The six-axis accelerometer and gyroscope data are captured from a single IMU placed on the thorax–abdominal wall. The raw data are processed on-device in real time. Figure 14 shows the overview of the IMU processing where the raw ax, ay, az, gx, gy, and gz are processed to extract the respiratory-induced accelerometer data (Figure 14b). Signal processing steps follow the procedures mentioned in Figure 7. As the z-axis is perpendicular to the abdominal wall, it shows the most significant behavior correlated to breathing changes. The processed z-axis is taken as the respiratory waveform and compared with the reference device. Figure 14c shows that the proposed device has a good correlation with the reference device.

5.2.1. Performance in Stationary States

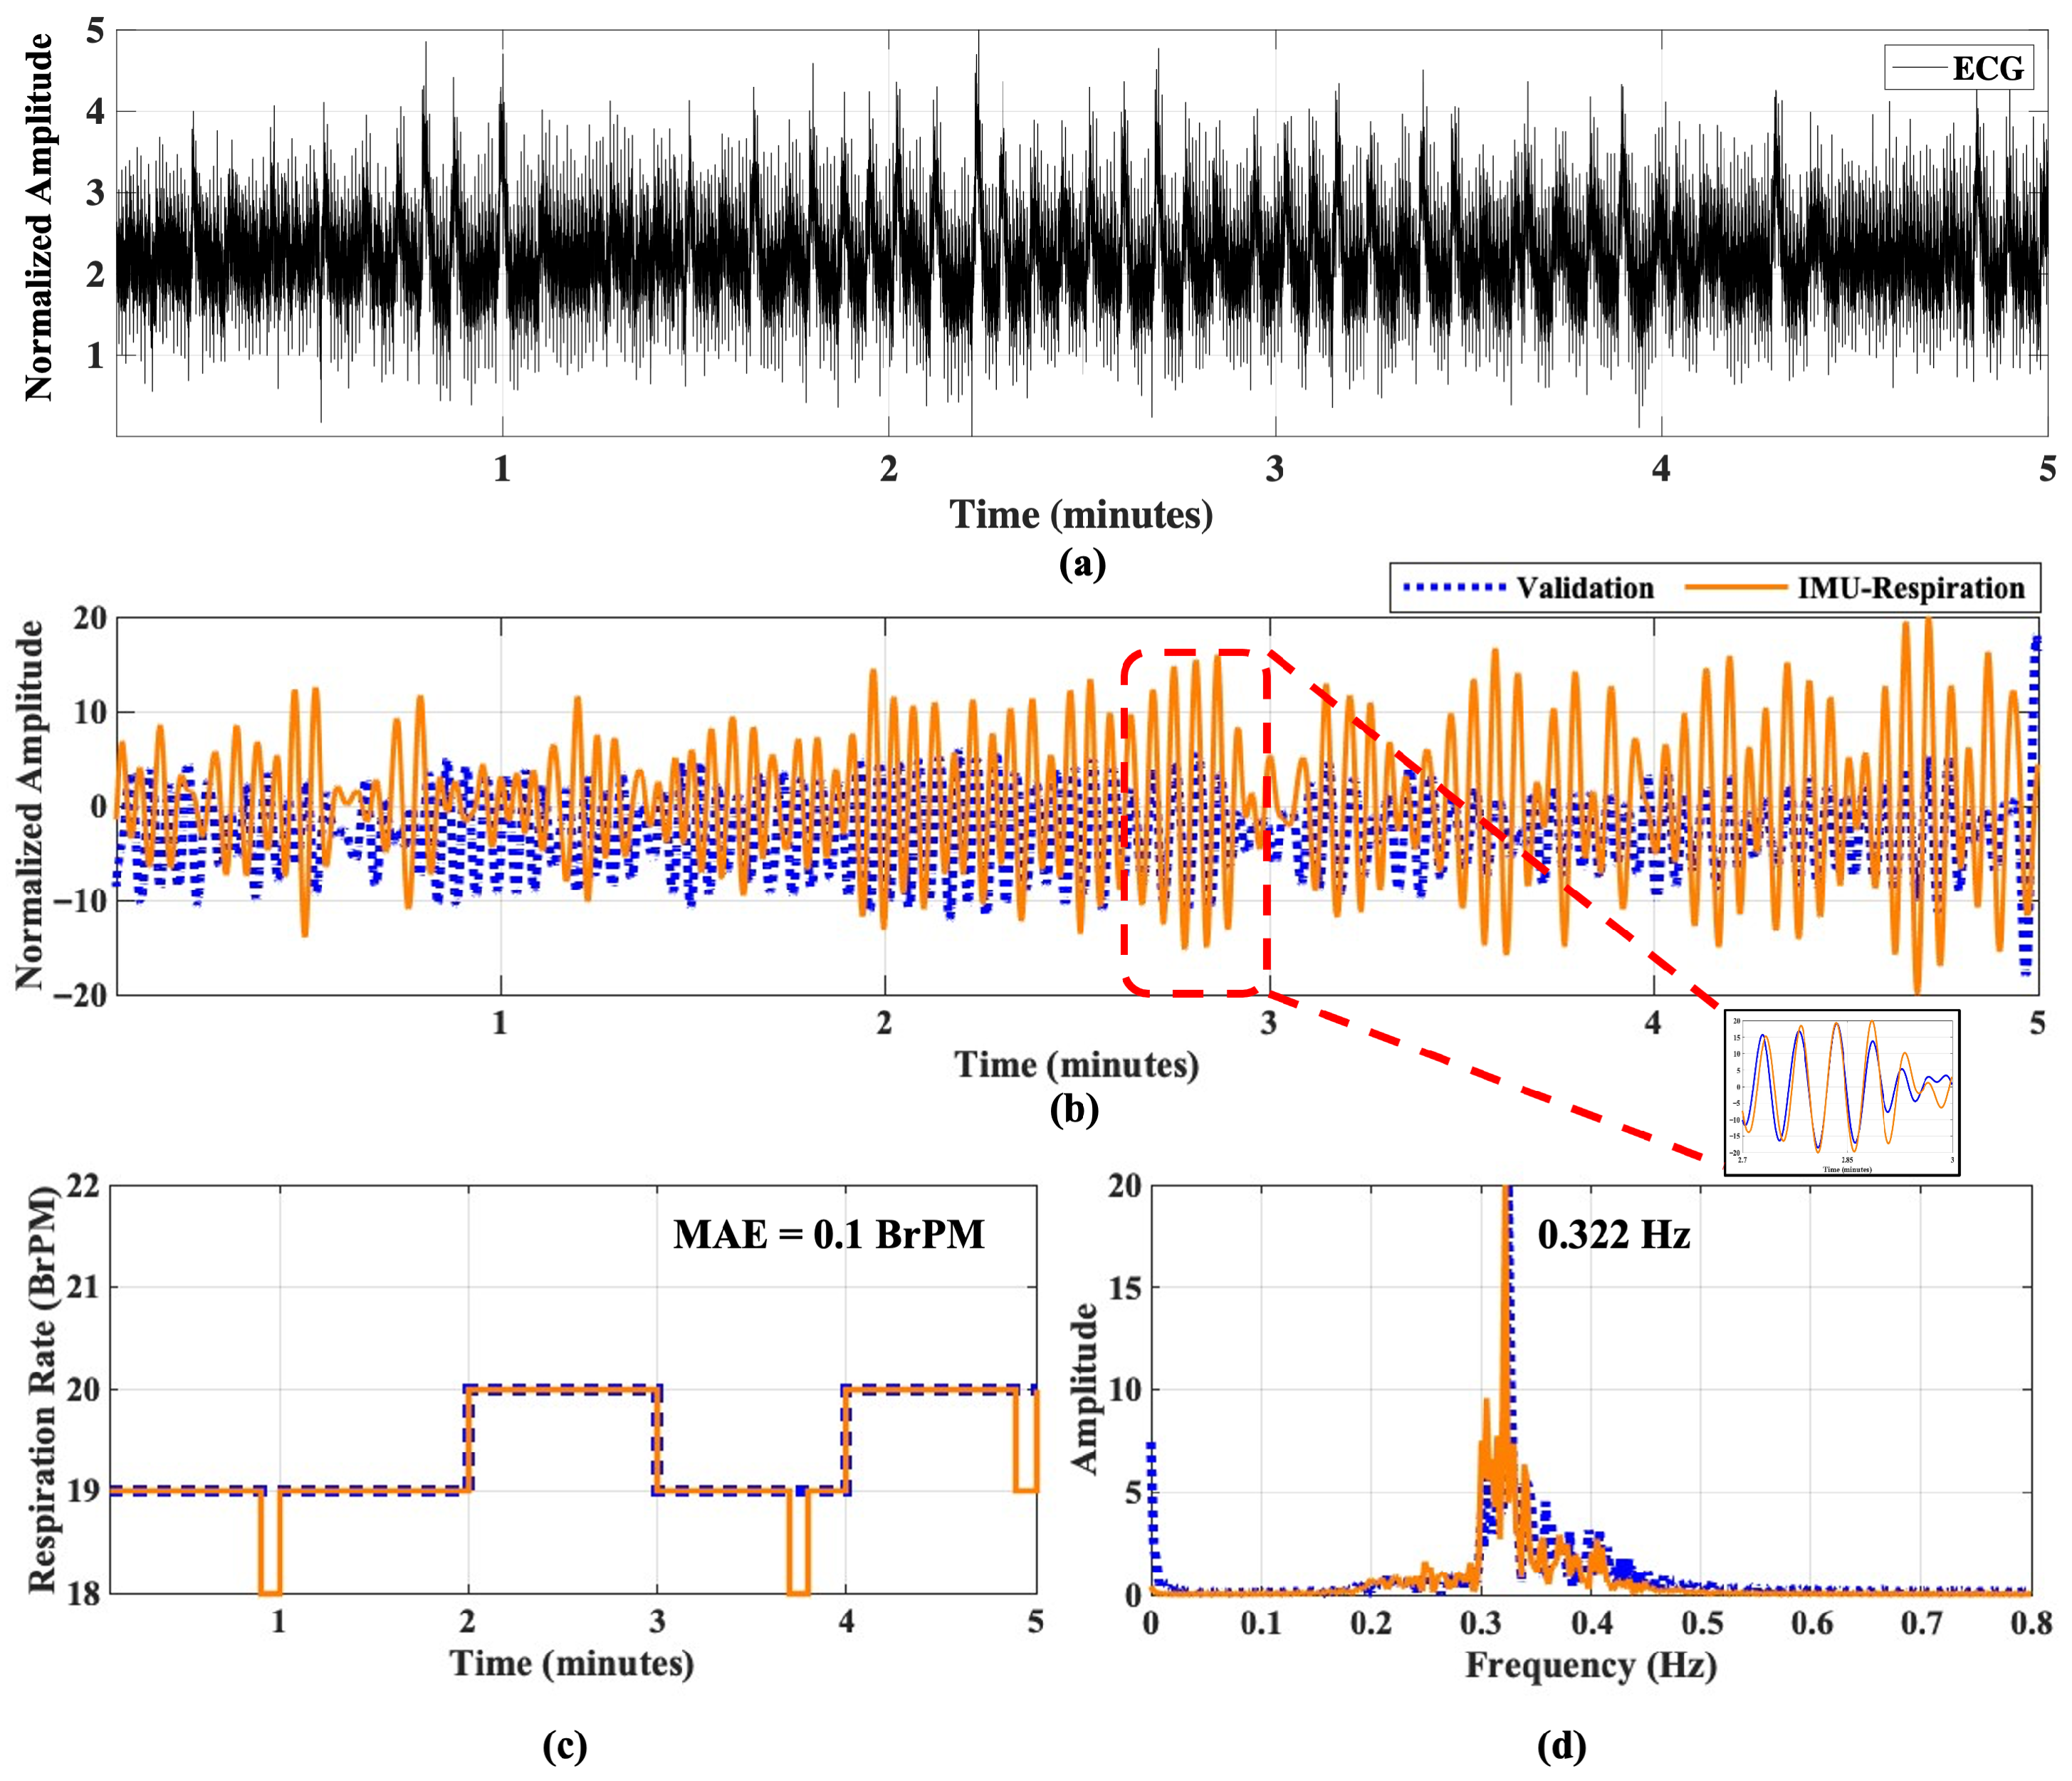
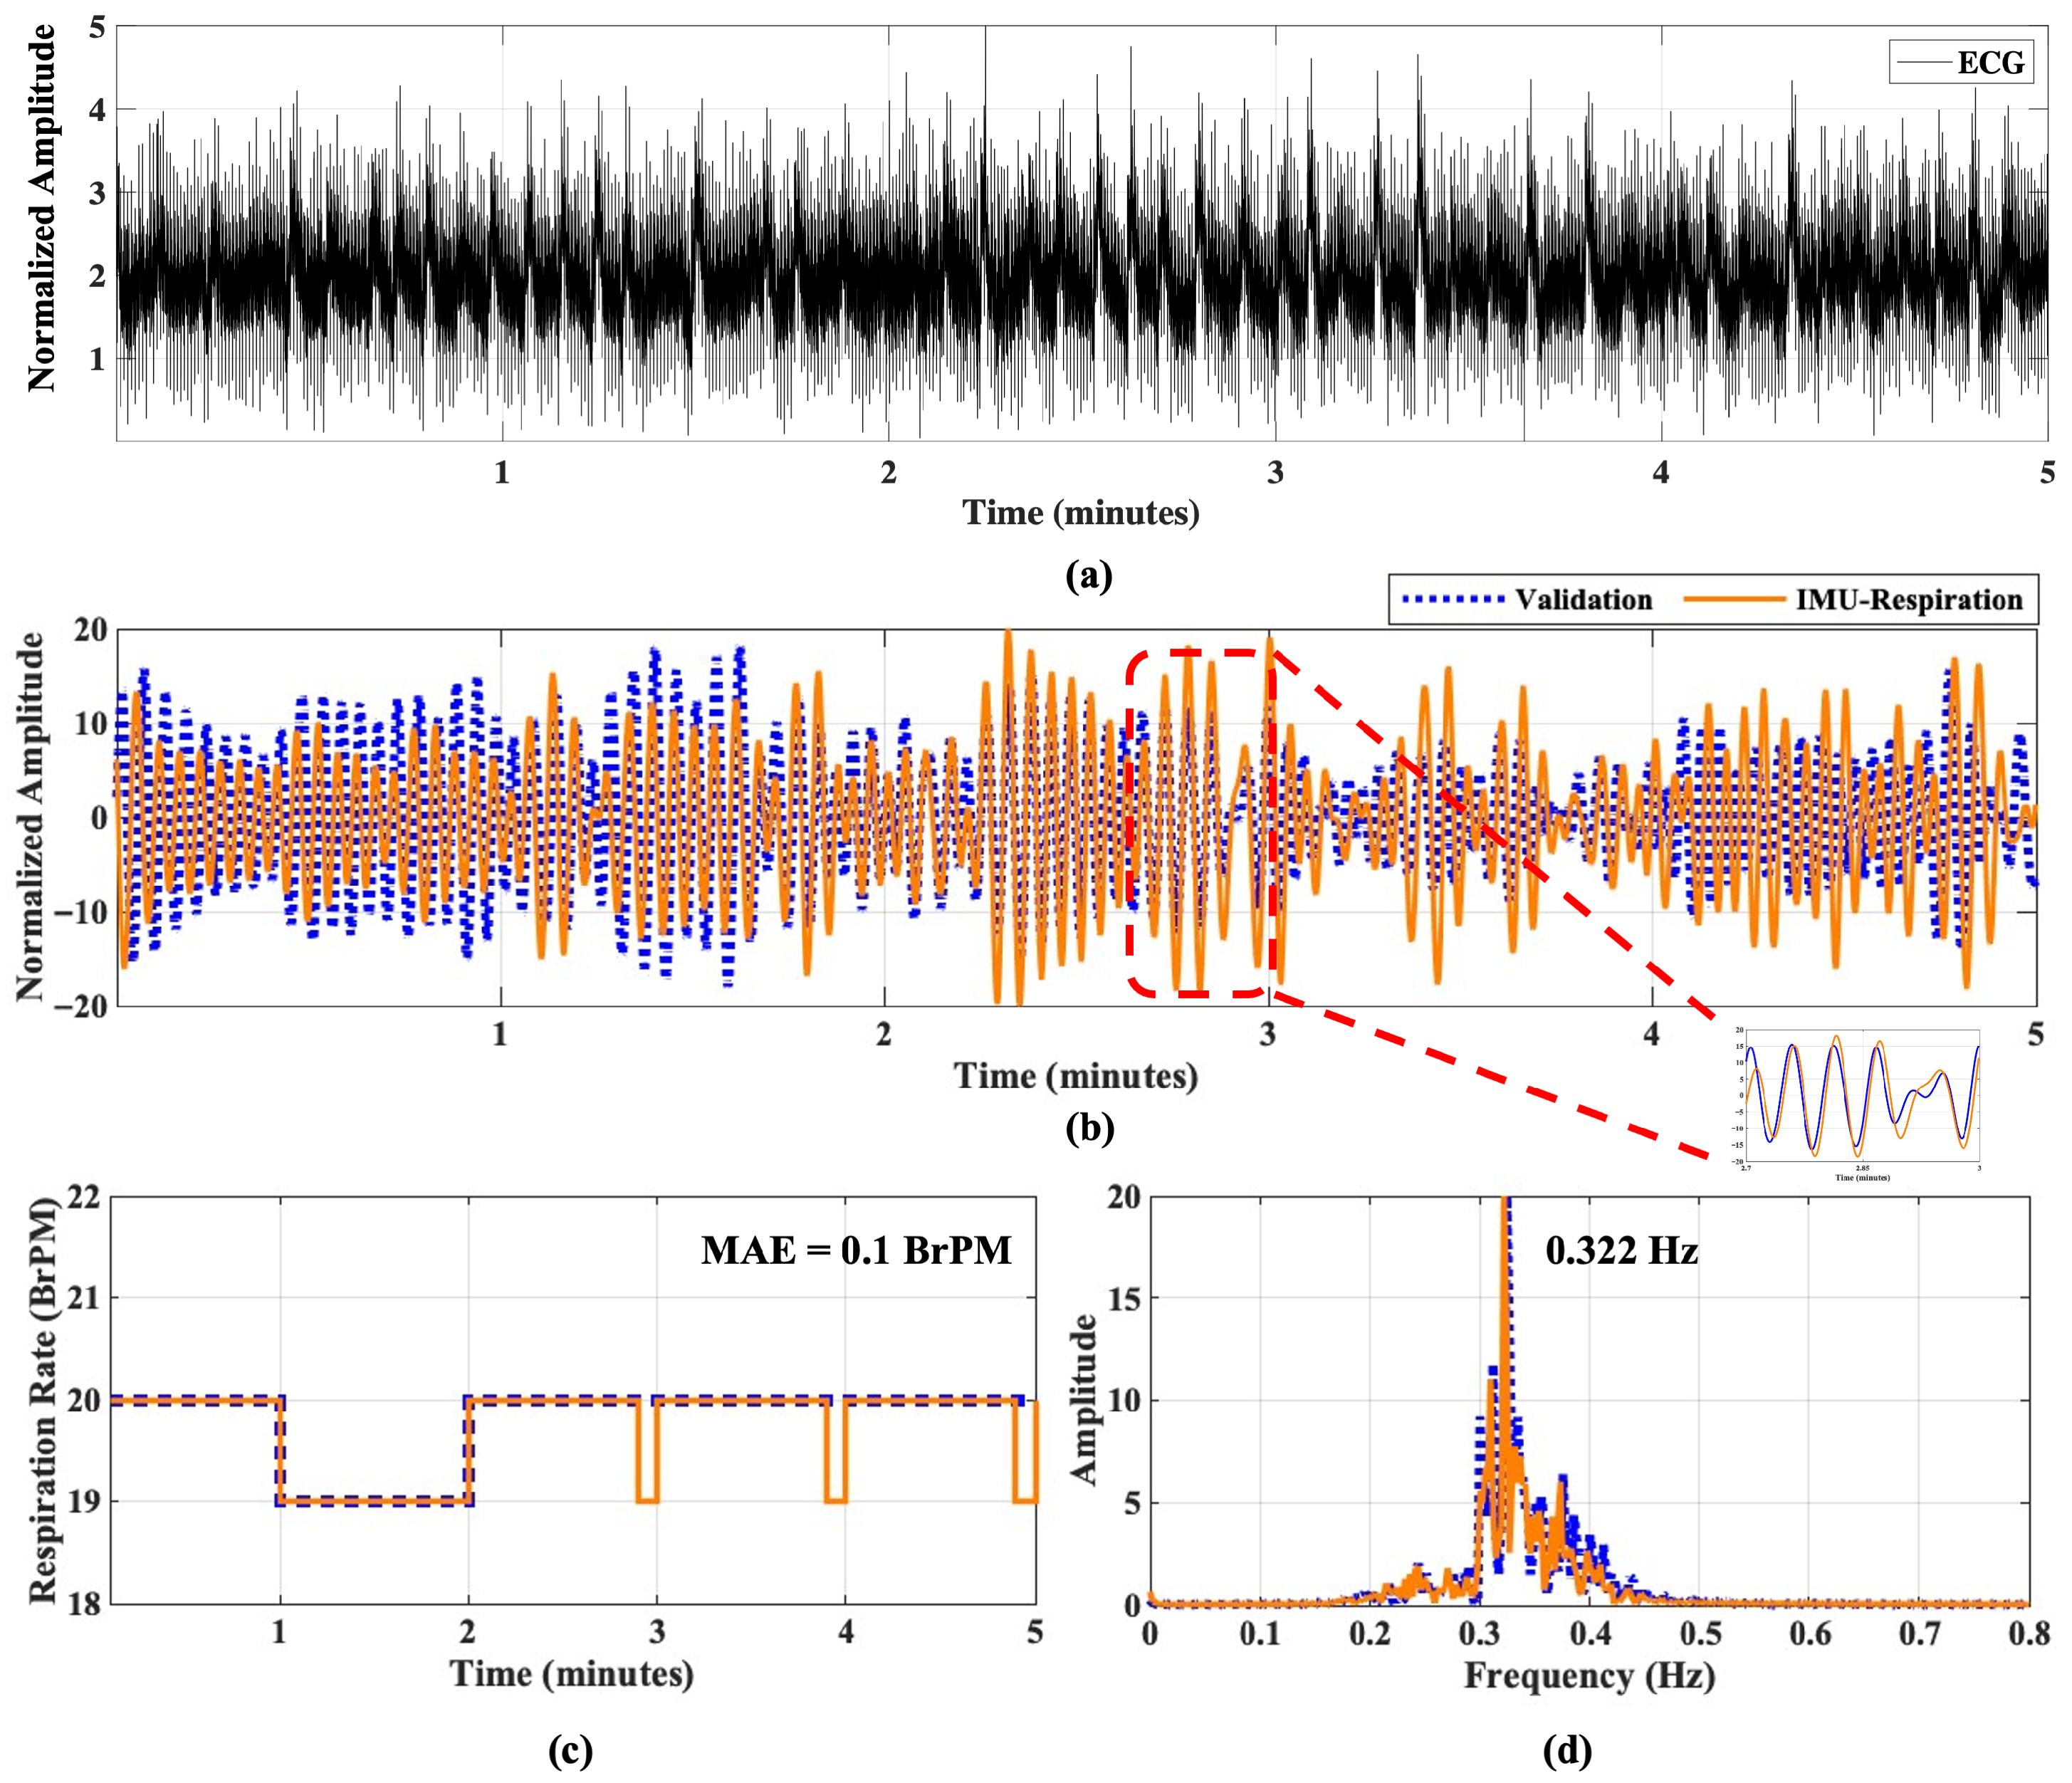
The performance of the proposed device is validated in stationary conditions such as sitting and standing. Figure 15 presents the performance evaluation for sitting conditions for one of the subjects. Figure 15a presents the raw ECG signal from the wearable. Figure 15b provides the reference and proposed respiratory signals captured simultaneously over 5 min. Figure 15c provides the estimated RR compared to the reference device for different breathing rates: 30, 24, 20, and 12 BrPM. In sitting conditions, the device performs well with no errors in most cases. Figure 15d depicts the frequency spectrum analysis over the processed breathing signal. The figure points to four different frequency spikes at 0.192, 0.332, 0.395, and 0.485 Hz, all of which correspond to 12, 20, 24, and 30 BrPMs.
Similarly, the performance is analyzed for standing conditions. Figure 16 presents the performance of the proposed system for standing states. Like sitting, standing condition also provides a good correlation between the proposed device and the reference device. Figure 16d provides the frequency spikes at 0.202, 0.322, 0.388, and 0.485 Hz, which closely correspond to 12, 20, 24, and 30 BrPMs, respectively. The figures indicate that the IMU can reliably detect respiration events in stationary conditions.

5.2.2. Performance in Dynamic States

The performance of a single IMU-based respiratory analysis, as well as cardiac signal, is evaluated in three dynamic conditions: walking, running, and cycling. Figure 17 presents the device’s performance during walking at a 2 mph speed. The wearable can reliably capture ECG signals in dynamic conditions by using dry, flexible electrodes on the chest. The MAE is only 0.06 BrPM for the subject. There can be a small phase lag between the reference and the proposed device because of the filtering stages. Overall, the system provides a good correlation with the validation device. The frequency spike is found at 0.324 Hz, corresponding to 20 BrPM, which indicates the single IMU can perform reliably during walking conditions.
During running conditions, the subjects run between 3 and 3.5 mph on a treadmill. Figure 18a indicates that the device can capture ECG in running states with minor moving artifacts. Figure 18b depicts the proposed and reference device breathing performance in running conditions. The single IMU performs reliably in this dynamic state. Furthermore, the subjects perform cycling with a speed range of 6–8 mph on a stationary bike. Figure 18c and Figure 19c indicate a good RR achievement compared to the reference device.
We test the proposed device in stationary and dynamic conditions. Table 5 provides a summary of HR and RR estimation for all subjects. For RR, we test 10 subjects for each posture, each of them for 5 min. In Test 1, stationary performance results are checked with the reference device. For sitting and standing, the MAERR is 0.14 and 0.12 BrPM with an accuracy of 99.25% and 99.34%, respectively. The MAEHR is also accurate, providing an overall accuracy of 98.92% in steady states. During each stationary state, four different breathing rates are tested: 30, 24, 20, and 12 BrPM. The performance statistics indicate that the proposed system can effectively estimate RR in stationary conditions.
The overall performance in Test 2 is also reliable. During Test 2, MAE is observed to be 0.17, 0.36, and 0.23 BrPM for the walking, running, and cycling states, respectively. For walking, a constant speed of 2 mph is set for every subject. On the other hand, the running and cycling speeds can vary widely for different age and gender groups. The running speed varies from 3 to 3.5 mph, while cycling varies from 6 to 8 mph. The HR measuring accuracy (accuracyHR) is ∼98%. The dynamic states, including running, provide reasonable accuracy of above 98% for RR. The higher accuracy indicates the effectiveness of the on-device processing algorithms for HR and RR processing in static and dynamic conditions.

5.2.3. Ambulatory Monitoring

We explore the performance of the wearable in real-life monitoring. The ambulatory monitoring includes a combination of indoor and outdoor activities. These activities replicate our daily life activities such as sitting, standing, walking, stair stair-stepping. Two male participants are included for this test, and data are taken for 20 min for each of them. The test is performed on the Texas Tech University campus.
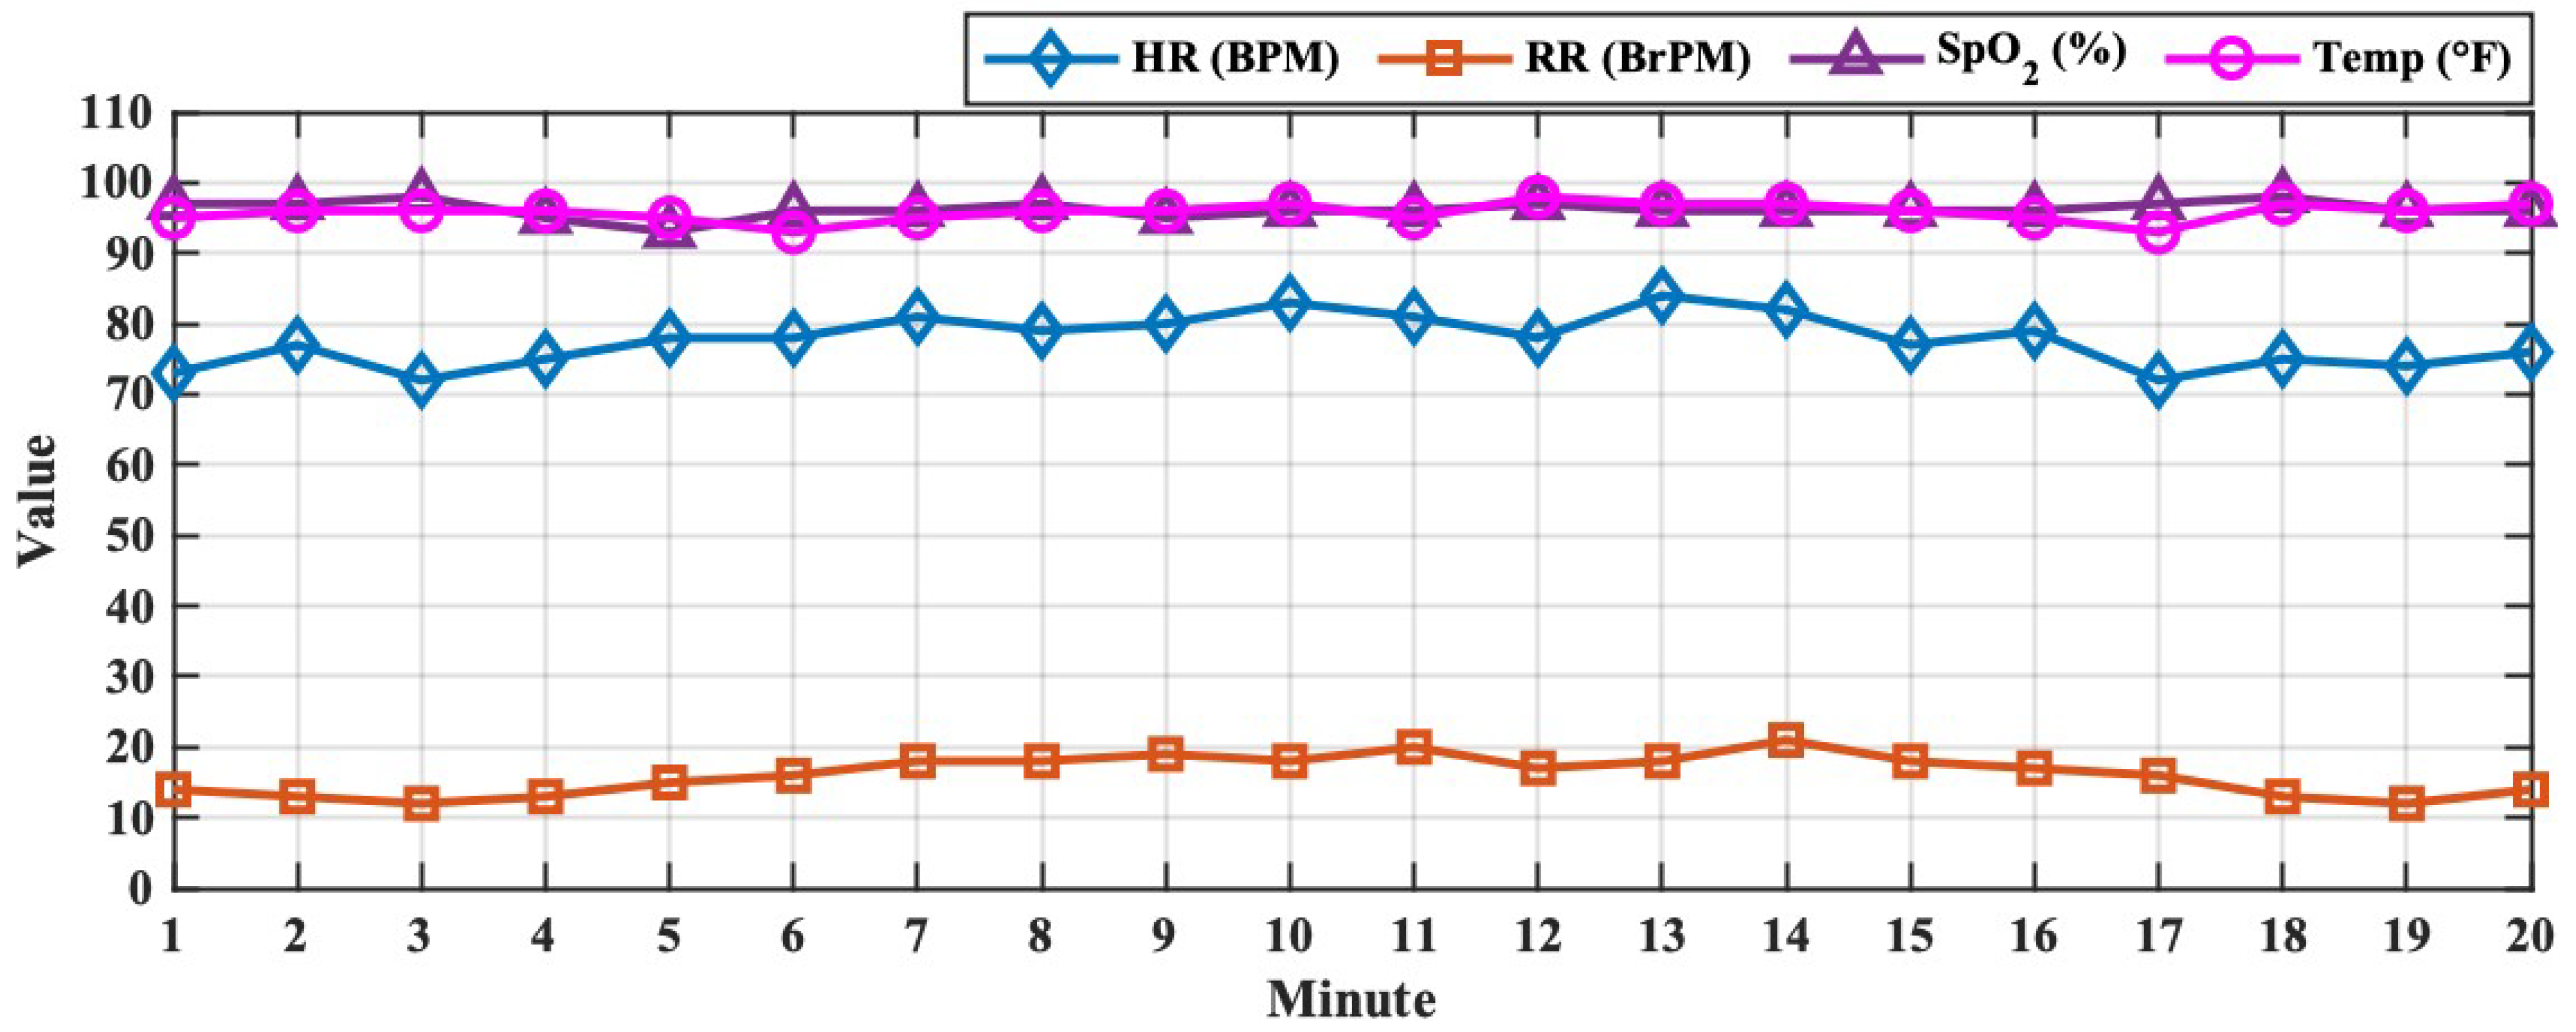
Ambulatory monitoring includes the observation of major physiological signs. We capture and process heart rate (HR), RR, SpO2, and body temperature simultaneously for each subject. Figure 20 presents the simultaneous data processed in real time in an ambulatory setup. The first 5 min are in indoor conditions inside the lab environment that involves sitting and walking. Then, 13 min are spent outdoors with normal walking. During the last 2 min, the participants come back to the starting point. There are also stair-stepping stages during the transition between indoor and outdoor states.

6. Discussion

Table 6 provides the performance of the proposed wearable system with recent cardio-respiration wearables. Most of the studies are offline and do not include moving conditions during testing. Textile patch-based smart shirts can offer on-device multimodal monitoring. However, wearable devices with more flexibility and comfort for long-term monitoring are still required. This work incorporates a flexible thin IJP sensor for cardiac signal acquisition that provides more flexibility in long-term monitoring. Simultaneously, the device can process respiration signals from a single IMU. Compared to recent studies, our work offers low-complexity single IMU-based real-time respiration monitoring in static and dynamic conditions during indoor and outdoor activities. The custom device consumes an average of 7.4 mA of current and a maximum of 37 mA during active data Tx states in the ambulatory monitoring setup. The IMU signal processing latency is 1.4 ms, which ensures reliable compatibility with real-time data processing. The proposed device is powered by a 350 mAhr Lipo battery and with 7.4 mA of average power consumption, the device can continuously operate for ∼47 h. These features make the system advantageous for continuous, long-term daily monitoring.
We encounter a few challenges while capturing and validating our proposed system. There is an amplitude variation observed between the reference and the proposed respiration device in some cases. These variations can occur because of the placement of the two devices. Moreover, the use of the Kardia®device during exercise protocol restricts the natural arm movement. As a result, the IMU sensor may not entirely reflect the effects of natural body movements during exercise activities. In future, we aim to use reference devices that add less restriction to natural movement. The movement of the thorax–abdominal wall also varies in different areas, and thus, an amplitude variation can be expected between the two devices. To ensure proper synchronization, similar mobile devices are used, and data storage is started and stopped manually at the same time. As maintaining a constant RR is tough in dynamic states, the subjects are only encouraged to provide a constant breathing rate of 20 BrPM. The age range of subjects varies from 25 to 35 years. In the future, we intend to perform the analysis on more subjects and patients with a diverse population set. If not properly attached to the body, the device may get displaced from the thorax–abdomen or may fall accidentally during extreme moving conditions. In those cases, the IMU data would not represent the exact respiratory behavior. To avoid this, the device has to be properly worn with a belt or vest. For future, we aim to explore the performance of the device for extreme moving conditions in outdoor environments.

7. Conclusions

A low-power wearable device for cardiac and respiration monitoring is proposed in this paper. The wearable offers a novel approach for single IMU processing to capture the respiratory signal. The 6-axis accelerometer and gyroscope data from the IMU are processed by a quaternion-based approach to estimate the breathing pattern and RR. The wearable can simultaneously process ECG, SpO2, and temperature signals. The ECG and respiration signals are validated with commercial devices during stationary and dynamic postures. Combining both static and dynamic activities, the HR and RR processing methods offer overall accuracies of 98.3% and 98.9%, respectively. The wearable is also used to monitor data in an ambulatory setup in indoor and outdoor conditions. The proposed device offers data processing in real time with an overall latency of ∼61 ms for every 10 s of data. The wearable draws an average of 7.4 mA during active states and a maximum current of 37 mA during BLE transmission. These features make the wearable a low-power, real-time device for monitoring cardiac and pulmonary health vitals simultaneously.

Author Contributions

Conceptualization, M.R. and B.I.M.; methodology, M.R.; software, M.R.; validation, M.R.; formal analysis, M.R.; investigation, M.R., resources, M.R.; data curation, M.R.; writing—original draft preparation, M.R.; writing—review and editing, M.R. and B.I.M.; visualization, M.R.; supervision, B.I.M.; project administration, B.I.M.; funding acquisition, B.I.M. All authors have read and agreed to the published version of the manuscript.

Funding

This research was funded by the National Science Foundation under Grant No. 2105766.

Institutional Review Board Statement

The study was conducted in accordance with the Declaration of Helsinki, and approved by the Institutional Review Board of Texas Tech University (approved IRB No. IRB2020-783).

Informed Consent Statement

Informed consent was obtained from all subjects involved in the study.

Data Availability Statement

The original contributions presented in this study are included in the article. Further inquiries can be directed to the corresponding author.

Acknowledgments

The 3D packaging was designed by Robert Hewitt.

Conflicts of Interest

The authors declare no conflicts of interest.

References

  1. United Nations, Department of Economic and Social Affairs (Population Division). World Population Ageing 2013; Technical Reports; United Nations, Department of Economic and Social Affairs (Population Division): New York, NY, USA, 2013. [Google Scholar]
  2. Soh, P.J.; Vandenbosch, G.A.; Mercuri, M.; Schreurs, D.M.P. Wearable wireless health monitoring: Current developments, challenges, and future trends. IEEE Microw. Mag. 2015, 16, 55–70. [Google Scholar] [CrossRef]
  3. Milenković, A.; Otto, C.; Jovanov, E. Wireless sensor networks for personal health monitoring: Issues and an implementation. Comput. Commun. 2006, 29, 2521–2533. [Google Scholar] [CrossRef]
  4. Philip, N.Y.; Rodrigues, J.J.; Wang, H.; Fong, S.J.; Chen, J. Internet of Things for in-home health monitoring systems: Current advances, challenges and future directions. IEEE J. Sel. Areas Commun. 2021, 39, 300–310. [Google Scholar] [CrossRef]
  5. Andrade, A.; Cabral, A.T.; Bellini, B.; Rodrigues, V.F.; da Rosa Righi, R.; da Costa, C.A.; Barbosa, J.L.V. IoT-based vital sign monitoring: A literature review. Smart Health 2024, 32, 100462. [Google Scholar] [CrossRef]
  6. Tang, Y.; Chen, Z.; Li, A.; Zheng, T.; Lin, Z.; Xu, J.; Lv, P.; Sun, Z.; Gao, Y. Merit: Multimodal wearable vital sign waveform monitoring. arXiv 2024, arXiv:2410.00392. [Google Scholar] [CrossRef]
  7. Hasan, S.; Pantha, T.; Arafat, M.A. Design and development of a cost-effective portable IoT enabled multi-channel physiological signal monitoring system. Biomed. Eng. Adv. 2024, 7, 100124. [Google Scholar] [CrossRef]
  8. Do, C.T.; Khai, N.D.; Tuan, D.N.; Chau, P.H.M.; Thanh, N.T.; Le, A.N.; Nguyen, V.D.; Van Chien, T. IoT-Powered Mental Healthcare: Sleep State Analyzing and Monitoring based on EEG Signals. IEEE Access 2025, 13, 66888–66906. [Google Scholar]
  9. Kim, D.; Lee, J.; Park, M.K.; Ko, S.H. Recent developments in wearable breath sensors for healthcare monitoring. Commun. Mater. 2024, 5, 41. [Google Scholar] [CrossRef]
  10. Judice, A.; Malhotra, S.; Sharma, M. Recent advancements in wearable antennas and its future directions. In Proceedings of the 2024 11th International Conference on Reliability, Infocom Technologies and Optimization (Trends and Future Directions) (ICRITO), Noida, India, 14–15 March 2024; IEEE: New York, NY, USA, 2024; pp. 1–6. [Google Scholar]
  11. Cheng, J.; Ma, T.; Xue, N.; Qin, B.; Zhou, W.; Sun, X. Advancements in Wearable Sensor Technology for Remote Health Monitoring. In Proceedings of the 2024 IEEE 10th World Forum on Internet of Things (WF-IoT), Ottawa, ON, Canada, 10–13 November 2024; IEEE: New York, NY, USA, 2024; pp. 1–5. [Google Scholar]
  12. Abid, M.H.; Talin, I.A. IoT-Based ECG Monitoring System on Smartphones. In Proceedings of the 2024 International Conference on Advances in Computing, Communication, Electrical, and Smart Systems (iCACCESS), Dhaka, Bangladesh, 8–9 March 2024; pp. 1–5. [Google Scholar] [CrossRef]
  13. He, C.; Fan, X.; Li, Y. Toward Ubiquitous Healthcare Services with a Novel Efficient Cloud Platform. IEEE Trans. Biomed. Eng. 2013, 60, 230–234. [Google Scholar] [CrossRef]
  14. Elhanashi, A.; Dini, P.; Saponara, S.; Zheng, Q. Advancements in TinyML: Applications, Limitations, and Impact on IoT Devices. Electronics 2024, 13, 3562. [Google Scholar] [CrossRef]
  15. Haghayegh, F.; Norouziazad, A.; Haghani, E.; Feygin, A.A.; Rahimi, R.H.; Ghavamabadi, H.A.; Sadighbayan, D.; Madhoun, F.; Papagelis, M.; Felfeli, T.; et al. Revolutionary Point-of-Care Wearable Diagnostics for Early Disease Detection and Biomarker Discovery through Intelligent Technologies. Adv. Sci. 2024, 11, 2400595. [Google Scholar] [CrossRef]
  16. Srivastav, A.K.; Das, P.; Srivastava, A.K. Biotech and IoT: An Introduction Using Cloud-Driven Labs; Springer: Berlin/Heidelberg, Germany, 2024. [Google Scholar]
  17. Bhuvaneshwari, V.; Sadaieswaran, R.; Malathi, P.; Legapriyadharshini, N.; Thirumalaikumari, T.; Raja, S. IoT-Enhanced Innovations in Drug Delivery Systems for Targeted Therapy in Autoimmune Disorders. In Proceedings of the 2024 10th International Conference on Advanced Computing and Communication Systems (ICACCS), Coimbatore, India, 14–15 March 2024; IEEE: New York, NY, USA, 2024; Volume 1, pp. 1275–1281. [Google Scholar]
  18. Pandurangan, P.; Rakshi, A.D.; Sundar, M.S.A.; Samrat, A.V.; Meenambiga, S.; Vedanarayanan, V.; Meena, R.; Namasivayam, S.K.R.; Moovendhan, M. Integrating cutting-edge technologies: AI, IoT, blockchain and nanotechnology for enhanced diagnosis and treatment of colorectal cancer-A review. J. Drug Deliv. Sci. Technol. 2024, 91, 105197. [Google Scholar] [CrossRef]
  19. van der Stam, J.A.; Mestrom, E.H.; Scheerhoorn, J.; Jacobs, F.; de Hingh, I.H.; van Riel, N.A.; Boer, A.K.; Scharnhorst, V.; Nienhuijs, S.W.; Bouwman, R.A. Accuracy of vital parameters measured by a wearable patch following major abdominal cancer surgery. Eur. J. Surg. Oncol. 2022, 48, 917–923. [Google Scholar] [CrossRef]
  20. Stevens, G.; Larmuseau, M.; Damme, A.V.; Vanoverschelde, H.; Heerman, J.; Verdonck, P. Feasibility study of the use of a wearable vital sign patch in an intensive care unit setting. J. Clin. Monit. Comput. 2025, 39, 245–256. [Google Scholar] [CrossRef]
  21. Montes, J.; Young, J.C.; Tandy, R.; Navalta, J.W. Reliability and validation of the hexoskin wearable bio-collection device during walking conditions. Int. J. Exerc. Sci. 2018, 11, 806. [Google Scholar] [CrossRef]
  22. Wei, J.C.; van den Broek, T.J.; van Baardewijk, J.U.; van Stokkum, R.; Kamstra, R.J.; Rikken, L.; Gijsbertse, K.; Uzunbajakava, N.E.; van den Brink, W.J. Validation and user experience of a dry electrode based Health Patch for heart rate and respiration rate monitoring. Sci. Rep. 2024, 14, 23098. [Google Scholar] [CrossRef]
  23. Momota, M.M.R.; Morshed, B.I.; Ferdous, T.; Fujiwara, T. Fabrication and characterization of inkjet printed flexible dry ECG electrodes. IEEE Sens. J. 2023, 23, 7917–7928. [Google Scholar] [CrossRef]
  24. Make, B.J.; Yawn, B.P. Breathing life into COPD management: Ongoing monitoring, pulmonary rehabilitation, and individualized care. Chest 2018, 154, 980–981. [Google Scholar] [CrossRef]
  25. Zulkifli, N.A.B.; Jeong, W.; Kim, M.; Kim, C.; Ko, Y.H.; Hyun, D.C.; Lee, S. 3D-printed magnetic-based air pressure sensor for continuous respiration monitoring and breathing rehabilitation. Soft Sci. 2024, 4, 20. [Google Scholar] [CrossRef]
  26. Brinkman, J.E.; Toro, F.; Sharma, S. Physiology, Respiratory Drive; StatPearls Publishing: Treasure Island, FL, USA, 2018. [Google Scholar]
  27. Karlen, W.; Raman, S.; Ansermino, J.M.; Dumont, G.A. Multiparameter respiratory rate estimation from the photoplethysmogram. IEEE Trans. Biomed. Eng. 2013, 60, 1946–1953. [Google Scholar] [CrossRef]
  28. Utsha, U.T.; Morshed, B.I. Edge-Computing Enabled Real-Time Respiratory Monitoring and Breathing Pattern Detection. In Proceedings of the 2024 IEEE 20th International Conference on Body Sensor Networks (BSN), Chicago, IL, USA, 15–17 October 2024; IEEE: New York, NY, USA, 2024; pp. 1–4. [Google Scholar]
  29. Karkouli, G.; Douros, K.; Moriki, D.; Moutsatsou, P.; Giannopoulou, I.; Maratou, E.; Koumpagioti, D. Dysfunctional breathing in children: A literature review. Children 2024, 11, 556. [Google Scholar] [CrossRef]
  30. Loveridge, B.; West, P.; Kryger, M.; Anthonisen, N. Alteration in breathing pattern with progression of chronic obstructive pulmonary disease. Am. Rev. Respir. Dis. 1986, 134, 930–934. [Google Scholar] [CrossRef]
  31. Vicente, B.A.; Sebastião, R.; Sencadas, V. Wearable devices for respiratory monitoring. Adv. Funct. Mater. 2024, 34, 2404348. [Google Scholar] [CrossRef]
  32. De Fazio, R.; Stabile, M.; De Vittorio, M.; Velázquez, R.; Visconti, P. An overview of wearable piezoresistive and inertial sensors for respiration rate monitoring. Electronics 2021, 10, 2178. [Google Scholar] [CrossRef]
  33. Meena, J.S.; Choi, S.B.; Jung, S.B.; Kim, J.W. Electronic textiles: New age of wearable technology for healthcare and fitness solutions. Mater. Today Bio 2023, 19, 100565. [Google Scholar] [CrossRef]
  34. Blanco-Almazán, D.; Groenendaal, W.; Catthoor, F.; Jané, R. Chest movement and respiratory volume both contribute to thoracic bioimpedance during loaded breathing. Sci. Rep. 2019, 9, 20232. [Google Scholar] [CrossRef]
  35. Berkebile, J.A.; Mabrouk, S.A.; Ganti, V.G.; Srivatsa, A.V.; Sanchez-Perez, J.A.; Inan, O.T. Towards estimation of tidal volume and respiratory timings via wearable-patch-based impedance pneumography in ambulatory settings. IEEE Trans. Biomed. Eng. 2021, 69, 1909–1919. [Google Scholar] [CrossRef]
  36. Qiu, C.; Wu, F.; Han, W.; Yuce, M.R. A wearable bioimpedance chest patch for real-time ambulatory respiratory monitoring. IEEE Trans. Biomed. Eng. 2022, 69, 2970–2981. [Google Scholar] [CrossRef]
  37. Sharan, R.V.; Takeuchi, H.; Kishi, A.; Yamamoto, Y. Macro-Sleep Staging with ECG-Derived Instantaneous Heart Rate and Respiration Signals and Multi-Input 1-D CNN–BiGRU. IEEE Trans. Instrum. Meas. 2024, 73, 1–12. [Google Scholar] [CrossRef]
  38. Krishnapriya, G.B.; Ponnalagu, R.N.; Goel, S. A Resource-Efficient Time-Domain-Based Algorithm to Estimate Respiration Rate from Single-Lead ECG Signal. IEEE Open J. Instrum. Meas. 2025, 4, 1–9. [Google Scholar] [CrossRef]
  39. Wang, Y.; Liu, H.; Xiang, W.; Shui, Y.; Guo, L.; Zhou, M.; Pang, Y. A novel non-contact respiration and heartbeat detection method using frequency-modulated continuous wave radar. IEEE Sens. J. 2024, 24, 10434–10446. [Google Scholar] [CrossRef]
  40. Alves, R.; van Meulen, F.; Overeem, S.; Zinger, S.; Stuijk, S. Thermal Cameras for Continuous and Contactless Respiration Monitoring. Sensors 2024, 24, 8118. [Google Scholar] [CrossRef]
  41. Vincent, K.; Jing, N.; Wang, L. AcBreath: In-Hand Free Acoustic Breath Signal Reconstruction using Variational AutoEncoder. IEEE Sens. J. 2024, 25, 4908–4916. [Google Scholar] [CrossRef]
  42. Dan, G.; Zhao, J.; Chen, Z.; Yang, H.; Zhu, Z. A Novel Signal Acquisition System for Wearable Respiratory Monitoring. IEEE Access 2018, 6, 34365–34371. [Google Scholar] [CrossRef]
  43. Monaco, V.; Giustinoni, C.; Ciapetti, T.; Maselli, A.; Stefanini, C. Assessing Respiratory Activity by Using IMUs: Modeling and Validation. Sensors 2022, 22, 2185. [Google Scholar] [CrossRef]
  44. Rousanoglou, E.; Foskolou, A.; Emmanouil, A.; Boudolos, K. Inertial Sensing of the Abdominal Wall Kinematics during Diaphragmatic Breathing in Head Standing. Biomechanics 2024, 4, 63–83. [Google Scholar] [CrossRef]
  45. Gollee, H.; Chen, W. Real-time detection of respiratory activity using an inertial measurement unit. In Proceedings of the 2007 29th Annual International Conference of the IEEE Engineering in Medicine and Biology Society, Lyon, France, 22–26 August 2007; pp. 2230–2233. [Google Scholar] [CrossRef]
  46. Ricci, M.; Manrique-Cordoba, J.; Romero-Ante, J.D.; Vicente, J.M.; Cordella, F.; Sabater-Navarro, J.M. Apnea Detection in newborns using abdominal IMU. In Proceedings of the 2024 46th Annual International Conference of the IEEE Engineering in Medicine and Biology Society (EMBC), Orlando, FL, USA, 15–19 July 2024; pp. 1–4. [Google Scholar] [CrossRef]
  47. De Fazio, R.; Visconti, P.; Perrone, E.; Greco, M.R.; Velazquez, R. Development and Testing of Piezoresistive and Inertial-Based Chest Bands for Breathing Monitoring. In Proceedings of the 2022 7th International Conference on Smart and Sustainable Technologies (SpliTech), Bol/Split, Croatia, 5–8 July 2022; pp. 1–6. [Google Scholar] [CrossRef]
  48. Hung, P.; Bonnet, S.; Guillemaud, R.; Castelli, E.; Yen, P.T.N. Estimation of respiratory waveform using an accelerometer. In Proceedings of the 2008 5th IEEE International Symposium on Biomedical Imaging: From Nano to Macro, Paris, France, 14–17 May 2008; pp. 1493–1496. [Google Scholar] [CrossRef]
  49. Cheng, H.; Jiang, H.; Duan, M.; Li, S.; Tong, Y.; Wan, T.; Liu, L. Design of a wearable dynamic respiratory monitoring system based on a distributed inertial measurement unit. IEEE Sens. J. 2024, 25, 3295–3308. [Google Scholar] [CrossRef]
  50. Lee, S.; Lim, Y.; Lim, K. Multimodal sensor fusion models for real-time exercise repetition counting with IMU sensors and respiration data. Inf. Fusion 2024, 104, 102153. [Google Scholar] [CrossRef]
  51. Khan, S.; Alzaabi, A.; Ratnarajah, T.; Arslan, T. Novel statistical time series data augmentation and machine learning based classification of unobtrusive respiration data for respiration Digital Twin model. Comput. Biol. Med. 2024, 168, 107825. [Google Scholar] [CrossRef]
  52. Bhongade, A.; Gupta, R.; Prathosh, A.; Gandhi, T.K. Respara-net: Respiration parameter estimation using wearable single inertial measurement unit sensor and deep learning. IEEE Sens. J. 2024, 24, 24931–24944. [Google Scholar] [CrossRef]
  53. Alsharif, A.A.; Aviles, J.M.; Zechel, F.M.; Alsharif, N.A.; El-Atab, N. Multi-material direct-ink-writing of silver-based flexible and highly deformable dry electrocardiogram biopatches. View 2024, 5, 20240008. [Google Scholar] [CrossRef]
  54. Jeng, G.S.; Chen, S.; Hsieh, L.T.; Lo, M.T. Contactless Respiratory Waveform Estimation Using Ultrasound Planar Array. IEEE Open J. Ultrason. Ferroelectr. Freq. Control 2025, 5, 23–32. [Google Scholar] [CrossRef]
  55. Grover, K.; Choudhary, J.s.; Dhawan, P.; Jha, R.; Yadav, H. Self-Powered Humidity Sensing and Real-Time Respiration Monitoring Based on Nonlinear-Optical Single Crystals of Imidazolium Perchlorate. ACS Appl. Electron. Mater. 2024, 6, 7865–7875. [Google Scholar] [CrossRef]
  56. Ali, A.; Wei, Y.; Tyson, J.; Akerman, H.; Jackson, A.; Lane, R.; Spencer, D.; White, N.M. Enhancing the response of a wearable sensor for improved respiratory rate (RR) monitoring. IEEE Access 2024, 12, 180913–180925. [Google Scholar] [CrossRef]
  57. Romero, J.; Ferlini, A.; Spathis, D.; Dang, T.; Farrahi, K.; Kawsar, F.; Montanari, A. OptiBreathe: An earable-based PPG system for continuous respiration rate, breathing phase, and tidal volume monitoring. In Proceedings of the 25th International Workshop on Mobile Computing Systems and Applications, San Diego, CA, USA, 28–29 February 2024; pp. 99–106. [Google Scholar]
  58. Angelucci, A.; Aliverti, A. An IMU-based wearable system for respiratory rate estimation in static and dynamic conditions. Cardiovasc. Eng. Technol. 2023, 14, 351–363. [Google Scholar] [CrossRef]
  59. Analog Device. Single-Lead, Heart Rate Monitor Front End; AD8232 Data Sheet; Analog Device: Wilmington, MA, USA, 2013. [Google Scholar]
  60. InvenSense, Inc. MPU-6000 and MPU-6050 Product Specification, Revision 3.4; InvenSense, Inc.: San Jose, CA, USA, 2013. [Google Scholar]
  61. Maxim Integrated. MAX30101: High-Sensitivity Pulse Oximeter and Heart-Rate Sensor for Wearable Health; Maxim Integrated: Wilmington, MA, USA, 2020. [Google Scholar]
  62. Silicon Laboratories. Si7021-A20: I2C Humidity and Temperature Sensor; Silicon Laboratories: Sydney, Australia, 2022. [Google Scholar]
  63. SparkFun Electronics. SparkFun Pro nRF52840 Mini–Bluetooth Development Board (DEV-15025); SparkFun Electronics: Boulder, CO, USA, 2022. [Google Scholar]
  64. Cardarelli, S.; Mengarelli, A.; Tigrini, A.; Strazza, A.; Di Nardo, F.; Fioretti, S.; Verdini, F. Single IMU displacement and orientation estimation of human center of mass: A magnetometer-free approach. IEEE Trans. Instrum. Meas. 2019, 69, 5629–5639. [Google Scholar] [CrossRef]
  65. Hashimoto, Y.; Sato, R.; Takagahara, K.; Ishihara, T.; Watanabe, K.; Togo, H. Validation of wearable device consisting of a smart shirt with built-in bioelectrodes and a wireless transmitter for heart rate monitoring in light to moderate physical work. Sensors 2022, 22, 9241. [Google Scholar] [CrossRef]
Figure 1. Overall system consisting of IJP electrodes, a custom wearable device, and a custom mobile application.
Electronics 14 04276 g001
Figure 2. Custom device: (a) Bluetooth and power unit, and (b) custom PCB.
Electronics 14 04276 g002
Figure 3. AFE circuit: (a) biasing, (b) high pass, and (c) low pass filtering, (d) IMU circuit, (e) I2C configuration.
Electronics 14 04276 g003
Figure 4. Interconnection of the major hardware components.
Electronics 14 04276 g004
Figure 5. Flowchart of the firmware.
Electronics 14 04276 g005
Figure 6. Block diagram of the ECG signal processing.
Electronics 14 04276 g006
Figure 7. Respiration signal processing: (a) IMU placement, (b) IMU processing.
Electronics 14 04276 g007
Figure 8. Block diagram of the PO signal processing.
Electronics 14 04276 g008
Figure 9. Experimental setup of the protocols and validation for different postures: (a) treadmill setup, (b) sitting, (c) standing, (d) walking, (e) running, and (f) cycling.
Electronics 14 04276 g009
Figure 10. Bode plot for the ECG filter response.
Electronics 14 04276 g010
Figure 11. CMRR performance of the instrumentation amplifier.
Electronics 14 04276 g011
Figure 12. RSSI performance over distance: (a) 1 Mbps speed, (b) 2 Mbps speed.
Electronics 14 04276 g012
Figure 13. ECG signal processing.
Electronics 14 04276 g013
Figure 14. Respiration signal processing from raw data.
Electronics 14 04276 g014
Figure 15. Performance of ECG and IMU-based respiration during sitting compared with validation device for one subject: (a) ECG signal, (b) respiration signal from proposed system, (c) breathing rate (BrPM) variations, (d) amplitude spectrum of the respiratory signal.
Electronics 14 04276 g015
Figure 16. Performance of ECG and IMU-based respiration during standing compared with validation device for one subject: (a) ECG signal, (b) respiration signal from proposed system, (c) breathing rate (BrPM) variations, (d) amplitude spectrum of the respiratory signal.
Electronics 14 04276 g016
Figure 17. Performance of ECG and IMU-based respiration during walking compared with validation device for one subject: (a) ECG signal, (b) respiration signal from proposed system, (c) breathing rate (BrPM) variations, and (d) amplitude spectrum of the respiratory signal.
Electronics 14 04276 g017
Figure 18. Performance of ECG and IMU-based respiration during running compared with validation device for one subject: (a) ECG signal, (b) respiration signal from proposed system, (c) breathing rate (BrPM) variations, and (d) amplitude spectrum of the respiratory signal.
Electronics 14 04276 g018
Figure 19. Performance of ECG and IMU-based respiration during cycling compared with validation device for one subject: (a) ECG signal, (b) respiration signal from proposed system, (c) breathing rate (BrPM) variations, and (d) amplitude spectrum of the respiratory signal.
Electronics 14 04276 g019
Figure 20. Ambulatory monitoring in indoor and outdoor: HR, RR, SpO2, body temperature.
Electronics 14 04276 g020
Table 1. BLE packet data description.
BLE Packet NumberPacket DescriptionPayload Size (Bytes)
1–50Raw ECG400
51ECG Features400
52–57Raw IMU (6 axis)400
58Respiration200
59–60Raw PO400
61Raw Temperature200
62RR, Mean SpO2, Mean Temperature6
Table 2. Summary of breathing patterns and test durations.
Test #PostureBreathing PatternBrPMDuration (mins)
Test 1 (static)Sitting &
Standing (all phases)
Phase 1: Inhale 1 s–Exhale 1 s
Phase 2: Inhale 1.25 s–Exhale 1.25 s
Phase 3: Inhale 1.5 s–Exhale 1.5 s
Phase 4: Inhale 2.5 s–Exhale 2.5 s
30
24
20
12
1
1.25
1.5
1.25
Test 2 (dynamic)WalkingInhale 1 s – Exhale 1 s205
RunningInhale 1 s–Exhale 1 s205
CyclingInhale 1 s–Exhale 1 s205
Test 3 (ambulatory)Include sitting,
standing, walking,
stair stepping
Normal breathing-20
Table 3. BLE power consumption under various configurations.
BLE PropertiesIavg, mAImax, mA
SpeedConnection IntervalSleep Mode
1 mbps50 msYes7.3936.97
1 mbps50 msNo16.4743.47
2 mbps50 msYes7.2539.37
2 mbps50 msNo16.3543.48
1 mbps20 msYes11.3141.34
1 mbps40 msYes11.1841.22
Table 4. Processing latencies for 10 s data.
Data ProcessingLatency, ms
ECG processing59.3
Respiration processing1.4
PO processing0.55
Temperature processing0.02
Table 5. Performance of HR & RR Estimation.
TestPostureMAEHR (BPM)AccuracyHR (%)MAERR (BrPM)AccuracyRR (%)
Test 1
(stationary)
Sitting0.1999.050.1499.25
Standing0.2298.790.1299.34
Test 2
(dynamic)
Walking0.3197.900.1799.17
Running0.3397.730.3698.01
Cycling0.2898.250.2398.61
Table 6. Comparison of different wearable cardio-respiratory monitoring systems.
Ref.SensorDeviceProcessing PlatformPosture/ActivityApplicationPerformance
Montes et al. [21]Textile patchHexoskin smart shirtrecording device connected, real time1.5, 2.5, 3.5 mph walkingHR, RRrHR = 0.86,
rRR = 0.87
Hashimoto et al. [65]Textile sensorC3 fit IN-Pulse bioelectrodeOn-deviceModerate workHRMAPE = 0.92%
Ali et al. [56]Capacitive sensingCapaciflector textile sensorOfflineSittingRRAcc: 99.39%
Grover et al. [55]Humidity sensingIMP crystal-based humidity sensorOfflineNormal/deep breathing- T resp  = 75 s;
T rec  = 18 s
Romero et al. [57]PPG-basedIn-ear PPG sensor to extract respirationOfflineSittingRR, TVMAE: 1.96
Bhongade et al. [52]Single IMU on coastal regionARM Cortex-M7, 600 MHz, data in SD cardCNN in MATLABSittingRRMAE: 0.04
Cheng et al. [49]Distributed IMU front/backArray of XsensDOT IMU, BLE TxMobile computingStanding, sitting, walking, squattingMotion inference, RRMAE: 0.8
Angelucci et al. [58]3 IMU front/backMesh network among sensor nodesCNN applied offlineStatic, dynamicHuman activity, RRAcc: 98%
Berkebile et al. [35]Impedance pneumographyTetrapolar electrode thoracic patch, SD cardMATLABSitting, supine, walking, stairsTV, RRMAPE: 0.93%;
RTE: 4.5%
Qui et al. [36]Impedance pneumographyChest patch, BLE-LoRa TxOn-device, real timeSitting, standing, supine, lying, walking, running, cycling, ambulatory indoor-outdoorRRAcc: 97.8% (static), Acc: 98.5% (dynamic)
This workIJP electrode, Single IMU on thorax–abdomenBiopotential and Motion sensing, BLE TxOn-device, real timeSitting, standing, walking, running, cycling, dynamic indoor-outdoorHR, RRStatic:
AccHR = 98.9%,
AccRR = 99.3%,
Dynamic:
AccHR = 97.9%,
AccRR = 98.6%
Acc: accuracy, T resp : response time, T rec : recovery time, MA/PE: mean absolute/percentage error, RTE: respiratory timing error.
Disclaimer/Publisher’s Note: The statements, opinions and data contained in all publications are solely those of the individual author(s) and contributor(s) and not of MDPI and/or the editor(s). MDPI and/or the editor(s) disclaim responsibility for any injury to people or property resulting from any ideas, methods, instructions or products referred to in the content.