Abstract
Accurate segmentation of lung contours from computed tomography (CT) scans is essential for developing reliable computer-aided diagnostic systems. Although deep learning models, especially convolutional neural networks, have advanced the automation of pulmonary region extraction, their performance is often limited by low contrast and atypical anatomical appearances in CT images. This paper presents MSDC-AM U-Net, a hierarchically supervised segmentation framework built upon the U-Net architecture, integrated with a newly designed Multi-Scale Dilated Convolution (MSDC) module and an Attention Module (AM). The MSDC component employs dilated convolutions with varying receptive fields to improve edge detection and counteract contrast-related ambiguities. Furthermore, spatial attention mechanisms applied across different dimensions guide the model to focus more effectively on lung areas, thereby increasing localization precision. Extensive evaluations on multiple public lung imaging datasets (Luna16, Montgomery County, JSRT) confirm the superiority of the proposed approach. Our MSDC-AM U-Net achieved leading performance, notably attaining a Dice Coefficient of 0.974 on the Luna16 CT dataset and 0.981 on the JSRT X-ray dataset, thereby exceeding current leading methods in both qualitative and quantitative assessments.
1. Introduction
Medical imaging techniques, particularly Magnetic Resonance Imaging (MRI) and Computed Tomography (CT), play a critical role in clinical diagnosis and rehabilitation therapy. Nevertheless, conventional manual diagnostic approaches are increasingly inadequate for the demands of contemporary medical imaging. Consequently, computer-aided diagnostic systems utilizing medical image analysis have drawn significant interest. A pivotal procedure within this domain is the delineation of regions of interest (ROIs) [1]. The COVID-19 outbreak has inflicted substantial damage on global social and economic progress [2]. In this context, CT imaging has emerged as a preferred technique for detecting pulmonary conditions, including COVID-19. Precise segmentation of lung areas from CT scans can support clinicians in disease identification and contribute to controlling viral transmission [3]. Yet, achieving accurate lung segmentation in CT images remains difficult owing to challenges like low texture clarity, insufficient contrast, and variations in anatomical presentation and positioning. Sample CT images from public datasets provided in Figure 1 illustrate the intricate nature of lung segmentation in computer-aided diagnostic systems.

Figure 1.
Representative cases from three datasets, displaying original images alongside segmented lung regions. The figure is arranged into three columns, exhibiting samples from the Luna16, Montgomery County, and JSRT datasets, respectively.
Medical image segmentation plays a pivotal role in the area of image processing, and there is a wealth of research being undertaken to heighten the precision and efficacy of these techniques. Segmentation methodologies can mainly be classified into two types according to their detection paradigms: traditional model-based strategies [4] and methods founded on Convolutional Neural Networks (CNNs) [5]. Classic techniques employ various segmentation rules, such as the Otsu method [6], Region Growing [7], and Markov Random Field [8], in the processing of medical images. Despite their computational efficiency, these traditional methods typically necessitate domain expertise and intensive tuning for particular applications or datasets, which may result in suboptimal performance when faced with complex segmentation challenges. To overcome these limitations, contemporary researchers have turned to diverse machine learning techniques aiming to improve segmentation precision due to their robust feature extraction capabilities. A case in point, Shrivastava et al. [9] introduced an enhanced K-means clustering mechanism for segmenting brain MRI images. A segmentation methodology for CT and MRI images, introduced by Pan et al. [10], leverages Bayesian analysis in combination with a region-growing approach. The work by Li et al. [11] presents a segmentation concept for medical image volumes that employs Support Vector Machines (SVMs). Although machine learning-driven methods have proven to be effective in certain contexts, the success hinged on effective feature design and choice is still critical for their overall performance. Specifically, devising powerful feature descriptors remains a formidable task for medical images characterized by subtle textural information or poor contrast, thereby setting high barriers to achieving exceptional segmentation outcomes.
In the landscape of artificial intelligence, the dawn of sophisticated computing power—particularly advancements in GPUs—has propelled the field of deep learning into a new era of innovation [12]. Networks based on deep learning have been proficient in not merely identifying but also extrapolating intricate, high-order features which are necessary for processing images across a plethora of tasks like detection [13], segmentation [14], and categorization [15]. The medical images domain, in particular, has seen a surge of deep learning-derived methods such as U-Net [16], SegNet [17], and DeepLab [18], which have all shown their advantage in carving precise image segmentations. The classification issue in medical imaging was addressed by Roth et al. through the application of 3D FCNs [19]. An efficient solution for segmenting gastric carcinoma imagery was proposed by Wang et al. in the form of Deeplab v3+, which balances accuracy and computational demand [20]. Further applications include a SegNet framework by Alqazzaz et al. for brain MRI analysis [21], and a multi-tier dense network by Shi et al. for retinal vasculature segmentation, both validated on accessible datasets [22]. Tapping into network topology, Mou et al. introduced an augmented U-Net wired with an enhanced self-attention mechanism to forge deeper, more layered feature representations [23]. The pervasive U-Net has essentially become a blueprint for a multitude of segmentation challenges, notably in the medical imaging circuit. Embracing this paradigm, the newly realized multi-level supervised network aimed at automating pulmonary segmentation subscribes to the U-Net blueprint, a testament to its proven prowess in the dissection of medical images.
To overcome these limitations, this work presents a new architecture designed with multi-level supervision to achieve more accurate lung segmentation. The framework integrates a meticulously designed MSDC (Multi-scale Dilated Convolution) module and an Attention Module. The MSDC module is embedded within each branch of the U-Net architecture’s short-cut part, allowing it to capture comprehensive edge features. Concurrently, the attention component is engineered to amplify the fusion of spatial information to meticulously delineate the lung regions on CT scans. Based on rigorous experiments conducted across three publicly available CT lung image datasets, MSDC-AM U-Net exhibits formidable segmentation performance, standing in favorable comparison with the forefront of current segmentation techniques.
Although the proposed network is built upon the U-Net architecture, its originality stems from the novel integration of a Multi-Scale Dilated Convolution (MSDC) module and a multi-branch Attention Module (AM) within a hierarchically supervised learning framework. The MSDC module captures multi-scale contextual features through dilated convolutions with varying receptive fields, which is particularly effective for lung boundaries with low contrast. The AM employs three distinct spatial attention branches to capture cross-dimensional dependencies, a design not commonly seen in existing attention mechanisms. Furthermore, the multi-level supervision strategy with trainable loss weights allows the model to adaptively focus on features from different depths, enhancing edge preservation and localization precision. The salient contributions articulated in this paper encapsulate the following:
- 1.
- We propose a new lung image segmentation method. This method combines the idea of multi-level supervision to calculate the multi-stage losses in the feature fusion process, and takes the sum of multi-stage losses with different weights as the prediction result.
- 2.
- Compared to other algorithm models, the innovation of our algorithm model mainly focuses on two modules: Multi-Scale Dilated Convolution module and the Attention Module. The MSDC module utilizes convolutional layers with different receptive fields to extract features at different scales, increasing lung region contrast in the image. The Attention Module utilizes three different dimensions of attention methods to enhance the lung region in the image.
- 3.
- Our algorithm has achieved good results not only on the CT dataset, but also on other X-ray datasets.
This paper is structured as follows. Section 2 presents a comprehensive survey of existing works in the field of medical image segmentation. Section 3 elaborates on our proposed architecture by explaining in depth the multi-level supervised network, with particular emphasis on the intricacies of the MSDC module and the attention mechanisms employed. Section 4 discusses the methodology applied to validate our approach and reports on the findings from experiments conducted using three different lung image datasets that are openly accessible. Following this, in Section 5, we delve into a discussion about the practical adoption and integration of lung segmentation techniques into clinical workflows. We draw this paper to a close in Section 6 with our concluding remarks and a perspective on avenues for future investigation within the realm of medical image segmentation.
2. Related Work
Numerous approaches for image segmentation grapple with achieving high-precision delineations, mainly due to the attenuation of information through pooling steps and the insufficient handling of local contextual details. To address these issues, a plethora of network models aimed at augmenting the segmentation prowess were proposed. A common dichotomy in network design broadly groups these methodologies into two categories: single-branch and multi-branch architectures.
2.1. Single-Branch-Based Models
Single-branch models primarily focus on architectural refinement and optimization strategies—such as feature fusion, attention mechanisms, and deep supervision—to improve segmentation performance. For instance, Zhou et al. proposed the U-Net++ framework, which utilizes nested skip pathways to effectively aggregate multi-scale features [24]. In retinal vessel segmentation, a hybrid model was introduced to address the variable signal-to-noise ratios across vascular structures [25]. Dou et al. designed a network that captures multi-scale contextual information to enhance segmentation accuracy in low-resolution brain MRI scans [26]. Similarly, Gu et al. developed a context encoding network to extract discriminative features while reducing spatial information loss during down-sampling [27]. Despite these advances, such models can still be limited by insufficient information flow and restricted receptive fields, which may compromise detection precision. More recently, a U-Net-based attentional approach integrating multi-head and cross-channel attention mechanisms has been applied to segment lung regions from X-ray images [28].
2.2. Multiple-Branch-Based Models
Multi-branch architectures in medical image segmentation enhance model performance by establishing richer information pathways. To improve the delineation of fine details, Valanarasu et al. developed KiU-Net for multiscale imagery [29], and Wang et al. proposed W-Net for small structures [30]. The challenge of color variation in nuclei segmentation was addressed by Zhao et al. through Triple U-Net, which interlaces branches for feature integration [31]. Similarly, to improve information flow, Zhuang et al. designed LadderNet [32], and Jha et al. created Double U-Net to capture broader semantic information [33]. Further innovations include a Double Attention Res-UNet optimized with a Dingo Optimization algorithm for feature enhancement [34], and a modified V-Net that incorporates selective kernel modules with soft attention for multi-scale feature extraction [35]. Ref. [36] proposes ConTriNet, a robust triple-flow network that employs a “divide-and-conquer” strategy to effectively integrate modality-specific and modality-complementary information for RGB-Thermal Salient Object Detection, enhancing performance against modality disparities and defective samples.
Departing from the aforementioned methodologies, this paper introduces an innovative multi-level supervised lung segmentation network that is anchored in the U-Net framework. The strategy embeds a supervisory module at the base of four distinct branches during the decoding phase, dedicated to preserving the integrity of edge details specific to lung regions in CT scans. Concurrently, an attention mechanism woven into the skip connection stages assists in mitigating background distractions, hence sharpening the network’s concentration on lung features within the CT images. To further refine the model’s segmentation finesse on testing datasets, a dynamically weighted fusion of the supervisory losses from each branch is employed throughout the training process.
3. The Proposed Method
The method introduced here is designed to enhance the precision in the segmentation of lung regions within CT scans, and it primarily encompasses two pivotal components: a multi-level supervision framework and an attention-based module. Initially, we explain the architecture of MSDC-AM U-Net followed by a detailed exposition of the model’s training process.
3.1. Network Architecture
The overall architecture of our proposed method, depicted in Figure 2, builds upon the U-Net backbone while introducing several key enhancements. To aid in interpreting the diagram, we provide this detailed overview. The network follows a symmetric encoder–decoder structure with skip connections. The encoder pathway (left side) processes the input image through a series of 3 × 3 convolutional layers and down-sampling operations, progressively extracting features while reducing spatial dimensions. The decoder pathway (right side) performs the reverse operation through up-sampling and convolution, gradually reconstructing the segmentation mask.

Figure 2.
The pipeline of MSDC-AM U-Net. MSDC and AM denote the Multi-Scale Dilated Convolution and Attention Module, respectively. Each convolutional layer is parameterized as kernel size × kernel size × channels. Left (Encoder): Processes the input CT image through consecutive 3 × 3 convolutional layers and max-pooling operations, extracting features at multiple scales. Right (Decoder): Reconstructs the segmentation mask through up-sampling and 3 × 3 convolutional layers, progressively restoring spatial resolution. Color-Coded Pathways: Black color: Represent the flow of attention-weighted features from the encoder to the decoder through the enhanced skip connections. Red color: Indicate the up-sampled features flowing upward through the decoder pathway.
Our key innovations are integrated into the skip connections: MSDC modules are embedded at multiple levels to capture multi-scale contextual information; AM modules are combined with MSDC in deeper layers to enhance focus on lung regions; The color-coded pathways distinguish between different feature types: black for attention-weighted skip connections and red for up-sampled decoder features
To further refine the focus on relevant lung regions and to improve edge detection around the lung contours, the network employs multi-resolution ground truth (GT) mask images at the end of each decoder branch. These GT mask images enable a multi-level supervision strategy, through which the network hones in on the lung areas with iterative precision. The MSDC module, in tandem with additional convolutional layers, processes the concatenated feature map within each respective branch, producing mask images that undergo comparative analysis with GT mask images to extract enhanced lung region edge details.
Employing pre-trained parameters improves the model’s segmentation accuracy—a method that has garnered widespread validation across various image processing methodologies. Challenging the convention of single-step edge retrieval, our new approach stacks supervised operations at different depths within the baseline network. This structured approach effective filters out noise and incrementally zeroes in on lung edge-related regions, furnishing the network with a multi-level supervisory signal that enriches its focus on the lung areas.
We also calibrate the objective function by assigning distinct weightage to the loss contributions from each branch. Considering the comparative discriminative features derived from higher network layers, more substantial weightage is placed on losses associated with these elevated-feature layers. Through rigorous experimentation and parameter optimization, we have identified an ideal set of initial values that deliver optimal performance.
3.2. The Multi-Scale Dilated Convolution (MSDC) Module
Accurate localization of lung areas across scales requires the integration of multi-scale contextual features. A common solution involves employing convolutional layers with different kernel sizes. Inspired by this, we designed the MSDC module, which incorporates multiple dilated convolutions to act as advanced filters capable of capturing a wider spectrum of contextual information. The structure of the MSDC module is depicted in Figure 3.

Figure 3.
Detailed structure of the Multi-Scale Dilated Convolution (MSDC) and Attention Module (AM). The MSDC (within the red dotted box) captures multi-scale context, while the AM (within the blue dotted box) comprises two sub-components: a Spatial Attention Block (green) and a Recalibration Attention Block (orange).
To diversify feature representations, the MSDC module combines three dilated convolutional layers with dilation rates of 6, 12, and 18, together with a standard convolutional layer. These four parallel branches work in concert to extract multi-scale features, denoted as . However, the feature maps generated by each branch may lack global contextual coherence. To address this, a global average pooling layer is incorporated, thereby engendering enhanced contextual features . Moreover, we apply a convolution layer to reduce computational demands.
The feature map is computed through a series of operations defined by:
In this formulation, corresponds to global average pooling, refers to a convolution, and indicates up-sampling using bilinear interpolation to resize the features back to the original dimensions of .
The scale-aware feature representation is then produced by combining multiple feature maps:
where the symbol + denotes channel-wise concatenation, and again represents a convolutional layer.
3.3. The Attention Module (AM)
The accurate segmentation of lung regions in CT images is often complicated by complex anatomical backgrounds, where irrelevant tissues can distract the model. To address this, we introduce an Attention Module (AM) designed to suppress background interference and adaptively focus computational resources on the pulmonary structures. As illustrated in Figure 3, the AM operationalizes this through two sequential components: a Spatial Attention Block, which identifies where the important lung regions are located across the image, and a Soft Attention Block, which refines how features are weighted within those regions to enhance local discriminability.
3.3.1. Spatial Attention Block
The Spatial Attention Block aims to generate a holistic attention map that highlights the spatial extent of the lungs. Its key innovation lies in using three parallel branches (, , and ) to capture complementary cross-dimensional interactions. This multi-branch design ensures that contextual relationships between Height–Width, Height–Channel, and Width–Channel dimensions are all considered, leading to a more robust spatial attention map.
Branch is designed to capture relationships between the Width and Channel dimensions. To achieve this, the input feature map F with a size of (where C, H, and W represent Channel, Height, and Width dimensions) is rotated 90° counterclockwise about the H-axis. This rotation effectively aligns the Width and Channel dimensions for subsequent pooling and convolution operations, allowing the branch to learn how feature patterns across different channels correlate with spatial positions along the width. Branch captures relationships between the Height and Width dimensions—the standard spatial plane. It processes the input feature F in its original orientation, focusing on the classic spatial correlations within the image. Branch is designed to capture relationships between the Height and Channel dimensions. The input is rotated 90° counterclockwise about the W-axis, aligning the Height and Channel dimensions for analysis.
In each branch, the (rotated) feature undergoes parallel average- and max-pooling to create a compact context descriptor, followed by a convolution and sigmoid activation to generate a branch-specific attention weight map. The final, comprehensive spatial attention feature is obtained by summing the outputs of all three branches (after restoring their original orientation), effectively fusing the cross-dimensional cues:
3.3.2. Soft Attention Block
While the Spatial Attention Block effectively identifies the general lung region, the internal appearance of the lungs (e.g., vasculature, potential pathologies) is non-uniform. The Soft Attention Block acts as a feature refiner that works upon the spatially attended features. It generates a pixel-wise weight map that performs a final, detailed recalibration. This process adaptively accentuates salient structures within the lung area (like vessel boundaries) and suppresses less informative areas, further boosting the model’s ability to distinguish fine details. The final refined output is computed as:
where × denotes element-wise multiplication. This step ensures that the model not only focuses on the correct location but also hones in on the most critical features within that location for precise segmentation.
3.4. Loss Function
The overall loss function in our framework combines a weighted IoU loss and a weighted binary cross-entropy loss . The loss at each decoder branch, denoted as , is formulated as:
This composite loss integrates both global and local supervision signals to enhance segmentation accuracy. Unlike standard IoU loss, the weighted variant applied here emphasizes challenging pixels by assigning them higher weights, thereby focusing learning effort on diagnostically ambiguous regions. Similarly, the weighted BCE loss prioritizes difficult-to-classify pixels over easier ones, diverging from the uniform weighting in conventional BCE. Both loss formulations align with established practices in object detection, as referenced in Ref. [37], and have proven effective in segmentation contexts.
Our model incorporates supervisory signals from four decoder branches, with the corresponding losses labeled to . Since features from higher-level layers typically possess greater discriminative power, we assign progressively increasing weights to losses from deeper branches. To automate and optimize this weighting, we introduce a set of trainable loss weights , , , and .
These weights are initialized with the values = 0.1, = 0.2, = 0.3, and = 0.4. reflecting our prior assumption that deeper branches should initially contribute more. Crucially, these weights are implemented as trainable parameters of the model and are optimized via backpropagation using the same Adam optimizer that updates the network’s convolutional weights. The gradients with respect to these loss weights are computed from the final aggregated loss itself, allowing the model to learn the optimal contribution of each supervision level directly from the data.
To maintain training stability and prevent gradient explosion, the raw weights are normalized at each forward pass to sum to one. The final aggregated loss is computed as:
This adaptive weighting strategy allows the model to dynamically balance the influence of each branch’s supervisory signal throughout the training process, leading to more robust convergence.
3.5. Training Details
All experiments were implemented using PyTorch 1.10.0 with CUDA 11.6 support, running on a Quadro RTX 8000 GPU (48 GB memory). Proper parameter initialization proved crucial for successful segmentation performance. Considering GPU memory constraints, the batch size was empirically set to 4. Model optimization employed the Adam algorithm with an initial learning rate of 1 × 10⁻⁴, maintained over 400 training epochs to ensure adequate convergence.
Experimental results confirm that integrating both the MSDC module and soft attention mechanism yields significant improvements in segmentation accuracy. Comparative evaluations against state-of-the-art methods on benchmark medical imaging datasets demonstrate our approach’s superior performance. The proposed modules collectively enhance the model’s segmentation precision, establishing a new performance level on the evaluated datasets.
4. Experiments
4.1. Datasets
The proposed network was evaluated using several publicly accessible lung image datasets containing corresponding ground-truth segmentation masks, ensuring a comprehensive assessment of its performance across diverse imaging sources.
Luna16 Dataset: Originally released through the Kaggle Data Science Bowl, this dataset includes both 2D and 3D lung CT scans with expert-annotated lung masks. Our experiments utilized the 2D subset, comprising 267 images at a resolution of pixels.
Montgomery County X-ray Dataset: This publicly accessible dataset, provided by the U.S. National Library of Medicine, contains 138 posterior–anterior chest X-ray images at a native resolution of 4892 × 4020 pixels [38]. The collection includes studies from 58 patients with tuberculosis manifestations and 80 healthy controls. All images were resized to 256 × 256 pixels to facilitate efficient training.
JSRT Dataset: Curated by the Japanese Society of Radiological Technology [39], this dataset consists of 247 chest radiographs with a resolution of 1024 × 1024 pixels. Each image was similarly rescaled to 256 × 256 pixels for model training.
Given the moderate scale of these datasets, we adopted a standard 8:2 training–test split. Furthermore, 5% of the training samples were reserved for validation to support model selection and avoid overfitting. Key characteristics of each dataset are summarized in Table 1.

Table 1.
Overview of the three benchmark datasets.
4.2. Evaluation Metrics
To comprehensively assess the model’s performance across different datasets, we adopted four standard evaluation metrics: Sensitivity (), Accuracy (), Jaccard Similarity Coefficient (), and Dice Coefficient (). These metrics are formally defined as follows:
where P and G denote the predicted and ground truth segmentation regions, respectively. The terms (true positive), (true negative), (false positive), and (false negative) represent the fundamental components of the confusion matrix used in binary classification.
4.3. Experiments Results
The performance of the proposed segmentation model is evaluated through both qualitative and quantitative assessments.
4.3.1. Results on Luna16 Dataset
Performance Comparison: To evaluate the efficacy of our multi-level supervised network, we conducted comparative experiments on the Luna16 dataset against various contemporary segmentation methods, including both traditional model-based and deep learning-based approaches.
As summarized in Table 2, MSDC-AM U-Net achieves competitive results across key evaluation metrics. The proposed model yields superior performance in terms of (), Accuracy (), and Sensitivity () compared to other methods.
Table 2.
Segmentation performance on the Luna16 dataset. The best score for each metric is shown in bold. A dash (“—”) is used when a result was not provided in the original reference.
It is noteworthy that while MSDC-AM U-Net achieves the highest Dice Coefficient (0.974) and Accuracy (0.989), its Sensitivity (0.969) is marginally lower than that of R-UNet (0.973). We acknowledge that in medical diagnosis, a lower Sensitivity, indicating a higher false negative rate (i.e., missed lung regions), warrants careful consideration. We attribute this slight trade-off primarily to our model’s strong emphasis on boundary precision and specificity, which is reflected in its high Dice and Accuracy scores. The multi-level supervision and attention mechanisms are designed to reduce false positives at ambiguous boundaries, which can sometimes lead to more conservative segmentation in extremely low-contrast regions, potentially at the cost of a minimal reduction in Sensitivity. However, it is important to note that in clinical practice, minimizing false positives is also crucial to prevent over-segmentation and unnecessary subsequent analysis. The Dice Coefficient and Jaccard Index, which balance both false positives and false negatives, are often considered more comprehensive metrics for segmentation quality, and our model excels in these. Furthermore, the absolute difference in Sensitivity is very small (0.004), and MSDC-AM U-Net still maintains a highly competitive Sensitivity value above 0.96.
Ablation Study: To systematically evaluate the contribution of each proposed component, we conducted a progressive ablation study on the Luna16 dataset in Table 3. Starting from a standard U-Net as our baseline, we incrementally integrated our core innovations.
Table 3.
Summary of ablation study results on the Luna16 dataset.
First, adding the MSDC module to the baseline resulted in a clear improvement, with the Dice Coefficient increasing from 0.965 to 0.968. This confirms the MSDC module’s effectiveness in capturing multi-scale contextual features, which is crucial for resolving ambiguous boundaries. Next, integrating the Attention Module (AM) on top of the MSDC-enhanced model further boosted the Dice score to 0.971. This demonstrates the AM’s role in suppressing background interference and focusing the network’s capacity on salient pulmonary structures. Finally, incorporating the Multi-level Supervision mechanism yielded the highest performance across all metrics, achieving a Dice Coefficient of 0.974.
Qualitative Analysis: To visually evaluate the segmentation performance, Figure 4 presents a series of test cases from the Luna16 dataset, with a specific emphasis on challenging scenarios such as low-contrast boundaries, irregular lung shapes, and the presence of adjacent anatomical structures with similar intensities.
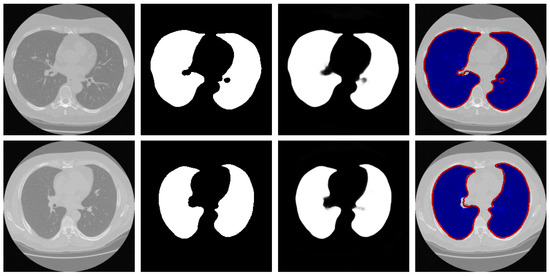

Figure 4.
Representative samples from the testing phase. From left to right: input image, ground truth mask, predicted segmentation, and the difference map between prediction and ground truth. The red arrows in the third and fourth rows of the first column in the figure represent difficult recognition areas, the red arrows in the second column represent corresponding ground truth image edge areas, and the red arrows in the third column represent difficult recognition edges in the predicted image. The blue area in the fourth column represents the predicted areas, and the red part represents the ground truth contour.
The results demonstrate that our model generates segmentation masks with crisp boundaries and accurate anatomical alignment. Crucially, as highlighted in the third and fourth rows of Figure 4, the network maintains high precision even in regions where the contrast between lung tissue and the surrounding pleura is very low—a common failure point for many segmentation methods. The difference maps (rightmost column) are included to provide a comprehensive view of the discrepancies, which are minimal and predominantly located at the most subtle boundaries, thus underscoring the overall high accuracy of our method.
These visual observations corroborate the quantitative findings and confirm the model’s robustness in handling the inherent complexities of lung CT segmentation.
4.3.2. Results on Montgomery County X-Ray Dataset
Performance Comparison: We conducted a comprehensive evaluation of the proposed lung segmentation model by comparing it against several state-of-the-art segmentation methods on the Montgomery County X-ray dataset. The comparative results, detailed in Table 4, clearly demonstrate the superior performance of our multi-level supervised network across all key evaluation metrics, including the Dice score (), Jaccard Index (), and Accuracy ().
Table 4.
Comparative results on the Montgomery County X-ray dataset. The best-performing metric values are shown in bold. A dash (“—”) is used where results were not available from the corresponding reference.
The experimental findings reveal that our proposed approach achieves significantly higher scores compared to other segmentation techniques, with particularly notable improvements in boundary delineation and consistency across diverse cases. For instance, MSDC-AM U-Net attained a Dice score of 0.972, outperforming the closest competitor by 0.5 percentage points. This performance advantage is consistent across all metrics, underscoring the robustness of our architecture.
These results not only confirm the effectiveness of our proposed model but also highlight its strong generalization capability to X-ray imaging modality. The superior performance can be attributed to the synergistic effect of the multi-level supervision mechanism, which preserves fine-grained details, and the Attention Module that effectively suppresses background interference. The consistent outperformance across different evaluation metrics establishes MSDC-AM U-Net as a competitive solution for medical image segmentation tasks, particularly in challenging scenarios with limited contrast and complex anatomical backgrounds.
Furthermore, the model’s ability to maintain high accuracy on X-ray images, which present different characteristics compared to CT scans, demonstrates its versatility and potential for broader clinical applications.
Ablation Study: A systematic ablation study was performed to evaluate the individual contributions of each component within our proposed framework on the Montgomery County dataset in Table 5.
Table 5.
Summary of ablation study results on the Montgomery County X-ray dataset.
Starting from the U-Net baseline (Dice: 0.962), the incremental addition of the MSDC module improved the Dice score to 0.966 (+0.4%), demonstrating its effectiveness in enhancing feature representation for X-ray images. Subsequent integration of the Attention Module further increased performance to 0.969 (+0.3% over the MSDC-only model), validating its role in focusing computational resources on pulmonary structures while suppressing irrelevant thoracic background. The complete MSDC-AM U-Net with multi-level supervision achieved the best performance of 0.972 (+0.3% over the model without supervision), highlighting the importance of hierarchical supervision in preserving edge details in X-ray imagery.
Notably, the performance gains on this X-ray dataset, while consistent, were slightly more modest than those observed on CT datasets. We attribute this to the inherent challenges of X-ray imaging, including projectional superimposition of anatomical structures and lower inherent contrast compared to CT. Nevertheless, the clear progressive improvement with each added component confirms their individual and collective value across imaging modalities.
Qualitative Analysis: Figure 5 illustrates the segmentation outputs for the Montgomery County X-ray dataset. Visual examination reveals strong agreement between the model’s predictions and the reference annotations. The model successfully navigates these complexities, accurately separating the lung fields from the mediastinum and the diaphragm, as evidenced by the clean segmentation boundaries in the third column. Crucially, as highlighted in the third and fourth rows of Figure 5, the network maintains high precision even in regions where the contrast between lung tissue and the surrounding pleura is very low. The difference maps show only sporadic and minor errors, primarily in the costophrenic angles where boundaries are inherently faint, confirming the model’s high operational reliability for clinical X-ray imaging.

Figure 5.
Sample results from the testing set. From left to right: original image, ground truth, predicted segmentation mask, and the difference map. The red arrows in the third and fourth rows of the first column in the figure represent difficult recognition areas, the red arrows in the second column represent corresponding ground truth image edge areas, and the red arrows in the third column represent difficult recognition edges in the predicted image. The blue area in the fourth column represents the predicted areas, and the red part represents the ground truth contour.
4.3.3. Results on JSRT Dataset
Performance Comparison: To comprehensively assess the proposed multi-level supervised network, we benchmarked its performance against several advanced segmentation methods on the JSRT dataset, including both classical model-based approaches and contemporary CNN-based architectures. The comparative results are summarized in Table 6.
Table 6.
Comparative results on the JSRT dataset. The best-performing values are emphasized in bold. A dash (“—”) indicates cases where results were not provided in the original work.
As shown in Table 6, MSDC-AM U-Net achieves superior performance on both evaluation metrics—the Dice score () and Jaccard Index ()—surpassing all compared approaches. These results demonstrate the model’s robust capability in accurately delineating lung regions, confirming its state-of-the-art performance on the JSRT dataset and validating the effectiveness of our architectural design for medical image segmentation tasks.
Ablation Study: We performed a detailed ablation study on the JSRT dataset to evaluate the individual contributions of each proposed component. The results, summarized in Table 7, reveal particularly impressive gains on this dataset.
Table 7.
Ablation analysis of the proposed model on the JSRT dataset.
The standard U-Net baseline achieved a Dice score of 0.951 on the JSRT dataset. The addition of the MSDC module alone provided a substantial improvement of +2.1%, increasing the Dice score to 0.972. This significant gain suggests that the multi-scale contextual features captured by the MSDC module are especially beneficial for the high-resolution JSRT radiographs. The subsequent integration of the Attention Module further enhanced performance by +0.4% to 0.976, demonstrating its effectiveness in refining feature focus. Most notably, the incorporation of the multi-level supervision mechanism yielded the largest improvement of +0.5%, resulting in the final Dice score of 0.981 for our full model.
Qualitative Analysis: Figure 6 presents qualitative results from the JSRT dataset to visually assess the segmentation performance. The visualization includes test images, corresponding ground truth, model predictions, and difference maps for comparative analysis.

Figure 6.
Qualitative segmentation results on sample test cases. From left to right: original image from the test dataset, corresponding ground-truth mask, segmentation result generated by the proposed model, and difference map between the ground truth and prediction. The red arrows in the third and fourth rows of the first column in the figure represent difficult recognition areas, the red arrows in the second column represent corresponding ground truth image edge areas, and the red arrows in the third column represent difficult recognition edges in the predicted image. The blue area in the fourth column represents the predicted areas, and the red part represents the ground truth contour.
Visual inspection confirms that the proposed network generates lung masks with well-defined boundaries that closely align with anatomical structures. In most cases, the segmentation results show strong agreement with ground truth annotations, demonstrating the model’s capability to accurately identify pulmonary regions in CT images.
While the overall performance is satisfactory, certain challenging cases reveal limitations in boundary delineation, particularly in regions with low contrast or pathological alterations. These occasional discrepancies highlight opportunities for further refinement and suggest that clinical applications may benefit from optional manual correction in critical scenarios. The visual evidence thus validates the model’s effectiveness while acknowledging areas for future improvement.
4.4. Convergence Behavior Analysis
To thoroughly assess the training dynamics and check for potential overfitting, we monitored the segmentation loss curves throughout the training process across all three datasets. Figure 7 illustrates the training and validation loss curves recorded at 10-epoch intervals over the complete 400-epoch training period.

Figure 7.
Segmentation loss curves for three lung segmentation datasets (training and validation loss over 400 epochs).
Notably, all datasets show that the validation loss closely tracks the training loss, with no significant divergence observed even after 400 epochs. This convergence pattern confirms that our multi-level supervision strategy with adaptive loss weighting effectively prevents overfitting while maintaining robust learning across different imaging modalities. The stable behavior across CT (Luna16) and X-ray (Montgomery County, JSRT) datasets further demonstrates the generalization capability of our proposed architecture.
Figure 6 shows segmentation loss curves for Luna16, Montgomery County, and JSRT datasets, showing training and validation losses recorded at 10-epoch intervals over 400 training epochs. The consistent convergence and minimal gaps between training and validation losses indicate stable learning without overfitting.
4.5. Module Configuration
This Section mainly discusses the impact of different attention module structures on the final results of the MSDC-AM U-Net on the Luna16 dataset.
From Table 8, it can be seen that different convolution kernel sizes have an impact on the results. We tested four different combinations of convolution kernels, and from the results, the combination we used achieved the best performance. However, from the data perspective, the difference between the various combinations ({3, 5, 7}, {5, 7, 9}, and {7, 9, 11}) is not significant. Especially, the numerical difference between the first three combinations is relatively small.
Table 8.
Performance comparison of different kernel sizes on Luna16 dataset.
We also tested the number of branches for feature fusion. In the Proposed Method section, we employed three branches for fusion, and in this section, we compare the differences in performance between two-branch fusion and three-branch fusion. From Table 9, we can see that the parameters for the fusion of the two branches are the same as our proposed AM. In the process of merging two branches, the combination of Branch2 + Branch3 has the best accuracy, but compared with the combination of three branches, the accuracy is not high.
Table 9.
Performance of different branch combinations in the Attention Module on the Luna16 dataset.
4.6. Computational Complexity Analysis
To assess the practical efficiency of the proposed model, we compared its computational complexity directly with the standard U-Net baseline. All models were profiled under identical conditions (PyTorch 1.10.0, Quadro RTX 8000) with an input size of 256 × 256. The results are summarized in Table 10.
Table 10.
Computational complexity comparison with U-Net baseline (input size: 256 × 256).
As detailed in the table, the incorporation of the MSDC and AM modules leads to an increase in model size and computational demand compared to the standard U-Net. Specifically, our MSDC-AM U-Net contains 36.7 million parameters, an 18.4% increase over the standard U-Net (31.0M). In practical terms, the average inference time per image for our model is 12.5 ms, which is 27.6% slower than U-Net’s 9.8 ms but remains highly feasible for real-time clinical applications. The GPU memory footprint during training with a batch size of 4 is 4.1 GB, compared to 3.2 GB for the baseline. This analysis confirms that the significant performance gains achieved by our model (1% increase in Dice Coefficient on the Montgomery county X-ray dataset and 3.1% increase in Dice Coefficient on the Montgomery county X-ray dataset) are attained with a reasonable and practically acceptable computational overhead. The results demonstrate a favorable trade-off between accuracy and efficiency for clinical deployment.
4.7. Statistical Validation Analysis
All quantitative results reported in this section are the mean ± standard deviation of the evaluation metrics obtained from a 5-fold cross-validation study, ensuring a statistically robust assessment. To quantify the significance of the performance improvement, paired t-tests were conducted to compare the Dice Coefficient of our proposed MSDC-AM U-Net against the standard U-Net baseline across the five folds. The resulting p-values are reported in Table 11.
Table 11.
Results are presented as mean ± standard deviation from 5-fold cross-validation.
Evaluations on several public lung imaging datasets via 5-fold cross-validation confirm that the proposed approach exceeds current leading methods. Our MSDC-AM U-Net achieved a mean Dice Coefficient of 0.974 ± 0.002 on the Luna16 dataset, with the improvement over the U-Net baseline being statistically significant.
5. Discussion
Accurate segmentation of lung regions from CT images remains challenging due to issues such as low contrast and ambiguous anatomical boundaries. This study aims to develop a robust and precise lung segmentation framework to overcome these difficulties.
Unlike traditional model-based techniques, deep learning approaches provide end-to-end solutions and have shown remarkable success across various vision tasks. In medical image analysis, architectures like U-Net and its variants have delivered encouraging segmentation results. Nevertheless, these models often struggle to achieve high segmentation fidelity, primarily due to restricted receptive fields and insufficient preservation of boundary details.
To overcome these constraints, we introduce a multi-level supervised network incorporating a dedicated supervision mechanism and an Attention Module. The multi-level supervision scheme is designed to capture features at various scales, thereby improving the model’s ability to resolve fine boundary structures. Simultaneously, the attention component enhances feature discrimination by dynamically weighting spatial locations, suppressing irrelevant background regions while emphasizing pulmonary areas.
Ablation experiments confirm that both components contribute significantly to segmentation accuracy. However, the method occasionally faces difficulties in cases where lung tissue exhibits textural similarities to adjacent anatomical structures, indicating an area for future refinement. Furthermore, as noted in the results, the model’s design, which prioritizes boundary accuracy, leads to a slight trade-off in sensitivity compared to some other methods. This highlights a fundamental balance in medical image segmentation between being inclusive (high sensitivity) and precise (high boundary accuracy). The optimal point in this balance may depend on the specific clinical task. These observations underscore the potential of the proposed approach while also highlighting the inherent challenges in fully automated lung segmentation.
6. Conclusions
This paper presents MSDC-AM U-Net, a novel multi-level supervised network architecture designed to address the challenges of lung segmentation in CT images, particularly those arising from weak contrast and ambiguous boundaries. The proposed framework integrates two key components: a multi-level supervision mechanism that captures multi-scale contextual information through diverse receptive fields, and an Attention Module that dynamically adjusts spatial weights to prioritize pulmonary structures.
Experimental validation across three public datasets demonstrates the accuracy and robustness of the MSDC-AM U-Net. The model achieved a Dice Coefficient of 0.974 and a Jaccard Index of 0.949 on the Luna16 CT dataset, and consistently high performance on the JSRT (Dice: 0.981, Jaccard: 0.968) and Montgomery County X-ray (Dice: 0.972, Jaccard: 0.946) datasets. These results confirm the architecture’s capability to effectively handle the complexities inherent in thoracic imaging, including low contrast and anatomical variability, across different imaging modalities.
Despite the promising results, the proposed MSDC-AM U-Net has certain limitations that warrant discussion and present opportunities for future research. Firstly, the model’s performance can be suboptimal in the presence of severe pathological anomalies that drastically alter the lung’s shape or texture, such as large pleural effusions or advanced consolidation, which were not prevalent in the used datasets. The model was primarily trained on data with relatively intact lung anatomy, and its ability to generalize to grossly abnormal cases requires further validation on more diverse clinical datasets. Secondly, while the multi-level supervision and attention mechanisms improve accuracy, they also increase the model’s computational complexity compared to a standard U-Net. This could be a consideration for deployment in resource-constrained environments. Future work could focus on model compression or knowledge distillation techniques to enhance inference efficiency without significantly compromising performance. Thirdly, as noted in the results, the model’s design, which emphasizes boundary precision, can lead to a slight trade-off in sensitivity in extremely low-contrast regions. Exploring dynamically weighted loss functions that adaptively balance the penalty for false negatives and false positives during training could be a viable path to mitigate this. Finally, the current work is focused on 2D segmentation. While this is effective for many diagnostic tasks, a natural and significant extension is to develop a 3D version of the architecture to leverage volumetric contextual information, which could further improve segmentation consistency across adjacent slices and help in segmenting structures with strong 3D continuity.
For future work, we plan to explore several directions to enhance the model’s clinical applicability: extending the framework to 3D segmentation tasks to leverage volumetric context, improving generalization across diverse imaging protocols and pathological cases, and integrating anatomical constraints to ensure topological plausibility. These advancements will contribute to developing more reliable computer-aided diagnostic systems for pulmonary medicine.
Author Contributions
Y.W. (Yahao Wen) conceived the experiments, conducted the experiments, performed the software development, carried out the formal analysis, performed the investigation, provided the resources, and was responsible for visualization, supervision, and funding acquisition. Y.W. (Yahao Wen) and Y.W. (Yongjie Wang) were involved in validation. Y.W. (Yahao Wen) and Y.W. (Yongjie Wang) prepared the original draft of the manuscript. All authors have read and agreed to the published version of the manuscript.
Funding
This research received no external funding.
Data Availability Statement
The datasets generated and/or analyzed during the current study are not publicly available due to privacy concerns and their intended use in a commercial software database but are available from the corresponding author on reasonable request.
Conflicts of Interest
Author Yahao Wen was employed by the company ChinaComm System Co., Ltd. The remaining authors declare that the research was conducted in the absence of any commercial or financial relationships that could be construed as a potential conflict of interest.
References
- Rizwan, I.; Haque, I.; Neubert, J. Deep learning approaches to biomedical image segmentation. Inform. Med. Unlocked 2020, 18, 100297. [Google Scholar] [CrossRef]
- Nafisah, S.I.; Muhammad, G. Tuberculosis detection in chest radiograph using convolutional neural network architecture and explainable artificial intelligence. Neural Comput. Appl. 2024, 36, 111–131. [Google Scholar] [CrossRef]
- Alzubaidi, M.; Zubaydi, H.D.; Bin-Salem, A.A.; Abd-Alrazaq, A.A.; Ahmed, A.; Househ, M. Role of deep learning in early detection of covid-19: Scoping review. Comput. Methods Programs Biomed. Update 2021, 1, 100025. [Google Scholar] [CrossRef]
- Patil, D.D.; Deore, S.G. Medical image segmentation: A review. Int. J. Comput. Sci. Mob. Comput. 2013, 2, 22–27. [Google Scholar]
- Tajbakhsh, N.; Jeyaseelan, L.; Li, Q.; Chiang, J.N.; Wu, Z.; Ding, X. Embracing imperfect datasets: A review of deep learning solutions for medical image segmentation. Med. Image Anal. 2000, 63, 101693. [Google Scholar] [CrossRef]
- Bindu, C.H.; Prasad, K.S. An efficient medical image segmentation using conventional otsu method. Int. J. Adv. Sci. Technol. 2013, 38, 67–73. [Google Scholar]
- Kaushik, D.; Singh, U.; Singhal, P.; Singh, V. Medical image segmentation using genetic algorithm. Int. J. Comput. Appl. 2013, 81, 10–15. [Google Scholar] [CrossRef]
- Nguyen, T.M.; Wu, Q.M.J. A fuzzy logic model based markov random field for medical image segmentation. Evol. Syst. 2013, 4, 171–181. [Google Scholar] [CrossRef]
- Ng, H.P.; Ong, S.H.; Foong, K.; Goh, P.; Nowinski, W.L. Medical image segmentation using k-means clustering and improved watershed algorithm. In Proceedings of the IEEE Southwest Symposium on Image Analysis and Interpretation, Denver, CO, USA, 26–28 March 2006; pp. 61–65. [Google Scholar]
- Pan, Z.; Lu, J. A bayes-based region-growing algorithm for medical image segmentation. Comput. Sci. Eng. 2007, 9, 32–38. [Google Scholar] [CrossRef]
- Li, S.; Fevens, T.; Krzy˙zak, A. A svm-based framework for autonomous volumetric medical image segmentation using hierarchical and coupled level sets. Int. Congr. Ser. 2004, 1268, 207–212. [Google Scholar] [CrossRef]
- Yann LeCun, Y.B.; Hinton, G. Deep learning. Nature 2015, 9, 32–38. [Google Scholar]
- Zhao, Z.Q.; Zheng, P.; Xu, S.T.; Wu, X. Object detection with deep learning: A review. IEEE Trans. Neural Netw. Learn. Syst. 2019, 9, 3212–3232. [Google Scholar] [CrossRef] [PubMed]
- Minaee, S.; Boykov, Y.; Porikli, F.; Plaza, A.; Kehtarnavaz, N.; Terzopoulos, D. Image segmentation using deep learning: A survey. IEEE Trans. Pattern Anal. Mach. Intell. 2022, 44, 3523–3542. [Google Scholar] [CrossRef] [PubMed]
- Rawat, W.; Wang, Z. Deep convolutional neural networks for image classification: A comprehensive review. Neural Comput. 2017, 29, 2352–2449. [Google Scholar] [CrossRef] [PubMed]
- Ronneberger, O.; Fischer, P.; Brox, T. U-net: Convolutional networks for biomedical image segmentation. In Proceedings of the 18th International Conference on Medical Image Computing and Computer-Assisted Intervention, Munich, Germany, 5–9 October 2015; pp. 234–241. [Google Scholar]
- Badrinarayanan, V.; Kendall, A.; Cipolla, R. Segnet: A deep convolutional encoder-decoder architecture for image segmentation. IEEE Trans. Pattern Anal. Mach. Intell. 2017, 39, 2481–2495. [Google Scholar] [CrossRef]
- Chen, L.; Zhu, Y.; Papandreou, G.; Schroff, F.; Adam, H. Encoder-decoder with atrous separable convolution for semantic image segmentation. In Proceedings of the European Conference on Computer Vision (ECCV), Munich, Germany, 8–14 September 2018; pp. 801–818. [Google Scholar]
- Roth, H.R.; Oda, H.; Zhou, X.; Shimizu, N.; Yang, Y.; Hayashi, Y.; Oda, M.; Fujiwara, M.; Misawa, K.; Mori, K. An application of cascaded 3d fully convolutional networks for medical image segmentation. Comput. Med. Imaging Graph. 2018, 66, 90–99. [Google Scholar] [CrossRef]
- Wang, J.; Liu, X. Medical image recognition and segmentation of pathological slices of gastric cancer based on deeplab v3+ neural network. Comput. Methods Programs Biomed. 2021, 207, 106210. [Google Scholar] [CrossRef]
- Alqazzaz, S.; Sun, X.; Yang, X.; Nokes, L. Automated brain tumor segmentation on multi-modal mr image using segnet. Comput. Vis. Medium 2019, 2, 5. [Google Scholar] [CrossRef]
- Shi, Z.; Wang, T.; Huang, Z.; Xie, F.; Liu, Z.; Wang, B.; Xu, J. Md-net: A multi-scale dense network for retinal vessel segmentation. Biomed. Signal Process. Control 2021, 70, 102977. [Google Scholar] [CrossRef]
- Mou, L.; Zhao, Y.; Fu, H.; Liu, Y.; Cheng, J.; Zheng, Y.; Su, P.; Yang, J.; Chen, L.; Frangi, A.F.; et al. Cs2-net: Deep learning segmentation of curvilinear structures in medical imaging. Med. Image Anal. 2021, 67, 101874. [Google Scholar] [CrossRef]
- Zhou, Z.; Siddiquee, M.M.R.; Tajbakhsh, N.; Liang, J. Unet++: Redesigning skip connections to exploit multiscale features in image segmentation. IEEE Trans. Med. Imaging 2020, 39, 1856–1867. [Google Scholar] [CrossRef] [PubMed]
- Yang, L.; Wang, H.; Zeng, Q.; Liu, Y.; Bian, G. A hybrid deep segmentation network for fundus vessels via deep-learning framework. Neurocomputing 2021, 448, 168–178. [Google Scholar] [CrossRef]
- Dou, H.; Karimi, D.; Rollins, C.K.; Ortinau, C.M.; Vasung, L.; Velasco-Annis, C.; Ouaalam, A.; Yang, X.; Ni, D.; Gholipour, A. A deep attentive convolutional neural network for automatic cortical plate segmentation in fetal mri. IEEE Trans. Med. Imaging 2021, 40, 1123–1133. [Google Scholar] [CrossRef]
- Gu, Z.; Cheng, J.; Fu, H.; Zhou, K.; Hao, H.; Zhao, Y.; Zhang, T.; Gao, S.; Liu, J. Ce-net: Context encoder network for 2d medical image segmentation. IEEE Trans. Med. Imaging 2019, 38, 2281–2292. [Google Scholar] [CrossRef]
- De la Sotta, T.; Chang, V.; Pizarro, B.; Henriquez, H.; Alvear, N.; Saavedra, J.M. Impact of attention mechanisms for organ segmentation in chest x-ray images over u-net model. Multimed. Tools Appl. 2024, 83, 49261–49283. [Google Scholar] [CrossRef]
- Valanarasu, J.M.J.; Sindagi, V.A.; Hacihaliloglu, I.; Patel, V.M. Kiu-net: Overcomplete convolutional architectures for biomedical image and volumetric segmentation. IEEE Trans. Med. Imaging 2022, 41, 965–976. [Google Scholar] [CrossRef]
- Wang, B.; Wang, L.; Chen, J.; Xu, Z.; Lukasiewicz, T.; Fu, Z. w-net: Dual supervised medical image segmentation model with multi-dimensional attention and cascade multi-scale convolution. arXiv 2020, arXiv:2012.03674. [Google Scholar]
- Zhao, B.; Chen, X.; Li, Z.; Yu, Z.; Yao, S.; Yan, L.; Wang, Y.; Liu, Z.; Liang, C.; Han, C. Triple u-net: Hematoxylin-aware nuclei segmentation with progressive dense feature aggregation. Med. Image Anal. 2020, 65, 101786. [Google Scholar] [CrossRef]
- Zhuang, J. Laddernet: Multi-path networks based on u-net for medical image segmentation. arXiv 2018, arXiv:1810.07810. [Google Scholar]
- Jha, D.; Riegler, M.A.; Johansen, D.; Halvorsen, P.; Johansen, H.D. Doubleu-net: A deep convolutional neural network for medical image segmentation. In Proceedings of the IEEE 33rd International Symposium on Computer-Based Medical Systems (CBMS), Rochester, MN, USA, 28–30 July 2020; pp. 558–564. [Google Scholar]
- Balamurugan, M.; Balamurugan, R. An efficient deep neural network model for tuberculosis detection using chest x-ray images. Neural Comput. Appl. 2024, 36, 14775–14796. [Google Scholar] [CrossRef]
- Wang, Z.; Men, J.; Zhang, F. Improved v-net lung nodule segmentation method based on selective kernel. Signal Image Video Process. 2023, 17, 1763–1774. [Google Scholar] [CrossRef]
- Tang, H.; Li, Z.; Zhang, D.; He, S.; Tang, J. Divide-and-Conquer: Confluent Triple-Flow Network for RGB-T Salient Object Detection. IEEE Trans. Pattern Anal. Mach. Intell. 2025, 47, 1958–1974. [Google Scholar] [CrossRef]
- Qin, X.; Zhang, Z.; Huang, C.; Gao, C.; Dehghan, M.; Jagersand, M. Basnet: Boundary-aware salient object detection. In Proceedings of the IEEE/CVF Conference on Computer Vision and Pattern Recognition (CVPR), Long Beach, CA, USA, 15–20 June 2019; pp. 7479–7489. [Google Scholar]
- Jaeger, S.; Candemir, S.; Antani, S.; Wang, Y.; Thoma, G. Two public chest x-ray datasets for computer-aided screening of pulmonary diseases. Quant. Imaging Med. Surg. 2014, 4, 475–477. [Google Scholar]
- Shiraishi, J.; Katsuragawa, S.; Ikezoe, J.; Matsumoto, T.; Kobayashi, T.; Komatsu, K.I.; Matsui, M.; Fujita, H.; Kodera, Y.; Doi, K. Development of a digital image database for chest radiographs with and without a lung nodule: Receiver operating characteristic analysis of radiologists’ detection of pulmonary nodules. Am. J. Roentgenol. 2000, 174, 71–74. [Google Scholar] [CrossRef]
- Hojjatoleslami, S.A. and Kittler, J. Region growing: A new approach. IEEE Trans. Image Process. A Publ. IEEE Signal Process. Soc. 1998, 7, 1079. [Google Scholar] [CrossRef]
- Bhargavi, P.M.; Mayee, V.; Manaswini, T.; Manvitha, S. A comparison of image segmentation techniques, otsu and watershed for x-ray images. Int. J. Res. Eng. Technol. 2015, 4, 2481–2495. [Google Scholar] [CrossRef]
- Chen, H.; Qi, X.; Yu, L.; Heng, P.-A. Dcan: Deep contour-aware networks for accurate gland segmentation. In Proceedings of the IEEE Conference on Computer Vision and Pattern Recognition (CVPR), Las Vegas, NV, USA, 27–30 June 2016; pp. 2487–2496. [Google Scholar]
- Jin, Q.; Meng, Z.; Sun, C.; Wei, L.; Su, R. Ra-unet: A hybrid deep attention-aware network to extract liver and tumor in ct scans. Front. Bioeng. Biotechnol. 2020, 8, 605132. [Google Scholar] [CrossRef]
- Xiao, X.; Lian, S.; Luo, Z.; Li, S. Weighted res-unet for high-quality retina vessel segmentation. In Proceedings of the 9th International Conference on Information Technology in Medicine and Education (ITME), Hangzhou, China, 19–21 October 2018; pp. 327–331. [Google Scholar]
- Alom, M.Z.; Hasan, M.; Yakopcic, C.; Taha, T.M.; Asari, V.K. Recurrent residual convolutional neural network based on u-net (r2u-net) for medical image segmentation. arXiv 2018, arXiv:1802.06955. [Google Scholar]
- Fu, H.; Cheng, J.; Xu, Y.; Wong, D.W.K.; Liu, J.; Cao, X. Joint optic disc and cup segmentation based on multi-label deep network and polar transformation. IEEE Trans. Med. Imaging 2017, 37, 1597–1605. [Google Scholar] [CrossRef]
- Oktay, O.; Schlemper, J.; Folgoc, L.L.; Lee, M.C.H.; Heinrich, M.P.; Misawa, K.; Mori, K.; McDonagh, S.G.; Hammerla, N.Y.; Kainz, B.; et al. Attention u-net: Learning where to look for the pancreas. arXiv 2018, arXiv:1804.03999. [Google Scholar] [CrossRef]
- Aboelenein, N.M.; Songhao, P.; Koubaa, A.; Noor, A.; Afifi, A. Httu-net: Hybrid two track u-net for automatic brain tumor segmentation. IEEE Access 2020, 8, 101406–101415. [Google Scholar] [CrossRef]
- Hu, J.; Shen, L.; Albanie, S.; Sun, G.; Wu, E. Squeeze-and-excitation networks. IEEE Trans. Pattern Anal. Mach. Intell. 2020, 42, 2011–2023. [Google Scholar] [CrossRef] [PubMed]
- Xie, Y.; Zhou, Y.; Wang, C.; Ma, Y.; Yang, M. Multi-scale feature fusion network with local attention for lung segmentation. Signal Process. Image Commun. 2023, 119, 117042. [Google Scholar] [CrossRef]
- Long, J.; Shelhamer, E.; Darrell, T. Fully convolutional networks for semantic segmentation. In Proceedings of the IEEE Conference on Computer Vision and Pattern Recognition (CVPR), Boston, MA, USA, 7–12 June 2015. [Google Scholar]
- Peng, C.; Zhang, X.; Yu, G.; Luo, G.; Sun, J. Large kernel matters—Improve semantic segmentation by global convolutional network. In Proceedings of the IEEE Conference on Computer Vision and Pattern Recognition (CVPR), Honolulu, HI, USA, 21–26 July 2017; pp. 4353–4361. [Google Scholar]
- Wang, P.; Chen, P.; Yuan, Y.; Liu, D.; Huang, Z.; Hou, X.; Cottrell, G. Understanding convolution for semantic segmentation. In Proceedings of the IEEE Winter Conference on Applications of Computer Vision (WACV), Lake Tahoe, NV, USA, 12–15 March 2018; pp. 1451–1460. [Google Scholar]
- Milletari, F.; Rieke, N.; Baust, M.; Esposito, M.; Navab, N. CFCM: Segmentation via coarse to fine context memory. In Proceedings of the International Conference on Medical Image Computing and Computer Assisted Intervention, Granada, Spain, 16–20 September 2018; pp. 667–674. [Google Scholar]
- Ammar, L.B.; Gasmi, K.; Ltaifa, I.B. Vit-tb: Ensemble learning based vit model for tuberculosis recognition. Cybern. Syst. 2024, 55, 634–653. [Google Scholar] [CrossRef]
- Alaoui Abdalaoui Slimani, F.; Bentourkia, M. Improving deep learning u-net++ by discrete wavelet and attention gate mechanisms for effective pathological lung segmentation in chest x-ray imaging. Phys. Eng. Sci. Med. 2025, 48, 59–73. [Google Scholar] [CrossRef]
- Turk, F.; Kılıc¸aslan, M. Lung image segmentation with improved u-net, v-net and seg-net techniques. PeerJ Comput. Sci. 2025, 11, 2700. [Google Scholar] [CrossRef]
- Candemir, S.; Jaeger, S.; Palaniappan, K.; Musco, J.P.; Singh, R.K.; Xue, Z.; Karargyris, A.; Antani, S.; Thoma, G.; McDonald, C.J. Lung segmentation in chest radiographs using anatomical atlases with nonrigid registration. IEEE Trans. Med. Imaging 2014, 32, 577–590. [Google Scholar] [CrossRef]
- Wu, G.; Zhang, X.; Luo, S.; Hu, Q. Lung segmentation based on customized active shape model from digital radiography chest images. J. Med. Imaging Health Inform. 2015, 11, 184–191. [Google Scholar] [CrossRef]
- Ibragimov, B.; Likar, B.; Pernus, F.; Vrtovec, T. Accurate landmark-based segmentation by incorporating landmark misdetections. In Proceedings of the IEEE 13th International Symposium on Biomedical Imaging (ISBI), Prague, Czech Republic, 13–16 April 2016; pp. 1072–1075. [Google Scholar]
- Novikov, A.A.; Lenis, D.; Major, D.; Hladvka, J.; Wimmer, M.; Buhler, K. Fully convolutional architectures for multi-class segmentation in chest radiographs. IEEE Trans. Med. Imaging 2018, 37, 1865–1876. [Google Scholar] [CrossRef]
- Chen, L.C.; Papandreou, G.; Schroff, F.; Adam, H. Rethinking atrous convolution for semantic image segmentation. arXiv 2017, arXiv:1706.05587. [Google Scholar] [CrossRef]
- Mittal, A.; Hooda, R.; Sofat, S. Lf-segnet: A fully convolutional encoder–decoder network for segmenting lung fields from chest radiographs. Wirel. Pers. Commun. 2018, 101, 511–529. [Google Scholar] [CrossRef]
- Schlemper, J.; Oktay, O.; Schaap, M.; Heinrich, M.; Kainz, B.; Glocker, B.; Rueckert, D. Attention gated networks: Learning to leverage salient regions in medical images. Med. Image Anal. 2019, 53, 197–207. [Google Scholar] [CrossRef]
- Ibrahim, N.; Puchalapalli, C. Lung field segmentation in chest radiographs from boundary maps by a structured edge detector. IEEE J. Biomed. Health Inform. 2018, 22, 842–851. [Google Scholar]
- Ibtehaz, N.; Rahman, M.S. Multiresunet: Rethinking the u-net architecture for multimodal biomedical image segmentation. Neural Netw. 2020, 121, 74–87. [Google Scholar] [CrossRef] [PubMed]


Disclaimer/Publisher’s Note: The statements, opinions and data contained in all publications are solely those of the individual author(s) and contributor(s) and not of MDPI and/or the editor(s). MDPI and/or the editor(s) disclaim responsibility for any injury to people or property resulting from any ideas, methods, instructions or products referred to in the content. |
© 2025 by the authors. Licensee MDPI, Basel, Switzerland. This article is an open access article distributed under the terms and conditions of the Creative Commons Attribution (CC BY) license (https://creativecommons.org/licenses/by/4.0/).