Article

Decentralized Dispatch Strategy for Island Microgrid Clusters Based on Historical Similarity and Offline Training

Wenzhou Power Supply Company, State Grid Zhejiang Electric Power Co., Ltd., Wenzhou 325000, China
*
Author to whom correspondence should be addressed.
Electronics 2025, 14(21), 4239; https://doi.org/10.3390/electronics14214239
Submission received: 18 September 2025 / Revised: 14 October 2025 / Accepted: 17 October 2025 / Published: 29 October 2025

Abstract

To address the issues of efficiency and real-time performance in power mutual assistance among island microgrid clusters, a two-stage decentralized dispatching optimization method combining similarity measurement with offline training and online optimization is proposed. Firstly, the power architecture of island microgrid clusters is studied, and the mathematical model of island microgrid units is established. Secondly, a centralized offline training model for island microgrid clusters with economic cost and carbon emissions as indicators is constructed, and the output states of adjustable units under different natural resource conditions are stored. Then, in actual operation, each microgrid selects the most similar historical data through similarity measurement and uses the output of controllable units as the initial dispatching value for online optimization. Finally, the effectiveness of the proposed method is verified through a practical example, reducing the dependence of island microgrid clusters on long-distance communication between islands and the mainland.

1. Introduction

Ensuring the normal power supply of numerous islands in China is an inevitable requirement for the long-term stable development of the marine economy [1,2]. The traditional power supply method for islands is to use diesel generators, but the long-term use of diesel generators will have a negative impact on the local ecological environment [3]. The “Island Protection Law of the People’s Republic of China” clearly states that priority should be given to the utilization of abundant renewable energy sources such as wind and solar energy in island areas [4]. Island microgrids can effectively and flexibly utilize renewable energy, reduce the phenomenon of wind and solar energy curtailment, and reduce the use of fossil fuel units, contributing to the realization of the dual carbon goals [5,6,7].
The grid-connected operation of island microgrids can reduce the power supply pressure within the island, share unstable factors, and ensure power supply security. However, there is a lack of power mutual assistance strategies among island microgrids, and it is necessary to establish coordination and dispatching methods between island power grids to enhance the penetration rate of renewable energy in island microgrid clusters and the reliability of power supply in island operation mode [8]. Therefore, scholars have conducted relevant research. Cunha et al., 2025 quantitatively demonstrate that clustering three microgrids reduces curtailed energy by 30% and eliminates load shedding during islanded events, thereby highlighting the economic and resilience benefits of collaborative operation [9]. Cunha et al., 2023 further review multi-microgrid architectures and identify flexible point-of-common-coupling switching, hierarchical/decentralized control, and local energy markets as key enablers for such clusters [10]. Literature [11] explored the cooperative operation of shared energy storage in multiple island microgrid systems. To optimize resource allocation and reduce service costs, a two-stage approach is used. The first stage focuses on optimizing profit and energy storage capacity using a modified grey wolf algorithm, while the second stage addresses revenue distribution through a game-theoretic negotiation process and the alternating direction multiplier method. The economic and reliability of the scheme were verified through simulation result. Literature [12] combined multiple adjacent island microgrids into an island cluster multi-microgrid, where each region supplies power to each other and serves as backup, effectively improving the safety and reliability of power supply. Literature [13] established an uncertainty optimization dispatching model for island multi-microgrid operation based on reliability and economic indicators, and solved it by combining the particle swarm optimization algorithm with Monte Carlo simulation. The example verified the effectiveness and rationality of the proposed dispatching strategy. The above literature has studied island microgrid clusters to varying degrees, providing important reference value for the construction of island microgrid clusters, but they have not conducted research on the control technology of island microgrid clusters in terms of the efficiency and real-time performance of power dispatching.
Microgrid cluster control technology can be divided into centralized control and distributed control. For centralized control, literature [14,15,16] considered factors such as economy, environmental protection, and voltage stability to construct multi-objective optimization dispatching models for microgrid clusters. Literature [17] studied the impact of demand response on reducing power generation losses based on economic optimization. Literature [18] constructed a hierarchical energy optimization management model for active distribution networks with the lowest operating cost of generating units at the active distribution network layer and the lowest economic and environmental costs at the multi-microgrid system layer, and conducted dynamic optimization by introducing adaptive weight coefficients. However, centralized optimization requires processing all the data and variables of the entire system, leading to a significant increase in computational complexity and time, especially when there are many and large-scale microgrids.
For distributed control, it enables independent optimization of scheduling in each region, reducing the demand for computing power and communication resources, especially when the system is large-scale and tightly coupled. References [19,20,21] proposed a dynamic economic decentralized optimization scheduling method based on the alternating direction method of multipliers (ADMM), which decoupled the power grid model into three types: equipment, terminals, and connection points, enabling independent optimization scheduling in each region and reducing the demand for computing and communication resources. Reference [22] proposed a decentralized scheduling model considering energy storage participation for the problem of high wind power accommodation, based on the synchronous ADMM algorithm, to achieve cross-regional accommodation of wind power. Reference [23] established a two-layer decentralized scheduling model for a group of microgrids based on the ADMM algorithm, where the upper layer coordinated the scheduling to minimize the total cost of the microgrid group, and the lower layer optimized the management within each microgrid. The two layers were solved alternately, reducing the communication burden of microgrids while maintaining good convergence. However, distributed scheduling based on the alternating multiplier method has a slow convergence speed when the problem scale is large or the coupling relationship of the system is strong, which seriously affects the scheduling results in the case of poor communication conditions in island microgrid groups.
In islanded microgrid clusters, communication conditions may be poor. By utilizing similarity metrics, historical states similar to the current conditions can be quickly identified during the offline optimization phase for initial value setup. Subsequent precise adjustments through online optimization reduce reliance on inter-island communication, ensuring scheduling efficiency and real-time performance. Additionally, each microgrid can rapidly locate the most similar historical data day from offline optimization results using similarity metrics, thereby shortening the solution time for scheduling plans.
In summary, the existing research has the following problems that need to be addressed: The existing methods for island microgrid clusters have not fully considered the efficiency and real-time performance of power dispatching. Centralized control methods have high computational complexity and time consumption, which are not suitable for large-scale and numerous microgrids. Distributed control methods based on ADMM have slow convergence speed when the problem scale is large or the system coupling relationship is strong, which affects the scheduling results under poor communication conditions in island microgrid groups. This paper focuses on the issues of efficiency and real-time performance of energy scheduling in island microgrid groups with long-distance communication, and conducts research on a decentralized inter-island mutual assistance scheduling model for island microgrid groups considering operation costs and carbon emissions. Firstly, the power architecture of island microgrid groups is studied, assuming that the island microgrid group includes two load islands and two resource islands, with transmission channels connecting the load islands and resource islands. Mathematical models are established for different equipment. In the construction of the optimization problem, an optimization problem considering operation costs and carbon emissions is established. In the offline training of the island microgrid group, centralized optimization is conducted with different meteorological resources as boundaries, and the output states of adjustable units under corresponding boundary conditions are stored. In actual operation, each microgrid selects the most similar historical data through similarity measurement and uses the output of controllable units as the initial scheduling value for online optimization. The proposed decentralized scheduling method is compared with independent optimization and centralized optimization methods to verify its effectiveness and reduce the dependence of island microgrid groups on long-distance communication between islands and the mainland.

2. Power Architecture and Mathematical Model of Island Microgrid Groups

Island groups are generally far from the mainland, and their power architecture mostly adopts an interconnected structure of island microgrid groups that can operate in isolation. Island microgrid systems are adapted to local conditions. Due to the different resource and load levels of different islands, the islands can be divided into two major categories: load islands and resource islands [24]. Load islands have a dense population, high load levels, and complex functions. Under normal circumstances, the power on load islands is mainly supplied by a small number of new energy generation devices, energy storage systems, and micro gas turbines. Resource islands mainly provide power to load islands. Due to their abundant renewable energy and large development space, they are equipped with a large number of wind turbines and photovoltaic and other new energy generation devices. Resource islands can use energy storage systems to store the electricity generated by wind turbines and photovoltaic systems, or transmit it to load islands through submarine cables [8].
To promote the local consumption of new energy generation in island groups and reduce transmission losses, not only can the microgrids of each island exchange electricity indirectly through the large power grid, but also they can provide mutual assistance in terms of electricity between islands [25]. Each island microgrid can interact with the microgrids of other islands in terms of energy. Only when the power of the island group is insufficient to support the operation of load islands will the power of the large power grid be used.

2.1. Modeling of Island Microgrid Units

2.1.1. Offshore Wind Turbine Devices

The output of offshore wind power is significantly influenced by sea wind conditions. Considering the different impacts of terrain, climate, and season on sea wind compared to land wind, non-parametric distribution is used to fit the sea wind speed. This method has a high requirement for the quality of historical wind speed data. The formula can be expressed as:
v = v 0 ln h 0 ln s 0 ln h w ln s 0
where v and v0 are the wind speeds at the height of the offshore wind turbine hub and the reference height of the offshore wind farm respectively; hw and h0 are the heights of the offshore wind turbine hub and the reference height of the offshore wind farm respectively; s0 is the surface roughness of the actual marine state.
The relationship between the sea wind speed v and the wind turbine output can be seen in the following formula:
P w v = 0 v < v i a w v 2 + b w v + c w v i < v < v n P n v n < v < v o 0 v o < v
where Pw is the output power of the wind turbine; vi is the cut-in wind speed, vn is the rated wind speed, vo is the cut-out wind speed; Pn is the rated power of the wind turbine; aw, bw and cw can be obtained by fitting the historical data of sea wind speed and the power characteristic curve of the wind turbine.

2.1.2. Photovoltaic Devices

The output power of a photovoltaic power station is determined by the photovoltaic power generation efficiency and the global horizontal irradiance (GHI). The calculation methods for photovoltaic power generation efficiency and photovoltaic output power are as follows:
T c = T a + T r 20 800 G H I
η P V = η r e f 1 + γ T c T r e f
P P V = η P V G H I A P V 1000
where Tc and Ta are the photovoltaic temperature and the ambient temperature respectively; Tr and Tref are the rated operating temperature and the photovoltaic reference temperature of the photovoltaic cell, set at 45 °C and 25 °C respectively; GHI is the global horizontal irradiance; ηPV and ηref are the photovoltaic power generation efficiency and the photovoltaic power generation efficiency under standard conditions respectively; γ is the photovoltaic temperature coefficient; PPV is the photovoltaic output power; APV is the area of the photovoltaic plane.

2.1.3. Gas Turbine Devices

The calculation model of micro gas turbine needs to consider the upper and lower limit constraints of its output, ramping constraints and efficiency equations. The calculation model of micro gas turbine is as follows:
P m g t min P m g t t P m g t max
Δ P m g t d o w P m g t t P m g t t 1 Δ P m g t u p
η m g t = a g P m g t 2 + b g P m g t + c g
where P mgt min and P mgt max are the upper and lower limit power of the micro gas turbine respectively; Pmgt is its time series output power; P mgt dow and P mgt up are the ramping rates of output reduction and output increase respectively; t is the operating cycle of gas turbine devices; ηmgt is the efficiency of the gas turbine; ag, bg and cg are the coefficients of the quadratic fitting between efficiency and output power.

2.1.4. Battery

High-efficiency and high-energy-density lithium batteries are used as energy storage elements. The charging state of the electrical energy storage system determines its ability to absorb or provide electrical energy. At any given moment, the charging state of the electrical energy storage system is determined by the previous charging state and the charging and discharging quantities, and needs to be limited within a certain range. In addition, the energy storage battery cannot charge and discharge simultaneously, and the charging and discharging power is limited within the maximum power range. The calculation model of the electrical energy storage system is as follows:
S O C B E S S t = S O C B E S S t 1 1 σ B E S S +   P B E S c h a t η B E S c h a P B E S d i s t η B E S d i s Δ t E B E S max
S O C B E S min S O C B E S S t S O C B E S max
0 P B E S c h a t , P B E S d i s t P B E S max
where SOCBESS is the charge state of the battery energy storage system; t is the operating cycle of battery; SOC BES min and SOC BES max are the minimum and maximum charge states respectively; σBESS is the hourly self-discharge efficiency; P BES cha and P BES dis are the charging power and discharging power respectively; P BES max is the maximum discharging power; η BES cha and η BES dis are the charging efficiency and discharging efficiency respectively; E BES max is the maximum storage state.

2.1.5. Seawater Desalination Load

Seawater desalination load, as a controllable load, can assist in regulating the power of the microgrid. According to the water demand of island residents and the capacity limit of the water storage tank, the power range of the seawater desalination device required to meet the water demand of residents in a certain future period can be calculated. The simplified calculation model of the seawater desalination device is as follows:
P w a t e r = Q w
t = 1 N w t = M
where Pwater is the required electrical power of the seawater desalination system; Q is the electricity required to produce a unit volume of fresh water; N is the serial number of the seawater desalination device; w is the fresh water production rate; t is the operating cycle of seawater desalination device; M is the total daily fresh water demand.

2.1.6. Electric Vehicle Load

The prediction of electric vehicle charging load is the basis of the day-ahead dispatch of the microgrid. In this study, based on the statistical survey of the travel results of private vehicles in the literature, the starting time of each sample electric vehicle’s grid connection charging is generated by sampling different numbers of samples from the fitted probability distribution function. The calculation model is as follows:
f T t = 1 2 π σ t e t β t 2 2 σ t 2 β t 12 t 24 1 2 π σ t e t + 24 β t 2 2 σ t 2 0 t β t 12
where fT is the probability density function of the daily connection probability and the starting time of the electric vehicle; βt and σt are the parameters of the fitted normal distribution function; t is the Electric vehicle grid connected charging time.
Then, the total load of electric vehicle charging is determined by the number of electric vehicles charging at each moment and the charging duration of the electric vehicles, where the charging duration is a proportional function of the daily driving distance of the electric vehicles. The calculation model is as follows:
f L L = 1 2 π L σ L e ln L β L 2 2 σ L 2
T e s v = L E e s v P e s v r e f
P e s v t = n t P e s v r e f
where fL is the probability density function of the daily driving distance of electric vehicles; L is the driving distance of electric vehicles; Tesv is the charging duration of electric vehicles; Eesv and P esv ref are the power consumption per kilometer and the rated charging power of electric vehicles respectively; Pesv is the total load curve of electric vehicles; n is the number of electric vehicles charging at each moment.

2.1.7. Distribution Network

The distribution network can provide additional electric power for multiple microgrid clusters. Its expression is as follows:
P G min P G t P G max
P G = P l o a d + P e s v + P w a t e r P B E S d i s   P m g t P P V P w i = 1 , i j x P i , j
where PG is the electric power provided by the distribution network; P G min and P G max are the minimum and maximum values of the electric power provided by the distribution network respectively; t is the time period; Pload is the daily life load power; Pi,j is the interaction power between microgrid i and Microgrid j.

3. Distributed Scheduling Model of Microgrid Clusters

The distributed scheduling model of island microgrid clusters proposed in this study adopts a combination of offline training and online optimization. In the offline training stage, the microgrid clusters first perform centralized optimization based on a large amount of historical data, and store the output states of the adjustable units and the corresponding natural resource conditions. In the online optimization stage, the similarity between the wind and photovoltaic resources of each microgrid is measured, and the most similar historical data day is found from the offline optimization results. The output of the controllable units is taken as the initial scheduling value, and each microgrid is separately subjected to online optimization. Finally, an optimized scheduling plan for the island microgrid clusters is provided.
Compared with the traditional distributed optimization scheduling method, the method proposed in this paper selects the most similar historical data through similarity measurement in the offline optimization stage as the initial scheduling value for online distributed optimization, which shortens the solution time of the scheduling plan and reduces the dependence on inter-island communication, ensuring the efficiency and real-time performance of the scheduling.

3.1. Offline Training Centralized Optimization Model

In the offline training stage, the historical 365 days of wind speed and photovoltaic power generation data of 4 microgrids are used for centralized optimization to obtain the daily output time series of the controllable units of each microgrid and store them. The optimization objective comprehensively considers the minimization of system operation cost Feco and carbon emissions Fco2.
min   F e c o + γ F C O 2
F e c o = t = 1 24 i = 1 4 C B E S P B E S S , i d i s t + C W P W , i t + C P V P P V , i t + C m g t P m g t , i t + C G P G , i t
F e c o = t = 1 24 i = 1 4 a B E S S P B E S , i d i s t + a W P W , i t + a P V P P V , i t + a m g t P m g t , i t + a G P G , i t
where CPV, CW, CBESS, Cmgt and CG are the unit operation costs of photovoltaic equipment, wind turbines, energy storage batteries, micro gas turbines and the distribution network respectively; aPV, aW, aBESS, amgt and aG are the carbon emission coefficients of the corresponding equipment; γ is the proportionality factor for the comprehensive economic and carbon emission optimization; PPV,i(t), PW,i(t), P BES dis ,i(t), Pmgt,i(t) and PG,i(t) are the power of the i-th corresponding equipment at time t. The corresponding values are selected as shown in the following Table 1 and Table 2.

3.2. Online Distributed Optimization Model

3.2.1. Similarity Measurement

To quickly retrieve the most analogous historical scenario from the offline library, three widely-used distance measures were evaluated on the 365-day data set: Euclidean distance (ED); Manhattan distance (MD); Dynamic time warping (DTW).
Accuracy was quantified by the day-ahead scheduling-cost error relative to the fully centralized solution, while efficiency was assessed by the average retrieval time on a 3.4 GHz desktop. Table 3 summarises the results. ED achieves virtually the same accuracy as DTW (error < 0.02%) but consumes only 4.3% of the computation time and requires no parameter tuning or extra storage. MD is marginally faster than ED, yet its error is five times higher. Consequently, ED was selected as the online similarity metric.
The Euclidean distance is calculated as:
D d = i = 1 4 t = 1 24 P W , i t P W , i r e f d , t 2 + P P V , i t P P V , i r e f d , t 2
where D is the calculated Euclidean distance; d is the corresponding day in the offline training data, and the d with the smallest similarity measurement is selected as the reference day; PW,iref and PPV,iref are the wind and photovoltaic resources of each day in the offline training data respectively.

3.2.2. Optimization Objective

In actual operation, each microgrid is separately subjected to online optimization. To make the optimization results tend to the centralized optimization results, a penalty function is introduced for the output deviation of the adjustable units (micro gas turbines, electrical energy storage devices) based on the output status of the reference day in the optimization objective function. The optimization objective of each microgrid is as follows:
min λ t = 1 24 P e s b t P e s b r e f t + P m g t t P m g t r e f t +   F e c o , i + γ F C O 2 , i
where λ is the penalty coefficient for the deviation of the output of the adjustable units (micro gas turbines, electrical energy storage devices) from the reference day operation status; Pesb and Pmgt respectively represent the output of the energy storage device and the micro gas turbine; P esb ref and P mgt ref respectively represent the output of the energy storage device and the micro gas turbine on the reference day.

3.3. Two-Stage Decentralized Dispatch Model Solving Process for Island Microgrid Clusters

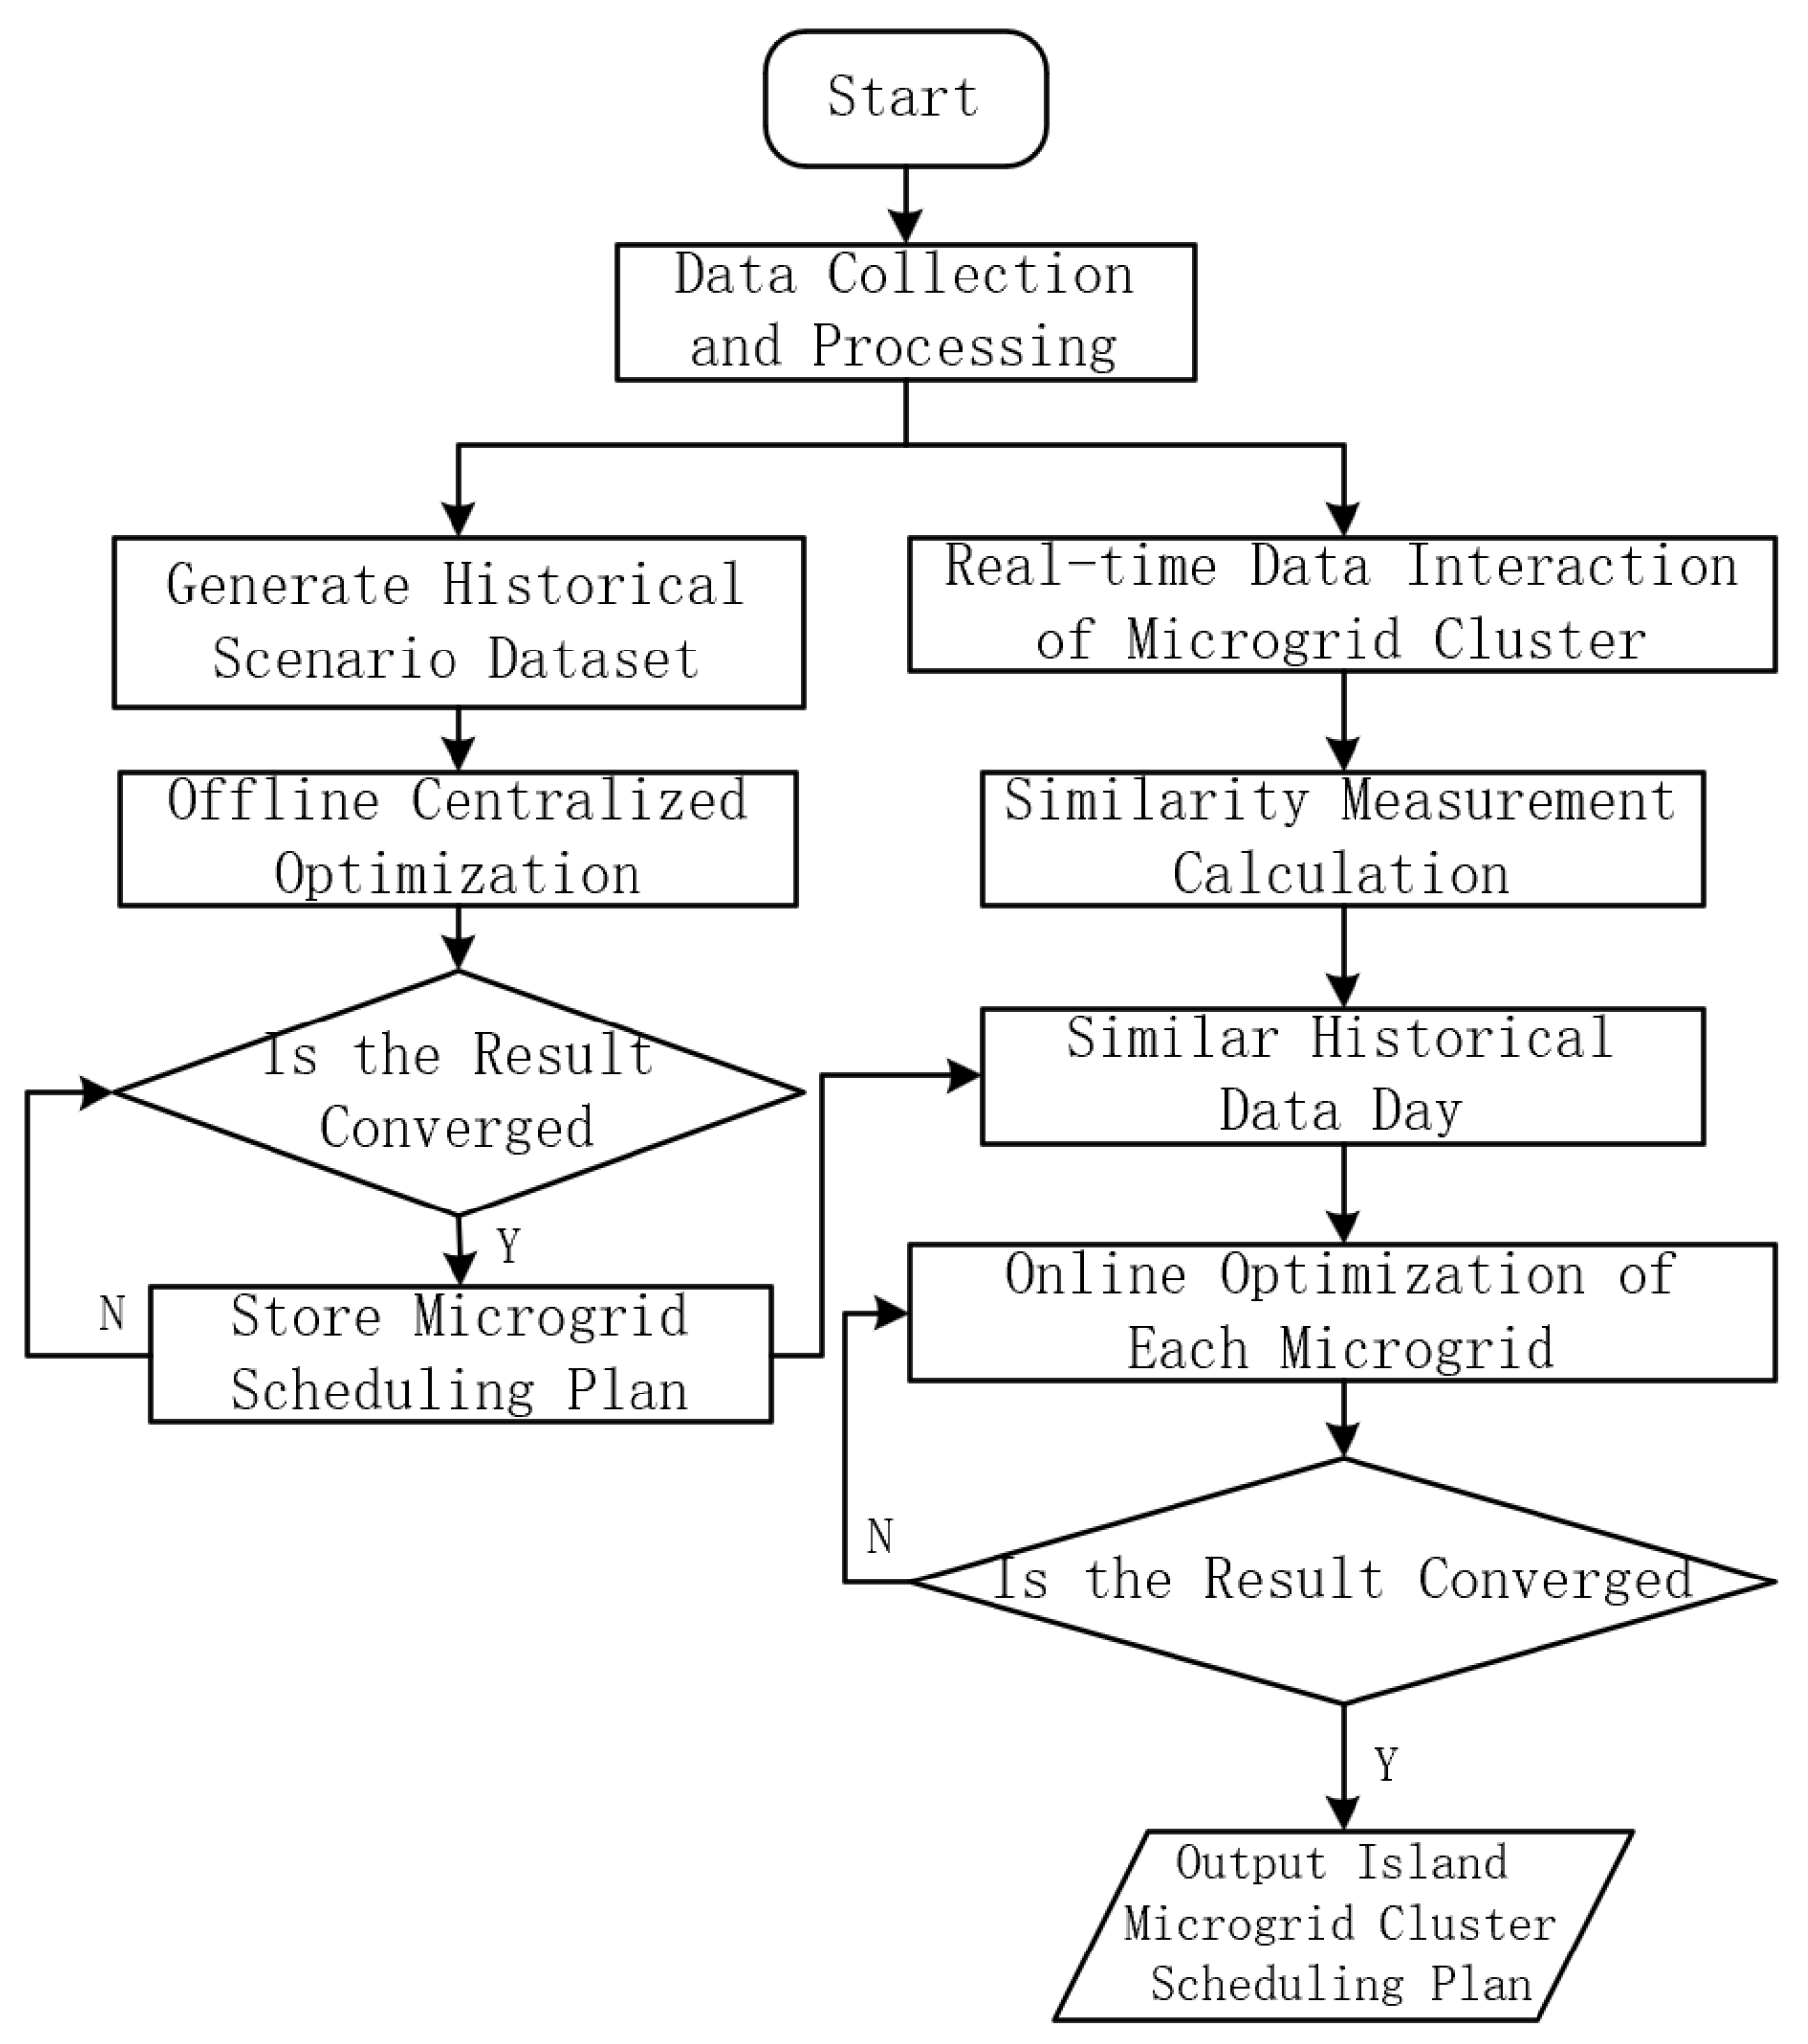
As shown in Figure 1, the two-stage decentralized dispatch model for the island microgrid cluster starts with the data collection and processing phase. It begins by generating a historical scenario dataset for offline centralized optimization, determining whether the results converge, and storing the microgrid cluster dispatch plan if convergence is achieved. Simultaneously, real-time data interaction within the microgrid cluster is conducted, followed by similarity metric calculations to filter out similar historical datasets. Each microgrid then performs online optimization based on these datasets, reassessing convergence, and ultimately outputs the island microgrid cluster dispatch plan. This process transitions from a global centralized optimization perspective to a localized real-time distributed collaborative optimization, effectively balancing dispatch precision and computational efficiency. It combines scientific rigor with practical feasibility, addressing the complex operational requirements of island microgrid clusters and providing robust support for energy management.

4. Case Study Analysis

4.1. Basic Data

This paper takes the island microgrid cluster system, which contains 4 microgrids, as an example for case simulation. The 4 microgrids system used in this study is a synthetic test case constructed to reflect the typical scale and resource mix of small–medium island clusters. The optimization period is set to 24 h, with a time interval of 1 h, and the maximum power of the interconnection lines between microgrids is 1400 kW. In the offline training, the collected 365-day data was used, and the Matlab R2023a was adopted with Gurobi 10.0.2 for solving. The time series output of the micro gas turbine and the electrical energy storage obtained from the solution was stored along with the corresponding wind and solar data.
The penalty coefficient λ balances operational cost and the deviation from the reference day. To determine an appropriate value, we performed a sensitivity analysis on the 4-microgrid system with λ varying from 0.01 to 1.0. Table 4 reports the averaged results over ten random days. When λ < 0.1 the ADMM convergence slows (iteration number > 80) and the total cost slightly increases because the adjustable units deviate too far from the reference. When λ > 0.1 the iteration number continues to fall but the total cost starts to rise owing to over-restrictive penalties. λ = 0.1 gives the knee point of the cost-iteration trade-off and is therefore adopted in the case study. A sensitivity analysis confirmed that the chosen penalty coefficient λ = 0.1 provides the best trade-off between solution accuracy and computational efficiency.
To verify scalability, the proposed two-stage method was further tested on two larger clusters: a 10-microgrid system and a 30-microgrid system, both generated by replicating the original 4-microgrid topology and keeping the same island-to-island connection density (average node degree ≈ 2.3). Table 5 lists the key indicators. The offline training stage is centrally executed only once and its time grows linearly with the number of microgrids. Online optimization is fully parallel; the wall-clock time shown in Table 5 is measured when all sub-problems run on a 3.4 GHz/8 GB desktop using MATLAB + Gurobi. Communication demand per microgrid is proportional to the number of physical neighbours, not to the total cluster size; therefore the ADMM penalty term converges in almost the same number of iterations (≈45–50) for 4-, 10- and 30-microgrid cases. Even for a 100-microgrid cluster the estimated online time is <5 min, which is still acceptable for day-ahead scheduling.

4.2. Analysis of Optimization Results

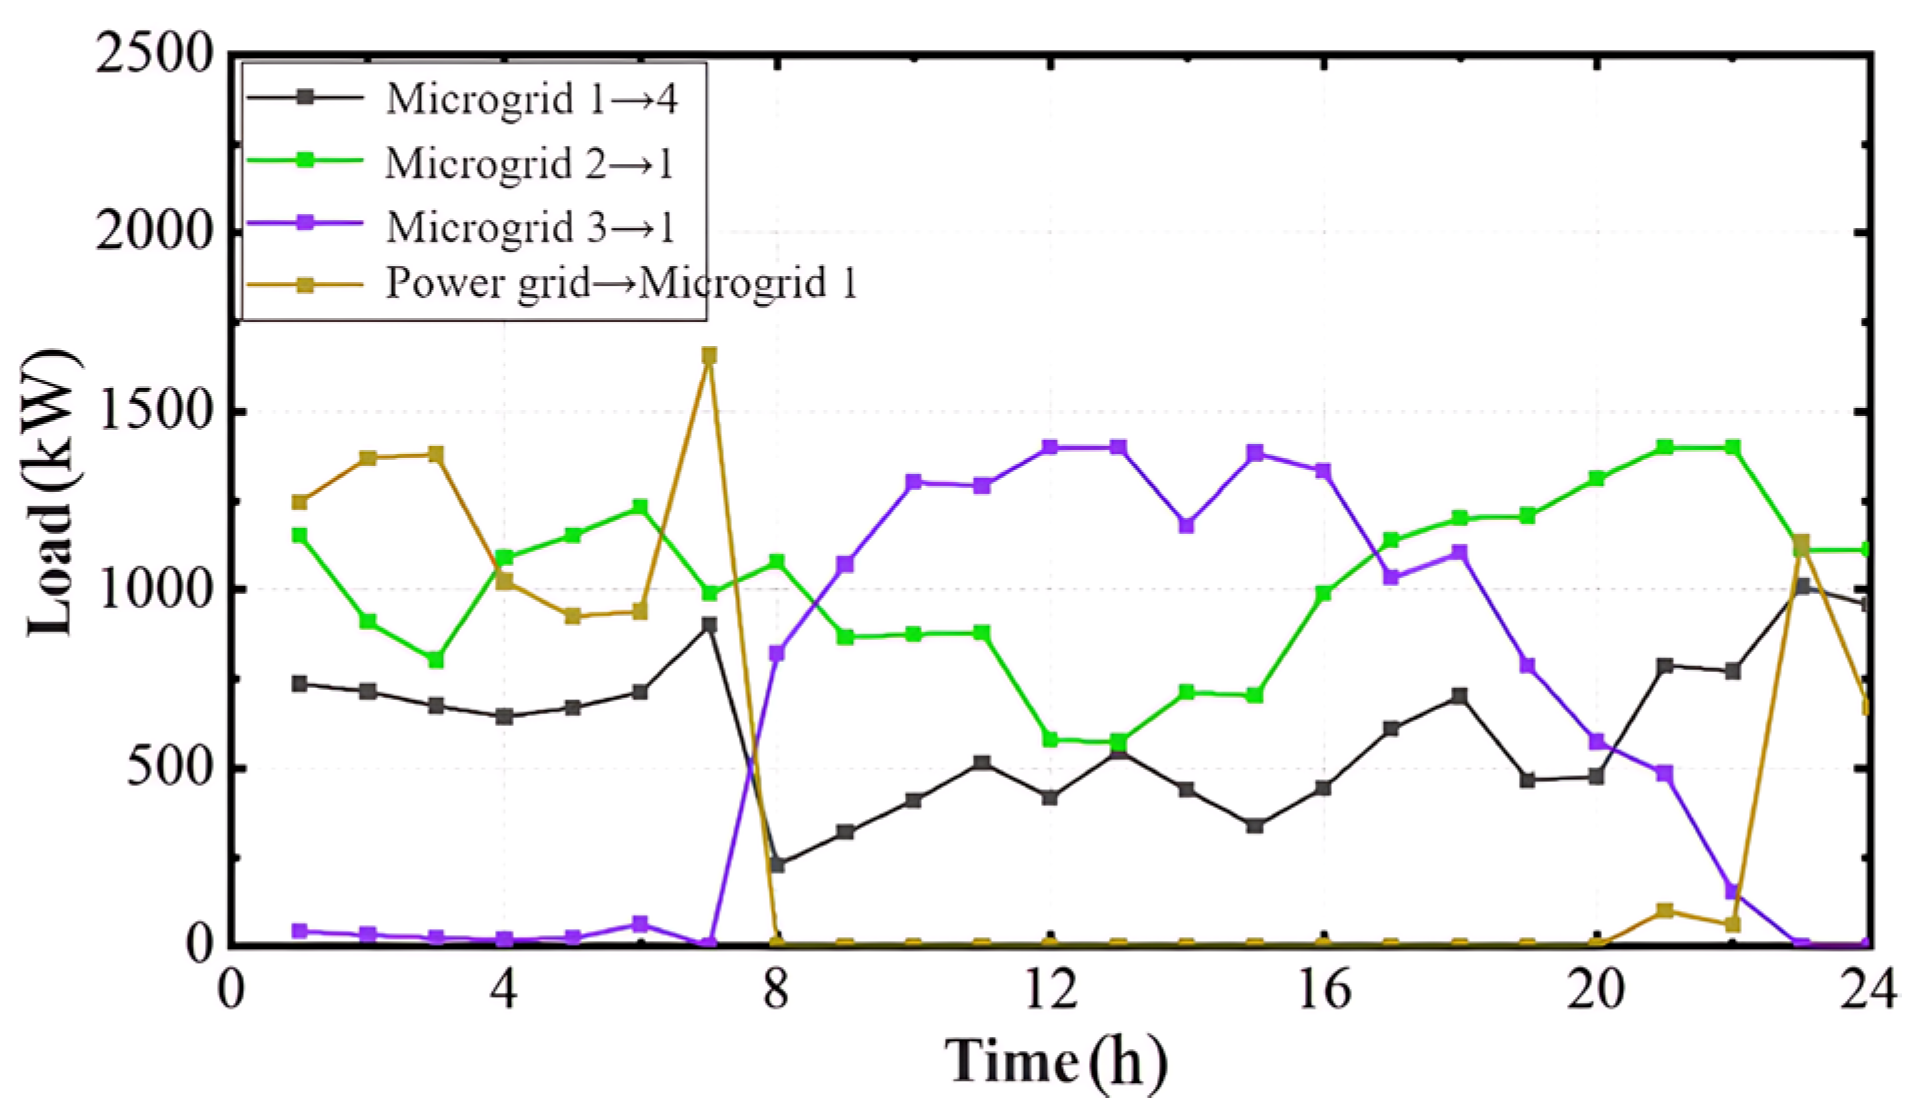
The interaction power among the microgrids obtained through optimization is shown in Figure 2. It can be observed that due to the concentration of photovoltaic resources during the daytime, the power transferred from Microgrid 3 to Microgrid 1 is mainly concentrated between 10:00 and 18:00, and the energy storage system releases some of the photovoltaic energy stored during the day in the evening. Compared to photovoltaic resources, wind resources are distributed throughout the day, and Microgrid 2 supplies power to Microgrid 1 throughout the day. Meanwhile, due to the abundant wind and photovoltaic resources in Microgrid 2 and Microgrid 3, the load demands of Microgrid 1 are largely met through inter-microgrid mutual assistance, allowing Microgrid 1 to meet its load demands without purchasing electricity from the main grid from 8:00 to 22:00.
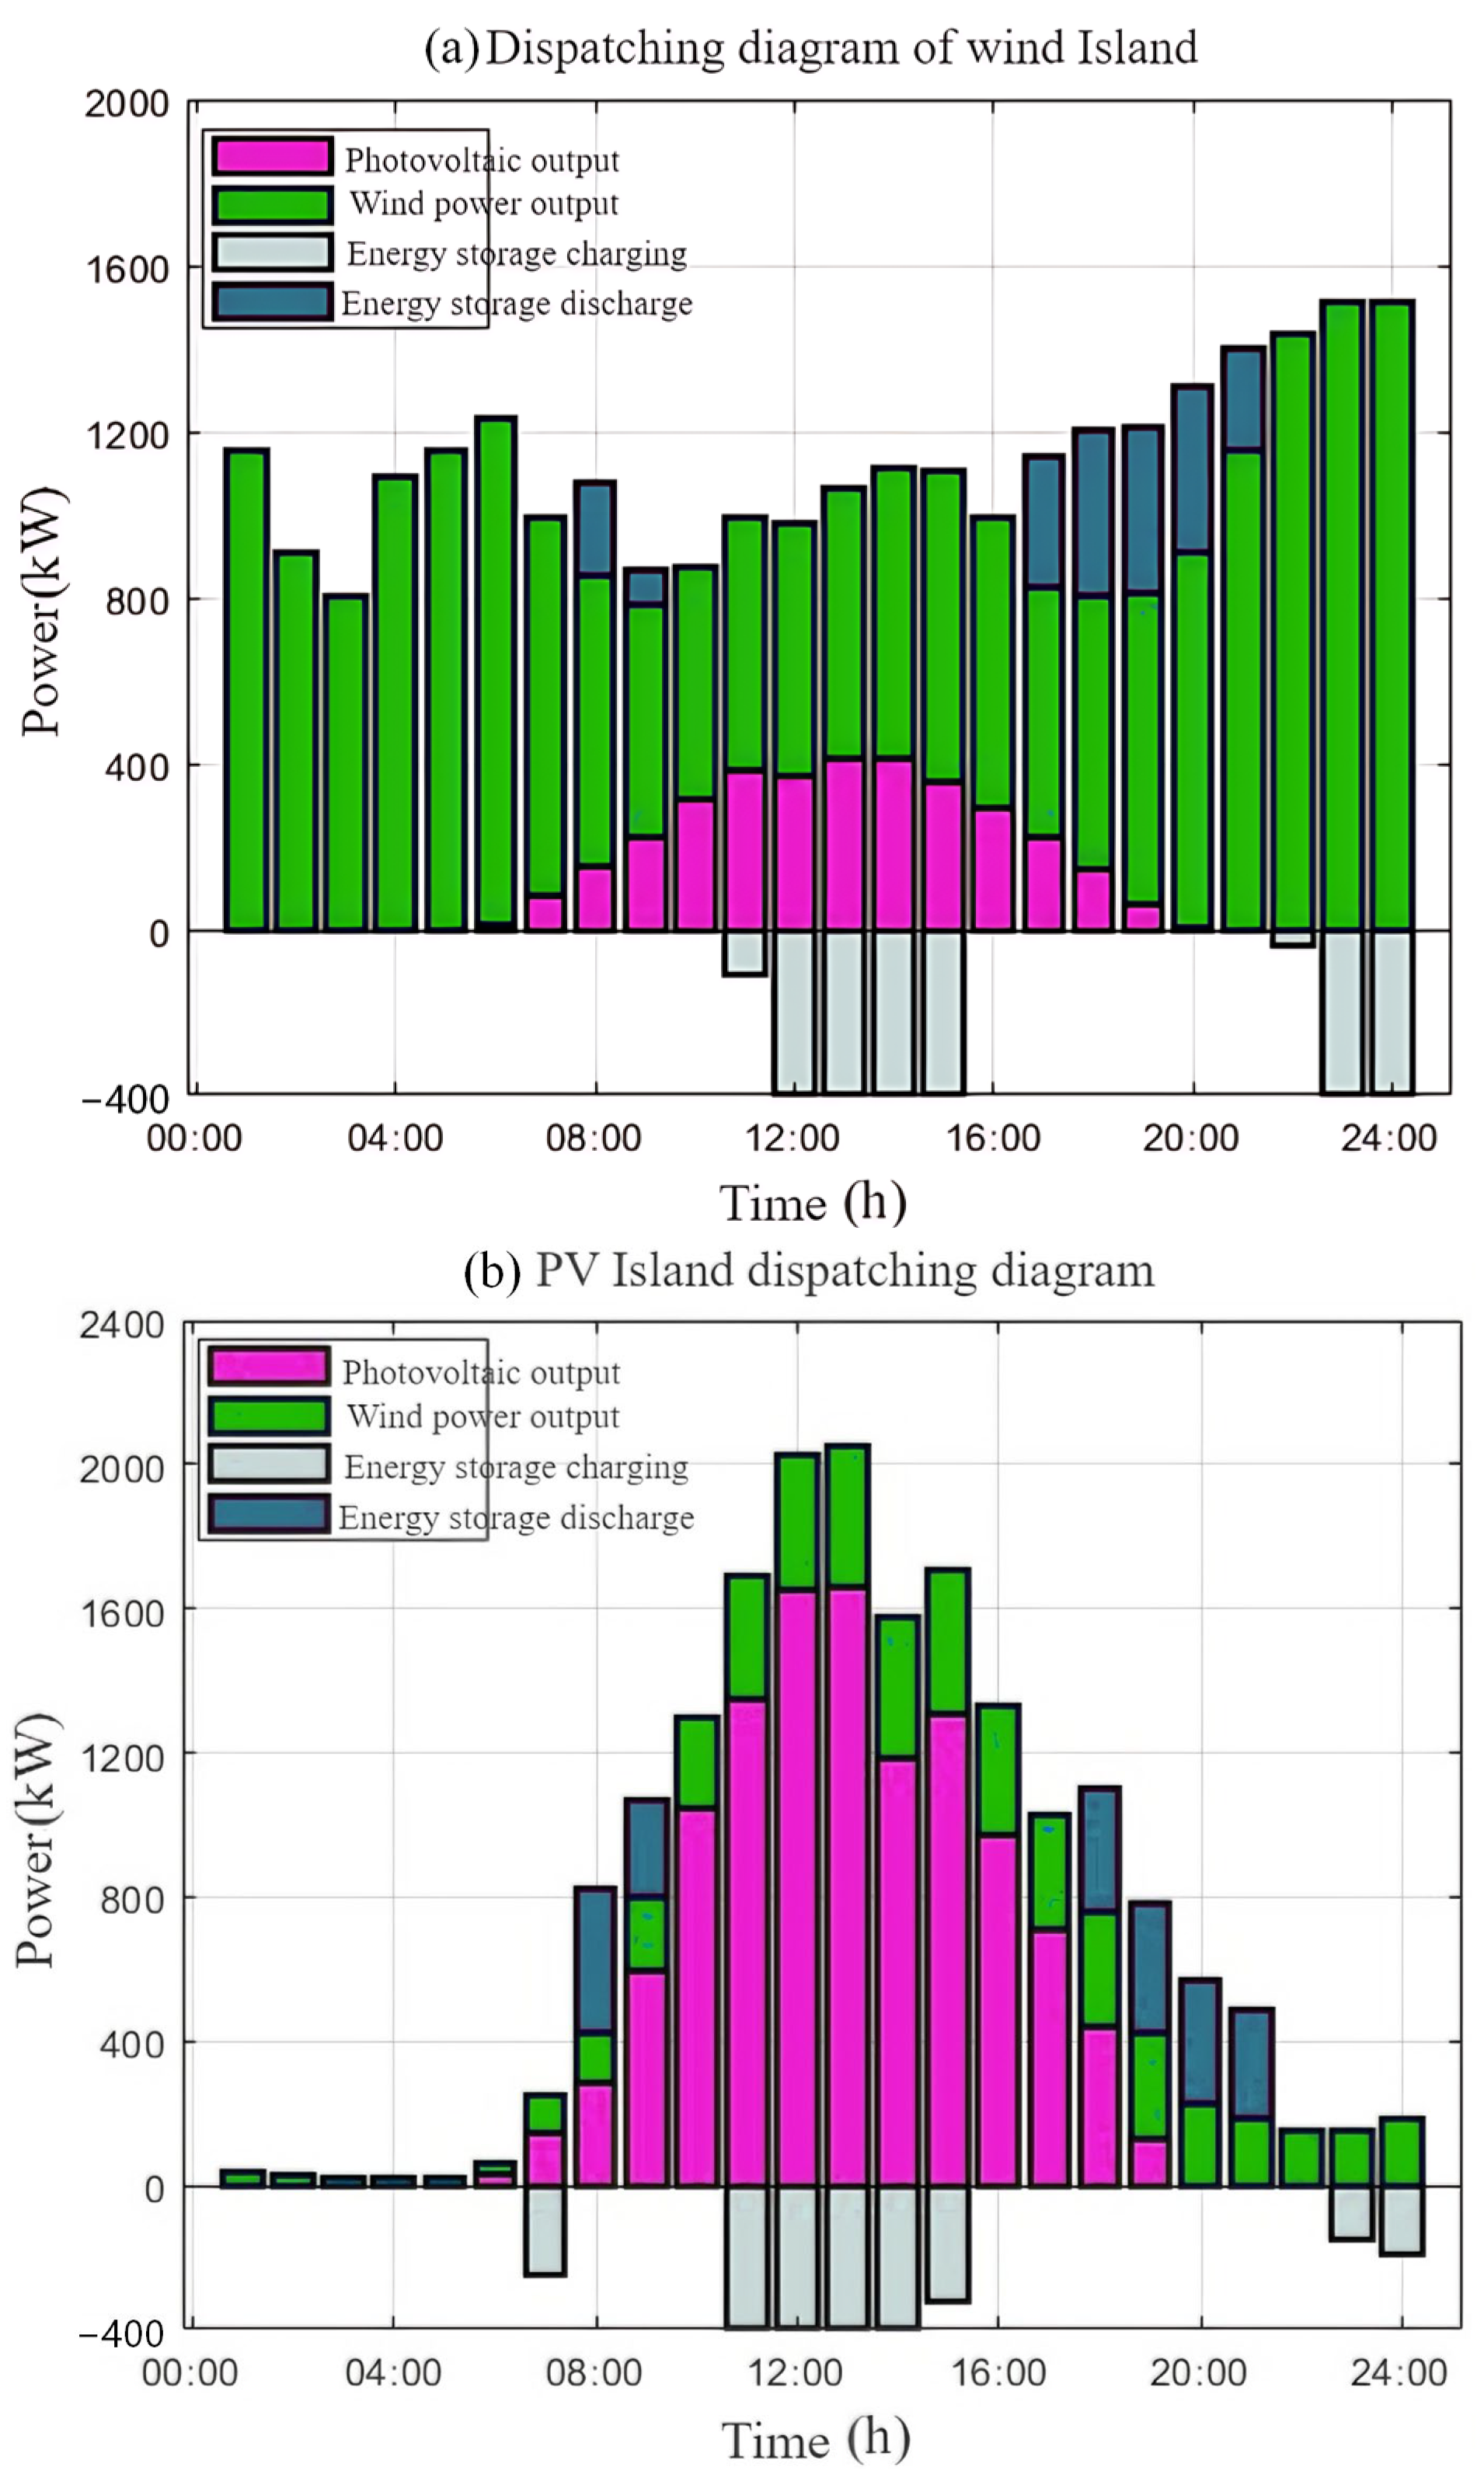
The dispatch diagrams of Microgrid 2 and Microgrid 3 on the resource island are shown in Figure 3. Due to the maximum capacity of the island’s transmission channel and the load demands of the load island, the energy storage batteries on the resource island mainly charge between 11:00 and 15:00 during the day and discharge between 17:00 and 21:00, thereby reducing the waste of wind and solar energy.
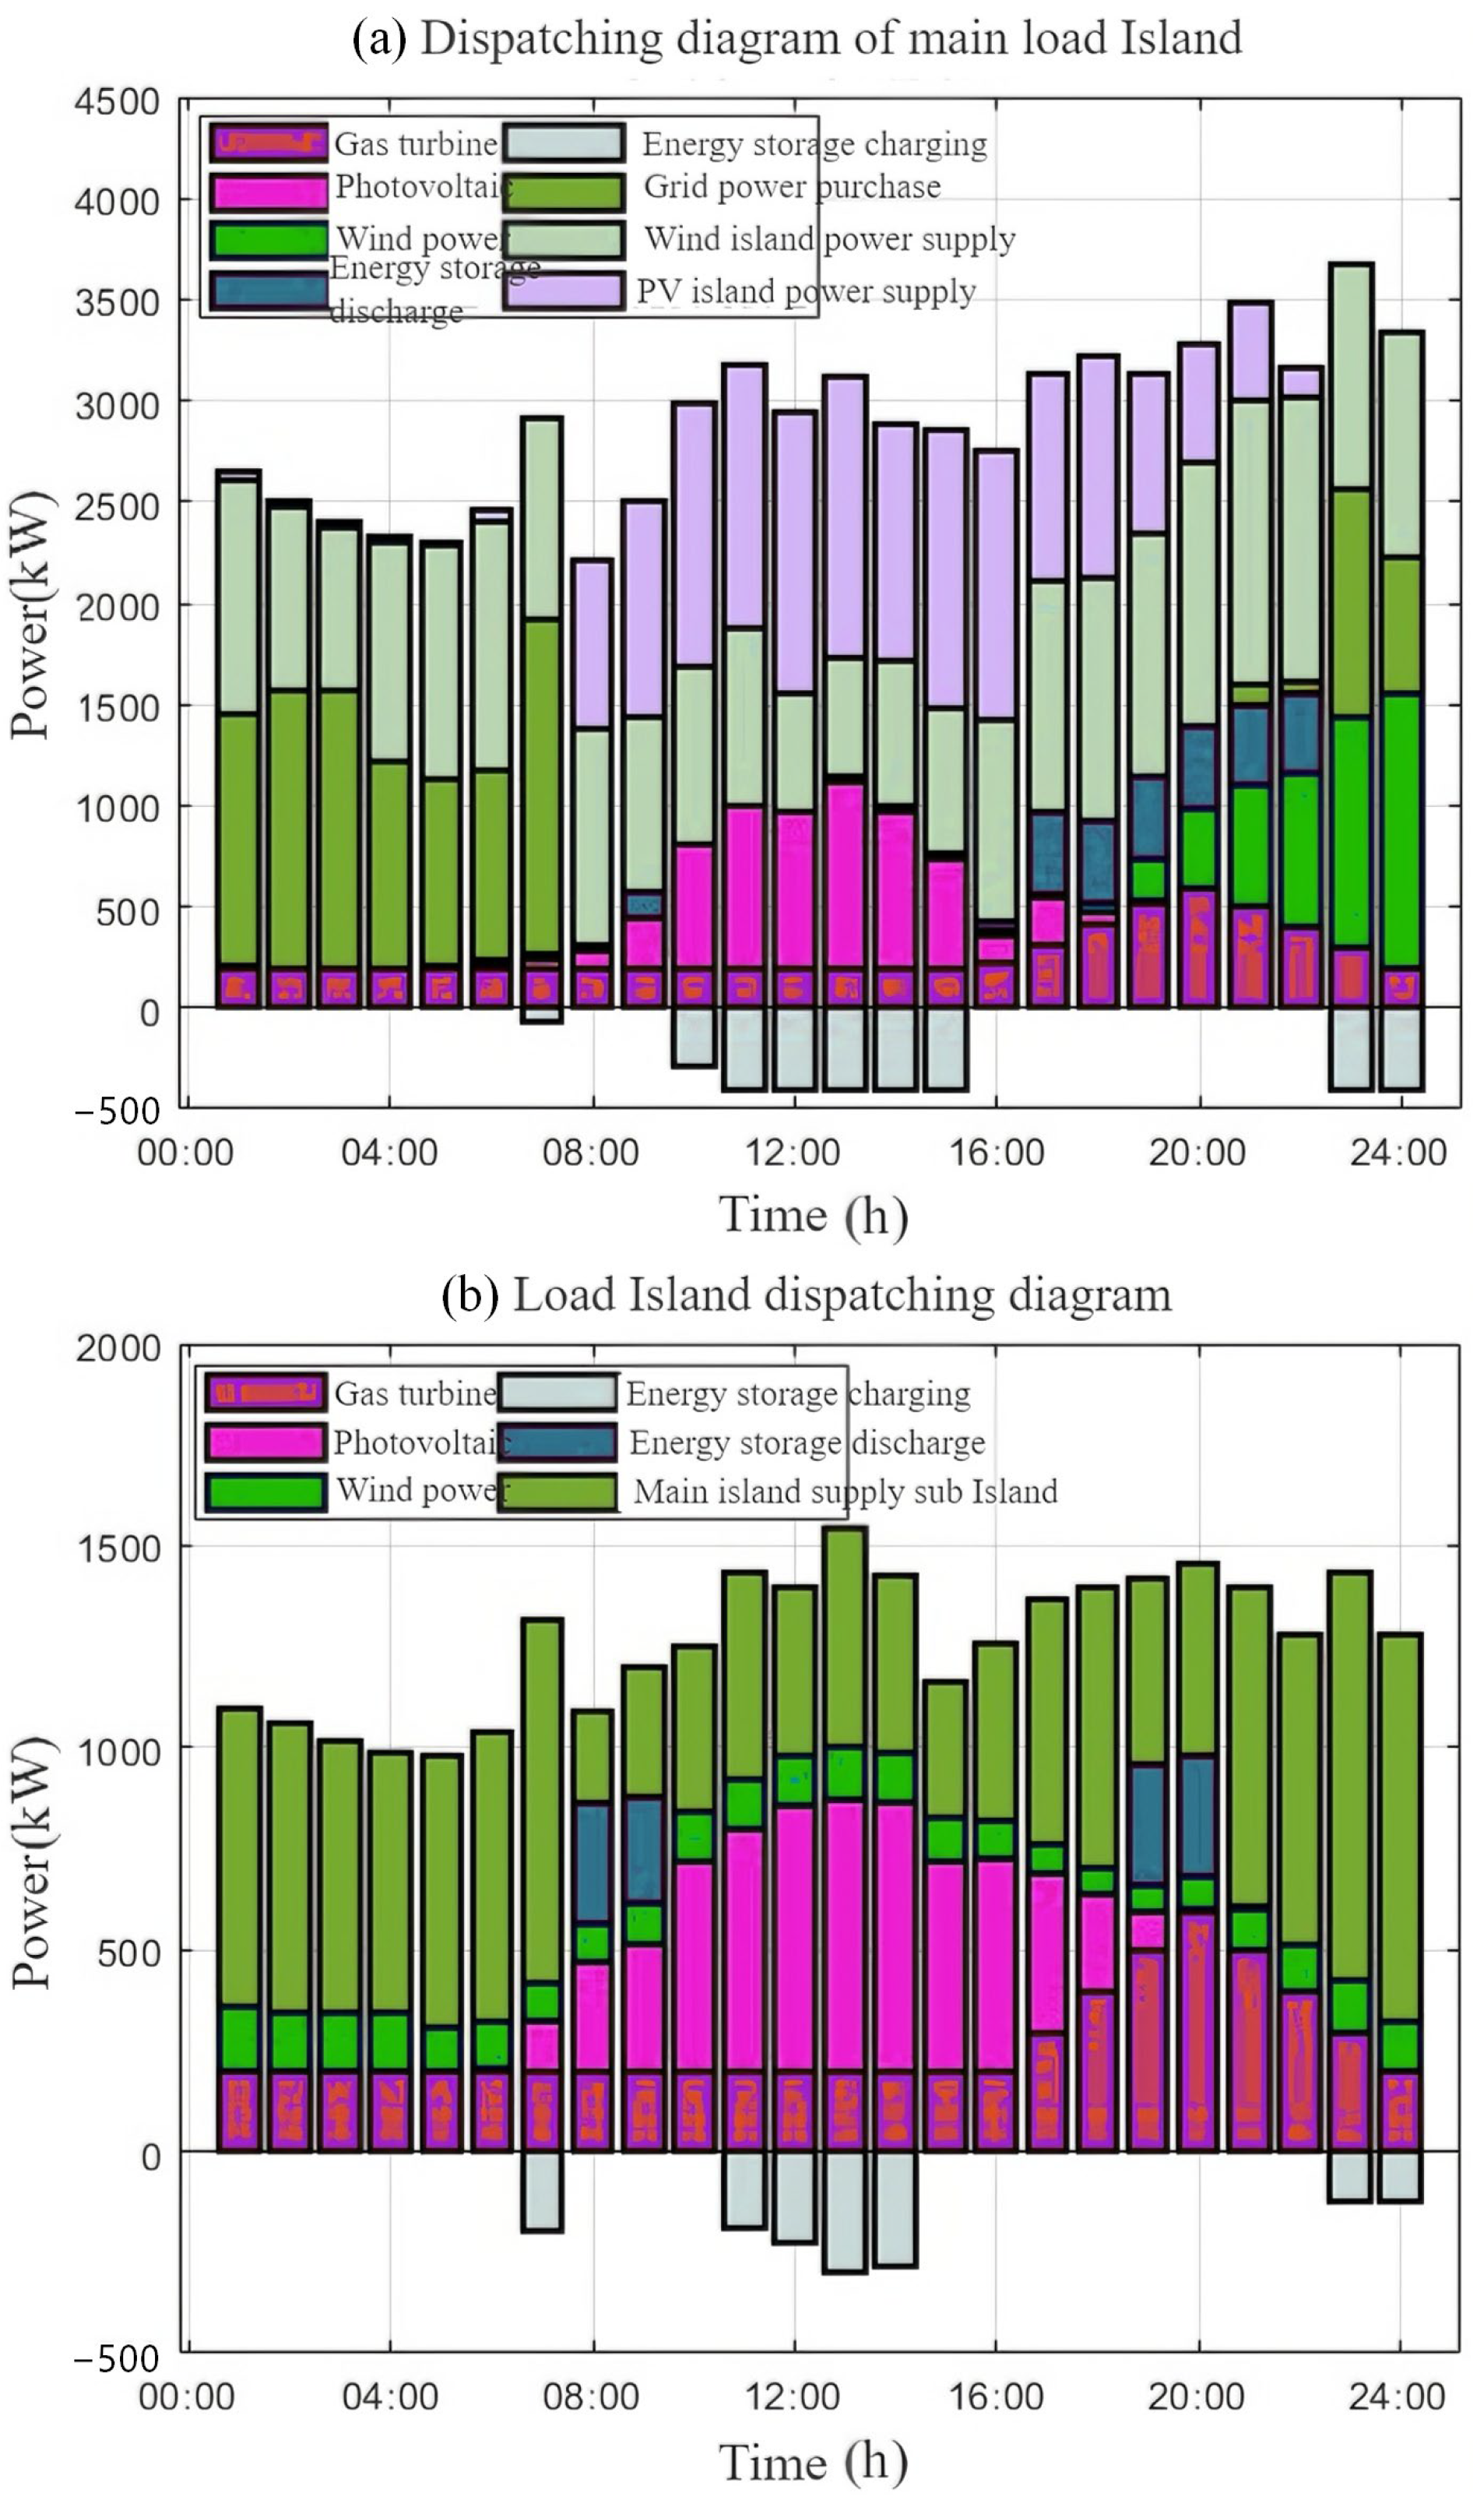
The dispatch diagrams of Microgrid 1 and Microgrid 4 on the load island are shown in Figure 4. Although the load demand on the load island is relatively high during the day, the corresponding photovoltaic resources are also concentrated during the daytime. At night, although the wind and solar resources are scarce, the corresponding load demand is also low. As a result, the micro gas turbine operates at the lowest load from 24:00 to 16:00 the next day. Microgrid 1 stores energy at the maximum power of the energy storage system at 7:00, 10:00 to 15:00, and 23:00 to 24:00, while Microgrid 2 stores energy at 7:00, 11:00 to 14:00, and 23:00 to 24:00.

4.3. Comparison with Independent Optimization Results

To compare the performance of multi-microgrid distributed collaborative scheduling with independent optimization, the same day’s optimization scheduling was conducted for the above-mentioned island microgrid system using both independent and distributed optimization models. The carbon emissions and related economic costs are shown in Table 6. It can be observed that multi-microgrid distributed collaborative scheduling can significantly reduce the carbon emissions of the microgrid group by approximately 3.0 tons. At the same time, the distributed collaboration reduces the interaction power with the main grid, resulting in a 28.9% decrease in the total system operation cost.
In Distributed Collaboration, there was an unexpected amount of abandoned electricity in Microgrid 2, which may occurs between 11:00 and 15:00. During these hours the tie-line power reaches its thermal limit of 1400 kW for 4 consecutive hours. Consequently, the unexpected curtailment is primarily caused by transmission congestion rather than by the similarity metric. Enlarging the submarine cable capacity or relocating part of the daytime surplus to a local seawater-desalination load would mitigate this issue.

4.4. Comparison with Centralized Optimization Results

The same day’s wind and solar resources and load conditions were selected as boundary data, and both the centralized optimization method and the distributed optimization method proposed in this study were used for solution. The results are shown in Table 7. It can be observed that the total cost obtained by the distributed optimization method in this study deviates from that of the centralized optimization method by approximately 0.17%, and the solution time is reduced from 1.899 s to 0.746 s. This indicates that the method proposed in this study can ensure the efficiency and real-time performance of the scheduling in island microgrid groups with poor communication conditions.

5. Conclusions

To address the issues of efficiency and real-time performance in power mutual assistance of island microgrid groups, this paper proposes a two-stage decentralized dispatching optimization method based on similarity measurement combined with offline training and online optimization. Simulation results demonstrate that compared to independent optimization, the proposed method reduced total carbon emissions by approximately 14.1% (from 21.55 tons to 18.51 tons) and total operating cost by approximately 28.9% (from 20,784 yuan to 14,771 yuan). The distributed optimization method achieved a total cost of 14,771 yuan, deviating from centralized optimization by only 0.17% (14,746 yuan), while reducing solution time from 1.89 s to 0.746 s. The additional tests on 10- and 30-microgrid clusters demonstrate that both computation time and communication burden scale near-linearly with system size, confirming the method’s suitability for large island clusters.
The 4-island system was intentionally sized to match the capacity mix and peak-to-storage ratio reported in IEEE microgrid benchmarks and real island projects (20–60 kW PV, 10–30 kW WT, 15–50 kWh BESS, 1–2 MW tie-line). Because the proposed two-stage scheme only requires local historical data and a lightweight similarity search, its computational burden scales near-linearly with the number of microgrids and can be directly applied to clusters of ten or more islands of similar scale. The conclusions on cost and emission reductions remain valid when (i) the renewable penetration is 60–120% of annual demand and (ii) the inter-island communication delay is below 1 s. For systems with highly skewed resource distribution, large diesel shares, or demand-response programmes, the framework is still applicable; only the cost and carbon coefficients in the offline training model need to be extended accordingly, while the online similarity-plus-ADMM structure remains unchanged.
For future research, we will focus on enhancing similarity measurement algorithms using advanced machine learning techniques to improve accuracy and speed in identifying similar historical data. We will explore the integration of demand response strategies, such as dynamic pricing and incentive schemes for controllable loads, to optimize supply-demand balance.
Author Contributions

Conceptualization, J.W. and J.S.; methodology, H.X.; software, Y.X.; validation, J.M., L.W. and J.W.; formal analysis, J.S.; investigation, H.X.; resources, Y.X.; data curation, J.M.; writing—original draft preparation, L.W.; writing—review and editing, J.W.; visualization, H.X.; supervision, J.W.; project administration, J.S.; funding acquisition, J.S. All authors have read and agreed to the published version of the manuscript.

Funding

This research was funded by [the Science and Technology Project of State Grid Zhejiang Electric Power Co., Ltd.] grant number [B311WZ23000C] And The APC was funded by [the Science and Technology Project of State Grid Zhejiang Electric Power Co., Ltd.]. Information regarding the funder and the funding number should be provided. Please check the accuracy of funding data and any other information carefully.

Data Availability Statement

The data presented in this study are available on request from the corresponding author due to privacy.

Conflicts of Interest

Author Junjian Wu, Jingliao Sun, Honglei Xi, Yeyun Xiang, Jian Meng and Longdong Wu are employed by the Wenzhou Power Supply Company. The authors declare that the research was conducted in the absence of any commercial or financial relationships that could be construed as a potential conflict of interest.

References

  1. Kedong, Y.; Liu, Z.; Zhang, C.; Huang, S.; Li, J.; Lv, L.; Su, X.; Zhang, R. Analysis and forecast of marine economy development in China. Mar. Econ. Manag. 2022, 5, 1–33. [Google Scholar] [CrossRef]
  2. Yu, L.; Duan, D.; Min, K.; Wang, T. Advancing Marine-Bearing Capacity and Economic Growth: A Comprehensive Analysis of Blue Economy Resilience, Network Evolution, and Technological Influences in China’s Coastal Areas. Water 2024, 16, 1019. [Google Scholar] [CrossRef]
  3. Rahman, A.; Farrok, O.; Haque, M.M. Environmental impact of renewable energy source based electrical power plants: Solar, wind, hydroelectric, biomass, geothermal, tidal, ocean, and osmotic. Renew. Sustain. Energy Rev. 2022, 161, 112279. [Google Scholar] [CrossRef]
  4. Mengyao, H. Research on Investment Risk Assessment of Island Microgrid Project Considering Seawater Desalination System. Master’s Thesis, North China Electric Power University, Beijing, China, 2022. [Google Scholar]
  5. Arévalo, P.; Ochoa-Correa, D.; Villa-Ávila, E.; Espinoza, J.L.; Albornoz, E. Decarbonizing Insular Energy Systems: A Literature Review of Practical Strategies for Replacing Fossil Fuels with Renewable Energy Sources. Fuels 2025, 6, 12. [Google Scholar] [CrossRef]
  6. Dawn, S.; Ramakrishna, A.; Ramesh, M.; Das, S.S.; Rao, K.D.; Islam, M.; Ustun, T.S. Integration of renewable energy in microgrids and smart grids in deregulated power systems: A comparative exploration. Adv. Energy Sustain. Res. 2024, 5, 2400088. [Google Scholar] [CrossRef]
  7. Li, H.; Ren, Z.; Trivedi, A.; Srinivasan, D.; Liu, P. Optimal planning of dual-zero microgrid on an island toward net-zero carbon emission. IEEE Trans. Smart Grid 2023, 15, 1243–1257. [Google Scholar] [CrossRef]
  8. Bahrami, M.; Vakilian, M.; Farzin, H.; Lehtonen, M. Multi-step island formation and repair dispatch reinforced by mutual assistance after natural disasters. Int. J. Electr. Power Energy Syst. 2021, 126, 106572. [Google Scholar] [CrossRef]
  9. Cunha, P.H.; Saavedra, O.R.; Ribeiro, L.A.S.; Oliveira, D.Q. Cluster operation of microgrids: Assessing economic and resilience gains. Electr. Power Syst. Res. 2025, 239, 111220. [Google Scholar] [CrossRef]
  10. Cunha, P.H.; Saavedra, O.R.; Oliveira, D.Q. Critical review of multi-microgrids. In Proceedings of the 15th IEEE International Conference on Industry Applications (INDUSCON), São Bernardo do Campo, Brazil, 22–24 November 2023; pp. 443–450. [Google Scholar]
  11. Shi, Z.; Yan, L.; Hu, Y.; Wang, Y.; Qin, W.; Liang, Y.; Zhao, H.; Jing, Y.; Deng, J.; Zhang, Z. Optimization of Operation Strategy of Multi-Islanding Microgrid Based on Double-Layer Objective. Energies 2024, 17, 4614. [Google Scholar] [CrossRef]
  12. Kang, K.; Zhang, Z.; Zhong, T.; Li, H.; Zhang, Y.; Lin, X.; Shi, D. Microgrid economic power planning scheme for Pelagic island group. Smart Electr. Power 2019, 47, 26–33. [Google Scholar]
  13. Zheng, C.; Yang, P.; Xu, Z.; He, T. Typical Characteristics and engineering design of island interconnected multi-microgrids. Electr. Drive 2018, 48, 55–59. [Google Scholar]
  14. Zhou, Y.; Wu, H.; Li, Y.; Xin, H. Dynamic dispatch of multi-microgrid for neighboring islands based on MCS-PSO algorithm. Dianli Xitong Zidonghua/Autom. Electr. Power Syst. 2014, 38, 204–210. [Google Scholar]
  15. Zhao, Z.; Cui, S.; Fan, X.; Li, H. Multi-objective coordination optimization of multi-microgrid considering economic and environmental benefits. Renew. Energy Resour. 2019, 37, 372–378. [Google Scholar]
  16. Qiu, W.; Zhang, J.; Liu, N. Multi-objective optimal power flow considering environmental factor and voltage stability. Trans. China Electrotech. Soc. 2012, 27, 190–197. [Google Scholar]
  17. Yao, L.; Wang, W.; Lin, H.; Liu, J. Day-ahead Optimal Scheduling of Wind-powered Microgrid Cluster with Source-storage Collaboration Taking into Account Low-carbon Economic Operation. J. Chin. Soc. Power Eng. 2024, 44, 462–474. [Google Scholar]
  18. Bao, W.; Ge, M.; Yuan, Y.; Yuan, Z.; He, X. Techno-Economic Optimization of Wind/Photovoltaic/Storage Independent Microgrid Considering Demand Response. Acta Energiae Solaris Sin. 2024, 45, 343–350. [Google Scholar]
  19. Sun, W.; Zhang, H.; Xie, Z.; Li, L.; Liang, H. Hierarchical energy optimization management of active distribution network with multi-microgrid system. J. Ind. Prod. Eng. 2022, 22, 202–210. [Google Scholar]
  20. Li, P.; Lu, Y.; Bai, X.; Hua, W. Decentralized optimization for dynamic economic dispatch based on alternating direction method of multipliers. Proc. CSEE 2015, 35, 2428–2435. [Google Scholar]
  21. Ouyang, C.; Liu, M.; Lin, S.; Feng, H. Decentralized dynamic economic dispatch algorithm of microgrids using synchronous alternating direction method of multipliers. Trans. China Electrotech. Soc. 2017, 32, 134–142. [Google Scholar]
  22. Liang, N.; Li, P.; Liu, Z.; Song, Q.; Luo, L. Optimal scheduling of island microgrid with seawater-pumped storage station and renewable energy. Processes 2020, 8, 737. [Google Scholar] [CrossRef]
  23. Ren, J.; Xu, Y.; Dong, S. A decentralized scheduling model with energy storage participation for interconnected power system with high wind power penetration. Power Syst. Technol. 2018, 42, 1079–1086. [Google Scholar]
  24. Wang, H.; Ai, Q.; Wu, J.; Xie, Y.; Zhou, X. Bi-level distributed optimization for microgrid clusters based on alternating direction method of multipliers. Power Syst. Technol. 2018, 42, 1718–1727. [Google Scholar]
  25. Ji, Y.; Niu, G.; Qu, X.; Sun, S.; Yu, P.; Zhang, L.; Chen, J. Planning Evaluation Method of Islands Microgrid System Considering Multi-Energy Complementary. Smart Electr. Power 2021, 49, 24–31. [Google Scholar]
Figure 1. Two-stage decentralized dispatch model solving process.
Electronics 14 04239 g001
Figure 2. Interaction Power among Microgrids.
Electronics 14 04239 g002
Figure 3. Dispatch Diagrams of the Wind Island and the Photovoltaic Island. (a) Dispatch Diagram of the Wind Island; (b) Dispatch Diagram of the Photovoltaic Island.
Electronics 14 04239 g003
Figure 4. Dispatch Diagrams of the Load Island. (a) Dispatch Diagram of the Main Load Island; (b) Dispatch Diagram of the Subordinate Load Island.
Electronics 14 04239 g004
Table 1. Economic Parameters of Each Device in the Island Microgrid Cluster.
DeviceParameterUnitValue
Gas turbineCH4 low calorific valuekWh/m39.88
Natural gas priceyuan/m32.72
Wind turbineOperating costyuan/kWh0.02
Photovoltaic unitOperating costyuan/kWh0.03
Energy storageOperating costyuan/kWh0.05
Distribution networkPeak electricity priceyuan/kWh1.13
valley electricity priceyuan/kWh0.33
Flat electricity priceyuan/kWh0.84
Table 2. Unit Carbon Emissions of Each Device in the Island Microgrid Cluster.
DeviceCO2 Emissions/g/kWh
Gas turbine564.70
Wind turbine34.00
Photovoltaic unit40.00
Energy storage91.33
Distribution network803.00
Table 3. Comparison of distance metrics.
MetricAvg. Cost Error/%Avg. Time/ms
DTW0.01140
ED0.0249
MD0.1152
Table 4. Sensitivity of penalty coefficient λ.
λIterationsTotal Cost (¥)CPU Time (s)
0.018714 8201.34
0.056214 7850.98
0.104614 7710.75
0.504114 7890.71
1.003914 8100.69
Table 5. Scalability results.
Number of MicrogridsOffline Time (min)Online Time (s)Iterations
48.10.7546
1020.31.947
3061.55.849
Table 6. Comparison of Independent Optimization and Distributed Collaborative Scheduling Results.
MethodParameterMicrogrid 1Microgrid 4Microgrid 2Microgrid 3
Independent optimizationCarbon emissions/t5.1114.720.930.84
Total carbon emissions/t21.55
Amount of wind and light abandoned/kWh000480
electricity purchasing cost/yuan1127661100
Energy storage loss cost/yuan5712425
Fuel cost/yuan4513732000
Other operating costs/yuan269403118325
Total operating cost/yuan596614,347122350
Total cost/yuan20,784
Distributed collaborationCarbon emissions/t12.664.071.180.89
Total carbon emissions/t18.51
Amount of wind and light abandoned/kWh0091480
electricity purchasing cost/yuan3636000
Energy storage loss cost/yuan51234141
Fuel cost/yuan5005493600
Other operating costs/yuan294281164299
Total operating cost/yuan89865240205340
Total cost/yuan14,771
Table 7. Comparison of the Method Proposed in This Study and Centralized Optimization Method.
MethodTotal Cost/YuanSolution Time/s
Centralized optimization14,7461.89
Distributed optimization of this study14,7710.74
Disclaimer/Publisher’s Note: The statements, opinions and data contained in all publications are solely those of the individual author(s) and contributor(s) and not of MDPI and/or the editor(s). MDPI and/or the editor(s) disclaim responsibility for any injury to people or property resulting from any ideas, methods, instructions or products referred to in the content.