Abstract
Understanding causal structures in data center cooling systems is essential for energy optimization and fault detection. Conventional methods based on physical connectivity ensure interpretability but often miss latent interactions, while Granger causality captures predictive dependencies yet suffers from sensitivity to data quality and ambiguous directionality. To overcome these limitations, we propose a hybrid causal discovery framework that integrates physics-informed priors with Granger-inspired predictive modeling. A key innovation is the use of a relative increment formulation, which focuses on the proportional change in observables immediately after control actions. This design filters out long-term seasonal trends and emphasizes short-term, actionable effects. Applied to a large-scale dataset from a real data center, the framework successfully recovers known control–feedback links, identifies consistent control–temperature relationships, and reveals cross-unit influences overlooked by traditional approaches. By combining physical priors for directionality with predictive causality for flexibility, the method yields a causal network that is both interpretable and robust, offering a principled basis for decision-making in energy-critical infrastructures.
1. Introduction
Understanding the causal structure in data center cooling systems is crucial for tasks such as energy optimization and fault detection. These tasks require not only predictive accuracy but also model interpretability and physical consistency—particularly in large-scale infrastructures where control decisions must align with engineering logic and operational constraints [1].
Existing research approaches can be broadly categorized into two paradigms: physics-based connectivity graph construction and Granger causality analysis based on statistical learning. Physics-based methods build causal networks from the topological relationships between components [2,3,4,5,6], offering the advantage of aligning with intuitive engineering understanding and comprehensively capturing first-order interactions. However, such static networks struggle to represent the deeper causal logic arising from dynamic control actions, chaotic behavior, or implicit thermal coupling during system operation. They are particularly inadequate for quantifying the propagation pathways of subtle but impactful “butterfly effect”-like influences [7].
To overcome the limitations of physics-based methods, Granger causality [8,9,10] provides a data-driven alternative, inferring causal direction by testing whether the inclusion of one variable’s past values improves the prediction of another [11,12,13,14,15]. Although this approach can uncover hidden statistical associations in the data, it remains fundamentally predictive rather than definitively causal, and is highly sensitive to data stationarity, temporal synchronization, and unobserved confounding variables. In systems with fast control loops, this often leads to misjudgment of causal direction.
Notably, physics-based methods and Granger causality are inherently complementary: the former provides directional constraints and interpretability, while the latter offers flexibility in discovering unknown relationships from data. However, most existing studies employ these two approaches in isolation, failing to effectively integrate their strengths.
We propose a hybrid causal discovery framework that integrates physics-informed priors with Granger-inspired predictive modeling. First, we define control and observable variables based on physical knowledge and construct a prior causal network. Then, under the relative increment scheme, we train predictive models and apply feature importance analysis to identify the most influential control variables, forming a data-driven causality network. Finally, we correct and refine the data-driven results using physical priors as directional constraints, yielding a causal map that combines interpretability, robustness, and adaptability.
We validate the framework on a 611-day time-series dataset collected from a real-world data center cooling system. The evaluation proceeds in two stages: first, verifying control–feedback relationships to assess predictive accuracy; second, constructing and correcting control–temperature causal networks to evaluate physical consistency. Compared to conventional Granger-based approaches, our method introduces directional constraints, nonlinear modeling capacity, and resilience to static or low-variance control signals—features that are particularly valuable in engineered systems with structured redundancy and intermittent activation.
The main contributions of this work are summarized as follows:
1. Analysis Based on Relative Increments: We introduce a novel representation that models the proportional change in observables, effectively filtering out slow-varying trends and long-term drifts. This allows the framework to isolate and accentuate the short-term, actionable dynamics directly resulting from control actions, thereby enhancing the signal-to-noise ratio for causal discovery.
2. Hybrid Causal Discovery Framework: We develop a principled framework that synergistically combines data-driven predictive causality with physics-informed directional constraints. This integration mitigates the limitations of purely data-driven methods (like Granger causality) in distinguishing true causation from correlation, especially in systems with strong multicollinearity and synchronous behavior, resulting in causal maps that are both data-supported and physically consistent.
3. Validation on a Real-World Industrial System: We demonstrate the efficacy and practical utility of our method through a comprehensive case study on a real data center cooling system, using a 611-day operational dataset. The validated causal structures provide a foundational tool for tasks such as energy optimization and fault detection, directly contributing to the improvement in key energy efficiency metrics like Power Usage Effectiveness (PUE).
Ovearall, this work contributes a principled approach to causal inference in cyber–physical systems, bridging domain knowledge and statistical learning to support interpretable, actionable decision-making in energy-critical infrastructure. In particular, the discovered causal structures offer a foundation for optimizing cooling efficiency and improving system-wide energy metrics such as Power Usage Effectiveness (PUE), which remains a key benchmark in data center operations [16,17,18,19,20,21,22,23].
2. Methodology
This study proposes a hybrid methodology to uncover causal relationships in data center cooling systems by combining physical knowledge with data-driven techniques. The goal is to build a causal network that reflects both the system’s designed control logic and its observed dynamic behavior.
The approach consists of three main components. First, we use physics-informed reasoning to define a baseline causal structure based on system layout and control logic. Second, we introduce a relative increment prediction framework to capture short-term control effects while filtering out long-term trends and seasonal patterns. Third, we apply a Multi-Layer Perceptron (MLP) model to learn nonlinear relationships, and use Permutation Importance [24] to quantify the influence of each control variable efficiently.
Together, these steps form a unified strategy for discovering interpretable and operationally relevant causal links in complex physical systems.
2.1. Physics-Informed and Data-Driven Causal Networks
For complex physical systems such as data center cooling infrastructures, tasks like energy optimization and fault detection require a clear understanding of the causal network among system components. Of particular importance is the control–response relationship between control variables and observable variables—those quantities influenced by control actions and measured via sensors.
The most common approach is to construct a causal network based on physical connectivity, spatial layout, and theoretical logic, often through manual inference or statistical mapping. This method ensures that first-order relationships between nodes are complete and unaffected by whether specific equipment was active during the observation period.
However, real-world physical systems exhibit far greater complexity. Components and subsystems interact through pipes, circuits, or even airflows, forming causal networks that extend well beyond first-order relationships. These latent interactions are not readily observable and cannot be easily inferred from surface-level inspection. To uncover such hidden control–response relationships, a data-driven causal discovery framework—specifically, predictive causality—is required.
Naturally, such frameworks have limitations. Consider a system with multiple identical device groups performing the same function and connected via a shared bus or manifold. If one group remains inactive over a long period (e.g., as a backup), its control variables will not exhibit observable influence on shared parameters, making it difficult to detect its causal role from data alone.
Figure 1 illustrates the relationship between the physics-informed causal network and the data-driven network. These two are not mutually exclusive but rather complementary. The physical network serves as a prior for the data-driven approach. Conversely, predictive causality alone cannot determine the directionality of causal links, whereas physical interpretation provides clear direction—from control variables to affected observables. By integrating both approaches, the physical network can guide, correct, and supplement the data-driven network, especially in terms of causal directionality. This dual-framework integration forms the core methodological proposition of this work.
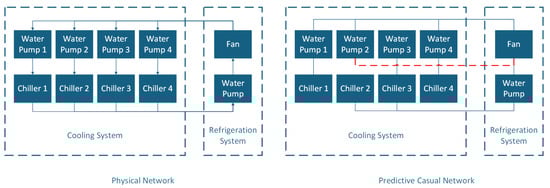
Figure 1.
Comparison between the physics-informed causal network and the data-driven predictive causality network. Solid lines represent confirmed causal relationships derived from physical priors, while dashed lines indicate higher-order dependencies inferred through predictive causality. The physics-informed network exhibits clear directionality, whereas the predictive network reveals latent interactions beyond first-order physical connections.
2.2. Causal Discovery Based on Relative Increment Prediction
We introduce a relative increment formulation tailored to control–response dynamics in physical systems. Rather than modeling absolute sensor readings, we focus on the proportional change in observables immediately following control actions. Formally, for a sensor value and control inputs , the relative increment is defined as
This formulation isolates the short-term, actionable effect of control variables while filtering out slow-varying seasonal trends and long-term drifts. By emphasizing fast-reacting causal dynamics, it enhances both interpretability and operational relevance.
Granger causality provides a foundational principle for time-series-based causal inference: if the past values of a time series X improve the prediction of another series Y, then X is said to “Granger-cause” Y. Building on this concept, we propose a data-driven causal discovery framework tailored to control–response relationships in physical systems:
- (a)
- For each observable variable, we train a predictive model using all available control variables as input features.
- (b)
- For each model, we evaluate the relative importance of individual control variables and identify the top k variables that exert the strongest influence on the prediction outcome.
In the context of data center cooling systems, thermal management strategies vary significantly across seasons, and long-term business growth introduces gradual shifts in workload and heat generation. These factors imply that the underlying data exhibit both long-period seasonality and non-stationary trends. Consequently, using wide temporal windows or analyzing raw sensor readings directly may obscure short-term control effects and introduce confounding influences.
To address this, we design a prediction scheme based on relative increments—a formulation that isolates the immediate impact of control actions on observable variables. Rather than modeling absolute values, we focus on the proportional change in observables at the next time step following a control adjustment. This approach filters out slow-varying seasonal and trend components, allowing the model to capture fast-reacting causal dynamics.
Assume a system comprising n controllers and m sensors, where the value of i-th controller at time t is
whereas the reading of the j-th sensor at time t is denoted as
Control variables influence observable variables through a progressive adjustment mechanism, which can be expressed as
where . The relative increment is then defined as
in which serves as an approximation of .
As shown in Equation (1), the relative increment quantifies the ratio of change in an observable variable immediately after a control action. In our study, control variables primarily include the actual power consumption of pumps, fans, and compressors—components known to respond rapidly to control signals. Given a data sampling interval of 15 min, this temporal resolution is sufficient to capture the system’s reactive behavior to control inputs.
This formulation enables the causal discovery framework to focus on short-term, actionable relationships, enhancing interpretability and relevance for operational decision-making. By combining Granger-inspired modeling with relative increment analysis, we obtain a more robust and physically meaningful causal map of the system.
It should be noted that the Granger causality adopted in this paper represents a form of statistical causality based on prediction. This approach essentially defines a quantifiable, temporally predictive form of causality, rather than asserting an absolute causal relationship as might be explored in philosophy or physics. Accordingly, this study aims to identify causal links with significant predictive value, thereby enhancing system interpretability and controllability, while clearly distinguishing such relationships from mere correlation.
2.3. Implementation Strategy: MLP and Permutation Importance
Given the complex and nonlinear physical relationships between control and observable variables, linear models are insufficient for capturing the underlying dynamics of the system. To address this, we employ a Multi-Layer Perceptron (MLP) architecture—a class of feedforward neural networks capable of modeling nonlinear dependencies and capturing synergistic effects among multiple control variables.
An MLP consists of an input layer, one or more hidden layers, and an output layer. Each layer applies a linear transformation followed by a nonlinear activation function. For a given observable variable , the MLP predicts its relative increment based on the control inputs . The model can be formally expressed as
where
- is the learned approximation of the true mapping ,
- and are the weights and biases of the l-th layer,
- is the activation function (e.g., ReLU) applied at layer l,
- L is the total number of layers.
This architecture allows the model to capture both individual and joint effects of control variables on the target observable, enabling more accurate and physically meaningful predictions.
To assess the relative importance of each control variable, we adopt the Permutation Importance method. The core idea is intuitive: for a trained model, if randomly permuting the values of a specific input variable significantly degrades performance on the validation set, then that variable is deemed important for prediction. Conversely, if the performance remains largely unchanged, the variable is considered uninformative. This approach aligns conceptually with Granger causality, which also evaluates the predictive contribution of one variable to another. However, unlike Granger-based methods, Permutation Importance does not require retraining multiple models for different control variable subsets, making it computationally efficient.
In practice, the importance score of controlling variable for variable is computed over k permutations as follows:
where
- is the performance of the original model (measured by in this study),
- is the performance after the l-th permutation of variable ,
- reflects the average drop in performance due to disrupting the predictive signal of .
After computing the importance scores, we select the top three control variables for each observable target and record their rankings. Selecting multiple variables allows us to capture deeper, distributed influences across the system—reflecting higher-order causal relationships within the network.
3. Experiment
3.1. Data and Physical Background
This study utilizes a dataset collected from a large-scale data center cooling system, spanning a total of 611 days with a fixed sampling interval of 15 min, resulting in 58,656 time steps. The system comprises several key subsystems: cooling water loops, chilled water loops, secondary-side water pumps, cooling tower fans, and chillers. The cooling tower section includes eight fan units, while the chiller subsystem consists of four structurally identical and functionally redundant systems.
To clarify the scope of this study, the rationale for selecting a 15 min fixed sampling interval is outlined as follows. First, this interval represents the industry standard for data collection and anomaly detection in data center sensors, facilitating benchmarking and validation against prevailing practices. Second, the research objective is not to capture the transient dynamics of the cooling system, but rather to focus on the quasi-steady-state operations that prevail after transient events. A 15 min interval is sufficient to characterize these sustained steady-state characteristics. Finally, it should be noted that this sampling strategy may not effectively capture instantaneous anomalies that occur during rapid transient phases, which constitutes a recognized limitation of this study.
As summarized in Table 1, the control variables include frequency-based control signals for various pumps and fans, as well as the compressor current percentage for each chiller. Under the assumption of constant voltage, the compressor current percentage can be interpreted as a proxy for instantaneous power consumption. The observable variables primarily consist of temperature readings—arguably the most critical indicators of cooling system performance—and feedback signals. Some control variables are directly associated with feedback channels, allowing for immediate assessment of control effectiveness. For detailed variable definitions and classifications, refer to Table 2.

Table 1.
Control variable names and their meanings ().
Table 2.
Observation variable names and their meanings ().
This dataset captures both the structural topology and dynamic behavior of the cooling system, providing a rich foundation for causal analysis. The presence of repeated subsystems and shared control pathways enables the exploration of both direct and higher-order control–response relationships, which are systematically analyzed in the following sections.
3.2. Experimental Design
The experimental evaluation consists of two main components, each designed to validate different aspects of the proposed MLP + Permutation Importance framework.
Step 1: Validation via Feedback Signals
To assess the correctness of the causal discovery framework, we first examine observable variables that serve as feedback signals corresponding to specific control actions. These feedback variables are expected to respond directly to their associated control inputs, such as cooling tower fan speeds and water pump frequencies. Based on system design and control logic, we establish a set of physical priors indicating which control variables should influence which feedback signals (see Figure 2a,b). These relationships provide a ground truth for evaluating the model’s ability to recover known causal links.
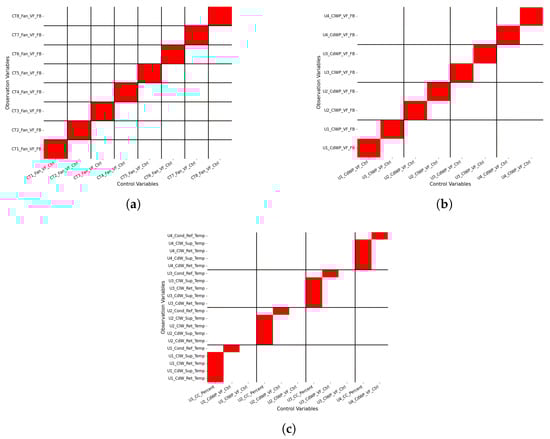
Figure 2.
Physics-informed prior relationships between control and observable variables. The horizontal axis represents control variables, and the vertical axis represents observable variables. Black lines delineate different equipment groups, while red highlights indicate the primary influencing control variable for each observable. (a) Cooling Tower Fan Control vs. Feedback Signals. (b) Water Pump Control vs. Feedback Signals. (c) Control Variables vs. Water Temperature Across System Zones.
Step 2: Discovery of Temperature–Control Relationships
In the second part of the experiment, we focus on identifying control variables that exert actual influence over temperature readings throughout the system. Using the data-driven causal discovery framework, we analyze the learned relationships between control inputs and temperature observables. These results are then compared against physical priors derived from equipment allocation and cooling zone assignments (see Figure 2c, whose construction are detailed in the following subsection). By integrating model outputs with domain-specific knowledge, we aim to reconstruct a physically consistent causal map of the system.
Together, these two steps allow us to evaluate both the predictive accuracy and physical interpretability of the proposed framework. The feedback signal analysis serves as a direct test of causal directionality, while the temperature–control mapping assesses the model’s ability to uncover deeper, system-level interactions.
3.3. Control–Feedback Signal Validation
Figure 3a presents the predictive causality results between the variable frequency control signals of cooling tower fans and their corresponding feedback variables. The discovered relationships align well with the physical priors (see Figure 2a), confirming the expected control–response structure. Interestingly, an unexpected cross-influence is observed between Fan 1 and Fan 2, which can be attributed to their near-synchronous control behavior under real operating conditions. This is supported by a high correlation coefficient of 0.99 between their control signals.
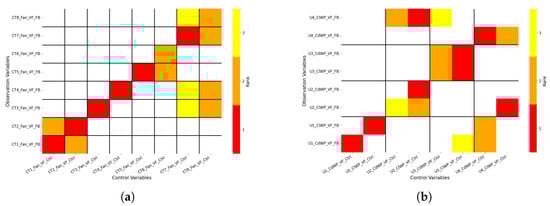
Figure 3.
Permutation importance heatmaps showing data-driven causal influence between control variables and feedback signals. The horizontal axis represents control variables, and the vertical axis represents observable variables. Black lines separate different equipment groups. The color scale in the figure indicates the relative causal influence rankings, color intensity indicates importance: red for strongest, orange for second-strongest, and yellow for third. (a) Variable frequency control of cooling tower fans and corresponding feedback signals. (b) Variable frequency control of water pumps and corresponding feedback signals.
Figure 3b illustrates the relationships between cooling and chilled water pumps and their respective feedback variables (physical priors see Figure 2b). Similar to the fan subsystem, predictive causality reveals strong intra-group synchronization between cooling and chilled water pumps within the same unit. The correlation coefficients (see Table 3) further support this observation. Beyond synchronization, the model successfully distinguishes control–response relationships across different equipment groups, demonstrating its ability to capture both local and system-level causal structure.
Table 3.
Correlation coefficients between chilled water pump control and cooling water pump control across units. Bold values indicate intra-unit synchronization. CdWP: Cooling Water Pump, ClWP: Chilled Water Pump, VF Ctrl: Variable Frequency Control.
These results validate the effectiveness of our predictive causality framework. It is important to note that physical priors were implicitly incorporated during model construction—specifically, by modeling the influence of control variables on observables, rather than the reverse. This directional assumption stems from direct physical reasoning. Moreover, the predictive causality analysis reveals interpretable relationships not explicitly encoded in the physical priors, such as synchronized control patterns among certain actuators.
These insights lay the foundation for the next subsection, which explores temperature–control relationships across the system.
This study employs a Multi-layer Perceptron (MLP) for nonlinear regression analysis to capture the complex dynamic characteristics within cooling systems. The specific model configuration and implementation details are as follows:
Network Depth: Four-layer structure comprising an input layer, two hidden layers, and an output layer.
Hidden Layer Design: Dual hidden layer structure with 64–32 neurons, utilizing ReLU activation function to mitigate gradient-vanishing issues.
Optimization Algorithm: Adam optimizer with an initial learning rate of 0.001.
Training Strategy: Maximum of 500 training epochs with early stopping mechanism to prevent overfitting.
Regularization Method: L2 regularization to enhance model generalization capability. Data Pre-processing: Standardization of both features and target variables to ensure training stability.
Model Validation and Evaluation: The model training employs time-series cross-validation to assess performance, with permutation importance analysis quantifying the contribution of each feature to prediction outcomes. This configuration achieves an optimal balance between computational efficiency and model complexity, effectively characterizing the nonlinear dynamic behavior in cooling systems.
Computational Resource Configuration: All experiments were conducted on an NVIDIA GeForce RTX 3090 GPU platform (NVIDIA Corporation, Santa Clara, CA, USA), with individual training processes completing within minutes. This computational efficiency ensures the practical applicability of the method in engineering contexts and provides adequate computational headroom for subsequent extended analysis of larger-scale systems.
3.4. Control–Temperature Influence Analysis
This section investigates which control variables exert the strongest influence over temperature distributions across the data center’s cooling system. As summarized in Table 2, each unit is associated with five key temperature measurements: chilled water supply and return temperatures, cooling water supply and return temperatures, and condenser refrigerant temperature. Correspondingly, each unit has three primary control variables: chilled water pump frequency control, cooling water pump frequency control, and chiller current percentage (see Table 1).
Figure 4a presents the Permutation Importance results for these control–temperature relationships. The physical interpretation of these relationships is guided by two domain-informed assumptions:
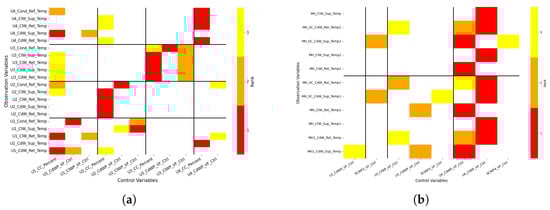
Figure 4.
Permutation importance heatmaps showing data-driven causal influence between control variables and temperature observables. (a) focuses on temperatures within individual units, while subfigure (b) examines temperatures along the main header. The horizontal axis represents control variables, and the vertical axis represents temperature measurements. Black lines separate different equipment groups. The color scale in the figure indicates the relative causal influence rankings, color intensity indicates importance: red for strongest, orange for second-strongest, and yellow for third. (a) Permutation importance: control variables vs. unit-level temperature observables. (b) Permutation importance: control variables vs. main header temperature observables.
Intra-unit control variables are expected to have stronger influence on their own temperature observables than inter-unit variables.
Water pump temperatures are primarily affected by chiller power (represented by current percentage), while condenser refrigerant temperature reflects chiller load and is more sensitive to chilled water supply volume (i.e., pump frequency control).
As shown in Figure 4a, the computed Permutation Importance scores largely reproduce these expectations. However, some deviations are observed, which may be attributed to data incompleteness or multicollinearity among control variables. It is worth noting that Figure 4a currently displays only the data-driven results; the corresponding physical priors are illustrated in Figure 2c.
Figure 4b further explores the influence of all control variables on a system-wide key metric: the main header temperature. Interestingly, despite the symmetric design of the four units, Unit 4 exhibits dominant influence. This aligns with its operational role as the most active unit in practice. Our framework is particularly sensitive to control variables that exhibit frequent and dynamic changes, while it is less responsive to variables that remain constant over time. This behavior stems from the relative increment formulation, which emphasizes short-term variation rather than long-term presence.
Finally, we apply a physics-informed correction to the data-driven causal discovery results. Since no structured prior exists for the main header temperature, the correction is limited to unit-level temperature observables. The correction logic is as follows: based on the physical priors shown in Figure 2c, we revise or fill in the top-ranked (rank 1) causal links, while preserving the remaining structure from the original Permutation Importance results (Figure 4a). The corrected causal map is presented in Figure 5.
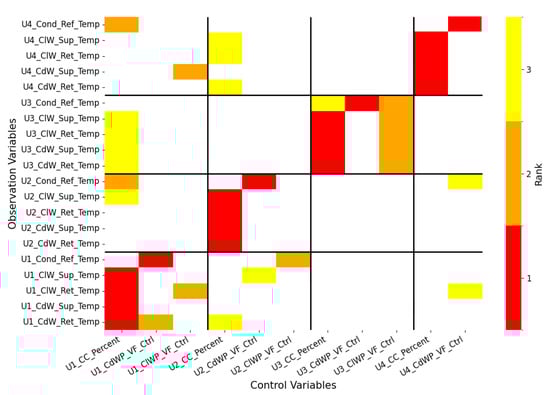
Figure 5.
Physics-informed correction of the data-driven causal map for unit-level temperature observables. Top-ranked causal links are revised or supplemented based on physical priors (Figure 2c), while lower-ranked relationships from the original Permutation Importance results (Figure 4a) are retained.
4. Conclusions
This study proposes a hybrid causal discovery framework that integrates physics-informed priors with Granger-inspired predictive inference to uncover control–response relationships in data center cooling systems. A key contribution is the introduction of a relative increment formulation, which models proportional changes in observables rather than their absolute values. This design effectively filters out long-term seasonal and trend components, enabling the framework to focus on short-term, actionable dynamics that directly reflect the impact of control actions. By combining physical priors for causal directionality with predictive causality for flexibility, the approach balances interpretability, robustness, and adaptability.
Extensive experimental validation was conducted on a large-scale dataset spanning 611 days. In the first stage, feedback signals were used to verify known control–response links, and the results demonstrated strong consistency with system design and physical expectations. In the second stage, the framework was applied to temperature-related observables, uncovering both expected intra-unit causal paths and novel cross-unit influences that are physically plausible but not explicitly encoded in the system layout. The analysis further revealed that Unit 4 exerted dominant influence on main header temperatures, consistent with its operational prominence. These findings highlight the method’s ability to capture both designed logic and emergent patterns of system behavior.
The proposed hybrid causal discovery framework, while validated in the context of data center cooling systems, possesses a generalizable structure that can be adapted to a broader class of cyber–physical systems (CPS). The core assumptions enabling this transferability are (1) the existence of known physical or control-theoretic priors that constrain causal directions (e.g., energy flows, control signals acting on actuators); (2) the availability of high-frequency time-series data reflecting system dynamics; and (3) the presence of dominant, short-term causal mechanisms that can be isolated from long-term non-stationary trends. Our framework explicitly decouples these general elements from system-specific implementations. The relative increment formulation serves as a generic pre-processing step to handle non-stationarity, while the integration of physics for directionality and statistics for strength constitutes a reusable causal inference pattern.
Consequently, this approach is directly applicable to other domains such as building HVAC systems and microgrids. In HVAC systems, the framework can distinguish between direct actuator-to-zone temperature influences and emergent cross-zone thermal couplings, all while respecting the known topology of air and water loops. Similarly, in a microgrid, it can elucidate causal links from dispatch commands and renewable generation to frequency and voltage deviations, filtering out slow seasonal variations to focus on transient stability events. The primary adaptation required lies in encoding the domain-specific physical priors—such as energy flow directions in power systems or thermodynamic laws in thermal systems—into the initial causal graph. Therefore, the methodology offers a versatile and principled template for causal discovery in complex engineered systems where interpretability and physical consistency are paramount.
Overall, this work contributes a principled approach to causal inference in cyber–physical infrastructures. By bridging domain knowledge and statistical learning, the proposed framework provides interpretable and operationally relevant causal maps, offering a reliable foundation for energy optimization, anomaly detection, and decision support in large-scale cooling systems.
Author Contributions
Conceptualization, X.C. and J.W.; Methodology, J.W.; Validation, X.C. and T.X.; Formal Analysis, X.C. and J.W.; Investigation, T.X. and H.S.; Resources, L.L.; Data Curation, X.C. and L.L.; Writing—Original Draft Preparation, X.C., T.X. and J.W.; Writing—Review and Editing, X.C. and T.X.; Visualization, J.W. and H.S.; Supervision, L.L.; Project Administration, M.L. and L.L.; Funding Acquisition, C.H. and L.L. All authors have read and agreed to the published version of the manuscript.
Funding
This work was supported by ZTE Industry-University-Institute Cooperation funds under Grant No. IA20240731006.
Informed Consent Statement
Informed consent was obtained from all subjects involved in the study.
Data Availability Statement
The data presented in this study are available on request from the corresponding author. The data are not publicly available due to confidentiality agreements with a prominent corporation, which also provides inspiration for this work [25,26].
Conflicts of Interest
Author Ming Liu, Chunhua Hou and Lixia Liu were employed by the company ZTE Corporation. The remaining authors declare that the research was conducted in the absence of any commercial or financial relationships that could be construed as a potential conflict of interest.
References
- Kong, D.; Reffat, R.; Chen, Z.; Yang, Z.; Ma, H.; Du, D.; Zhang, Z. Decoupled step-wise simulation-based energy-efficient control for industrial space cooling: Practical validation in a large-scale manufacturing plant. Build. Simul. 2025, 18, 1–24. [Google Scholar] [CrossRef]
- Dayarathna, M.; Wen, Y.; Fan, R. Data center energy consumption modeling: A survey. IEEE Commun. Surv. Tutor. 2015, 18, 732–794. [Google Scholar] [CrossRef]
- Heller, B.; Seetharaman, S.; Mahadevan, P.; Yiakoumis, Y.; Sharma, P.; Banerjee, S.; McKeown, N. Elastictree: Saving energy in data center networks. In Proceedings of the 7th USENIX Symposium on Networked Systems Design and Implementation, San Jose, CA, USA, 20–30 April 2010; Volume 10, pp. 249–264. [Google Scholar]
- Bari, M.F.; Boutaba, R.; Esteves, R.; Granville, L.Z.; Podlesny, M.; Rabbani, M.G.; Zhang, Q.; Zhani, M.F. Data center network virtualization: A survey. IEEE Commun. Surv. Tutor. 2012, 15, 909–928. [Google Scholar] [CrossRef]
- Shieh, A.; Kandula, S.; Greenberg, A.; Kim, C.; Saha, B. Sharing the data center network. In Proceedings of the 8th USENIX Symposium on Networked Systems Design and Implementation (NSDI 11), Boston, MA, USA, 30 March–1 April 2011. [Google Scholar]
- Xia, W.; Zhao, P.; Wen, Y.; Xie, H. A survey on data center networking (DCN): Infrastructure and operations. IEEE Commun. Surv. Tutor. 2016, 19, 640–656. [Google Scholar] [CrossRef]
- Lorenz, E.N. Deterministic Nonperiodic Flow. J. Atmos. Sci. 1963, 20, 130–141. [Google Scholar] [CrossRef]
- Granger, C.W.J. Investigating causal relations by econometric models and cross-spectral methods. In Essays in Econometrics: Collected Papers of Clive W. J. Granger; Harvard University Press: Cambridge, MA, USA, 2001; pp. 31–47. [Google Scholar]
- Moraffah, R.; Sheth, P.; Karami, M.; Bhattacharya, A.; Wang, Q.; Tahir, A.; Raglin, A.; Liu, H. Causal inference for time series analysis: Problems, methods and evaluation. Knowl. Inf. Syst. 2021, 63, 3041–3085. [Google Scholar] [CrossRef]
- Shojaie, A.; Fox, E.B. Granger Causality: A Review and Recent Advances. Annu. Rev. Stat. Its Appl. 2022, 9, 289–319. [Google Scholar] [CrossRef] [PubMed]
- Nandwana, A.; Vij, R.K.; Sharma, D. Causality-Based Thermal Prediction for Data Center. In Proceedings of the 2018 IEEE 23rd International Conference on Emerging Technologies and Factory Automation (ETFA), Torino, Italy, 4–7 September 2018; Volume 1, pp. 1297–1304. [Google Scholar]
- Zheng, P.; Lee, B.C. Hound: Causal Learning for Datacenter-scale Straggler Diagnosis. Proc. ACM Meas. Anal. Comput. Syst. 2018, 2, 1–36. [Google Scholar] [CrossRef]
- Ding, Y. Causal and Interpretable Learning for Datacenter Latency Prediction. Ph.D. Thesis, University of Chicago, Chicago, IL, USA, 2020. [Google Scholar]
- Bhagwat, H.; Singh, A.; Vasan, A.; Sivasubramaniam, A. Thermal influence indices: Causality metrics for efficient exploration of data center cooling. In Proceedings of the 2012 International Green Computing Conference (IGCC), San Jose, CA, USA, 4–8 June 2012; pp. 1–10. [Google Scholar] [CrossRef]
- Patel, J.; Sarkani, S.; Mazzuchi, T.A. Knowledge based data center capacity reduction using sensitivity analysis on causal Bayesian belief network. Inf. Knowl. Syst. Manag. 2013, 12, 135–148. [Google Scholar] [CrossRef]
- Avelar, V.; Azevedo, D.; French, A.; Power, E.N. PUE: A comprehensive examination of the metric. White Pap. 2012, 49. [Google Scholar]
- Liu, Y.; Wei, X.; Xiao, J.; Liu, Z.; Xu, Y.; Tian, Y. Energy consumption and emission mitigation prediction based on data center traffic and PUE for global data centers. Glob. Energy Interconnect. 2020, 3, 272–282. [Google Scholar] [CrossRef]
- Van De Voort, T.; Zavrel, V.; Galdiz, I.T.; Hensen, J. Analysis of performance metrics for data center efficiency. REHVA J. 2017, 5–11. [Google Scholar]
- Lei, N.; Masanet, E. Climate-and technology-specific PUE and WUE estimations for US data centers using a hybrid statistical and thermodynamics-based approach. Resour. Conserv. Recycl. 2022, 182, 106323. [Google Scholar] [CrossRef]
- Flores-Martin, D.; Mahillo, M.; Lemus-Prieto, F.; Corral-García, J.; Rico-Gallego, J.A. Improving Energy Efficiency in a Data Center: PUE Analyzing and Tuning. In Proceedings of the 2025 IEEE 25th International Symposium on Cluster, Cloud and Internet Computing (CCGrid), Tromsø, Norway, 19–22 May 2025; pp. 1–10. [Google Scholar]
- Zhao, P.; Yang, L.; Kang, Z.; Lin, J. On predicting the pue with gated recurrent unit in data centers. In Proceedings of the 2019 IEEE 5th International Conference on Computer and Communications (ICCC), Chengdu, China, 6–9 December 2019; pp. 1664–1670. [Google Scholar]
- Hu, Y.; Tang, Y.; Ji, X.; Chen, Y. A Submerged Building Strategy for Low-Carbon Data Centers in Coal Mining Subsidence Areas: System Design and Energy–Carbon Performance Assessment. Buildings 2025, 15, 3148. [Google Scholar] [CrossRef]
- Setyo, Z.G.M.; Rijal, H.B.; Aqilah, N.; Abdullah, N. Energy Efficiency Measurement Method and Thermal Environment in Data Centers—A Literature Review. Energies 2025, 18, 3689. [Google Scholar] [CrossRef]
- Altmann, A.; Toloşi, L.; Sander, O.; Lengauer, T. Permutation importance: A corrected feature importance measure. Bioinformatics 2010, 26, 1340–1347. [Google Scholar] [CrossRef] [PubMed]
- Meng, F.; Huang, Y.; Lu, Z.; Xiao, H. Multi-user mmWave beam tracking via multi-agent deep Q-learning. ZTE Commun. 2023, 21, 53. [Google Scholar]
- Ji, Y.; Han, J.; Zhao, Y.; Zhang, S.; Gong, Z. Log anomaly detection through gpt-2 for large scale systems. ZTE Commun. 2023, 21, 70. [Google Scholar]
Disclaimer/Publisher’s Note: The statements, opinions and data contained in all publications are solely those of the individual author(s) and contributor(s) and not of MDPI and/or the editor(s). MDPI and/or the editor(s) disclaim responsibility for any injury to people or property resulting from any ideas, methods, instructions or products referred to in the content. |
© 2025 by the authors. Licensee MDPI, Basel, Switzerland. This article is an open access article distributed under the terms and conditions of the Creative Commons Attribution (CC BY) license (https://creativecommons.org/licenses/by/4.0/).