Abstract
In recent years, the widespread adoption of photovoltaic (PV) panels for electricity generation has provided significant momentum toward sustainable energy goals. However, it has been observed that the accumulation of dust and contaminants on panel surfaces markedly reduces efficiency by blocking solar radiation from reaching the surface. Consequently, dust detection has become a critical area of research into the energy efficiency of PV systems. This study proposes SolPowNet, a novel Convolutional Neural Network (CNN) model based on deep learning with a lightweight architecture that is capable of reliably distinguishing between images of clean and dusty panels. The performance of the proposed model was evaluated by testing it on a dataset containing images of 502 clean panels and 340 dusty panels and comprehensively comparing it with state-of-the-art CNN-based approaches. The experimental results demonstrate that SolPowNet achieves an accuracy of 98.82%, providing 5.88%, 3.57%, 4.7%, 18.82%, and 0.02% higher accuracy than the AlexNet, VGG16, VGG19, ResNet50, and Inception V3 models, respectively. These experimental results reveal that the proposed architecture exhibits more effective classification performance than other CNN models. In conclusion, SolPowNet, with its low computational cost and lightweight structure, enables integration into embedded and real-time applications. Thus, it offers a practical solution for optimizing maintenance planning in photovoltaic systems, managing panel cleaning intervals based on data, and minimizing energy production losses.
1. Introduction
The finite nature of fossil fuel reserves and their negative environmental impacts are increasingly highlighting the global significance of renewable energy sources. In this context, solar energy is considered a prominent option in terms of environmental sustainability and energy security. Solar panels form the basis of this process by directly converting energy from the sun into electrical energy. Worldwide, easy access to sunlight has led to the rapid growth of investments in this field. The installed PV capacity is expected to reach 8000 GW by 2050 [1]. However, prolonged exposure of solar panels to dust, dirt, rain, and various weather conditions contaminates the panel surface. This contamination hinders sunlight from reaching the panel surface, leading to significant energy efficiency losses [2]. Researchers have shown that this contamination decreases the energy efficiency of photovoltaic (PV) panels by 10% to 60% [3]. In fact, pollution in Saudi Arabia over a short period of six months results in a 50% loss [4], pollution over 29 months in Nepal causes a 76% loss [5], pollution over two months in certain regions of India leads to a 30% loss [6], and pollution over two months in Kuwait results in a 65% energy loss [7]. Additionally, the layer of dirt traps moisture, causing structural damage such as corrosion to PV panels and reducing the lifespan of the panels [8].
Considering all these negative effects, regular monitoring, cleaning, and maintenance of photovoltaic panels must be carried out without interruption. However, manual monitoring and maintenance processes in large-scale solar power plants require significant time and cost. Therefore, the use of image processing and artificial intelligence (AI) technologies for the automatic monitoring of solar panel performance has become inevitable. These technological approaches both improve maintenance processes and contribute to sustainable energy efficiency [9].
In recent years, rapid advancements in image processing and AI have paved the way for revolutionary innovations across many sectors [6]. Complex problems such as criminal identification through facial recognition, diagnosis of plant diseases in agriculture, and tumor detection in healthcare can now be solved with higher accuracy rates. Thanks to their capacity to derive meaning from large datasets, these technologies offer effective solutions to problems that are difficult to tackle with traditional methods [10,11]. However, the large number of trainable parameters in state-of-the-art CNN models leads to high hardware requirements, including GPUs with significant capacity. In contrast, in the fields where solar power plants are installed, the use of such high-capacity hardware systems is not always feasible. Moreover, the abundance of trainable parameters delays rapid decision-making processes for dust detection in solar power plants. Lightweight CNN models that can operate with a lower hardware capacity and provide instantaneous decisions in real-time applications are needed in literature.
This study aims to develop a deep learning-based model for dust detection on photovoltaic panels. The CNN model, constructed using widely adopted deep learning libraries such as TensorFlow and Keras, can automatically and efficiently distinguish between clean and dusty panels. In this way, cleaning operations in solar power plants can be planned and optimized more effectively, with the objective of increasing energy production efficiency. In this study, the proposed CNN model with an end-to-end architecture was developed and trained using images of PV panels. The main contributions of the study can be summarized as follows:
- A flexible and novel CNN architecture has been developed that allows for the easy modification of all layer sizes and structures.
- Compared to pre-trained CNN models, the developed SolPowNet CNN model is lightweight.
- Dust detection can be performed more rapidly from PV images using devices with a lower hardware capacity. As a result, it offers a usage advantage in real-time analyses for systems operating with drones or stationary monitoring cameras.
- The SolPowNet CNN model demonstrates better performance than existing methods in literature.
In Section 2, an extensive review of pertinent scholarly works within the field is undertaken to establish a theoretical groundwork for the research detailed in this paper. Section 3 elaborates on the dataset used, outlines the architecture of the CNN model, discusses several widely used CNN models, and describes the metrics utilized for the performance evaluation. Section 4 encompasses the experimental design and a comparative assessment of the proposed CNN model to affirm its effectiveness and advantages over alternative methods. The concluding section discusses the results obtained and proposes directions for future research endeavors.
2. Related Work
Recently, image processing techniques and deep learning approaches have been widely used for the automatic determination of solar panel cleanliness. Deep learning architectures such as CNNs have demonstrated superior capabilities in the analysis and classification of visual data. Using these methods, the detection of whether solar panels are dusty or clean can be performed quickly and accurately, thereby enabling the automation of maintenance processes. This has led researchers to focus intensively on this field and has resulted in numerous studies that have made significant contributions to the detection of contamination of PV panels.
Sun et al. conducted a study aimed at improving the detection performance of dust pollution on solar panels using the YOLO architecture. In the study, they showed that the developed YOLO model detected dusty panels with high accuracy compared to some popular deep learning methods and offered faster processing speeds, especially compared to traditional methods. The effectiveness of this method was emphasized particularly for real-time detection applications, and its benefits were highlighted. Experimental studies reported that the PP-YOLO model achieved precision and recall rates of 89.71% and 90.23%, respectively [12].
Maghami et al. installed two panels with identical characteristics on a flat surface in the study area to investigate the effect of dust on PV surfaces. Subsequently, they cleaned one of the PV panels while leaving the other uncleaned and collected hourly PV panel current and voltage data on specific days during different seasons. They calculated power and energy values using this data. In their study, they stated that the total energy produced by the cleaned panel was 11.61 kWh more than the energy produced by the dusty panel. Thus, they demonstrated that dust causes a loss in PV energy production [13].
Mehta and Singh developed automatic dust detection systems that optimize solar energy production and proposed a CNN-SVM-based method for this process. In their study, CNN was combined with a support vector machine (SVM) to enhance system performance. The experimental results demonstrate that the CNN-SVM model can distinguish between clean and dusty panels with 95% accuracy even under complex environmental conditions. The researchers noted that this method provides high accuracy and a low-cost solution [14].
Ghosh et al. proposed the use of a CNN model with the AlexNet architecture to detect dust on solar panels. In experimental studies conducted with the proposed model, they achieved an accuracy of 85% in detecting dust on solar panels. It has been suggested that this approach could automate the processes of detecting and cleaning dust on PV panels, thereby increasing electricity production efficiency [15].
Fan et al. developed a hybrid model that utilizes image processing in conjunction with a residual neural network (RNN) to detect dust accumulation on PV panels. In their model, residual elements are incorporated as skip connections between network layers. This reduces the order of the weight matrices, increasing the model’s flexibility and improving learning accuracy. Furthermore, various image processing techniques, such as transformation, nonlinear interpolation, correction, grid removal, clustering, and segmentation, were used for the classification of dust accumulation. In experimental studies, the model achieved an R2 value of 78.7% and a mean absolute error (MAE) of 3.67, indicating that their method provides a superior prediction accuracy compared to existing methods [16].
Bashirr et al. introduced a hybrid CNN-RF method that transforms electrical parameters in the IV curve into RGB images to detect contamination on solar panels. In this method, the IV curves of the panels are first transformed into RGB images, and then a CNN architecture is employed to extract features from these images. In the final stage, the extracted features are transferred to a Random Forest (RF) classifier, which classifies photovoltaic panels as clean or contaminated. Experimental studies indicate that their method achieves an accuracy of 98% [17].
Recently, sensor-based image detection systems deployed on platforms such as robots and unmanned aerial vehicles (UAVs), as well as computer vision techniques and deep learning approaches, have received increasing attention among researchers. This approach offers significant advantages, particularly in automating and scaling data collection and analysis processes. Details regarding some notable studies conducted in this field are presented in Table 1.

Table 1.
Comparison of methods for detecting dust on solar panels.
3. Materials and Methods
In this section, a novel CNN-based model named SolPowNet is presented for the automatic detection of dust (dirt) on photovoltaic panels. The flowchart of the proposed approach is summarized in Figure 1. This section begins by providing a detailed introduction to the dataset forming the basis of our study, with a comprehensive explanation of its main characteristics. Subsequently, brief overviews of commonly used pre-trained models in transfer learning, namely, AlexNet, VGG16, VGG19, ResNet50, and Inception V3, are provided, setting the stage for the detailed analysis of the performance of the proposed SolPowNet model. The architecture and prominent design components of SolPowNet, which were developed for the effective detection of contamination on PV panels, are then described in detail; finally, the classification metrics used for the objective evaluation of CNN model performance are outlined.
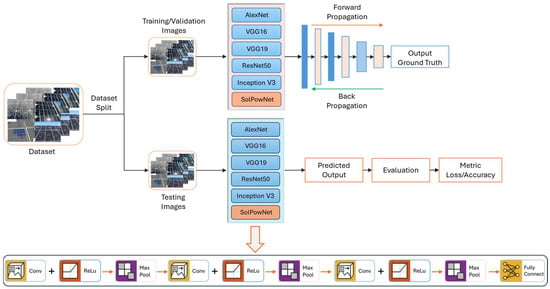
Figure 1.
Flowchart of the proposed model.
3.1. Effect of Dust on Light Attenuation in PV Panels
The efficiency of solar panels depends on the total amount of solar irradiance incident on their surface. In PV systems, the generation of electrical energy relies on the effective absorption of incoming light by the cells, and this relationship is expressed using Equation (1) [27]:
where Pout, G, γ, and T represent the output power of the panel, the irradiance incident on the clean panel surface, the effective surface area of the panel, and the ambient temperature. Additionally, PSTC, GSTC, and TSTC denote the values obtained under Standard Test Conditions (STCs). However, the accumulation of dust and dirt on the panel surface can negatively impact this process [28]. Dust particles obstruct part of the sunlight from reaching the cells by reflecting or absorbing it, leading to a decrease in the panel’s energy conversion rate and, consequently, reducing the overall efficiency of the system [29,30]. Dust accumulation reduces the amount of effective irradiation reaching the panel surface, which is defined by Equation (2):
where Gd, and τd, respectively, represent the radiation in the dusty condition and the attenuation of light caused by dust (optical absorption coefficient). In this case, the Soiling Loss Index (SLI), which leads to a decrease in the efficiency of PV panels, can be defined using Equation (3):
The output power of a dirty photovoltaic module is influenced by previously established parameters in conjunction with the SLI and can be determined using Equation (4):
3.2. Dataset
In this study, the dataset prepared by Gaurav Dutta for the purpose of classifying the clean and dirty states of solar panels was obtained from the publicly accessible Kaggle website [31]. The dataset comprises images of photovoltaic panels categorized into two distinct classes: “clean” and “dirty”. It includes 502 images representing clean panels and 340 images depicting dirty (dusty) panels, resulting in a total of 842 images of PV panels stored in JPEG format. Representative images of clean and dirty panels from the dataset are shown in Figure 2.
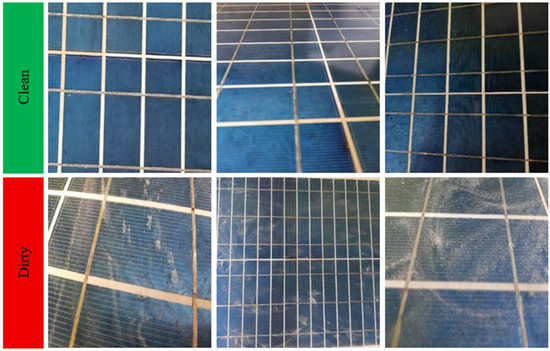
Figure 2.
Representative images of PV panels from the clean and dirty classes.
The images of PV panels in the dataset are in color (RGB) and have a resolution of 512 × 512 pixels. These images were resized to 224 × 224 × 3 to fit the input requirements of the proposed model. The dataset was randomly divided into three separate subsets for model training. This division allocated 80% of images for training, 10% for validation, and 10% for testing. The specifics of this distribution are outlined in Table 2.

Table 2.
Number of images in the training, validation, and test sets.
3.3. Architecture of the Convolutional Neural Network
Deep learning models possess the ability to independently learn complex mapping functions by directly mapping from input data through a deep architectural configuration. This architecture enables learning in a hierarchical arrangement, starting with features from lower levels and progressing toward multiple higher levels. Consequently, these models can exhibit superior performance by capturing unique patterns and relationships within the data without any external intervention [32]. A CNN is a popular deep learning model that is preferred for the classification of large-scale datasets [33,34]. CNN models are utilized in various fields, such as image processing, computer vision, pattern recognition, cybersecurity, time series, speech recognition analysis, and natural language processing [34]. As shown in Figure 3, a CNN model fundamentally consists of three layers: the convolutional, pooling, and fully connected layers.
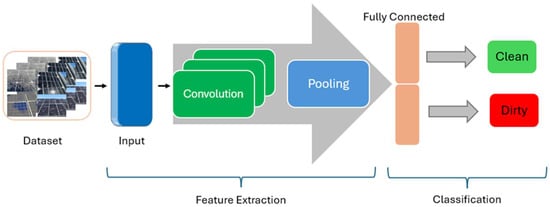
Figure 3.
Basic CNN architecture and layers.
3.3.1. Convolutional Layer
The convolutional (Convltn) layer is a fundamental component in the CNN architecture, enabling the extraction of spatial or temporal features from an input such as an image or signal. This layer comprises a set of learnable filters, known as kernels, and employs the convolution operation, symbolized by “*”, which is distinct from standard matrix multiplication [35]. In the convolutional layer, an n x n filter is rotated by 180° and then placed over the image. Subsequently, the input data values are element-wise multiplied with the elements of the rotated filter. The results of the multiplication are summed and stored in a new matrix [36]. This process is repeated using a sliding window approach from left to right and top to bottom to cover the entire input image [37]. The resulting new matrix is called a feature map. This newly obtained feature map (T) is represented as a new image containing the significant features of the input image X. The 2D convolution operation can be defined using Equation (5):
where X denotes the input image tensor, K denotes the filter weights, and T denotes the resulting feature map.
3.3.2. Pooling Layer
In convolutional neural networks, reducing the size of feature maps not only helps address the problem of model overfitting but also enables a higher-level representation of features in the input data, allowing the network to summarize features within a region [37]. For this reason, the use of a pooling layer following convolutional layers is generally recommended. In the literature, various pooling techniques, like average pooling, max pooling, and sum pooling, are commonly used [35].
3.3.3. Fully Connected Layer
The fully connected layer (FC) serves as the last layer in the CNN architecture, where classification takes place. The fundamental characteristic of this layer is that every neuron links to all neurons in the succeeding layer [35]. In the FC layer, the feature maps produced from the convolutional and pooling layers are converted into a one-dimensional vector. During this conversion, each neuron performs a linear transformation on the input vector using a weight matrix. Subsequently, a nonlinear transformation is carried out using a nonlinear activation function. In this process, the output y can be calculated with Equation (6), where X represents the input vector and W denotes the weights matrix:
Here, b denotes the bias vector, and f represents the activation function, such as ReLU, sigmoid, or softmax.
3.4. Transfer Learning
Transfer learning refers to the strategy of leveraging knowledge learned by a pre-trained model and adapting it to a new task or dataset, thereby reducing the need for extensive data and computation [38]. This approach is especially beneficial in academic and industrial settings where datasets may be small or the cost of training large models from scratch is prohibitive [39]. A common example involves repurposing a large visual classification model for a different visual dataset: by fine-tuning its higher layers while retaining its learned feature representations, the model can quickly specialize to the new task. In doing so, it preserves robust, generalizable feature extraction capabilities such as edge, texture, and shape detectors while efficiently aligning with the target domain’s specific objectives.
3.4.1. AlexNet
AlexNet is a deep learning model developed by Hinton and his students that achieved significant success in the 2012 ImageNet Large-Scale Visual Recognition Challenge (ILSVRC). This network, comprising 60 million parameters, possesses 8 fundamental layers consisting of 5 convolutional layers and 3 FC layers, and a total of 25 layers [40]. In the convolutional layers, the ReLu activation function is used, and max pooling is applied in the first, second, and fifth layers, while dropout techniques are implemented after the convolutional layers to prevent overfitting. Finally, the model concludes with a softmax layer for 1000 classes. The detailed structure of each layer of AlexNet is presented in Table 3 [40,41].

Table 3.
Details of the AlexNet layers.
3.4.2. VGG16
VGG16 is a convolutional neural network design conceptualized by Zisserman and Simonyan at the University of Oxford, developed by the Visual Geometry Group (VGG) [42]. This model attained a test accuracy of 92.77% on the ImageNet dataset, which comprises more than 14 million images across 1000 distinct classes. VGG16 consists of five fundamental blocks that combine convolution and max pooling layers [43]. The first two blocks each contain two convolution layers and one max pooling layer, while the subsequent three blocks each contain three convolution layers and one pooling layer. Input images with a size of 224 × 224 × 3 are progressively reduced in size through the blocks, yielding feature maps with sizes of 112 × 112 × 64, 112 × 112 × 128, 56 × 56 × 256, 28 × 28 × 512, and 7 × 7 × 512, respectively [44]. The detailed layer specifications of the model are presented in Table 4.

Table 4.
Details of the VGG16 layers.
3.4.3. VGG19
The VGG19 model is based on the same core principles as VGG16. The primary difference between the two models is that VGG19 includes one additional convolutional layer in each of blocks 3 through 5 compared to VGG16. As a result, VGG19 includes three additional convolutional layers compared to VGG16. The detailed architectural features and parameter counts of the VGG16 and VGG19 networks are presented in Table 5.

Table 5.
Comparison of the VGG16 and VGG19 architectures.
3.4.4. ResNet50
Since the 2010s, CNN models have been widely used in many fields. Researchers encountered the vanishing gradient problem when designing deeper networks to further improve the performance of CNN models and solve more complex problems. The ResNet (Residual Networks) architecture was developed by He et al. [45] to solve this vanishing gradient problem in deep networks, and this architecture achieved first place in the 2015 ILSVRC competition, with an error rate of 3.57%. As shown in Figure 4, the developed architecture incorporates skip connections, enabling the model to skip certain layers and directly pass features to upper layers.
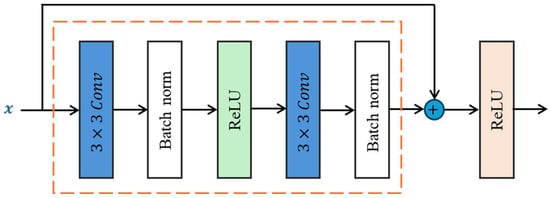
Figure 4.
Skip connection topology.
Residual blocks have two 3 × 3 convolutional layers with the same number of output channels. In the basic structure of ResNet, a convolutional layer is followed by a batch normalization layer and a ReLU activation layer. The architecture also utilizes a structure that skips these two convolution operations, allowing the input to be added directly before the final ReLU activation function. Variants of ResNet include ResNet50 and ResNet101, which contain 50 and 101 layers, respectively [46]. The details of the ResNet50 architecture used in the experimental studies are provided in Table 6 [45].

Table 6.
Details of the ResNet50 layers.
3.4.5. Inception V3
Inception V3 is an improved version of the Inception V1 and Inception V2 architectures that is capable of dimensionality reduction in image recognition and detection. The Inception V1 architecture, developed by Szegedy and colleagues and distinguished in the ILSVRC2014 competition, stands out by enabling various feature extractions within the same network module through parallel convolutional layers and different filter sizes [47]. The Inception modules allow simultaneous multi-scale convolutional filtering via 1 × 1, 3 × 3, and 5 × 5 filters, enabling the model to generate feature representations at different scales with improved classification accuracy. In this method, not all learned filters are utilized within a 22-layer architecture. Unlike previous versions, the V3 version employs factorized structures that reduce the computational cost [48,49]. For instance, instead of a single 5 × 5 convolution, it is decomposed into two stacked 3 × 3 convolutions. In both cases, although the receptive field is 5 × 5, a 5 × 5 convolution kernel has 25 parameters, while in the factorized version, this number is only 18. The Inception V3 architecture is shown in Table 7 [50].

Table 7.
Details of the Inception V3 layers.
3.5. Proposed CNN Model: SolPowNet
This study presents SolPowNet, a novel CNN architecture developed to classify solar panel datasets as clean or dusty. The main advantage of SolPowNet is its reduced number of trainable parameters, which decreases the computational complexity and cost. The architecture comprises ten layers in total, including an input layer, three convolutional layers each succeeded by a ReLU activation function, three max pooling layers, and three fully connected (dense) layers. The convolutional layers utilize 32, 64, and 128 filters, respectively, with all layers employing a kernel size of 3 × 3 and a stride of 1 × 1. The architecture of the proposed SolPowNet model is presented in Figure 5.

Figure 5.
The architecture of the SolPowNet model.
The number of trainable parameters in the CNN architecture is a fundamental metric determining both the computational complexity and the lightness of the model. As the number of parameters increases, the network’s representational power, potential accuracy, training time, memory requirements, and risk of overfitting increase. Conversely, lightweight architectures with fewer parameters offer significant advantages in real-time applications on mobile and embedded systems.
The number of trainable parameters in CNN architectures is directly related to the filter sizes and the generated feature maps used in the layers. Specifically, for feature maps created with filters of size (i × j) over an input of size (n × n), the total number of trainable parameters can be calculated using the formula (i × j × n + 1) × n. The SolPowNet architecture designed within this framework contains approximately 11.17 million trainable parameters, considering the model’s layer structure and filter configurations. Details regarding the SolPowNet layer structure and the parameter distribution in each layer are presented comprehensively in Table 8.

Table 8.
SolPowNet layer structure and detailed parameters.
In the proposed SolPowNet CNN model, the ReLU activation function was preferred in the convolutional layers to alleviate the vanishing gradient problem that may arise and to accelerate the learning process. In this way, the model is enabled to learn faster and achieve better overall performance. The mathematical formula for the ReLU activation function is presented in Equation (7):
On the other hand, the sigmoid activation function was used in the final dense layer of the classification stage. The sigmoid function produces an S-shaped curve with values ranging between 0 and 1. The mathematical formula for this function is given in Equation (8):
Mapping the outputs of this function to the 0–1 interval allows the resulting value to be interpreted as a probability, thereby facilitating a threshold determination in binary classification problems and enhancing the interpretability of the model in terms of reliability. Its formula is provided in Equation (9):
Binary cross-entropy was chosen as the loss function because the dataset considered in experimental studies was divided into two classes. The fundamental property of this function is that it quantitatively measures the agreement between the probability predictions produced by the model and the actual class labels (0 or 1). Binary cross-entropy evaluates the probability values assigned to the correct class through a mechanism of penalization and reward; therefore, as the loss decreases, the model’s predictions approach the true labels more closely. This approach enables a threshold-independent performance evaluation of classifiers that produce probabilistic outputs and provide consistent optimization behavior even in cases of imbalanced class distributions. The mathematical formula for the binary cross-entropy loss is presented in Equation (10):
In the notations used in Equations (9) and (10), represents the input vector for each sample, represents the model’s learnable weights, and the term represents the bias component. The total number of samples is denoted by , while represents the predicted class label probability for the corresponding sample, and represents the corresponding actual class label.
3.6. Metrics for Evaluating Performance
The performance of the proposed model was analyzed using fundamental metrics such as accuracy, precision, recall, and F1-score, which are commonly utilized in the evaluation of CNN models. The confusion matrix shown in Figure 6 was utilized as a reference to compute these metrics, illustrating the rates of accurate and inaccurate predictions for each class.
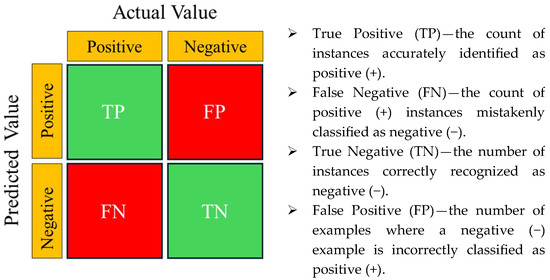
Figure 6.
Confusion matrix.
The mathematical formulas and explanations for these metrics are summarized in Table 9.

Table 9.
Mathematical formulas and explanations for the evaluation metrics.
4. Experimental Setup
In this study, pre-trained deep CNN-based networks such as AlexNet, VGG19, VGG16, ResNet50, and Inception V3 were used to classify the images of PV panels into two classes: dusty and clean. Furthermore, the performance of SolPowNet, our proposed lighter deep CNN architecture, was compared with these networks. The steps related to the flow of the experimental processes are summarized in Figure 1, and the training and evaluation phases were performed on Google Collaboratory (Collab) using online cloud services and A100 GPU hardware. In addition, personal computers with an Intel Core i7-4700HQ processor, 16 GB of RAM, and an NVIDIA GeForce 850M GPU were utilized to manage additional workloads and auxiliary experiments.
In experimental studies, the dataset was randomly divided into three independent subsets: 80% of the data was used for training, 10% for validation, and 10% for testing. To ensure consistency and fair comparability across all experiments, the same training, validation, and testing subsets were maintained across all CNN models. Furthermore, critical hyperparameters that directly affect model performance were empirically optimized, and the same configuration was applied to all models. The final hyperparameters of SolPowNet and state-of-the-art CNN models are presented in Table 10.

Table 10.
The final hyperparameters of SolPowNet and state-of-the-art CNN models.
Furthermore, in contrast to the state-of-the-art CNN models used in experimental studies, the training of the SolPoWNet CNN model followed Algorithm 1 outlined below.
| Algorithm 1. trainSolPowNet (•) |
| Input: Dataset |
| Output: trained SolPowNet (•) |
| 1: Image_resize ← (224 ×224 × 3) |
| 2: { Xtrain, Xvalidation, Xtest } ← train_validation_test_split (Dataset) |
| 3: Initialise: W ← random (•) B ← random (•) Lr ← 0.0001 epochs ← 50 |
| 4: while epoch ≤ epochs do |
| 5: Perform forward propagation with Equation (9) |
| 6: Calculate cost for forward propagation from Equation (10) |
| 7: Optimize cost function with Adam optimizer |
| 8: { W’, b’ } ← gradient_descent (W, b, Xtrain, loss) |
| 9: end while |
| 10: save (trained SolPowNet) |
5. Results and Discussion
In this section, the proposed SolPowNet method is comprehensively compared with current state-of-the-art CNN-based approaches, and after the experimental setup is complete, the steps summarized in Algorithm 1 are used to train the model. The results related to the training process are evaluated based on the training–validation accuracy and training–validation loss graphs presented in Figure 7 and Figure 8. According to Figure 7, the training and validation accuracies are 99.88% and 92.86% in the first epoch, respectively, while these values reach 100% and 94.05% in the last epoch, indicating a steady improvement in the model’s validation performance.
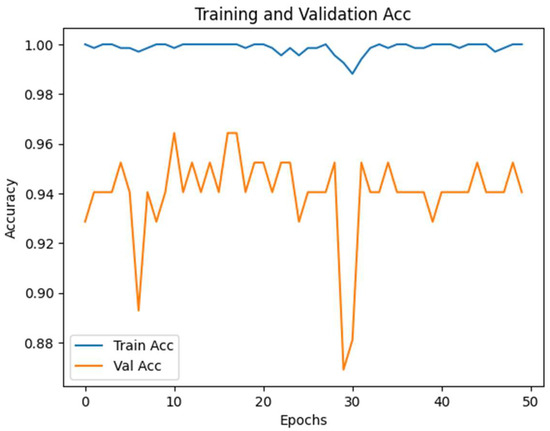
Figure 7.
Graph of the SolPowNet training–validation accuracy.
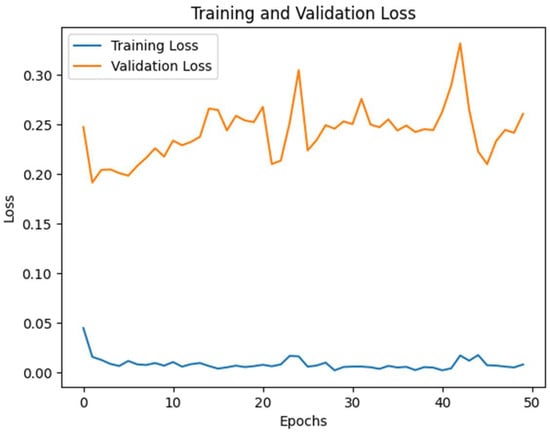
Figure 8.
Graphs of SolPowNet training–validation loss.
Similarly, in Figure 8, the training loss decreases from 0.0033 in the first epoch to 0.0020 in the last epoch, demonstrating that the learning process is progressing stably and the risk of overfitting is controlled. The results related to the training process reveal that the training phase of SolPowNet is balanced, and with the increasing validation performance, the method exhibits strong generalizability.
After the completion of the training process, the performance of the proposed SolPowNet model is comprehensively evaluated on the test dataset. The performance of the proposed model was assessed using the metrics specified in Table 9, and the metrics obtained for the SolPowNet model are presented in Figure 9. The model achieved an accuracy, recall, precision, and F1-score of 98.82%, 100.00%, 97.14%, and 98.55%, respectively.
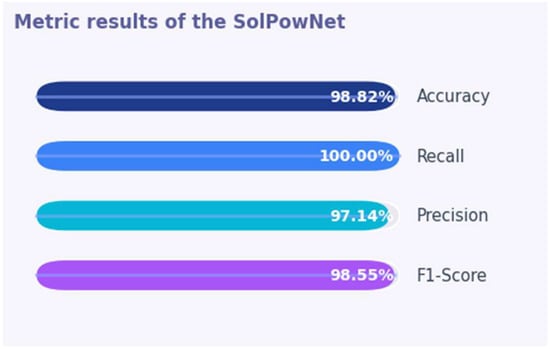
Figure 9.
Metrics of SolPowNet.
Furthermore, to examine the classification accuracy and error distributions in detail, the results are visualized in the confusion matrix presented in Figure 10. The confusion matrix effectively highlights the model’s strengths and weaknesses by illustrating the distributions of true positives, false positives, true negatives, and false negatives for each class. Thus, metrics such as class-based sensitivity and specificity are evaluated in addition to overall accuracy, and pairs of frequently misclassified classes are identified.
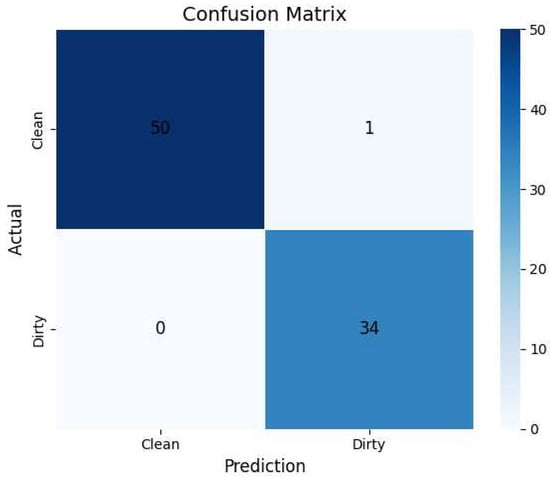
Figure 10.
SolPowNet confusion matrix.
The test dataset presented in Table 2 consists of images of 34 dirty panels and 51 clean panels. The confusion matrix shown in Figure 10 for the proposed SolPowNet model indicates that the model correctly classified all the dusty panels and accurately predicted 50 of the 51 images of clean panels. Only one image of a clean panel was incorrectly labeled as dirty. These results demonstrate that the model achieves high levels of sensitivity and accuracy, exhibiting a particularly strong performance in the detection of dusty panels.
Within the scope of performance evaluations for the proposed model, the receiver operating characteristic (ROC) curve presented in Figure 11 demonstrates the model’s classification capability. ROC curves are graphs illustrating the true positive and false positive rates, and the area under the curve (AUC) ranges from zero to one, representing the overall performance of the classifiers. However, the closer the performance metric is to one (the upper left corner of the curve), the more successful the method. The AUC value of one obtained for the ROC curve in Figure 11 indicates that the model performs class separation flawlessly and demonstrates that the proposed approach extremely effectively classifies the test dataset.

Figure 11.
SolPowNet ROC curve.
In this study, the relationship between the number of trainable parameters presented in Table 11 and accuracy performance was examined comprehensively. While ResNet50, with over 60 million parameters, demonstrated the lowest performance (80.00%), AlexNet with 62 million parameters (92.94%), VGG16 with 138 million parameters (95.25%), and VGG19 with 143.7 million parameters (94.12%) achieved higher, yet similar, accuracy values. In contrast, the proposed SolPowNet, with only 11.17 million parameters, achieved the highest accuracy at 98.82% and exhibited a remarkable advantage in terms of parametric efficiency.

Table 11.
Comparison of the accuracy of SolPowNet and state-of-the-art CNN models on the test dataset.
The findings indicate that the number of trainable parameters does not show a direct correlation with accuracy. However, it should not be disregarded that the number of parameters has decisive impacts on the training speed and hardware requirements. In this regard, selecting CNN models with lightweight architecture is critically important, particularly in resource-constrained environments such as solar power plants. Moreover, such models can provide substantial advantages for devices with limited processing power, including embedded systems (e.g., Raspberry Pi, Jetson Nano, and ESP32-CAM) and real-time systems used with drones or fixed surveillance cameras.
As part of a comprehensive evaluation of the performance of the proposed method, all pre-trained deep learning models were examined by calculating accuracy, recall, precision, and F1-score, with visual comparisons presented in Figure 12.
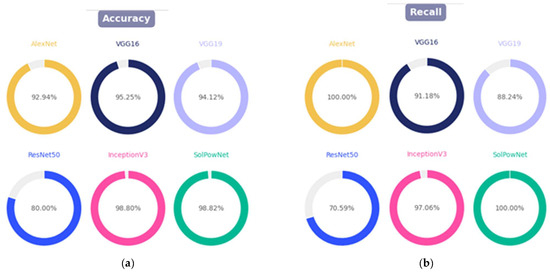
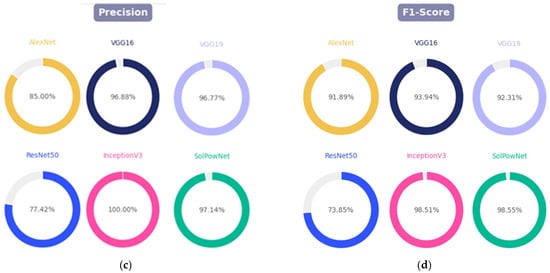
Figure 12.
Graphs comparing the performance comparison of the proposed and state-of-the-art CNN models: (a) accuracy; (b) recall; (c) precision; and (d) F1-score.
In terms of accuracy, the proposed method outperformed all pre-trained models, achieving a success rate of 98.82%. Regarding the recall metric, the AlexNet model demonstrated the highest performance at 100%, while in the precision assessment, the proposed method achieved the second-best result of 97.14%, following Inception V3. Due to the imbalanced distribution of the dataset, the F1 score is particularly critical in this study. In this regard, SolPowNet surpassed all other pre-trained models, providing an F1 score of 98.55%. The F1 scores obtained for the AlexNet, VGG16, VGG19, ResNet50, and Inception V3 models were 91.89%, 93.94%, 92.31%, 73.85%, and 98.51%, respectively.
6. Conclusions
This paper, a novel CNN model named SolPowNet is proposed as a lightweight deep learning architecture with high computational efficiency and low hardware requirements for the automatic detection of surface contamination, one of the most critical factors adversely affecting energy efficiency in PV panels. The proposed architecture consists of a total of ten layers, including an input layer, three convolutional layers, three max pooling layers, and three fully connected layers. By limiting the number of parameters to 11.17 million, the model aims to reduce computational complexity and provide a solution suitable for deployment on embedded or low-capacity systems.
In the experimental studies, a dataset comprising images of 340 soiled solar panels and 502 clean solar panels was used, enabling a quantitative assessment of the model’s contamination detection performance under real-world conditions. Without applying any preprocessing to the dataset, all images were resized to 224 × 224 × 3 dimensions for compatibility with SolPowNet and other compared deep learning models. As a result of the comprehensive experimental evaluation, the proposed model demonstrated the reliable and effective classification of solar panel surface states (dusty/clean), achieving performance metrics of 98.82% accuracy, 100% recall, 97.14% precision, and 98.55% F1 score.
Furthermore, in comparative experiments conducted to analytically validate SolPowNet classification performance, the model was benchmarked against current and widely used CNN architectures, including AlexNet, VGG16, VGG19, ResNet50, and Inception V3. In terms of accuracy, SolPowNet outperformed AlexNet, VGG16, VGG19, ResNet50, and Inception V3 by 5.88%, 3.57%, 4.70%, 18.82%, and 0.02%, respectively. While SolPowNet and AlexNet showed the same recall performance, SolPowNet surpassed VGG16, VGG19, ResNet50, and Inception V3 by 8.82%, 11.76%, 29.14%, and 2.94%, respectively. Although the precision of Inception V3 exceeded SolPowNet by 2.86%, the proposed model yielded 12.14% and 19.72% better results than AlexNet and ResNet50, respectively, and outperformed all compared models in the F1 score. These results can be regarded as evidence of the reliable applicability of SolPowNet in real-world PV system applications, such as condition monitoring, maintenance planning, and efficiency optimization, given its ability to achieve high accuracy with fewer parameters and lower hardware costs.
Although the SolPowNet model delivers satisfactory results in determining the dirty (dusty) and clean states of PV panels, developing CNN models better suited for real-time applications is needed. In this way, by further minimizing the application constraints of the lightweight SolPowNet deep CNN model, more suitable solutions can be provided for real-time embedded systems.
Future research could focus on incorporating the model into embedded systems designed for real-time operation. In this context, SolPowNet could facilitate online performance monitoring within intelligent solar tracking stations that utilize drones or stationary camera setups. Furthermore, by expanding the model’s architecture to incorporate thermal or infrared imaging data, it would enable the simultaneous analysis of various parameters, including the panel surface temperature or cell faults, in addition to dust, all within a unified network architecture.
Author Contributions
Conceptualization, M.A. and Ö.F.A.; methodology, M.A.; software, M.A. and Ö.F.A.; validation, M.A., Ö.F.A. and A.A.; formal analysis, M.A., Ö.F.A. and A.A.; writing—original draft preparation, M.A., Ö.F.A. and A.A.; writing—review and editing, M.A., Ö.F.A. and A.A.; visualization, M.A. All authors have read and agreed to the published version of the manuscript.
Funding
This research received no external funding.
Data Availability Statement
A publicly available dataset was used (https://www.kaggle.com/datasets/hemanthsai7/solar-panel-dust-detection) accessed on 10 March 2025.
Conflicts of Interest
The authors declare no conflicts of interest.
References
- Qi, J.; Dong, Q.; Song, Y.; Zhao, X.; Shi, L. Combining Dust Scaling Behaviors of PV Panels and Water Cleaning Methods. Renew. Sustain. Energy Rev. 2025, 212, 115394. [Google Scholar] [CrossRef]
- Onim, M.S.H.; Sakif, Z.M.M.; Ahnaf, A.; Kabir, A.; Azad, A.K.; Oo, A.M.T.; Afreen, R.; Hridy, S.T.; Hossain, M.; Jabid, T.; et al. SolNet: A Convolutional Neural Network for Detecting Dust on Solar Panels. Energies 2023, 16, 155. [Google Scholar] [CrossRef]
- Hussain, A.; Batra, A.; Pachauri, R. An Experimental Study on Effect of Dust on Power Loss in Solar Photovoltaic Module. Renew. Wind Water Sol. 2017, 4, 9. [Google Scholar] [CrossRef]
- Adinoyi, M.J.; Said, S.A.M. Effect of Dust Accumulation on the Power Outputs of Solar Photovoltaic Modules. Renew. Energy 2013, 60, 633–636. [Google Scholar] [CrossRef]
- Paudyal, B.R.; Shakya, S.R. Dust Accumulation Effects on Efficiency of Solar PV Modules for off Grid Purpose: A Case Study of Kathmandu. Sol. Energy 2016, 135, 103–110. [Google Scholar] [CrossRef]
- Vaishak, S.; Bhale, P.V. Effect of Dust Deposition on Performance Characteristics of a Refrigerant Based Photovoltaic/Thermal System. Sustain. Energy Technol. Assess. 2019, 36, 100548. [Google Scholar] [CrossRef]
- Mekhilef, S.; Saidur, R.; Kamalisarvestani, M. Effect of Dust, Humidity and Air Velocity on Efficiency of Photovoltaic Cells. Renew. Sustain. Energy Rev. 2012, 16, 2920–2925. [Google Scholar] [CrossRef]
- Noura, H.N.; Chahine, K.; Bassil, J.; Abou Chaaya, J.; Salman, O. Efficient Combination of Deep Learning Models for Solar Panel Damage and Soiling Detection. Measurement 2025, 251, 117185. [Google Scholar] [CrossRef]
- Abdelsattar, M.; Rasslan, A.A.A.; Emad-Eldeen, A. Detecting Dusty and Clean Photovoltaic Surfaces Using MobileNet Variants for Image Classification. SVU-Int. J. Eng. Sci. Appl. 2025, 6, 9–18. [Google Scholar] [CrossRef]
- Sladojevic, S.; Arsenovic, M.; Anderla, A.; Culibrk, D.; Stefanovic, D. Deep Neural Networks Based Recognition of Plant Diseases by Leaf Image Classification. Comput. Intell. Neurosci. 2016, 2016, 3289801. [Google Scholar] [CrossRef]
- Yilmaz, A. Brain Tumor Detection from MRI Images with Using Proposed Deep Learning Model: The Partial Correlation-Based Channel Selection. Turk. J. Electr. Eng. Comput. Sci. 2021, 29, 2615–2633. [Google Scholar] [CrossRef]
- Sun, T.; Gao, H.; Fan, S.; Hu, X. Enhancing Dust Detection on Photovoltaic Panels with PP-YOLO: A Deep Learning Approach. In Proceedings of the 2024 4th International Conference on Machine Learning and Intelligent Systems Engineering (MLISE), Zhuhai, China, 28–30 June 2024; IEEE: Piscataway, NJ, USA, 2024; pp. 24–28. [Google Scholar] [CrossRef]
- Maghami, M.; Hizam, H.; Gomes, C. Impact of Dust on Solar Energy Generation Based on Actual Performance. In Proceedings of the 2014 IEEE International Conference on Power and Energy (PECon), Kuching, Malaysia, 1–3 December 2014; IEEE: Piscataway, NJ, USA, 2014; pp. 388–393. [Google Scholar] [CrossRef]
- Mehta, S.; Singh, M. Optimizing Solar Energy Output Through Automated Dust Detection Using CNN-SVM. In Proceedings of the 2024 5th International Conference on Smart Electronics and Communication (ICOSEC), Trichy, India, 18–20 September 2024; IEEE: Piscataway, NJ, USA, 2024; pp. 920–924. [Google Scholar] [CrossRef]
- Ghosh, A.; Afrin, S.; Tithy, R.S.; Nahid, F.; Alam, F.; Reza, A.W. Improving Solar Panel Efficiency: A CNN-Based System for Dust Detection and Maintenance. In Proceedings of the 2nd International Conference on Big Data, IoT and Machine Learning, Dhaka, Bangladesh, 6–8 September 2023; Volume 867, pp. 673–684. [Google Scholar] [CrossRef]
- Fan, S.; Wang, Y.; Cao, S.; Zhao, B.; Sun, T.; Liu, P. A Deep Residual Neural Network Identification Method for Uneven Dust Accumulation on Photovoltaic (PV) Panels. Energy 2022, 239, 122302. [Google Scholar] [CrossRef]
- Bashir, S.B.; Farag, M.M.; Hamid, A.-K.; Adam, A.A.; Bansal, R.C.; Mbungu, N.T.; Elnady, A.; Abo-Khalil, A.G.; Hussein, M. Innovative Dust Detection and Efficient Cleaning of PV Panels: A CNN-RF Approach Using I–V Curve Data Transformed into RGB Mosaics. Energy Convers. Manag. X 2025, 27, 101079. [Google Scholar] [CrossRef]
- Winkel, P.; Wilbert, S.; Röger, M.; Krauth, J.J.; Algner, N.; Nouri, B.; Wolfertstetter, F.; Carballo, J.A.; Alonso-Garcia, M.C.; Polo, J.; et al. Cell-Resolved PV Soiling Measurement Using Drone Images. Remote Sens. 2024, 16, 2617. [Google Scholar] [CrossRef]
- Khalid, H.M.; Rafique, Z.; Muyeen, S.M.; Raqeeb, A.; Said, Z.; Saidur, R.; Sopian, K. Dust Accumulation and Aggregation on PV Panels: An Integrated Survey on Impacts, Mathematical Models, Cleaning Mechanisms, and Possible Sustainable Solution. Sol. Energy 2023, 251, 261–285. [Google Scholar] [CrossRef]
- Bassil, J.; Noura, H.N.; Salman, O.; Chahine, K.; Guizani, M. Efficient Combination of Deep Learning and Tree-Based Classification Models for Solar Panel Dust Detection. Intell. Syst. Appl. 2025, 26, 200509. [Google Scholar] [CrossRef]
- Alatwi, A.M.; Albalawi, H.; Wadood, A.; Anwar, H.; El-Hageen, H.M. Deep Learning-Based Dust Detection on Solar Panels: A Low-Cost Sustainable Solution for Increased Solar Power Generation. Sustainability 2024, 16, 8664. [Google Scholar] [CrossRef]
- Özer, T.; Türkmen, Ö. An Approach Based on Deep Learning Methods to Detect the Condition of Solar Panels in Solar Power Plants. Comput. Electr. Eng. 2024, 116, 109143. [Google Scholar] [CrossRef]
- Li, M.; Wang, Y. Deep Learning for Dust Accumulation Analysis on Desert Solar Panels: A CNN-Transformer Approach. IEEE Access 2025, 13, 69857–69872. [Google Scholar] [CrossRef]
- Abd, H.S.; Judran, H.K.; Aun, S.H.A.; Jaddoa, A.A.; Hammoodi, K.A.; Kadhim, S.A.; Daif, J.M. Dust Deposition and Cleaning Effect on PV Panel: Experimental Approach. Results Eng. 2025, 27, 106041. [Google Scholar] [CrossRef]
- Abuqaaud, K.A.; Ferrah, A. A Novel Technique for Detecting and Monitoring Dust and Soil on Solar Photovoltaic Panel. In Proceedings of the 2020 Advances in Science and Engineering Technology International Conferences (ASET), Dubai, United Arab Emirates, 4 February–9 April 2020; IEEE: Piscataway, NJ, USA, 2020; pp. 1–6. [Google Scholar] [CrossRef]
- Shao, Y.; Zhang, C.; Xing, L.; Sun, H.; Zhao, Q.; Zhang, L. A New Dust Detection Method for Photovoltaic Panel Surface Based on Pytorch and Its Economic Benefit Analysis. Energy AI 2024, 16, 100349. [Google Scholar] [CrossRef]
- Al-Addous, M.; Dalala, Z.; Alawneh, F.; Class, C.B. Modeling and Quantifying Dust Accumulation Impact on PV Module Performance. Sol. Energy 2019, 194, 86–102. [Google Scholar] [CrossRef]
- Fatima, K.; Faiz Minai, A.; Malik, H.; García Márquez, F.P. Experimental Analysis of Dust Composition Impact on Photovoltaic Panel Performance: A Case Study. Sol. Energy 2024, 267, 112206. [Google Scholar] [CrossRef]
- Yakubu, S.; Samikannu, R.; Gawusu, S.; Wetajega, S.D.; Okai, V.; Shaibu, A.K.S.; Workneh, G.A. A Holistic Review of the Effects of Dust Buildup on Solar Photovoltaic Panel Efficiency. Sol. Compass 2025, 13, 100101. [Google Scholar] [CrossRef]
- Chen, L.; Fan, S.; Sun, S.; Cao, S.; Sun, T.; Liu, P.; Gao, H.; Zhang, Y.; Ding, W. A Detection Model for Dust Deposition on Photovoltaic (PV) Panels Based on Light Transmittance Estimation. Energy 2025, 322, 135284. [Google Scholar] [CrossRef]
- Dutta, G. Dataset of Solar Panel Dust Detection. Available online: https://www.kaggle.com/datasets/hemanthsai7/solar-panel-dust-detection (accessed on 10 March 2025).
- Sarker, I.H. Deep Learning: A Comprehensive Overview on Techniques, Taxonomy, Applications and Research Directions. SN Comput. Sci. 2021, 2, 420. [Google Scholar] [CrossRef]
- Aslan, M. CoviDetNet: A New COVID-19 Diagnostic System Based on Deep Features of Chest x-Ray. Int. J. Imaging Syst. Technol. 2022, 32, 1447–1463. [Google Scholar] [CrossRef]
- Zhao, J.; Mao, X.; Chen, L. Speech Emotion Recognition Using Deep 1D & 2D CNN LSTM Networks. Biomed. Signal Process. Control. 2019, 47, 312–323. [Google Scholar] [CrossRef]
- Balaha, H.M.; El-Gendy, E.M.; Saafan, M.M. CovH2SD: A COVID-19 Detection Approach Based on Harris Hawks Optimization and Stacked Deep Learning. Expert Syst. Appl. 2021, 186, 115805. [Google Scholar] [CrossRef]
- Lei, X.; Pan, H.; Huang, X. A Dilated Cnn Model for Image Classification. IEEE Access 2019, 7, 124087–124095. [Google Scholar] [CrossRef]
- Woźniak, M.; Siłka, J.; Wieczorek, M. Deep Neural Network Correlation Learning Mechanism for CT Brain Tumor Detection. Neural Comput. Appl. 2023, 35, 14611–14626. [Google Scholar] [CrossRef]
- Pires de Lima, R.; Marfurt, K. Convolutional Neural Network for Remote-Sensing Scene Classification: Transfer Learning Analysis. Remote Sens. 2019, 12, 86. [Google Scholar] [CrossRef]
- Hussain, M.; Bird, J.J.; Faria, D.R. A Study on CNN Transfer Learning for Image Classification. In Proceedings of the 18th UK Workshop on Computational Intelligence, Nottinghma, UK, 5–7 September 2018; Volume 840, pp. 191–202. [Google Scholar] [CrossRef]
- Krizhevsky, A.; Sutskever, I.; Hinton, G.E. ImageNet Classification with Deep Convolutional Neural Networks. Adv. Neural Inf. Process. Syst. 2012, 2, 1097–1105. [Google Scholar] [CrossRef]
- Shin, H.C.; Roth, H.R.; Gao, M.; Lu, L.; Xu, Z.; Nogues, I.; Yao, J.; Mollura, D.; Summers, R.M. Deep Convolutional Neural Networks for Computer-Aided Detection: CNN Architectures, Dataset Characteristics and Transfer Learning. IEEE Trans. Med. Imaging 2016, 35, 1285–1298. [Google Scholar] [CrossRef] [PubMed]
- Simonyan, K.; Zisserman, A. Very Deep Convolutional Networks for Large-Scale Image Recognition. In Proceedings of the 3rd International Conference on Learning Representations, ICLR 2015—Conference Track Proceedings, San Diego, CA, USA, 7–9 May 2015. [Google Scholar] [CrossRef]
- Praharsha, C.H.; Poulose, A. CBAM VGG16: An Efficient Driver Distraction Classification Using CBAM Embedded VGG16 Architecture. Comput. Biol. Med. 2024, 180, 108945. [Google Scholar] [CrossRef]
- Mascarenhas, S.; Agarwal, M. A Comparison between VGG16, VGG19 and ResNet50 Architecture Frameworks for Image Classification. In Proceedings of the 2021 International Conference on Disruptive Technologies for Multi-Disciplinary Research and Applications (CENTCON), Bengaluru, India, 19–21 November 2021; pp. 96–99. [Google Scholar] [CrossRef]
- He, K.; Zhang, X.; Ren, S.; Sun, J. Deep Residual Learning for Image Recognition. In Proceedings of the IEEE Computer Society Conference on Computer Vision and Pattern Recognition, Las Vegas, NV, USA, 27–30 June 2016; pp. 770–778. [Google Scholar] [CrossRef]
- Bohlol, P.; Hosseinpour, S.; Soltani Firouz, M. Improved Food Recognition Using a Refined ResNet50 Architecture with Improved Fully Connected Layers. Curr. Res. Food Sci. 2025, 10, 101005. [Google Scholar] [CrossRef]
- Szegedy, C.; Liu, W.; Jia, Y.; Sermanet, P.; Reed, S.; Anguelov, D.; Erhan, D.; Vanhoucke, V.; Rabinovich, A. Going Deeper with Convolutions. In Proceedings of the IEEE Computer Society Conference on Computer Vision and Pattern Recognition, Boston, MA, USA, 7–12 June 2015; pp. 1–9. [Google Scholar] [CrossRef]
- Szegedy, C.; Vanhoucke, V.; Ioffe, S.; Shlens, J.; Wojna, Z. Rethinking the Inception Architecture for Computer Vision. In Proceedings of the IEEE Computer Society Conference on Computer Vision and Pattern Recognition, Las Vegas, NV, USA, 27–30 June 2016; pp. 2818–2826. [Google Scholar] [CrossRef]
- Onim, M.S.H.; Nyeem, H.; Roy, K.; Hasan, M.; Ishmam, A.; Akif, M.A.H.; Ovi, T.B. BLPnet: A New DNN Model and Bengali OCR Engine for Automatic Licence Plate Recognition. Array 2022, 15, 100244. [Google Scholar] [CrossRef]
- Cao, J.; Yan, M.; Jia, Y.; Tian, X.; Zhang, Z. Application of a Modified Inception-v3 Model in the Dynasty-Based Classification of Ancient Murals. EURASIP J. Adv. Signal Process. 2021, 2021, 49. [Google Scholar] [CrossRef]
Disclaimer/Publisher’s Note: The statements, opinions and data contained in all publications are solely those of the individual author(s) and contributor(s) and not of MDPI and/or the editor(s). MDPI and/or the editor(s) disclaim responsibility for any injury to people or property resulting from any ideas, methods, instructions or products referred to in the content. |
© 2025 by the authors. Licensee MDPI, Basel, Switzerland. This article is an open access article distributed under the terms and conditions of the Creative Commons Attribution (CC BY) license (https://creativecommons.org/licenses/by/4.0/).