Article

LPI Radar Waveform Modulation Recognition Based on Improved EfficientNet

1
Early Warning Intelligence Department, Air Force Early Warning Academy, Wuhan 430019, China
2
North Automatic Control Technology Institute, Taiyuan 030000, China
*
Author to whom correspondence should be addressed.
Electronics 2025, 14(21), 4214; https://doi.org/10.3390/electronics14214214
Submission received: 22 September 2025 / Revised: 16 October 2025 / Accepted: 25 October 2025 / Published: 28 October 2025

Abstract

To address the challenge of low modulation recognition accuracy for Low Probability of Intercept (LPI) radar waveforms under low Signal-to-Noise Ratio (SNR) conditions—a critical limitation in current radar signal processing research—this study proposes a novel recognition framework anchored in an improved EfficientNet model. First, to generate time–frequency images, the radar signals are initially subjected to time–frequency analysis using the Choi–Williams Distribution (CWD). Second, the Mobile Inverted Bottle-neck Convolution (MBConv) structure incorporates the Simple Attention Module (SimAM) to improve the network’s capacity to extract features from time–frequency images. Specifically, the original serial mechanism within the MBConv structure is replaced with a parallel convolution and attention approach, further optimizing feature extraction efficiency. Third, the network’s loss function is upgraded to Focal Loss. This modification aims to mitigate the issue of low recognition rates for specific radar signal types during training: by dynamically adjusting the loss weights of hard-to-recognize samples, it effectively improves the classification accuracy of challenging categories. Simulation experiments were conducted on 13 distinct types of LPI radar signals. The results demonstrate that the improved model validates the effectiveness of the proposed approach for LPI waveform modulation recognition, achieving an overall recognition accuracy of 96.48% on the test set.

1. Introduction

With its excellent stealth and anti-jamming characteristics, Low Probability of Interception (LPI) radars have gained increasing popularity in electronic warfare in recent years, owing to rapid advancements in radar technology. By emitting waveforms with sophisticated modulation patterns, LPI radars enhance battlefield survivability and reduce the probability of detection by adversaries. However, the intricate diversity of LPI radar signals poses significant challenges to the recognition of waveform modulation [1,2]. As a result, accurate and efficient identification of LPI radar modulation types has become increasingly critical for achieving superiority in electronic spectrum warfare.
Conventional methods for recognizing LPI radar waveform modulations primarily rely on signal-processing techniques such as feature matching, cyclic–stationary feature extraction, and time–frequency analysis [3,4,5]. While these approaches demonstrate satisfactory performance under certain conditions, they often suffer from limited robustness and high computational costs when confronted with challenges such as multipath effects, noise interference, and increasing signal complexity. With recent advancements in deep learning, a growing number of researchers have turned to deep learning-based methods to address the problem of LPI radar waveform modulation recognition [6,7,8,9,10,11,12]. These techniques show remarkable improvements in feature extraction and classification performance. However, when applied to LPI radar signals, current deep learning models still exhibit several limitations. On one hand, these models often underperform in the extraction of discriminative features under low signal-to-noise ratio (SNR) conditions, leading to suboptimal modulation recognition accuracy. On the other hand, many models incorporate excessively deep network architectures with a large number of parameters, resulting in high computational demands, prolonged training time, and difficulties in meeting real-time processing requirements. Moreover, the dynamic and diverse nature of LPI radar signals calls for more robust and generalizable feature extraction models.
Two primary methods can be used to widely classify deep learning-based LPI radar waveform modulation recognition. The first method uses deep neural networks to recognize waveform modulations by extracting features from the radar’s time-domain signal, which is used as the network input. Wei et al. [11] completed the identification challenge for radar source signals with six different waveform modulations using CNN, LSTM, and DNN. Using a one-dimensional convolutional neural network with attention mechanism (CNN-1D-AM), Wu et al. [12] detected seven different basic radar transmission signals with an SNR of −6 dB and a recognition rate that was close to 95%. In ref. [13], 13 typical waveforms were recognized using a multi-channel one-dimensional convolutional neural network with input from radar echoes. The other approach uses time–frequency analysis techniques to transform radar source data into time–frequency images, which are then used to train deep neural network models that can detect radar sources. Using the Choi–Williams Distribution (CWD) and building LPI-Net for radar source signal identification, ref. [7] achieved 98.6% accuracy for 13 waveform modulations at an SNR of 0 dB. Utilizing the structural resemblance between matching filters and convolutional kernels, Paper [8] suggested a ResNeSt network that used a fuzzy inference system inside an adaptive network for preprocessing filtering, improving spatiotemporal image properties when SNR is low. In order to cope with noise interference in signals, ref. [14] divided noisy images into several patches and applied a convolutional autoencoder on each patch. In [10], a locally dense connected U-Net was integrated with the SRR-loss function to mitigate noise interference and enhance the features of time–frequency images (TFIs). A novel algorithm combining ConvNeXt with Focal Loss was introduced in [15] to improve the identification and filtering of LPI radar signals. Meanwhile, ref. [16] achieved 97.94% recognition accuracy when SNR is −8 dB for radar signals with 12 LPI modulation types by using an asymmetric dilated convolution coordinate attention residual networks.
By using a composite scaling technique that incorporates depth, width, and resolution, EfficientNet [17], an effective deep learning model, strikes a solid balance between computing efficiency and performance. EfficientNet has proven to perform exceptionally well in a variety of fields, including object detection and image categorization. Significant benefits are offered for applications in resource-constrained contexts by its effective network architecture design. Nevertheless, there are difficulties when using the original EfficientNet directly for LPI radar waveform modulation recognition: Radar signals have feature distributions that differ greatly from those of natural images and are usually displayed as time–frequency graphs or one-dimensional sequences. During feature extraction, this discrepancy could make it difficult for the model to accurately represent the signals’ time–frequency properties, and the pre-trained model of EfficientNet lacks domain-specific radar signal expertise because it is built on the ImageNet dataset. Therefore, its capacity to generalize within the radar signal domain is limited when using a pre-trained model. Meanwhile, the original EfficientNet also does not perform well in low-noise conditions. Therefore, it has become essential to adapt EfficientNet for the LPI radar waveform modulation recognition task in order to improve recognition accuracy.
To solve the problem of recognizing LPI radar signal modulation under low-SNR conditions, we propose a recognition method based on an improved EfficientNet architecture. Our work mainly focuses on three key aspects: selecting a better time–frequency transformation method, building an effective network for feature extraction, and implementing efficient training strategies. First, the original radar data is transformed into two-dimensional time–frequency images using the CWD method. Then, the improved EfficientNet model is trained, where the Focal Loss function is introduced to better handle categories with lower classification accuracy. Meanwhile, the Mobile Inverted Bottle-neck Convolution (MBConv) module of EfficientNet is modified by integrating the Simple Attention Module (SimAM) and redesigning the convolution and attention processes in parallel instead of in series. Finally, experiments on a simulated dataset with 13 LPI radar modulation types demonstrate that the proposed approach achieves a classification accuracy of 96.48%, outperforming comparable methods. The major contributions to this paper are listed as follows:
  • A deep network architecture based on improved EfficientNet is proposed. By incorporating the SimAM into EfficientNet’s MBConv structure and designing a parallel architecture, we effectively mitigate the impact of noisy features in time–frequency images on payment method recognition.
  • During training, the Focal Loss function is used in place of the original cross-entropy loss function to overcome the problem of misclassification caused by similarities across specific modulation. By dynamically allocating higher loss weights to samples that are hard to recognize during training, this strategy forces the model to concentrate more on samples that are hard to recognize, thus increasing recognition accuracy.
  • Experiments were carried out using a simulated dataset with 13 types of LPI radar modulation. The results indicate that the suggested approach reaches a classification accuracy of 96.48%.
The rest of this article is organized as follows: Section 2 introduces the LPI radar signal, including the signal model and CWD method. Section 3 presents the EfficientNet architecture and details its improvements. Section 4 conducts simulation experiments and analysis. Section 5 summarizes the paper.

2. LPI Radar Signal and Processing

2.1. LPI Radar Signal Model

The LPI radar signal y ( k ) received by electronic reconnaissance equipment can be described as follows [1]:
y ( k ) = A ( k ) e j θ ( k ) + w ( k )
where k is the index value increasing with sampling interval sequentially, A ( k ) is the instant amplitude. θ ( k ) is the instantaneous phase of the ideal sampling signal. w ( k ) is the additive noise, typically modeled as Additive White Gaussian Noise (AWGN), instantaneous frequency f ( k ) , and instantaneous phase offset ϕ ( k ) can be used to further computationally express instantaneous phase θ ( k ) as follows:
θ ( k ) = 2 π   f ( k ) ( k T s ) + ϕ ( k )
where T s is the signal sampling interval time. The LPI signal modulation is similar, making waveform recognition challenging. We set A ( k ) = 1 , employing Frequency Modulation (FM) and Phase Modulation (PM) to simulate 13 LPI Radar signals in this paper.

2.2. CWD Method

The radar time-domain signal must first be converted into a time–frequency image using time–frequency analysis in order to discover LPI radar waveform modulations utilizing deep learning techniques. The way that signal frequency changes over time is intuitively revealed by this method, which combines analysis in the time and frequency domains. Time–frequency analysis turns out to be practical for radar signal detection since time–frequency images show different properties for various modulation patterns. One of these is the quadratic time–frequency distribution, which includes CWD technique [7,16,18,19,20]. Using a kernel function that is exponentially weighted, it successfully inhibits cross-term interference. In this study, a time–frequency image is obtained by performing time–frequency transformation on the radar radiation source signal using the CWD approach. The following is the CWD time–frequency transformation formula:
C W D ( t , ω ) = 1 2 π x ( μ + τ 2 ) . x * ( u τ 2 ) ϕ ( ξ , τ ) e j ( ξ μ τ ω ξ t ) d μ d τ d ξ
where t , ω denote time and angular frequency separately, τ denotes the time delay, ϕ ( ξ , τ ) is a kernel function:
ϕ ( ξ , τ ) = e ξ 2 τ 2 / σ
where σ is a scaling factor, and the larger the value of σ , the higher the corresponding time–frequency resolution, but the more severe the cross-talk. Conversely, the smaller the σ , the lower the time–frequency resolution, but the better the cross-talk suppression. The value of σ is set to 1 in order to balance time–frequency resolution and cross-talk.
In this paper, radar signals are first converted into time–frequency images through time–frequency transformation, and then into grayscale images to accelerate training and reduce network parameters. To meet EfficientNet’s input requirements, all images are resized to 224 × 224. Under an SNR of 0 dB, the grayscale images obtained from 13 different radar waveform modulations are shown in Figure 1. The CWD-based time–frequency analysis reveals clear differences among modulation types, but some waveforms remain visually similar in the time–frequency domain. Therefore, feature extraction with trained networks is required for accurate classification.

3. The Proposed Method

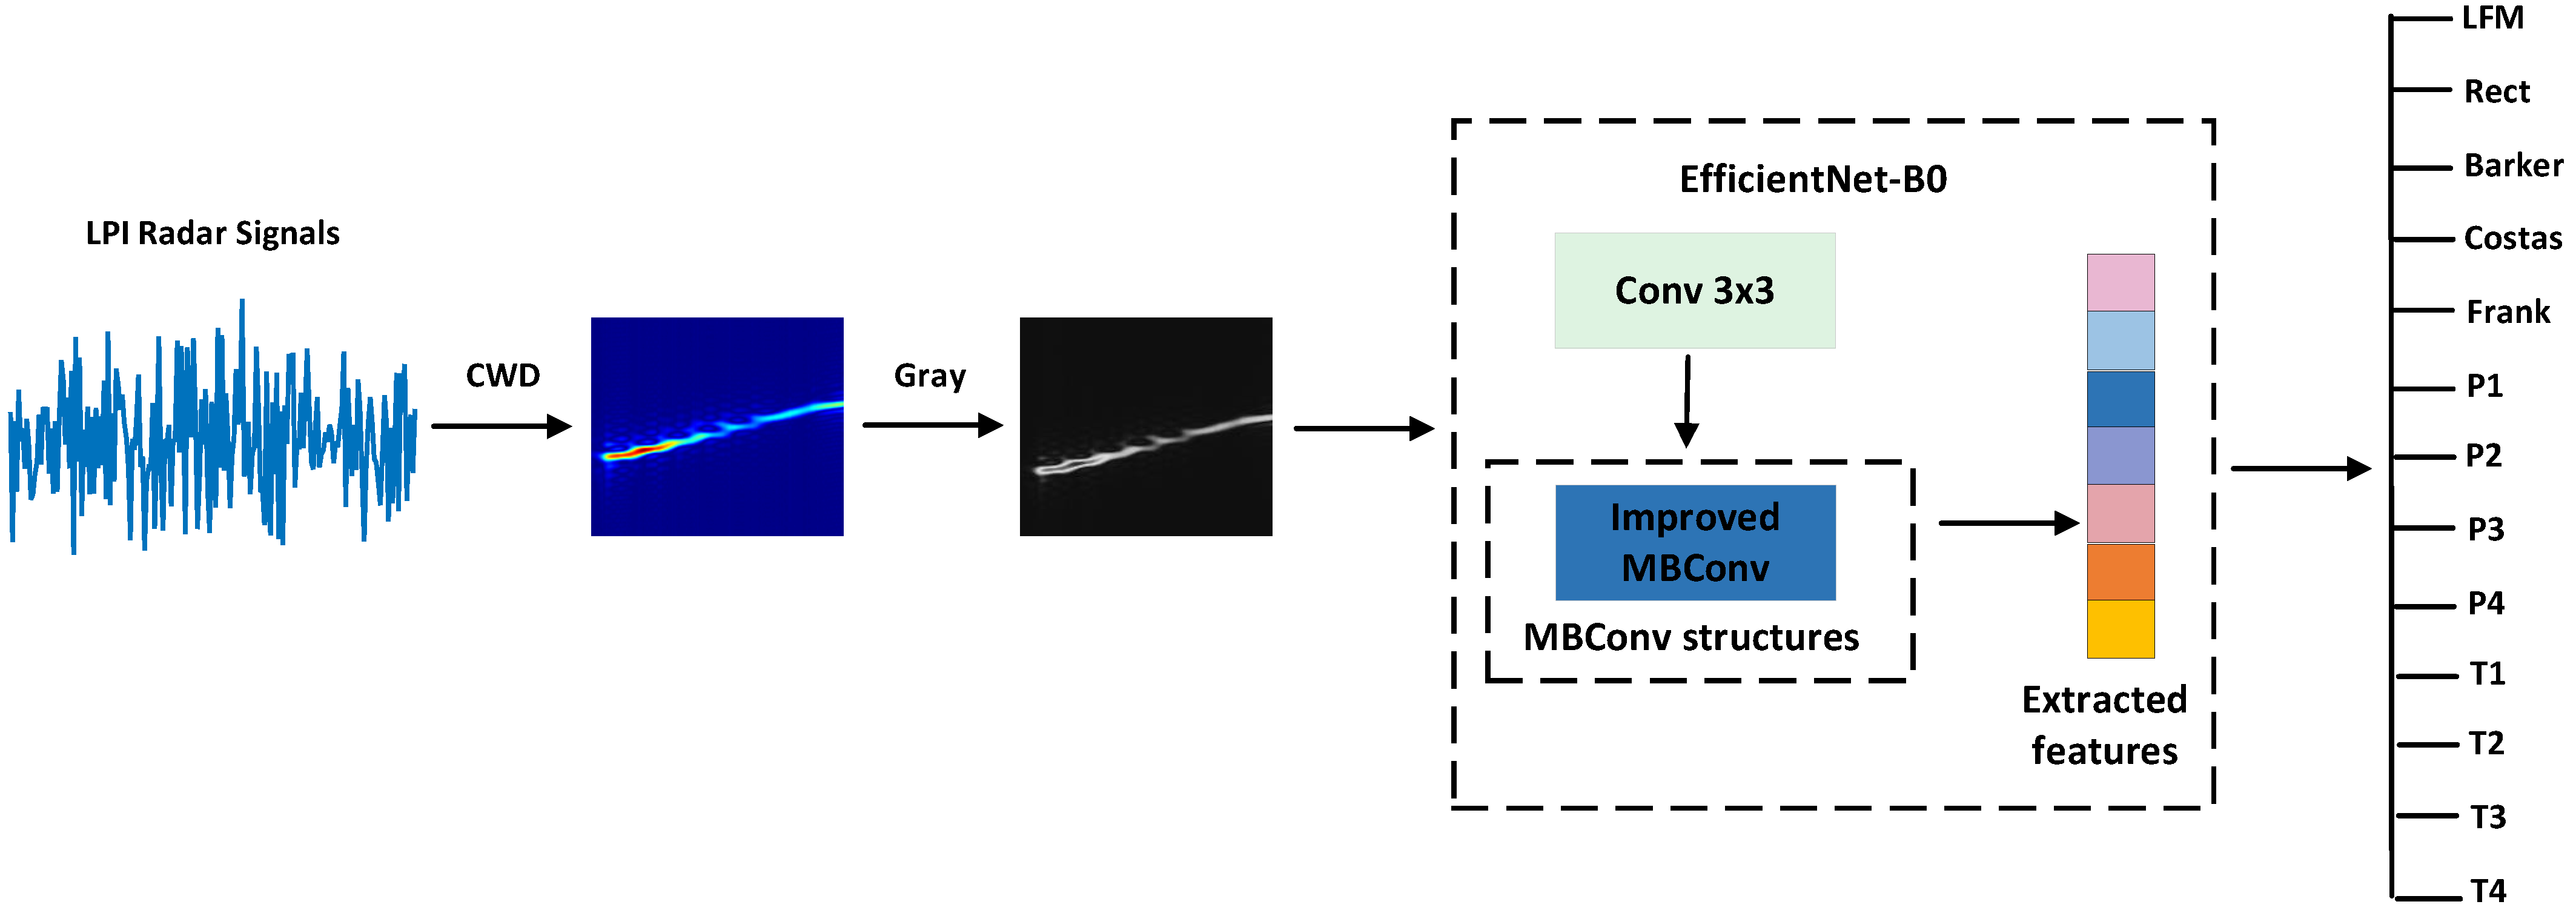
The structural framework of the proposed method is illustrated in Figure 2. First, the original noisy LPI radar signal is transformed into a time–frequency image using CWD analysis, which is then converted into a grayscale image. These grayscale images are divided into training, validation, and test sets. The training process is conducted on the EfficientNet-B0 model, enhanced with Focal Loss to improve supervision and with modifications to the MBConv structure for better spatiotemporal feature extraction under low-SNR conditions. Finally, the extracted features are used to classify and recognize the waveform modulation of the signals.

3.1. EfficientNet-B0 Baseline Network

EfficientNet was proposed by Google researchers in 2019 [17]. In order to simultaneously maximize model depth, width, and input resolution, it employs a compound scaling method that extends traditional model scaling strategies. With this method, accuracy and computational economy are balanced while achieving optimal model performance. Let the model’s depth, width, and resolution be denoted by d , ω , r , respectively. EfficienNet’s scaling method is expressed as follows:
d = α ϕ ω = β ϕ r = γ ϕ
where α β 2 γ 2 2 , α 1 , β 1 , γ 1 , ϕ denotes the scaling factor. By setting different scaling factors based on EfficientNet-B0, the B0-B7 networks can be obtained, where the network architecture of EfficientNet-B0 is shown in Table 1 and the explanations of specific parameters can refer to ref. [17].

3.2. SimAM Attention Mechanism

Based on the neuroscience concept of spatial inhibition, SimAM Attention Mechanism [21] is a simple, parameter-free attention mechanism. It dynamically modifies neural weights to improve model performance by determining local similarities in feature maps; SimAM uses feature maps for three-dimensional weighting without adjusting any parameters. SimAM defines the following energy function for a single neuron t and additional neurons in the input feature map:
e t ( ω t , b t , y , x i ) = 1 M 1 i = 1 M 1 ( 1 ( ω t x i + b t ) ) 2 + ( 1 ( ω t t + b t ) ) 2 + λ ω t 2
where ω t denotes the weight of the linear transformation, b t denotes the corresponding bias term, M denotes the number of neurons, λ denotes the regularization coefficient, taking partial derivatives with respect to ω t and b t , setting the derivatives equal to zero, the expressions for ω t and b t are as follows:
ω t = 2 ( t μ t ) ( t μ t ) 2 + 2 σ t 2 + 2 λ
b t = 1 2 ( t + μ t ) ω t
where μ t denotes the mean computed by all neurons except t , σ t denotes the corresponding variance. Substituting the mean and variance into the energy function formula yields the energy function result:
e t * = 4 ( σ ^ 2 + λ ) ( t u ^ ) 2 + 2 σ ^ 2 + 2 λ
From the energy function formula, it can be seen that the greater the difference between a neuron and its neighboring neurons, the lower the corresponding energy value. This indicates that the neuron is more important during training and should be assigned a higher weight. Therefore, 1 / e t * is used to represent the importance of a neuron. According to the definition of the attention mechanism, the weighted features of the feature map can be obtained as follows:
X ~ = s i g m o i d ( 1 E ) X

3.3. Improved MBConv Module

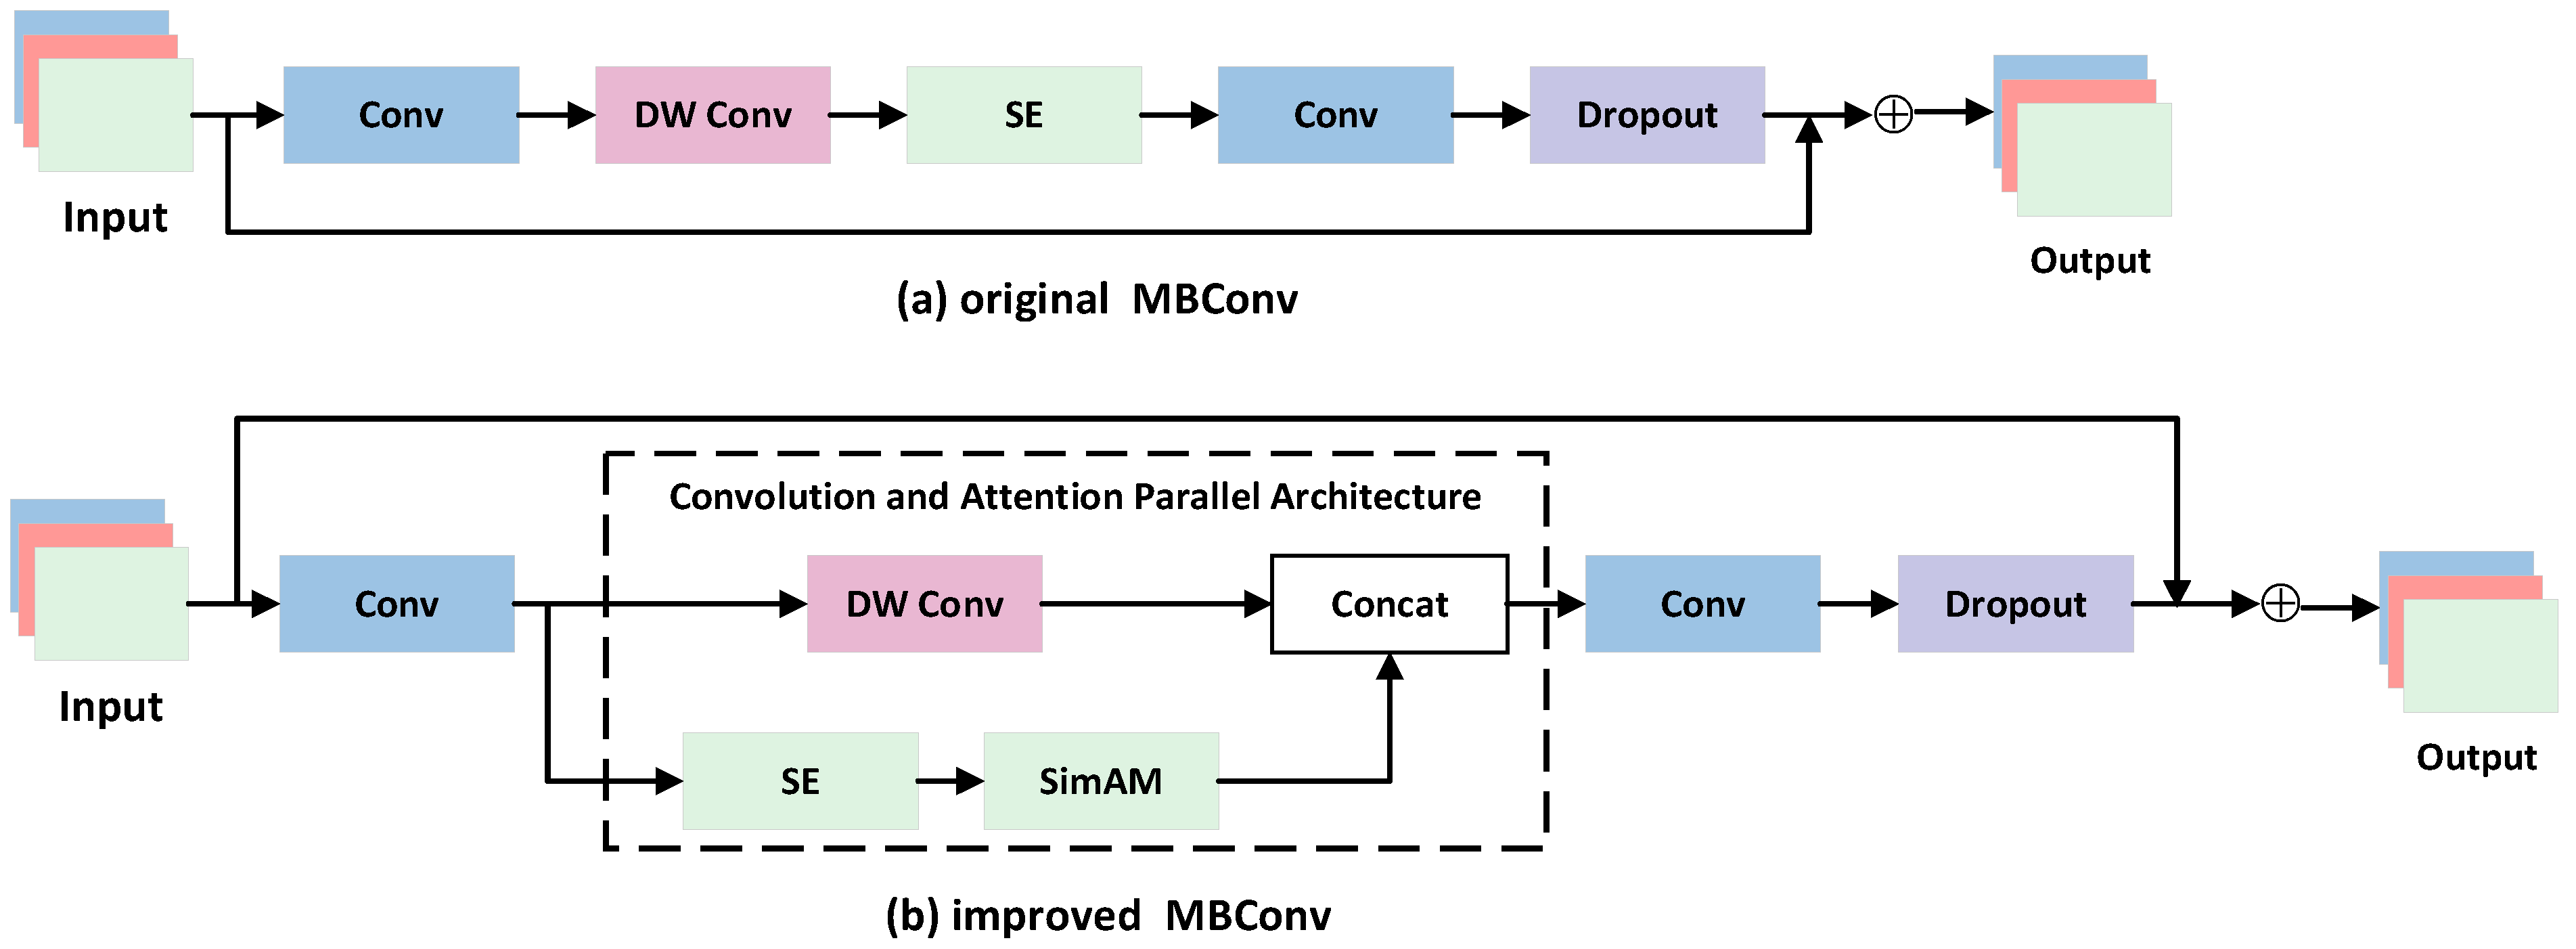
In the original EfficientNet-B0 network, the SE attention mechanism employed within the MBConv structure determines which feature map channels are important through “Squeeze-and-Excitation” operations, which selects features from the channel dimension. In time–frequency images, SE attention judges feature channels representing specific modulation slopes as more important than those representing background noise. The time–frequency patterns of signals with different modulation schemes in the LPI radar segment exhibit minimal differences, manifesting as subtle variations in texture and brightness. The SE attention mechanism struggles to effectively distinguish such fine feature differences. SimAM attention, as a neuroscience-inspired 3D attention mechanism, computes a unique weight for each point in the feature map. This effectively suppresses noise interference while capturing subtle features in the time–frequency image. Employing a tandem structure of SE and SimAM allows SE to select important feature maps, while SimAM selects subtle features within them and suppresses noise. Additionally, a parallel architecture was designed for the DW Conv branch and attention branch, concatenating their feature maps along the channel dimension to enhance the model’s fault tolerance and robustness. Consequently, the SimAM attention mechanism is integrated into every MBConv structure in the enhanced EfficientNet architecture.
As shown in Figure 3, the improved MBConv structure transforms the original serial arrangement of DW Conv, followed by SE attention into a parallel configuration of DW Conv and two attention mechanisms. The outputs from these parallel branches are concatenated along the channel dimension, then processed through a dimension-reducing convolution layer and a Dropout layer to generate the final feature map.

3.4. Focal Loss Function

Signals with various modulation types show notable variances in their time–frequency characteristics in the difficult problem of time–frequency image recognition for radar waveform modulation. The time–frequency images of signals exhibit a high degree of similarity, which blurs the lines between categorization and creates “hard samples” that are challenging to recognize. Meanwhile, signals with modulation forms such as Rect have unique time–frequency properties, making them “easy samples” that are simple to recognize. Radar signals are also very vulnerable to interference from the surroundings in low-SNR conditions. Some samples are necessarily “hard samples” that are challenging to distinguish due to low SNR and obscured characteristics. The classic cross-entropy loss function is limited during training due to this intrinsic categorization difficulty difference between samples. Thus, instead of using the original cross-entropy loss as the loss function for EfficientNet-B0, the Focal Loss function [22,23] is introduced in our method. In training step, the Focal Loss function reduces the loss weight for “easy samples” while increasing the loss weight for “hard samples”. By focusing more on difficult samples during learning, this strategy helps the network achieve higher classification accuracy. For binary classification problems, the corresponding cross-entropy loss function is defined as follows:
C E ( p , y ) = log ( p ) i f   y = 1 log ( 1 p ) otherwise
where y { ± 1 } is the ground-truth class, p [ 0 , 1 ] is the probability that a sample belongs to class 1, which is defined as follows:
p t = p i f   y = 1 1 p otherwise
The cross-entropy loss function can then be simplified to C E ( p t ) = log ( p t ) . To address the issue of class and sample imbalance, the Focal Loss function introduces a dynamic modulation factor ( 1 p t ) γ and a class balance coefficient α t based on cross-entropy, expressed as follows:
F L ( p t ) = α t ( 1 p t ) γ log ( p t )
when p ( t ) is small, the value of ( 1 p t ) γ approaches 1, exerting minimal influence on the loss function; however, as p ( t ) approaches 1, the value of ( 1 p t ) γ approaches 0, thereby reducing the weight assigned to “easy samples”. Consequently, Focal Loss effectively increases the weight of “hard samples” in the loss function, causing the loss function to favor these challenging cases. The parameter γ controls the weight difference between easy and hard samples. When γ = 0 , the Focal Loss function degenerates into the standard cross-entropy loss function. As γ increases, the loss weight coefficient for “easy samples” gradually decreases, while the weight for “hard samples” gradually increases.

4. Experiments and Discussions

4.1. Experimental Setup

To validate the effectiveness of the proposed method, 13 types of LPI radar signals were simulated [7], the related parameters and value can be found in Table 2.
The sampling frequency f s was set to 100 MHz. AWGN was added during signal simulation with an SNR range of −10 dB to 10 dB with a step of 2 dB. For each modulation and every SNR condition, 200 samples were generated, so each modulation has 2200 samples. Multipath fading effects happen when radar signals travel through several routes while being transmitted, to simulate the actual propagation process of signals, we introduced a certain degree of attenuation to the signals during simulation. The following is how the multipath fading channel parameters are set up: path delay τ = U ( 1 , 1000 ) n s , path gain G = U ( 10 , 0 ) , maximum Doppler shift f D = U ( 5 , 400 ) H z . After signal simulation concludes, the time-domain signal was converted into a time–frequency image using CWD time–frequency analysis, and the resulting time–frequency image was further processed into grayscale. The generated image size was set to 224 × 224; EfficientNet-B0 pre-trained model was not used in our experiment.
During the dataset simulation phase, we use Matlab 2020a to simulate radar signals and perform CWD time–frequency analysis. A remote server running Ubuntu 20.04 with an NVIDIA RTX 3090 GPU and 24 GB of VRAM is used for the training step, based on the improved EfficientNet model, CUDA version 11.3, PyTorch 1.10.0 deep learning framework, and Python version 3.8. The training parameters are displayed during the training process in Table 3.

4.2. Experimental Results and Discussions

To validate the proposed method performance in recognizing 13 types of LPI radar signals, a comparative analysis was conducted between the proposed method and the original EfficientNet-B0 network. The recognition results of both approaches are shown in Figure 4.
As shown in Figure 4, when the SNR exceeds 0 dB, the classification performance of the models based on EfficientNet-B0 and our proposed method show little difference. This is because under conditions of low noise in the signal, the time–frequency map obtained through CWD time–frequency analysis exhibits signal features from different waveform modulations that are less affected by noise. After adjustment and extraction by the network, these features become easier to classify. But when facing low SNR, higher noise levels in the signal cause noise features to dominate the time–frequency image, making accurate classification more challenging. In contrast to the pre-improvement approach, the improved EfficientNet-B0 model provides superior recognition and classification performance under the same settings. Two significant changes are responsible for this improvement: First, the original serial design is changed to a parallel architecture by including the SimAM attention mechanism into EfficientNet-B0. This allows the network to focus more on features relevant to the image and the target’s time–frequency image during training, while paying less attention to noise components. Consequently, the model extracts more effective features. Meanwhile, samples that are hard to recognize during training are given more weight when the Focal Loss function is used in place of the original cross-entropy loss function. As a result, the model is more inclined to concentrate on data that falls into difficult categories, increasing the overall classification accuracy.
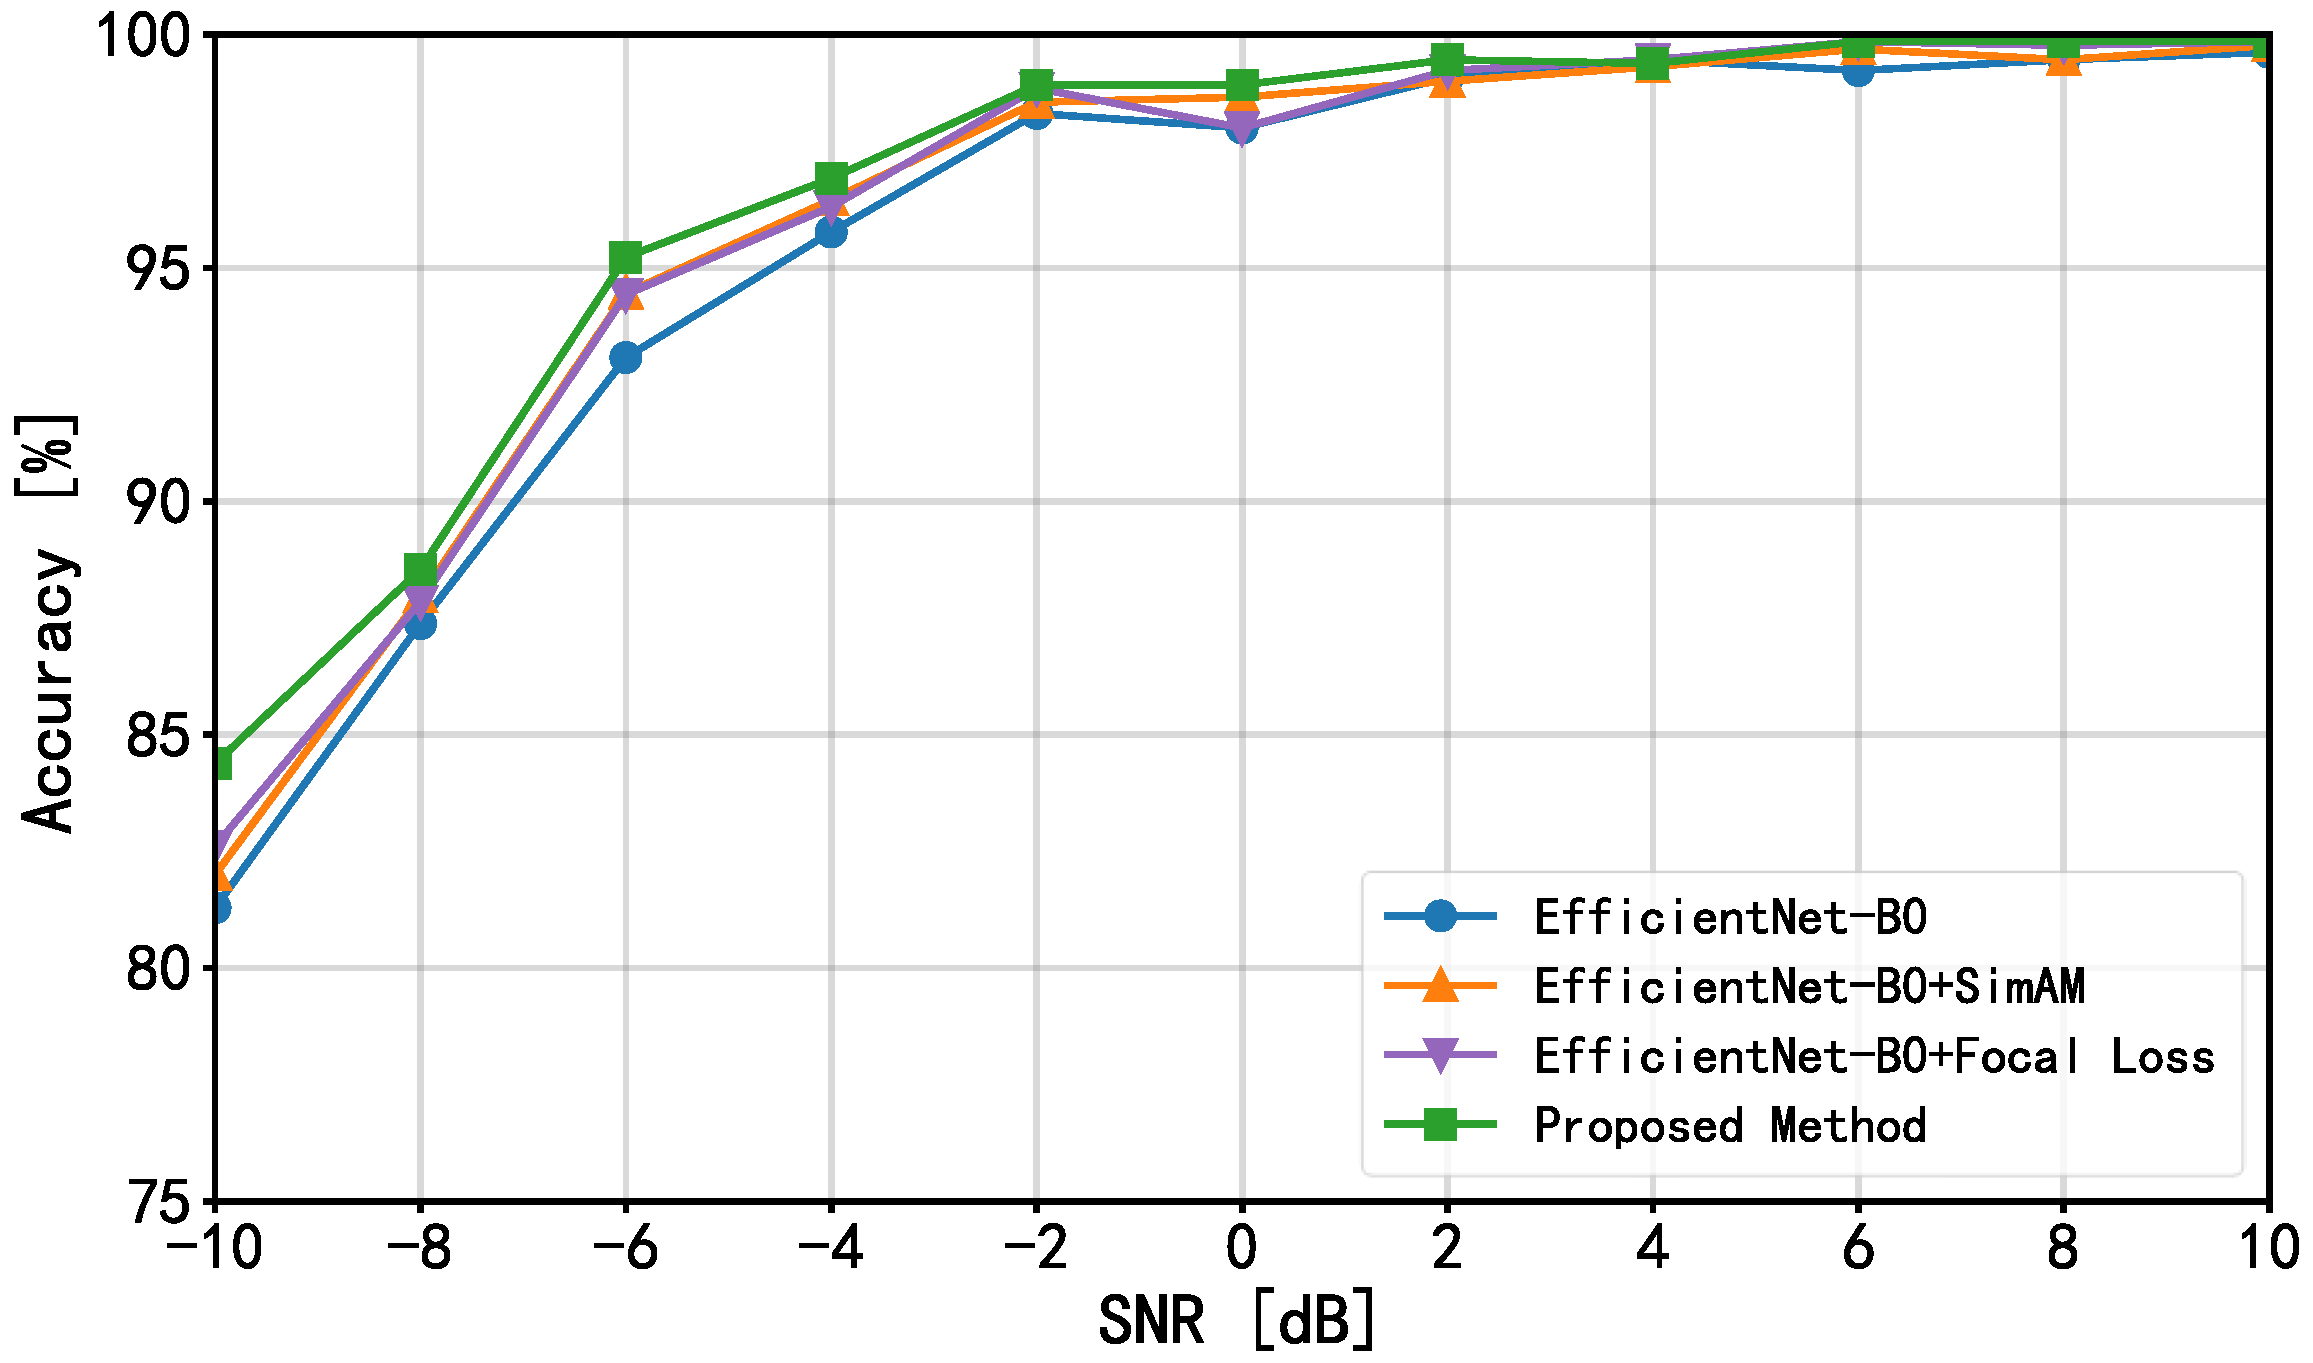
Several ablation experiments were carried out using the overall classification accuracy on the test set as the evaluation metric in order to better examine the effects of the SimAM attention mechanism and Focal Loss function added in the improved method on the model’s classification performance. Figure 5 displays the experimental results.
As shown in Figure 5, when the SNR exceeds 0 dB, both the original model and the improved model yield satisfactory recognition performance, with negligible differences observed between their results. However, under low-SNR conditions, integrating either the SimAM attention mechanism or the Focal Loss function individually into the EfficientNet-B0 model leads to a moderate improvement in recognition accuracy. Notably, the optimal recognition performance is achieved when these two strategies are combined. Specifically, for the enhanced approach incorporating both the SimAM attention mechanism and the Focal Loss function, the overall recognition and classification accuracy of the network is presented in Table 4.
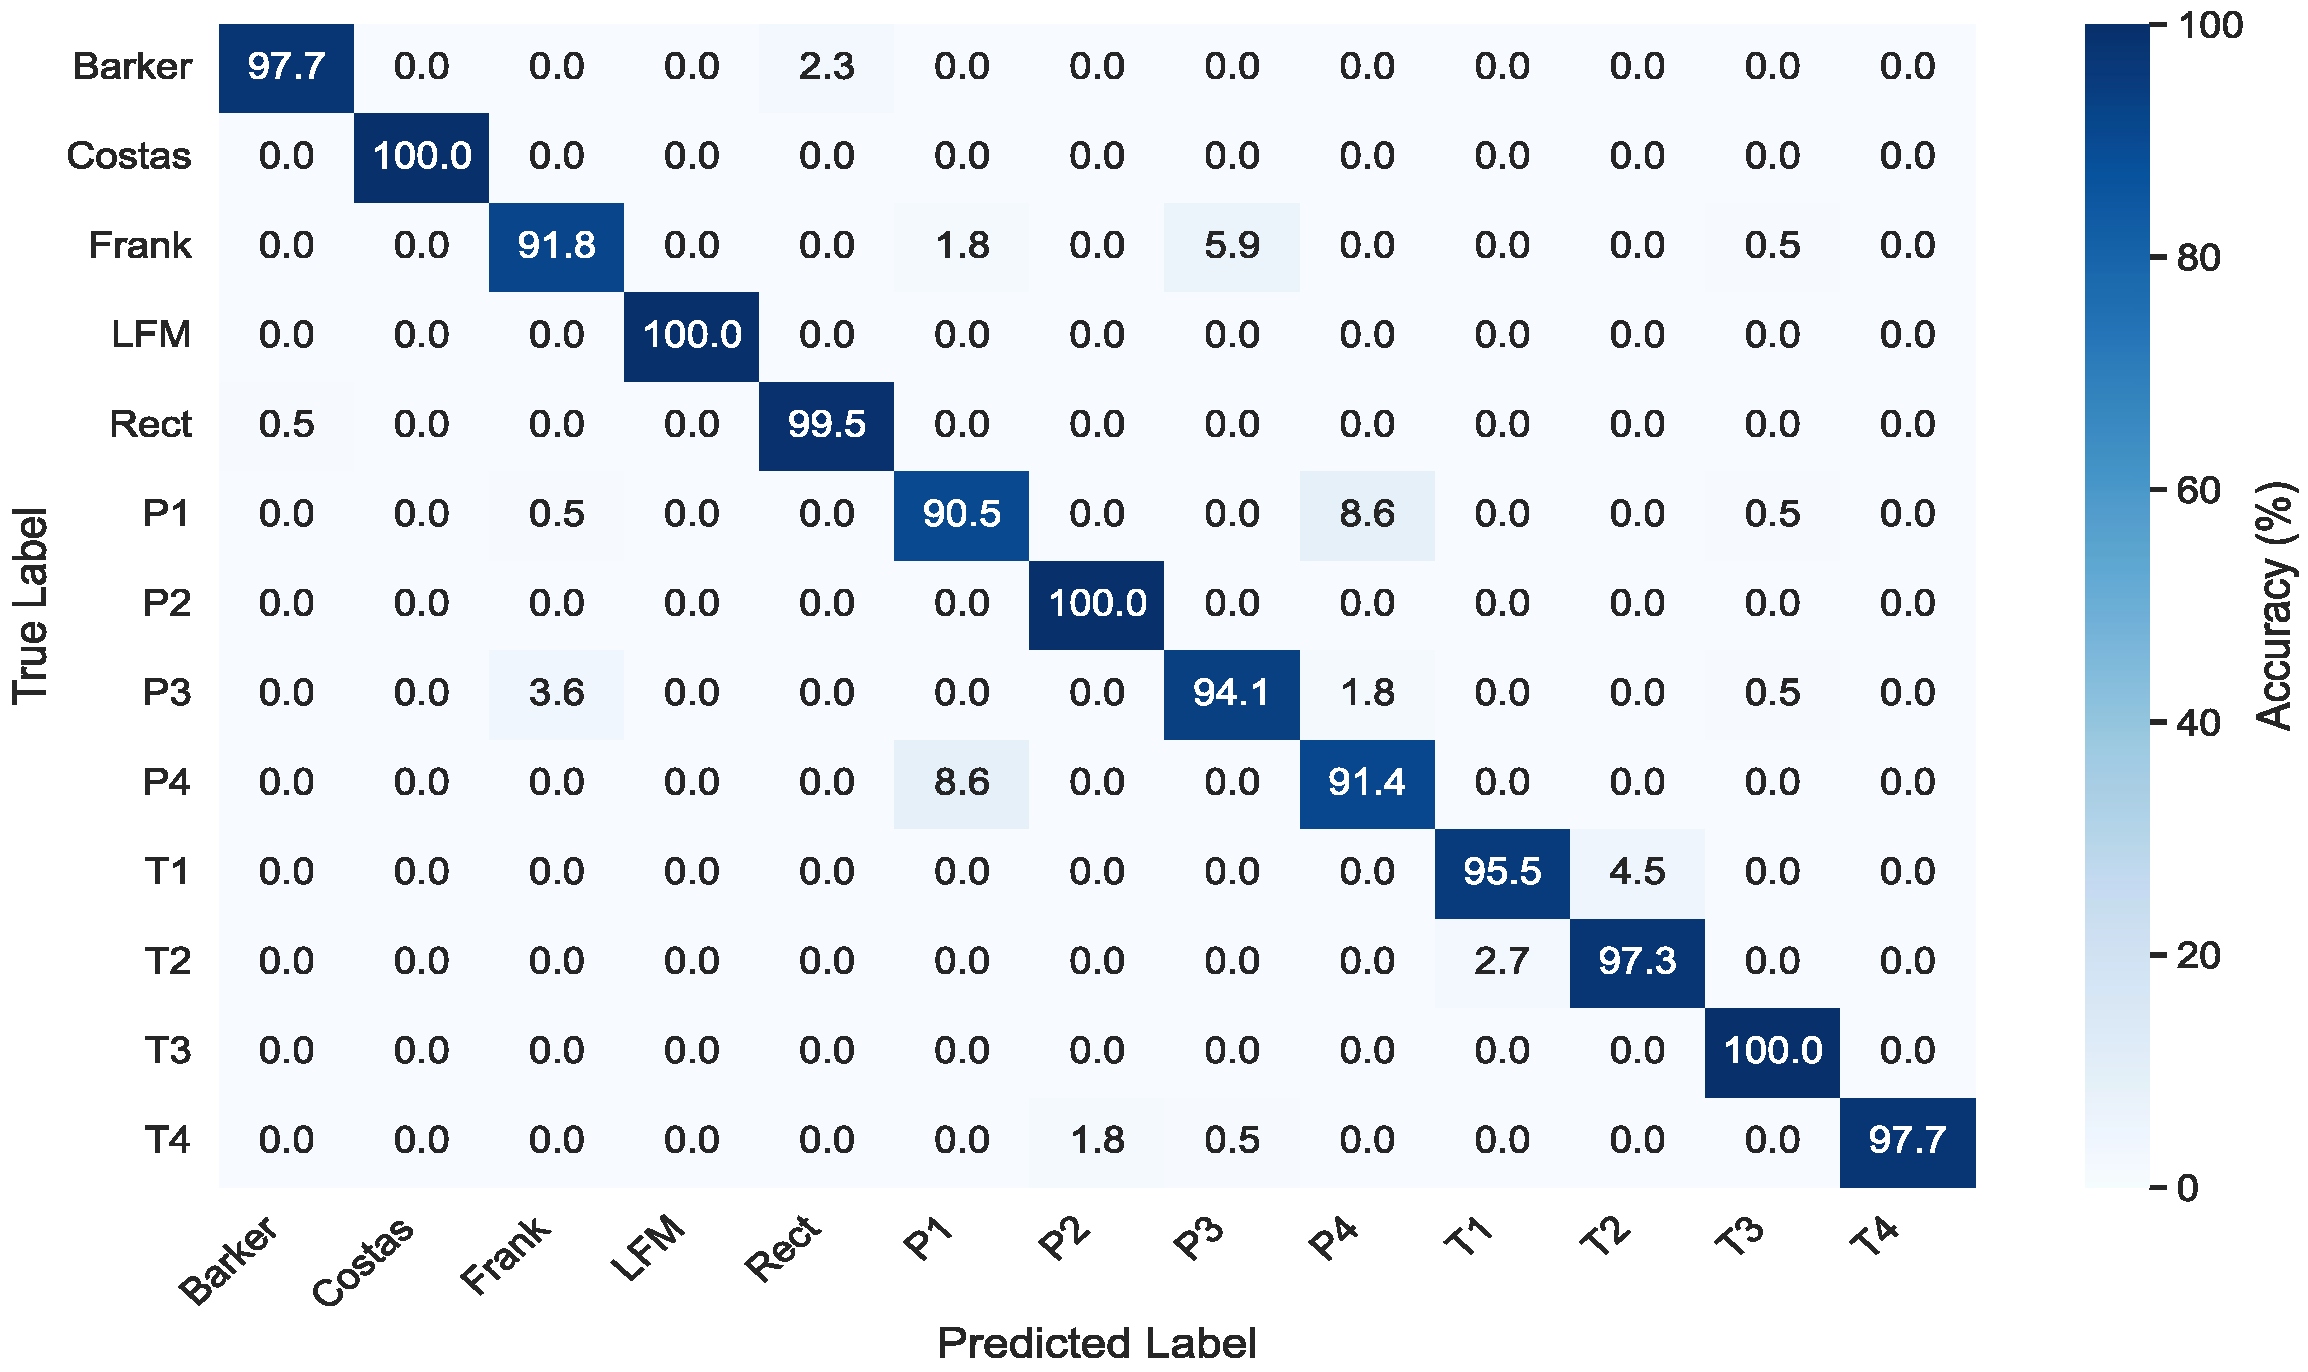
A confusion matrix of the recognition results was displayed, as illustrated in Figure 6, to further examine the model’s overall recognition performance for signals across various modulation categories. Overall recognition accuracy is comparatively high for signals modulated by employing techniques like Costas, LFM, and Rect. Nevertheless, multi-phase modulation patterns such as P1 and P4 have a reduced recognition accuracy. This is mostly because P1 and P4 signals have very similar autocorrelation and model function properties and are modulated using particular phase sequences. The category features in the time–frequency plot become similar when there is a lot of noise in the signal, which makes it harder for the model to properly distinguish between them. By modulating signals through particular phase sequences, P4 codes themselves display very similar autocorrelation and model function properties. The time–frequency plot’s category features become indistinguishable when signal noise is strong, which hinders the model’s ability to distinguish between categories and lowers recognition accuracy overall.
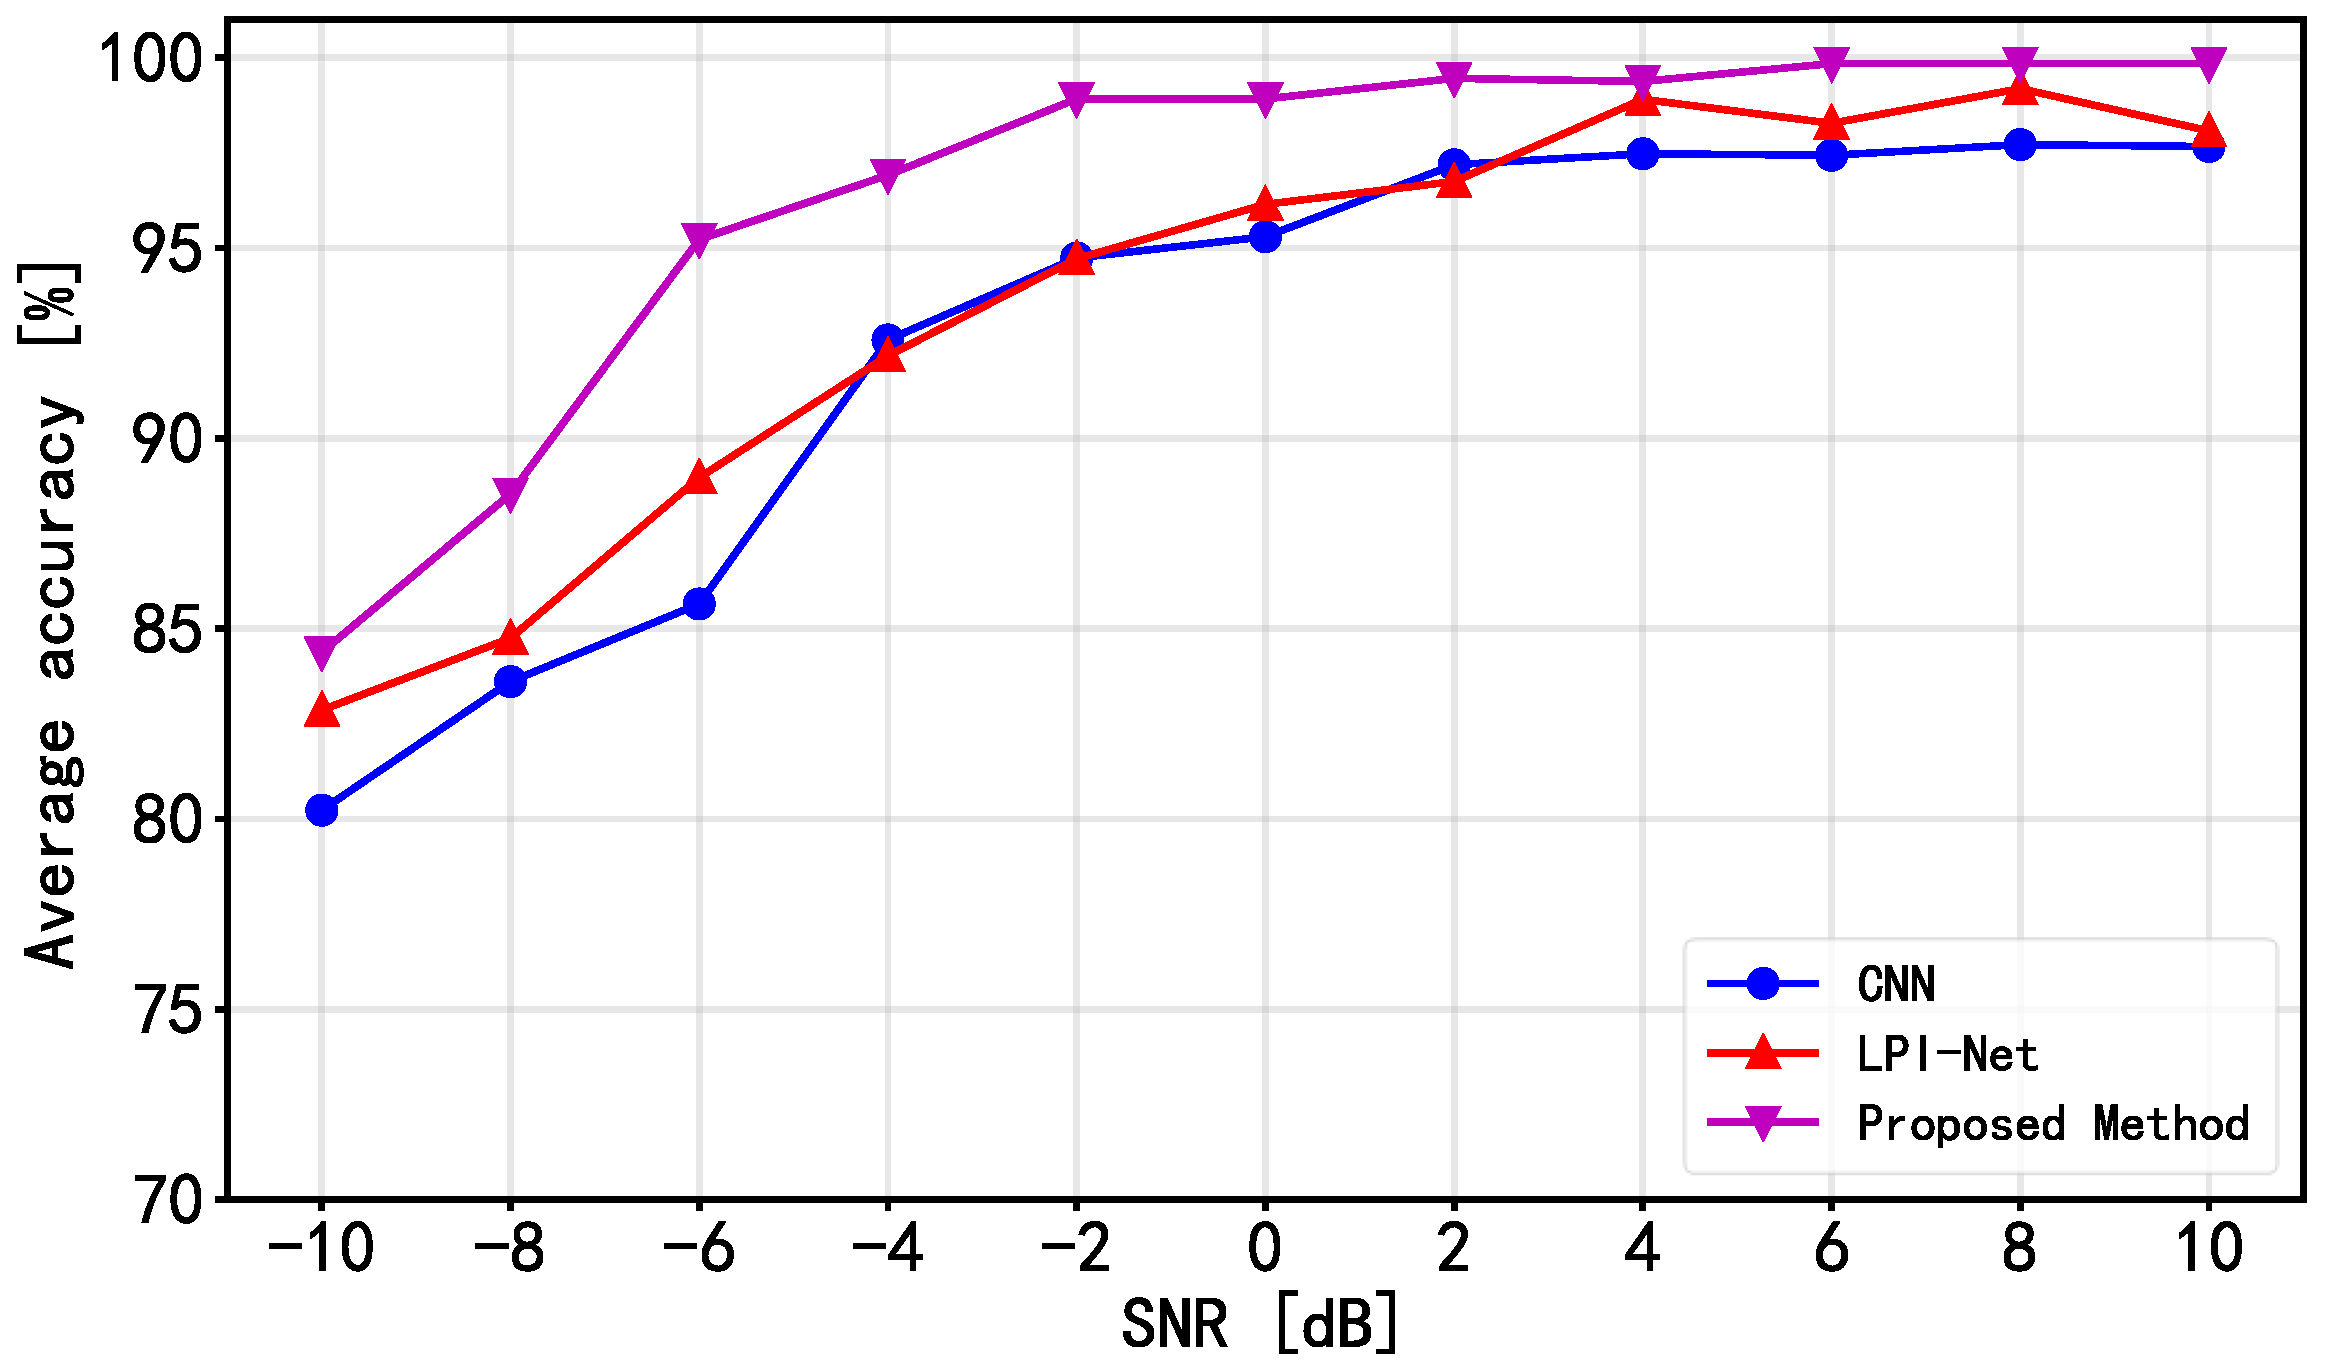
This study contrasts the suggested method with two additional methods based on CWD time–frequency transformation and deep learning networks in order to further compare the recognition performance of the improved method with other comparable approaches. Using a CNN network that was created, Ref [1] carried out recognition based on the LPI radar modulation technique by adjusting parameters such input size, number of filters, filter size, and number of neurons. In order to develop the LPI-Net network for radar signal modulation recognition, the Ref [7] used CWD time–frequency analysis. Figure 7 displays the three methods’ recognition results based on the simulation dataset.
The recognition accuracy curves of the three methods for 13 distinct LPI radar signal waveform modulations on the simulation dataset are displayed in Figure 7. It is evident that under different SNR settings, the method suggested in this paper achieves an overall higher identification accuracy than the other two techniques. The suggested improved approach shows a notable improvement over the other two approaches, especially at low SNR levels. The suggested method’s recognition accuracy of 84.38% at an SNR of −10 dB surpasses the LPI-Net method’s 82.86% recognition performance.
It should be noted that in our experiments, the LPI radar signals were simulated with Rayleigh fading to introduce a certain degree of signal attenuation, thereby simulating the actual propagation characteristics of radar signals in realistic environments. To investigate the impact of signal attenuation on waveform modulation recognition performance, this study conducted additional simulations of the same 13 LPI radar signals without attenuation under identical parameter configurations. The evaluation was performed using the same dataset partitioning methodology, with results presented in Figure 8. As illustrated in Figure 8, when attenuation is not incorporated during signal simulation, the proposed method demonstrates superior signal modulation recognition performance under low–SNR conditions. As SNR increases, the influence of attenuation on modulation recognition accuracy gradually diminishes. This phenomenon occurs because at sufficiently high SNR levels, the neural network model possesses adequate discriminative capability to accurately identify the modulation type, effectively overcoming the effects of channel-induced attenuation.

5. Conclusions

This research proposes a method based on CWD time–frequency analysis and an improved EfficientNet network to address the problem of low recognition accuracy for LPI radar waveform modulations under low-SNR conditions. Radar signals are transformed into two-dimensional time–frequency domain images through CWD time–frequency analysis. The EfficientNet network is then enhanced by integrating the SimAM attention mechanism. Specifically, the original serial structure of SE attention and convolution in the MBConv module is restructured into a parallel configuration where SimAM and SE attention mechanisms operate in parallel, followed by convolution operations. Furthermore, the original cross-entropy loss function is replaced with the Focal Loss function to address the issue of low classification accuracy for specific modulation categories during training. This modification enables dynamic adjustment of loss weights for samples that are difficult to classify during the training process. Experimental validation on a radar signal simulation dataset comprising 13 waveform modulations demonstrates that the proposed enhanced method achieves superior classification accuracy compared to existing approaches. The method effectively mitigates noise interference and delivers robust recognition performance, particularly under low-SNR conditions. While the current study relies on comprehensive simulations that accurately model real LPI signal characteristics, a primary direction for future research is to validate the proposed algorithm using measured data obtained through collaborative efforts or open-source datasets, and the other direction is to improve classification accuracy while maintaining or reducing network architectural complexity.
In addition, Current research is limited to the LPI radar waveform modulation recognition, which is beneficial to both military defense and civil infrastructure optimization and does not pose a threat to public health or national security. The authors acknowledge the dual use potential of the research and confirm that all necessary precautions have been taken to prevent potential misuse. As an ethical responsibility, the authors strictly adhere to relevant national and international laws about DURC. The authors advocate for responsible deployment, ethical considerations, regulatory compliance, and transparent reporting to mitigate misuse risks and foster beneficial outcomes.

Author Contributions

Conceptualization, Y.Q. and L.N.; methodology, Y.Q. and L.N.; software, Y.Q. and X.F.; validation, H.L.; formal analysis, Y.Z.; resources, Y.Q. and L.N.; writing—original draft preparation, Y.Q. and L.N.; writing—review and editing, Y.Q. and L.N. All authors have read and agreed to the published version of the manuscript.

Funding

This work was supported by the National Social Science Fund (Grant No. 2025-SKJJ-D-036), the Natural Science Foundation of Hubei Province (Grant No. 2025AFB419), and the Air Force Equipment Research Project (Grant No. KJ2024C008).

Data Availability Statement

The original contributions presented in this study are included in the article. Further inquiries can be directed to the corresponding author.

Conflicts of Interest

The authors declare no conflicts of interest.

References

  1. Kong, S.H.; Kim, M.; Hoang, L.M.; Kim, E. Automatic LPI Radar Waveform Recognition Using CNN. IEEE Access 2018, 6, 4207–4219. [Google Scholar] [CrossRef]
  2. Zhang, M.; Liu, L.; Diao, M. LPI Radar Waveform Recognition Based on Time-Frequency Distribution. Sensors 2016, 16, 1682. [Google Scholar] [CrossRef] [PubMed]
  3. Kishore, T.R.; Rao, K.D. Automatic Intrapulse Modulation Classification of Advanced LPI Radar Waveforms. IEEE Trans. Aerosp. Electron. Syst. 2017, 53, 901–914. [Google Scholar] [CrossRef]
  4. Li, P. Research on radar signal recognition based on automatic machine learning. Neural Comput. Appl. 2020, 32, 1–11. [Google Scholar] [CrossRef]
  5. Xu, T.; Yuan, S.; Liu, Z.; Guo, F. Radar Emitter Recognition Based on Parameter Set Clustering and Classification. Remote Sens. 2022, 14, 4468. [Google Scholar] [CrossRef]
  6. Gupta, P.; Jain, P.; Kakde, O. Deep Learning Techniques in Radar Emitter Identification. Def. Sci. J. 2023, 73, 551–563. [Google Scholar] [CrossRef]
  7. Huynh-The, T.; Doan, V.S.; Hua, C.H.; Pham, Q.V.; Nguyen, T.V.; Kim, D.S. Accurate LPI Radar Waveform Recognition With CWD-TFA for Deep Convolutional Network. IEEE Wirel. Commun. Lett. 2021, 10, 1638–1642. [Google Scholar] [CrossRef]
  8. Chen, B.; Wang, X.; Zhu, D.; Yan, H.; Xu, G.; Wen, Y. LPI Radar Signals Modulation Recognition in Complex Multipath Environment Based on Improved ResNeSt. IEEE Trans. Aerosp. Electron. Syst. 2024, 60, 8887–8900. [Google Scholar] [CrossRef]
  9. Ni, X.; Wang, H.; Meng, F.; Hu, J.; Tong, C. LPI Radar Waveform Recognition Based on Multi-Resolution Deep Feature Fusion. IEEE Access 2021, 9, 26138–26146. [Google Scholar] [CrossRef]
  10. Jiang, W.; Li, Y.; Liao, M.; Wang, S. An Improved LPI Radar Waveform Recognition Framework With LDC-Unet and SSR-Loss. IEEE Signal Process. Lett. 2022, 29, 149–153. [Google Scholar] [CrossRef]
  11. Wei, S.; Qu, Q.; Su, Y.-Y.; Wang, M.; Jun, S.H.I.; Hao, X. Intra-pulse modulation radar signal recognition based on CLDN network. IET Radar Sonar Navig. 2020, 14, 803–810. [Google Scholar] [CrossRef]
  12. Wu, B.; Yuan, S.; Li, P.; Jing, Z.; Huang, S.; Zhao, Y. Radar Emitter Signal Recognition Based on One-Dimensional Convolutional Neural Network with Attention Mechanism. Sensors 2020, 20, 6350. [Google Scholar] [CrossRef] [PubMed]
  13. Yakkati, R.R.; Boddu, A.B.; Pardhasaradhi, B.; Yeduri, S.R.; Cenkeramaddi, L.R. Low Probability of Intercept Radar Signal Classification using Multi-Channel 1D-CNN. In Proceedings of the 2024 10th International Conference on Communication and Signal Processing (ICCSP), Melmaruvathur, India, 12–14 April 2024; pp. 536–541. [Google Scholar]
  14. Kim, J.; Cho, S.; Hwang, S.; Lee, W.; Choi, Y. Enhancing LPI Radar Signal Classification Through Patch-Based Noise Reduction. IEEE Signal Process. Lett. 2024, 31, 716–720. [Google Scholar] [CrossRef]
  15. Luo, L.; Huang, J.; Yang, Y.; Hu, D. Radar Waveform Recognition with ConvNeXt and Focal Loss. IEEE Access 2024, 12, 171993–172003. [Google Scholar] [CrossRef]
  16. Wang, X.; Xu, G.; Yan, H.; Zhu, D.; Wen, Y.; Luo, Z. LPI Radar Signals Modulation Recognition Based on ACDCA-ResNeXt. IEEE Access 2023, 11, 45168–45180. [Google Scholar] [CrossRef]
  17. Tan, M.; Le, Q. EfficientNet: Rethinking Model Scaling for Convolutional Neural Networks. In Proceedings of the 36th International Conference on Machine Learning; Long Beach, CA, USA, 9–15 June 2019, pp. 6105–6114.
  18. Qin, L.; Wei, L.; Niu, C.; Yintu, B.; Zhoubo, H. Radar Signal Waveform modulation Recognition Based on Split EfficientNet Network under Low Signal-to-Noise Ratio. Chin. J. Electron. 2023, 51, 675–686. [Google Scholar]
  19. Ahmad, A.A.; Aji, M.M.; Abdulkadir, M.; Adunola, F.O.; Lawan, S. Analysis of Normal Radar Signal Based on Different Time-Frequency Distribution Configurations. Arid. Zone J. Eng. Technol. Environ. 2024, 20, 699–712. [Google Scholar]
  20. Li, X.; Cai, Z. Deep Learning and Time-Frequency Analysis Based Automatic Low Probability of Intercept Radar Waveform Recognition Method. In Proceedings of the 2023 IEEE 23rd International Conference on Communication Technology (ICCT), Nanjing, China, 20–22 October 2023; pp. 291–296. [Google Scholar]
  21. Yang, L.; Zhang, R.Y.; Li, L.; Xie, X. Simam: A simple, parameter-free attention module for convolutional neural networks. In Proceedings of the 38th International Conference on Machine Learning, Virtual Event, 18–24 July 2021; pp. 11863–11874. [Google Scholar]
  22. Lin, T.Y.; Goyal, P.; Girshick, R.; He, K.; Dollár, P. Focal Loss for Dense Object Detection. In Proceedings of the 2017 IEEE International Conference on Computer Vision (ICCV), Venice, Italy, 22–29 October 2017; pp. 2999–3007. [Google Scholar]
  23. Li, X.; Lv, C.; Wang, W.; Li, G.; Yang, L.; Yang, J. Generalized Focal Loss: Towards Efficient Representation Learning for Dense Object Detection. IEEE Trans. Pattern Anal. Mach. Intell. 2023, 45, 3139–3153. [Google Scholar] [CrossRef] [PubMed]
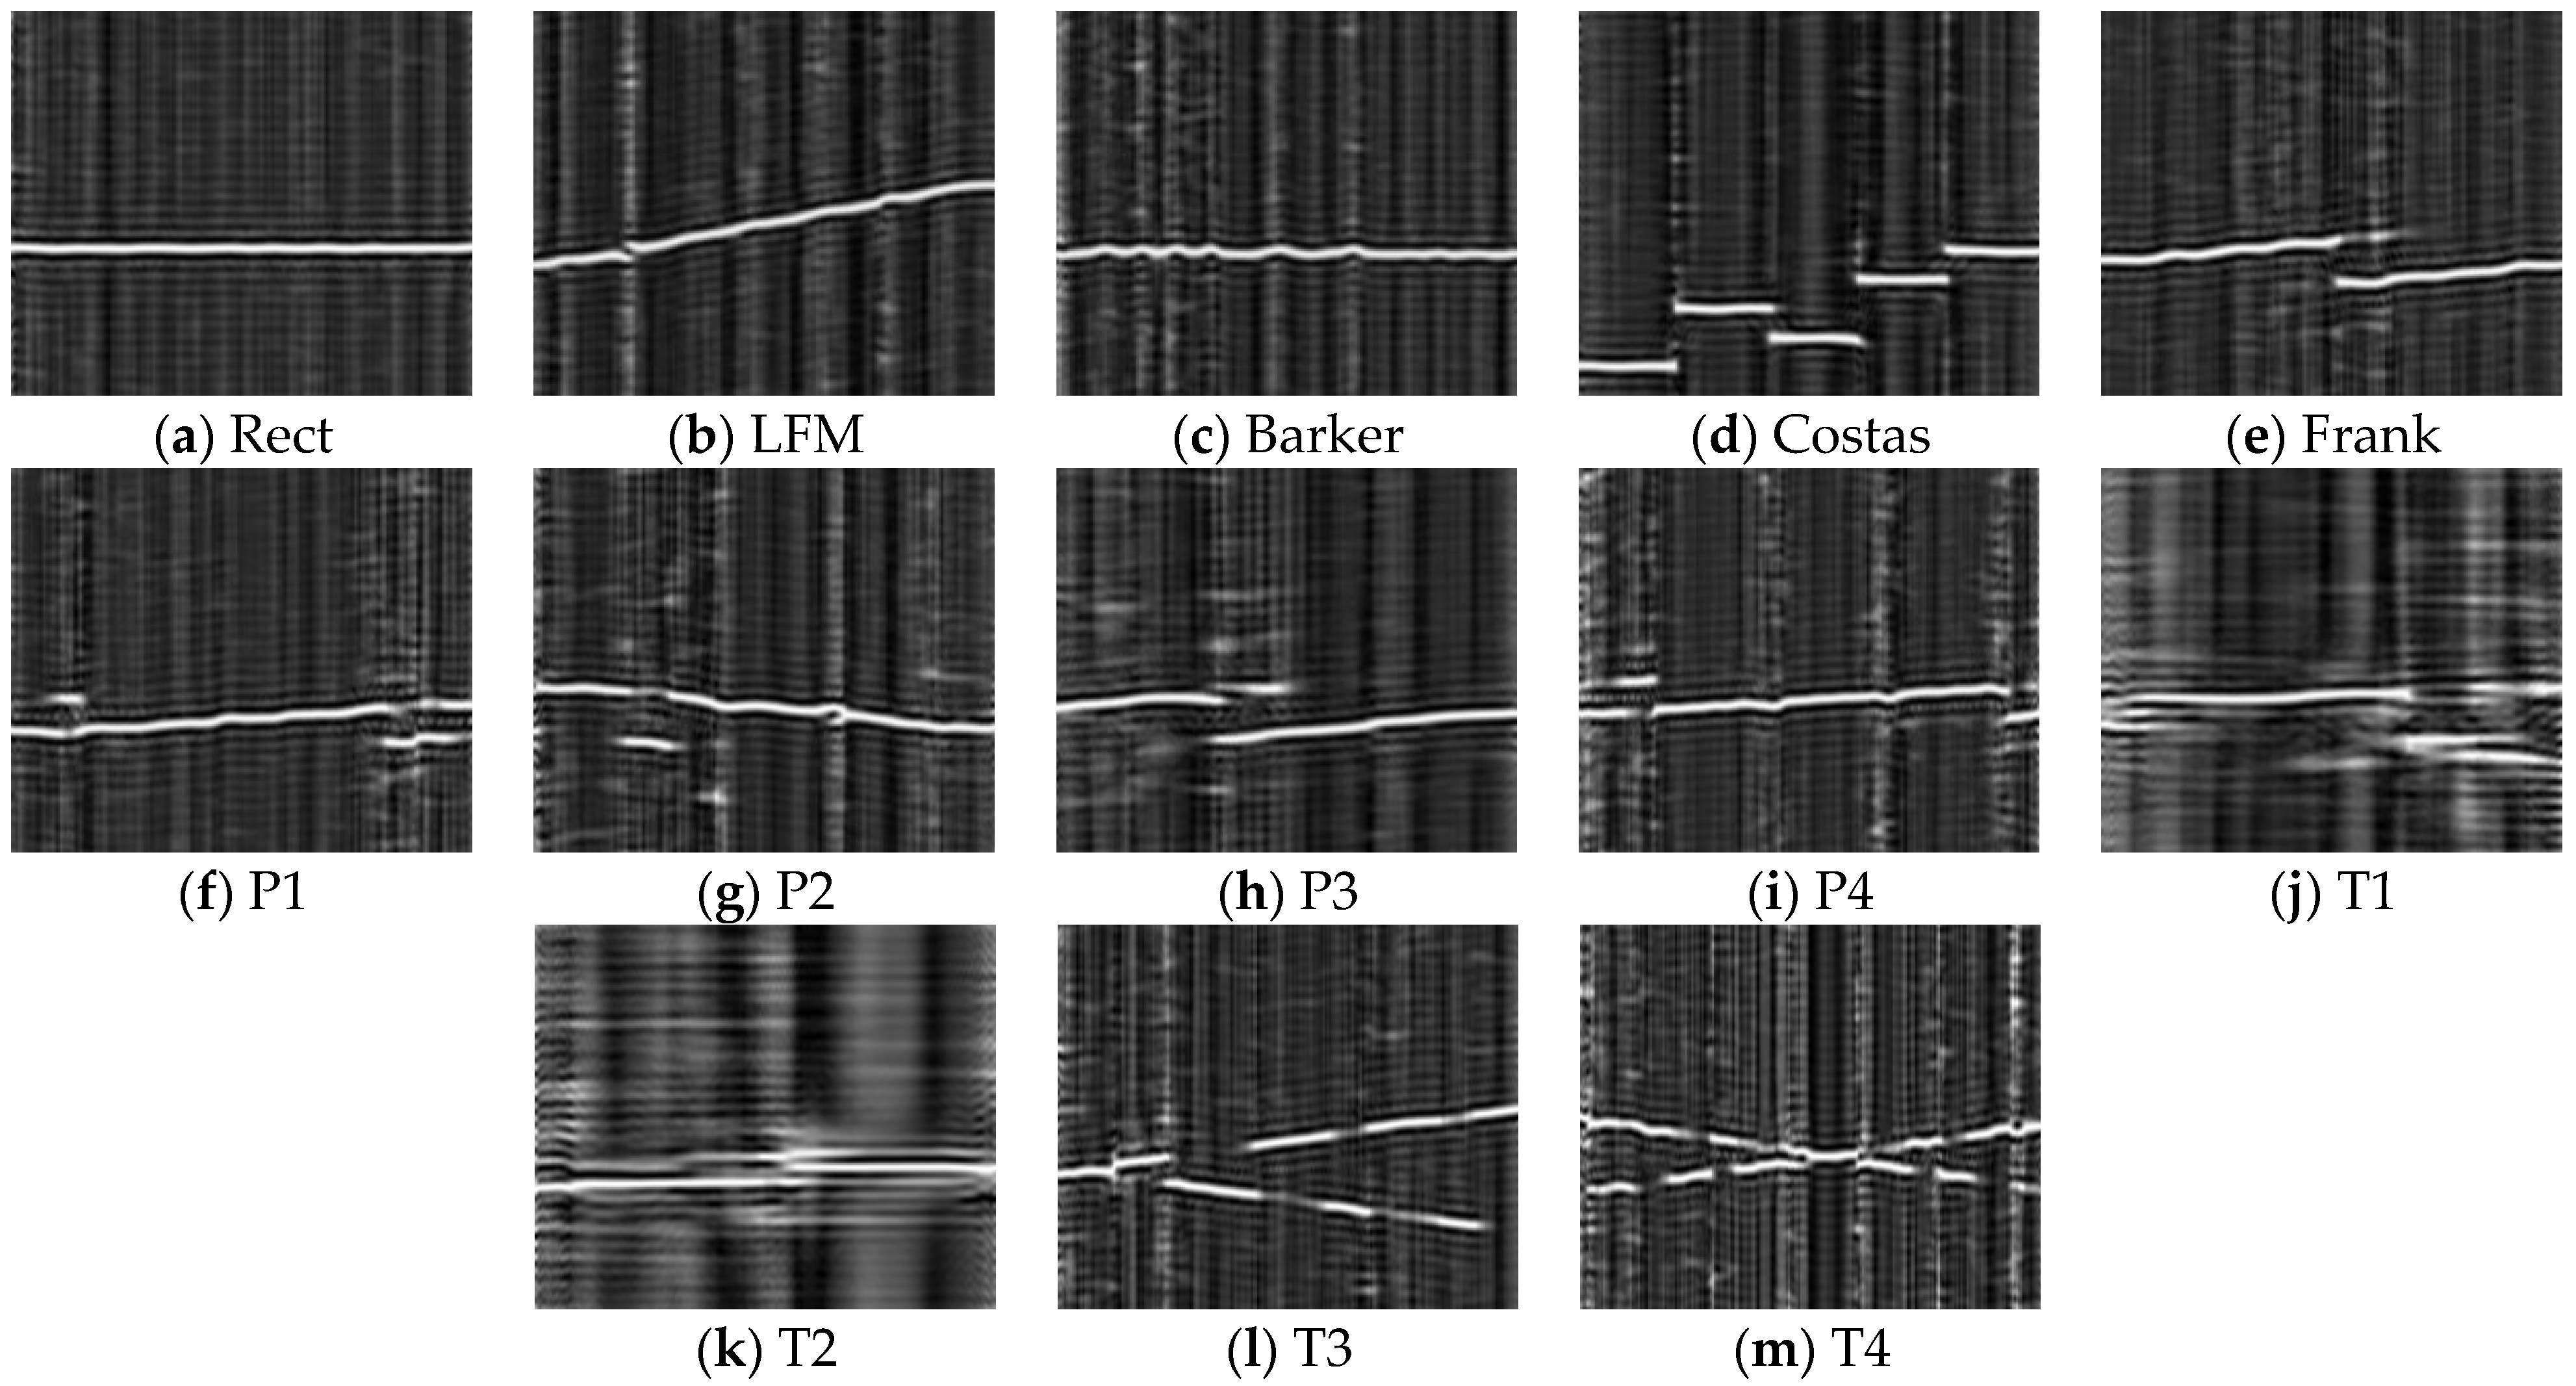
Figure 1. Time–frequency images of 13 kinds of LPI radar signals.
Electronics 14 04214 g001
Figure 2. The structure of our proposed method.
Electronics 14 04214 g002
Figure 3. Comparison of the original MBConv structure with the improved structure.
Electronics 14 04214 g003
Figure 4. Performance comparison before and after improved.
Electronics 14 04214 g004
Figure 5. The impact of different improvement strategies on model recognition accuracy.
Electronics 14 04214 g005
Figure 6. The overall classification results confusion matrix.
Electronics 14 04214 g006
Figure 7. Comparison of classification performance across different methods.
Electronics 14 04214 g007
Figure 8. Comparison of classification performance across attenuation.
Electronics 14 04214 g008
Table 1. EfficientNet-B0 baseline network.
StageOperatorResolutionChannelsLayers
1Conv3 × 3224 × 224321
2MBConv1, k3 × 3112 × 112161
3MBConv6, k3 × 3112 × 112242
4MBConv6, k5 × 556 × 56402
5MBConv6, k3 × 328 × 28803
6MBConv6, k5 × 514 × 141123
7MBConv6, k5 × 514 × 141924
8MBConv6, k3 × 37 × 73201
9Conv1 × 1, FC7 × 712801
Table 2. Parameters of 13 types of LPI radar signals.
Modulation TypesParametersValue
Rect Carrier   frequency   f 0 [ f s / 6 ,   f s / 5 ]
LFM Carrier   frequency   f 0 [ f s / 6 ,   f s / 5 ]
Bandwidth B [ f s / 20 ,   f s / 16 ]
Costas Fundamental   frequency   f m [ f s / 30 ,   f s / 24 ]
Frequency hop { 3 , 4 , 5 , 6 }
BarkerCode length { 7 , 11 , 13 }
Cycles per phase code [ 20 , 24 ]
Carrier   frequency   f 0 [ f s / 6 ,   f s / 5 ]
FrankNumber of frequency steps M { 6 , 7 , 8 }
Cycles   per   phase   code   C p p [ 3 , 5 ]
P1, P2 Carrier   frequency   f 0 [ f s / 6 ,   f s / 5 ]
Number of frequency steps M { 6 , 7 , 8 }
Cycles   per   phase   code   C p p [ 3 , 5 ]
P3, P4 Carrier   frequency   f 0 [ f s / 6 ,   f s / 5 ]
Number   of   subcodes   N c {36, 39, 64}
Cycles   per   phase   code   C p p [ 3 , 5 ]
T1, T2 Carrier   frequency   f 0 [ f s / 6 ,   f s / 5 ]
Number of segments m { 4 , 5 , 6 }
T3, T4 Carrier   frequency   f 0 [ f s / 6 ,   f s / 5 ]
Number of segments m { 4 , 5 , 6 }
Bandwidth B [ f s / 20 ,   f s / 10 ]
Table 3. Training parameter setting.
NoParameterValue
1Batch size32
2Iterations50
3OptimizerAdam
4Learning rate0.001
5 α in Focal Loss0.25
6 γ in Focal Loss2
Table 4. The impact of different strategies on model recognition rate.
Focal LossSimAMAccuracy (%)
××95.54
×95.91
×96.01
96.48
Disclaimer/Publisher’s Note: The statements, opinions and data contained in all publications are solely those of the individual author(s) and contributor(s) and not of MDPI and/or the editor(s). MDPI and/or the editor(s) disclaim responsibility for any injury to people or property resulting from any ideas, methods, instructions or products referred to in the content.