Abstract
This paper presents the development of a 224-channel radio frequency (RF) receiver operating in the 0.6–1.8 GHz band, intended for a wide-field phased array radio telescope. The system employs a cost-effective architecture that combines the flexibility of phased array feeds with the low-cost characteristics of reflector systems, enabling high gain, rapid scanning, and multi-beam observation. The receiver achieves low-noise amplification, dynamic gain control, and filtering through a modular design. The system provides a total gain of 80–85 dB with a noise temperature of less than 35.1 K.
1. Introduction
Fast Radio Bursts (FRBs) represent a recently observed class of transient radio emission phenomena, which have emerged as a research frontier in high-energy astrophysics and time-domain astronomy since their initial discovery in 2007 [1]. Characterized by millisecond-scale durations and extraordinary brightness, these events have drawn significant scientific attention. As of 2024, major radio observatories worldwide (including FAST, Parkes, and GBT) have collectively detected over 5000 FRB events, with approximately 8% exhibiting repeating burst patterns [2]. These groundbreaking discoveries not only reveal extreme physical environments in the cosmos but also pose new challenges to the field coverage capabilities of contemporary radio observation technologies.
The core performance parameters of modern radio telescopes can be categorized into three critical elements: (1) sensitivity, quantified by the System Equivalent Flux Density (SEFD) that positively correlates with effective collecting area [3]; (2) angular resolution, governed by diffraction limits and proportional to the wavelength/aperture ratio [4]; and (3) instantaneous field of view (FoV), determined by beamforming techniques. Notably, these parameters exhibit inherent engineering constraints—large apertures enhance resolution at the expense of reduced FoV [5], while high sensitivity demands substantial collecting areas. Such parameter interdependencies critically influence instrument selection strategies for diverse observational tasks.
The Five-hundred-meter Aperture Spherical Telescope (FAST), developed by the National Astronomical Observatories of the Chinese Academy of Sciences (NAOC), exemplifies fixed-dish systems with its exceptional sensitivity of 2000 m2/K [6]. However, its L-band FoV remains limited to 2.5 arcminutes due to aperture–FoV trade-offs [7]. In contrast, steerable parabolic systems like Australia’s 64 m Parkes Telescope (commissioned 1961) achieved an expanded instantaneous FoV of 5.9 degrees through phased array feed technology [8], though beam performance degrades with scan angle due to phase errors and secondary reflector limitations.
The Square Kilometer Array (SKA), a synthesis array paradigm, proposes to integrate 1.3 million log-periodic antennas (low-frequency), 250 mid-frequency aperture antennas, and 2500 parabolic dishes (15 m diameter) across 0.5–15 GHz, targeting both high-resolution and 30-degree FoV [9]. However, SKA’s Phase 1 digital backend must process up to 1000 PB/s data streams from its 1.3 million antennas, highlighting computational challenges in large-scale arrays.
To address these observational requirements, our project plans to develop an all-sky phased array radio telescope comprising 19 subarrays (1 m diameter each). Each subarray integrates 112 Vivaldi dual-polarized antennas with 224 receiving channels (Figure 1), achieving enhanced sensitivity through reduced receiver noise while maintaining a wide FoV and high resolution. This paper introduces the first experimental receiver prototype for this system, including RF front-end modules, calibration networks, and backend subsystems, primarily designed to validate core functionalities.
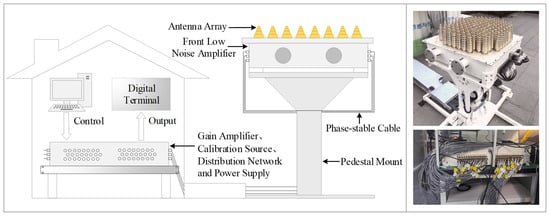
Figure 1.
224-Channel phased array radio telescope receiver.
Many research institutes around the world have developed receivers for radio telescopes. According to the working temperature, it can be divided into cryogenic receivers and room-temperature receivers. For example, NARO in the USA, for the Green Bank Telescope (GBT) project, has developed many versions of cryogenic PAF prototypes, including the dual-polarization dipole GBT1 PAF with a cryogenic Low-Noise Amplifier in 2015 [10]. In 2017, a highly sensitive cryogenic GBT2 PAF was proposed, which achieves a receiver temperature of 17 K at 1.4 GHz [11], and the expected additional noise in the LNA is approximately 4.8 K when cooled to 15 K [12]. For another Australian Square Kilometer Array Pathfinder (ASKAP) project, CSIRO developed the Mk. II PAF for ASKAP in 2016, which achieves a beam equivalent noise temperature of less than 50 K from 0.7 GHz to 1.8 GHz. The LNA for PAF measured a minimum noise temperature of 21 K when cooled to 77 K [13]. The noise temperature of cryogenic receivers is significantly lower than that of room-temperature receivers, so the use of cryogenic receivers is very popular in the field of radio astronomy. However, due to the expensive refrigeration equipment, the cost of cryogenic receivers is very high for phased array telescopes. Therefore, the development of low-noise room-temperature receivers is also important. For example, in 2009, NORO designed a room-temperature 19-element L-band phased array feed receiver for GBT, where the LNA noise temperature was 33 K [14]. In 2010, CSIRO designed a room-temperature focal plane array receiver for ASKAP, where the LNA noise temperature was 48 K, the gain was 12.6 dB, and the post-amplifier provided 17 dB gain [15]. In 2017, CSIRO designed an 188-element, 1.2 m diameter PAF receiver for ASKAP, where the LNA noise temperature was 40 K [16].
We propose a room-temperature receiver with low-noise temperature and high gain. Compared to cryogenic receivers such as GBT2 and Mk. II PAF, our design significantly expands the number of channels, and test results demonstrate excellent channel consistency. By adopting a simplified receiver architecture, we avoid introducing additional noise and achieve favorable noise performance at room temperature. The design also ensures high gain and improved gain flatness. Furthermore, considering the deployment environment and site conditions of the receiver, we develop a fast and feasible near-field calibration device and system. This article illustrates the system diagram and the 224-channel receiver architecture in Section 2. The measuring methods and testing results are discussed in Section 3.
2. Phased Array Radio Telescope Receiver Design
2.1. System Design of Radio Telescope Receiver
The phased field telescope receiver system presented in this study employs an all-digital architecture for multi-channel signal processing, with its core operational workflow divided into four principal stages: low-noise amplification, gain amplification stage, calibration source, and distribution network, as illustrated in the system block diagram in Figure 2. The overall assembly measures 1 m × 1 m.
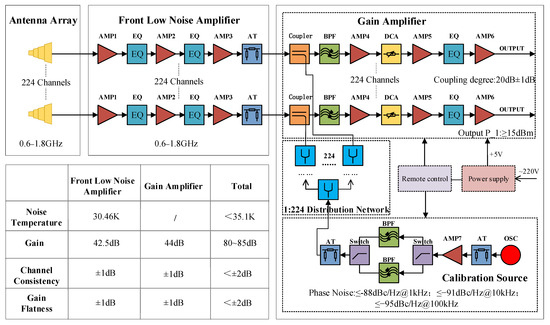
Figure 2.
Phased field telescope diagram.
A broadband helical antenna array operating within the 0.6–1.8 GHz frequency range captures electromagnetic signals. These signals are converted to baseband outputs via a 224-antenna matrix network, which processes 224 receive channels. Each receiver channel incorporates a front low-noise amplifier (FLNA) followed by a gain amplifier (GA). The FLNA provides a noise temperature of approximately 30.46 K and a gain of about 42.5 dB. The GA, serving as the subsequent amplification stage, provides an additional gain of approximately 40 dB. The total system noise temperature is less than 35.1 K, and the overall system gain ranges from approximately 80 to 85 dB.
The calibration source generates broadband calibration signals under command, which the calibration network splits into 224 channels for injection into the GA. An isolated three-output power supply module provides internal system power. The remote-control module facilitates GA bandwidth selection, gain adjustment, calibration signal management, and power supply monitoring.
Chassis 1 integrates 224 FLNA channels with direct antenna interfaces. Chassis 2 integrates 224 GA channels alongside the calibration source, calibration network, and power modules. Phase-stable cables interconnect the chassis. Signals undergo amplification, filtering, attenuation, and calibration within the RF front-end before being output via Chassis 2 ports for digital processing.
2.2. RF Front-End Design
The RF front-end comprises an FLNA and a GA, designed to linearly amplify weak input signals while minimizing the overall noise contribution.
FLNA uses Skyworks’ Sky67151 and Sky67159 models. These two amplifiers are designed based on GaAs PHEMT technology and have the characteristics of high gain, low-noise temperature, and ultra-wideband. Since the noise figure of FLNA mainly depends on the first-stage amplifier, the first stage uses the SKY67151, which has a lower noise temperature. However, its return loss (S11) is more than −10 dB near 1.6 GHz according to its datasheet. To improve the S11, an input matching network is designed. The S11 of the amplifier could be less than 10 dB after the input matching network design.
According to the datasheet of Sky67151, the gain of Sky67151 drops by about 7 dB from 0.6 GHz to 1.8 GHz; the in-band gain flatness of SKY67159 is less than 0.5 dB, the noise temperature is less than 26.39 K, the S22 wave is better than −20 dB, and the S11 is better than −16 dB. The gain of this 3-stage amplifier fluctuates by about 8 dB.
The latter two low-noise amplifiers require better in-band gain flatness within 0.6 to 1.8 GHz, a noise temperature less than 75.27 K, and good input-output standing waves. Therefore, Skyworks’ SKY67159 and SKY65017 were chosen as the second and third amplifiers. The first-stage amplifier’s gain is reduced by approximately 7 dB from 0.6 GHz to 1.8 GHz. To obtain good in-band gain flatness, we design a two-stage equalizer. The parameters of the equalizer in Figure 3 are C5 = C6 = C7 = 1 pF, R1 = R2 = 15 Ohm, R3 = 68 Ohm, and L3 = 5.6 nH.

Figure 3.
Simplified schematic of the 3-stage FLNA.
Figure 4 shows the simulation results of the equalizer circuit schematic. A two-stage equalizer is used here, with the single-stage equalizer providing 3.7 dB compensation and the two-stage equalizer providing 7.4 dB compensation, which achieves the requirement of in-band gain ripple ≤ ±1.5 dB from 0.6 GHz to 1.8 GHz.
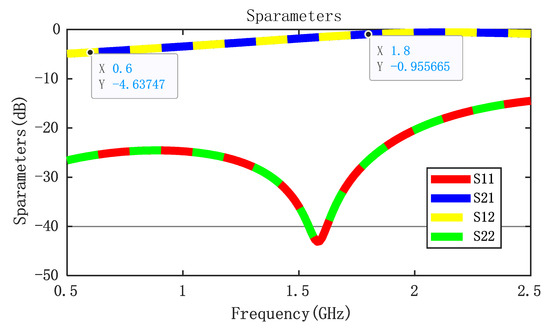
Figure 4.
S-parameter simulation of the equalizer for FLNA.
As the second stage of the receiver, GA consists of a coupler, a filter, three amplifiers, an equalizer, and a digitally controlled attenuator (DCA). We use SKY67159 and SKY65017 for the design. The gain flatness of the entire circuit link is mainly affected by the amplifier, and the influence of other components is relatively small. The gain of the first and second-stage amplifiers (SKY67159) has a 1 dB gain drop from 0.6 G to 1.8 G, the gain of the third-stage amplifier (SKY65017) has a 0.5 dB gain drop within the bandwidth, and the other components have a gain drop of about 0.7 dB.
The system noise figure is generally simulated by the Friis formula in RF systems, which is used for the combination of multiple amplifiers or passive devices.
Ftotal is the total noise figure of the whole system, and Fn and Gn represent the noise figure and gain of the class n. The noise figure (NF) is generally expressed in two ways: decibels (dB) and linear values (F). In Friis’s formula, the gain and noise figures of each level need to be multiplied and added by linear values.
Table 1 shows the performance of the FLNA and GA. This FLNA achieves a gain of 42.54 dB and a noise temperature of 30.46 K. We use two equalizers to achieve a gain flatness of less than 1 dB, and the final stage cascade PI attenuator is used to adjust the total gain value. The power supply of Sky67151 is 5 V/65 mA, the power supply of Sky67159 is 5 V/45 mA, and the total current of the FLNA is 155 mA.

Table 1.
Parameters of FLNA and GA.
GA includes three amplifiers, achieving a gain of more than 40 dB, and uses an equalizer to achieve gain flatness of less than ±1 dB. According to the datasheet, the DCA (PE43712) could provide a maximum attenuation of 31.75 dB with 0.5 dB steps, which can achieve adjustable gain. The gain flatness of the entire circuit link is mainly affected by the amplifier, and the influence of other components is relatively small. Figure 5 shows the schematic of the equalizer circuit. The parameters are L1 = 0.3 nH, L2 = 55 nH, C1 = 10 pF, C2 = 0.05 pF, R1 = 15 Ohm, R2 = 15 Ohm, R3 = 180 Ohm, and the S-parameter simulation results are shown in Figure 6. The equalizer provides 1.46 dB compensation.
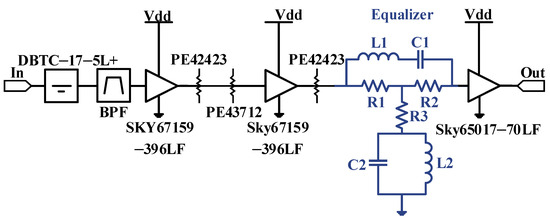
Figure 5.
Simplified schematic of a 3-stage gain amplifier.
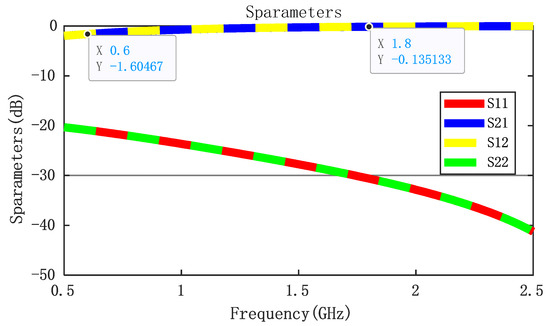
Figure 6.
S-parameter simulation of the equalizer.
The RF front-end component integrates the above FLNA and GA. Table 1 shows the performance of the RF front-end. The gain of the FLNA is greater than 40 dB, and the GA is 40~45 dB. Therefore, the gain of the RF front-end is 80~85 dB. We simulate the maximum gain and minimum gain for whether the DCA is turned on. The conclusion is that when DCA is 1 dB, the maximum gain is 86.5 dB, the noise temperature is 30.46 K, and the OIP3 is 29.61 dB. When DCA is 31.75 dB, the minimum gain is 54.75 dB, the noise temperature is 32.54 K, and the OIP3 is 24.37 dB.
2.3. Radio Frequency Link Calibration and Monitoring
The design and performance of the feed network directly affect the overall performance of the antenna. Specifically, the feed network ensures that the radiation characteristics of each element in the antenna array meet the design requirements by rationally distributing the amplitude and phase of the current and voltage, thus improving the antenna gain and beam control ability. In addition, the feed network is responsible for impedance matching, ensuring that the signal can be transmitted efficiently, reducing reflection and loss, and thus improving the overall efficiency of the system.
In this design, the feed network consists of a 1:16 power divider and a 1:14 power divider. In order to reduce the power component network size as much as possible, the chip power component is selected as the basic unit of the feed network. The 1:16 structure of this scheme is composed of a fourth-order equal power division network, and a 1:14 power divider connects a 50 Ω load.
In accordance with the deployment environment and site conditions of the phased array telescope, a rapid and feasible near-field calibration device and system have been designed. In this near-field calibration system, a transmitting probe is fixed above the phased array antenna elements via a scanning mechanism, with its radiation direction facing the antenna array. Port 1 of a vector network analyzer is connected to the transmitting probe, while port 2 is connected to the output of the phased array receive chain. By accurately moving the probe step by step, the amplitude and phase errors of each tested unit are sequentially collected and stored under remote control. A block diagram of the near-field calibration principle is shown in Figure 7a, and a photograph of the actual test setup is provided in Figure 7b.
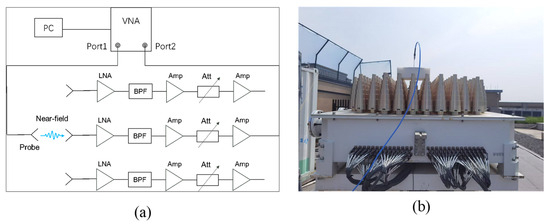
Figure 7.
Near-field calibration technology. (a) Schematic diagram of the near-field calibration principle; (b) field test setup.
Subsequently, the near-field probing method is used to generate an initial calibration lookup table for the large-scale phased array antenna. This table corresponds one-to-one with the internal calibration data obtained simultaneously during testing and serves as a reference for periodic internal calibration comparisons during actual operation.
In this paper, the calibration module outputs three point-frequency signals at 0.6 GHz, 1.2 GHz, and 1.8 GHz, which serve as the input signals for the calibration network. The reference is provided by a 10 MHz temperature-compensated crystal oscillator (Model WTV-705AE57C3.3-010.000MHz from WINTRON China, Shenzhen, China), whose frequency stability and accuracy meet the system requirements. The frequency synthesizer (PLL) utilizes the ADF4351 chip. During the design process, considering the power requirements of the subsequent calibration network, an SBB3089 (Qorvo, NC, USA) amplifier (AMP7) is chosen to provide a gain of 16 dB. Additionally, a cascaded π-attenuator is used to adjust the gain, ensuring that the final output gain can reach or exceed 4 dBm. Furthermore, to effectively filter out the second and third harmonics generated by the PLL and amplifier output signals, this design chooses a switchable cascaded filter to select the signals with 0.6 GHz, 1.2 GHz, and 1.8 GHz outputs.
2.4. Digital Backend Data Handling
We employ all-digital beamforming (DBF) within the monostatic array of the field telescope to process the high-speed data stream acquired by the antenna array in real-time at a microsecond level, achieving spatial focusing of wideband signals and simultaneously capturing radio emissions from multiple directions across a wide field of view. The core methodology involves channelizing the signals, acquired in real-time by digital receivers, into narrow subband components using an oversampled polyphase filter bank (OSPFB). The data stream of each subband is then multiplied by the corresponding complex weights, or beamforming coefficients, which are calculated from the antenna position vectors and the direction vectors of beam pointing. This process of complex weighting precisely adjusts the phase of the signals from each antenna, resulting in constructive interference for the signals from the target direction and destructive suppression for others. Prior to beamforming, a fine-grained calibration was performed to compensate for phase errors introduced by the digital receivers. The effectiveness of this approach was validated through the observation of a target source, as demonstrated by the results presented in Section 3.5.
3. Results
This design established a test platform covering the 0.6–1.8 GHz for evaluating key receiver parameters (Figure 8a), enabling systematic assessment of key performance indicators for phased array receivers. The test equipment includes a noise figure analyzer (NFA, keysight N8976B, Santa Rosa, CA, USA, with spectrum analyzer mode), a vector network analyzer (VNA, Keysight P5024A, Santa Rosa, CA, USA), a signal generator (Rigol DSG5202, Suzhou, China), and a power supply (Keysight EDU36311A, Santa Rosa, CA, USA). Figure 8b–d show the testing methods for the key indicators. The testing environment temperature remained stable at 25 °C throughout the evaluation.
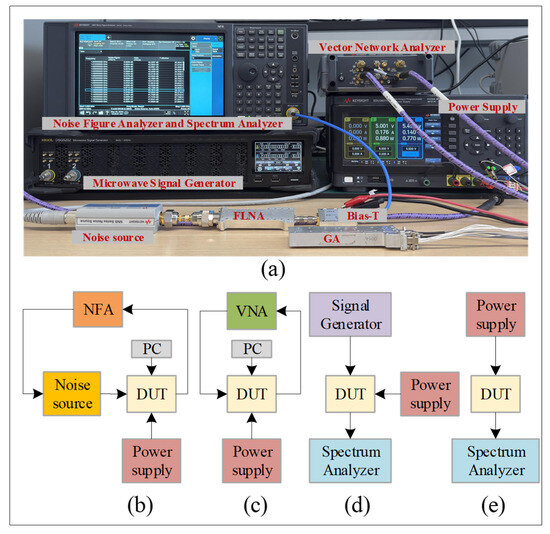
Figure 8.
Testing environment and testing methods. (a) Test photo; (b) noise temperature test; (c) S-parameter test; (d) linearity test; (e) calibration source test.
3.1. Noise Temperature
For RF front-end modules operating at room temperature, system noise measurements were performed using the Y-factor method. With attenuators set to 0 dB, noise figure characterization was conducted across 224 modules at frequency points of 0.6, 0.8, 1.0, 1.2, 1.4, 1.6, and 1.8 GHz. The processed data, visualized in Figure 9, displays the noise temperature distribution of all 224 channels via box plots.
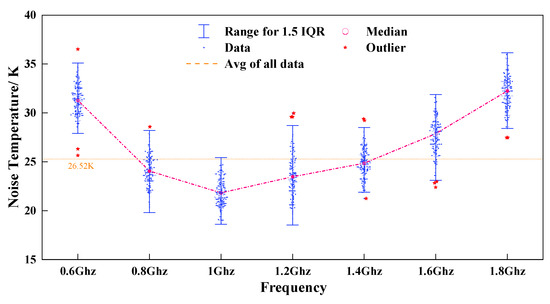
Figure 9.
Noise temperature box plot of the 224 RF front-end (Q1 corresponds to the 25th percentile of data points, indicating that 25% of the 224 datasets at that frequency point fall below this value; Q3 represents the 75th percentile, meaning 25% of the data exceeds this threshold).
As shown in Figure 9, the majority of data points cluster between the first (Q1) and third quartiles (Q3), with a narrow interquartile range (IQR), indicating stable noise temperature performance across all channels and frequencies. A small number of outliers, attributed to minor environmental fluctuations and component tolerances, exhibit negligible deviations and were excluded from statistical analysis. The average noise temperature across all 224 channels was calculated for each frequency, yielding a system-wide average of 26.5 K and a maximum noise temperature of 35.1 K. Test results show close agreement with simulation data.
3.2. Gain, Gain Flatness, and Channel Gain Consistency
Within the 0.6–1.8 GHz frequency range, the gain of all 224 channels in the system ranges between 80 dB and 85 dB (Figure 10). Since the RF front-end module is directly connected to the antenna at its input and interfaces with an ADC for digital signal processing at its output, the system gain is primarily contributed by the RF front-end. Specifically, the FLNA provides approximately 40–43 dB of gain, while the GA contributes an additional 40–43 dB.
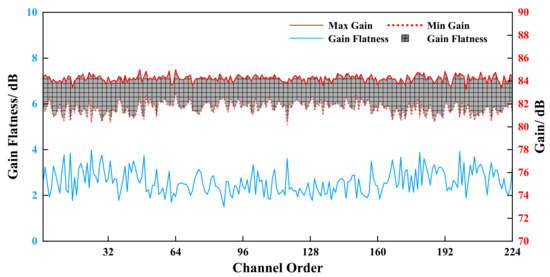
Figure 10.
Gain and gain flatness of the receiver.
All channels exhibit in-band gain flatness () within ±2 dB, with a maximum deviation of 4 dB (Figure 10). Using one channel as the reference, box plots of channel gain consistency (CGC) for the remaining 223 channels across seven frequency points were generated. These plots demonstrate that the multi-channel gain consistency is within ±2 dB (Figure 11).
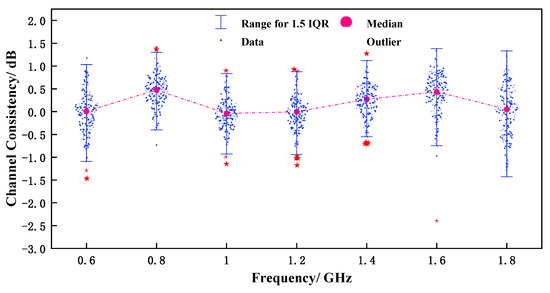
Figure 11.
Channel consistency of the receiver.
3.3. Linearity
Linearity testing of the receiver was conducted at 0.6 GHz, 1.2 GHz, and 1.8 GHz. The output power of the receiver was measured using a spectrum analyzer by varying the signal source power (Figure 12). The output power at 1 dB gain compression (P_1dB) of the receiver was determined when the RF front-end’s gain decreased by 1 dB. The system-wide minimum P_1dB value was measured as 15 dB.
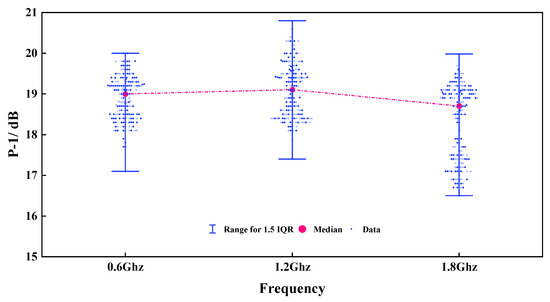
Figure 12.
The 1 dB gain compression point of the receiver.
3.4. Near-Field Calibration Test Results
The raw data of phase and amplitude errors from the external near-field calibration of the 224-element array are shown in Figure 13a,b. In the RF chain, the digital step attenuator has a step size of 0.5 dB and a maximum attenuation of 31.5 dB. By configuring the attenuation level of each element’s digital attenuator, amplitude equalization was performed separately for X- and Y-polarizations. Phase equalization was carried out in the digital signal processing domain. For example, at 1.2 GHz, the phase difference between each channel and the reference channel was used as the phase equalization parameter in the digital signal processor. The equalized phase and amplitude responses are shown in Figure 13c,d.
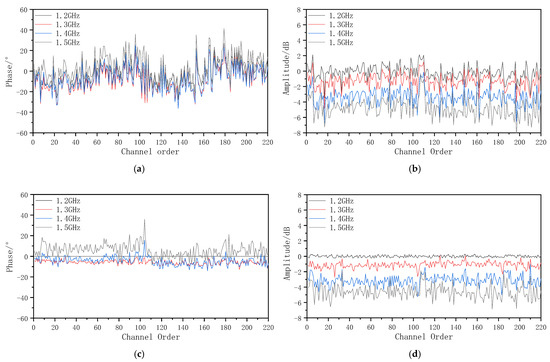
Figure 13.
Near-field calibration test results. (a) Phase before calibration; (b) amplitude before calibration; (c) phase after calibration; (d) amplitude after calibration.
After digital equalization, the phase inconsistency across the 224 channels was ≤±6.4° at 1.3 GHz, ≤±14.9° at 1.4 GHz, and ≤±22.3° at 1.5 GHz. The amplitude inconsistency was ≤±0.25 dB at 1.2 GHz, ≤±1.4 dB at 1.3 GHz, and ≤±2.5 dB at 1.4 GHz.
3.5. Beamforming Results
We established an 8-channel small-scale test system based on a Radio Telescope Receiver to observe an unmanned aerial vehicle carrying a signal source. The all-digital beamforming algorithm was deployed on a server cluster to validate its real-time processing capability. As shown in Figure 14, the measurement results demonstrate that the system could successfully point toward the signal source on the UAV and track its movement. The spectral characteristics of the beamformed signal directed at the source consistently matched those of the original transmitted signal.

Figure 14.
Beamforming Test Results.
4. Discussion
This study successfully demonstrates a high-performance, multi-channel receiver operating under room-temperature conditions. As summarized in Table 2, compared to existing state-of-the-art room-temperature receivers (e.g., the ASKAP receiver), our design achieves superior gain and exceptional gain flatness while maintaining a comparable system noise temperature.

Table 2.
Performance summary and comparison with the state-of-the-art receiver.
Key performance breakthroughs within the 0.6–1.8 GHz band are highlighted as follows:
Noise Temperature: An average noise temperature of 26.5 K and a maximum of 35.1 K are achieved. The average noise temperature is as low as 26.5 K, with a maximum maintained at 35.1 K. This outstanding noise performance is primarily attributed to the system-level design.
Gain and Flatness: A high gain of 80–85 dB, combined with a gain variation of only ±2 dB, demonstrates the system’s strong amplification capability and excellent channel consistency. This lays the foundation for large-scale channel integration, directly enhancing the overall system sensitivity.
Scalability: The 224-channel design significantly expands the channel count compared to cryogenic receivers like CBT2 and Mk. II PAF. Test results confirm good channel consistency, highlighting the potential of this architecture for application in large-scale arrays.
Merits and Innovations: The core merit of this design lies in its ability to achieve system performance comparable to some cryogenic systems without the need for complex and expensive cryogenic cooling. This dramatically reduces deployment, operational costs, and system complexity. Furthermore, the specially developed fast near-field calibration system provides crucial technical support for the practical deployment and periodic maintenance of such a large-scale array.
Demerits and Future Work: Despite the excellent performance, certain inherent trade-offs exist. Firstly, the room-temperature operation fundamentally limits the ultimate noise performance, preventing it from reaching the ultra-low-noise levels of top-tier cryogenic receivers. Secondly, large-scale channel integration, while boosting sensitivity, increases system power consumption and thermal management challenges. Future work will focus on optimizing power consumption, further improving linearity (e.g., P_1dB), and exploring the integration of compact thermoelectric cooling for critical modules. This aims to push the performance closer to its limits without significantly increasing system complexity.
As shown in Table 2, this receiver achieves high gain and exceptional flatness while maintaining a noise temperature comparable to systems such as the receiver of ASKAP under room-temperature conditions. The system sensitivity is enhanced through large-scale channel integration.
5. Conclusions
This paper presents the design and implementation of a 224-channel room-temperature receiver system for a phased array telescope. The system comprises key modules, including the RF front-end, calibration source, calibration network, power supply, and controller. Experimental results demonstrate that within the operational frequency band of 0.6–1.8 GHz, the 224-channel RF front-end exhibits outstanding performance: an average noise temperature as low as 26.5 K with a maximum of 35.1 K; a peak gain reaching 85 dB (typically ranging from 80 to 85 dB); and excellent in-band flatness (±2 dB), channel consistency (±2 dB), and linearity (input 1 dB compression point > 15 dB). Compared to existing uncooled receivers of the same class, this design achieves significantly enhanced system gain while maintaining low-noise temperature. The receiver has been successfully integrated into a phased array telescope prototype, and further observational verification work will be conducted subsequently.
Author Contributions
Conceptualization, X.C. (Xiaokang Chen) and S.J.; methodology, X.C. (Xiaokang Chen) and S.J.; software, X.C. (Xiaokang Chen) and S.J.; validation, X.H. (Xinli Han); formal analysis, X.H. (Xinli Han); investigation, X.C. (Xue Chen); resources, C.Q.; data curation, X.H. (Xinge Huang); writing—original draft preparation, X.C. (Xiaokang Chen) and S.J.; writing—review and editing, X.C. (Xiaokang Chen), S.J. and Z.C.; visualization, X.C. (Xiaokang Chen) and S.J.; supervision, X.Z.; project administration, R.D.; funding acquisition, R.D. All authors have read and agreed to the published version of the manuscript.
Funding
The “Pioneer” and “Leading Goose” R&D Program of Zhejiang (2024SSYS0009).
Data Availability Statement
The dataset is available on request from the authors.
Conflicts of Interest
The authors declare no conflicts of interest.
References
- Lorimer, D.R.; Bailes, M.; McLaughlin, M.A.; Narkevic, D.J.; Crawford, F. A bright millisecond radio burst of extragalactic origin. Science 2007, 318, 777–780. [Google Scholar] [CrossRef] [PubMed]
- Blinkverse. Available online: https://blinkverse.zero2x.org/ (accessed on 19 June 2025).
- Sun, Z.X.; Wang, J.Q.; Wang, G.L. Sensitivity Analysis of the Feed System for the TM VGOS Telescope. In Proceedings of the 2020 12th International Conference on Communication Software and Networks (ICCSN), Chongqing, China, 12–15 June 2020. [Google Scholar] [CrossRef]
- Kellermann, K.I.; Moran, J.M. The Development of High-Resolution Imaging in Radio Astronomy. Annu. Rev. Astron. Astrophys. 2001, 39, 457–509. [Google Scholar] [CrossRef]
- Ivashina, M.V.; Iupikov, O.; Maaskant, R.; van Cappellen, W.A.; Oosterloo, T. An Optimal Beamforming Strategy for Wide-Field Surveys with Phased-Array-Fed Reflector Antennas. IEEE Trans. Antennas Propag. 2011, 59, 1864–1875. [Google Scholar] [CrossRef]
- Li, D.; Pan, Z. The Five-hundred-meter Aperture Spherical Radio Telescope (FAST) Project: THE FAST PROJECT. Radio Sci. 2016, 51, 1060–1064. [Google Scholar] [CrossRef]
- Hengqian, G.; Chengjin, J.; Haiyan, Z.; Yan, S.; Rendong, N. A way to improve the field of view of the large aperture radiotelescope. In Proceedings of the 2004 Asia-Pacific Radio Science Conference, Qingdao, China, 24–27 August 2004. [Google Scholar]
- Roshi, D.A.; Shillue, W.; Simon, B.; Warnick, K.F.; Jeffs, B.; Pisano, D.J.; Prestage, R.; White, S.; Fisher, J.R.; Morgan, M.; et al. Performance of a Highly Sensitive, 19-element, Dual-polarization, Cryogenic L-band Phased-array Feed on the Green Bank Telescope. Astron. J. 2018, 155, 202. [Google Scholar] [CrossRef]
- Hotan, A.W.; Bunton, J.D.; Chippendale, A.P.; Whiting, M.; Tuthill, J.; Moss, V.A.; McConnell, D.; Amy, S.W.; Huynh, M.T.; Allison, J.R.; et al. Australian Square Kilometre Array Pathfinder: I. System Description; Cambridge University Press: Cambridge, UK, 2021. [Google Scholar]
- Roshi, D.A.; Warnick, K.F.; Brandt, J.; Fisher, J.R.; Ford, P.; Jeffs, B.D.; Marganian, P.; McLeod, M.; Mello, M.; Morgan, M.; et al. A 19 element cryogenic phased array feed for the Green Bank Telescope. In Proceedings of the 2015 IEEE International Symposium on Antennas and Propagation & USNC/URSI National Radio Science Meeting, Vancouver, BC, Canada, 19–24 July 2015. [Google Scholar]
- Roshi, D.A.; Shillue, W.; Fisher, J.R.; Morgan, M.; Castro, J.; Groves, W.; Boyd, T.; Simon, B.; Hawkins, L.; van Tonder, V.; et al. A Highly-Sensitive Cryogenic Phased Array Feed for the Green Bank Telescope. In Proceedings of the 2017 XXXIInd General Assembly and Scientific Symposium of the International Union of Radio Science (URSI GASS), Montreal, QC, Canada, 19–26 August 2017. [Google Scholar]
- Groves, W.M., III; Morgan, M.A. A Cryogenic SiGe Low-noise Amplifier Optimized for Phased-array Feeds. Publ. Astron. Soc. Pac. 2017, 129, 085001. [Google Scholar] [CrossRef]
- Chippendale, A.P.; Brown, A.J.; Beresford, R.J.; Hampson, G.A.; Shaw, R.D.; Hayman, D.B.; Macleod, A.; Forsyth, A.R.; Hay, S.G.; Leach, M.; et al. Measured Aperture-Array Noise Temperature of the Mark II Phased Array Feed for ASKAP. In Proceedings of the 2015 International Symposium on Antennas and Propagation (ISAP), Hobart, Australia, 9–12 November 2015. [Google Scholar]
- Warnick, K.F.; Jeffs, B.D.; Landon, J.; Waldron, J.; Jones, D.; Fisher, J.R.; Norrod, R. Beamforming and imaging with the BYU/NRAO L-band 19-element phased array feed. In Proceedings of the 2009 13th International Symposium on Antenna Technology and Applied Electromagnetics and the Canadian Radio Science Meeting, Banff, AB, Canada, 15–18 February 2009. [Google Scholar]
- Hayman, D.B.; Bird, T.S.; Esselle, K.P.; Hall, P.J. Experimental Demonstration of Focal Plane Array Beamforming in a Prototype Radiotelescope. IEEE Trans. Antennas Propag. 2010, 58, 1922–1934. [Google Scholar] [CrossRef]
- Beresford, R.; Ferris, D.; Cheng, W.; Hampson, G.; Bunton, J.; Chippendale, A.; Kanapathippillai, J. A radio astronomy L-band phased array feed system using RF over fiber distribution. In Proceedings of the 2017 International Topical Meeting on Microwave Photonics (MWP), Beijing, China, 23–26 October 2017. [Google Scholar]
- Sheng-Pu, N.; Yang, W.; Jun, M. Design and Preliminary Test results of a L-band Phased Array Feed for QTT. In Proceedings of the 2021 13th International Symposium on Antennas, Propagation and EM Theory (ISAPE), Zhuhai, China, 1–4 December 2021; pp. 1–3. [Google Scholar] [CrossRef]
- Ibarra-Medel, E.; Velazquez, M.; Ferrusca, D.; Kurtz, S. Design and construction of a Low-Noise L-Band Amplifier for the Tulancingo I radio Telescope. In Proceedings of the 2022 IEEE Latin American Electron Devices Conference (LAEDC), Cancun, Mexico, 4–6 July 2022; pp. 1–4. [Google Scholar] [CrossRef]
- Burnett, M.C.; Ashcraft, N.; Ammermon, S.M.; Jeffs, B.D.; Warnick, K.F. Low Noise L-band RF-over-fiber Signal Transport for ALPACA on the GBT. In Proceedings of the 2022 United States National Committee of URSI National Radio Science Meeting (USNC-URSI NRSM), Boulder, CO, USA, 4–8 January 2022; pp. 125–126. [Google Scholar] [CrossRef]
Disclaimer/Publisher’s Note: The statements, opinions and data contained in all publications are solely those of the individual author(s) and contributor(s) and not of MDPI and/or the editor(s). MDPI and/or the editor(s) disclaim responsibility for any injury to people or property resulting from any ideas, methods, instructions or products referred to in the content. |
© 2025 by the authors. Licensee MDPI, Basel, Switzerland. This article is an open access article distributed under the terms and conditions of the Creative Commons Attribution (CC BY) license (https://creativecommons.org/licenses/by/4.0/).