Abstract
This paper proposes a metal defect detection method based on laser-induced audible sound testing (LAST). Defective and defect-free martensitic stainless-steel cubes were used as study samples, and the spectral characteristics of the acoustic signals generated under laser irradiation were comparatively analyzed. Based on F-ratio analysis, weighting curves characterizing the discrimination capability of each frequency band were calculated. Subsequently, nonlinear filter banks were designed according to the spectrum discrimination weights, tailored to the degree of spectrum discrimination. Finally, a globally weighted cepstral coefficient (GWCC) extraction algorithm for laser-induced acoustic signals was developed to determine whether defects are present in metals. Experimental results show that the recognition rate of defective samples based on GWCC features reached 94%, higher than that of traditional acoustic features, effectively enhancing feature discriminability. The results of this study demonstrate that applying LAST to metal defect detection is feasible. This method leverages laser-generated acoustic signals from a more comprehensive and economical perspective, pioneering a new solution for non-destructive testing of metal defects.
1. Introduction
Non-destructive testing (NDT) techniques are crucial for industrial quality control and structural health monitoring. In recent years, demand has been increasing for rapid and non-contact detection of defects in metallic components. Laser ultrasonics (LUT), as the mainstream non-contact inspection method [1,2,3], excites ultrasonic waves (typically greater than 1 MHz) using pulsed lasers and receives surface vibration signals with interferometers. It has been successfully applied to defect detection in high-end equipment such as aerospace and nuclear power systems [4,5,6,7,8,9]. LUT boasts advantages including high spatial resolution (typically at the micrometer scale) and high sensitivity to internal defects [10]. However, it also faces several limitations, such as high equipment cost, the need for precise calibration, and sensitivity to surface conditions of the material [11].
For defect detection in metallic materials, other technological approaches exist in addition to LUT. Ultrasonic testing (UT) relies on the principle that acoustic waves are reflected when encountering defects during propagation through a material. It utilizes probes and coupling agents to identify defect types and sizes. To improve signal-to-noise ratio, researchers have applied signal processing algorithms such as wavelet transform and complementary ensemble empirical mode decomposition (CEEMD) [12]. Electromagnetic acoustic testing (EMAT) excites and receives ultrasonic waves by electromagnetic coupling. By eliminating the need for coupling agents, it offers greater suitability for rough-surface inspection. Recent advances include the differential-mode coil and dual-conditioning circuit proposed by Ma [13], and the optimization of an omnidirectional magnetic-concentrator-type EMAT (OD-MC-EMAT) structure by Liu [14], both of which significantly enhance resistance to lift-off effects and improve defect detection performance. Radiographic testing (RT) employs the penetration and attenuation properties of X-rays or gamma rays for imaging.
Signal processing and artificial intelligence methods are playing an increasingly important role in data analysis within the field of metal non-destructive testing. Methods such as the non-local means denoising algorithm by Kim [15] and Butterworth high-pass filtering by Wang [16] have improved image quality and defect recognition efficiency, and several real-time inspection systems have been developed.
By integrating the Wavelet Packet Pooling Mechanism (WPPM) with a Spiking Neural Network (SNN), the groundbreaking study by Wang et al. [17] provides a new paradigm for compound defect detection. This bio-inspired model combines interpretability with powerful time-frequency analysis, delivering exceptional robustness and accuracy in noisy settings be-yond traditional methods and greatly promoting the practical use of AI in industrial nondestructive testing. However, due to the complexity of on-site equipment and testing conditions, as well as the diversity of workpiece materials and geometries, the ability to generalize and adaptability remain the primary challenges facing various algorithms today.
Although the aforementioned traditional inspection methods based on physical signals such as ultrasound and X-rays have established a relatively mature non-destructive testing system, their detection perspective remains primarily focused on the macroscopic structure and internal geometric features of materials. In recent years, Laser-induced breakdown spectroscopy (LIBS) employs ultrashort pulsed laser irradiation to generate plasma on the sample surface, followed by analysis of the plasma emission spectrum to determine the material composition and concentration. It notable that during the acquisition of ultrasonic signals, a broadband response containing audible components is also recorded. Notably, within the complex physical process of LIBS laser pulse-material interaction, alongside the generation of optical and ultrasonic signals used for compositional analysis and defect detection, there exists a long-overlooked “byproduct”—the audible acoustic signal produced instantaneously during laser exposure. This signal serves as an “acoustic snapshot” of the laser-material interaction, with its generation mechanism closely tied to material properties and states. Therefore, within the analytical framework of AI-enabled signal processing, treating the audible acoustic signal generated during the LIBS process as a new analytical target and exploring its potential for material defect discrimination represents a promising new avenue for investigation. To date, research on laser-induced audible sound signals has been limited. Most conventional studies have regarded audible sound generated by laser irradiation as noise and discarded it. A few studies, however, have exploited it, such as for detecting package contents or monitoring process sounds to determine the laser beam focal position [18,19]. Research in acoustic testing has shown that variations in the vibration characteristics of metallic materials under mechanical excitation can be detected even within the audible frequency range.
This paper presents the first exploratory investigation of a metal defect detection method based on laser-induced audible sound testing (LAST). Using a LIBS experimental platform, acoustic signals from defective and defect-free metal samples under laser irradiation were acquired. Effective features were extracted from their spectral characteristics and combined with machine-learning algorithms to establish a mapping between acoustic features and the presence or absence of defects in the samples. Experimental results demonstrate that this method achieves a defect detection accuracy of over 94% for metal surfaces. The introduction of laser-induced audible sound technology into the non-destructive testing of metallic materials not only expands the application scope of laser excitation in structural defect identification but also provides a new research direction for enhancing the structural health monitoring and safety assessment capabilities of in-service equipment.
The rest of this paper is organized as follows. Section 2 presents an analysis of the spectral characteristics of acoustic signals from defective and defect-free samples. The analysis confirmed that they have spectral discriminability, with the degree of discrimination varying across frequency bands. Section 3 details the design of a weighted filter bank based on spectral discriminative weights and the extraction of globally weighted cepstral coefficients (GWCCs). Section 4 presents and discusses the experimental results. Finally, the prospects and future directions for this technology are discussed in Section 5.
2. Spectral Discrimination Analysis of Laser-Induced Audible Sound
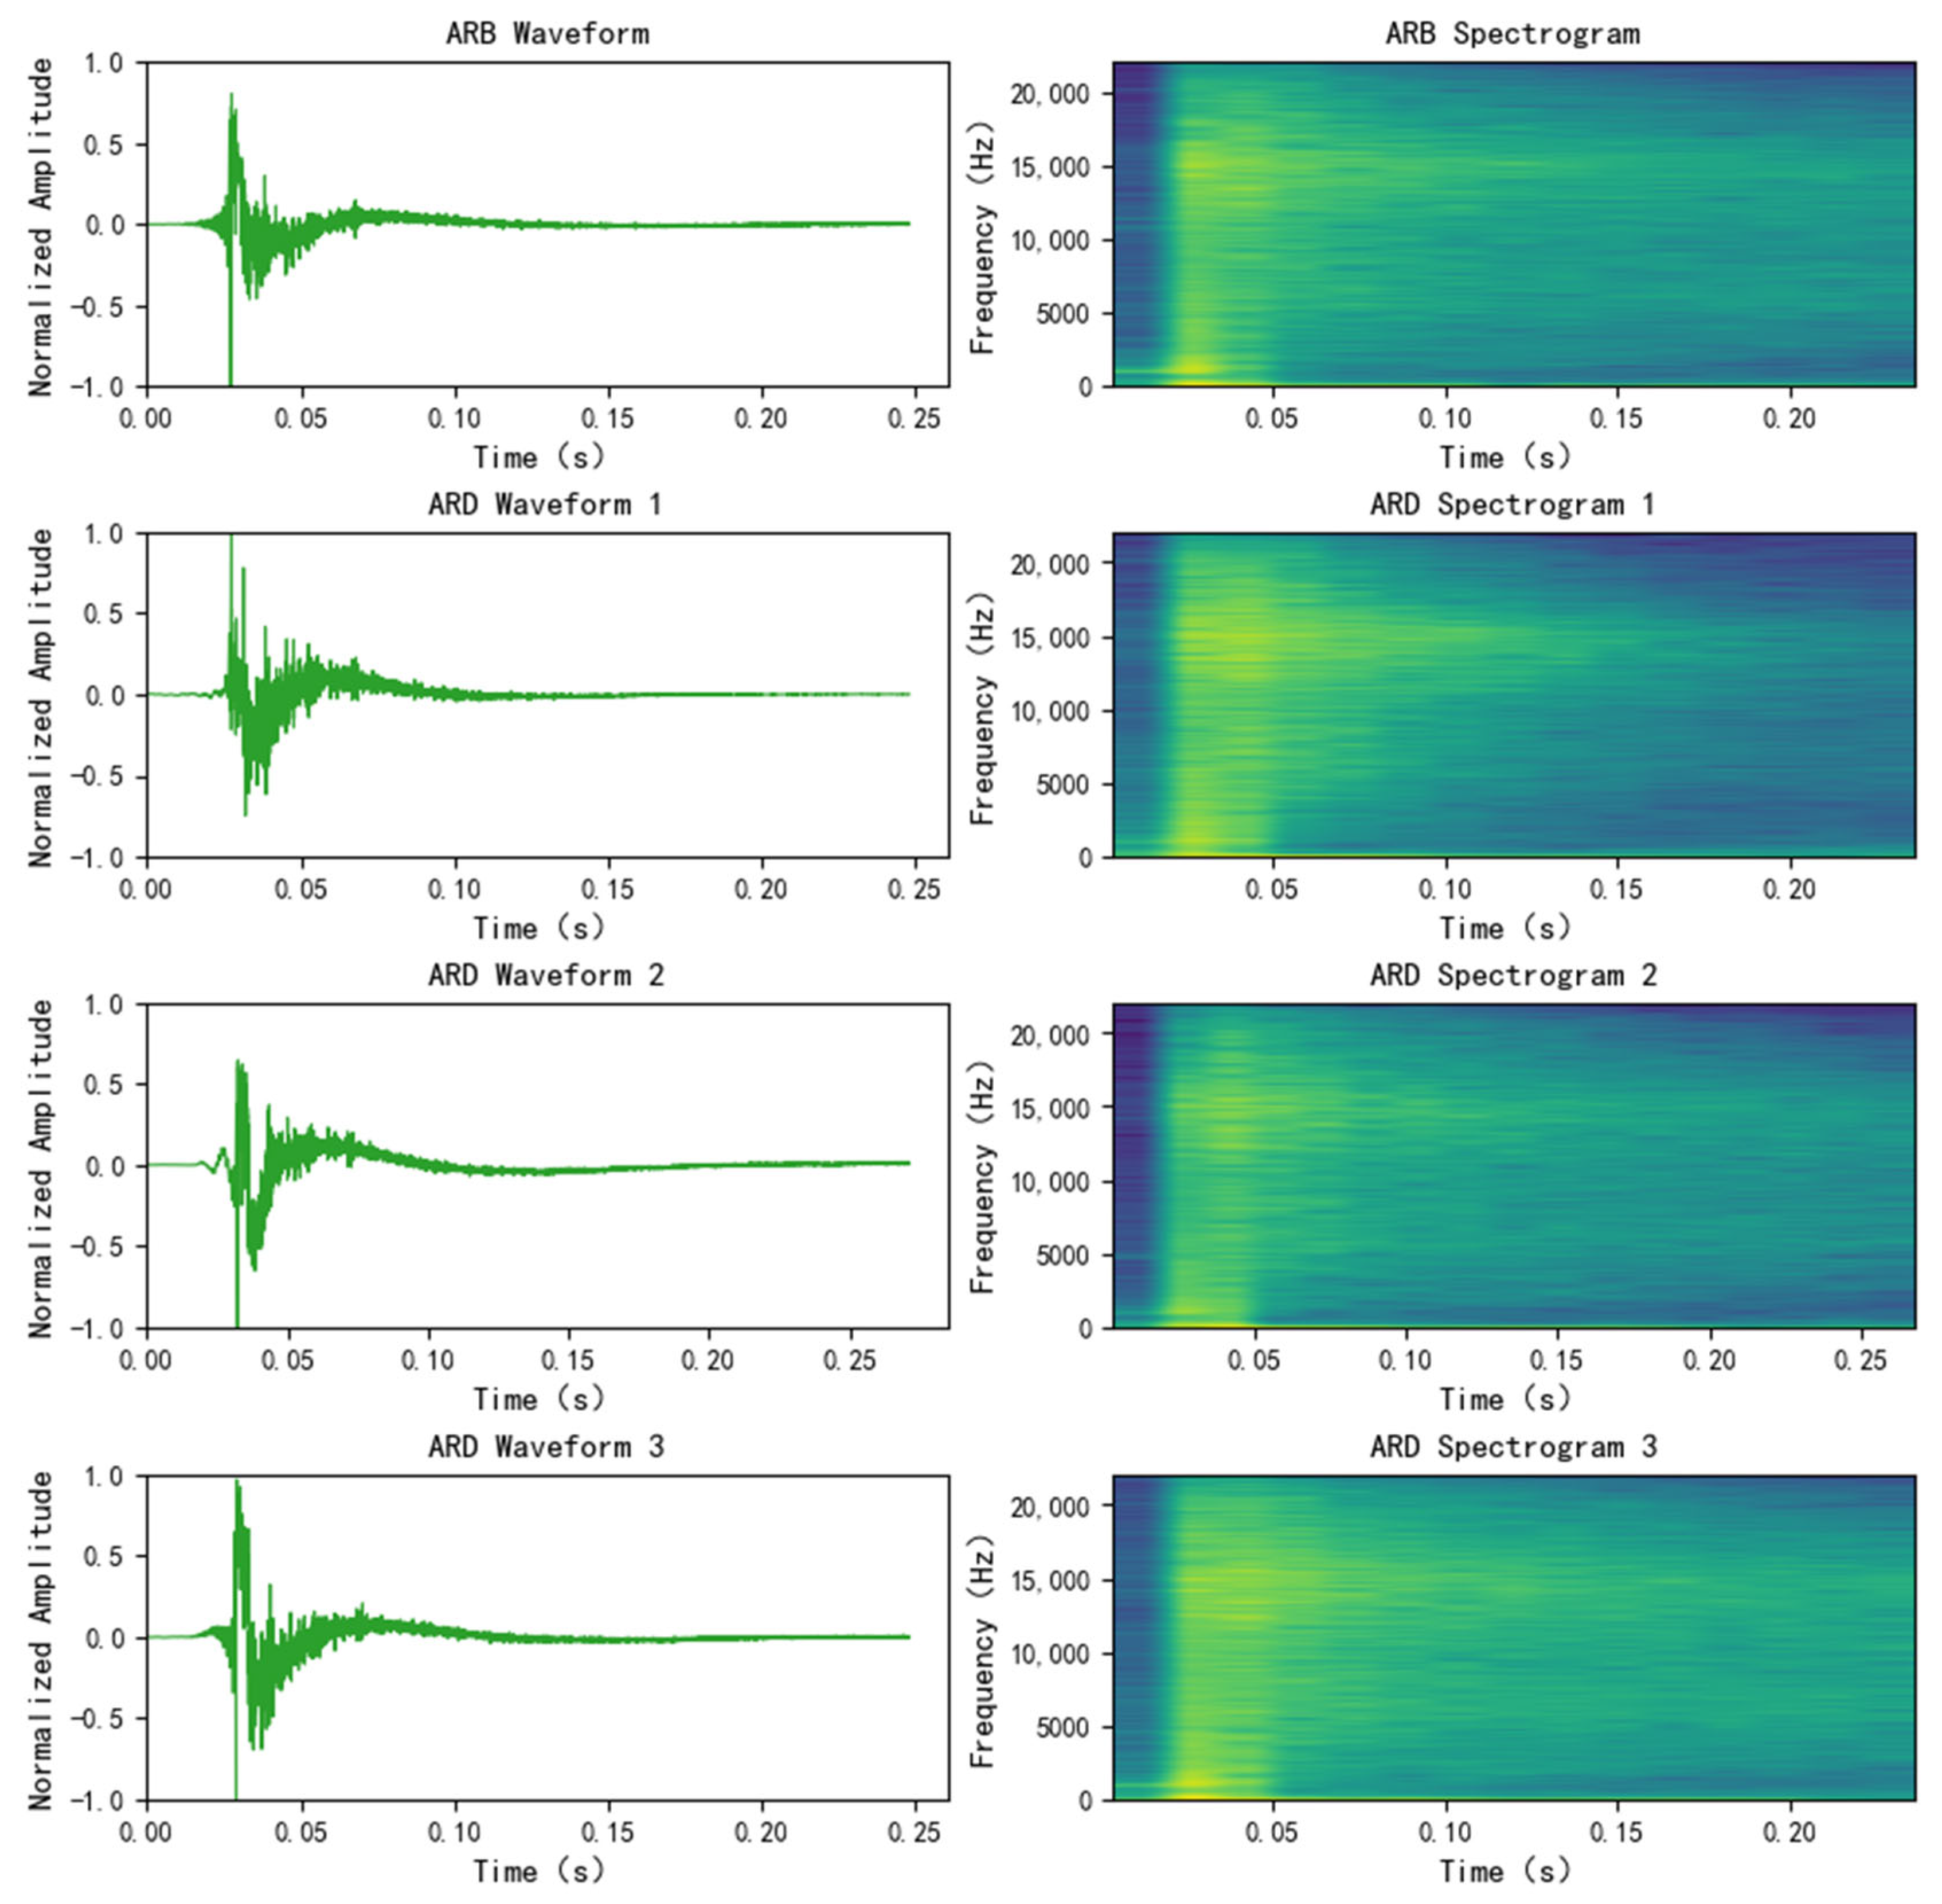
To quantitatively assess the distinguishability between the acoustic response from baseline defect-free metal blocks (ARB) and the acoustic response from defective metal blocks (ARD), acoustic signals from both types of samples were collected using the LIBS experimental platform. Their time-domain waveforms and spectrograms are shown in Figure 1. From the time-domain waveforms, it can be seen that although the two types of acoustic signals have overall similar trends, clear differences exist. The spectrograms also reveal that although the overall frequency distributions are similar, differences appear in frequency intensity and distribution details. These results provide a basis for distinguishing defective from defect-free metal samples using acoustic signals.
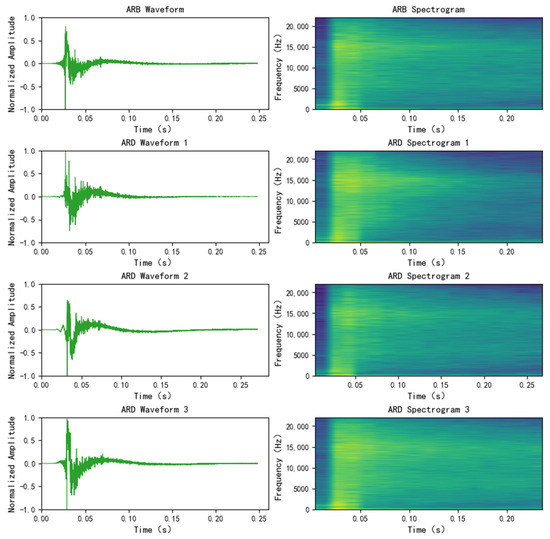
Figure 1.
Time-domain waveforms and spectra of ARB and ARD acoustic signals (length = 5.0 mm, width = 0.2 mm, height = 5.0 mm (ARD 1); length = 5.0 mm, width = 0.6 mm, height = 1.2 mm (ARD 2); length = 3.0 mm, width = 0.6 mm, height = 3.6 mm (ARD 3)).
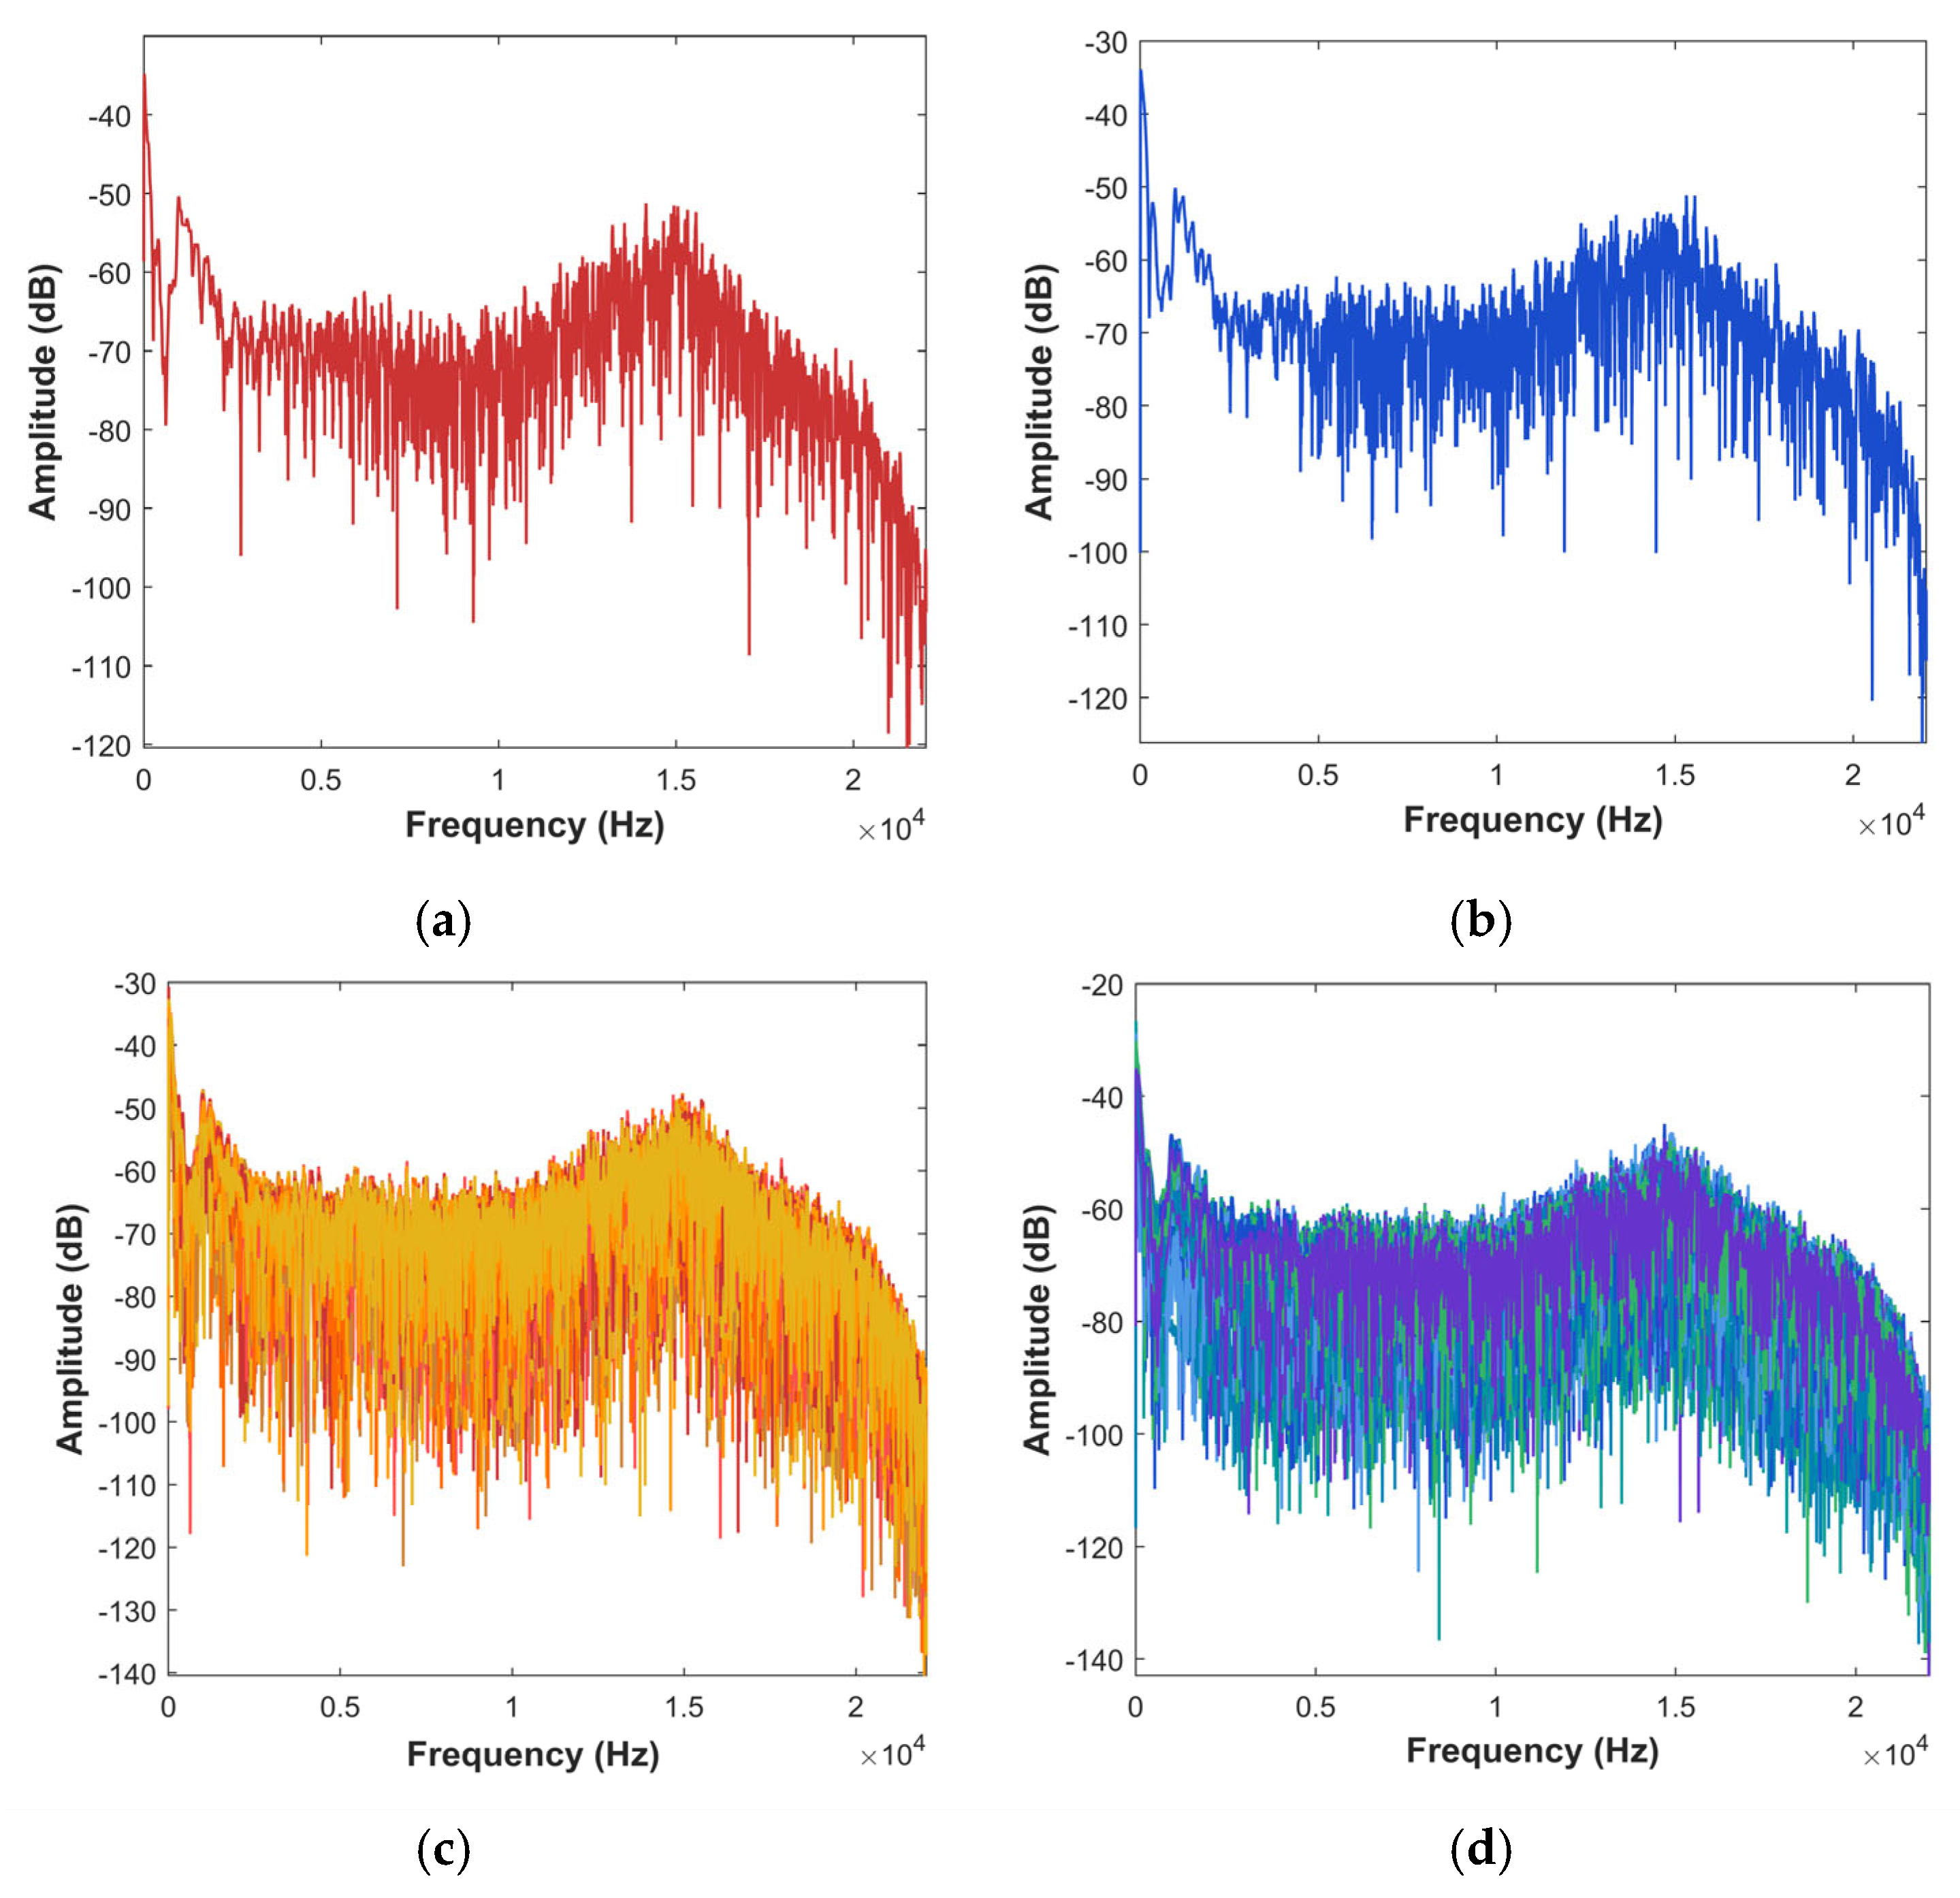
To further analyze the discriminability of the two signal types, Figure 2a and b show the amplitude spectra of a single ARB and ARD signal, respectively, and Figure 2c and d present the superposition of 100 ARB and 100 ARD amplitude spectra. The amplitude spectra within the same class have strong consistency. In contrast, subtle differences in frequency distribution and intensity are present between classes.
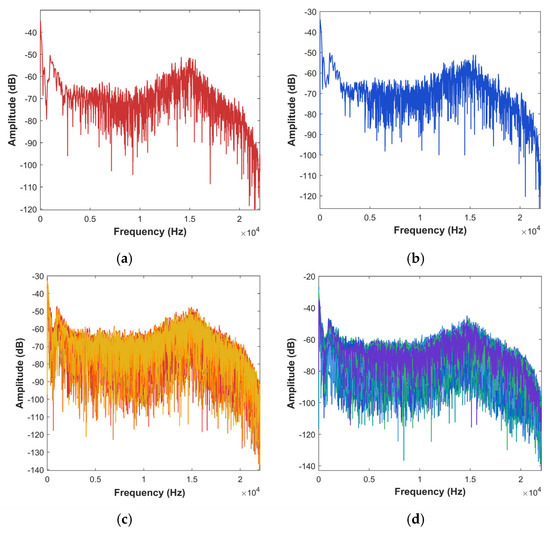
Figure 2.
Comparison of amplitude spectra between ARB and ARD. (a) a single ARB amplitude spectrum. (b) a single ARD amplitude spectrum. (c) 100 ARB amplitude spectra. (d) 100 ARD amplitude spectra.
To quantitatively evaluate the degree of spectral discrimination between the two types of acoustic signals and provide a basis for targeted feature design, the F-ratio index was employed. This index quantifies the ratio between interclass differences and intraclass dispersion in the spectral energy distribution. A larger F-ratio indicates stronger discriminative power at the corresponding frequency point [20].
For the acquired acoustic signals, framing was first applied. For each frame of acoustic signals (where L is frame length), the squared magnitude of the fast Fourier transform (FFT) was computed to obtain the energy spectrum vector of the frame in the frequency domain:
where is the number of points in the frequency domain, and is the energy value at the k-th frequency point. Let the set of sample vectors for ARB be , and that for ARD be , with and , denoting the total number of samples for the two classes, respectively. The mean energy spectrum vectors of ARB and ARD across all samples, denoted as and , respectively, are calculated. The F-ratio at the -th frequency point is then defined as
where measures the between-class difference (squared difference between the means) of ARB and ARD at the -th frequency point; and measure the within-class variance (dispersion of samples around their respective means) of ARB and ARD, respectively. A larger value indicates stronger discriminative ability of the -th frequency point for distinguishing ARB from ARD.
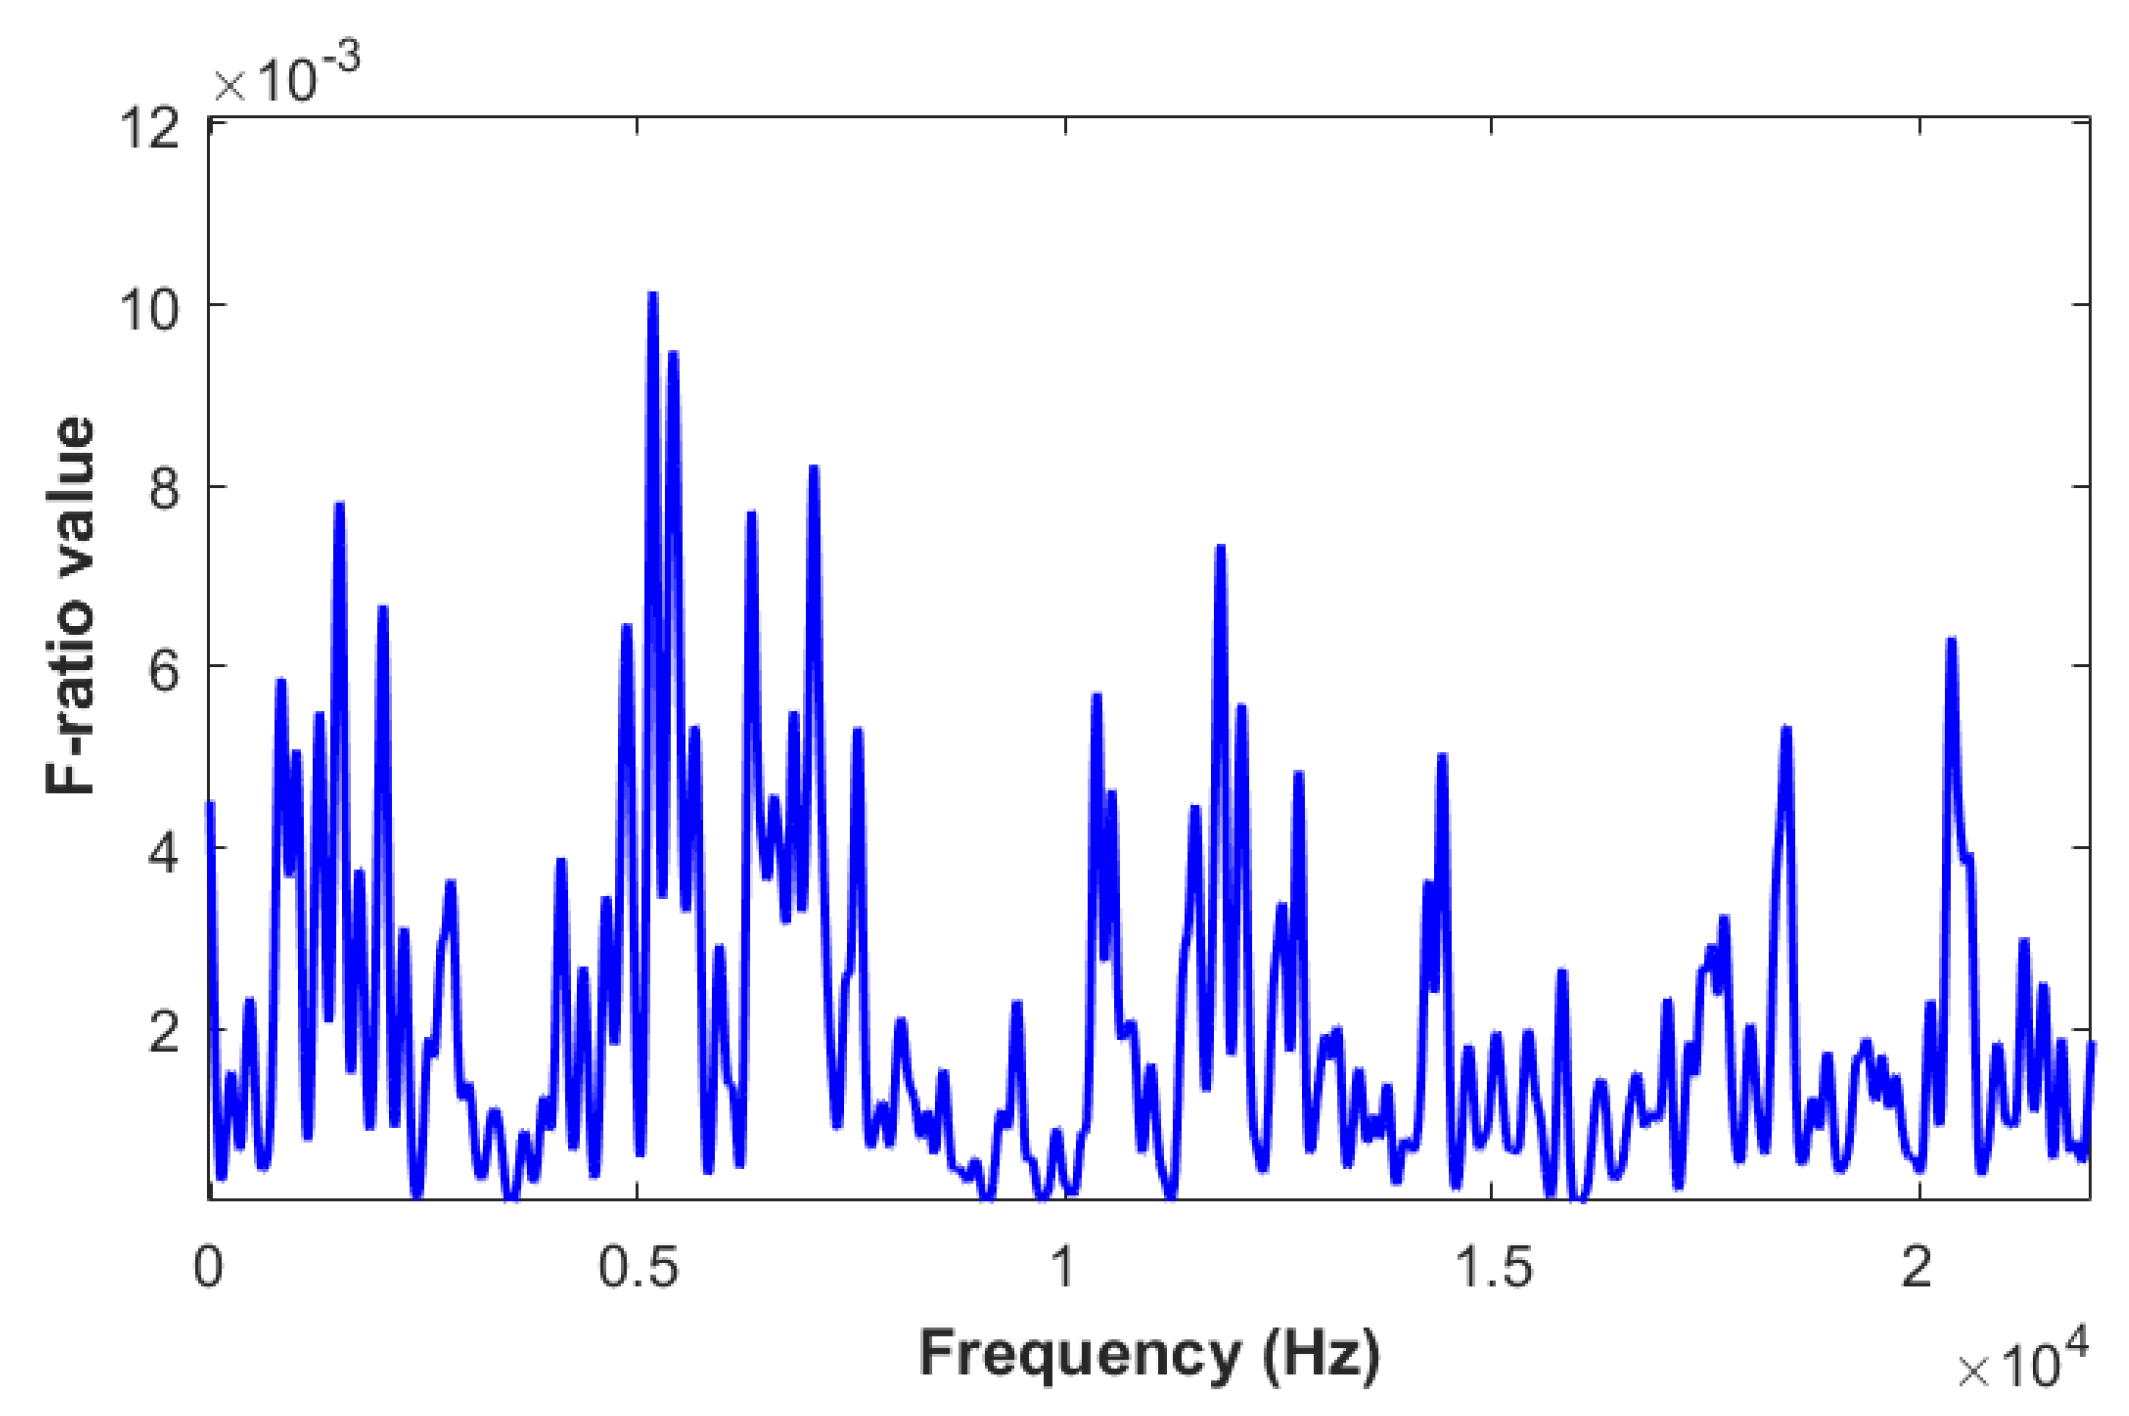
By calculating the values of all frequency points, the F-ratio curves can be obtained, as shown in Figure 3.
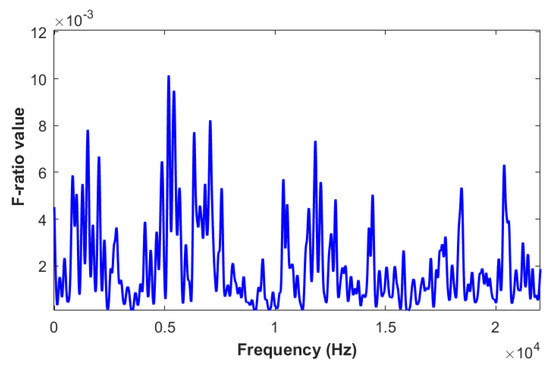
Figure 3.
F-ratio curves of ARB and ARD.
As shown in Figure 3, the F-ratio curves of ARB and ARD have obvious differences across frequency bands. It is notable that, in certain sub-bands in the frequency range, the F-ratio curves show strong consistency with relatively large F-ratio values, indicating that these sub-bands contain rich discriminative information. Therefore, in the feature design stage, it is necessary to emphasize sub-bands with strong discriminative ability, which can enhance the degree of spectral discrimination between the two types of acoustic signals.
3. GWCC Feature Extraction
3.1. Feature Extraction Scheme
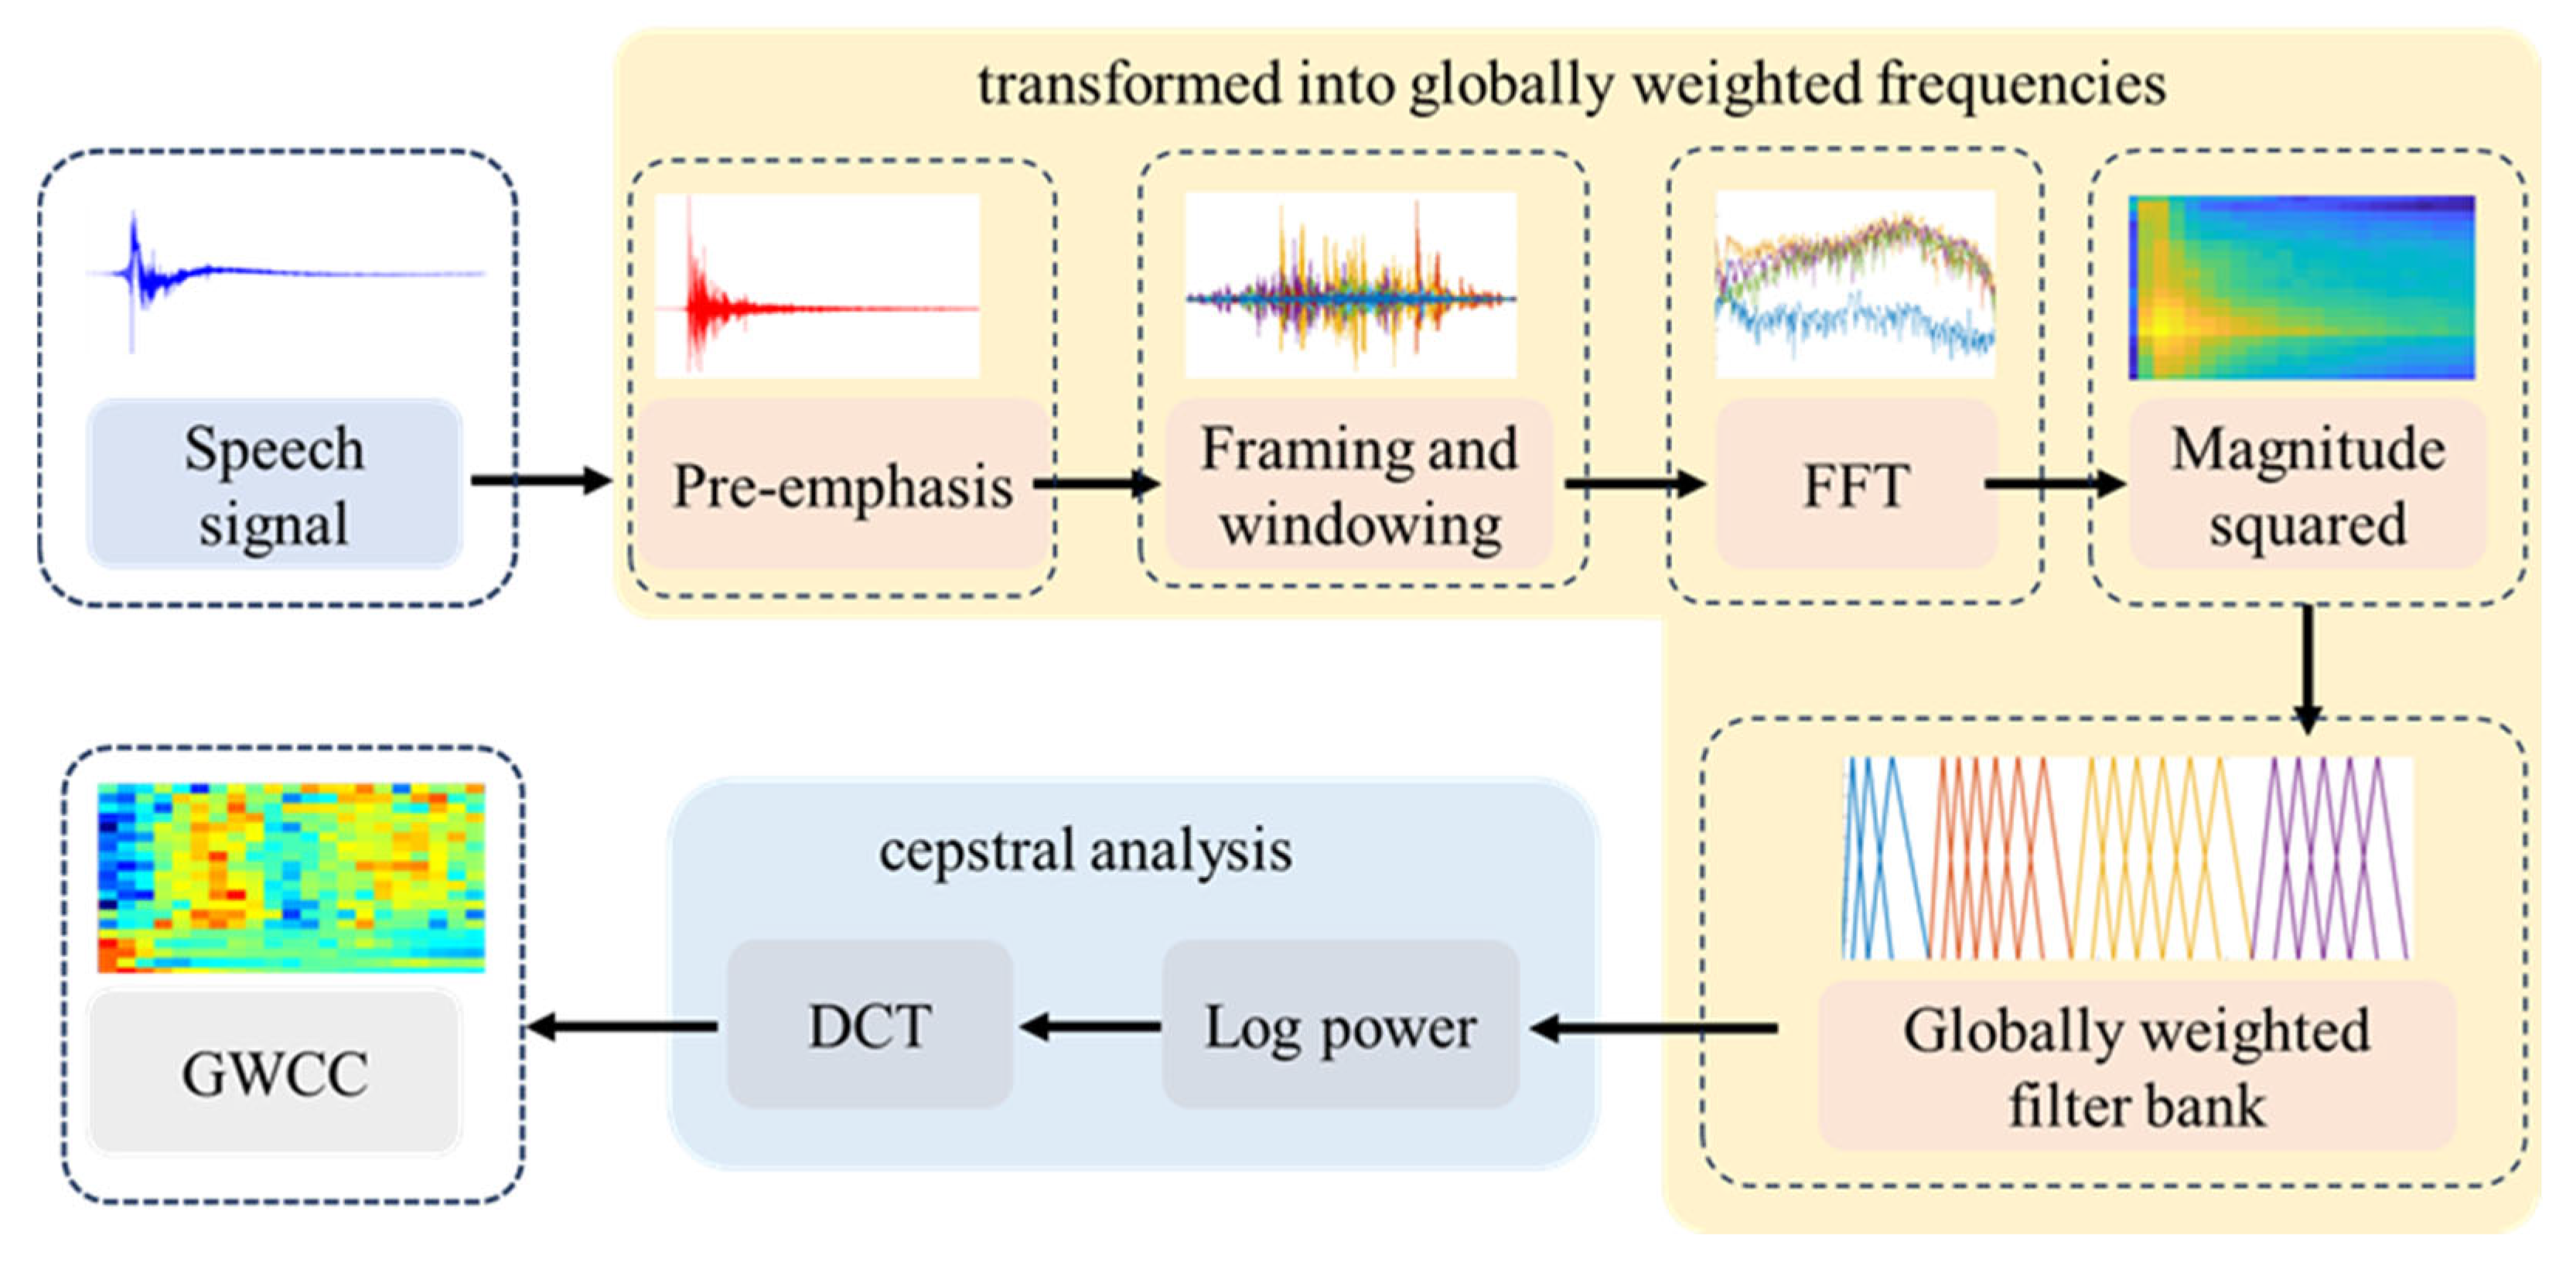
This paper proposes GWCC, a cepstral coefficient feature weighted across the full frequency band. The extraction procedure is illustrated in Figure 4.
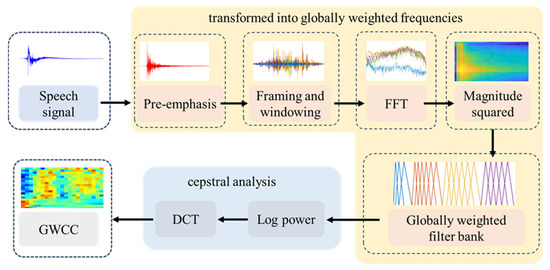
Figure 4.
GWCC feature extraction process.
First, the input acoustic signals are pre-emphasized. In essence, a high-pass filter is applied to enhance the high-frequency components and compensate for the gradual attenuation of energy in the high-frequency band. Its transfer function is expressed as , where is the pre-emphasis coefficient, typically , to ensure effective high-frequency enhancement. Next, framing is performed, in which the continuous acoustic signal is divided into short-time stationary frames with a certain overlap between adjacent frames to preserve temporal continuity. Each frame is windowed prior to FFT to reduce spectral leakage caused by boundary effects. The windowed frames are then transformed into the frequency domain using FFT, and the squared amplitude is computed to obtain the short-time power spectrum.
The next and most critical step is the design of the filter bank. In the proposed method, the entire frequency band is weighted according to the spectral discriminability between ARB and ARD, achieving a finer-grained weighting distribution. This approach retains the overall frequency resolution of the original spectrum while enhancing the discriminability of acoustic signals, as described in Section 3.2. After passing through the filter bank, the power spectrum undergoes logarithmic compression and dimensionality reduction using discrete cosine transform (DCT), ultimately yielding the GWCC features.
3.2. Design of Frequency-Band Weights
To construct frequency-domain discriminative weights for ARB and ARD, an upper-envelope extraction method was developed on the basis of local peak characteristics of the F-ratio curves. The procedure is as follows.
In the aforementioned part 2, we first uniformly trim all audio samples to the same dimension. Subsequently, based on the amplitude spectrum energy of the entire dataset, we statistically compute the F-ratio values for both defective and non-defective signals at each frequency point. This yields an F-ratio curve reflecting the discrimination capability across the entire dataset. The final weighting curve used for band allocation is generated by applying envelope extraction and normalization to this uniformly computed F-ratio curve. Based on this F-ratio curve (where denotes the number of frequency-domain points), the upper envelope is extracted using a sliding-window maximum method:
where is the window radius, and boundary points are processed using mirror padding. By capturing the maximum discriminability values within local sub-bands, this operation effectively suppresses random fluctuations while preserving the main trend of the curve. The resulting envelope vector is then normalized to its maximum value:
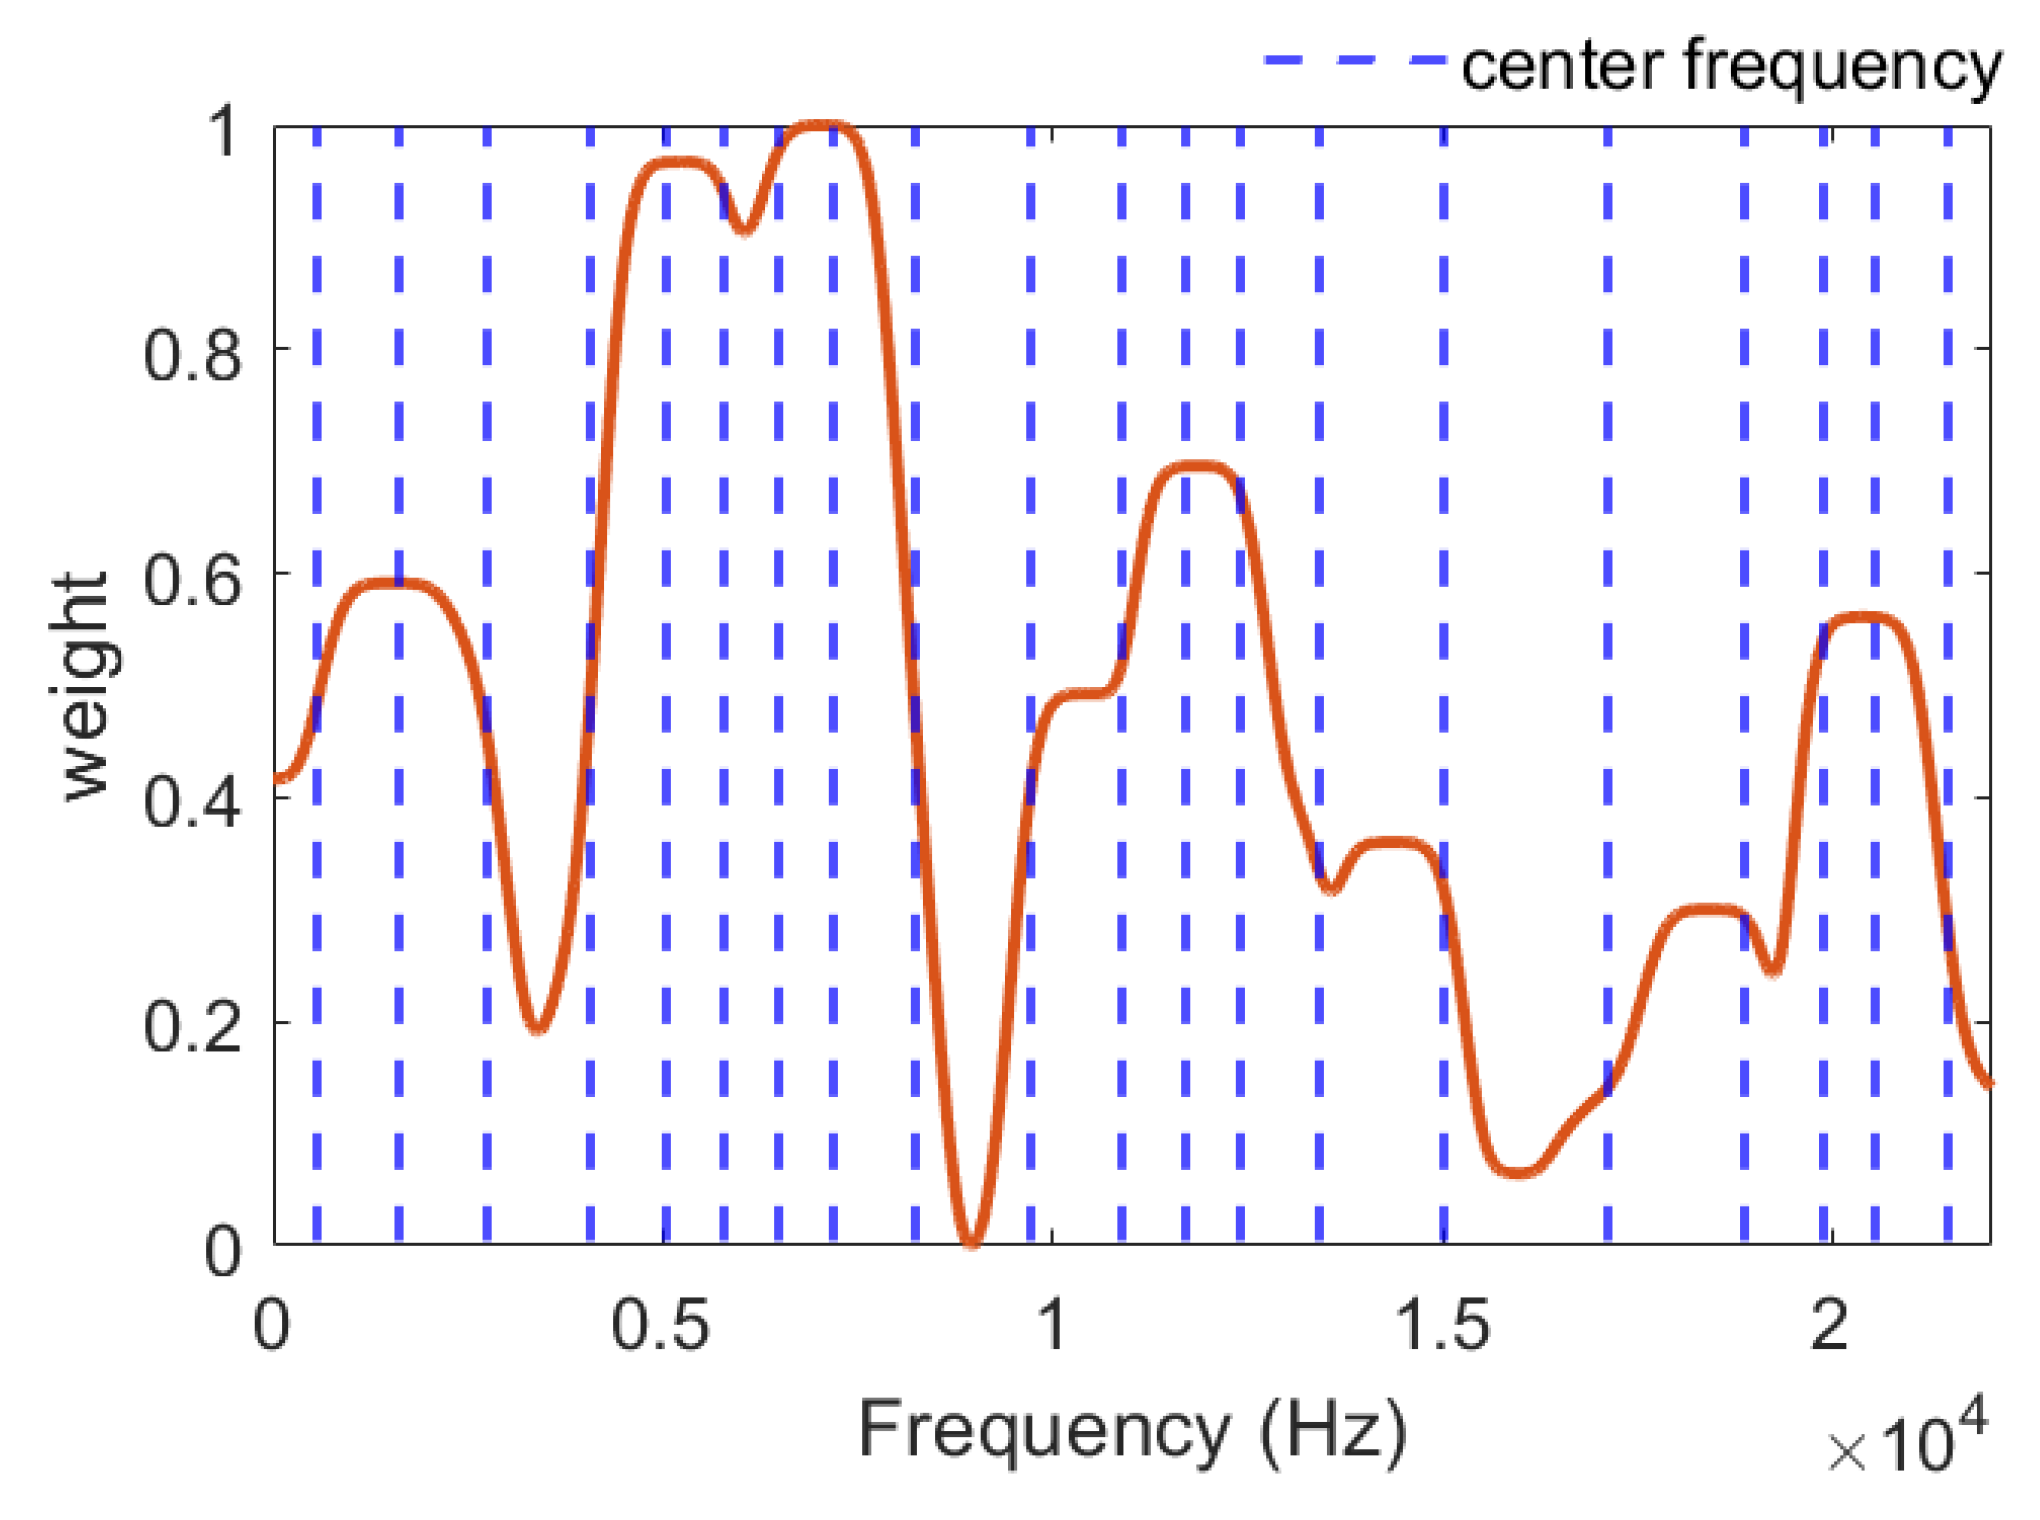
The final weights are thus obtained, which directly reflect the relative discriminability strength at each frequency point. Based on these weight curves, a cumulative weighted energy function is constructed, where Δf is the frequency resolution. Using this function, the total energy is equally divided into segments. The band boundaries of each filter are then determined using the inverse mapping of the cumulative energy function:
This method automatically yields a denser distribution of filters in high-weighted frequency bands. The resulting weighting curves and the distribution of filter center frequencies are shown in Figure 5.
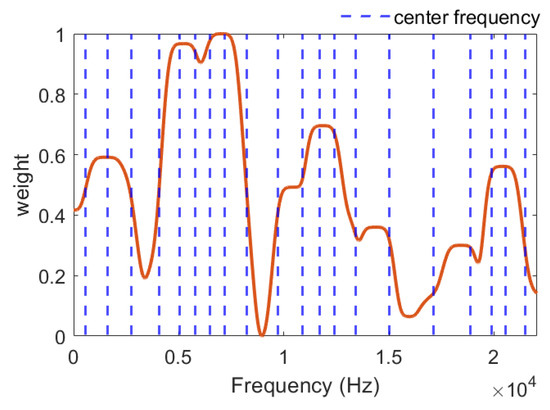
Figure 5.
Filter center-frequency distribution based on full-band weighting curves.
As shown in Figure 5, the center frequencies of the filter bank across the full band are allocated according to the weighting curve and used to extract highly discriminative regions between ARB and ARD. In higher-weight bands (e.g., portions of the mid- and low-frequency ranges), the filter center frequencies are more densely distributed, making it possible to capture more informative components. In contrast, in lower-weight bands, the filter center frequencies are distributed more sparsely, indicating weaker contributions to the overall features.
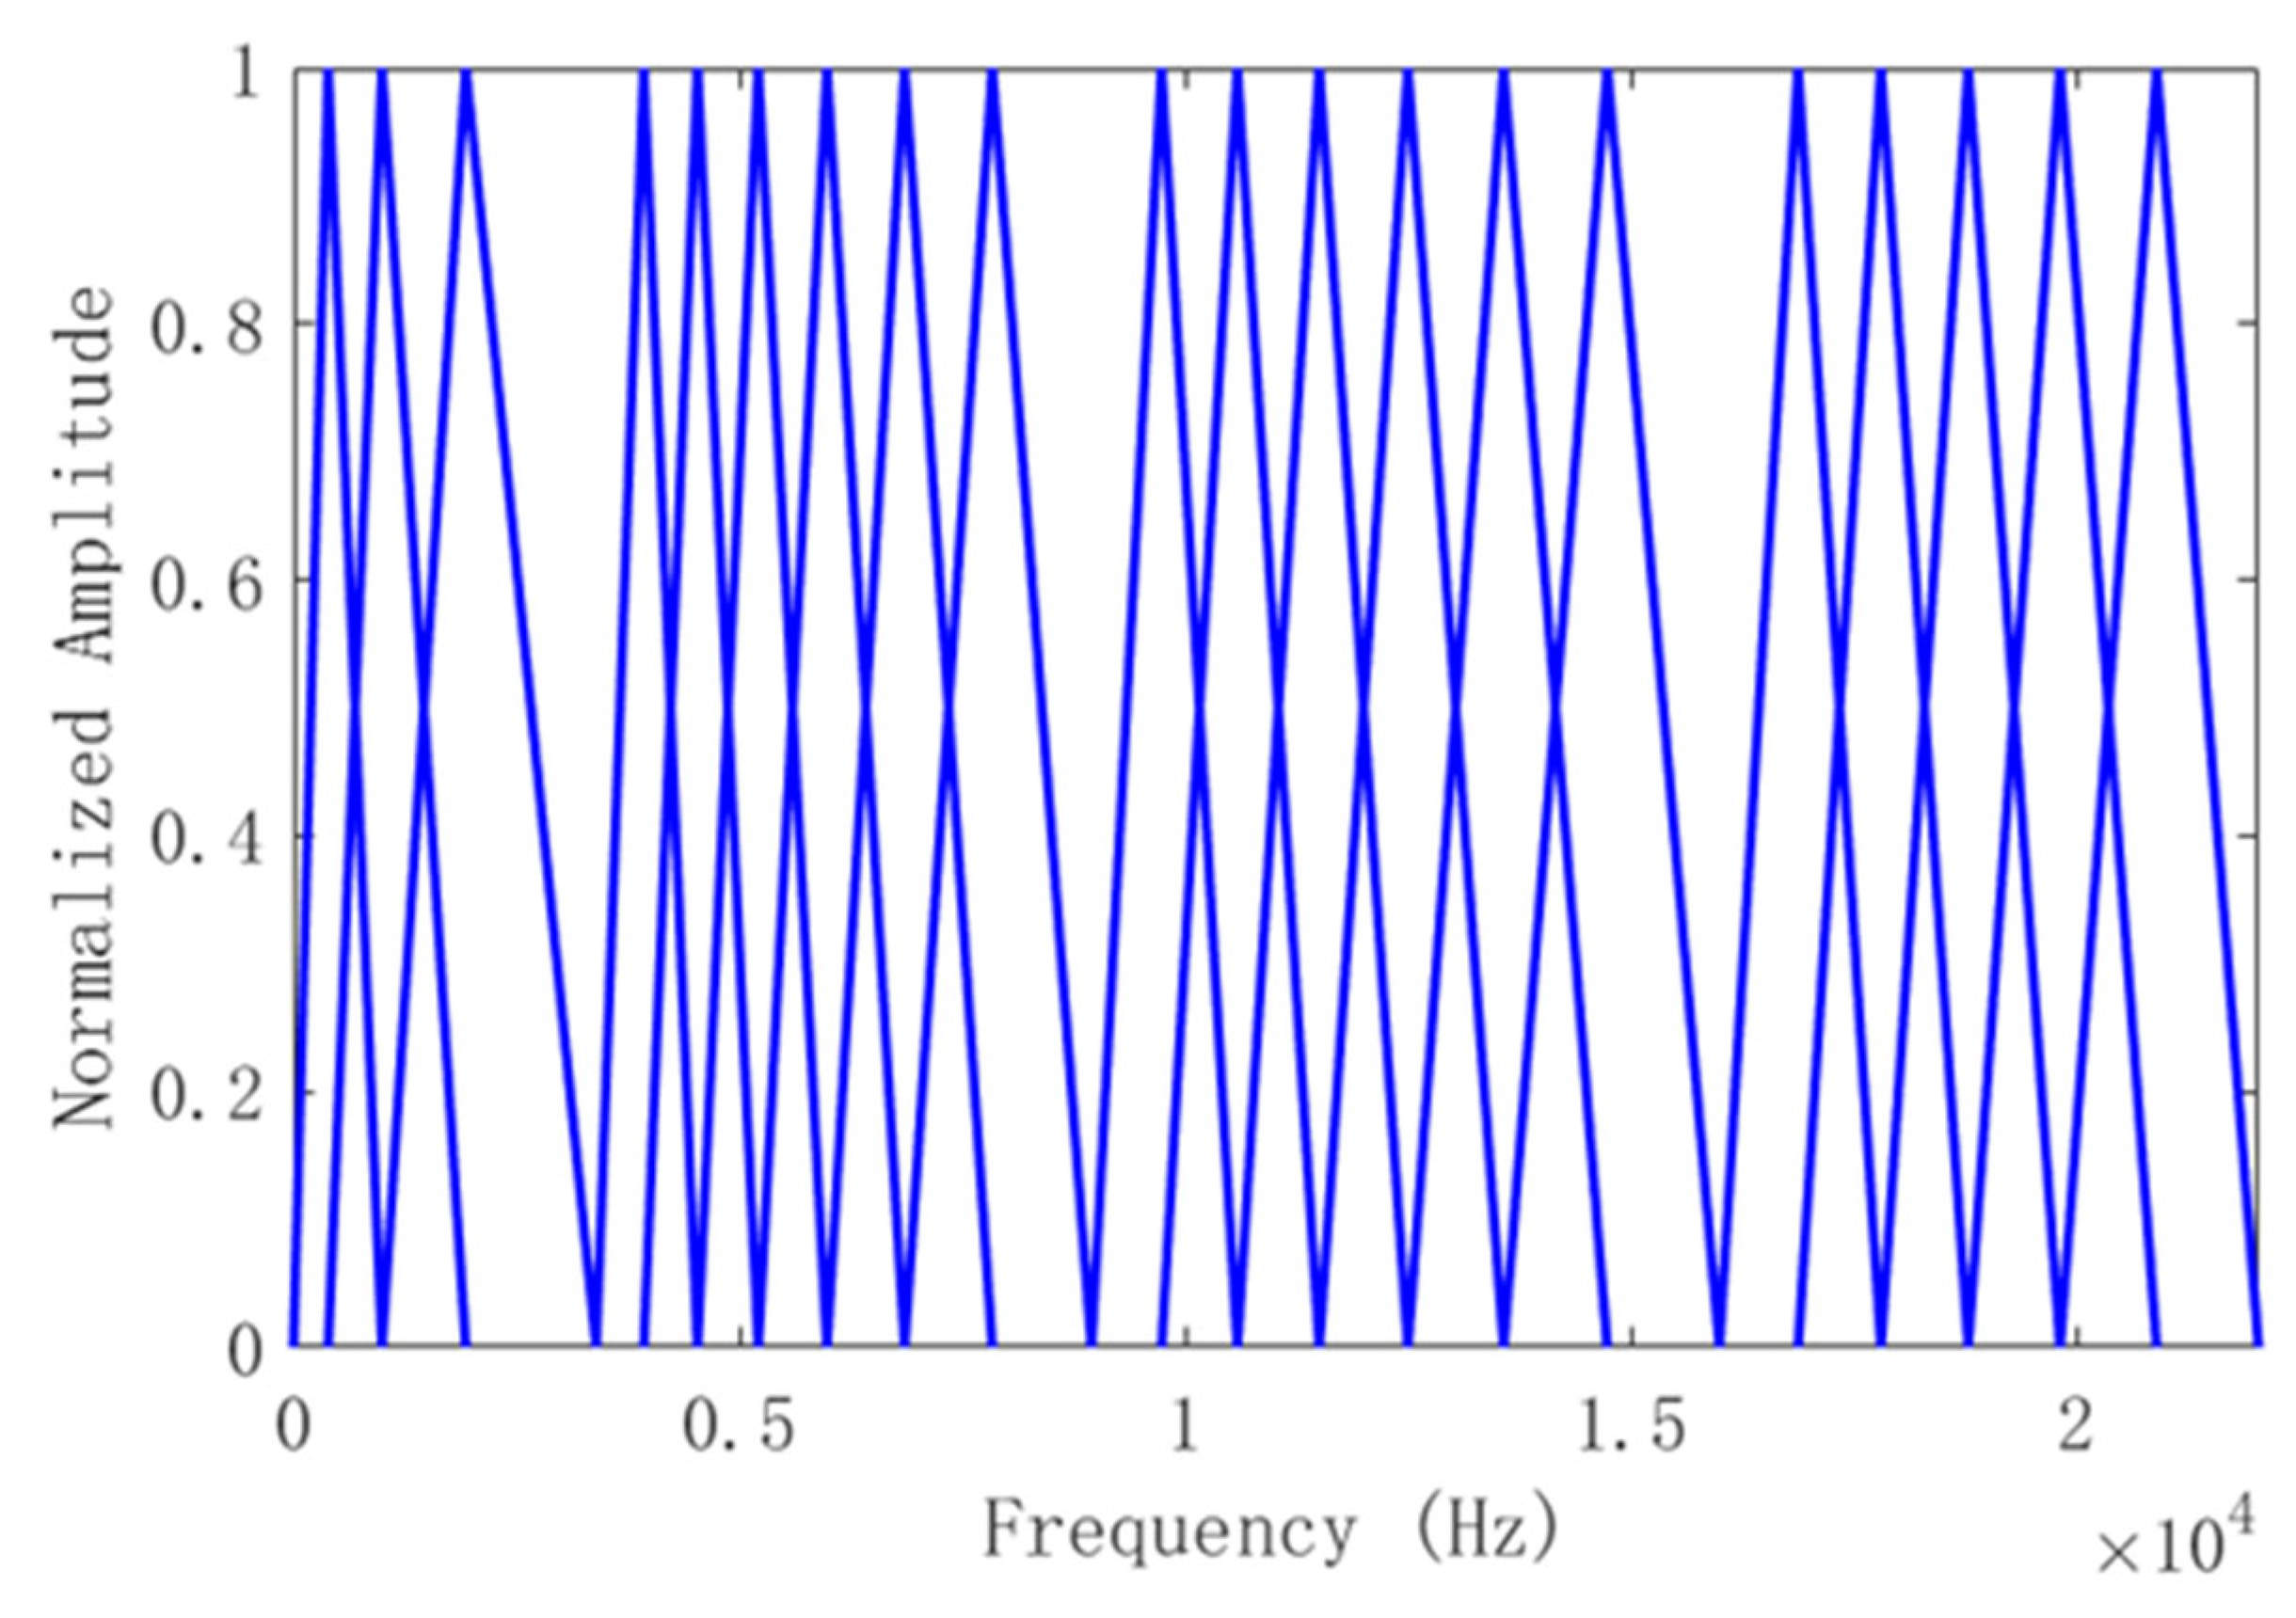
From the calculated center frequencies, the proposed method adopts triangular filters following the filter bank design of Mel frequency cepstral coefficients (MFCC) [21,22,23]. Such filters concentrate energy within the target band while ensuring smooth linear transitions between adjacent bands, thereby avoiding inter-band spectral leakage due to aliasing. This design achieves a desirable balance between computational efficiency and frequency-band discriminability. The corresponding response function is
where and .
The final distribution of the triangular filters, based on the center frequencies, is illustrated in Figure 6.
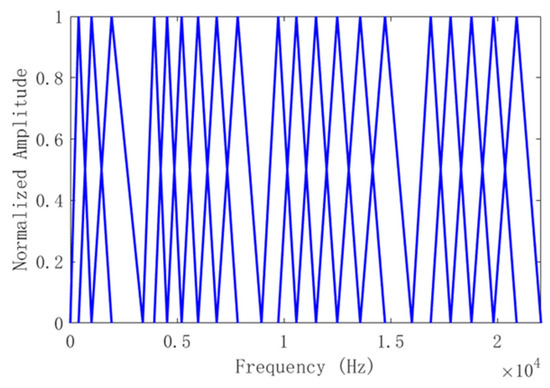
Figure 6.
Distribution of filter bank based on the full-band weighting curve.
As shown in Figure 6, the proposed globally weighted filter bank, by employing a non-uniform triangular bandpass design, achieves dense focusing in frequency regions with high discriminability. This adaptive sub-band partitioning mechanism effectively strengthens the intrinsic feature extraction capability of defective acoustic responses, while suppressing redundant information in low-weight bands. The nonlinear distribution characteristics of the filter bank form a synergistic mapping with the acoustic modulation behavior of metal defects, laying the foundation for frequency-domain optimizations of GWCC feature extraction.
4. Experiment and Analysis
4.1. Experimental Setup
4.1.1. Laser–Acoustic Inspection System
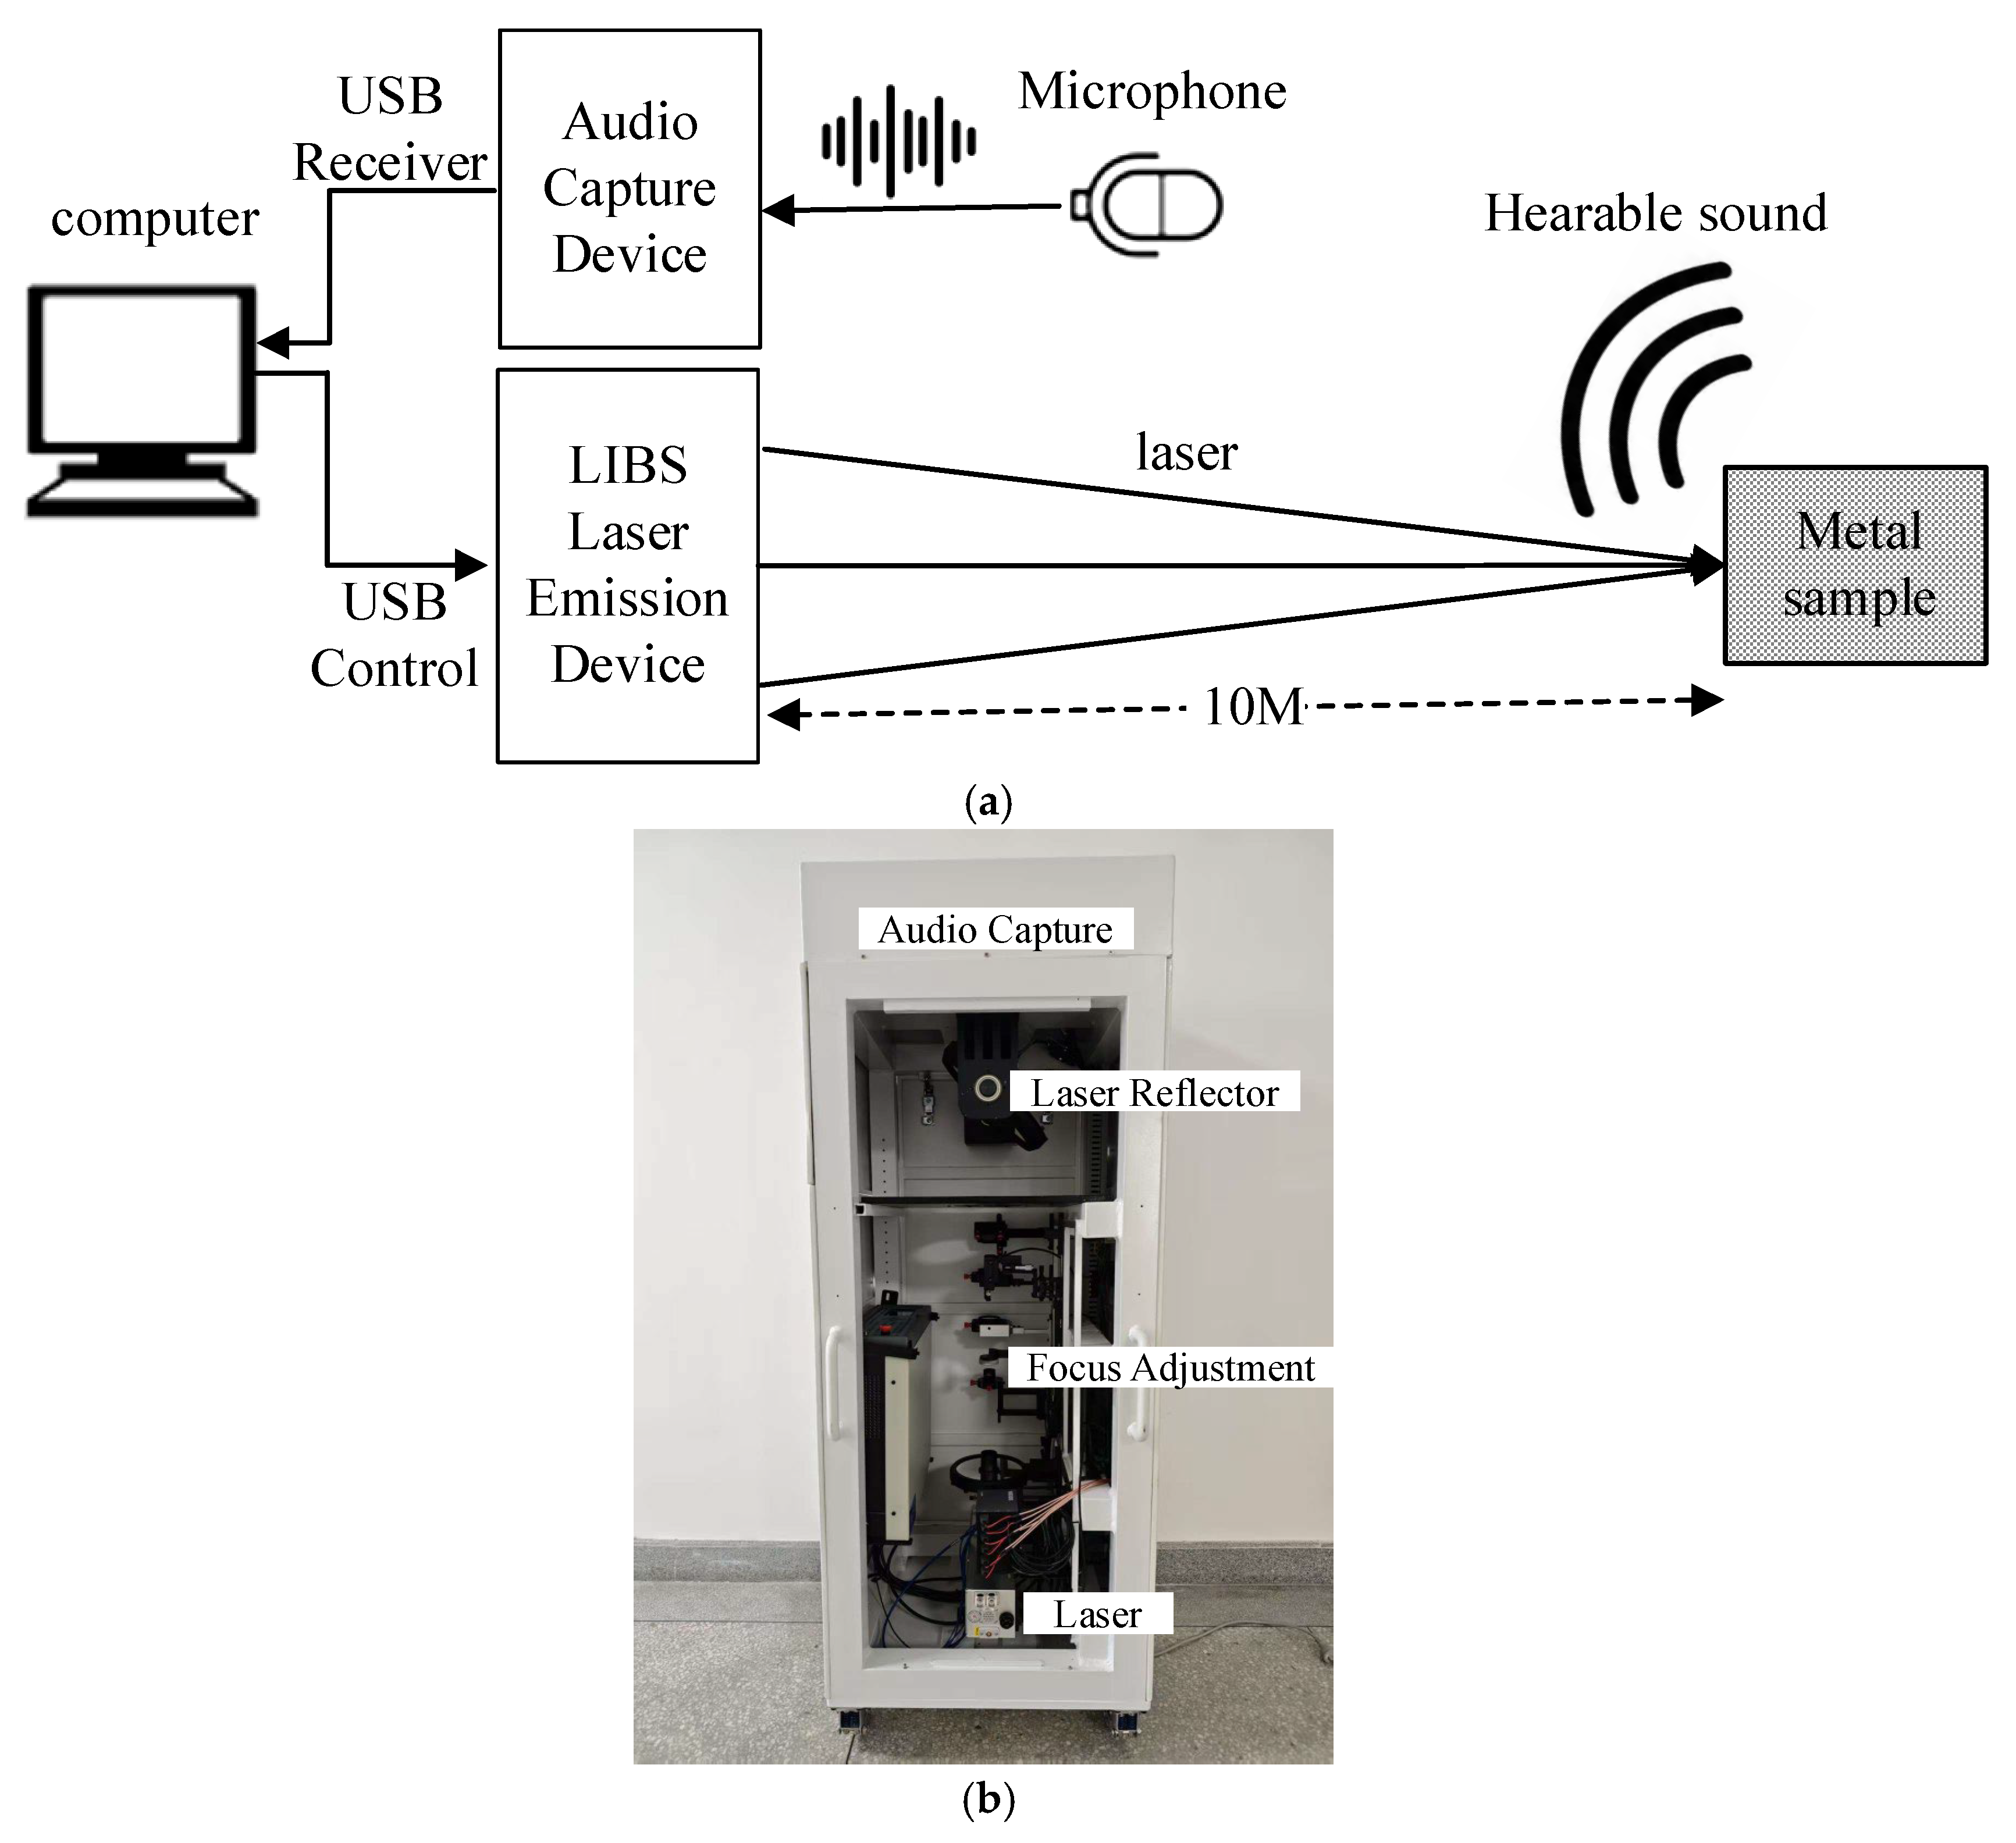
The laser–acoustic inspection experimental system is shown in Figure 7. It was based on a telescopic remote LIBS platform, which directs laser irradiation onto metal samples, while the acoustic signals generated from the samples are acquired. Measurements should be conducted in a quiet location; no special acoustic environment is required. The laser source was a DAWA200 pulsed Nd:YAG laser with a wavelength of 1064 nm, a single-pulse energy of 200 mJ, and a focused spot diameter smaller than 6 mm. The laser repetition rate was set to 1 Hz. The system was equipped with an audio acquisition device to capture audible sounds, with a sampling rate of 44.1 kHz, 16-bit quantization, and dual-channel recording. For each detection point, 10 repeated acquisitions were performed for statistical analysis.
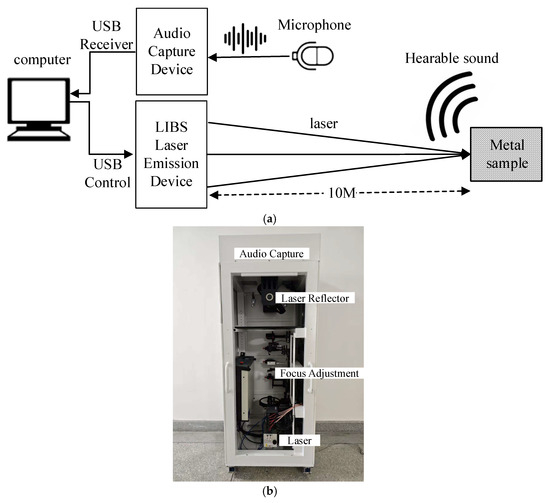
Figure 7.
Structure of the experimental system. (a) Schematic diagram of the experimental system. (b) LIBS laser emission module.
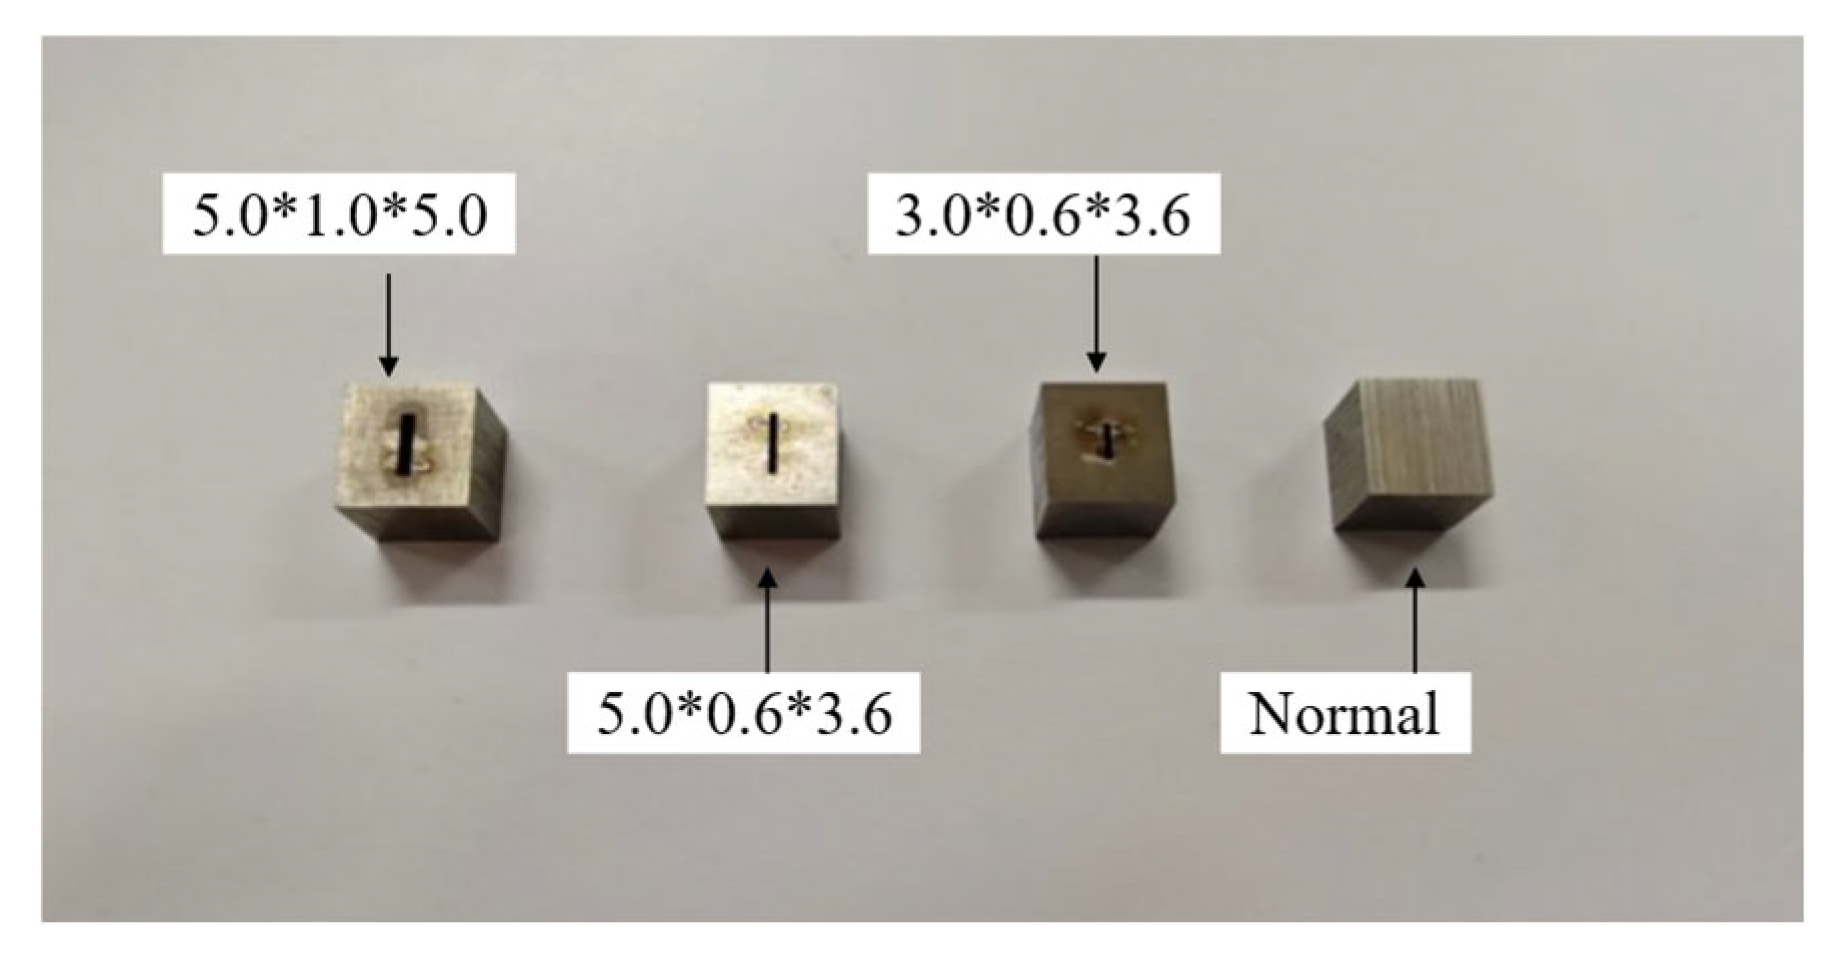
In the experiment, four martensitic stainless-steel cubes with different defect severities (model X4CRNIMO16-5-1, supplied by Yizhi Mould Processing Factory, Suzhou City, Jiangsu Province, China) were used as test samples, as shown in Figure 8. The martensitic stainless-steel specimens used in this study were all sourced from actual operating conditions within nuclear power plants (installed during one major overhaul and retrieved during the subsequent one), ensuring their material state perfectly matches real-world structures. We designed the shape of the defect to mimic the situation observed in catastrophic events at nuclear power plants. Blind-hole defects were fabricated on the surface of the cubes using precision electrical discharge machining. The actual diameters of the holes were measured with a white-light interferometer (measurement error < 2%). All samples were ultrasonically cleaned with acetone to remove machining residues. According to the length, width, and depth of the blind-hole defect region, the defective samples were classified into three classes, with a total of 15 specimens. The numbering and dimensions of the defective metal samples are listed in Table 1.
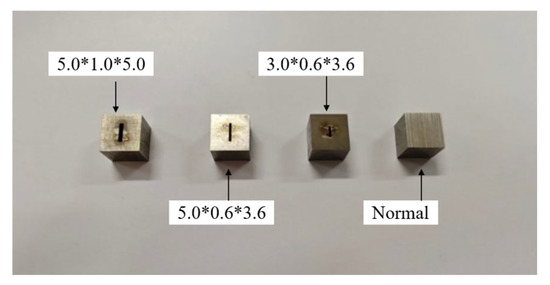
Figure 8.
Examples of martensitic stainless-steel cubes with blind-hole defects.

Table 1.
Numbering and dimensions of defective metal samples.
4.1.2. Experimental Dataset
Support vector machine (SVM) was employed as the learning model for defect recognition in the metal blocks. To this end, an acoustic signal feature dataset was constructed, containing both ARB and ARD. The sampling rate and bit depth of all acoustic signals were kept consistent, and the audio data were stored in WAV format to ensure uniform parameters during feature extraction, aiming to avoid interference from format differences. In the end, a dataset containing 200 ARB signals and 300 ARD signals was obtained from multiple defect-free and defective samples.
In terms of data structure, the entire dataset was split into training and testing sets at a 4:1 ratio. Specifically, the training set contained 160 ARB and 240 ARD signals, and the test set contained 40 ARB and 60 ARD signals, randomly selected. This split ensured the sufficiency of training samples while providing a sound basis for evaluating the generalization capability of the model.
4.2. Experimental Results and Analysis
4.2.1. Feature Visualization Analysis
To verify the advantages of the proposed GWCC in distinguishing between the two types of acoustic signals (ARB and ARD), the GWCC features were compared with five commonly used acoustic features: linear frequency cepstral coefficients (LFCC), MFCC, inverted MFCC (IMFCC), spectral centroid frequency coefficients (SCFC), and all-pole group delay function (APGDF). LFCC are derived from a linearly scaled filter bank, offering finer resolution in higher frequencies; MFCC mimic the human auditory perception by applying a mel-scale filter bank, emphasizing lower frequencies; IMFCC invert the mel-scale filter bank to enhance higher frequency contributions; SCFC capture the spectral centroid, reflecting the center of mass of the spectrum and related to brightness of the sound; APGDF, based on an all-pole model, extracts phase-related information from the group delay spectrum, beneficial in capturing resonant structures.
By evaluating these representative characteristics, GWCC’s unique capability in spectrum discrimination is demonstrated.
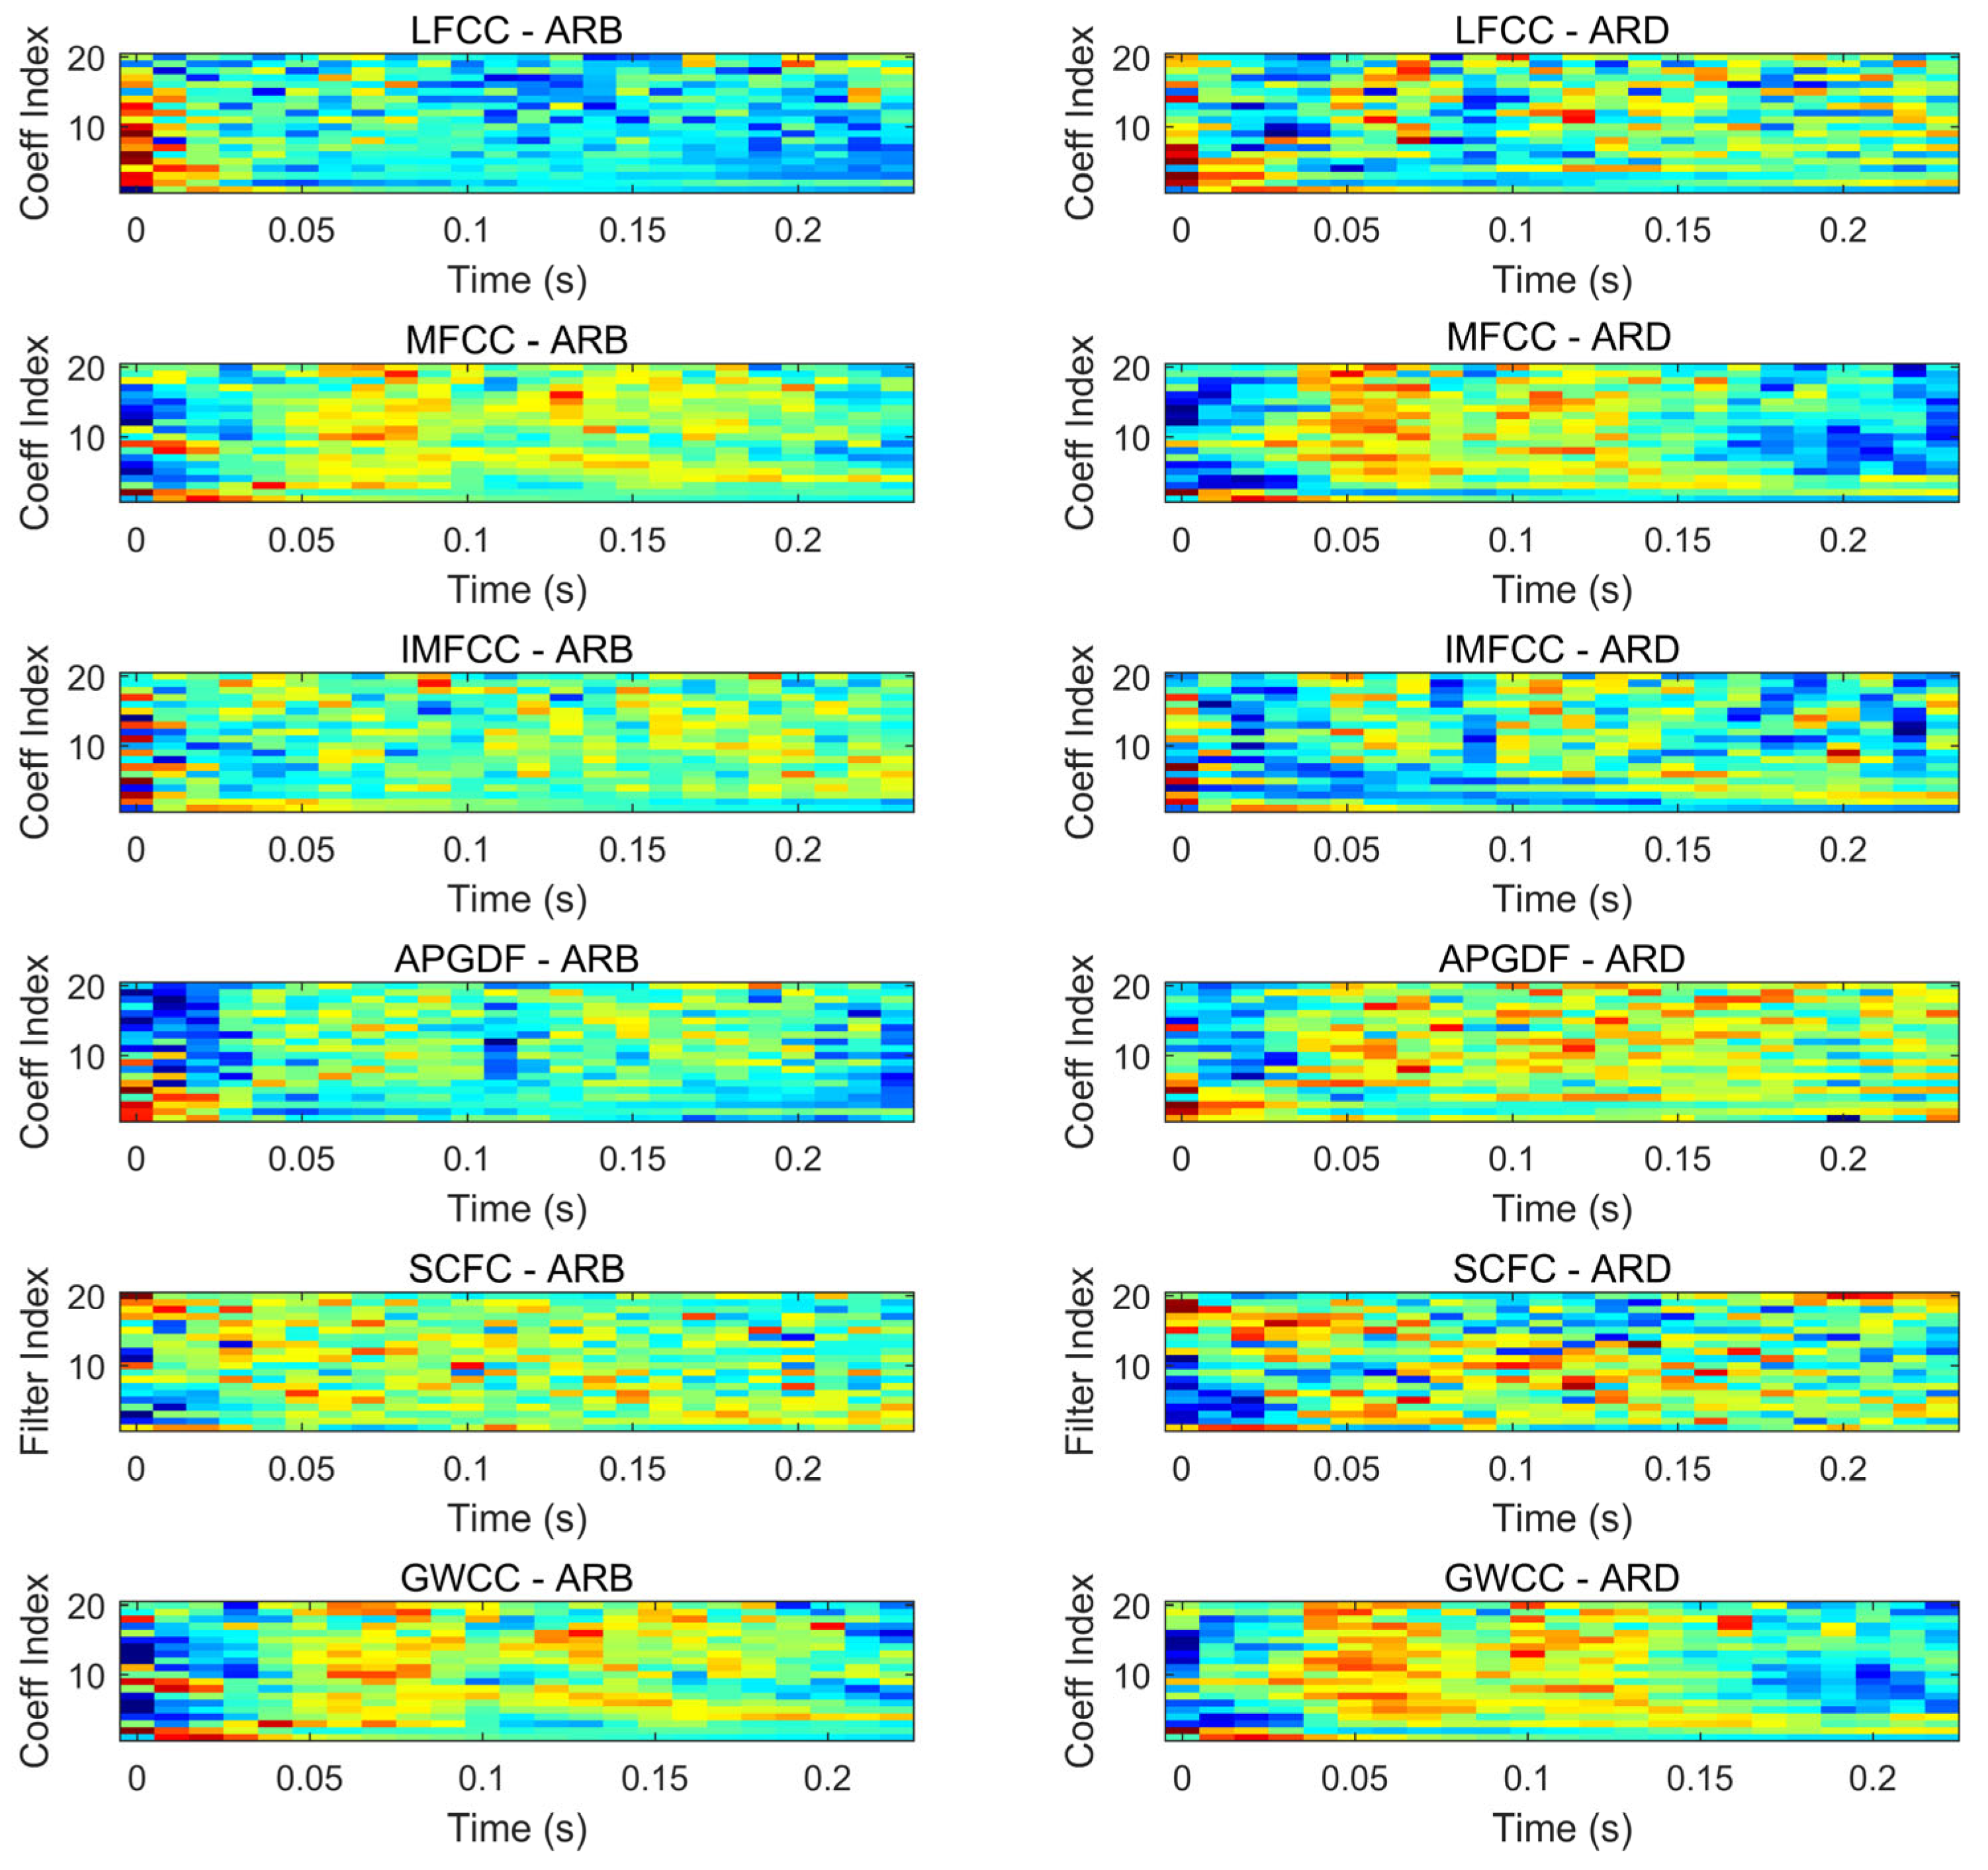
Figure 9 presents visualizations of the six types of features for ARB and ARD, shown as two-dimensional distributions in the time domain and coefficient dimension. In this way, the time–frequency patterns captured by different features can be observed more intuitively, making it possible to directly compare the feature representations between ARB and ARD.
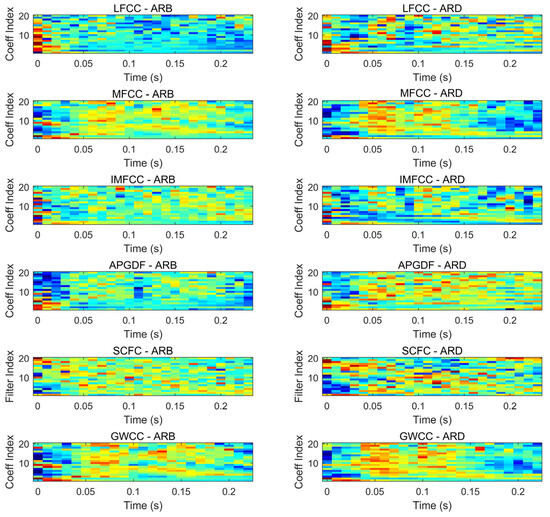
Figure 9.
Visualization of different features in ARB and ARD signals.
As shown in Figure 9, the feature visualizations of ARB and ARD differed across feature types. The difference was especially prominent in the GWCC features: ARB had a relatively smooth overall structure with more uniform feature distribution, whereas ARD showed more dynamic variations along the time axis. Comparing Figure 9 with Figure 1 shows that the degree of spectral discrimination between ARB and ARD was significantly enhanced after feature extraction. This result confirms the effectiveness of designing features from the perspective of spectral discriminability.
4.2.2. Feature Performance Comparison
To evaluate the classification performance and stability of different acoustic features, SVM classifiers were applied with systematic five-fold cross-validation experiments on the dataset. The experiment was conducted on an NVIDIA GeForce RTX 4060 graphics card, measuring a feature extraction time of approximately 50 milliseconds per sample. The model achieved a single classification latency below 5 milliseconds, demonstrating excellent computational efficiency. The dataset was randomly partitioned into five equally sized subsets. In each iteration, four subsets were used as the training set to optimize the SVM parameters (penalty coefficient C and radial basis function kernel parameter γ), and the remaining subset was used for testing. After five iterations, the average of the test results was taken as the final performance metric. This approach effectively reduced the dependence of model evaluation on a specific data split and improved the reliability of the results. Table 2 summarizes the optimal SVM parameter settings, the corresponding average recognition rates, and their standard deviations obtained for each feature through five-fold cross-validation.

Table 2.
Average recognition rate and standard deviation of classification based on each feature (five-fold cross-validation).
In the five-fold cross-validation experiments with the SVM model, obvious performance differences were observed across features under their respective optimal parameter configurations. Features among LFCC (optimal parameters:{C:10, γ:1}), MFCC ({C:100, γ:0.1}), IMFCC ({C:1, γ:0.1}), SCFC ({C:1, γ:0.1}), APGDF ({C:100, γ:1}), and GWCC had markedly different recognition rates within the same framework, indicating that the choice of feature extraction method plays a key role in acoustic signal classification. The conventional LFCC and MFCC features performed robustly, achieving mean recognition rates of 83.2% and 85.5%, respectively. By contrast, IMFCC, SCFC, and APGDF performed relatively poorly, all with mean recognition rates below 80%. It is notable that the GWCC features proposed in this study achieved peak performance with parameter settings {C:100, γ:0.1}, yielding a mean recognition rate as high as 94.0%. This result significantly surpassed the performance of all other features. Moreover, the small standard deviation associated with GWCC indicates that it has exceptional stability throughout the five-fold cross-validation process, and the least sensitivity to the randomness of data partitioning. These results provide strong evidence that GWCC features offer a substantial advantage in distinguishing between ARB and ARD.
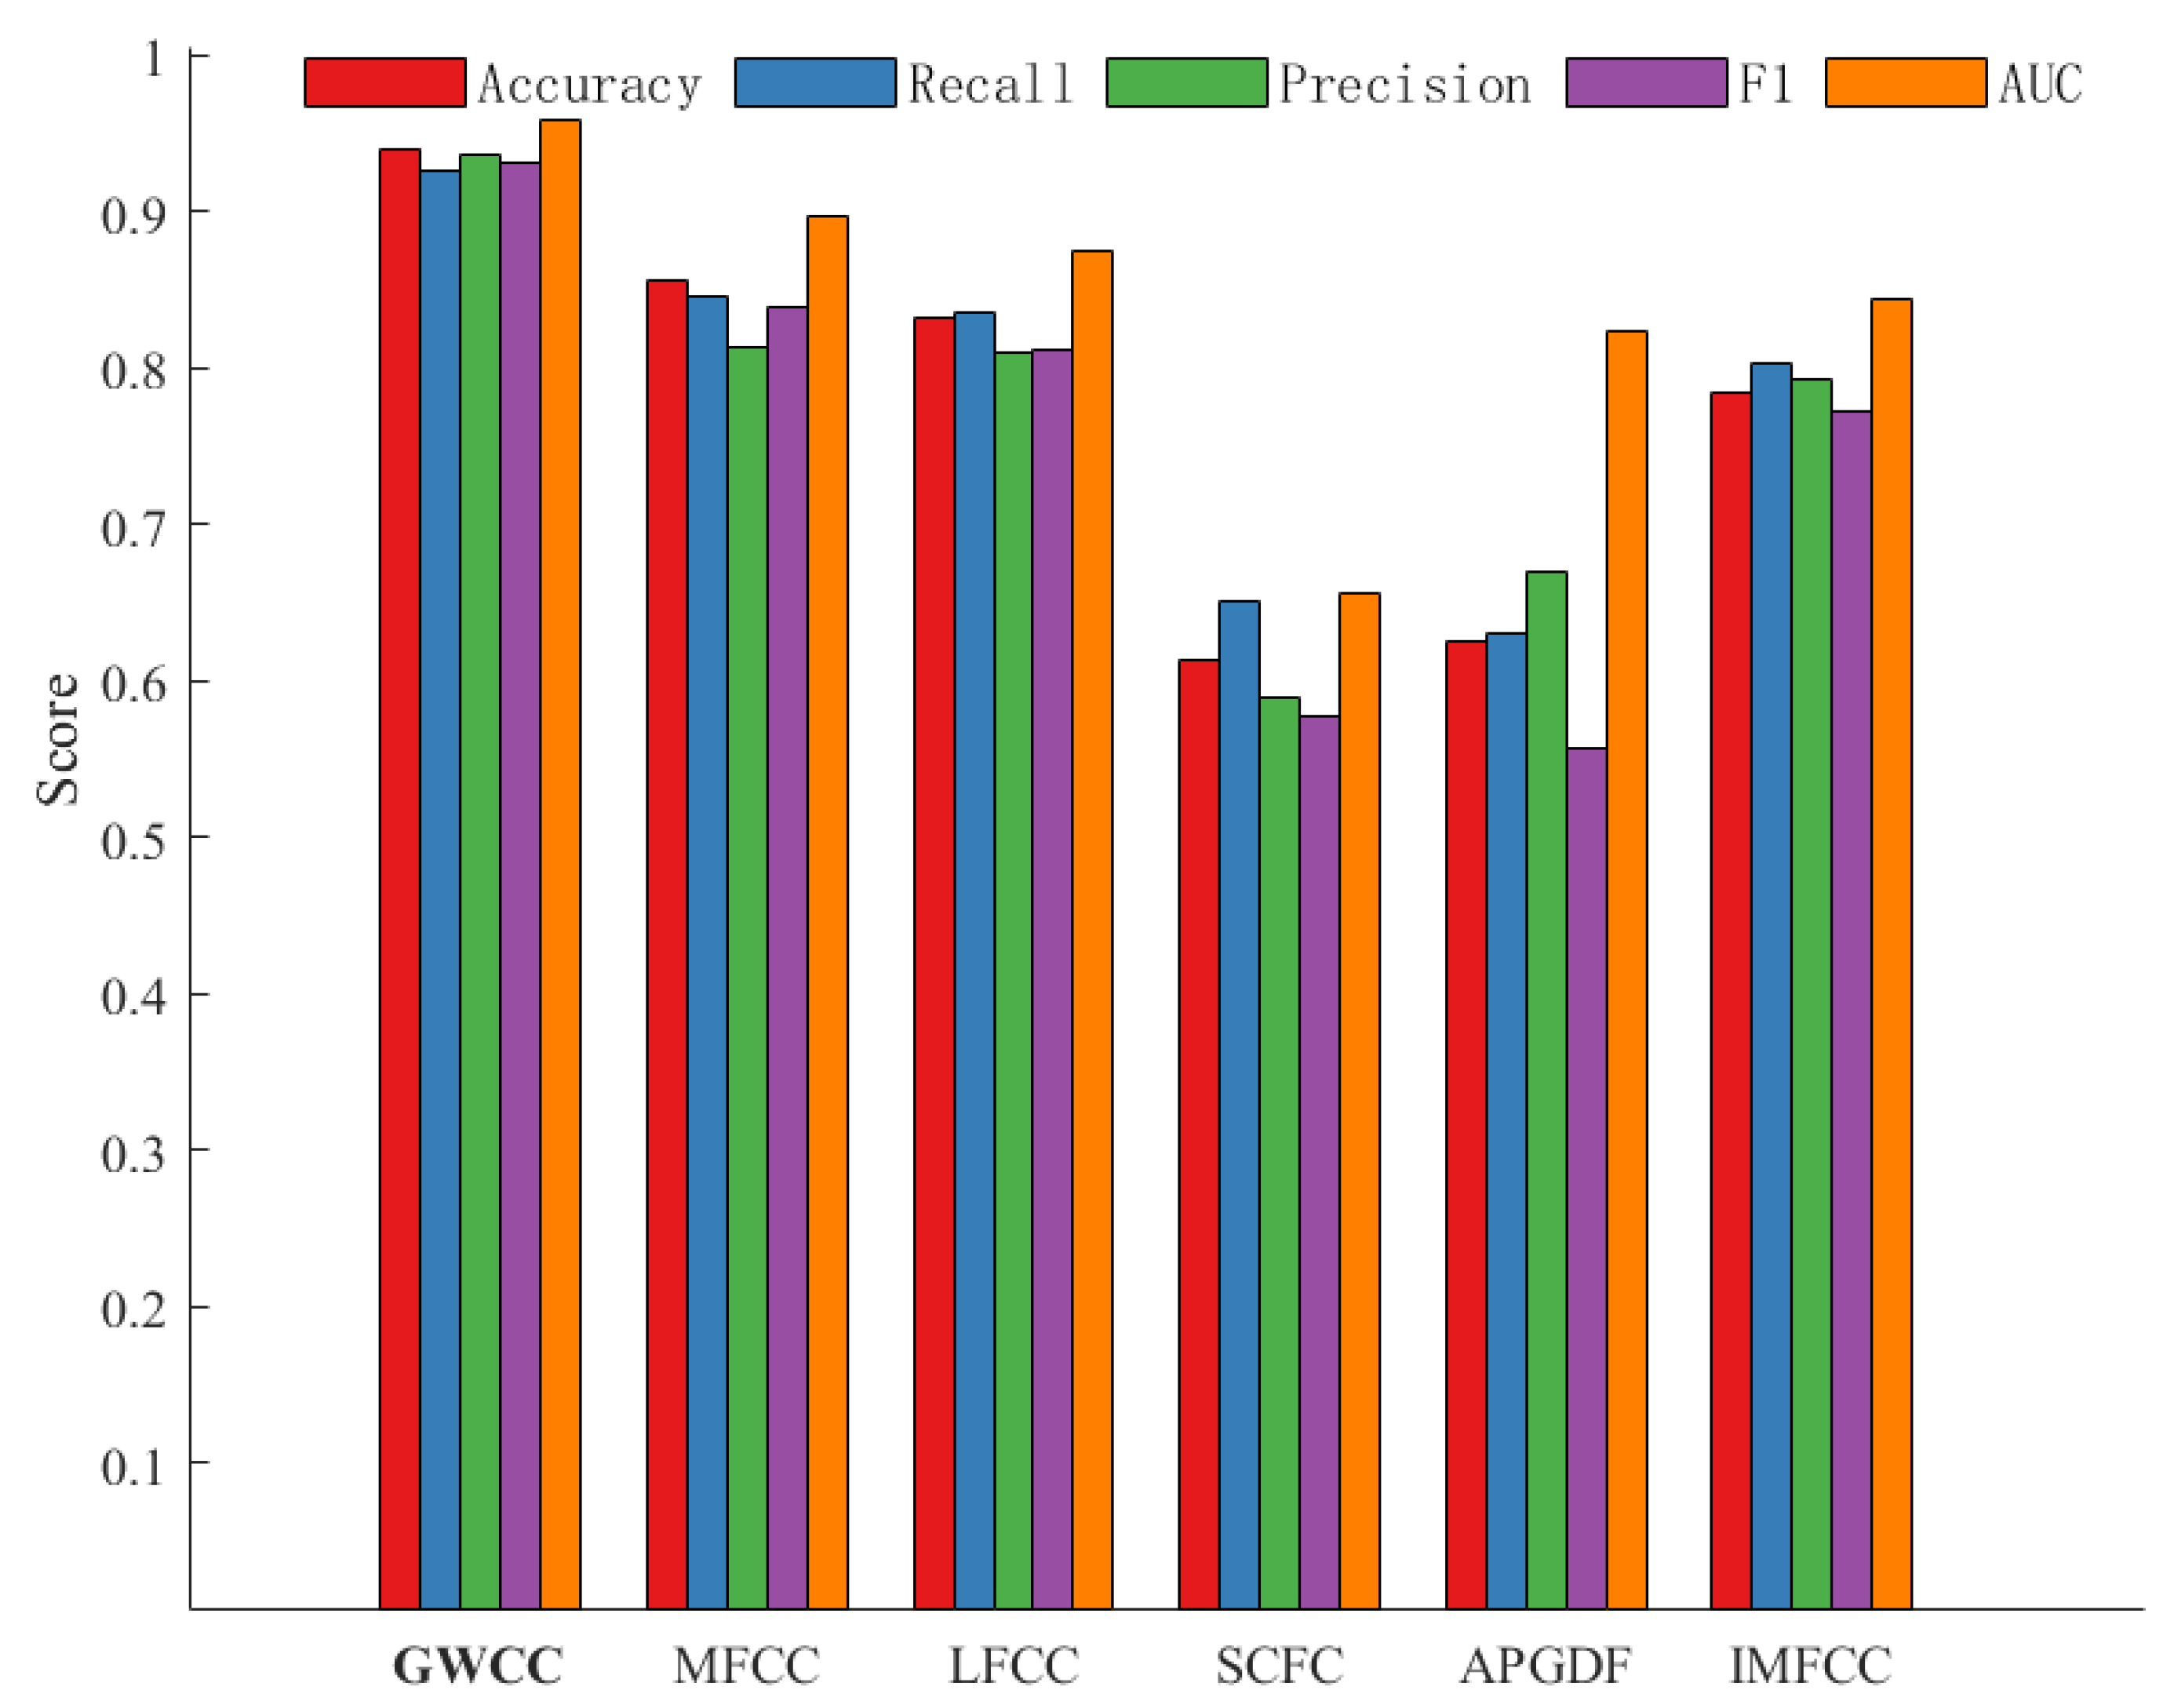
To fully assess the performance and classification effectiveness of different acoustic feature extraction methods, five key evaluation metrics were additionally calculated: accuracy, recall, precision, F1 score, and the area under the receiver operating characteristic curve (AUC). The results shown in Figure 10 represent the averaged outcomes on the five-fold cross-validation test sets, providing a clear visualization of the scores for the six features across these five metrics.
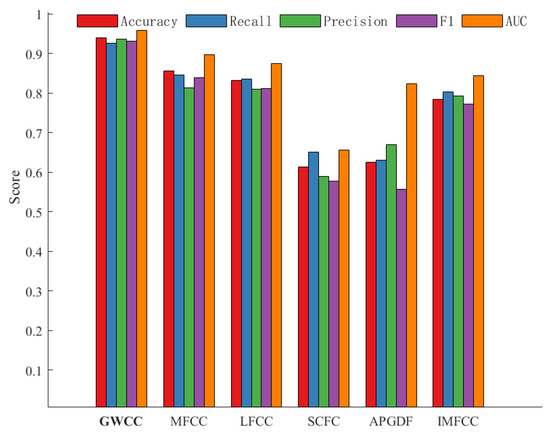
Figure 10.
Average scores for classification based on each feature (five-fold cross-validation).
The results show that GWCC significantly outperformed the other features (e.g., MFCC, LFCC, IMFCC) across all five evaluation metrics, fully demonstrating its superior performance in the ARB–ARD classification task. Specifically, the high AUC value of GWCC was particularly noteworthy, indicating that the feature not only achieves excellent overall classification accuracy but also has strong discriminability and robustness in distinguishing ARB from ARD. By comparison, MFCC and LFCC showed similar performance and generally outperformed IMFCC across most metrics, but both remained far inferior to GWCC.
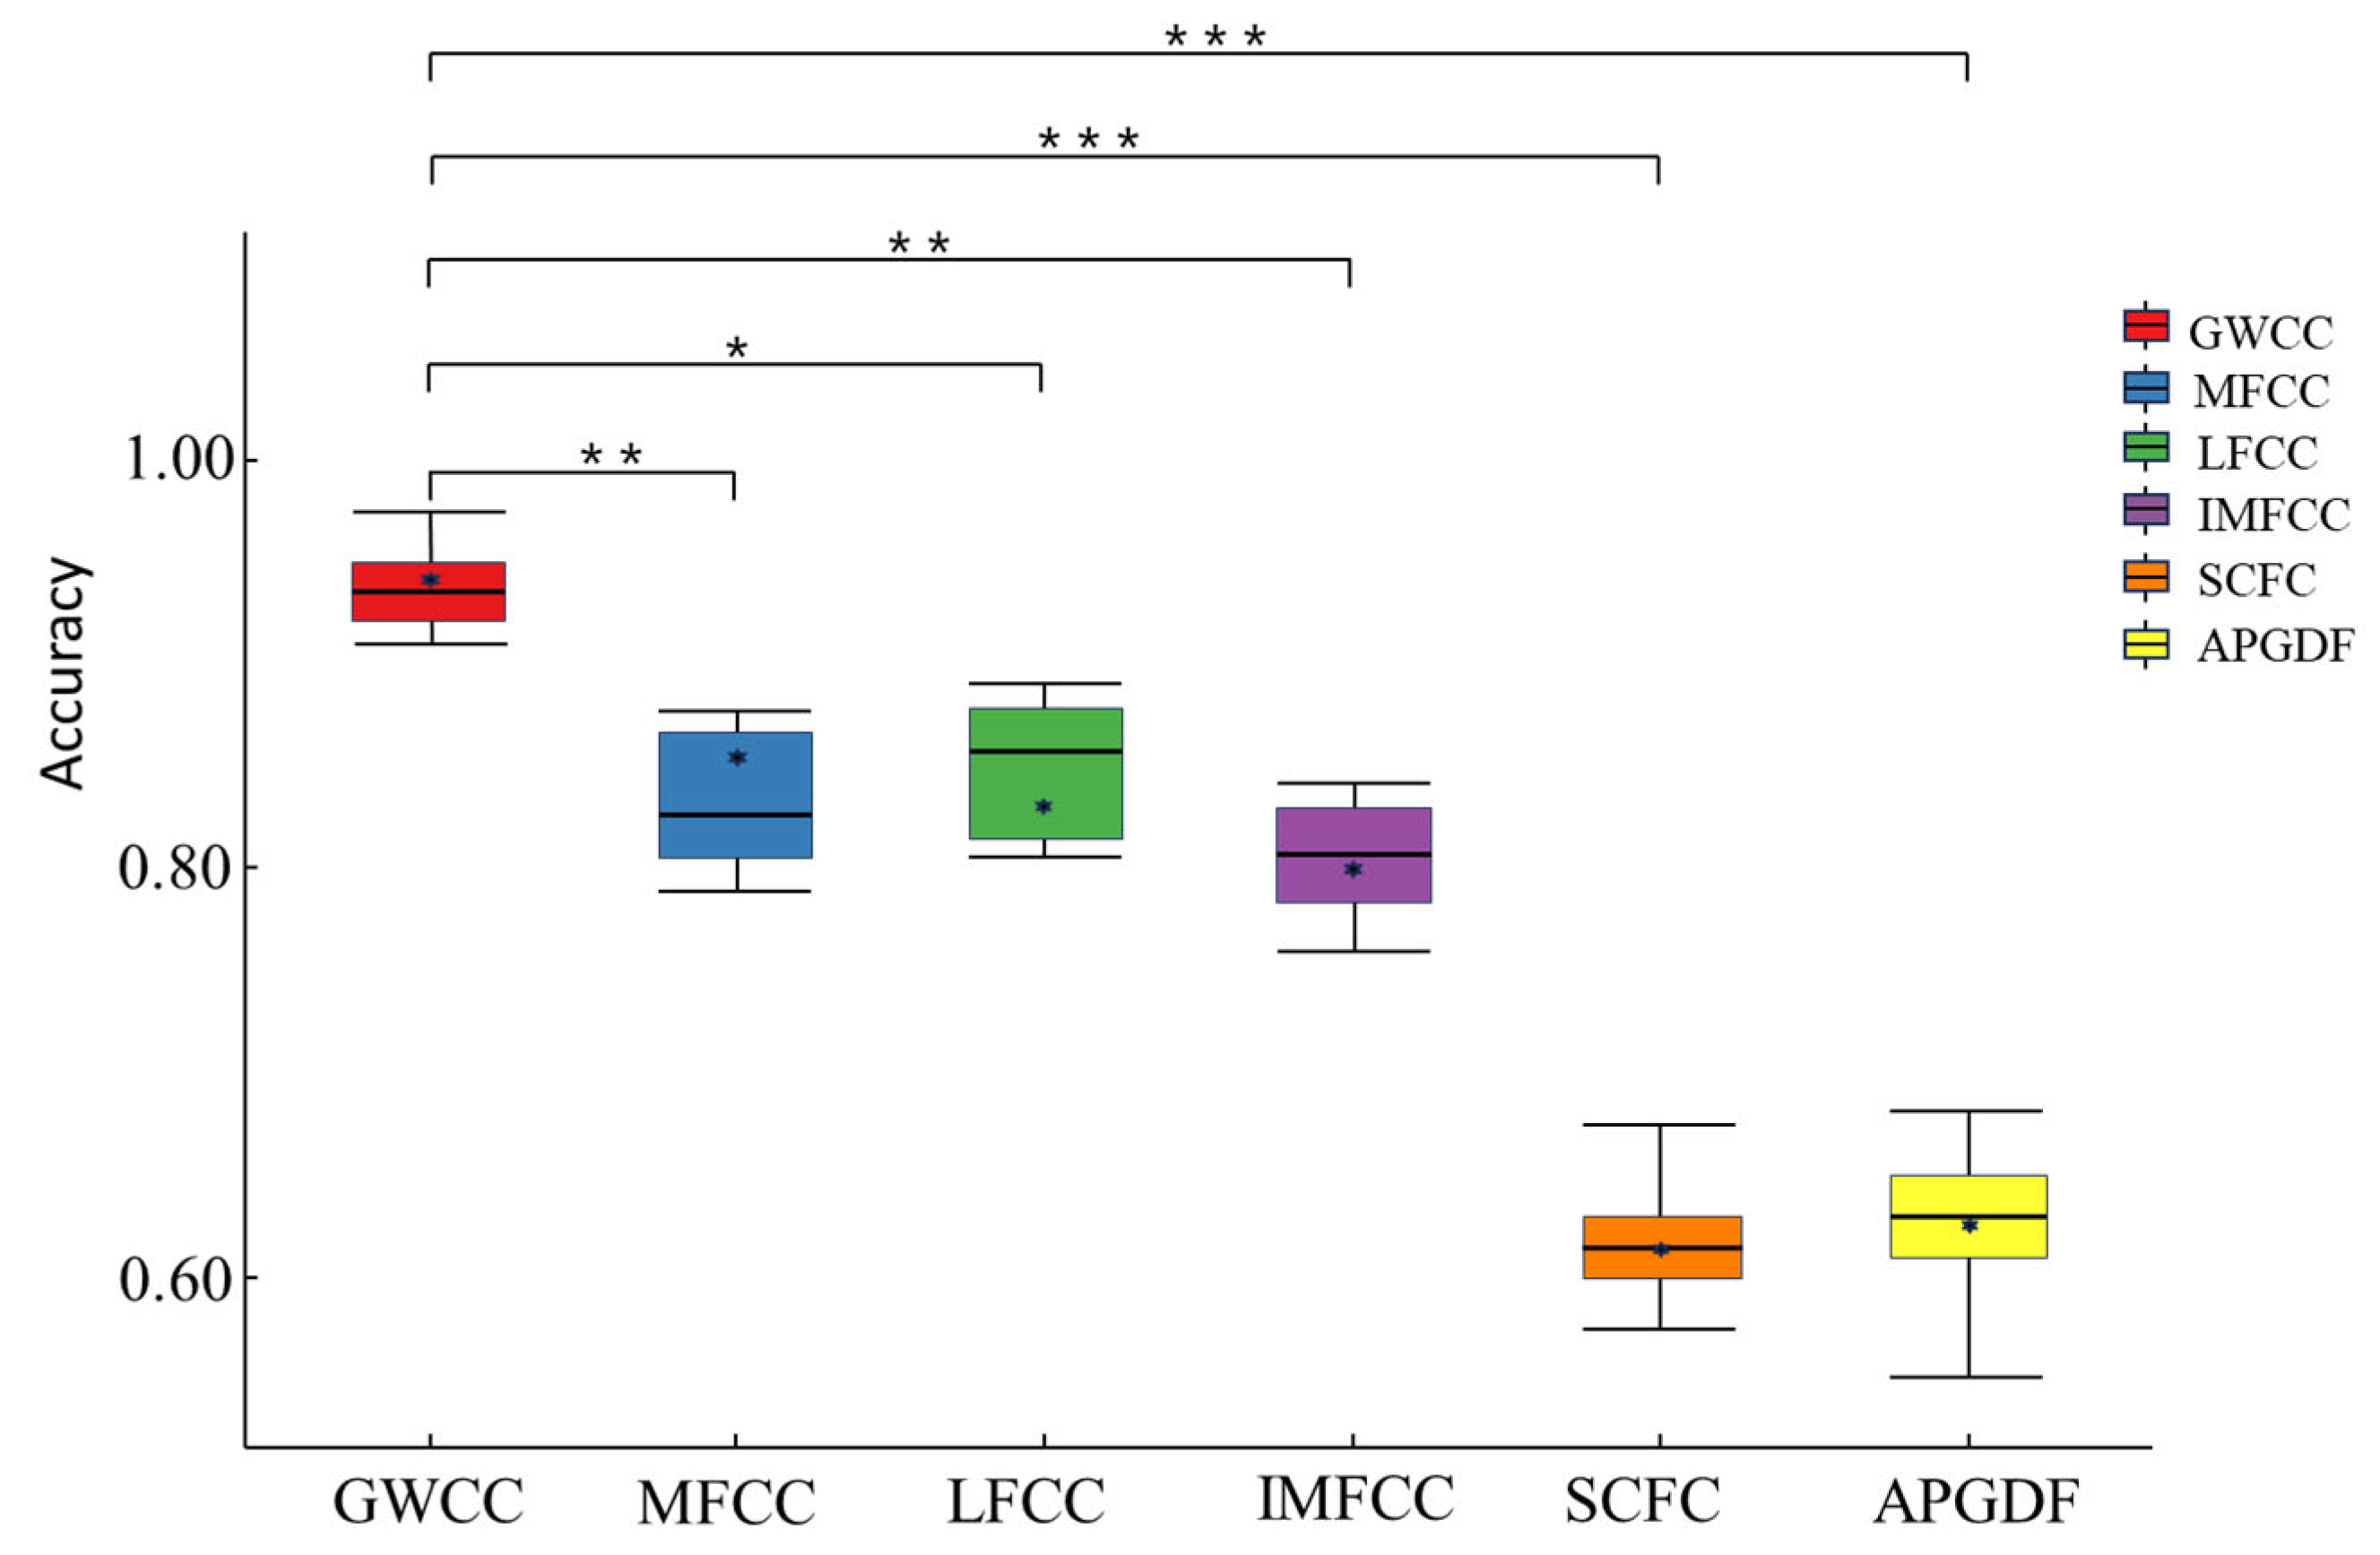
To further investigate the statistical significance of performance differences among the various acoustic features, paired-sample t-tests were conducted on the basis of the optimal model configurations obtained for the training set (as listed in Table 2). The tests focused on the higher-performing features (GWCC, MFCC, LFCC, IMFCC) and were performed on the recognition rates obtained from each fold of the five-fold cross-validation. The significance level was set at 0.05. Figure 11 illustrates the box plots of recognition rates along with the t-test results for all six features: GWCC, MFCC, LFCC, IMFCC, SCFC, and APGDF.
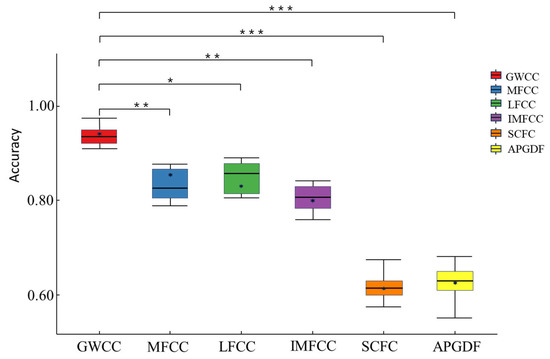
Figure 11.
Feature box plots and t-test results (significant differences: * p < 0.05, ** p < 0.01, *** p < 0.001).
The box plots shown in Figure 11 clearly revealed the distribution of recognition rates for each feature. GWCC not only achieved the highest median and mean values but also had the narrowest interquartile range. This result means GWCC delivered stable performance across folds. In contrast, MFCC showed larger fluctuations in recognition rate, and LFCC was relatively stable but still inferior overall to GWCC. Moreover, GWCC was significantly different from all other features, with recognition rates consistently superior (p < 0.05). This result strongly indicates that the highest average recognition rate achieved by GWCC (listed in Table 2) was not coincidental but reflected a statistically significant advantage. These findings further highlight the value of performing spectral discriminability analysis during feature design and, on this basis, constructing targeted weighted filter banks.
5. Conclusions and Future Work
This paper proposes a method for constructing a globally weighted filter bank based on spectrum discriminability optimization. Through comparative analysis of ARB and ARD, the F-ratio validates its significant spectral discriminative power, providing a theoretical basis for feature extraction. Building upon this, a spectral discriminability weighting curve is designed based on the F-ratio distribution. This enables the construction of a non-uniform filter bank that emphasizes high-discriminability subbands, thereby generating GWCC features with enhanced discriminative capability. Experimental results demonstrate that this feature significantly outperforms traditional acoustic features in metal defect classification, with statistically significant performance improvements. This method innovatively employs laser-induced audible acoustic signals for defect identification, offering a novel non-contact solution for industrial non-destructive testing. However, this study is constrained by the limited number of martensitic stainless-steel samples collected from actual nuclear power plant environments, as well as the insufficient diversity in defect types and material morphologies. This has somewhat impacted the method’s generalizability. Future work will build upon this feasibility study to further investigate the applicability and generalization capability of laser-induced audible sound across a broader range of materials and defect conditions, advancing its implementation in real-world industrial non-destructive testing scenarios. This will lay a solid foundation for future multi-modal material analysis and defect detection utilizing optical signals, ultrasonic signals, and audible sound signals derived from LIBS sensing.
Author Contributions
Conceptualization, B.Z., X.C. and W.H.; methodology, B.Z. and W.H.; software, B.Z. and W.H.; validation, B.Z., W.H. and S.W.; formal analysis, Y.H.; investigation, J.M.; resources, T.L.; data curation, S.W.; writing—original draft preparation, B.Z. and W.H.; writing—review and editing, B.Z. and W.H.; visualization, Z.C.; supervision, L.S.; project administration, B.Z. and T.L.; funding acquisition, B.Z. and T.L. All authors have read and agreed to the published version of the manuscript.
Funding
This research was funded by the National Key Research and Development Program of China (2022YFB3707203).
Data Availability Statement
The data are not publicly available due to privacy or ethical restrictions.
Conflicts of Interest
Authors B.Z., T.L., Y.H., Z.C., J.M. are employed by the company Suzhou Nuclear Power Research Institute. The remaining authors declare that the research was conducted in the absence of any commercial or financial relationships that could be construed as potential conflicts of interest. The authors declare that this study received funding from the National Key Research and Development Program of China (2022YFB3707203). The funder was not involved in the study design, collection, analysis, interpretation of data, the writing of this article or the decision to submit it for publication.
Abbreviations
The following abbreviations are used in this manuscript:
| LAST | Laser-Induced Audible Sound Testing |
| GWCC | Globally Weighted Cepstral Coefficients |
| LUT | Laser Ultrasonics |
| NDT | Non-Destructive Testing |
| UT | Ultrasonic Testing |
| CEEMD | Complementary Ensemble Empirical Mode Decomposition |
| EMAT | Electromagnetic Acoustic Testing |
| RT | Radiographic Testing |
| LIBS | Laser-Induced Breakdown Spectroscopy |
| ARD | Acoustic Response From Baseline Defective Metal Blocks |
| ARB | Acoustic Response From Baseline Defect-free Metal Blocks |
| SVM | Support Vector Machine |
| MFCC | Mel Frequency Cepstral Coefficients |
| LFCC | Linear Frequency Cepstral Coefficients |
| IMFCC | Inverted MFCC |
| SCFC | Spectral Centroid Frequency Coefficients |
| APGDF | All-Pole Group Delay Function |
References
- Lu, M.; Ding, L.; Yan, X.; Chen, Y. Application and prospect of laser ultrasonic nondestructive testing technology in advanced manufacturing. J. Vibration Meas. Diagnos. 2021, 41, 631–643. [Google Scholar]
- Fu, L.; Han, J.; Long, J. Application of ultrasonic nondestructive testing and evaluation on metal additive manufacture parts. J. Appl. Acoust. 2023, 42, 434–442. [Google Scholar]
- Liso, A.; Patruno, C.; Renò, V. A deep learning based probabilistic approach for non-destructive testing of aircraft components using laser ultrasonic data. IEEE Access 2025, 13, 66761–66773. [Google Scholar] [CrossRef]
- Joh, J.; Choi, Y.; Lee, J.R. Reverberation-based high-speed guided-wave ultrasonic propagation imager for structural inspection of thick composites. Compos. Struct. 2021, 259, 113446. [Google Scholar] [CrossRef]
- Kim, D.Y.; Cho, Y.H.; Lee, J.H. Assessment of wall-thinning in carbon steel pipe by using laser-generated guided wave. Nucl. Eng. Technol. 2010, 42, 546–551. [Google Scholar] [CrossRef]
- Selim, H.; Delgado-Prieto, M.; Trull, J.; Picó, R.; Romeral, L.; Cojocaru, C. Defect reconstruction by non-destructive testing with laser induced ultrasonic detection. Ultrasonics 2020, 101, 106000. [Google Scholar] [CrossRef] [PubMed]
- Zang, Y.; Zhang, H.; Zhu, L.; Li, Q.; Yuan, J. Application of in-situ static non-destructive testing technology in aviation equipment. Nondestr. Test. Technol. 2024, 48, 1–5. [Google Scholar]
- Zhou, H.; Gao, F.; Gu, P. Research on laser ultrasonic propagation characteristics and quantitative detection of delamination of carbon fiber composite. Optik 2022, 271, 170173. [Google Scholar] [CrossRef]
- Zhuang, B.Z.; Arcaro, A.; Gencturk, B.; Meyer, R.; Oberai, A.; Sinkov, A.; Good, M. Non-destructive evaluation and machine learning methods for inspection of spent nuclear fuel canisters: A state-of-the-art review. Prog. Nucl. Energy 2025, 185, 105697. [Google Scholar] [CrossRef]
- Voitovich, D.; Kurnikov, A.; Orlova, A.; Petushkov, A.; Shimolina, L.; Komarova, A.; Shirmanova, M.; Liu, Y.H.; Razansky, D.; Subochev, P. Local laser fluence estimation in optical resolution optoacoustic angiography employing calibrated ultrasound detector. Photoacoustics 2024, 44, 100734. [Google Scholar] [CrossRef] [PubMed]
- Hui, P.; Wei, Z. Laser ultrasonic weak defect signal detection based on Duffing oscillator. Russ. J. Nondestr. Test. 2025, 61, 23–31. [Google Scholar] [CrossRef]
- Yang, M. The Research on Ultrasonic Non-Destructive Testing Algorithm. Ph.D. Dissertation, Nanjing University of Posts and Telecommunications, Nanjing, China, 2019. [Google Scholar]
- Ma, Q. Research on Electromagnetic Eddy Current Methods and Multi-Parameter Evaluation for In-Line Detection of Pipeline Defects. Ph.D. Dissertation, University of Electronic Science and Technology of China, Chengdu, China, 2023. [Google Scholar]
- Liu, Z.; Deng, L.; Zhang, Y.; Li, A.; Bin, W.; He, C. Development of an omni-directional magnetic-concentrator-type electromagnetic acoustic transducer. NDT E Int. 2020, 109, 102193. [Google Scholar] [CrossRef]
- Kim, K.; Choi, J.; Lee, Y. Effectiveness of non-local means algorithm with an industrial 3 MeV LINAC high-energy X-ray system for non-destructive testing. Sensors 2020, 20, 2634. [Google Scholar] [CrossRef] [PubMed]
- Wang, J. Research on Automatic Defect Detection Algorithms for X-Ray Weld Images. Ph.D. Thesis, Xi’an University of Technology, Xi’an, China, 2018. [Google Scholar]
- Wang, Z.; Li, S.; Xuan, J.; Shi, T. Biologically inspired compound defect detection using a spiking neural network with continuous time–frequency gradients. Adv. Eng. Inform. 2025, 65, 103132. [Google Scholar] [CrossRef]
- Moros, J.; Gaona, I.; Laserna, J.J. Remotely exploring deeper-into-matter by non-contact detection of audible transients excited by laser radiation. Sensors 2017, 17, 2960. [Google Scholar] [CrossRef] [PubMed]
- Miyazaki, T.; Tanaka, Y. Monitoring Q-swithed YAG laser drilling process by generated sound. Int. J. Jpn. Soc. Precis. Eng. 1991, 25, 142–147. [Google Scholar]
- Chen, M.; Chen, X. Detection of replay spoof speech using global self-attentive Teager energy features. Acta Acust. 2024, 49, 1122–1130. [Google Scholar]
- Zheng, L. Research on Water Seepage Detection of Concrete Based on Percussion Method with MFCC as the Sound Feature. Ph.D. Thesis, Dalian University of Technology, Dalian, China, 2020. [Google Scholar]
- Wang, L.; Zhao, Z. Marine Mechanical Noise Monitoring System Based on MFCC-SVM. Automat. Instrum. 2020, 35, 54–58. [Google Scholar]
- Davis, S.; Mermelstein, P. Comparison of parametric representations for monosyllabic word recognition in continuously spoken sentences. IEEE Trans. Acoust. Speech Signal Process. 1980, 28, 357–366. [Google Scholar] [CrossRef]
Disclaimer/Publisher’s Note: The statements, opinions and data contained in all publications are solely those of the individual author(s) and contributor(s) and not of MDPI and/or the editor(s). MDPI and/or the editor(s) disclaim responsibility for any injury to people or property resulting from any ideas, methods, instructions or products referred to in the content. |
© 2025 by the authors. Licensee MDPI, Basel, Switzerland. This article is an open access article distributed under the terms and conditions of the Creative Commons Attribution (CC BY) license (https://creativecommons.org/licenses/by/4.0/).

