Article

Enhanced Heart Sound Detection via Multi-Scale Feature Extraction and Attention Mechanism Using Pitch-Shifting Data Augmentation

1
Faculty of Information Engineering and Automation, Kunming University of Science and Technology, Kunming 650500, China
2
Yunnan Key Laboratory of Computer Technologies Application, Kunming University of Science and Technology, Kunming 650500, China
*
Author to whom correspondence should be addressed.
Electronics 2025, 14(20), 4092; https://doi.org/10.3390/electronics14204092
Submission received: 26 September 2025 / Revised: 9 October 2025 / Accepted: 16 October 2025 / Published: 17 October 2025

Abstract

Cardiovascular diseases pose a major global health threat, making early automated detection through heart sound analysis crucial for their prevention. However, existing deep learning-based heart sound detection methods have shortcomings in feature extraction, and current attention mechanisms perform inadequately in capturing key heart sound features. To address this, we first introduce a Multi-Scale Feature Extraction Network composed of Multi-Scale Inverted Residual (MIR) modules and Dynamically Gated Convolution (DGC) modules to extract heart sound features effectively. The MIR module can efficiently extract multi-scale heart sound features, and the DGC module enhances the network’s representation ability by capturing feature interrelationships and dynamically adjusting information flow. Subsequently, a Multi-Scale Attention Prediction Network is designed for heart sound feature classification, which includes a multi-scale attention (MSA) module. The MSA module effectively captures subtle pathological features of heart sound signals through multi-scale feature extraction and cross-scale feature interaction. Additionally, pitch-shifting techniques are applied in the preprocessing stage to enhance the model’s generalization ability, and multiple feature extraction techniques are used for initial feature extraction of heart sounds. Evaluated via five-fold cross-validation, the model achieved accuracies of 98.89% and 98.86% on the PhysioNet/CinC 2016 and 2022 datasets, respectively, demonstrating superior performance and strong potential for clinical application.

1. Introduction

Cardiovascular disease has become a major threat to global health, causing more than 17 million deaths annually, which accounts for about one-third of all global deaths [1]. Early detection and treatment of cardiovascular diseases are essential [2]. Heart sound auscultation, as a convenient, non-invasive, and economical method of cardiac examination, can provide clues to various heart diseases, such as patent ductus arteriosus, arrhythmia, valve disease, and ventricular septal defect [3]. However, the accuracy of detecting heart sounds using a stethoscope largely relies on clinical experience. Experienced cardiologists are particularly rare in less developed regions and in countries with lower to moderate income levels [4]. Thus, developing automated techniques for analyzing heart sounds is crucial. These methods can help doctors minimize personal bias and enhance diagnostic efficiency [5].
Generally, the automatic diagnosis of heart sounds primarily involves two key steps: feature extraction and classification [6]. Currently, the feature extraction methods are mainly divided into the feature extraction method based on manual design and the feature extraction method based on deep learning. Manually designed feature extraction methods primarily focus on extracting features from three domains: time-domain features like amplitude and duration; frequency-domain features, for example, spectral entropy and power spectral density; and time-frequency-domain features, including continuous wavelet transform, discrete wavelet transform, and Mel-Frequency Cepstral Coefficients (MFCCs) [7]. Hand-designed feature extraction methods can tailor features to specific application requirements and signal characteristics, but they require specialist knowledge and experience, and the feature extraction process can be tedious and time-consuming.
In recent years, feature extraction methods leveraging deep learning have garnered extensive attention and research. Compared to traditional feature extraction techniques, deep learning methods can autonomously learn intricate feature representations directly from raw data, bypassing the need for manual design of feature extraction techniques [8]. Deep neural networks have powerful nonlinear modeling capabilities. They can gradually construct increasingly complex feature representations by stacking multiple nonlinear layers, starting from simple edge and texture features [9]. Among the deep learning techniques, Convolutional Neural Networks (CNNs) have demonstrated strong performance in extracting features from heart sounds, but there are still problems of insufficient feature extraction and representation abilities. Additionally, deep convolutional networks need many computing resources for training, which limits their application in resource-constrained environments.
In existing research, heart sound classifiers mainly include two types: traditional heart sound classifiers and heart sound classifiers based on deep learning. Traditional heart sound classifiers mainly include Support Vector Machines (SVMs) [10], decision trees [11], Random Forests (RFs) [12], and K-Nearest Neighbors (K-NN) [13]. Although traditional heart sound classifiers are simple to implement, they cannot capture the complex features in heart sound signals, and their ability to classify heart sounds is limited [14]. Compared with traditional heart sound classifiers, deep learning-based heart sound classifiers can automatically learn and extract complex heart sound features in heart sound classification tasks, demonstrating higher accuracy and stronger generalization ability.
Among deep learning classifiers, the CNN classifier showed better performance. However, the locality of convolution layer operations in CNNs also brings some limitations, such as a lack of the ability for global and sequence processing. For this reason, researchers have introduced attention mechanisms, spatial transformers, and dynamic convolution layers to enhance the flexibility and invariance of CNNs, improving their processing ability in sequential data and complex transformations. An attention mechanism is a common strategy to solve these problems. Currently, the attention modules commonly used in heart sound classifiers mainly include channel attention modules, such as the sequence and excitation module [15]; spatial attention modules, such as the Position Attention Module [16]; and hybrid attention mechanisms, including the Convolutional Block Attention Module [17]. The Convolutional Block Attention Module model considers both global and local heart sound features and has shown good performance in heart sound classification tasks. However, it has limited capability in capturing subtle variations in feature interactions due to its inherent architectural constraints, particularly in effectively integrating global and local feature information. Global features provide an overall pattern of the heart sound, while local features help capture transient pathological characteristics. The effective fusion of these two types of features is crucial for accurate heart sound analysis.
To address the aforementioned issues, we first employ pitch-shifting technology to preprocess the heart sounds and use various feature extraction techniques for initial feature extraction. Subsequently, we propose a Multi-scale Feature Extraction Network (MFENet) composed of MIR modules and DGC modules to further extract heart sound features. The MIR module can learn features from different regions and scales with minimal computational cost, enabling the extraction of rich heart sound features. The DGC module captures the interrelationships between features and dynamically adjusts the flow of information, thereby enhancing the network’s representation ability. Finally, we introduce a Multi-Scale Attention Prediction Network (MAPNet) based on a multi-scale attention mechanism to classify heart sound features. Through multi-scale feature acquisition and cross-feature learning, the MSA module focuses on the subtle changes between heart sound features while attending to both global and local information. This enables the model to concentrate on the critical features of the heart sound signal, thereby improving its classification performance. The main contributions of this study are as follows:
  • An MFENet is proposed, which combines MIR modules and DGC modules to effectively extract heart sound features. The MIR module can efficiently extract multi-scale heart sound features, and the DGC module enhances the network’s representational capabilities through dynamic feature interactions, thereby significantly improving the quality and efficiency of feature extraction.
  • An MAPNet is designed for heart sound feature classification and includes an MSA module. The MSA module effectively captures subtle pathological features of heart sound signals through multi-scale feature extraction and cross-scale feature interaction, focusing on features conducive to heart sound recognition tasks.
  • Introduce pitch-shifting techniques to enable the model to learn features that remain stable under pitch variations, thereby enhancing the model’s generalization capability.
The remainder of this article is structured as follows. In Section 2, we review the related work in the field. Section 3 presents the materials and methods, covering the datasets, data preprocessing, preliminary feature extraction, the proposed model architecture, evaluation metrics, and experimental setup. Section 4 reports the experimental results, including ablation studies and comparisons with state-of-the-art methods, to validate the effectiveness of the proposed approach. Finally, Section 5 concludes the paper with a summary, limitations, and future directions.

2. Related Work

Heart sounds provide insights into the condition of the cardiovascular system, including early signs of cardiovascular pathology [18]. Analyzing heart sounds can help to better understand the health status of the heart [19]. Clinical diagnosis of cardiovascular diseases has conventionally depended on cardiac auscultation as a primary screening tool. However, contemporary studies have demonstrated that even among trained cardiologists, the diagnostic accuracy achieved through auscultatory detection is limited to approximately 80% [20]. Automatic heart sound diagnosis using computer technology has been extensively explored to address this issue. The automatic diagnosis of heart sound using computer technology mainly includes two parts: feature extraction and classification.
In the feature extraction section, researchers usually use various approaches to extract meaningful information from heart sound signals. The feature extraction method based on manual design mainly extracts the frequency-domain features, time-domain features, and time-frequency-domain features of the heart sound signal [21]. Owing to the physiological nature of heart sound signals, frequency domain or time domain features extracted from heart sounds are more intuitive and easier to understand and calculate. However, it is difficult to quantify the basic information of heart sound signals using the frequency domain or time domain alone [22]. Therefore, researchers often combine frequency-domain and time-domain features with time-frequency features to quantify the basic information of heart sound signals. Maity et al. [23] used standard time-frequency features (spectrum, log Mel spectrum, and scalogram) to characterize heart sound signals and fine-tuned the pre-training lightweight model based on audio and image to classify phonocardiogram signals.
In recent years, CNNs have attracted significant interest in the field of heart sound signal processing for their robust feature extraction ability. Zhu et al. [24] proposed an end-to-end heart sound classification neural network model called LEPCNet, which directly extracts features from a one-dimensional raw heart sound waveform and classifies them. Fan et al. [4] introduced Le-LWTNet, an end-to-end CNN for heart sound abnormality detection. The method incorporates a learnable lifting wavelet transform (Le-LWT) module to extract multi-scale features from raw heart sound signals. Ma et al. [16] proposed an efficient dense connected dual attention network for heart sound classification. The network integrates the benefits of end-to-end architecture and self-attention mechanisms, enabling it to automatically extract heart sound features without relying on additional preprocessing. Compared with the existing methods, our proposed MFENet introduces two modules: the MIR module and the DGC module. The MIR module can learn features from different regions and scales at low computational cost, thereby enriching the representation of heart sound features. The DGC module captures the interrelationships between features and dynamically adjusts information flow, significantly enhancing the network’s representational capacity. This enables the network to extract more complex and meaningful heart sound features, leading to better recognition performance compared to existing methods.
Following feature extraction, the subsequent step involves constructing a classifier, which is the key step in converting the extracted features into actual diagnostic results. Traditional machine learning methods, including SVM, decision tree, RF, and K-NN, have seen extensive application in the categorization of heart sound signals [25]. These methods usually depend on hand-crafted features and use optimization algorithms to determine the classification boundary. As deep learning technology has advanced, CNNs have demonstrated significant potential in heart sound classification. Das and Dandapat et al. [26] integrated multi-core convolution and residual learning to effectively extract and leverage key features in heart sound signals, achieving high-precision classification of heart murmur severity. Singh et al. [27] introduced a U-Net model for classifying heart sounds. It converts phonocardiogram signals into Mel-spectrograms to extract features. The U-Net processes these images, using its encoder–decoder structure to effectively capture and classify features, achieving high accuracy on the PhysioNet datasets.
To enhance the classifier’s performance, researchers also introduced the attention mechanism into the classifier to help the model concentrate on crucial features in the heart sound signal and thereby enhance classification accuracy. Zhou et al. [28] proposed a method for detecting coronary artery disease by combining MFCC feature extraction, deep CNN, and attention mechanism to achieve high-precision coronary artery disease detection. Alkhodari et al. [29] proposed a deep learning-based attention transformer model. This model employs the transformer architecture to handle sequence data and the self-attention mechanism to capture long-distance dependencies, thereby gaining a deeper understanding of the intricate patterns within heart sound signals. Ranipa et al. [30] proposed a heart sound classification method utilizing a multimodal attention CNN. The classifier achieved efficient heart sound classification by combining multimodal feature extraction, channel attention, the spatial attention mechanism, and a feature-level fusion strategy. In this article, we introduce a MAPNet based on the multi-scale attention mechanism for heart sound feature classification. Within this network, compared to existing attention modules, the MSA module leverages multi-scale feature extraction and cross-scale feature interaction to not only capture both global and local heart sound features simultaneously but also integrate these features effectively. This enables it to identify subtle pathological characteristics in heart sound signals accurately and focus on the key features relevant to heart sound recognition tasks, significantly enhancing classification performance.

3. Materials and Methods

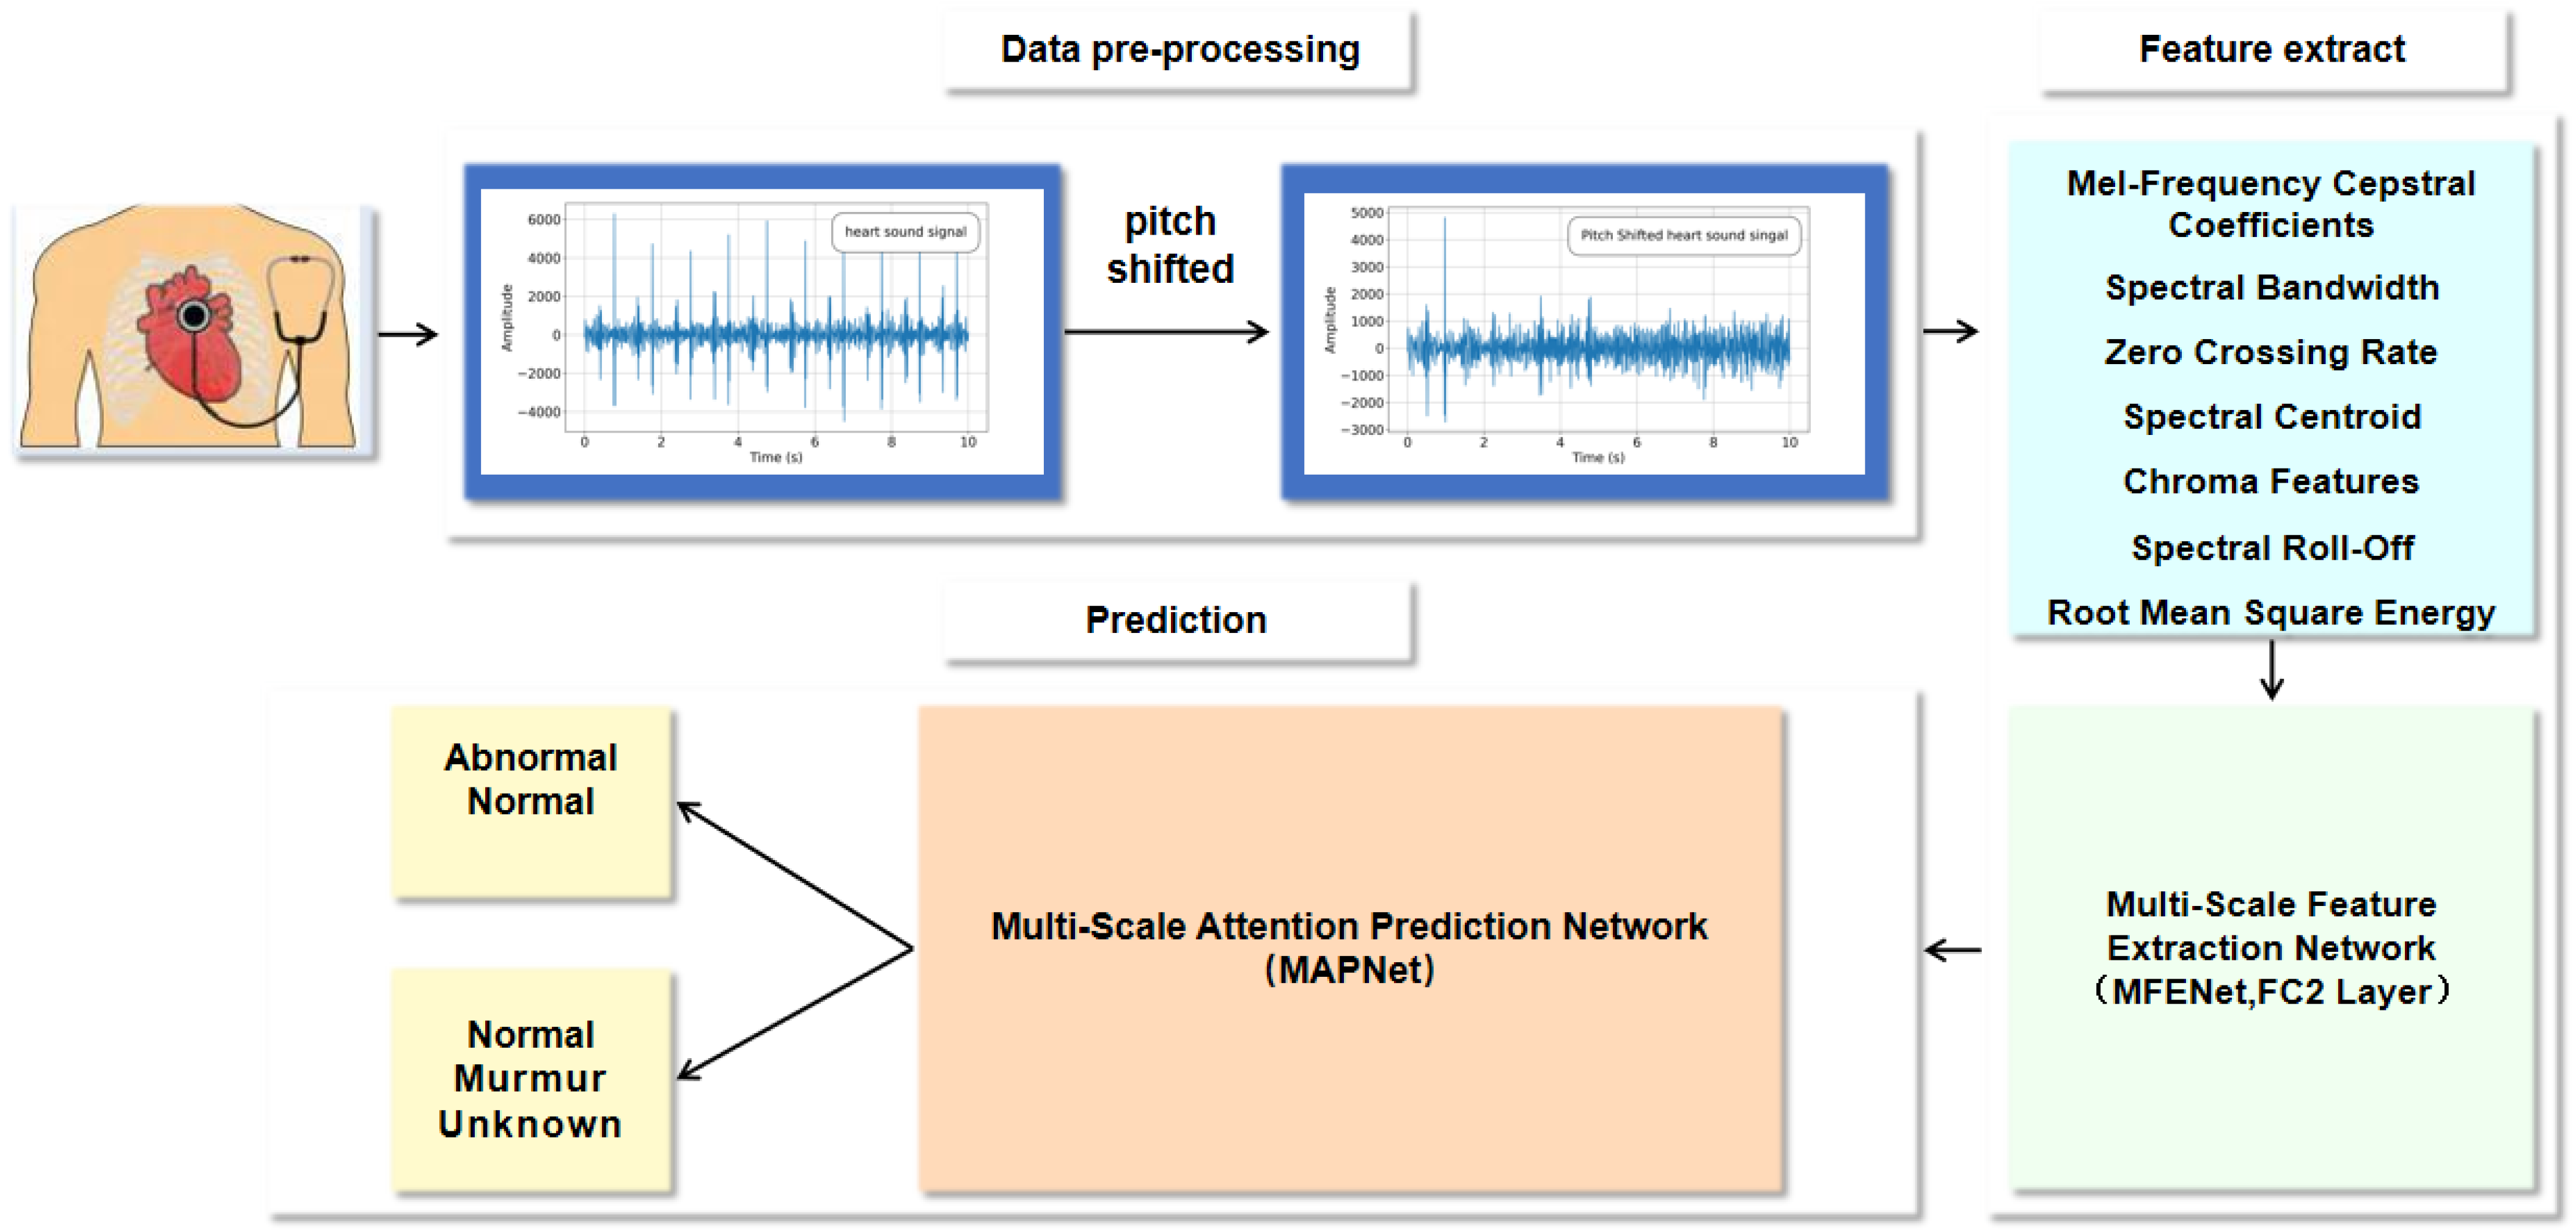
In this section, we begin by describing the datasets, followed by an introduction to the overall structure of the heart sound detection method, as illustrated in Figure 1. For the raw heart sound signal, there is no need to segment the heart sounds. We first apply pitch-shifting techniques to introduce pitch variations, enabling the model to learn features that remain stable under these varying conditions. Next, we extract preliminary heart sound features using Chroma Features (CF) [31], Spectral Bandwidth (SB) [32], Zero Crossing Rate (ZCR) [33], Root Mean Square Energy (RMSE) [34], Spectral Roll-off (SR) [32], Spectral Centroid (SC) [35], and MFCC [32]. Since the lengths of signals may not be consistent, and CNNs require input data to have fixed dimensions, we average the extracted features. Specifically, we calculate the mean of CF, RMSE, SC, SB, SR, and ZCR across the entire signal, obtaining a 1 × 1 feature value for each. For MFCC, we calculate the mean along the time dimension, resulting in a 1 × 20 feature vector. Subsequently, all features are concatenated into a 1 × 26 joint feature vector, serving as the input for our subsequent model. To obtain richer and more accurate heart sound features, we use MFENet to process the input features and extract deep features from the second fully connected layer (FC2) after training. Finally, MAPNet is employed to classify the extracted deep heart sound features. Afterward, we present the evaluation metrics used to assess model performance and then introduce the experimental setup, which includes details on the computational resources employed and the configuration of the models.

3.1. Data Description

This study utilized the PhysioNet/CinC Challenge 2016 dataset [36], the PhysioNet/CinC Challenge 2022 dataset [37], and the ZCHSound noise dataset [38]. The PhysioNet/CinC Challenge 2016 dataset is a widely used public dataset for heart sound analysis and research. The dataset was gathered by seven distinct research groups from various clinical and nonclinical environments and recorded in WAV format. The dataset consists of normal and abnormal heart sound recordings. The normal heart sound recordings belong to healthy subjects and consist of 2575 samples. Abnormal heart sound recordings, which consist of 665 samples, are sourced from patients diagnosed with heart disease. The dataset totals 3240 samples, as detailed in Table 1.
At the same time, the PhysioNet/CinC Challenge 2022 dataset is another commonly used heart sound dataset. This dataset was gathered from two separate cardiac screening programs in the Brazilian state of Pernambuco during 2014 and 2015. It consists of recordings from 942 subjects, each lasting between 5 and 65 s, with a sampling rate of 4000 Hz. A total of 3163 heart sound signals were gathered. After the collected heart sound signals are annotated by professionals, all heart sound records are divided into three categories, namely, “murmur”, which contains 616 records; “normal”, which contains 2391 records; and “unknown”, which contains 156 records, as shown in Table 1. We will use these two datasets to train our model and use them to verify and test the performance of the model.
The ZCHSound noise dataset is a collection of pediatric heart sound recordings specifically designed to include noisy, low-quality data. The dataset includes both normal heart sounds and heart sounds from children diagnosed with various congenital heart diseases. The noisy recordings contain interference from sources such as crying, coughing, and environmental sounds. This makes it possible to test the performance of algorithms under real-world noise conditions. The specific details of the dataset are shown in Table 1.

3.2. Data Preprocessing

Pitch shifting is a commonly adopted data augmentation technique in speech recognition, where it has been demonstrated to significantly improve the system’s overall robustness [39]. Although its application as a preprocessing step remains relatively unexplored in the biomedical domain, a recent study reported that pitch shifting enhances the effectiveness of psychoacoustic features in fetal phonocardiography [40]. Motivated by these findings, we extended pitch shifting to heart sound classification.
Cardiac acoustic signals form harmonic systems that originate from the physical vibrations of cardiovascular structures. While heart sounds differ fundamentally from musical signals in both their generation mechanisms and pathological correlates, we hypothesize that certain pathological features (such as murmurs caused by turbulent blood flow or split sounds resulting from valvular abnormalities) may demonstrate relative stability in their harmonic relationships across individuals. This potential invariance stems from the physical nature of these phenomena: although the fundamental frequency may vary with heart rate and individual anatomy, the harmonic structure generated by fixed pathological mechanisms (e.g., constricted valves or septal defects) remains relatively consistent. Through pitch shifting, we achieve two critical objectives for enhanced feature extraction: normalization of inter-subject spectral differences by aligning the fundamental frequency components across patients and preservation of the relative harmonic relationships that characterize pathological conditions. This approach allows the model to learn more invariant representations of disease patterns, focusing on the morphological stability of pathological features rather than on absolute frequency values. Compared to traditional time-domain augmentation techniques (e.g., noise addition or time warping), pitch shifting offers distinct advantages for heart sound analysis: it operates directly in the frequency domain to address spectral variations while maintaining the temporal integrity of acoustic events, and it preserves the harmonic relationships crucial for pathological identification.
To implement this approach, we adopted a pitch-shifting mechanism based on phase vocoders, which integrates spectral interpolation with phase correction. Specifically, when processing heart sound signals contaminated with significant noise, a fifth-order Butterworth bandpass filter with a passband of 25–1000 Hz was applied. This filter effectively attenuates both low- and high-frequency interference, selectively enhancing signal quality in noisy environments while preserving essential diagnostic information within the heart sound frequency range. To ensure precise time-frequency resolution for heart sound analysis, the Short-Time Fourier Transform was computed using a Hanning window of 2048 samples (corresponding to 128 ms at a 16 kHz sampling rate) with 50% overlap (1024 samples). Following the STFT, spectral interpolation was performed to achieve precise frequency adjustment and align pathological feature bands. This was achieved by linearly interpolating the original heart sound Short-Time Fourier Transform spectrum along the frequency axis, using a scaling factor α . The process is mathematically expressed as
Y [ m , k ]   =   X [ m , α k ]   +   ( α k α k ) · X [ m , α k + 1 ] X [ m , α k ]
where m is the frame index, k is the frequency bin index, X [ m , k ] is the original STFT spectrum, Y [ m , k ] is the pitch-shifted spectrum, α = 2 ( n s t e p s / 12 ) is the frequency scaling factor (with n s t e p s representing semitone shift steps), and · denotes the floor function. To maintain signal continuity, a phase correction is applied based on the instantaneous phase difference. This process ensures that the phase relationship between the shifted frequency components is preserved, which is crucial for maintaining the temporal structure of the heart sound signal during the pitch-shifting process. This process is mathematically expressed as
Δ φ [ m , k ] = α · { X [ m 1 , k ] · X * [ m , k ] }
φ Y [ m , k ] = φ X [ m , α k ] + Δ φ [ m , k ] · ( α k α k )
where φ X denotes the original phase, φ Y is the modified phase, is the phase angle operator, ∗ is the complex conjugate, and Δ φ [ m , k ] represents the instantaneous phase difference weighted by the frequency scaling factor in phase vocoders.
To select the appropriate pitch-shifting parameter for heart sound analysis, a −4 semitone shift ( α = 0.794 ) was chosen based on the intrinsic physiological characteristics of cardiac acoustics. Specifically, the primary energy of common pathological murmurs typically resides in the 80–200 Hz range. A moderate pitch shift of −4 semitones helps align the characteristic frequency bands of different individuals with the frequency range that is highly sensitive to human hearing (250–500 Hz). Additionally, this shift transforms normal adult heart sounds, which typically have a fundamental frequency between 60 and 120 Hz, to better match the simulated heart sound frequency range used in standard auscultation training. This alignment aids the feature extraction network in capturing acoustical patterns with diagnostic significance. While the effectiveness of this −4 semitone shift has been experimentally validated, its theoretical optimality remains subject to further confirmation through larger-scale, systematic studies of physiological acoustics under diverse conditions.

3.3. Preliminary Feature Extraction

To extract discriminative features from heart sound signals, we employ a comprehensive set of time-frequency analysis techniques that collectively characterize the signal’s acoustic properties. This selection of features, including the CF for periodic analysis, RMSE for energy variations, SC and SB for spectral shape, SR for high-frequency content, ZCR for signal sharpness, and MFCCs for spectral envelope, is well-established in the audio and biomedical signal processing literature for capturing salient patterns in non-stationary signals [41,42].
To ensure efficient model training when handling heart sound data with variable signal lengths, we adopted a feature extraction strategy based on statistical summaries to generate a fixed-dimensional and highly discriminative feature vector. This strategy of using statistical summaries of time-varying features has been successfully applied in other domains dealing with low signal-to-noise ratios and continuous signals, such as the detection of continuous gravitational waves [43]. In [44], statistical features (e.g., mean, standard deviation) extracted from spectrogram representations also proved crucial for constructing a robust ensemble model, complementing deep learning approaches.
In our method, we calculate the mean of CF, RMSE, SC, SB, SR, and ZCR across the entire signal, obtaining a 1 × 1 feature value for each. For MFCC, we calculate the mean along the time dimension, resulting in a 1 × 20 feature vector. While this averaging step sacrifices some temporal resolution, it effectively summarizes the global characteristics of each feature, which can be highly informative for classification [3,44]. Finally, all features are concatenated into a 1 × 26 joint feature vector, serving as the input for our subsequent model. This feature fusion method not only unifies the input dimensions but also leverages the complementarity of different features, improving the model’s robustness and discriminative power.
To address potential signal corruption (such as background noise or motion artifacts), all signals were preprocessed using a 5th-order Butterworth bandpass filter (25–1000 Hz) prior to feature extraction. This step effectively attenuated low-frequency rumble and high-frequency noise, significantly reducing the impact of background noise and improving overall signal quality. Furthermore, the use of statistical summaries of time-frequency features provides inherent robustness against transient, non-systematic artifacts, as their contributions are diluted when averaged over the entire signal duration. The mathematical representation of the preliminary feature extraction is as follows:
F i = [ η C F , η R M S E , η S C , η S B , η S R , η Z C R , η M F C C ]
where η C F R 1 is the mean chroma feature, η R M S E R 1 is the mean root mean square energy, η S C R 1 is the mean spectral centroid, η S B R 1 is the mean spectral bandwidth, η S R R 1 is the mean spectral rolloff, η Z C R R 1 is the mean zero-crossing rate, and η M F C C R 20 is the mean MFCCs.

3.4. Multi-Scale Feature Extraction Network

3.4.1. Multi-Scale Inverted Residual Module

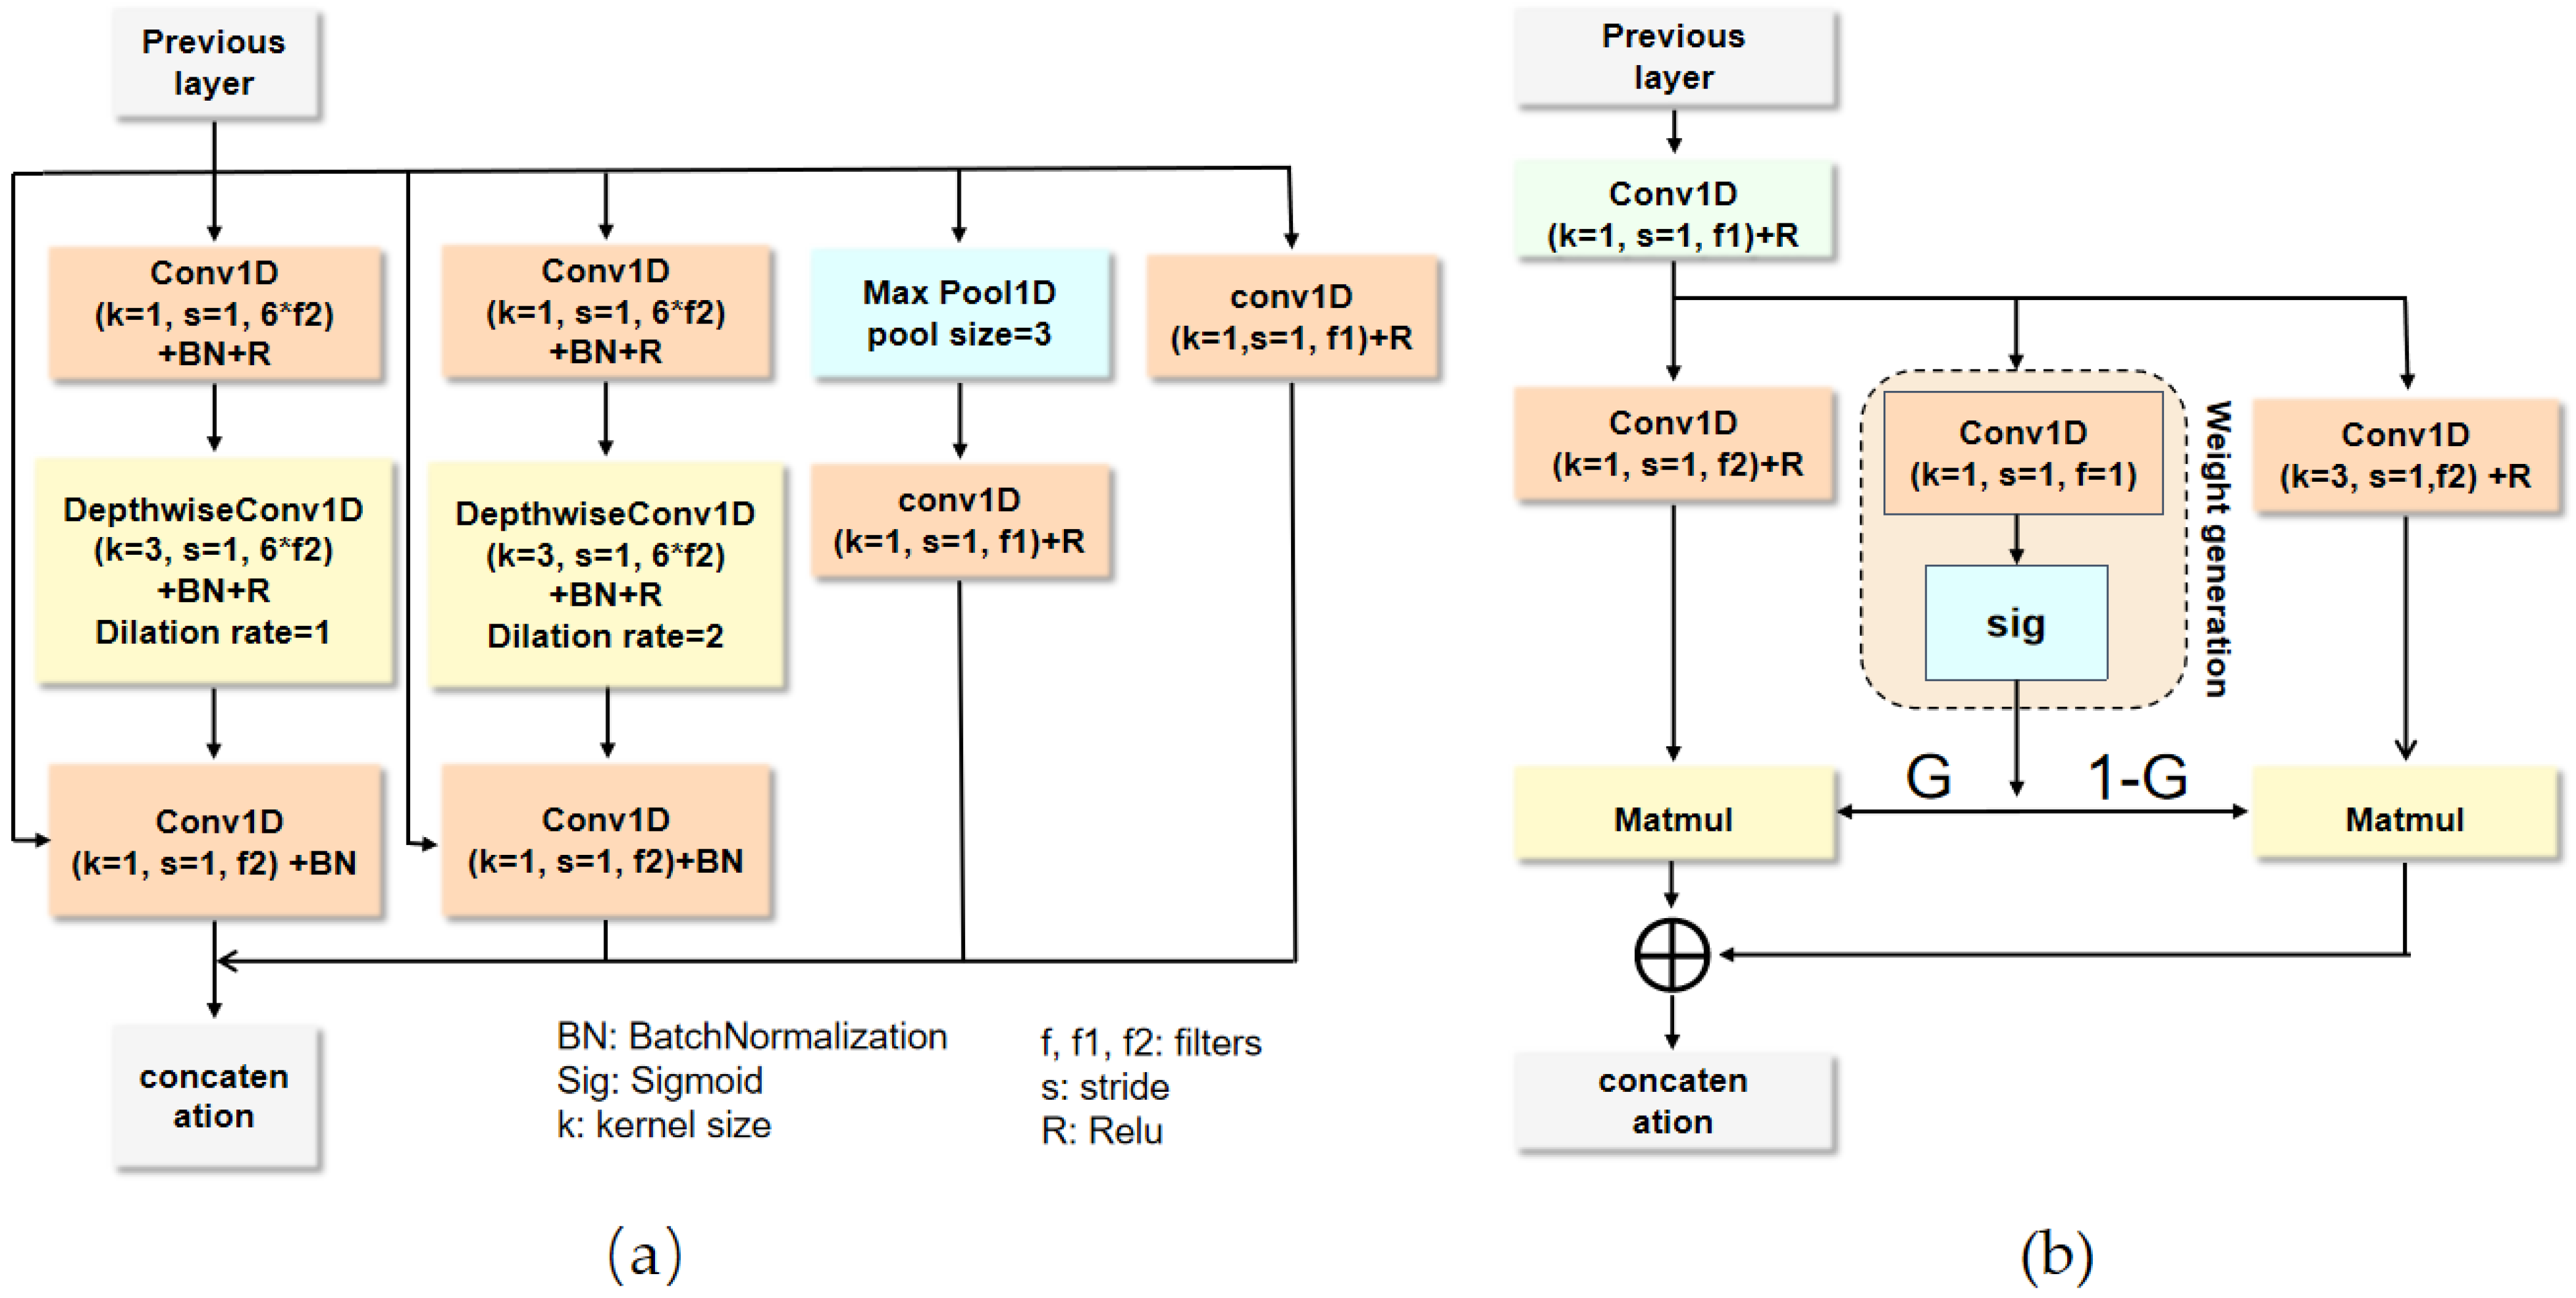
The CNNs possess strong nonlinear representation capabilities and have demonstrated excellent performance in extracting features from heart sound signals. To enhance multi-scale feature extraction while maintaining computational efficiency, we propose an innovative MIR module. As illustrated in Figure 2a, this module employs an inverted residual structure that significantly improves both model efficiency and representational capacity through strategic channel manipulation and depthwise separable convolution. The key advantage of the inverted residual design lies in its “expansion before compression” inverted structure, which performs efficient and high-fidelity nonlinear feature transformations in a carefully designed high-dimensional space. This is followed by linear projection and lossless shortcut connections, ultimately achieving powerful feature representation capabilities and efficient information flow with minimal computational overhead.
Let the input tensor be denoted as X R L × C i n , where L represents the sequence length and C i n indicates the number of input channels. The expansion layer first projects the input into a higher-dimensional feature space through a 1 × 1 convolution, where the number of output channels becomes C exp = t × C i n with the expansion factor t. This is followed by batch normalization and ReLU activation to stabilize and enhance feature representation. The transformation is formally defined as
X exp = Re L U ( B N ( C o n v 1 D 1 × 1 ( X ; W exp ) ) )
where W exp R 1 × 1 × C i n × C exp denotes the convolutional kernel of the expansion layer. The expanded features are then processed through depthwise separable convolution to efficiently capture multi-scale features while reducing computational complexity. The depthwise convolution applies a dilated filter with a rate d to extract multi-scale features, followed by batch normalization and ReLU activation. The pointwise convolution subsequently performs channel-wise fusion and dimensionality reduction. These operations are expressed as
X d w = Re L U ( B N ( D e p t h w i s e C o n v 1 D ( X exp ; W d w , d ) ) )
X p w = B N ( C o n v 1 D 1 × 1 ( X d w ; W p w ) )
where W d w R K × 1 × C exp is the depthwise convolution kernel of size K, and W p w R 1 × 1 × C exp × C o u t projects features to the output dimension C o u t . To facilitate gradient propagation and preserve original feature information, a residual connection is incorporated. This residual design enhances training stability and enables effective learning of complex heart sound representations.
To improve feature extraction capabilities, the MIR module captures features of different scales by using parallel convolution branches. The MIR module contains depthwise separable convolution, which boosts the model’s computational efficiency. Specifically, the convolution branch with a convolution kernel of 1 can efficiently adjust the number of channels and introduce nonlinearity. The pooling branches highlight important features through max pooling and adjust the number of channels through 1 × 1 convolution. Two inverse residual branches are employed, with dilation rates set to 1 and 2, respectively, to capture local features and broader contextual information. The dilation rates of 1 and 2 were selected to produce complementary receptive fields along the feature dimension. A dilation rate of 1 provides a narrow local receptive field that captures interactions among closely related acoustic descriptors, enhancing the sensitivity to fine-grained spectral variations that may correspond to subtle pathological cues. In contrast, a dilation rate of 2 broadens the receptive field to integrate relationships among more distant feature elements, allowing the network to capture global spectral dependencies and system-level patterns that characterize the overall heart sound morphology. This dual-scale configuration aligns with the characteristic frequency range of heart sounds (predominantly below 150 Hz) and enables the MIR module to model both localized discriminative patterns and broader acoustic contexts, thereby enhancing the model’s capacity to capture both specific pathological indicators and the general acoustic signature of heart sounds. Finally, the outputs from all branches are combined through concatenation to integrate feature information across different scales. The MIR module output layer can be represented as:
Y = C o n c a t e n a t e ( Y i n v r e s 1 , Y i n v r e s 2 , Y p o o l , Y c o n v 1 )
where Y i n v r e s 1 , Y i n v r e s 2 , Y p o o l and Y c o n v 1 are the inverse residual branch with an expansion rate of 1, the inverse residual branch with an expansion rate of 2, the pooled branch, and the convolution branch with a convolution kernel of 1, respectively. This multi-scale inverted residual design not only significantly improves computational efficiency but also effectively integrates multi-scale feature information through feature concatenation, thereby substantially enhancing the model’s capability to extract complex patterns in heart sound signals.

3.4.2. Dynamically Gated Convolution Module

To enhance the model’s ability to capture relationships between features, we propose the DGC module. As illustrated in Figure 2b, this module employs parallel multi-scale convolutions and an adaptive gating mechanism, enabling the network to dynamically fuse feature representations with varying receptive fields. Let the input feature map be X R L × C i n , where L denotes the sequence length and C i n represents the number of input channels. First, a squeeze operation reduces the feature dimensionality to decrease computational cost while guiding the network to focus on global information,
X c = B N ( C o n v 1 D 1 × 1 ( X ; W c ) )
Here, the squeeze convolution kernel W c R 1 × 1 × C i n × C c o m p reduces the number of channels to C c o m p = C i n r , where r is the compression ratio. The compressed feature X c R L × C c o m p is then fed into two parallel convolutional branches. Among them, a smaller convolution kernel ( K 1 ) is used to extract fine-grained local features, and a larger convolution kernel ( K 2 ) is used to aggregate global background information. The convolution operation of two branches can be represented as
X l e f t = Re L U ( C o n v 1 D ( X c ; W l e f t , K 1 ) )
X r i g h t = Re L U ( C o n v 1 D ( X C ; W r i g h t , K 2 ) )
where W l e f t R K 1 × 1 × C o u t and W r i g h t R K 2 × 1 × C o u t are the convolution weights for the left and right branches, respectively.
To adaptively recalibrate channel-wise feature responses, a gating mechanism is introduced. This mechanism generates a gating signal via a sigmoid activation function, allowing the network to emphasize features significantly influencing prediction outcomes while suppressing less relevant ones. The expression can be expressed as
G = σ ( C o n v 1 D 1 × 1 ( X c ; W g ) )
Here, W g R 1 × 1 × C c o m p × C o u t denotes the gating convolution weights, σ represents the sigmoid activation function, and the output gating tensor is. Finally, the output of the DGC module is obtained by dynamically fusing G R L × C o u t the features from the two branches using the gating weights. The expression can be expressed as
X o u t = G X l e f t + ( 1 G ) X r i g h t
where ⊙ denotes element-wise multiplication. This design enables the network to dynamically adjust the contributions of features at different scales, significantly enhancing the recognition and understanding of heart sound characteristics. The incorporation of the gating mechanism not only improves feature expression capability but also allows the model to adaptively select the most relevant feature scales based on the input content.
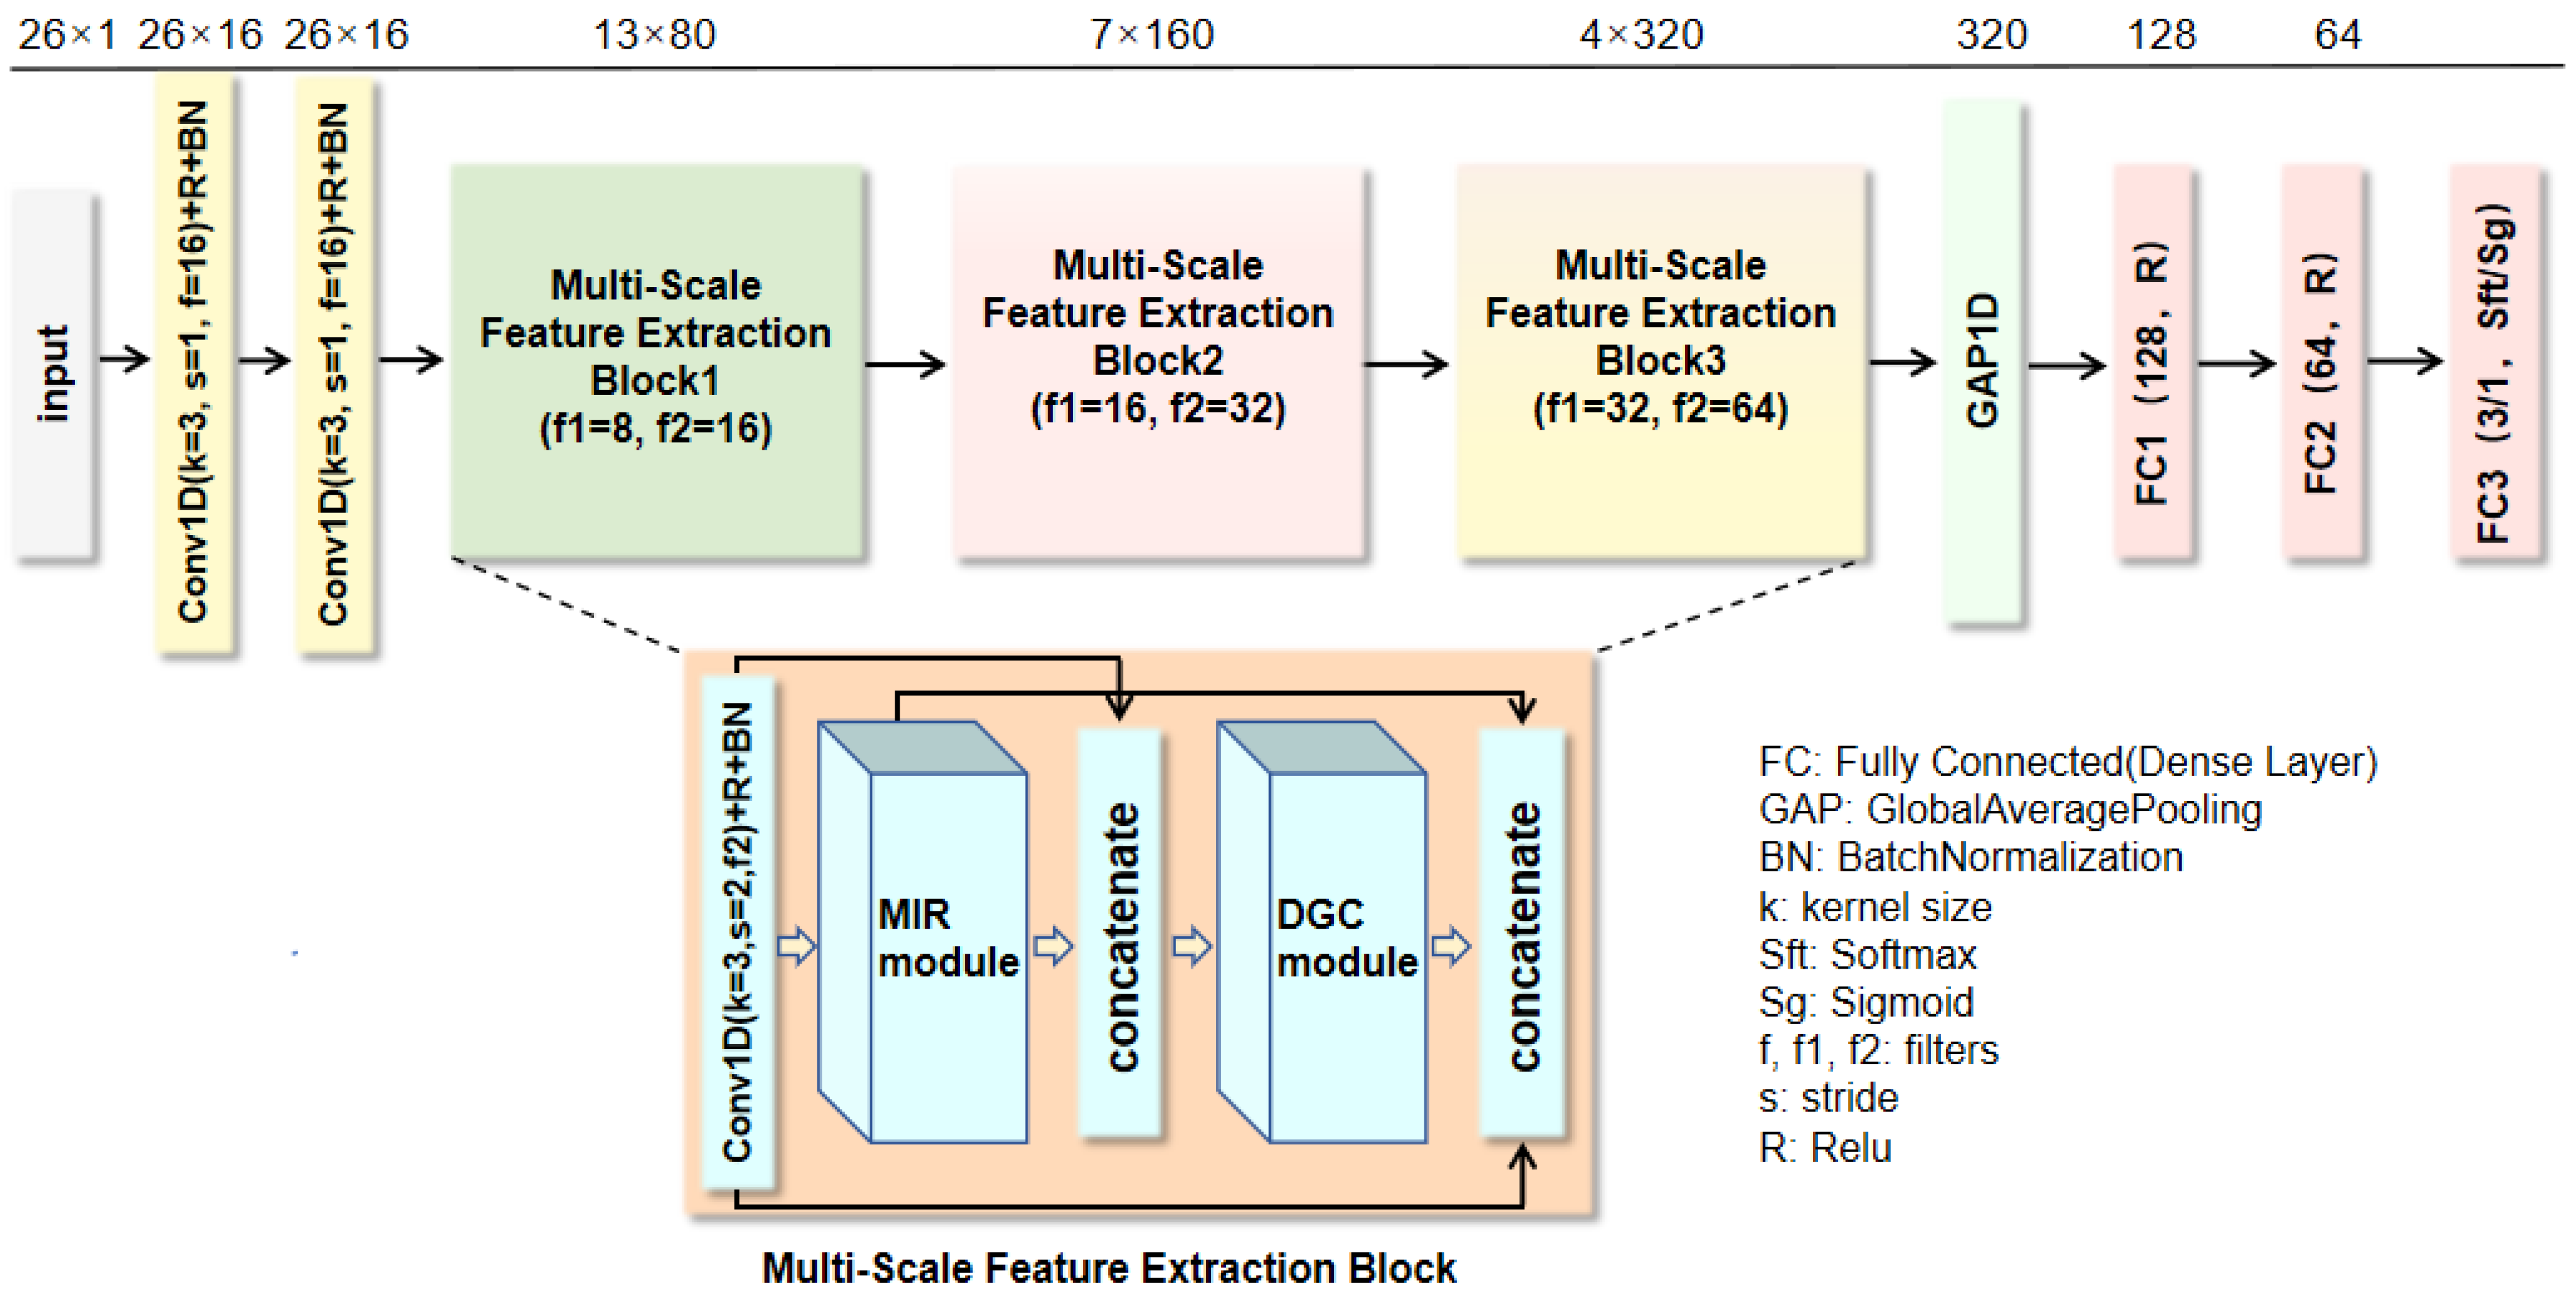
The MFENet architecture proposed in this study is shown in Figure 3, with its design core being the multi-scale feature extraction block. In this network architecture, the input data is first subjected to preliminary processing through a series of one-dimensional convolutional layers, activation functions, and batch normalization layers to generate initial feature mappings. Subsequently, these feature mappings are fed into the multi-scale feature extraction block composed of MIR modules and DGC modules. Within this block, the feature maps are first processed through one-dimensional convolutional layers, batch normalization, and activation functions. The processed feature maps are then sent to the MIR module for feature extraction. Following this, the feature maps extracted by the MIR module are concatenated with the initial feature maps that have been processed through one-dimensional convolution, batch normalization, and activation functions through the first concatenation operation. The concatenated feature maps are then fed into the DGC module to capture the relationships between features further. The output of the DGC module, along with the output feature maps from the MIR module and the initial feature maps processed through one-dimensional convolution, batch normalization, and activation functions, are concatenated through the second concatenation operation. This process effectively integrates the feature information extracted by different modules, enabling the network to extract heart sound features and capture the relationships between features, thereby enhancing the expressive power of the features. After being processed through three consecutive multi-scale feature extraction blocks, the feature maps are passed to the global average pooling layer to generate a compact feature vector. This feature vector is then fed into the fully connected layer and processed using sigmoid or softmax activation functions. Finally, we extract the deep features from the second fully connected layer (FC2) of the trained MFENet. This layer (FC2) is chosen because it summarizes the information obtained from the previous layers. Subsequently, the extracted deep features are classified using the MAPNet mentioned later.

3.5. Multi-Scale Attention Prediction Network

Multi-Scale Attention Module

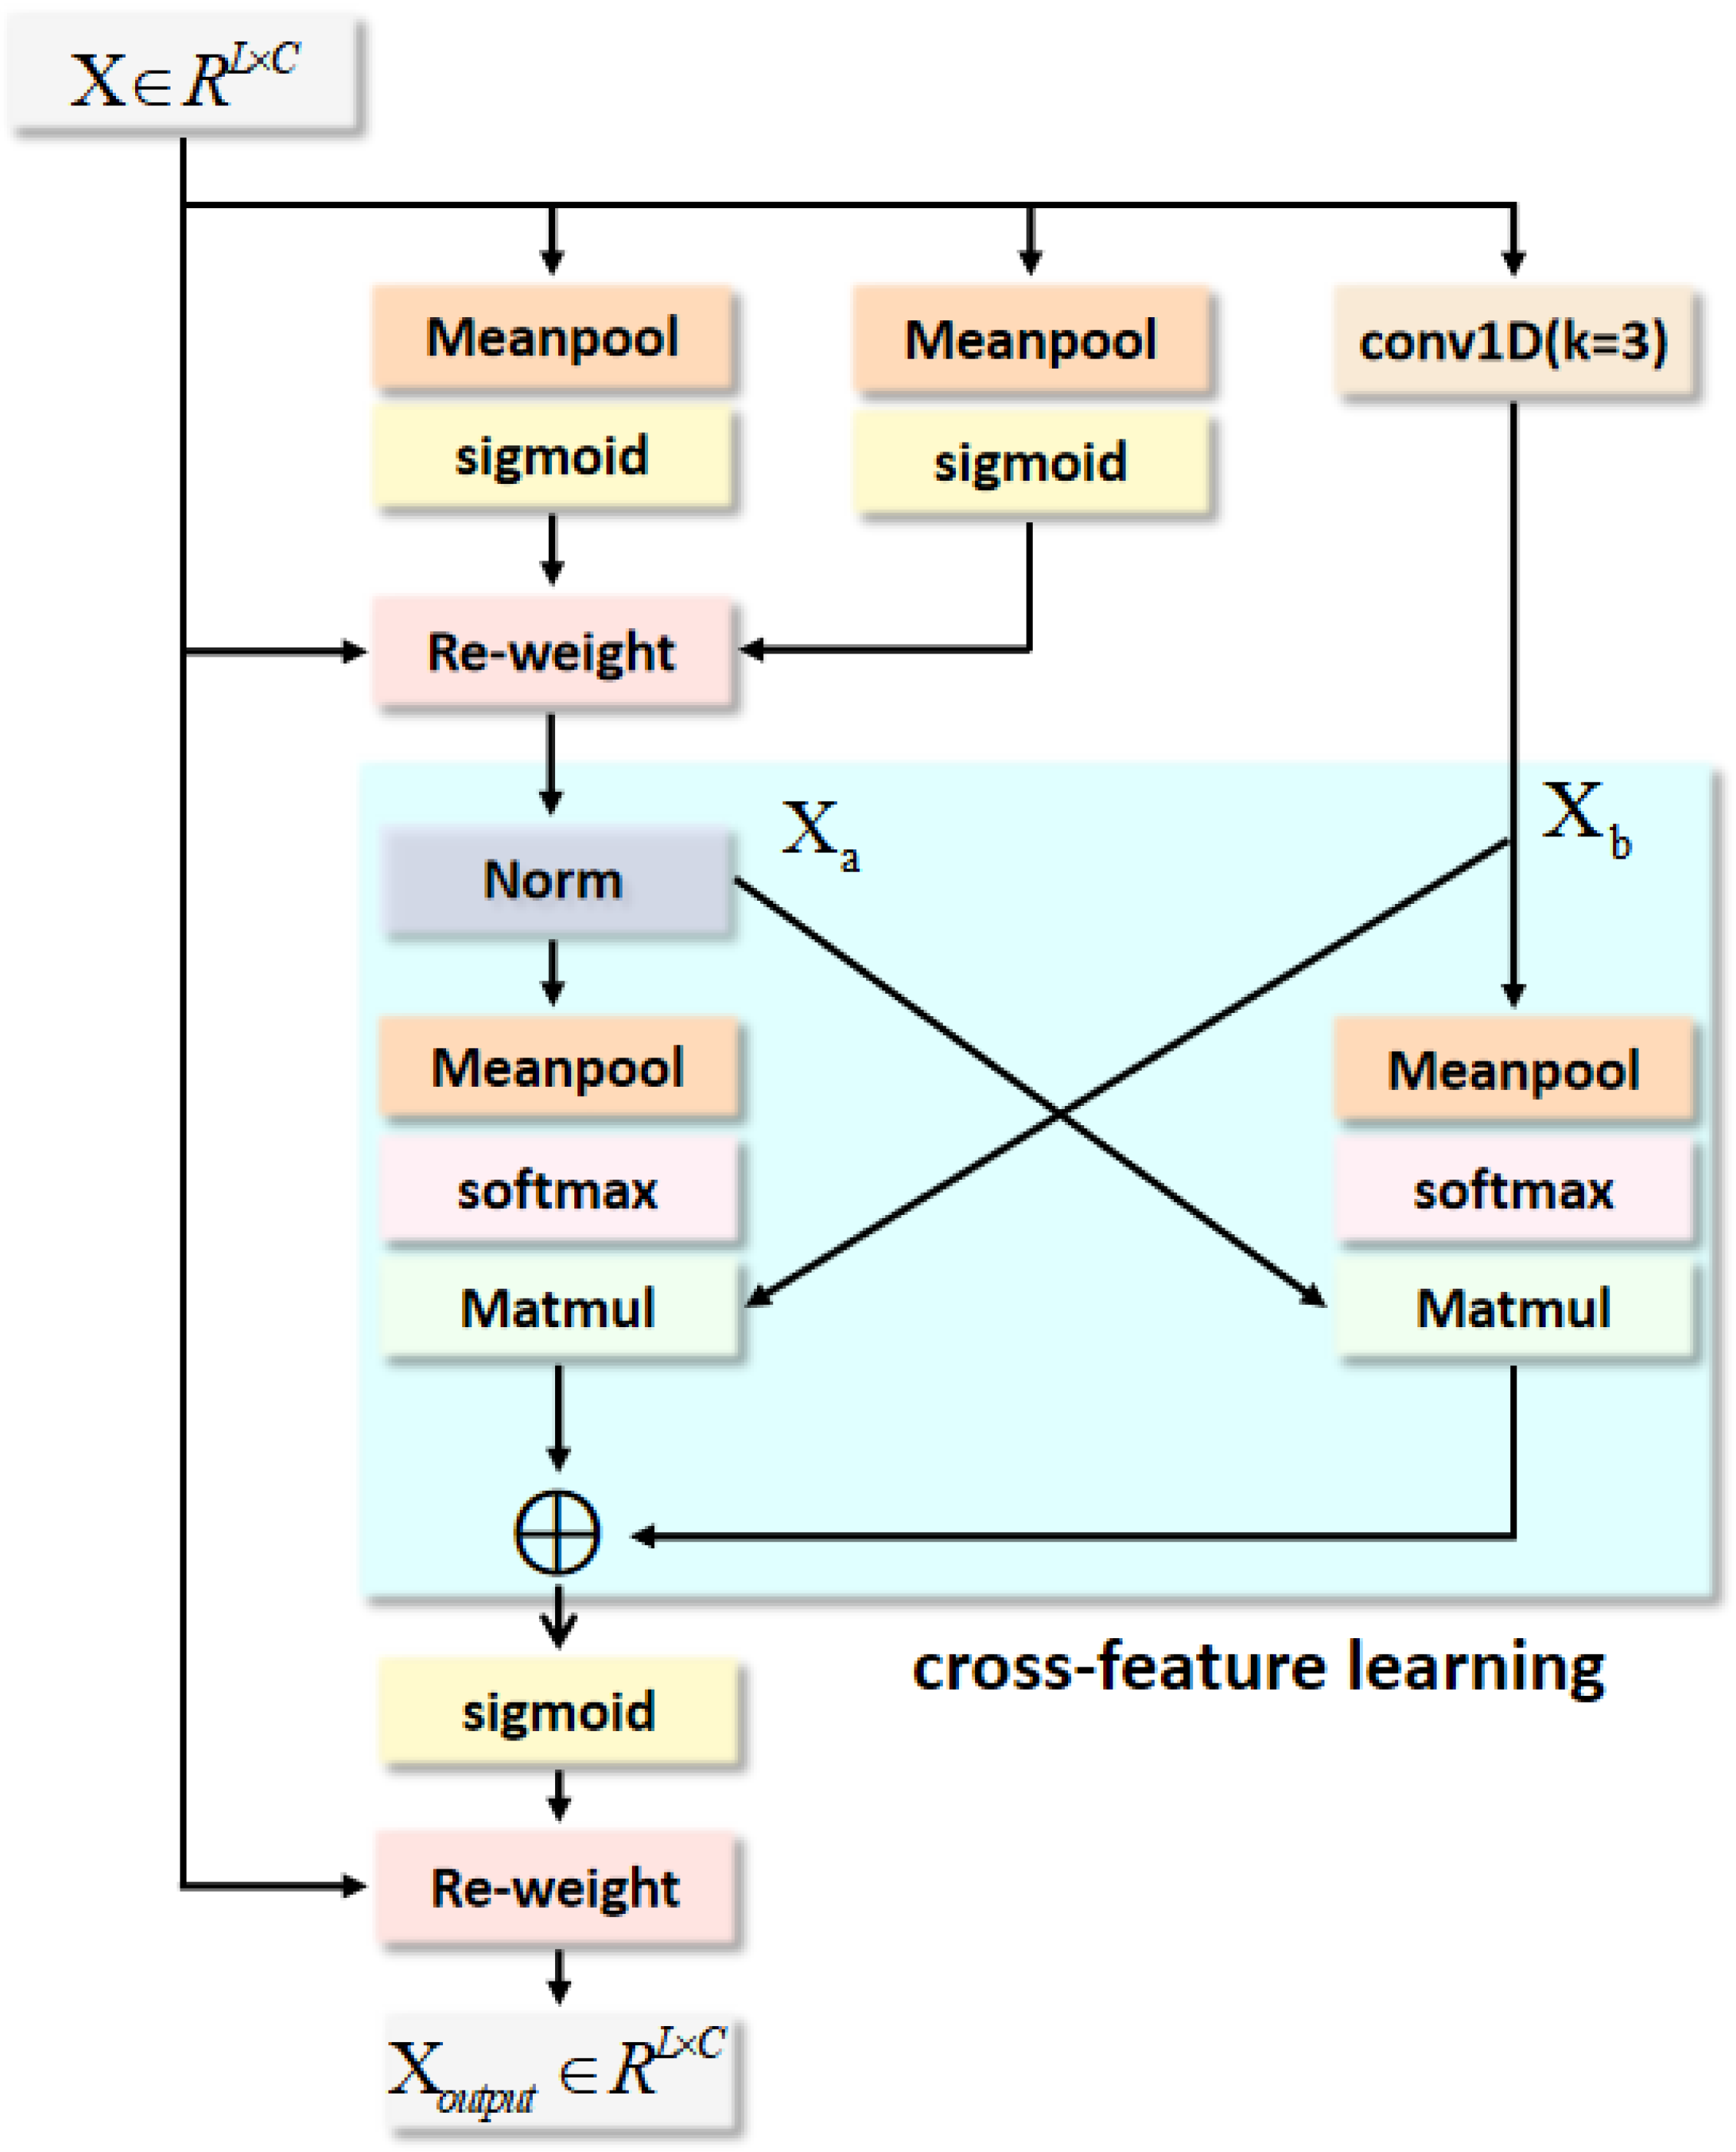
The attention mechanism allows the model to adaptively focus on the crucial features of the heart sound signal, thereby enhancing classification accuracy. In this study, we designed an attention module, as depicted in Figure 4. The input feature map is initially sent into three parallel branches. The first branch performs average pooling at each sequence position of the feature map and then, through a sigmoid activation function, captures the global feature of each position in the sequence. The second branch performs average pooling across each channel of the feature map and then uses the sigmoid activation function to derive the corresponding channel descriptors. By utilizing the first and second branches, important features are captured across different dimensions. Let the input be X R L × C , which is obtained by processing the one-dimensional deep feature (extracted from the second fully connected layer (FC2) of MFENet) through the circular convolution and concatenation operations described below. The operations of the first and second branches can be expressed as
B r a n c h 1 = 1 1 + exp ( ( 1 L i = 1 L X i , c ) ) c = 1 C
B r a n c h 2 = 1 1 + exp ( ( 1 C c = 1 C X i , c ) ) i = 1 L
Then the input feature is reweighted to generate the weighted feature X a R L × C , which can be represented as
X a = X b r a n c h 1 b r a n c h 2
Figure 4. Proposed multi-scale attention module.
Electronics 14 04092 g004
The third branch aggregates local feature information by applying a convolution. After convolution, the output X b R L × C is obtained. The convolution operation can be represented as
X b = C o n v 1 D ( X , W )
where W R 3 × C × C are the convolution weights.
To achieve richer feature aggregation, the module introduces a multi-scale attention fusion mechanism based on global representation X a and local representation X b . Specifically, the mechanism first performs average pooling on the global features and then applies softmax to obtain the normalized channel descriptors X 1 R 1 × C , with the expression as follows:
X 1 = S o f t max ( A v g P o o l ( N o r m ( X a ) ) )
Then, the matmul operation on the left side of Figure 4 is executed, multiplying X 1 R 1 × C and X b R L × C to generate the global-scale attention representation Y 1 R L × 1 . The expression is given as
Y 1 = X b × X 1
Consistent with the above operation, the local feature information of the right branch is encoded by applying the average pooling layer to obtain X 2 R 1 × C , and then the normalized channel descriptors are obtained using softmax. Subsequently, the matmul operation on the right side of Figure 4 is executed, multiplying X 2 R 1 × C with the input from the left branch X a R L × C to obtain the local-scale attention representation Y 2 R L × 1 . The expression is given as
Y 2 = X a × X 2
The module generates attention representations at different scales through dual pathways, then fuses the two complementary types of information using a feature summation strategy to obtain a more comprehensive and complementary feature representation, as shown in the following expression:
Y s u m = Y 1 + Y 2
Finally, the original input features are adaptively calibrated through a Sigmoid gating mechanism, which generates gating weights based on the fused global and local feature representations. This mechanism selectively enhances the original input, emphasizing important features while suppressing redundant information, as expressed by the following equation:
X o u t p u t = X σ ( Y s u m )
By combining multi-scale attention across global and local feature representations, the module effectively enhances the model’s sensitivity to both global dependencies and local details in heart sound signals, improving its ability to accurately identify pathological patterns.
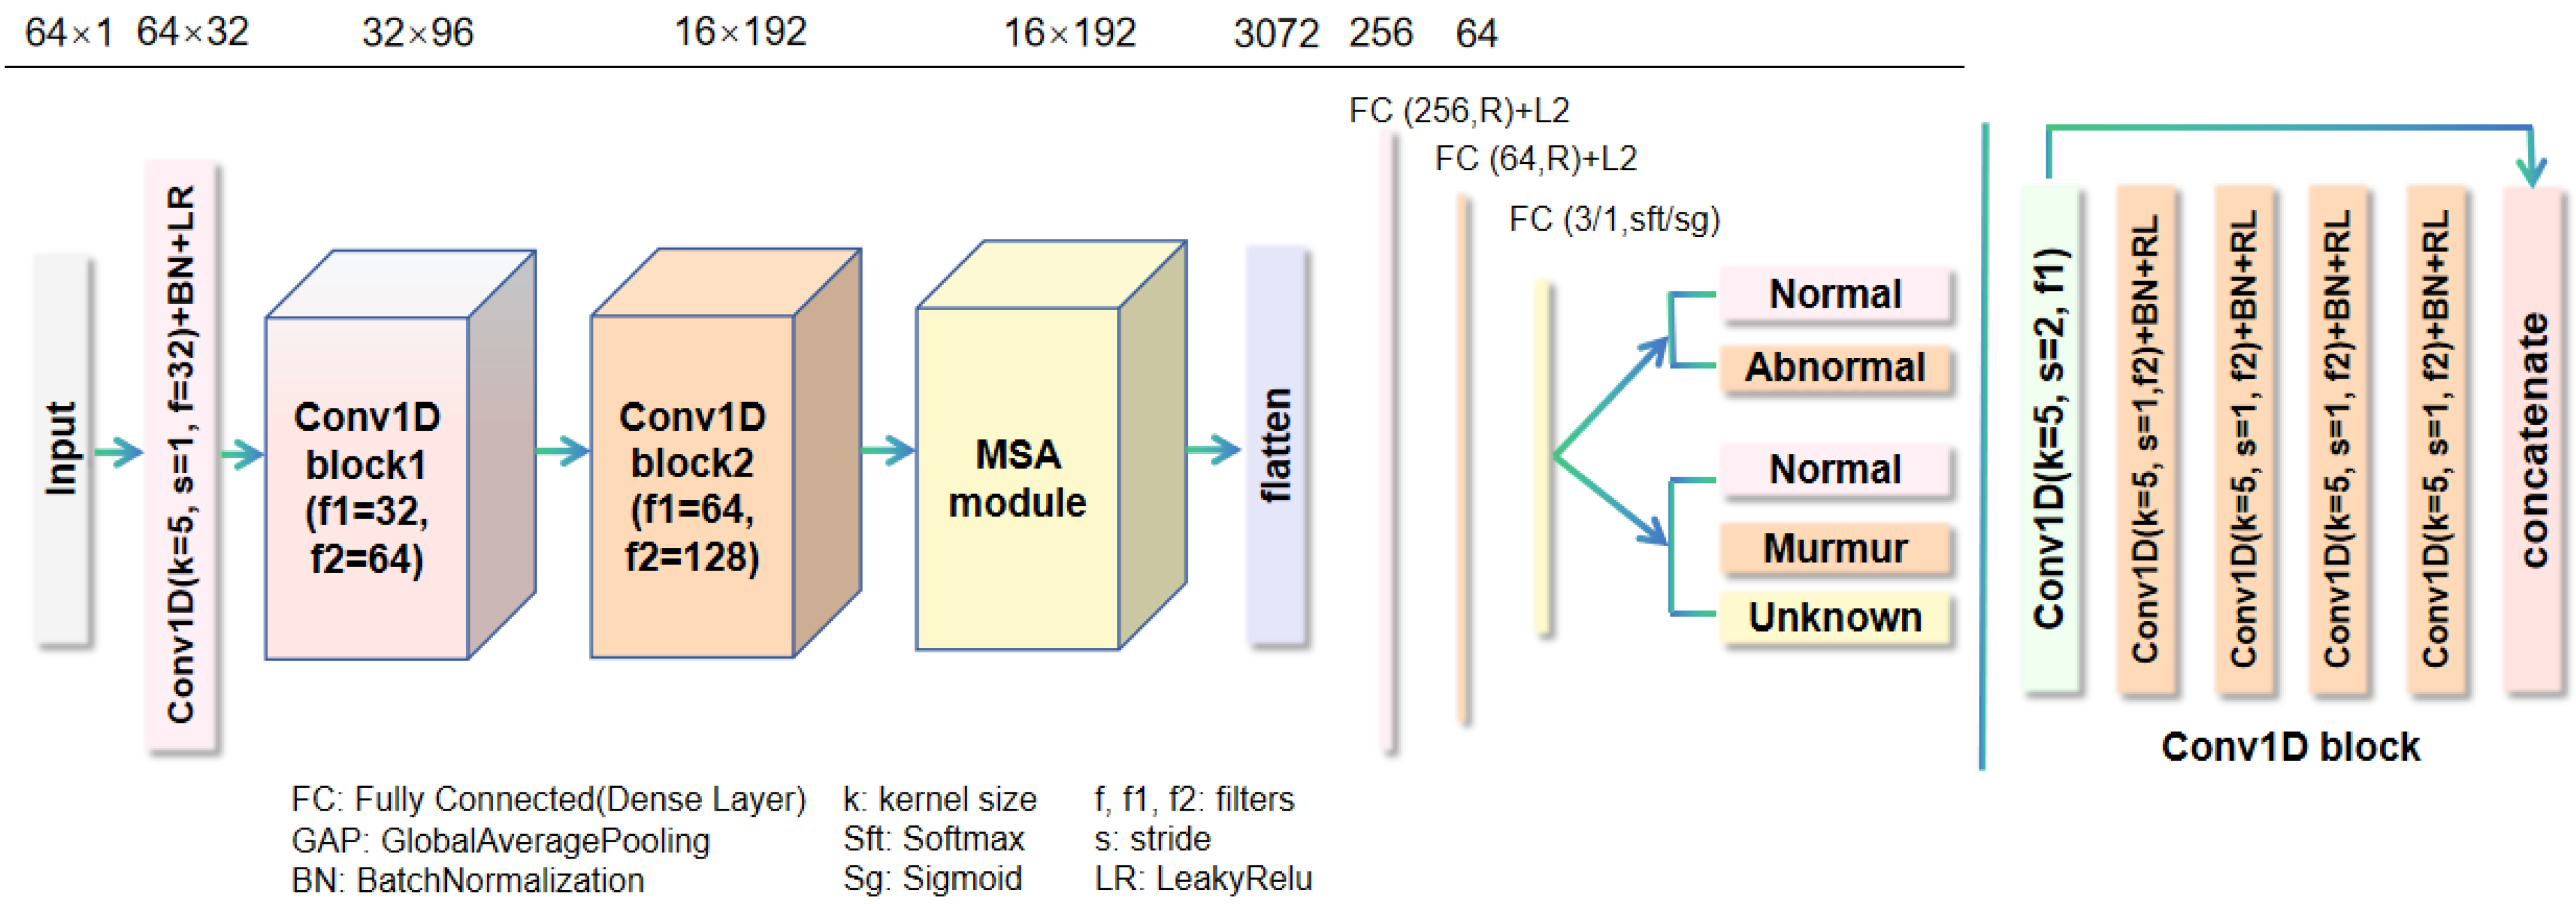
The MAPNet introduced in this paper is depicted in Figure 5, and it is composed of convolution operations and an MSA module. First, circular convolution and normalization operations are applied to the one-dimensional deep features extracted from the second fully connected layer (FC2) of MFENet to further refine and enhance these features. Concatenation operations are also employed to integrate features from different stages, thereby strengthening the network’s expressive capability and yielding an L × C feature. Subsequently, this feature is fed into the MSA module, which can effectively focus on the characteristics beneficial for heart sound recognition tasks while eliminating unnecessary information and redundancy. Finally, a flattened layer converts the multi-dimensional features into a single-dimensional vector, which is subsequently processed by three fully connected layers designed for heart sound classification. L2 regularization is utilized in the first two fully connected layers to avoid overfitting and enhance the model’s generalization capacity [45]. The expression of the L2 regularization technique is as follows:
J ( w , b ) = 1 2 m i = 1 m ( f w , b ( x ( i ) ) y ( i ) ) 2 + λ 2 m j = 1 n w j 2
where f w , b ( x ( i ) ) is the hypothesis function for predicting the output, w is the model parameter, x ( i ) represents the ith input vector, y ( i ) represents the ith actual output, m denotes the number of training samples, n denotes the count of features, and λ is the regularization parameter for controlling the regularization intensity.

3.6. Evaluation Criteria

In this study, we employed a comprehensive set of performance metrics to evaluate the model, which are well-suited for handling imbalanced classification problems. These include specificity, sensitivity (recall), F1-score, the area under the receiver operating characteristic curve (AUC), the Matthews Correlation Coefficient (MCC), and the geometric mean (G-mean). The selection of these metrics is intended to provide a robust and detailed assessment of the model’s discriminative ability across both majority and minority classes.
Given the substantial class imbalance in the PhysioNet/CinC 2022 dataset (2391 normal samples vs. 616 murmur samples), particular emphasis was placed on metrics that remain informative under such conditions. Sensitivity and specificity provide insights into class-wise performance, while the F1-score balances the trade-off between precision and recall. AUC summarizes the model’s performance across all classification thresholds. To further enhance interpretability and statistical robustness, we also included MCC, which accounts for all four components of the confusion matrix and is especially well-suited for imbalanced contexts, and G-mean, whose definition varies according to the classification setting: In binary classification, G-mean is defined as the geometric mean of sensitivity and specificity, whereas in multi-class classification, it is defined as the geometric mean of the sensitivity (recall) across all classes. Both definitions offer a comprehensive view of balanced classification performance. The mathematical definitions of MCC and G-mean are as follows:
M C C = T P × T N F P × F N ( T P + F P ) ( T P + F N ) ( T N + F P ) ( T N + F N )
G m e a n b i n a r y = S e n s i t i v i t y × S p e c i f i c i t y
G m e a n m u l t i c l a s s = ( i = 1 C S e n s i t i v i t y i ) 1 / C
where T P , T N , F P and F N represent true positives, true negatives, false positives, and false negatives, respectively, and C denotes the number of classes. It should be noted that we did not apply explicit imbalance mitigation strategies such as class weighting, oversampling (e.g., SMOTE), or undersampling during training. This decision was made to preserve the natural distribution of the dataset and avoid potential artifacts introduced by synthetic resampling. Instead, the robustness of the proposed model against class imbalance is reflected in the balanced sensitivity and specificity as well as the high MCC and G-Mean values, which confirm that the model does not overly bias toward the majority class. All reported results were obtained through stratified five-fold cross-validation to ensure reliable and reproducible evaluation.

3.7. Experimental Setup

The model uses the TensorFlow (Google, Mountain View, CA, USA) v2.19.0 framework. All experiments were conducted on a single GPU NVIDIA GeForce RTX 4060 Ti (NVIDIA, Santa Clara, CA, USA) with a dedicated GPU memory of 8 GB and a CPU processor of 3.40 GHz Intel i3-13100f (Intel, Santa Clara, CA, USA). The optimizer is an Adam optimizer with a learning rate of 0.001 and uses the Binary Cross-Entropy (BCE) for binary classification tasks and the Categorical Cross-Entropy(CCE) for multi-class classification tasks as the loss function. The expressions for BCE and CCE are as follows:
L o s s B C E = 1 N i = 1 N [ y i log ( p i ) + ( 1 y i ) log ( 1 p i ) ]
where N is the number of samples, y i is the true label of the i th sample, and p i is the model’s predicted probability that the sample belongs to class i.
L o s s C C E = i = 1 K y i log ( y ^ i )
where K is the number of categories, y i is the one-hot encoding of the true label, and y ^ i is the output probability predicted by the model.

4. Results

In this section, we conduct a comprehensive ablation experiment on two public heart sound datasets to analyze our proposed model. Subsequently, the proposed algorithm is evaluated by comparing it with the state-of-the-art methods.

4.1. Ablation Study

4.1.1. Pitch-Shifting Augmentation Analysis for Heart Sound Classification

Pitch shifting is particularly suitable for heart sound analysis because it directly operates in the frequency domain while preserving the temporal structure of acoustic events. As discussed in Section 3.2, cardiac acoustic signals exhibit harmonic structures arising from pathological mechanisms such as turbulent blood flow or valvular constriction, which remain relatively stable across individuals despite variations in the fundamental frequency. A moderate semitone shift can therefore normalize inter-subject spectral variability while retaining the relative harmonic relationships that characterize pathological conditions. Based on these physiological and acoustic considerations, we selected semitone shifts of −2, −4, and −6 for evaluation. The rationale is as follows: (i) −2 semitones represent a minor adjustment to examine whether small-scale spectral normalization yields benefits; (ii) −4 semitones provide a moderate adjustment that is expected to optimally align pathological murmurs (80–200 Hz) with the human auditory sensitivity range (250–500 Hz), thereby facilitating more discriminative feature extraction; and (iii) −6 semitones serve as a stress test to examine whether excessive shifting distorts pathological cues and degrades performance.
To evaluate the impact of pitch-shifting on classification, we conducted systematic ablation experiments on both the PhysioNet/CinC Challenge 2016 and 2022 datasets. Table 2 reports the results. Using the original signals ( n = 0 ) as the baseline, the model achieved 97.66% accuracy on the 2016 dataset. After applying a −4 semitone shift, accuracy increased to 98.89% (+1.23%), while sensitivity and specificity improved by 3.63% and 0.59%, respectively. The AUC index rose by 2.18%, confirming simultaneous enhancement of both positive-case detection and negative-case exclusion. When the shift was extended to −6 semitones, accuracy declined by 0.62% compared to −4 semitones, indicating that excessive spectral deformation can disrupt pathological features. This trend was consistently observed on the 2022 dataset: −4 semitones achieved the best overall performance, with peak AUC (99.83%), while larger shifts resulted in performance degradation. Notably, both datasets demonstrated excellent and stable performance at −4 semitones, with sensitivity exceeding 97% (2016: 97.34%, 2022: 97.92%) and AUC surpassing 98% (2016: 98.3%, 2022: 99.83%). These results validate the hypothesis that moderate pitch shifting not only normalizes inter-subject variability but also preserves critical harmonic structures, thereby improving discriminative power.

4.1.2. Comprehensive Module Ablation Analysis

To systematically validate the effectiveness of our proposed MFENet and attention module, we designed six ablation experiments on the PhysioNet/CINC Challenge 2016 and 2022 datasets. The baseline (Experiment 1) uses only the CNN trunk to provide a reference. Experiments 2–4 individually add the MSA, DGC, and MIR modules, respectively, to assess the independent contribution of each module. The rationale is as follows: the MSA module adaptively recalibrates multi-scale features, the DGC module captures feature dependencies and dynamically regulates information flow, and the MIR module enriches the feature space by extracting information from different receptive fields at minimal computational cost. Experiment 5 incorporates both MIR and DGC to evaluate their complementary effect. Finally, Experiment 6 integrated all modules into the baseline to assess the overall effectiveness of the complete framework.
Table 3 presents the results on the PhysioNet/CinC Challenge 2016 dataset. It can be observed that adding each module individually enhances performance to varying degrees, confirming their effectiveness. In particular, the MIR module captures multi-scale representations, and the DGC module complements this by capturing inter-feature dependencies, resulting in an accuracy of 97.38% when both are used together. Consistent improvements are also observed in MCC and G-Mean, where the combined MIR and DGC modules yield an MCC of 91.94% and an H-Mean of 95.65%, both significantly higher than those of the single-module configurations. This demonstrates their complementary roles in strengthening feature learning.
Table 4 shows the outcomes on the PhysioNet/CinC Challenge 2022 dataset. Compared with the baseline, the integration of all modules improves accuracy from 75.59% to 98.86% (a 23.27% gain) and F1-score from 65.09% to 98.13% (a 33.04% gain). In addition, MCC increases from 50.31% to 96.98% and G-Mean from 75.51% to 97.90%, highlighting substantial improvements in both balanced classification performance and stability across classes. Notably, adding only the MSA module yields limited improvement, as attention mechanisms alone cannot effectively compensate for insufficient feature extraction. By contrast, when the MIR and DGC modules are included, the network learns rich and discriminative heart sound features. The subsequent use of the MSA module in MAPNet then ensures that the most relevant features are emphasized, thereby maximizing classification accuracy. Overall, these ablation experiments provide a clear rationale for the inclusion of each module and demonstrate how they complement one another to achieve superior performance. This systematic design verifies both the rationality and the superiority of our model.
To further validate that the performance improvements observed in the ablation study are statistically significant rather than due to random variation, we conducted a Friedman Aligned Ranking (FAR) test followed by the Finner post hoc correction on the PhysioNet/CinC Challenge 2016 dataset based on the AUC metric. As shown in Table 5, the full model configuration (CNN + MSA + MIR + DGC) achieved the lowest mean rank (1.0), indicating the best overall performance among all tested variants. The FAR results show a clear performance separation, with the baseline CNN exhibiting the highest aligned rank (18.00) and the complete model showing the lowest (3.60). Furthermore, the Finner post hoc analysis reveals that the complete model significantly outperforms both CNN + DGC (p = 0.02385) and the baseline CNN (p = 0.00071), whereas the difference compared with CNN + MIR + DGC (p = 0.30982) is not statistically significant (p > 0.05). These findings confirm that the performance gains introduced by integrating the MSA, MIR, and DGC modules are statistically meaningful and contribute substantially to the overall model effectiveness. This statistical evidence further reinforces the empirical validity of our design and supports the superiority of the complete model framework.

4.2. Comparative Experiment

To comprehensively evaluate our algorithm’s performance, we conducted comparative experiments with other advanced methods using both the 2016 and 2022 PhysioNet/CinC Challenge datasets. For fair comparison, we directly adopted the experimental results reported in the original publications. When the F1-score or sensitivity was not provided in certain studies, we rigorously calculated these metrics based on the available data from the respective papers. However, due to some literature not providing complete information, especially AUC values, the AUC comparison for the 2016 PhysioNet/CinC Challenge dataset remains incomplete. To address this, we presents a more complete AUC comparison for the 2022 PhysioNet/CinC Challenge dataset, allowing our method to be directly compared with other methods on this metric, thereby ensuring that the overall evaluation is more comprehensive and fair.
Table 6 presents the comparison results of our model with other advanced methods on the 2016 PhysioNet/CinC Challenge dataset, in which our model outperforms other state-of-the-art methods. Specifically, the accuracy, F1-score, sensitivity, specificity, and AUC of our model after five-fold cross-validation were 98.89%, 97.20%, 97.34%, 99.27%, 97.11% and 98.30%, respectively. The accuracy, F1-score, specificity, and AUC achieved the highest rankings among all comparison algorithms. Among them, SAR-CardioNet [46] achieved the third highest accuracy and F1-score by leveraging its split-self attention mechanism to enhance the capture of critical temporal features and its multi-path residual design to address gradient vanishing issues. MK-RCNN [26] employed a multi-kernel residual convolutional structure to fuse phonocardiogram features at different scales, combined with the gradient stabilization properties of residual learning, achieving the second-highest accuracy on the PhysioNet Challenge 2016 dataset. In contrast, our MFENet leverages the MIR module to learn features from diverse regions and scales at a low computational cost, while the DGC module captures the interrelationships between features and dynamically adjusts information flow to deeply extract heart sound features, overcoming the insufficient feature extraction and representation capabilities of existing networks. Subsequently, the MAPNet is employed for heart sound classification, where the MSA module acquires multi-scale features and enables cross-feature learning, allowing it to focus on subtle variations between heart sound features while integrating both global and local information. This effectively addresses the insufficient integration of global and local feature information in existing heart sound attention mechanisms. Compared with SAR-CardioBNet, our model’s accuracy improved from 96.37% to 98.89% (a 2.52% improvement), and the F1-score enhanced from 96.33% to 97.20% (a 0.87% improvement). Through comparative evaluation with MK-RCNN [26], our method achieves higher accuracy and specificity. The five-fold cross-validation results are detailed in Table 7. Specifically, the proposed model reached the highest accuracy of 99.38%, F1-score of 98.63%, MCC of 98.23%, and G-Mean of 99.12% in the three-fold cross-validation. These results strongly demonstrate the effectiveness and robustness of our model across different evaluation metrics.
To further evaluate our method’s performance, we performed an external comparison using the Wilcoxon signed-rank test and Cohen’s d effect size on the PhysioNet/CinC Challenge 2016 dataset, as summarized in Table 8. In this comparison, the proposed method achieved an AUC of 98.30%, outperforming existing methods such as MDFNet [2] and SAR-CardioBNet [46], which both achieved an AUC of 98.00%. The Wilcoxon signed-rank test revealed no significant difference between our method and these two models (p = 0.2188), with Cohen’s d of 0.331 for both, indicating a small effect size. However, compared to KNN [47], which achieved an AUC of 95.00%, our method showed a statistically significant improvement (p = 0.0313) with a large effect size (Cohen’s d = 3.637). This demonstrates that our method provides a significant performance advantage over KNN and is on par with other advanced methods, further reinforcing the robustness and reliability of our model in heart sound abnormality recognition.
Table 6. Performance comparison with other state-of-the-art methods on the PhysioNet/CinC Challenge 2016 dataset.
MethodsAccuracy (%)F1-Score (%)Sensitivity (%)Specificity (%)AUC (%)
LEPCNet [24] 93.1 ± 1.1 89.4 ± 1.6 88.9 ± 1.9 90.4 ± 1.5 -
MDFNet [2]94.4486.9089.7795.6598.00
Le-LWTNet [4]94.5086.4086.4096.60-
PU learning technique using CNN [48]94.83-94.9094.42-
DDA [16]95.1594.0595.2497.59-
Semi-supervised NMF + ABS-GP + SVM [49]95.26--95.21-
MACNN [30]95.4997.1797.3288.42-
HS-Vectors [3]95.6089.2082.0687.60-
KNN [47]95.7896.00--95.00
1D + 2D-CNN [20]96.3091.1090.6097.90-
SAR-CardioBNet [46]96.3796.3396.3790.2598.00
MK-RCNN [26]98.53-99.0898.04-
Proposed method98.8997.2097.3499.2798.30
Table 7. Our method achieved results using 5-fold cross-validation on the PhysioNet/CinC Challenge 2016 dataset.
FoldAccuracyF1-ScoreSensitivitySpecificityAUC (%)MCC (%)G-Mean (%)
(%)(%)(%)(%)
199.0797.8197.8199.4198.6197.2298.60
298.6196.0794.8399.4497.1395.2497.10
399.3898.6398.6399.6099.1298.2399.12
499.3898.5698.5699.6199.0898.1799.08
597.9994.9496.8598.2797.5693.7597.56
Average98.8997.2097.3499.2798.3096.5298.29
Table 8. External comparison with existing methods based on the AUC metric using the Wilcoxon signed-rank test and Cohen’s d effect size on the PhysioNet/CinC Challenge 2016 dataset.
MethodAUC (%)Wilcoxon p-ValueCohen’s dStatistical Significance
Proposed (Ours)98.30---
MDFNet [2]98.000.21880.331Not Significant
SAR-CardioBNet [46]98.000.21880.331Not Significant
KNN [47]95.000.03133.637Significant
To further evaluate and compare our method and verify its generalization ability, we conducted experiments on the 2022 PhysioNet/CINC challenge dataset. Table 9 shows the outcomes of our model compared with other advanced methods. Our model remains superior to other advanced methods in the field of cardiac murmur recognition. Specifically, the accuracy, F1-score, sensitivity, specificity, and AUC of our model after five-fold cross-validation were 98.86%, 98.13%, 97.92%, 98.82% and 99.83%, respectively. The accuracy, F1-score, sensitivity, specificity, and AUC all ranked first among the comparison algorithms. This comprehensive superiority in all key metrics underscores the robustness and reliability of our method in detecting cardiac murmurs, an essential task in clinical diagnostics. This comprehensive superiority in all key metrics underscores the robustness and reliability of our method in detecting cardiac murmurs, an essential task in clinical diagnostics. Among these methods, MK-RCNN achieved the second-highest overall accuracy and F1-score. Compared with MK-RCNN, the accuracy of our model improved from 98.33% to 98.86% (a 0.53% improvement), and the F1-score enhanced from 97.05% to 98.13%(a 1.08% improvement). Comparative evaluation with MK-RCNN [26] demonstrates our method’s superior performance in handling class imbalance. Notably, our model achieves a more balanced clinical performance with 97.92% sensitivity and 98.82% specificity, effectively reducing both false negatives and false positives compared to MK-RCNN [26]. The specifics of the five-fold cross-validation are detailed in Table 10. Specifically, the proposed model reached the peak accuracy of 99.21%, sensitivity of 98.80%, and specificity of 99.21% during the three-fold cross-validation, where it also achieved the highest MCC of 97.91% and G-Mean of 98.79%. In addition, the model attained the highest F1-score of 98.79% and AUC of 99.92% in the four-fold cross-validation. These outcomes strongly demonstrate the effectiveness and generalization of our model, indicating that it can maintain high accuracy and reliability across different datasets.
To evaluate the performance of the proposed method in real-world clinical settings, we conducted experiments on the ZCHSound noisy dataset. As shown in Table 11, the detailed performance metrics of the proposed method on the ZCHSound noisy dataset using five-fold cross-validation are presented. The results indicate that the model maintains strong performance on noisy data, with all core metrics averaging above 97% (average accuracy: 97.17%, F1-score: 97.14%, AUC: 97.21%, and G-Mean: 97.20%). This consistent high performance across multiple evaluation metrics highlights the robustness of the model, particularly in handling noisy inputs commonly encountered in real-world clinical environments. Importantly, the average MCC reaches 94.33%, providing a more informative measure of classification performance under class imbalance and noisy conditions. This demonstrates that the model not only achieves high predictive accuracy but also maintains strong consistency between predicted and true labels across different classes. The fluctuation range of the metrics across the five cross-validations is very small (for example, accuracy ranges from 96.83% to 98.44%). This high degree of consistency indicates that the model’s performance is not significantly affected by the randomness of data partitioning and exhibits significant stability when facing internal data diversity. Sensitivity, which is crucial for disease screening applications, averages 96.89% (with three out of five experiments exceeding 97% and one reaching 100%), indicating that the model can effectively identify positive cases in noisy environments and minimize false negatives. Meanwhile, the specificity averages as high as 97.52%, demonstrating a very low rate of false positives. This high performance on noisy data highlights the model’s capability to accurately detect positive cases and maintain robust predictive accuracy even under challenging real-world conditions, which is essential for clinical applications where noise is ubiquitous.
In order to better visualize the classification performance, we provide the confusion matrices for the three-fold test datasets in the five-fold cross-validation of our model on the 2016 and 2022 PhysioNet/CinC Challenge datasets, as shown in Table 12. In Table 12a, for the 2016 dataset, 500 out of 502 healthy subjects were correctly predicted (accuracy: 99.60%), and 144 out of 146 abnormal subjects were correctly identified (accuracy: 98.63%). The misclassified cases mainly involved two normal subjects incorrectly predicted as abnormal and two abnormal subjects misclassified as normal. These errors may be attributed to borderline pathological signals, where murmur intensity is weak or masked by noise, making them acoustically similar to normal patterns. Table 12b presents the confusion matrix of the 2022 dataset. Among 484 normal samples, 483 were correctly predicted (accuracy: 99.79%). Of the 118 murmur samples, 114 were classified correctly (accuracy: 96.64%), while 3 were misclassified as normal and 1 as an unknown murmur. The misclassified murmur cases are likely due to the subtlety of pathological acoustic features, particularly when murmurs overlap with respiratory noise or occur intermittently, reducing their spectral distinctiveness. Importantly, all 31 samples of unknown murmur were correctly predicted (100%), suggesting that the model effectively distinguishes this class despite its limited sample size. Overall, the confusion matrices not only highlight the excellent diagnostic capability of our model but also reveal that most misclassifications occur between normal and murmur/abnormal categories. This suggests that enhancing sensitivity to subtle pathological cues, such as low-intensity or transient murmurs, could further reduce error rates and improve clinical reliability.
To further demonstrate the diagnostic ability of our network for heart abnormalities, we provide the receiver operating characteristic (ROC) curves for the 2016 and 2022 PhysioNet/CinC Challenge datasets under five-fold cross-validation, as shown in Figure 6. For the 2016 dataset (Figure 6a), the ROC curves of all five folds are presented with their respective AUC values. The AUC values range from 97.13% (Fold 2) to 99.12% (Fold 3), with a mean AUC of 98.30%. This small fluctuation range illustrates the stability and robustness of our model across different data partitions. Misclassifications in this dataset primarily occurred between normal and abnormal classes, likely due to weak murmurs that blur the acoustic distinction between these categories. This challenge emphasizes the need for fine-grained feature extraction and the importance of robust models that can capture subtle variations in heart sounds, which are often critical for accurate classification. The model’s high stability across folds indicates that it is not sensitive to particular data splits, further reinforcing its reliability. For the 2022 dataset (Figure 6b–f), the average AUCs reached 99.78% for normal, 99.77% for murmur, and 99.95% for unknown, yielding an overall mean of 99.83%. The few misclassifications were primarily murmur samples mislabeled as normal or unknown, likely caused by subtle murmurs or overlapping respiratory noise. Overall, the ROC curves not only highlight the strong diagnostic capability of our model but also demonstrate its stability across folds and robustness in handling different categories. The in-depth analysis of misclassified cases further suggests that enhancing sensitivity to weak or transient murmurs, along with refining the detection of subtle heart sound variations, could reduce errors and improve clinical applicability, enabling more reliable and accurate diagnosis in real-world settings.
To provide a more comprehensive evaluation of computational efficiency and practical applicability in clinical scenarios, we compared the model parameters, FLOPs, and average inference time of our proposed method with baseline approaches, as presented in Table 13. The proposed method achieves the highest classification accuracy (98.89%), surpassing LEPCNet (93.1%) and MK-RCNN (98.53%). In terms of computational complexity, our model has 1.57M parameters and 22.53M FLOPs, which are higher than those of LEPCNet (52.7K parameters, 1.6M FLOPs) but comparable to MK-RCNN (217K parameters). Importantly, the proposed method requires an average inference time of only 98.1 ms per recording, which is sufficiently low for real-time or near real-time deployment in clinical and wearable auscultation devices. These results demonstrate that, despite a moderate increase in model size, the MIR-enhanced architecture achieves a favorable trade-off between accuracy and efficiency, ensuring both high diagnostic reliability and practical feasibility in resource-constrained environments.
5. Conclusions

In this study, we present a neural network model designed for heart sound detection, leveraging multi-scale feature extraction and attention mechanisms. The model incorporates pitch-shifting technology for preprocessing heart sounds, followed by initial feature extraction using a variety of feature extraction techniques. Subsequently, MFENet is employed to further extract heart sound features, while MAPNet is utilized for classification. The MFENet architecture includes the MIR module and the DGC module, which together enable efficient feature learning across different regions and scales and dynamically adjust information flow to capture richer and more abstract features. The MAPNet, primarily composed of an MSA module, focuses on features that are conducive to heart sound recognition through multi-scale feature capture and cross-feature learning. Our comprehensive evaluation demonstrates that the proposed model achieves high accuracy in detecting abnormal heart sounds and cardiac murmurs. Specifically, it attains 98.89% accuracy for abnormal heart sound detection on the PhysioNet/CinC 2016 dataset and 98.86% accuracy for cardiac murmur detection on the PhysioNet/CinC 2022 dataset. These results are comparable to state-of-the-art methods, as evidenced by our model’s superior performance across key metrics, including accuracy, F1-score, specificity, and AUC.
While our model demonstrates high accuracy, we acknowledge several limitations in our current approach. Firstly, our model’s ability to distinguish between specific types of cardiac abnormalities, such as valvular heart disease and ventricular septal defects, is not fully explored. This limitation is significant, as differentiating between these conditions is crucial for clinical diagnosis. Additionally, our model’s performance across different demographic groups, such as children and adults, has not been thoroughly evaluated. This gap is important because heart sound characteristics can vary significantly between these groups, potentially affecting the model’s generalizability. Moreover, the model’s multimodal generalizability has not been addressed. Our study focuses solely on heart sound classification and does not discuss how the model can be integrated with other physiological signals, such as electrocardiograms, or adapted to different recording devices, such as digital stethoscopes and smartphone microphones. These considerations are essential for the model’s practical application in clinical settings.
In future work, we plan to address these limitations by exploring the integration of our model with other medical imaging and physiological signal analysis techniques. Specifically, we aim to combine heart sound analysis with electrocardiogram data and other relevant medical imaging modalities to achieve a more comprehensive diagnosis of heart disease. This multimodal approach will help distinguish between specific types of cardiac abnormalities and improve the overall accuracy and reliability of the model. We will also investigate the model’s performance across different demographic groups, including children and adults, to ensure robustness and generalizability. This will involve collecting and analyzing heart sound data from diverse populations to identify and address any performance disparities. Furthermore, we will explore the practical application of the model in real clinical settings. We plan to collaborate with medical institutions to conduct large-scale clinical trials, which will allow us to evaluate the model’s performance in real-world scenarios and verify its effectiveness and safety. This collaboration will also provide valuable insights into the model’s adaptability to different recording devices and clinical workflows. By addressing these limitations and expanding the scope of our research, we aim to develop a more comprehensive and clinically relevant heart sound detection model that can contribute significantly to the diagnosis and management of heart disease.

Author Contributions

Conceptualization, P.Y. and Y.Y.; methodology, P.Y.; software, P.Y.; validation, P.Y., M.D. and Y.Y.; formal analysis, P.Y.; investigation, Y.Y.; resources, M.D.; data curation, P.Y.; writing—original draft preparation, P.Y.; writing—review and editing, P.Y.; visualization, P.Y.; supervision, M.D.; project administration, M.D.; funding acquisition, M.D. All authors have read and agreed to the published version of the manuscript.

Funding

This research was funded by the Major Science and Technology Projects in Yunnan Province under Grant 202302AG050009.

Data Availability Statement

The original contributions presented in this study are included in the article. Publicly available datasets were analyzed in this work, which can be accessed at: https://physionet.org/challenge/2016, https://physionet.org/content/circor-heart-sound/1.0.3 and http://zchsound.ncrcch.org.cn/ (accessed on 15 October 2025).

Conflicts of Interest

The authors declare no conflicts of interest.

Abbreviations

The following abbreviations are used in this manuscript:
MFENetMulti-Scale Feature Extraction Network
MIRMulti-Scale Inverted Residual
DGCDynamically Gated Convolution
MAPNetMulti-Scale Attention Prediction Network
MSAMulti-Scale Attention
MFCCsMel-Frequency Cepstral Coefficients
CNNsConvolutional Neural Networks
SVMsSupport Vector Machines
RFsRandom Forests
K-NNK-Nearest Neighbors
MCCMatthews Correlation Coefficient
G-meanGeometric Mean
CFChroma Feature
SBSpectral Bandwidth
ZCRZero Crossing Rate
RMSERoot Mean Square Energy
SRSpectral Roll-Off
SCSpectral Centroid
STFTShort-Time Fourier Transform
AUCArea Under the ROC Curve
BCEBinary Cross-Entropy
CCECategorical Cross-Entropy

References

  1. Abbas, S.; Ojo, S.; Al Hejaili, A.; Sampedro, G.A.; Almadhor, A.; Zaidi, M.M.; Kryvinska, N. Artificial intelligence framework for heart disease classification from audio signals. Sci. Rep. 2024, 14, 3123. [Google Scholar] [CrossRef] [PubMed]
  2. Zhang, H.B.; Zhang, P.; Wang, Z.W.; Chao, L.Y.; Chen, Y.T.; Li, Q. Multi-Feature Decision Fusion Network for Heart Sound Abnormality Detection and Classification. IEEE J. Biomed. Health Inform. 2024, 28, 1386–1397. [Google Scholar] [CrossRef]
  3. Qiao, L.H.; Gao, Y.H.; Xiao, B.; Bi, X.L.; Li, W.S.; Gao, X.B. HS-Vectors: Heart Sound Embeddings for Abnormal Heart Sound Detection Based on Time-Compressed and Frequency-Expanded TDNN with Dynamic Mask Encoder. IEEE J. Biomed. Health Inform. 2023, 27, 1364–1374. [Google Scholar] [CrossRef]
  4. Fan, J.C.; Tang, S.Z.; Duan, H.; Bi, X.L.; Xiao, B.; Li, W.S.; Gao, X.B. Le-LWTNet: A Learnable Lifting Wavelet Convolutional Neural Network for Heart Sound Abnormality Detection. IEEE Trans. Instrum. Meas. 2023, 72, 6501314. [Google Scholar] [CrossRef]
  5. Tartarisco, G.; Cicceri, G.; Bruschetta, R.; Tonacci, A.; Campisi, S.; Vitabile, S.; Cerasa, A.; Distefano, S.; Pellegrino, A.; Modesti, P.A.; et al. An intelligent Medical Cyber-Physical System to support heart valve disease screening and diagnosis. Expert Syst. Appl. 2024, 238, 121772. [Google Scholar] [CrossRef]
  6. Li, Y.S.; Yi, J.Z.; Zhong, B.L.; Yi, Z.Y.; Chen, A.B.; Jin, Z. Heart Sounds Classification Based on High-Order Spectrogram and Multi-Convolutional Neural Network After a New Screening Strategy. Adv. Theory Simulations 2024, 7, 2300549. [Google Scholar] [CrossRef]
  7. Singh, S.A.; Devi, N.D.; Singh, K.N.; Thongam, K.; Reddy, B.; Majumder, S. An ensemble-based transfer learning model for predicting the imbalance heart sound signal using spectrogram images. Multimed. Tools Appl. 2023, 83, 39923–39942. [Google Scholar] [CrossRef]
  8. Guan, T.X.; Chen, Z.; Xu, D.Y.; Zeng, M.; Zuo, C.; Wang, X.; Cai, S.S.; Wang, J.J.; Hu, N. LaCHeST: An AI-assisted auscultation tool for pediatric congenital heart diseases screening and validated via large-scale screening tasks. Biomed. Signal Process. Control 2025, 103, 107474. [Google Scholar] [CrossRef]
  9. Zhang, R.; Li, X.-Y.; Pan, L.-H.; Hu, J.; Zhang, P.-Y. Heart sound diagnosis method based on multi-domain self-learning convolutional computation. Biomed. Signal Process. Control 2024, 94, 106332. [Google Scholar] [CrossRef]
  10. Kobat, M.A.; Dogan, S. Novel three kernelled binary pattern feature extractor based automated PCG sound classification method. Appl. Acoust. 2021, 179, 108040. [Google Scholar] [CrossRef]
  11. Iqtidar, K.; Qamar, U.; Aziz, S.; Khan, M.U. Phonocardiogram signal analysis for classification of Coronary Artery Diseases using MFCC and 1D adaptive local ternary patterns. Comput. Biol. Med. 2021, 138, 104926. [Google Scholar] [CrossRef] [PubMed]
  12. Balili, C.C.; Sobrepeña, M.C.C.; Naval, P.C. Classification of Heart Sounds using Discrete and Continuous Wavelet Transform and Random Forests. In Proceedings of the 3rd IAPR Asian Conference on Pattern Recognition (ACPR), Kuala Lumpur, Malaysia, 3–6 November 2015; pp. 655–659. [Google Scholar]
  13. Tuncer, T.; Dogan, S.; Tan, R.S.; Acharya, U.R. Application of Petersen graph pattern technique for automated detection of heart valve diseases with PCG signals. Inf. Sci. 2021, 565, 91–104. [Google Scholar] [CrossRef]
  14. Jamil, S.; Roy, A.M. An efficient and robust Phonocardiography (PCG)-based Valvular Heart Diseases (VHD) detection framework using Vision Transformer (ViT). Comput. Biol. Med. 2023, 158, 106734. [Google Scholar] [CrossRef]
  15. Hu, J.; Shen, L.; Sun, G. Squeeze-and-Excitation Networks. In Proceedings of the 31st IEEE/CVF Conference on Computer Vision and Pattern Recognition (CVPR), Salt Lake City, UT, USA, 18–23 June 2018; pp. 7132–7141. [Google Scholar]
  16. Ma, K.Y.; Lu, J.B.; Lu, B.Z. Parameter-Efficient Densely Connected Dual Attention Network for Phonocardiogram Classification. IEEE J. Biomed. Health Inform. 2023, 27, 4240–4249. [Google Scholar] [CrossRef]
  17. Woo, S.H.; Park, J.; Lee, J.Y.; Kweon, I.S. CBAM: Convolutional Block Attention Module. In Proceedings of the 15th European Conference on Computer Vision (ECCV), Munich, Germany, 8–14 September 2018; pp. 3–19. [Google Scholar]
  18. Liu, X.; Lv, C.C.; Cao, L.C.; Guo, X.M. Detection of coronary artery disease using a triplet network and hybrid loss function on heart sound signal. Biomed. Signal Process. Control 2025, 104, 107601. [Google Scholar] [CrossRef]
  19. Ma, S.C.; Chen, J.Y.; Ho, J.W.K. An edge-device-compatible algorithm for valvular heart diseases screening using phonocardiogram signals with a lightweight convolutional neural network and self-supervised learning. Comput. Methods Programs Biomed. 2024, 243, 107906. [Google Scholar] [CrossRef] [PubMed]
  20. Xiao, F.; Liu, H.Q.; Lu, J. A new approach based on a 1D+2D convolutional neural network and evolving fuzzy system for the diagnosis of cardiovascular disease from heart sound signals. Appl. Acoust. 2024, 216, 109723. [Google Scholar] [CrossRef]
  21. Das, S.; Jyotishi, D.; Dandapat, S. Automated Detection of Heart Valve Diseases Using Stationary Wavelet Transform and Attention-Based Hierarchical LSTM Network. IEEE Trans. Instrum. Meas. 2023, 72, 4005110. [Google Scholar] [CrossRef]
  22. Guo, Z.H.; Chen, J.X.; He, T.Y.; Wang, W.; Abbas, H.; Lv, Z.H. DS-CNN: Dual-Stream Convolutional Neural Networks-Based Heart Sound Classification for Wearable Devices. IEEE Trans. Consum. Electron. 2023, 69, 1186–1194. [Google Scholar] [CrossRef]
  23. Maity, A.; Pathak, A.; Saha, G. Transfer learning based heart valve disease classification from Phonocardiogram signal. Biomed. Signal Process. Control 2023, 85, 104805. [Google Scholar] [CrossRef]
  24. Zhu, L.X.; Qiu, W.Y.; Ma, Y.; Tian, F.Z.; Sun, M.K.; Wang, Z.H.; Qian, K.; Hu, B.; Yamamoto, Y.; Schuller, B.W. LEPCNet: A Lightweight End-to-End PCG Classification Neural Network Model for Wearable Devices. IEEE Trans. Instrum. Meas. 2024, 73, 2511111. [Google Scholar] [CrossRef]
  25. Nia, P.S.; Hesar, H.D. Abnormal Heart Sound Detection Using Time-Frequency Analysis and Machine Learning Techniques. Biomed. Signal Process. Control 2024, 90, 105899. [Google Scholar]
  26. Das, S.; Dandapat, S. Heart Murmur Severity Stages Classification Using Multikernel Residual CNN. IEEE Sens. J. 2024, 24, 13019–13027. [Google Scholar] [CrossRef]
  27. Singh, G.; Verma, A.; Gupta, L.; Mehta, A.; Arora, V. An automated diagnosis model for classifying cardiac abnormality utilizing deep neural networks. Multimed. Tools Appl. 2023, 105899. [Google Scholar] [CrossRef]
  28. Zhou, X.L.; Guo, X.M.; Zheng, Y.E.; Zhao, Y.Y. Detection of coronary heart disease based on MFCC characteristics of heart sound. Appl. Acoust. 2023, 212, 109583. [Google Scholar] [CrossRef]
  29. Alkhodari, M.; Hadjileontiadis, L.J.; Khandoker, A.H. Identification of Congenital Valvular Murmurs in Young Patients Using Deep Learning-Based Attention Transformers and Phonocardiograms. IEEE J. Biomed. Health Inform. 2024, 28, 1803–1814. [Google Scholar] [CrossRef] [PubMed]
  30. Ranipa, K.; Zhu, W.P.; Swamy, M.N.S. A novel feature-level fusion scheme with multimodal attention CNN for heart sound classification. Comput. Methods Programs Biomed. 2024, 248, 108122. [Google Scholar] [CrossRef]
  31. Chittaragi, N.B.; Koolagudi, S.G. Dialect Identification using Chroma-Spectral Shape Features with Ensemble Technique. Comput. Speech Lang. 2021, 70, 101230. [Google Scholar] [CrossRef]
  32. Sharma, G.; Umapathy, K.; Krishnan, S. Trends in audio signal feature extraction methods. Appl. Acoust. 2020, 158, 107020. [Google Scholar] [CrossRef]
  33. Pal, A.; Sankarasubbu, M. Pay Attention to the cough: Early Diagnosis of COVID-19 using Interpretable Symptoms Embeddings with Cough Sound Signal Processing. In Proceedings of the 36th Annual ACM Symposium on Applied Computing (SAC), Virtual, 22–26 March 2021; pp. 620–628. [Google Scholar]
  34. Nie, J.P.; Liu, R.; Mahasseni, B.; Azemi, E.; Mitra, V. September. Model-driven heart rate estimation and heart murmur detection based on phonocardiogram. In Proceedings of the 34th International Workshop on Machine Learning for Signal Processing (MLSP), London, UK, 22–25 September 2024. [Google Scholar]
  35. Xu, X.Y.; Cai, J.; Yu, N.S.; Yang, Y.N.; Li, X. Effect of loudness and spectral centroid on the music masking of low frequency noise from road traffic. Appl. Acoust. 2020, 166, 107343. [Google Scholar] [CrossRef]
  36. Liu, C.Y.; Springer, D.; Li, Q.; Moody, B.; Juan, R.A.; Chorro, F.J.; Castells, F.; Roig, J.M.; Silva, I.; Johnson, A.E.W.; et al. An open access database for the evaluation of heart sound algorithms. Physiol. Meas. 2016, 37, 2181–2213. [Google Scholar] [CrossRef]
  37. Oliveira, J.; Renna, F.; Costa, P.D.; Nogueira, M.; Oliveira, C.; Ferreira, C.; Jorge, A.; Mattos, S.; Hatem, T.; Tavares, T.; et al. The CirCor DigiScope Dataset: From Murmur Detection to Murmur Classification. IEEE J. Biomed. Health Inform. 2022, 26, 2524–2535. [Google Scholar] [CrossRef]
  38. Jia, W.J.; Wang, Y.Y.; Chen, R.W.; Ye, J.J.; Li, D.; Yin, F.; Yu, J.; Chen, J.J.; Shu, Q.; Xu, W.Z. ZCHSound: Open-Source ZJU Paediatric Heart Sound Database with Congenital Heart Disease. IEEE Trans. Biomed. Eng. 2024, 71, 2278–2286. [Google Scholar] [CrossRef] [PubMed]
  39. Purwins, H.; Li, B.; Virtanen, T.; Schlüter, J.; Chang, S.Y.; Sainath, T. Deep Learning for Audio Signal Processing. IEEE J. Sel. Top. Signal Process. 2019, 13, 206–219. [Google Scholar] [CrossRef]
  40. Vican, I.; Krekovic, G.; Jambros, K. Improved fetal heartbeat detection using pitch shifting and psychoacoustics. Biomed. Signal Process. Control 2024, 90, 105850. [Google Scholar] [CrossRef]
  41. Sabry, A.H.; Bashi, O.I.D.; Ali, N.H.N.; Al Kubaisi, Y.M. Lung disease recognition methods using audio-based analysis with machine learning. Heliyon 2024, 10, e26218. [Google Scholar] [CrossRef]
  42. Qiao, L.H.; Li, Z.X.; Xiao, B.; Shu, Y.C.; Wang, L.; Shi, Y.H.; Li, W.S.; Gao, X.B. QDRJL: Quaternion dynamic representation with joint learning neural network for heart sound signal abnormal detection. Neurocomputing 2023, 562, 126889. [Google Scholar] [CrossRef]
  43. Pintelas, E.; Livieris, I.E.; Pintelas, P. A Deep Learning-Based Methodology for Detecting and Visualizing Continuous Gravitational Waves. In Proceedings of the 19th International Conference on Artificial Intelligence Applications and Innovations (AIAI), Leon, Spain, 14–17 June 2023; pp. 3–14. [Google Scholar]
  44. Pintelas, E.; Livieris, I.E.; Pintelas, P. Researching the detection of continuous gravitational waves based on signal processing and ensemble learning. Neural Comput. Appl. 2024, 37, 10723–10736. [Google Scholar] [CrossRef]
  45. Jaiswal, S.; Mehta, A.; Nandi, G.C. Investigation on the Effect of L1 an L2 Regularization on Image Features Extracted using Restricted Boltzmann Machine. In Proceedings of the 2nd International Conference on Intelligent Computing and Control Systems (ICICCS), Madurai, India, 14–15 June 2018; pp. 1548–1553. [Google Scholar]
  46. Morshed, M.; Fattah, S.A. SAR-CardioNet: A Network for Heart Valve Disease Detection From PCG Signal Based on Split-Self Attention With Residual Paths. IEEE Sens. J. 2023, 23, 19553–19560. [Google Scholar] [CrossRef]
  47. Fuadah, Y.N.; Pramudito, M.A.; Lim, K.M. An Optimal Approach for Heart Sound Classification Using Grid Search in Hyperparameter Optimization of Machine Learning. Bioengineering 2023, 10, 45. [Google Scholar] [CrossRef]
  48. Nehary, E.A.; Rajan, S. Phonocardiogram Classification by Learning from Positive and Unlabeled Examples. IEEE Trans. Instrum. Meas. 2024, 73, 4005114. [Google Scholar] [CrossRef]
  49. Prabhakar, S.K.; Won, D.O. Phonocardiogram signal classification for the detection of heart valve diseases using robust conglomerated models. Expert Syst. Appl. 2023, 221, 119720. [Google Scholar] [CrossRef]
  50. Xu, C.Y.; Li, X.; Zhang, X.Y.; Wu, R.L.; Zhou, Y.X.; Zhao, Q.H.; Zhang, Y.; Geng, S.J.; Gu, Y.; Hong, S.D. Cardiac murmur grading and risk analysis of cardiac diseases based on adaptable heterogeneous-modality multi-task learning. Health Inf. Sci. Syst. 2023, 12, 2. [Google Scholar] [CrossRef] [PubMed]
  51. Manshadi, O.D.; Mihandoost, S. Murmur identification and outcome prediction in phonocardiograms using deep features based on Stockwell transform. Sci. Rep. 2024, 14, 7592. [Google Scholar] [CrossRef] [PubMed]
Figure 1. The overall structure of the proposed framework for heart sound detection.
Electronics 14 04092 g001
Figure 2. (a) Multi-scale inverted residual module; (b) Dynamically gated convolution module. The asterisk (∗) denotes the multiplication operation.
Electronics 14 04092 g002
Figure 3. Structure of multi-scale feature extraction network.
Electronics 14 04092 g003
Figure 5. Structure of the Multi-Scale Attention Prediction network.
Electronics 14 04092 g005
Figure 6. (a) The receiver operating characteristic (ROC) curve of each fold after 5-fold cross-validation on the PhysioNet/CinC Challenge 2016 Dataset; (bf) The receiver operating characteristic (ROC) curve of each class after 5-fold cross-validation on the PhysioNet/CinC Challenge 2022 Dataset.
Electronics 14 04092 g006
Table 1. Details of the heart sound datasets utilized in this study.
DatasetCategoryNumber
The PhysioNet/CinC Challenge 2016 datasetNormal2575
Abnormal665
Total3240
The PhysioNet/CinC Challenge 2022 datasetNormal2391
Murmur616
Unknown156
Total3163
The ZCHSound noise datasetNormal160
Abnormal158
Total318
Table 2. Performance of our method based on different n_step values of the pitch-shifting technique on the PhysioNet/CinC 2016 and 2022 datasets.
Datasetn_stepAccuracyF1-ScoreSensitivitySpecificityAUCMCCG-Mean
(%)(%)(%)(%)(%)(%)(%)
PhysioNet/CinC097.6694.2493.7198.6896.1292.8096.15
Challenge 2016−298.4396.1295.2999.2297.2695.1497.24
−498.8997.2097.3499.2798.3096.5298.29
−698.2795.7295.2199.0797.1494.7097.13
PhysioNet/CinC097.6694.2493.7198.6896.1293.8893.68
Challenge 2022−298.3396.1595.6898.8099.7995.7195.65
−498.8698.1397.9298.8299.8396.9897.90
−698.3294.7294.3098.6799.7895.6694.27
Table 3. Performance comparison in ablation experiments on the PhysioNet/CinC 2016 Dataset.
Model SettingsAccuracyF1-ScoreSensitivitySpecificityAUCMCCG-Mean
(%)(%)(%)(%)(%)(%)(%)
Experiment 1: Baseline CNN87.5969.7270.1192.2481.1862.1780.42
Experiment 2: CNN + MSA91.4278.3475.3195.6485.4873.1384.87
Experiment 3: CNN + DGC94.3885.9283.0697.3590.2182.5189.92
Experiment 4: CNN + MIR95.9390.1590.7797.2894.0387.6193.97
Experiment 5: CNN + MIR + DGC97.3893.5392.7898.6195.6991.9495.65
Experiment 6: CNN + MSA + MIR + DGC98.8997.2097.3499.2798.3096.5298.29
Table 4. Performance comparison in ablation experiments on the PhysioNet/CinC 2022 Dataset.
Model SettingsAccuracyF1-ScoreSensitivitySpecificityAUCMCCG-Mean
(%)(%)(%)(%)(%)(%)(%)
Experiment 1: Baseline CNN75.5965.0975.5966.6755.8850.3175.51
Experiment 2: CNN + MSA78.7573.0178.7572.4170.6861.4878.65
Experiment 3: CNN + DGC94.8191.2790.0295.0298.3886.4189.96
Experiment 4: CNN + MIR95.5893.7994.1596.3099.1388.8794.16
Experiment 5: CNN + MIR + DGC97.3195.4195.7397.6699.6093.0395.72
Experiment 6: CNN + MSA + MIR + DGC98.8698.1397.9298.8299.8396.9897.90
Table 5. Internal comparison among ablation variants based on AUC metric using the FAR test and Finner post hoc correction on the PhysioNet/CinC Challenge 2016 dataset.
SeriesFriedman Ranking (Classic)FAR Mean Aligned-RankFinner Post Hoc Test
p-ValueH0
CNN + MSA + MIR + DGC1.03.60--
CNN + MIR + DGC2.07.400.30982Fail to reject
CNN + DGC3.013.000.02385Rejected
Baseline CNN4.018.000.00071Rejected
Table 9. Performance comparison with other state-of-the-art methods on PhysioNet/CinC Challenge 2022 dataset.
MethodsAccuracyF1-ScoreSensitivitySpecificityAUC (%)
(%)(%)(%)(%)
KNN [47]76.3176.0076.00
CNN [29]83.3267.2080.2083.00
HMT+HMA [50]88.4076.50
Transformer [29]90.2371.1972.4188.6692.00
TFMs+AlexNet+RFE-RF [51]92.1091.0091.0091.0098.00
MK-RCNN [26]98.3397.0597.3698.00
Proposed method98.8698.1397.9298.8299.83
Table 10. Our method achieved results using 5-fold cross-validation on the PhysioNet/CinC Challenge 2022 dataset.
FoldAccuracyF1-ScoreSensitivitySpecificityAUC (%)MCC (%)G-Mean (%)
(%)(%)(%)(%)
198.7497.7197.0698.7199.6096.6197.04
298.5897.1596.4598.4299.8296.1096.43
399.2198.6298.8099.2199.9197.9198.79
498.8998.7998.6998.9299.9297.0998.68
598.8998.3798.5998.8299.9097.1798.57
Average98.8698.1397.9298.8299.8396.9897.90
Table 11. Our method achieved results using 5-fold cross-validation on the ZCHSound noise dataset.
FoldAccuracyF1-scoreSensitivitySpecificityAUC (%)MCC (%)G-Mean (%)
(%)(%)(%)(%)
198.4498.51100.0096.7798.3996.9298.37
296.8897.1494.44100.0097.2293.8997.18
396.8896.6796.6797.0696.8693.7396.87
496.8397.0697.0696.5596.8193.6196.80
596.8396.3096.3097.2296.7693.5296.76
Average97.1797.1496.8997.5297.2194.3397.20
Table 12. (a) Confusion matrix of the three-fold test dataset obtained by performing a five-fold cross-validation on the 2016 PhysioNet/CinC challenge dataset; (b) The confusion matrix of the three-fold test dataset obtained by performing a five-fold cross-validation on the 2022 PhysioNet/CinC challenge dataset.
(a)(b)
True\PredNormalAbnormalTrue\PredNormalMurmurUnknown
Normal5002Normal48310
Abnormal2144Murmur31141
---Unknown0031
Table 13. Comparison of computational complexity with the state-of-the-art methods.
MethodsAccuracy (%)Parameters (M)FLOPs (M)ART (ms)
LEPCNet [24] 93.1 ± 1.1 0.05271.610.1
MK-RCNN [26]98.530.217-2.82
Proposed method98.891.5722.5398.1
Disclaimer/Publisher’s Note: The statements, opinions and data contained in all publications are solely those of the individual author(s) and contributor(s) and not of MDPI and/or the editor(s). MDPI and/or the editor(s) disclaim responsibility for any injury to people or property resulting from any ideas, methods, instructions or products referred to in the content.