Article

A Nonlinear Volterra Filtering Hybrid Image-Denoising Method Based on the Improved Bat Algorithm for Optimizing Kernel Parameters

1
School of Intelligent Manufacturing, Huzhou College, Huzhou 313000, China
2
Guizhou Rongbai Lithium Battery Materials Co., Ltd., Guiyang 563099, China
*
Authors to whom correspondence should be addressed.
Electronics 2025, 14(20), 4076; https://doi.org/10.3390/electronics14204076
Submission received: 16 September 2025 / Revised: 10 October 2025 / Accepted: 13 October 2025 / Published: 16 October 2025
(This article belongs to the Section Artificial Intelligence)

Abstract

To address the issue of reducing noise in images containing mixed noise, a Volterra filtering method based on a Bat algorithm with velocity weight perturbation is proposed to optimize kernel parameters. The structural advantages of the Volterra filter (predictive performance, linear and nonlinear terms) are used to reduce the noise in these images. The dynamic velocity inertia-weight perturbation mechanism is used to improve the Bat algorithm’s optimization ability, while the kernel-parameter optimization and the noise reduction abilities of the Volterra filter are further improved. Theoretical analysis and experimental results show that the high-density mixed noise, comprising Gaussian and salt-and-pepper noise, can be filtered effectively by the proposed algorithm. Compared to traditional image-denoising methods, the proposed method outperforms other algorithms in removing mixed noise from images while preserving edge details. Within a specific noise intensity range, the greater the intensity of mixed noise in the image, the better the noise reduction performance of this filtering method. The method proposed in this paper is less affected by noise intensity. When the number of bats in the population and the number of iterations reach a certain value, the algorithm exhibits good convergence and stability.

1. Introduction

Digital images are often corrupted by noise during acquisition, transmission, and processing, so signal noise reduction has attracted the attention of many researchers in the field of image processing [1,2]. There are many kinds of image noise, which are characterized by mutual superposition and influence. The most common is high-density mixed noise produced by additive Gaussian noise (GN) and salt-and-pepper noise (SPN). The intensity of GN is described by the variance (σ) of noise, and the intensity of SPN is characterized by noise density (d).
To filter additive GN, mean filtering is the most commonly adopted traditional method [3]. However, after noise reduction, the edge and texture details of the image are easily smoothed. The noise reduction method based on the transform domain has obvious advantages in removing GN [4], but it demonstrates poor performance in removing SPN. A sparse dictionary-learning algorithm, proposed by Aharon, is the KSVD (K Singular-Value Decomposition) algorithm, which is a generalized form of the K-means clustering algorithm [5]. Compared to the characteristic of the kernel norm minimization algorithm that treats all singular values equally [6], the Weighted Nuclear Norm Minimization (WNNM) algorithm can perform small shrinkage processing for large singular values, and the practical information is better retained [7]. For the denoising of salt-and-pepper noise, nonlinear filtering methods are primarily employed, including median filtering [8], adaptive median filtering [9], and weighted median filtering [10]. Although this kind of nonlinear filtering algorithm can effectively and quickly remove noise, many details are lost. Total Variation (TV) regularization terms are introduced, combining the total variational regularization term and logarithmic penalty function, and a non-convex optimization model is proposed to effectively filter salt-and-pepper noise [11].
For the mixed noise containing additive GN and SPN, combining the traditional TV algorithm with the kernel norm minimization algorithm, a TV-regularized low-rank matrix factorization (LRTV) algorithm is proposed [12], and the segmentation of mixed noise is realized. The Weighted Encoding with Sparse Nonlocal Regularization algorithm (WESNR) integrates the sparse prior and non-local similarity prior into a variational framework for image denoising [13]. By taking advantage of the low-rank and non-local similarity of images, the Laplacian Scale Modeling and nonlocal low-rank regularization model can effectively remove the mixed noise [14].
In recent years, deep learning technology has brought about revolutionary progress in the field of image denoising, thanks to its powerful nonlinear mapping and feature representation capabilities. A hybrid Transformer–convolutional neural network (CNN) (HTC-net) and a self-supervised pretraining strategy are proposed, which effectively enhance denoising performance [15]. A data augmentation method that combines synthetic minority oversampling technology (SMOTE) and a transport-conditional Wasserstein generative adversarial network (Trans-CWGAN) is applied to the real operational data collected in auditorium buildings [16], demonstrating its strong potential for practical deployment in actual HVAC monitoring systems. However, this method requires a substantial amount of data and training costs, and sufficient computing power and time must be allocated for model training.
The Volterra series model integrates the functions of linear filters, nonlinear filters, and prediction, offering effective noise-removal capabilities for mixed noise while meeting real-time system requirements [17]. The kernel parameters of the Volterra series are crucial for describing nonlinear systems, and the identification of these parameters greatly affects filtering performance. Wang proposed a regional-scale intelligent optimization and end-to-end correction framework, which significantly improved data consistency under extreme geographical conditions through adaptive partitioning and uncertainty quantification [18]. Inspired by this, this study introduces a similar intelligent optimization philosophy into the field of image processing. For the degradation patterns of mixed noise and spatial variations, a meta-heuristic algorithm is adopted to optimize the Volterra filter, aiming to achieve the best balance between robust parameter search and detail feature preservation. The essence of the intelligent algorithm optimization method for Volterra filtering is a process of finding the optimal parameters for the current problem using a simple model. Its advantages lie in having no data dependence, relatively controllable computing costs, and strong flexibility. A denoising method that identifies Volterra filter kernel parameters using a genetic algorithm is proposed [19]. After the optimal kernel parameters were obtained, the optimization solution for the structure and parameters of the nonlinear Volterra filter model was achieved. A dynamic random local search biogeography-based optimization algorithm (DRLBBO) is proposed to optimize the model’s kernel parameters in the nonlinear Volterra filtering method [20]. The optimization of the structure and parameters of the nonlinear Volterra filter model was achieved [21].
As a meta-heuristic algorithm that dynamically controls two parameters such as noise intensity and pulse frequency, the Bat algorithm, in the early stages of the algorithm, has a high noise intensity and a low pulse rate, and bats tend to explore a wide space. As the number of iterations increases, the noise intensity automatically decreases and the pulse rate automatically increases. The algorithm naturally transitions to fine local development, enabling an effective conversion from a global to local search. It features an adaptive and development balance mechanism and can achieve rapid and precise convergence with fewer parameters. Taking advantage of this characteristic of the algorithm, a nonlinear Volterra filtering method based on the Bat algorithm (BA) is proposed [22], which can rapidly and accurately optimize the nonlinear Volterra kernel parameters. Due to the convergence issue of the BA, the optimization process is still prone to getting stuck in local optimal solutions, resulting in the kernel parameters being ineffective in terms of optimization.
Since the kernel parameters directly determine the noise reduction capability of the Volterra filter, in order to further optimize its kernel parameters, a Bat algorithm based on the velocity inertia-weight perturbation mechanism (VWDBA) is proposed to enhance the global optimization ability of a single bat and improve the convergence speed of the algorithm. Meanwhile, a fitness function that can quantitatively reflect the deviation degree between the output of the model to be identified and the ideal output is established, which can improve the accuracy of the improved algorithm in optimizing the kernel parameters and further enhance the ability of the filter to reduce mixed noise. On this basis, the Volterra filtering method with optimized kernel parameters (VWDBA-Volterra) is adopted to reduce the noise in images containing GN and SPN, and its effectiveness is verified through simulation experiments.

2. Volterra Series Model

The Volterra model is a nonlinear system model which can be expressed through input u ( t ) and output y ( t ) values, represented as
y ( t ) = n = 1 y n ( t ) = y 1 ( t ) + y 2 ( t ) + + y n ( t ) +
In Equation (1)
y 1 ( t ) = h 1 ( τ 1 ) u ( t τ 1 ) d τ 1 y 2 ( t ) = h 2 ( τ 1 , τ 2 ) u ( t τ 1 ) u ( t τ 1 ) d τ 1 d τ 2 y n ( t ) = h n ( τ 1 , τ 2 , , τ n ) i = 1 n u ( t τ i ) d τ 1 d τ 2 d τ n
In Equation (1), time is represented by t, u ( t ) is the time-domain model of the input signal, y ( t ) is the output signal, and h n ( τ 1 , τ 2 , , τ n ) the n-th-order time-domain kernel of the nonlinear Volterra filter model. In the filtering process, the Volterra series model shown in Equation (1) is distributed to obtain a discrete nth-order Volterra filter model, which is shown in Equation (2).
y ( k ) = n = 1 N y n ( k ) + e ( k ) , k = 1 , 2 , 3 , ,
In Equation (2), y ( k ) is the discrete time-domain model of the output signal; N the highest order; k is the order of the Volterra series, which is set as a positive Volterra integer; e ( k ) is the error of truncation; and m i can be expressed by
y n ( k ) = m 1 = 0 M 1 1 m n = 0 M n 1 h n ( m 1 , m 2 , , m n ) i = 1 n u ( k m i ) ,
In Equation (3), m i is the memory length and h n ( m 1 , m 2 , , m n ) the n-th-order time-domain kernel function of Volterra. Due to the characteristics of the infinite series of Equation (2), it cannot be accurately calculated. Stage processing is needed to determine the order and memory length of the infinite series. In order to approximate the expression of nonlinear systems, the third-order Volterra series model is used; then, using N = 3, Equation (2) can thus be simplified to the following expression:
y ( k ) = n = 1 3 y n ( k ) = y 1 ( k ) + y 2 ( k ) + y 3 ( k ) + e ( k ) ,
since the time-domain kernel of the Volterra series is symmetric, as shown in Equation (5).
h n s y m ( τ 1 , τ 2 , , τ n ) = 1 n ! i 1 , i 2 , , i n h ( τ i 1 , τ i 2 , , τ i τ i n ) ,
In Equation (5), i 1 , i 2 , , i n represents any of the permutations of 1 , 2 , 3 , , n .
y 1 ( k ) = a 1 ( m 1 ) m 1 = 0 N 1 h 1 ( m 1 ) u ( k m 1 ) y 2 ( k ) = a 2 ( m 1 , m 2 ) m 1 = 0 N 1 m 2 = 0 N 1 h 2 ( m 1 , m 2 ) u ( k m 1 ) u ( k m 2 ) y 3 ( k ) = a 3 ( m 1 , m 2 , m 3 ) m 1 = 0 N 1 m 2 = 0 N 1 m 3 = 0 N 1 h 3 ( m 1 , m 2 , m 3 ) u ( k m 1 ) u ( k m 2 ) u ( k m 3 ) ,
In Equation (6), m i is the length of memory and a i is the weight coefficient when the time-domain kernel is symmetric. The weight coefficient is introduced as follows:
a 1 ( m 1 ) = 1 a 2 ( m 1 , m 2 ) = 1 ; m 1 = m 2 2 ; m 1 m 2 a 3 ( m 1 , m 2 , m 3 ) = 1 ; m 1 = m 2 = m 3 3 ; m 1 = m 2 m 3 or m 1 m 2 = m 3 or m 1 m 3 = m 2 6 ; m 1 m 2 and m 2 m 3 a n d m 1 m 3
The model of the third-order filter can be expressed as
y ( k ) = m 1 = 0 N 1 a 1 ( m 1 ) h 1 ( m 1 ) u ( k m 1 ) + m 1 = 0 N 1 m 2 = 0 N 1 a 2 ( m 1 , m 2 ) h 2 ( m 1 , m 2 ) u ( k m 1 ) u ( k m 2 ) + m 1 = 0 N 1 m 2 = 0 N 1 m 3 = 0 N 1 a 3 ( m 1 , m 2 , m 3 ) h 3 ( m 1 , m 2 , m 3 ) u ( k m 1 ) u ( k m 2 ) u ( k m 3 ) + e ( k ) ,

3. Bat Algorithm with Velocity Weight Perturbation

The Volterra filter is essentially a multidimensional function of kernel parameters. Therefore, the process of kernel-parameter optimization is the same as the process for optimizing parameters in multidimensional space. The Bat algorithm is a widely used swarm intelligence optimization algorithm which suffers from the common shortcomings of these algorithms—a slow optimization process and a tendency to fall into local optimal solutions—so a nonlinear Volterra filtering method for kernel-parameter optimization based on VWDBA is proposed. The model structure and parameter identification of the Volterra filter are regarded as problems to be optimized, and the kernel parameter is regarded as the optimization variable. By multiplying the vector form of the predicted signal with the vector form of the Volterra filter kernel parameters, then performing mean square deviation with the vector form of the ideal signal as the fitness function of the algorithm, the BA ensures the output of the prediction model is approximate to the real value by continuously iterating for optimization. By introducing a velocity inertia-weight perturbation mechanism for bat individuals, the kernel parameters of the filter model can be determined through iterative optimization to ensure the output of the model to be identified approaches the actual signal output.

3.1. Bat Algorithm

In the Bat algorithm, the quality of a bat’s position is measured by the objective function value of the optimization problem. The spatial position and velocity update principle of a bat are as follows:
f i = f min + ( f max f min ) × β V i + 1 ( t ) = V i ( t ) + ( X best ( t ) X i ( t ) ) × f i X i ( t + 1 ) = X i ( t ) + V i ( t + 1 ) ,
In Equation (8), t represents the iteration number, X i ( t ) represents the bat’s position vector at time t, V i ( t ) represents the bat’s flight speed vector at time t, X b e s t ( t ) represents the best position among the bats in the current population, f i represents the pulse rate used by a bat i when searching for prey, and f i [ f min , f max ] , β [ 0 , 1 ] represents a uniformly distributed random variable. For local searches, when the spatial optimal solution is determined, new solutions are generated through random walk:
x n e w = x o l d + ε A t ,
In Equation (9), ε follows a random distribution in the interval [0, 1], A t represents the average noise intensity of the bat population at time t. During the evolution process of the Bat algorithm, the pulse intensity and emissions of bats are also adjusted with the increase in the number of iterations:
r i t + 1 = r i 0 [ 1 exp ( γ × t ) ] ,
In Equation (10), r i 0 represents the maximum pulse rate of a bat i , r i t + 1 represents the pulse rate of a bat i at time t + 1 ; and γ represents the coefficient of increases in pulse rate, which is a positive constant.
A i t + 1 = α A i t ,
In Equation (11), A i t represents the sound intensity of the bat i emitting a pulse at time t, and α is the coefficient of decay in pulse sound intensity, α [ 0 , 1 ] .

3.2. Bat Algorithm with Velocity Weight

A velocity weight perturbation mechanism for bat individuals is adopted in this paper. When updating the velocity of bat individuals in the (t) generation, the mean position x ¯ of the current population is first calculated. If a bat individual in the population is close to the current best position x i t x ¯ of the population, to prevent the population from falling into the current local optimum, when updating its velocity v i t + 1 , its previous velocity v i t variable is multiplied by the velocity weight coefficient ω . If a bat individual in the population is far from the current best position x i t < x ¯ of the population, to speed up the convergence of this individual towards the best position of the population, its velocity is updated v i t + 1 directly using its previous velocity variable v i t to improve the algorithm’s convergence speed. The formula for individual velocity updates is as follows.
v i t + 1 = v i t + ( x i t x ) f i x i t < x ¯ v i t + 1 = ω v i t + ( x i t x ) f i x i t x ¯ ,
In Equation (12), ω is a random variable that follows a normal distribution in [0, 1].

3.3. Kernel Parameters Optimized Based on VWDBA

VWDBA was used to optimize the kernel parameters of the nonlinear Volterra filter model, and the kernel-parameter vector to be optimized was shown in Equation (13).
H = [ h 1 ( 0 ) , h 1 ( 1 ) , h n ( M 1 1 ) , h 2 ( 0 , 0 ) , h 2 ( 0 , 1 ) , h n ( M 1 1 , M 2 1 ) , h 3 ( 0 , 0 , 0 ) , h 3 ( 0 , 0 , 1 ) , h n ( M 1 1 , M 2 1 , M 3 1 ) ] ,
As the individual position in the Bat algorithm, the dimension of the bat search space is represented by Equation (14)
D = M 1 + M 2 ( M 2 + 1 ) 2 + M 3 ( M 3 + 1 ) ( 2 M 3 + 1 ) 12 + M 3 ( M 3 + 1 ) 4 ,
The input matrix is U = [ u ( k ) , u ( k + 1 ) , , u ( k + L 1 ) ] T , where L is the data length and u ( k ) is the input vector at a specified time, as shown in Equation (15).
u ( k ) = [ u ( k ) , u ( k 1 ) , , u ( k M 1 + 1 ) , ( u ( k ) ) 2 , u ( k ) u ( k 1 ) , , ( u ( k M 3 + 1 ) ) 2 ] T ,
The objective function for optimization (fitness function) is shown in Equation (16).
f i t n e s s ( X i ) = F ( u ( k ) u d ( k ) ) = 1 L i = 1 L ( u ( k ) u d ( k ) ) 2 = 1 L i = 1 L u T ( k ) H ^ d ( k ) u d ( k ) 2 ,
In Equation (16), u d ( k ) represents the ideal signal, f i t n e s s ( x ) is the mean square error (MSE) for calculating the predicted and ideal outputs, and H ^ d ( k ) is the kernel-parameter vector optimized by d-th iteration of the algorithm. The VWDBA is used to obtain the optimal bat position with the minimum value of Equation (16), which is the optimal kernel parameter of the nonlinear Volterra filter model. The optimized process is shown in Figure 1.
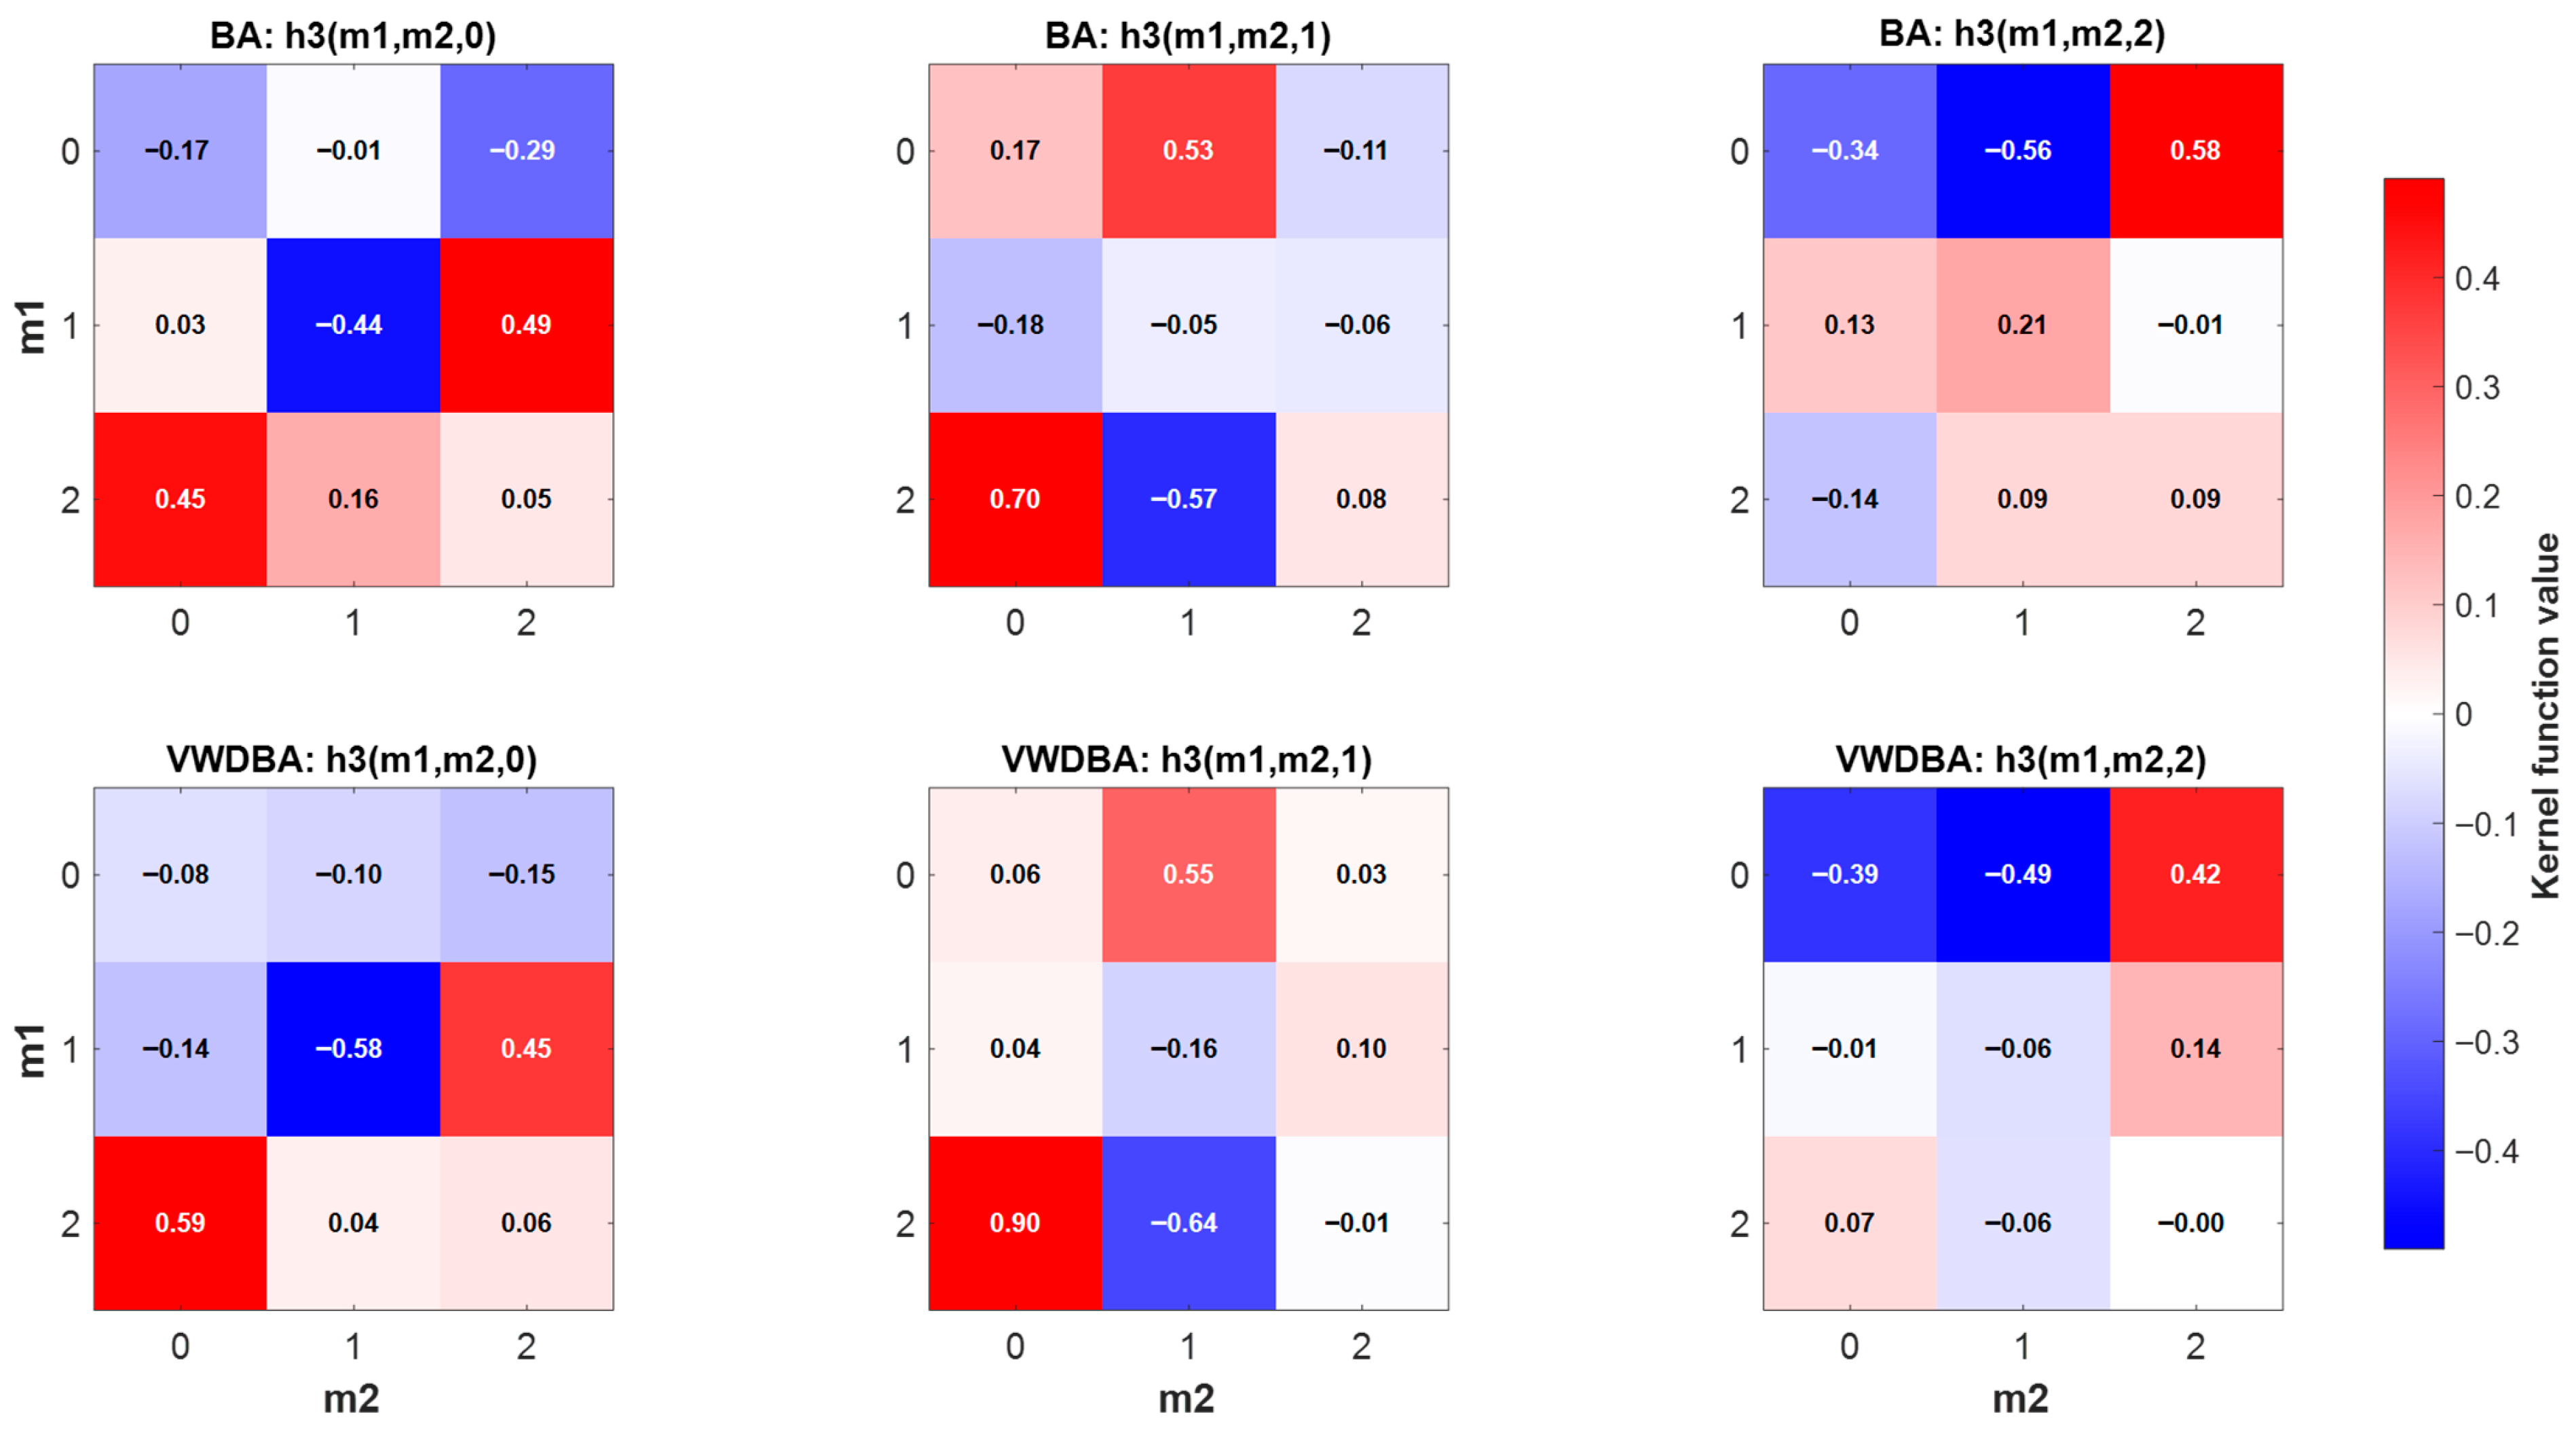
The method proposed in this paper (VWDBA) and the traditional BA were both adopted to optimize the third-order Volterra kernel function. The heat map of the optimized third-order Volterra kernel parameters is shown in Figure 2.
Figure 2 shows the post-optimization changes in the third-order Volterra kernel function using BA and VWDBA, respectively, intuitively demonstrating that the model proposed in this paper has better characteristics in capturing the high-order (third-order) nonlinear characteristics of the system compared to the traditional BA. The optimized kernel function presents a more regular spatial structure. Important nonlinear interaction terms (such as diagonal elements) have been significantly enhanced, random fluctuations and noise components have been effectively suppressed, the energy of the kernel function is more concentrated in the region with clear physical meaning, and the noise level has been reduced by 5.6%, verifying the effectiveness of the VWDBA in the optimization of Volterra filters. In order to verify the convergence of the algorithm, the BA and VWDBA algorithms were used to verify different test functions respectively. The test functions are shown in Table 1.
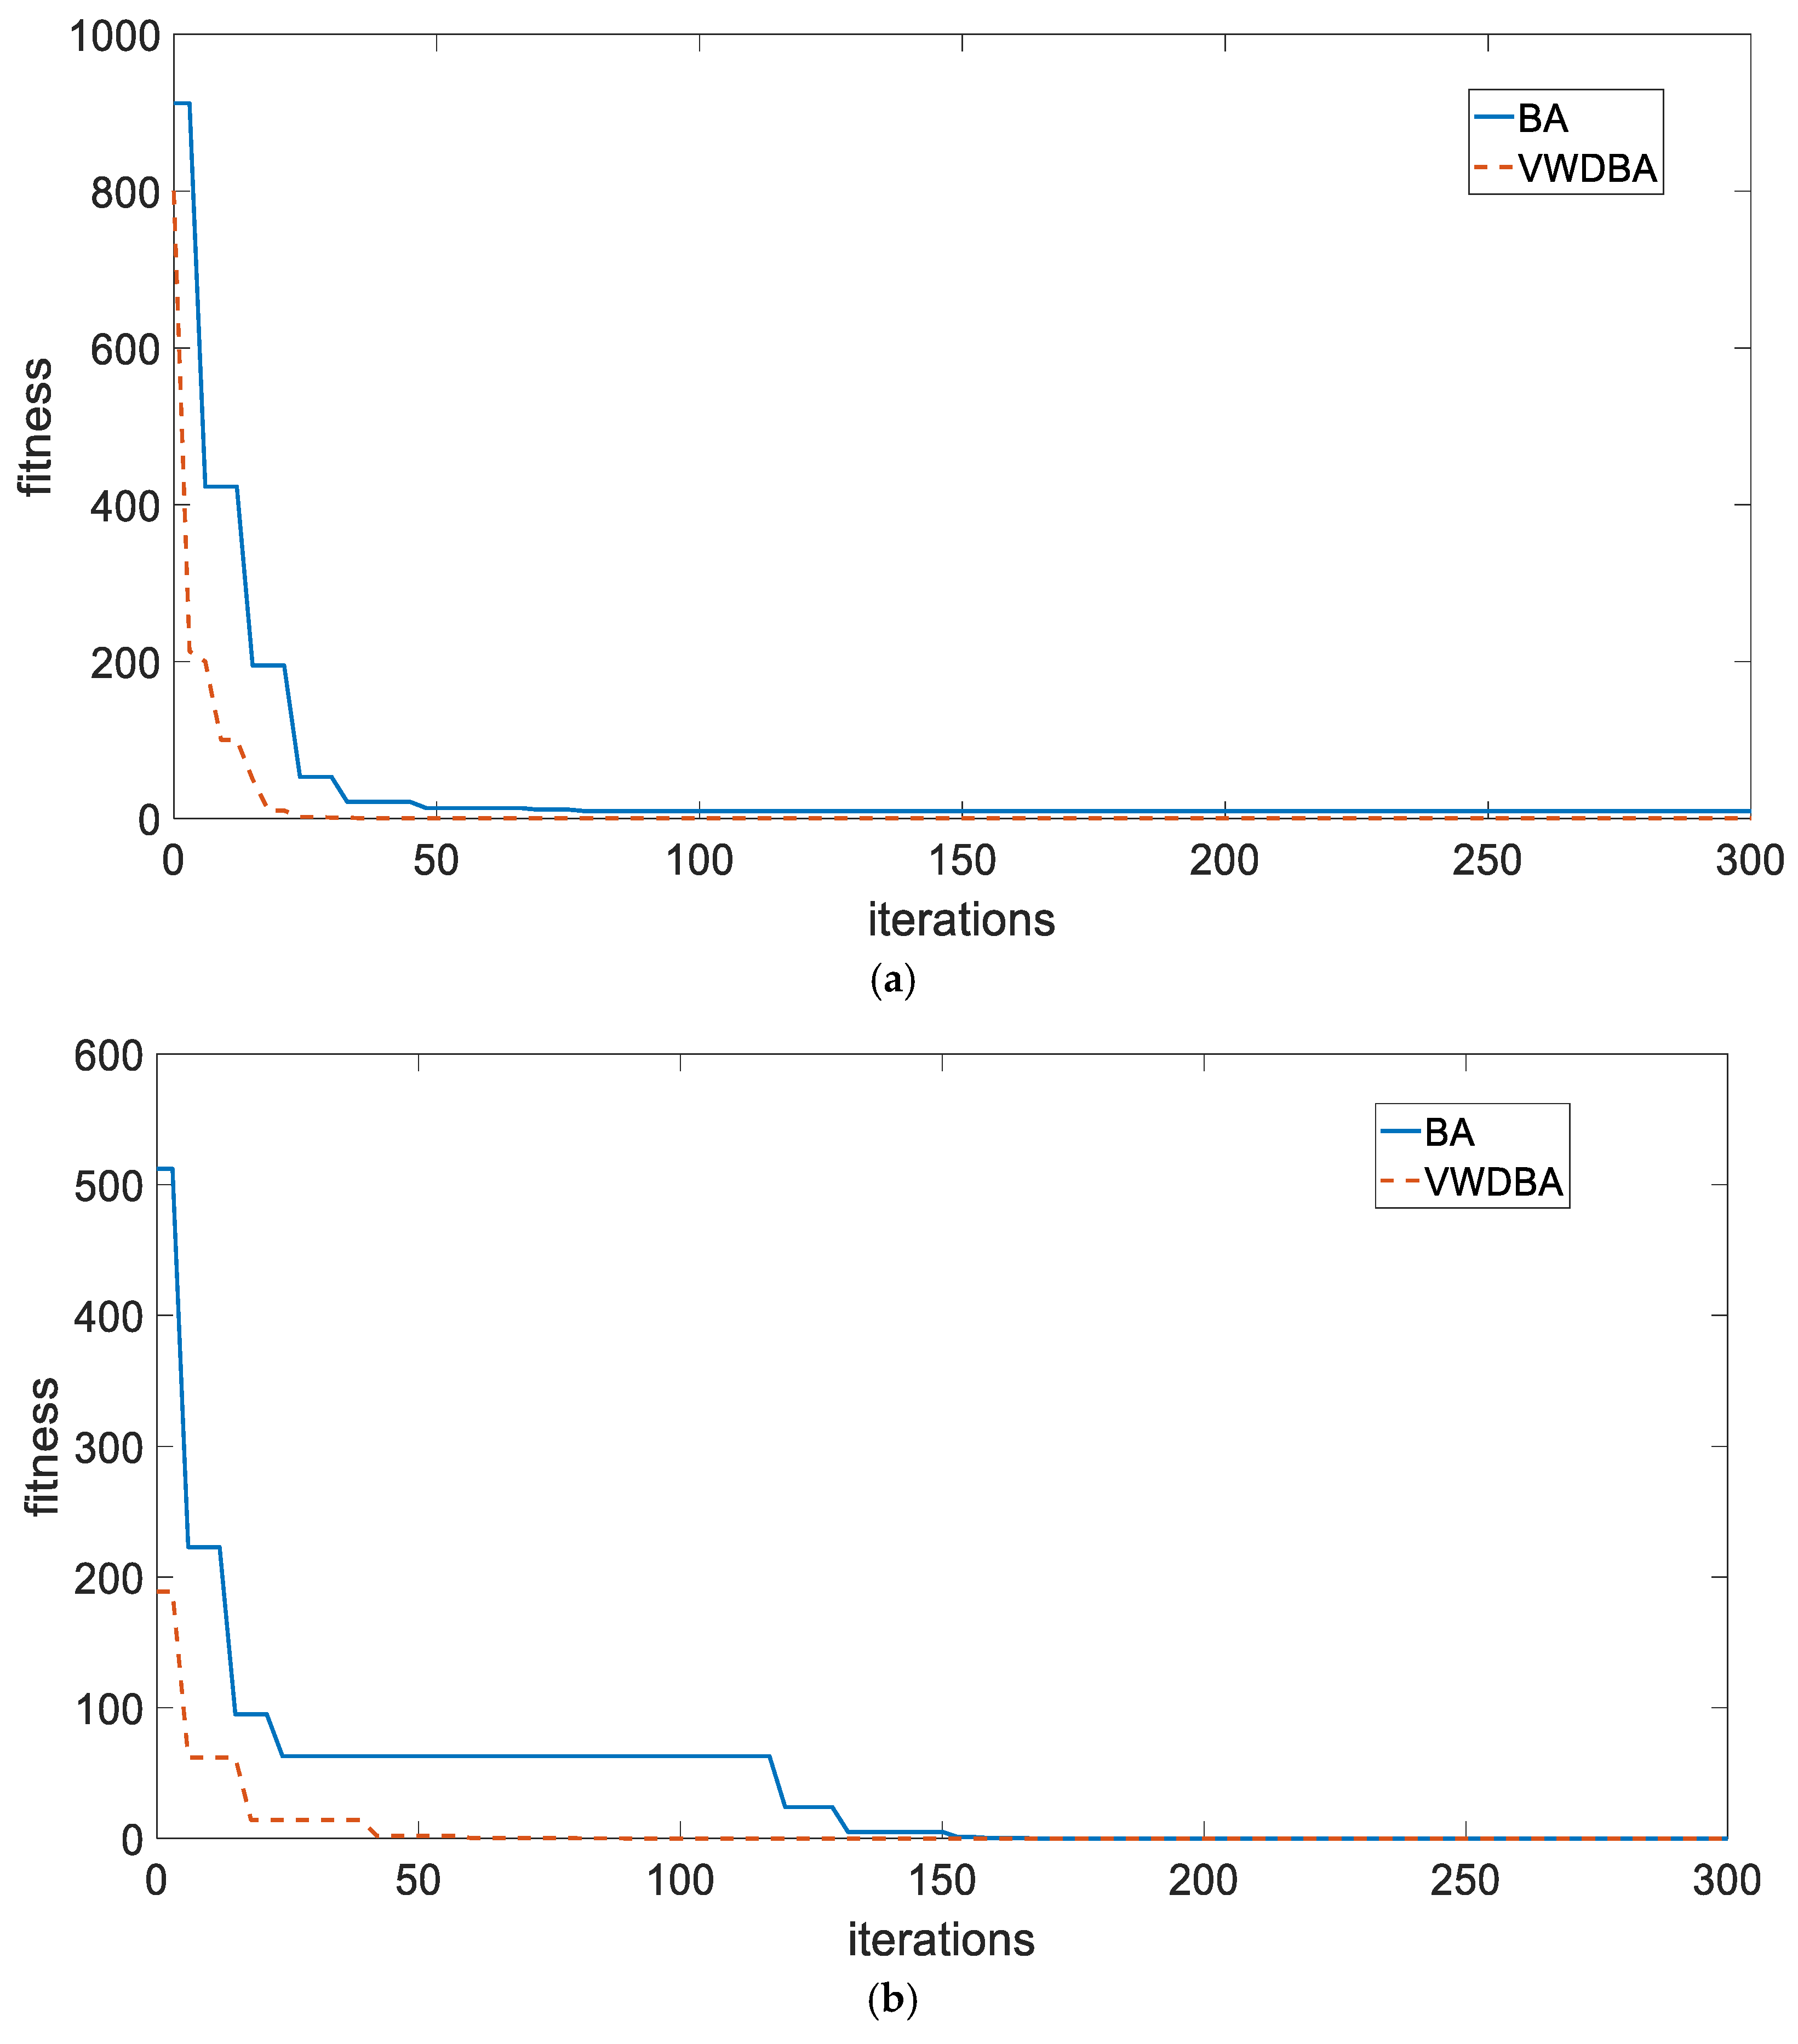
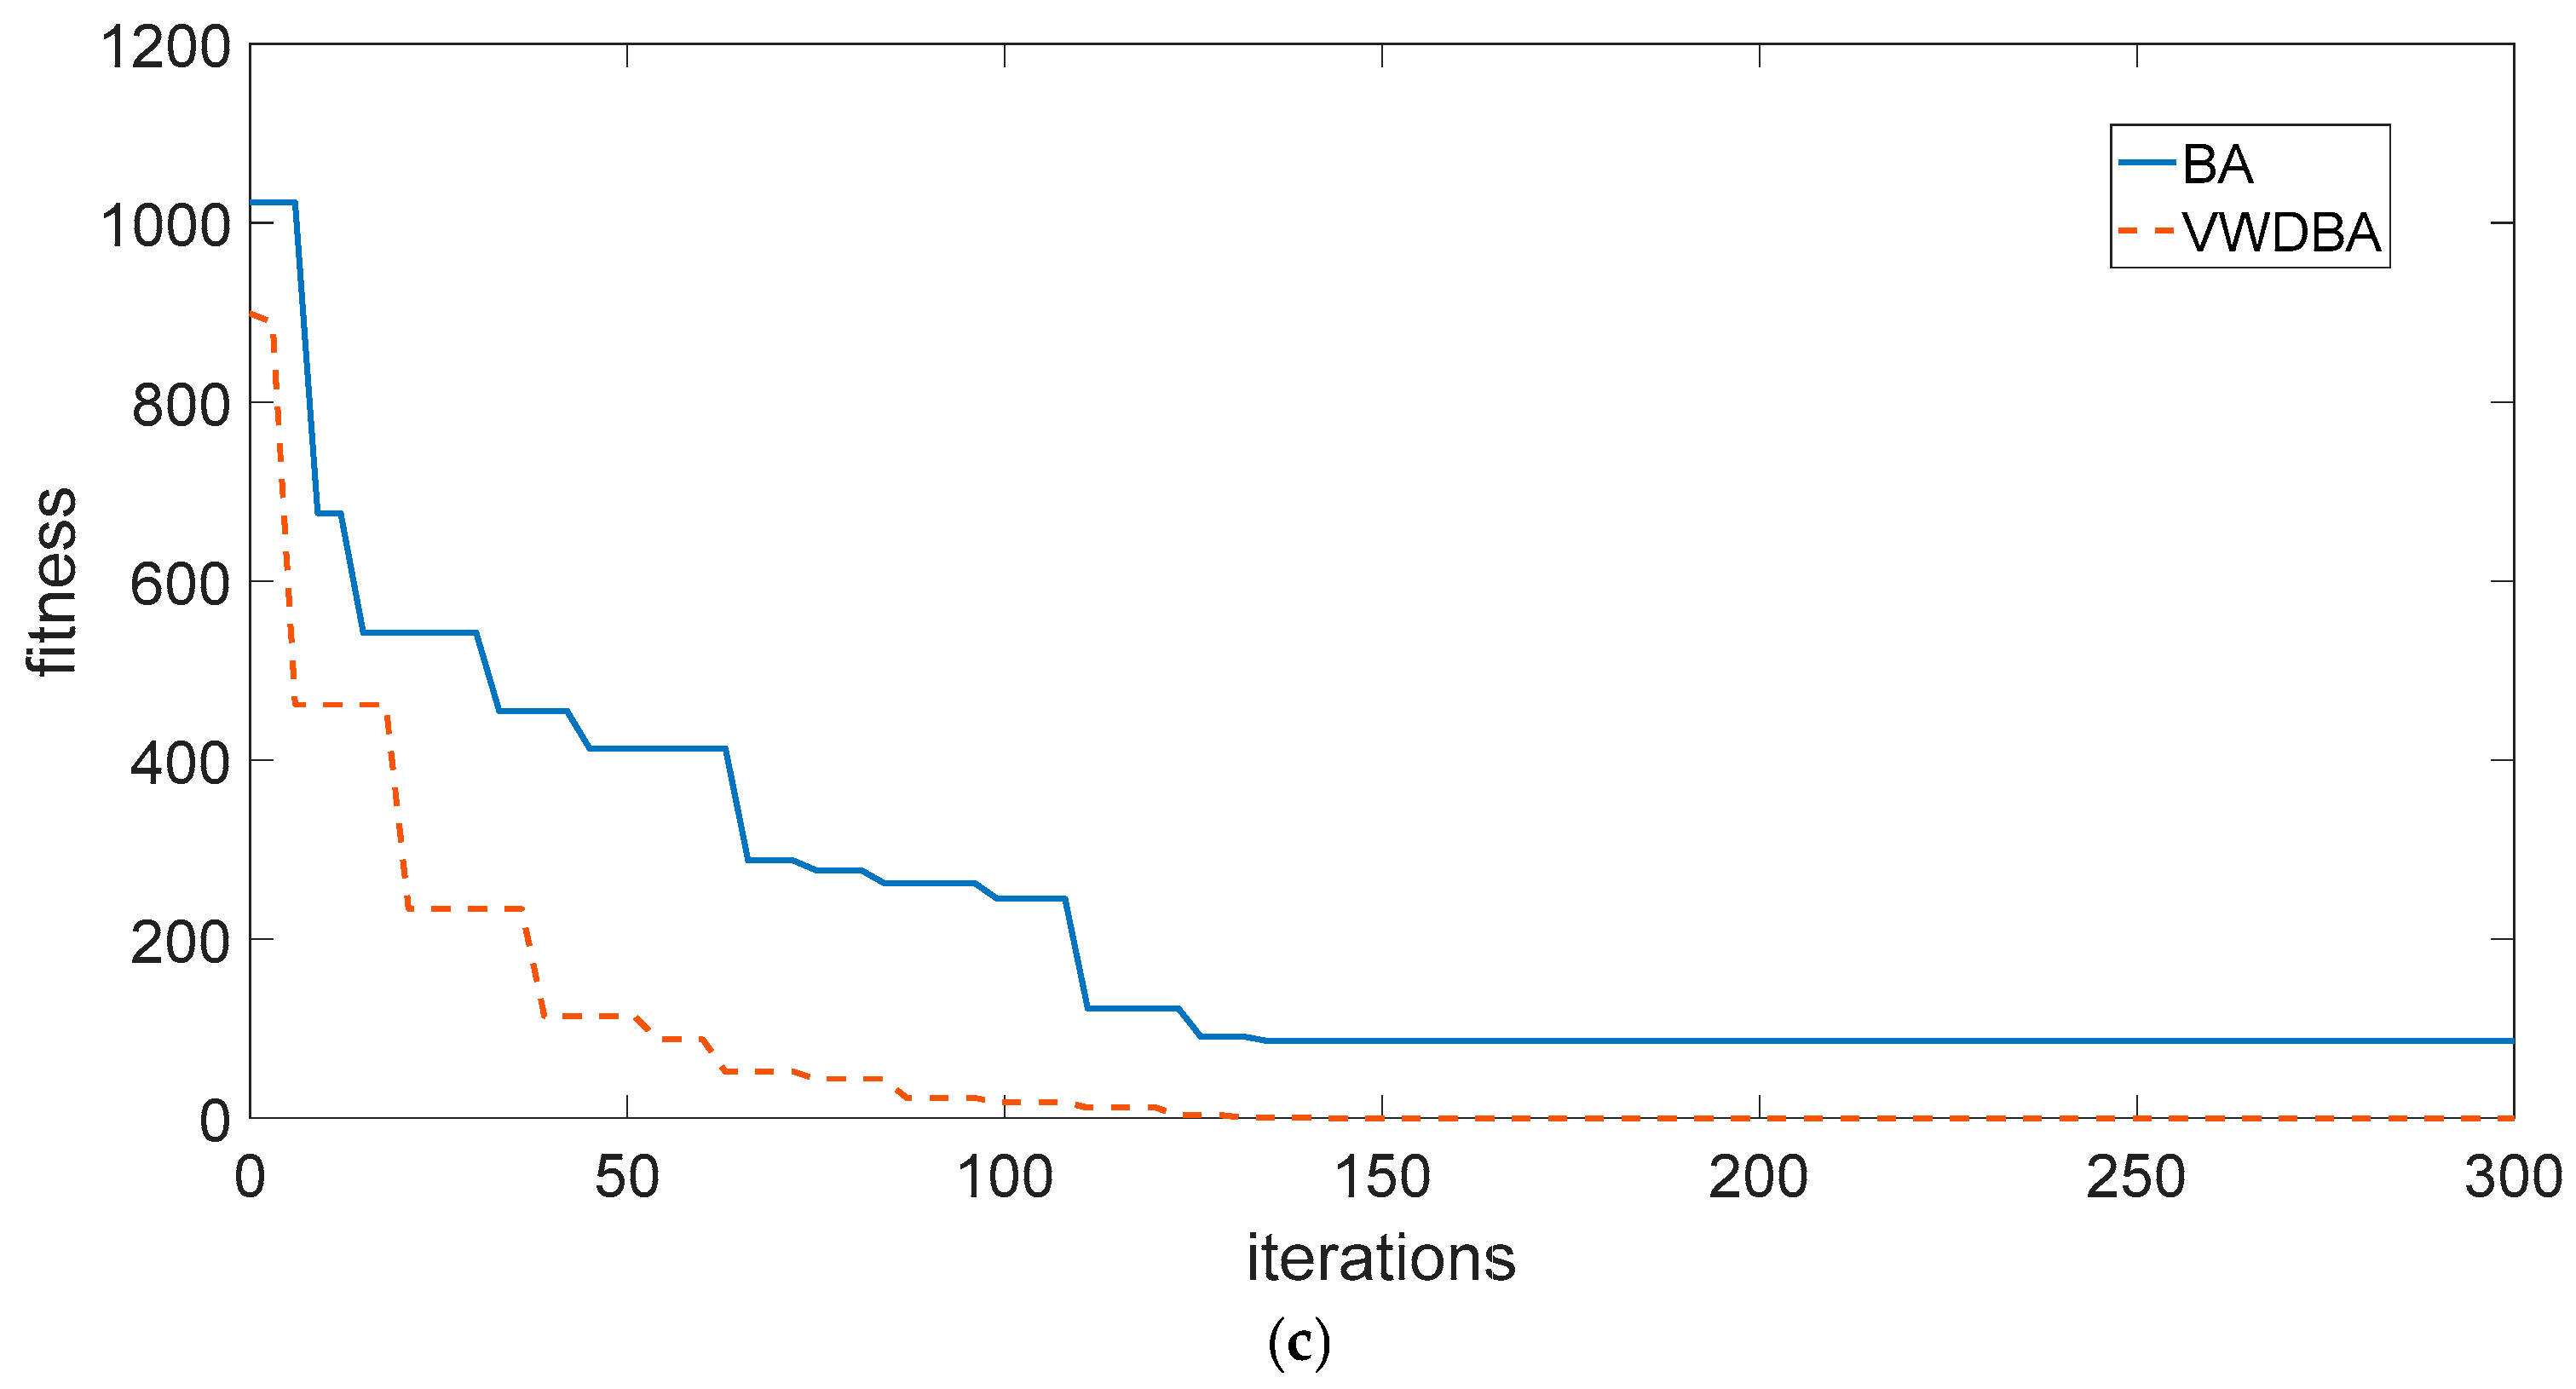
The relationship between the fitness value of the test function and the number of iterations is shown in Figure 3. For Griewank, the VWDBA is used to converge to the global optimal solution, but the BA cannot reach the same solution, and the rate of convergence is higher for the VWDBA than the BA. The multidimensional function Rastrigrin has high dimensions, multi-peaks, and a large number of local extreme values. Both algorithms reach the global optimal solution, but the VWDBA has fewer iterations than the BA. Schwefel also exhibits the characteristics of high dimensions and multi-peak values, and the function optimization process using the BA tends towards the locally optimal solution, whereas with the VWDBA, not only is the optimal solution of the function found in the space of different dimensions, but the number of iterations is less than that for the BA. Therefore, under the same dimension and population number, the VWDBA is superior to the BA in terms of optimization accuracy, optimization rate, and convergence rate, and can obtain the optimal solution for the function in a few iterations, demonstrating strong global optimization ability and high search accuracy.
Due to the large number of variables involved in the paper, in order to express the variables involved in all the formulas in the paper more clearly, the explanations of the variables appearing in the paper can all be found in the query in Appendix A.

4. Bat Algorithm with Velocity Weight Perturbation

4.1. Kernel Parameter Optimization Based on VWDBA

In order to objectively evaluate the noise reduction effect of the proposed VWDBA-Volterra algorithm on mixed noise, an 8-bit grayscale image (Kodak24) is used as the original image, and GN and SPN are used as the mixed noise. Five kinds of experiments were conducted to verify the performance of VWDBA-Volterra on single noise and mixed noise reduction, as well as the effects of the iteration count and bat population size in the VWDBA on the filtering performance.
Experiment 1: To verify the performance of VWDBA-Volterra in filtering a single type of noise, eight kinds of images (an image from the Kodak24 dataset) containing noise, including images containing additive GN (σ: 10, 15, 20, 25, respectively) and images containing SPN (d: 10%, 15%, 20%, 25%, respectively), are used as the image test sets, and the above eight images are denoised, respectively, by using VWDBA-Volterra. The peak signal-to-noise ratio (PSNR) and multi-scale structural similarity (MSSSIM) indexes are used to evaluate image quality regarding noise reduction.
In Experiment 1, a third-order Volterra filter is used. The memory length of the first-order time domain kernel of the Volterra filter is 6, that of the second-order time domain kernel is 4, and that of the third-order time domain kernel is 3. The bat population size in VWDBA is set to 30, f i [ 0 , 10 ] , r 0 = 1 , A 0 = 0.4 , α = 0.95 , and γ = 0.05 ; the number of iterations (t) is set to 200. The results of the kernel parameter optimization are shown in Table 2.
Experiment 2: To test the performance of VWDBA-Volterra in removing mixed noise, the algorithm is used to reduce the noise of the image test (Kodak 24) set containing additive GN and SPN. The four kinds of noise intensity [σ, d] selected in the experiment are [10, 10%], [10, 25%], [25, 25%], [10, 25%]. The images after noise reduction are compared with those denoised by WNNM [7], LRTV [11], WESNR [13], LSM-NLR [14], and Transformer-CNN [15]. The noise reduction capability of VWDBA-Volterra was analyzed from the perspective of data quantification and vision. A third-order Volterra filter in which the parameters are the same as the filter in Experiment 1 is used in Experiment 2; the differences in peak signal-to-noise ratio (ΔPSNR), structural similarity index (ΔSSIM), gradient magnitude similarity deviation (GMSD), and learned perceptual image patch similarity (LPIPS) are used as the evaluation indexes of the effectiveness of image noise reduction. After denoising 24 images from the kodak24 dataset, the average ΔPSNR, average ΔSSIM, average GMSD, and average LPIPS of the denoised images obtained by each algorithm were recorded, as were their standard deviations.
Experiment 3: The computational complexity and real-time filtering performance of the method proposed in this paper were verified. The computational complexity and operational time of the VWDBA-optimized VOLTERRA filtering method were compared for filtering a 256 × 256-pixel ‘Kodak24’ with mixed noise [10, 10%]. Several methods were compared, including such as WNNM, LRTV, WESNR, LSM-NLR, and Transformer-CNN; each filtering algorithm was independently run on 24 noisy images and the average running time was recorded.
Experiment 4: The effect of the number of iterations in VWDBA on the filter performance was tested, and four kinds of mixed noise intensity [σ, d] are selected: [10, 10%], [10, 25%], [25, 25%], and [10, 25%]. A third-order Volterra filter was used, in which the parameters are the same as those in Experiment 1 except for the number of iterations in the VWDBA. The interval for the number of iterations was [40, 200], to test the effect of altering the number of iterations in the VWDBA on the ability of the VWDBA-Volterra filter to reduce mixed noise. PSNR and GMSD were used as the image-quality evaluation indices.
Experiment 5: The effect of the bat population size in the VWDBA on the filter performance was tested; four different noise intensities [σ, d] are selected in the experiment, the same as in Experiment 2. A third-order Volterra filter was used, in which the parameters are the same as those in Experiment 1 except for the bat population size in the VWDBA. The population size interval was [10, 35]. The effect of the bat population size in VWDBA on the ability of the VWDBA-Volterra filter to reduce mixed noise is tested, and PSNR and GMSD are used as the image-quality evaluation indices.

4.2. Analysis of Experimental Results

(1)
Results of Experiment 1:
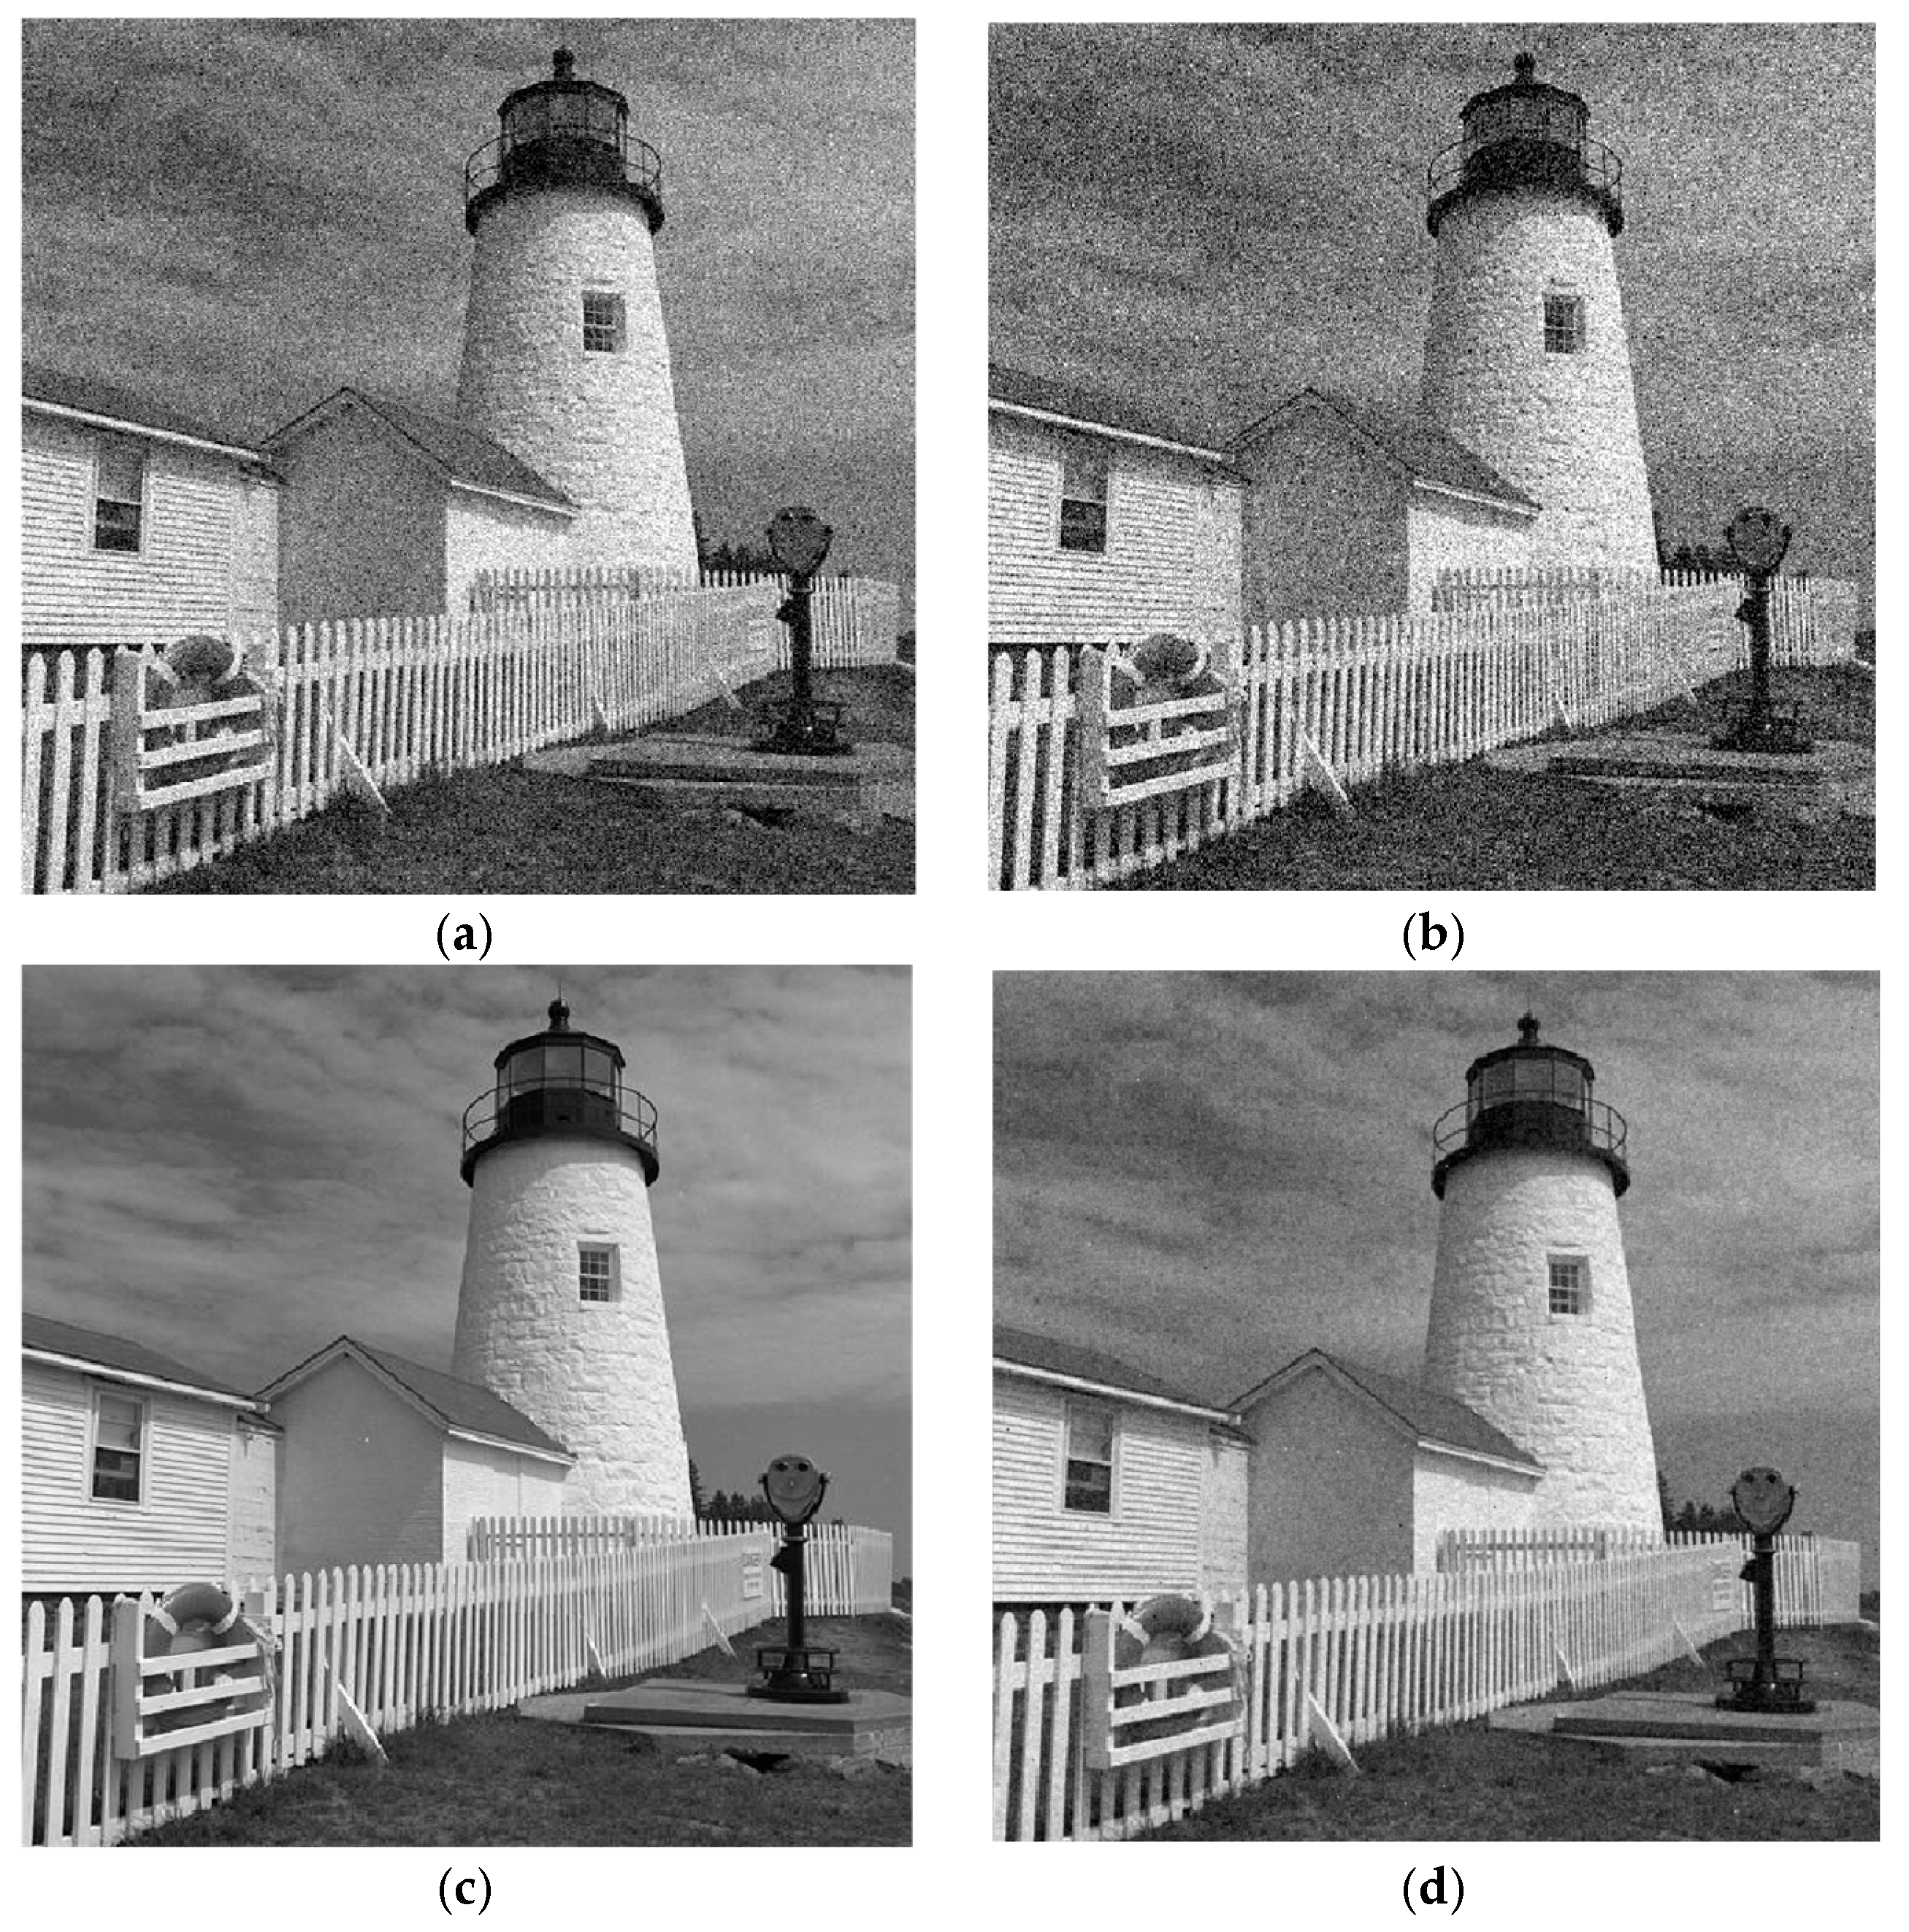
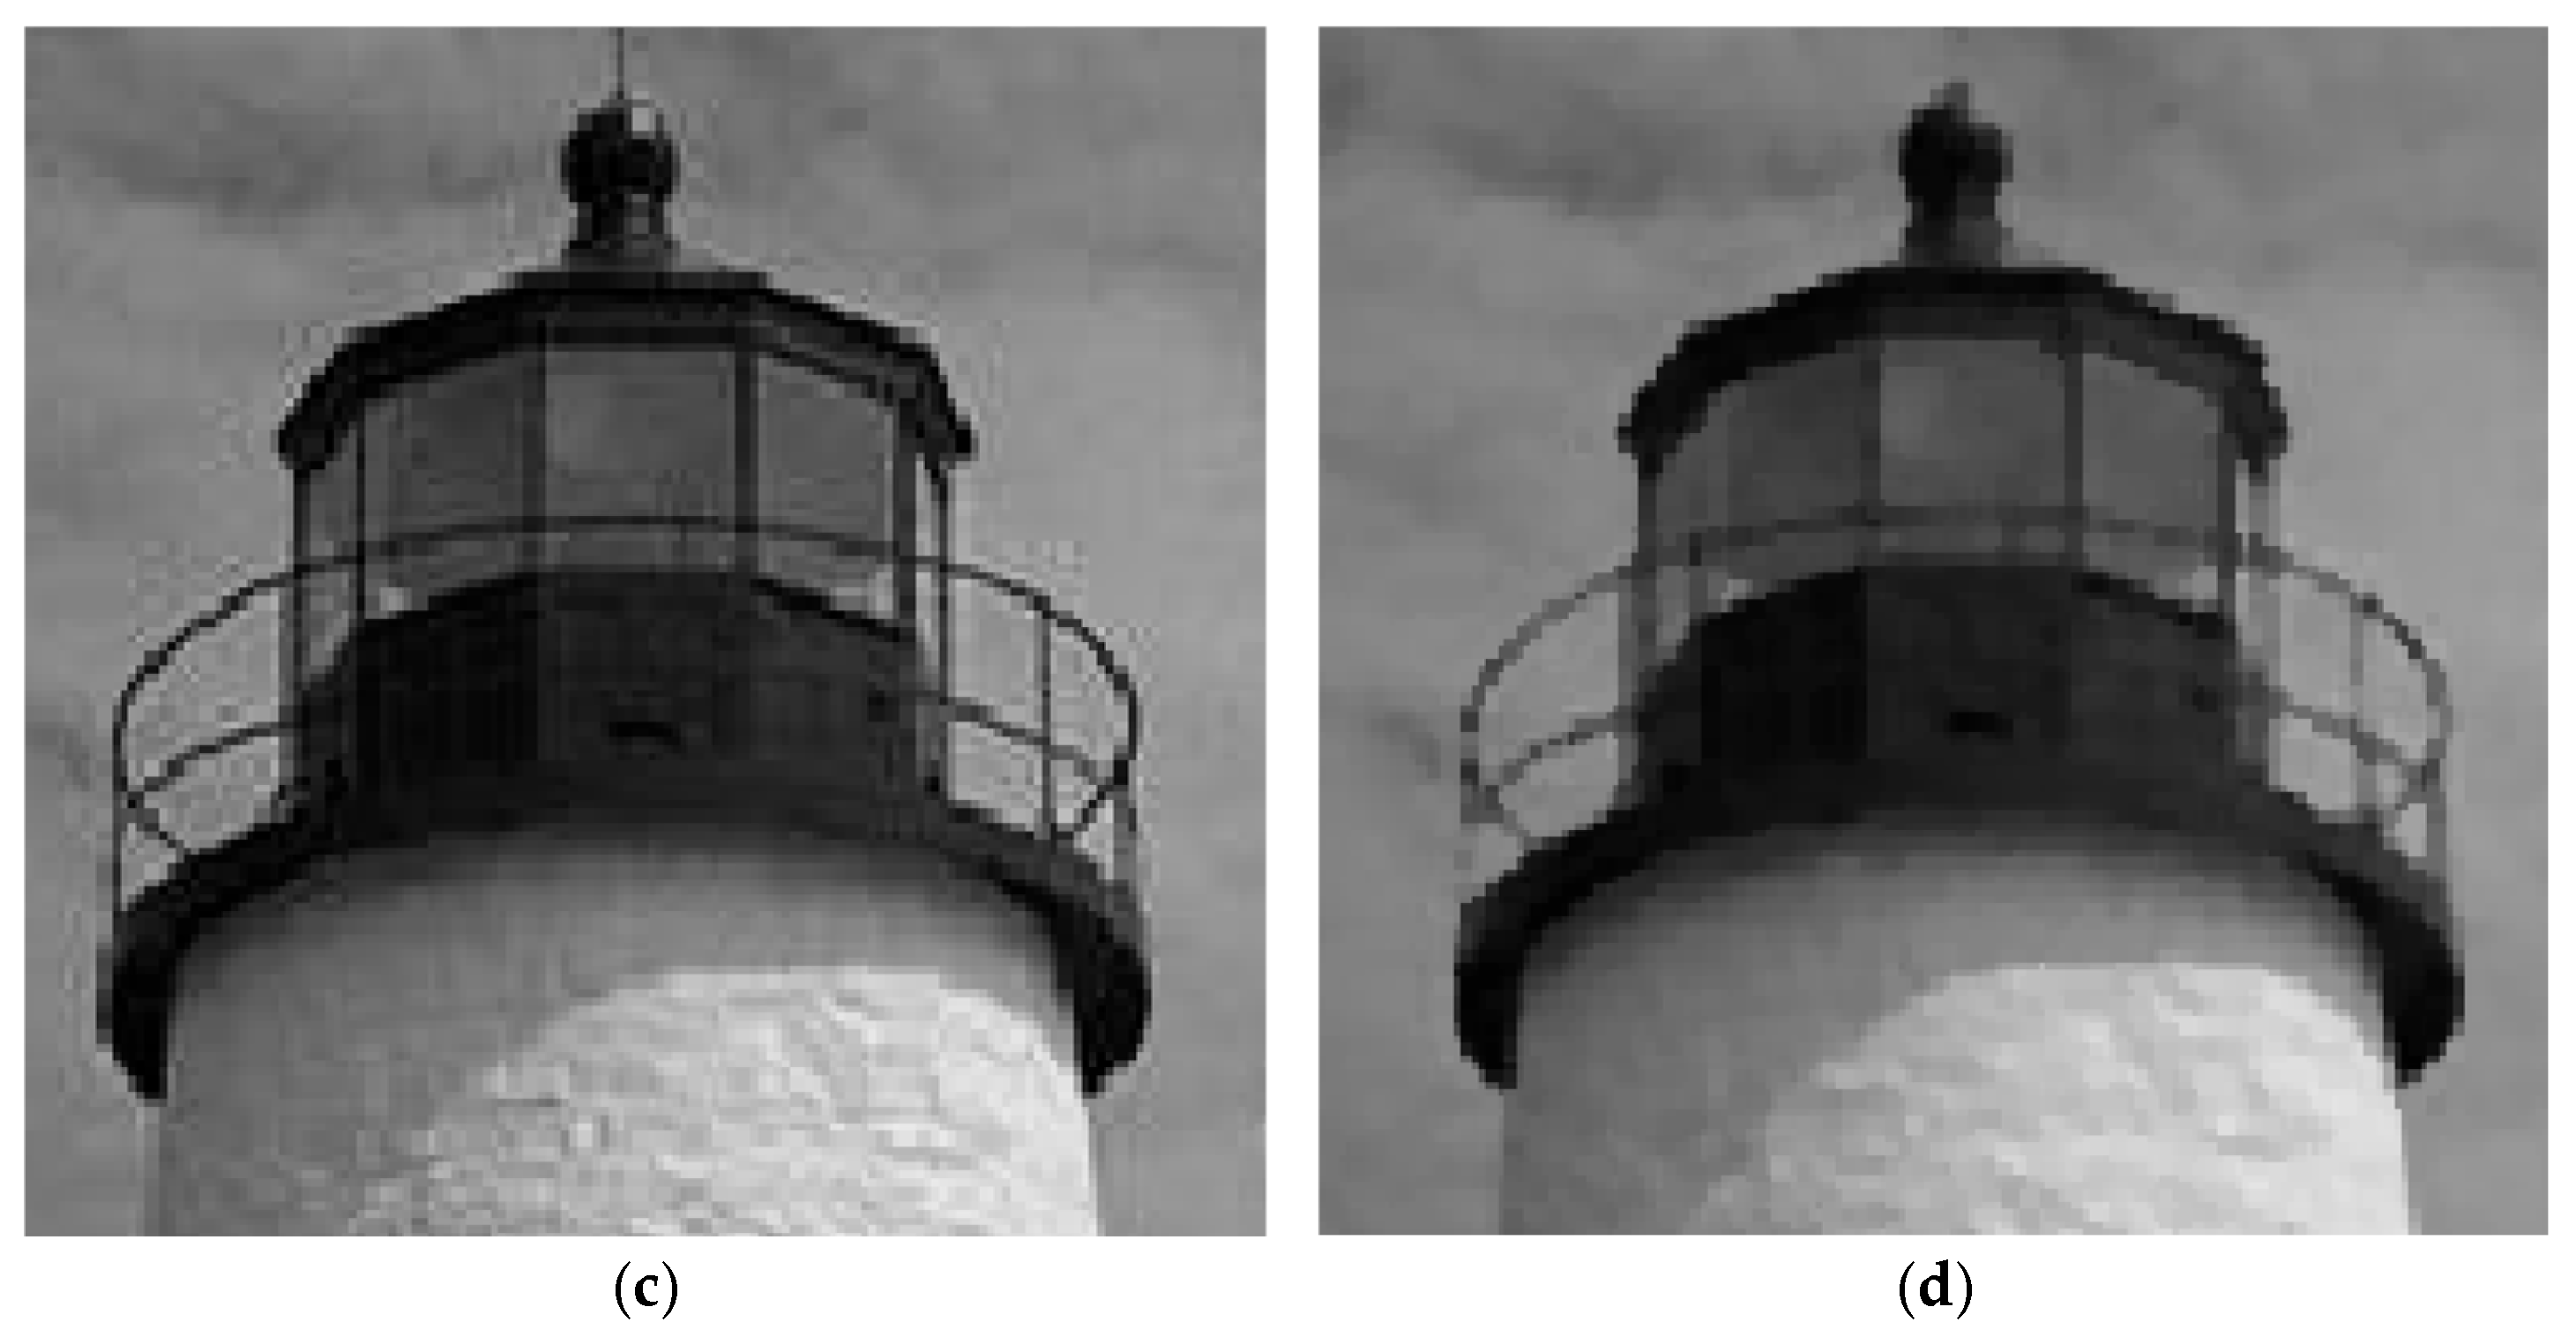
The effectiveness of the VWDBA-Volterra filter before and after removing GN is shown in Figure 4. Figure 4a,c show images with GN (σ = 10, σ = 20) as the image-quality evaluation index; Figure 4b,d show images in which the noise has been reduced through the use of VWDBA-Volterra. Compared with Figure 4a,b, in Figure 4c,d, the edges of the image after noise reduction are clearer and the effect of the noise reduction is better.
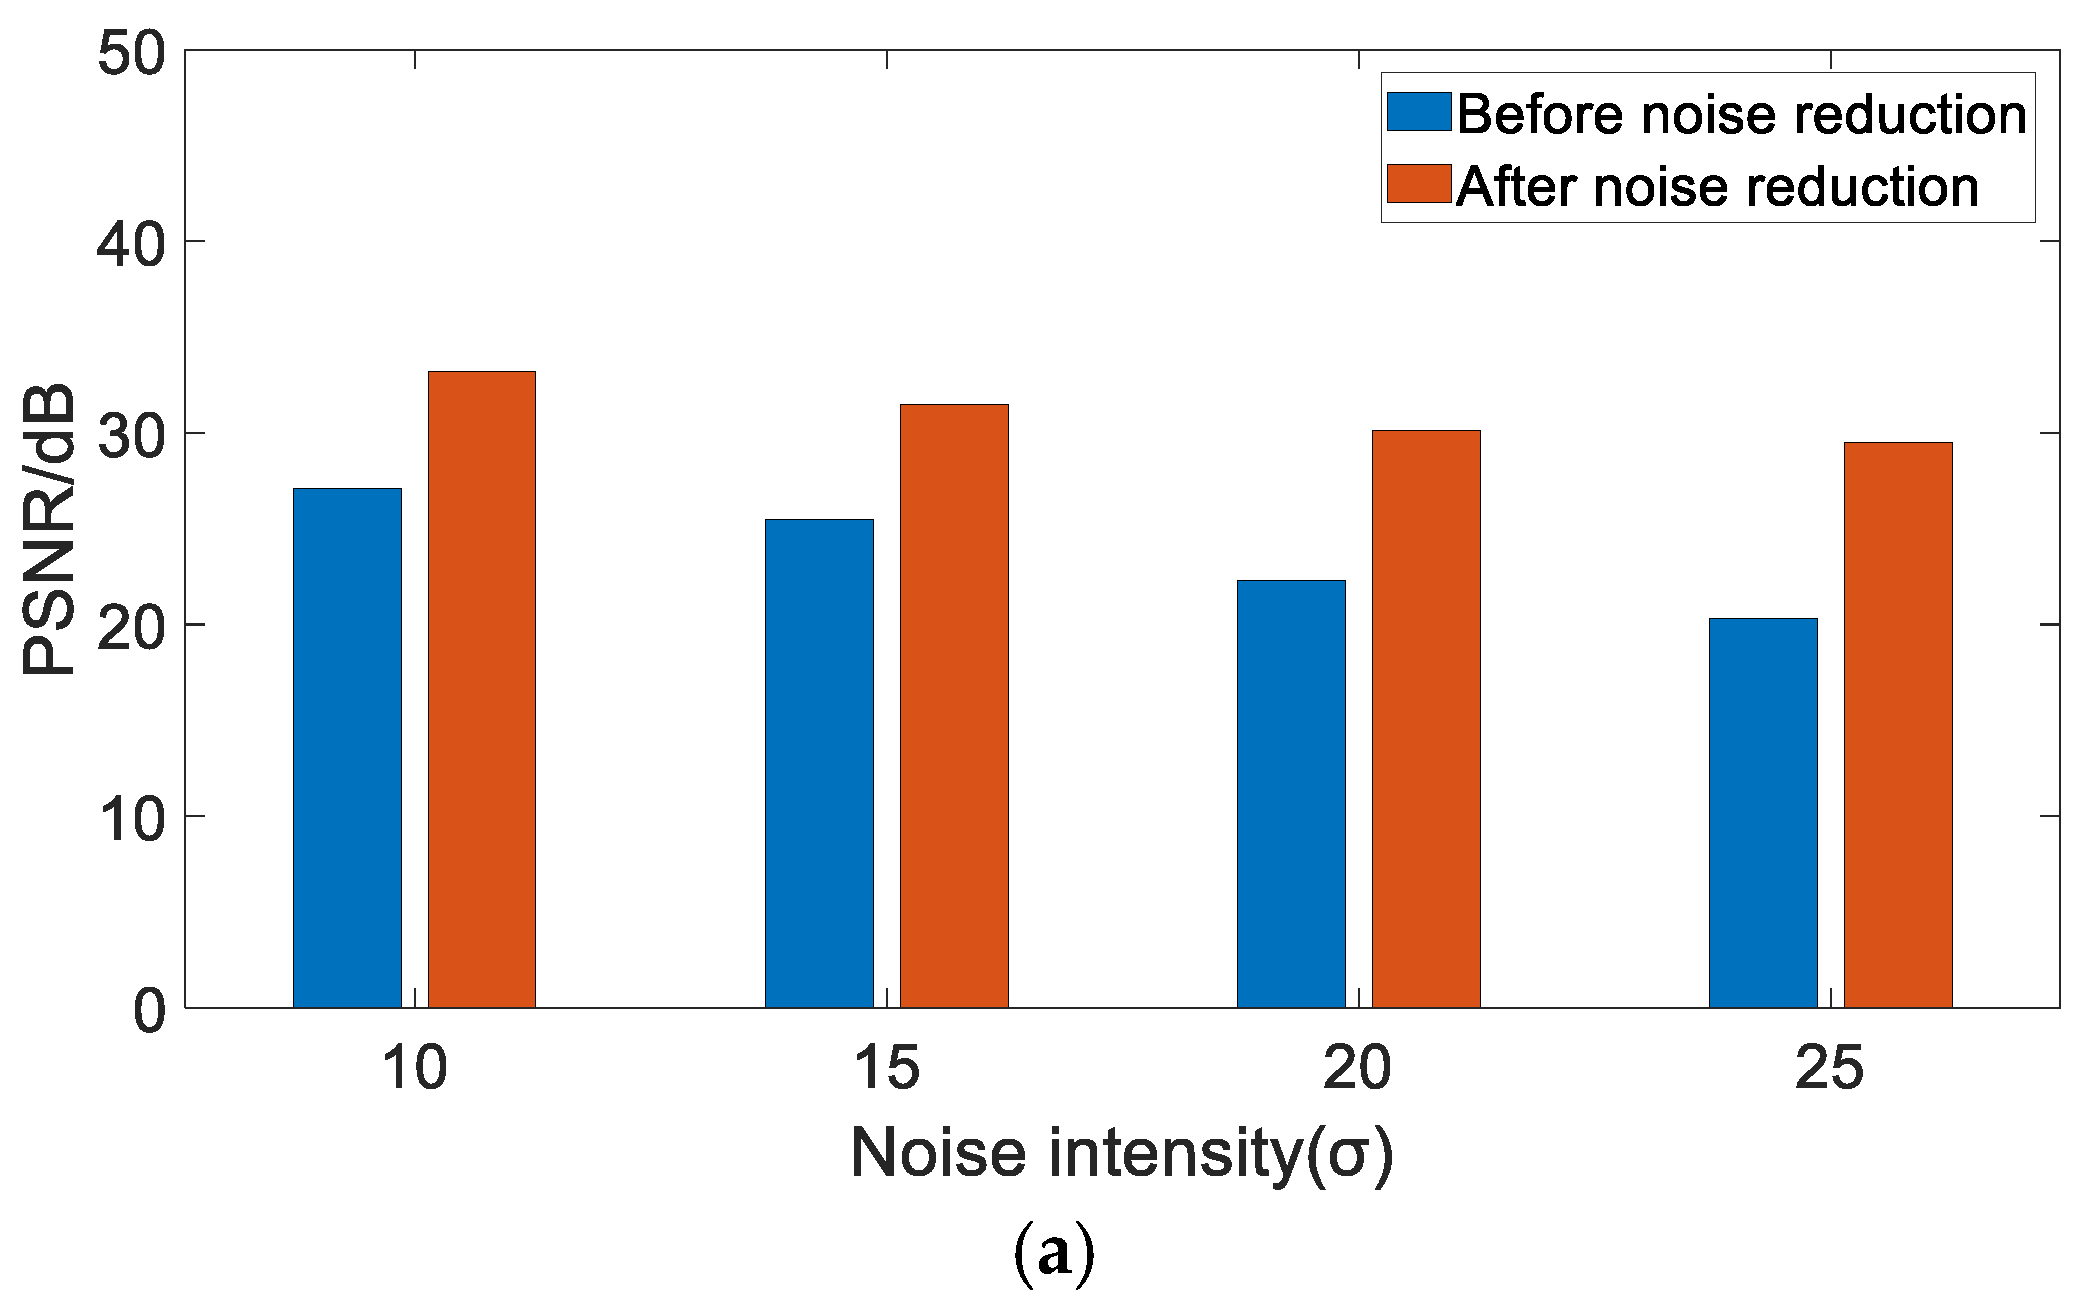
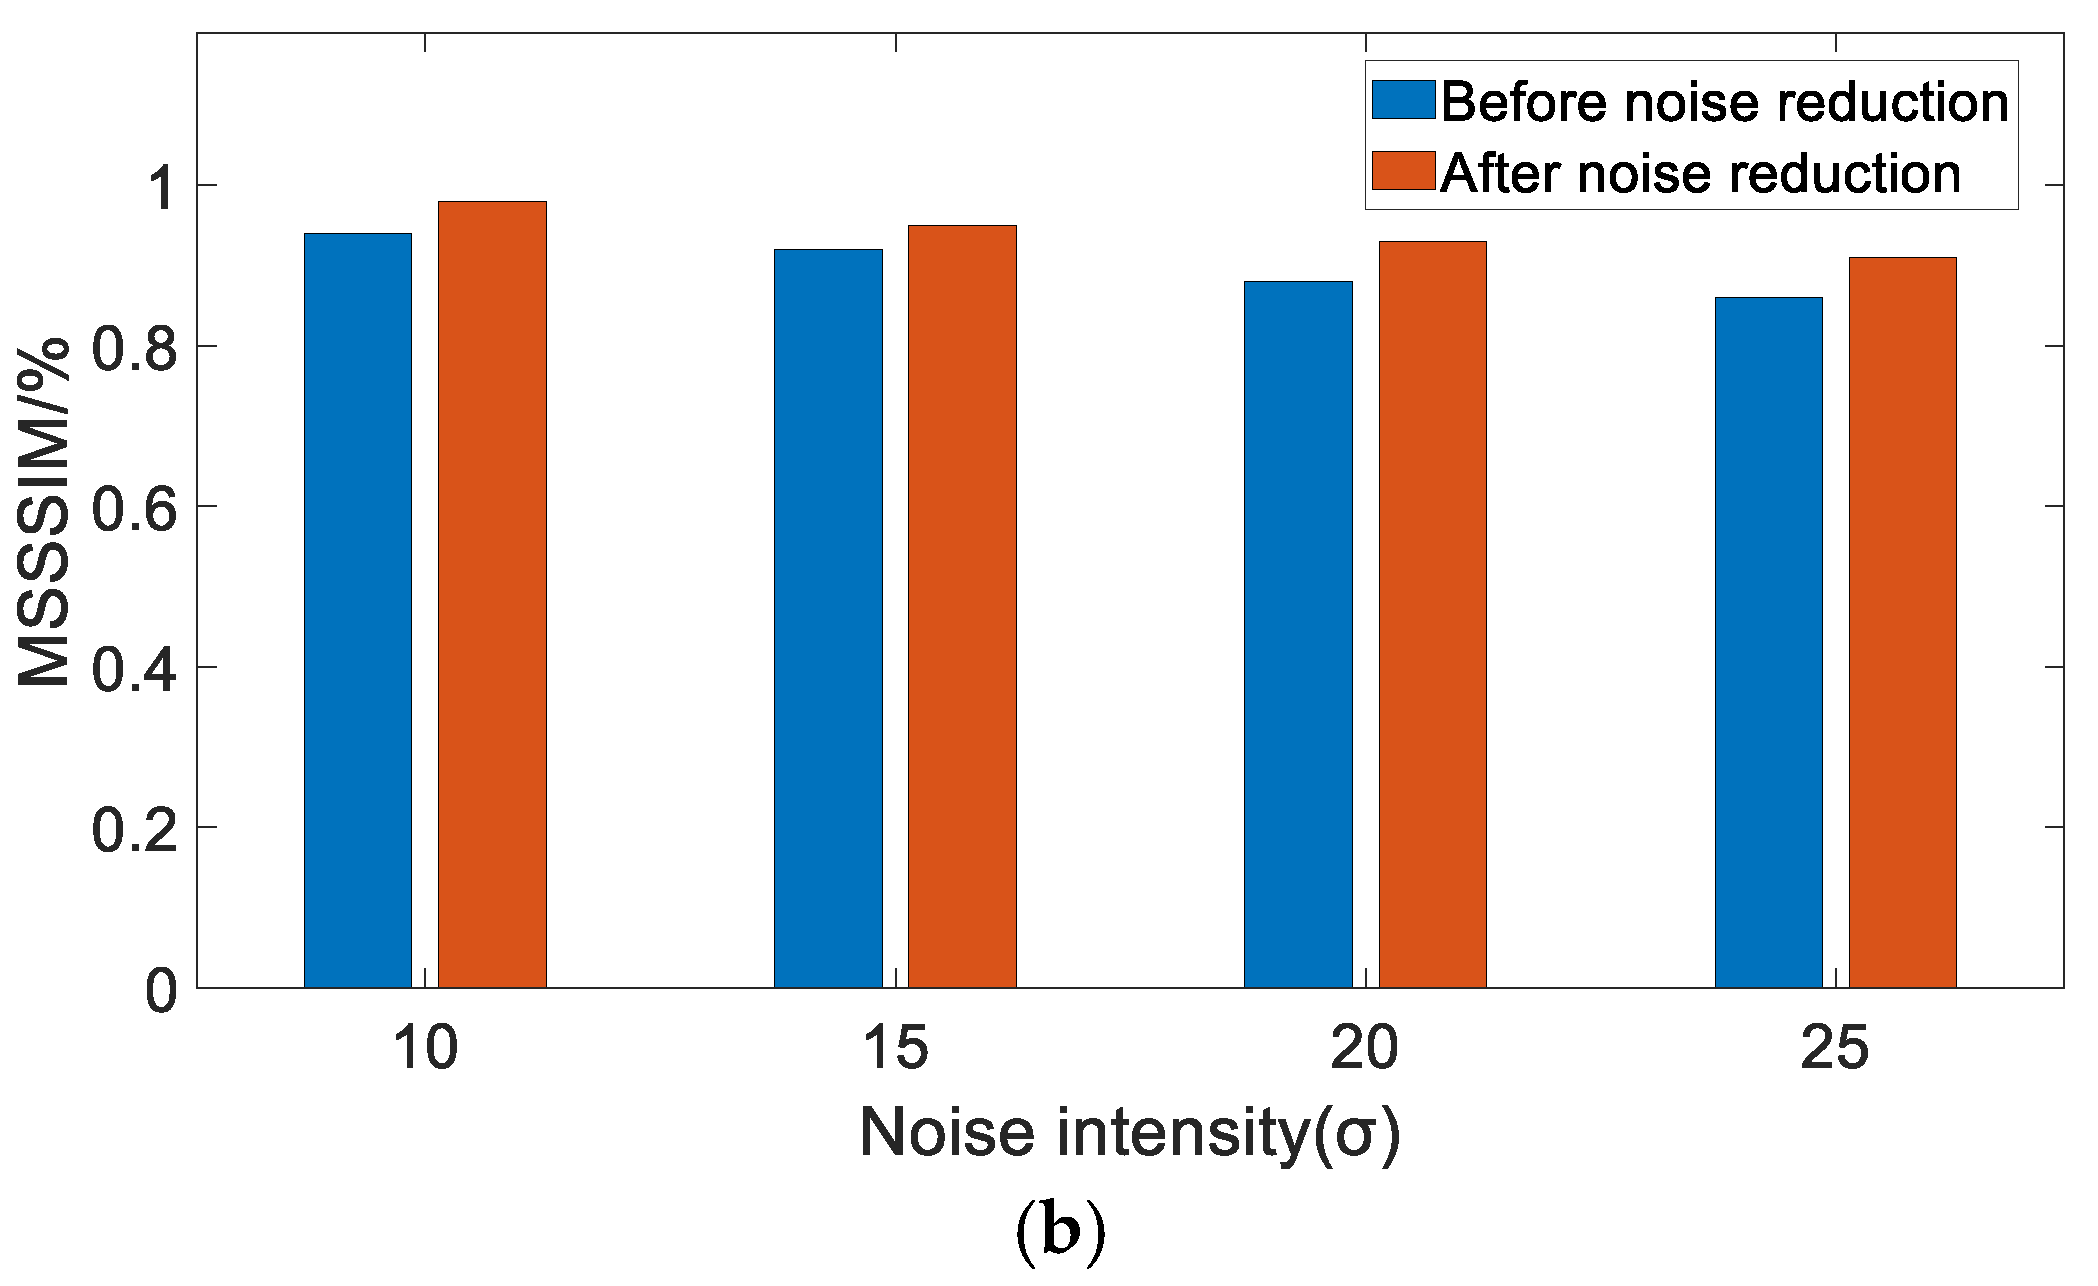
The PSNR and MSSSIM of the image after noise reduction with VWDBA-Volterra are shown in Figure 5. As shown in Figure 5a, by using VWDBA-Volterra to denoise images with GN, in which the variance increased incrementally—σ = 10, 15, 20, 25—the PSNR of the images is improved. All the PSNR values of the image after noise reduction are more than 30; the differences in the PSNR values of the image before and after noise reduction are 6.1, 6.3, 7.9, 9.4, respectively. The larger the σ of GN contained in the image, the greater the change in PSNR before and after noise reduction and the better the noise reduction effect. As shown in Figure 5b, the improvement of MSSSIM index in images after noise reduction is significantly above 0.9, and the differences in MSSSIM before and after noise reduction are 0.04, 0.05, 0.06, 0.08, respectively. The larger the σ of GN in the image, the greater the change in MSSSIM before and after the noise reduction, and the better the noise reduction effect.
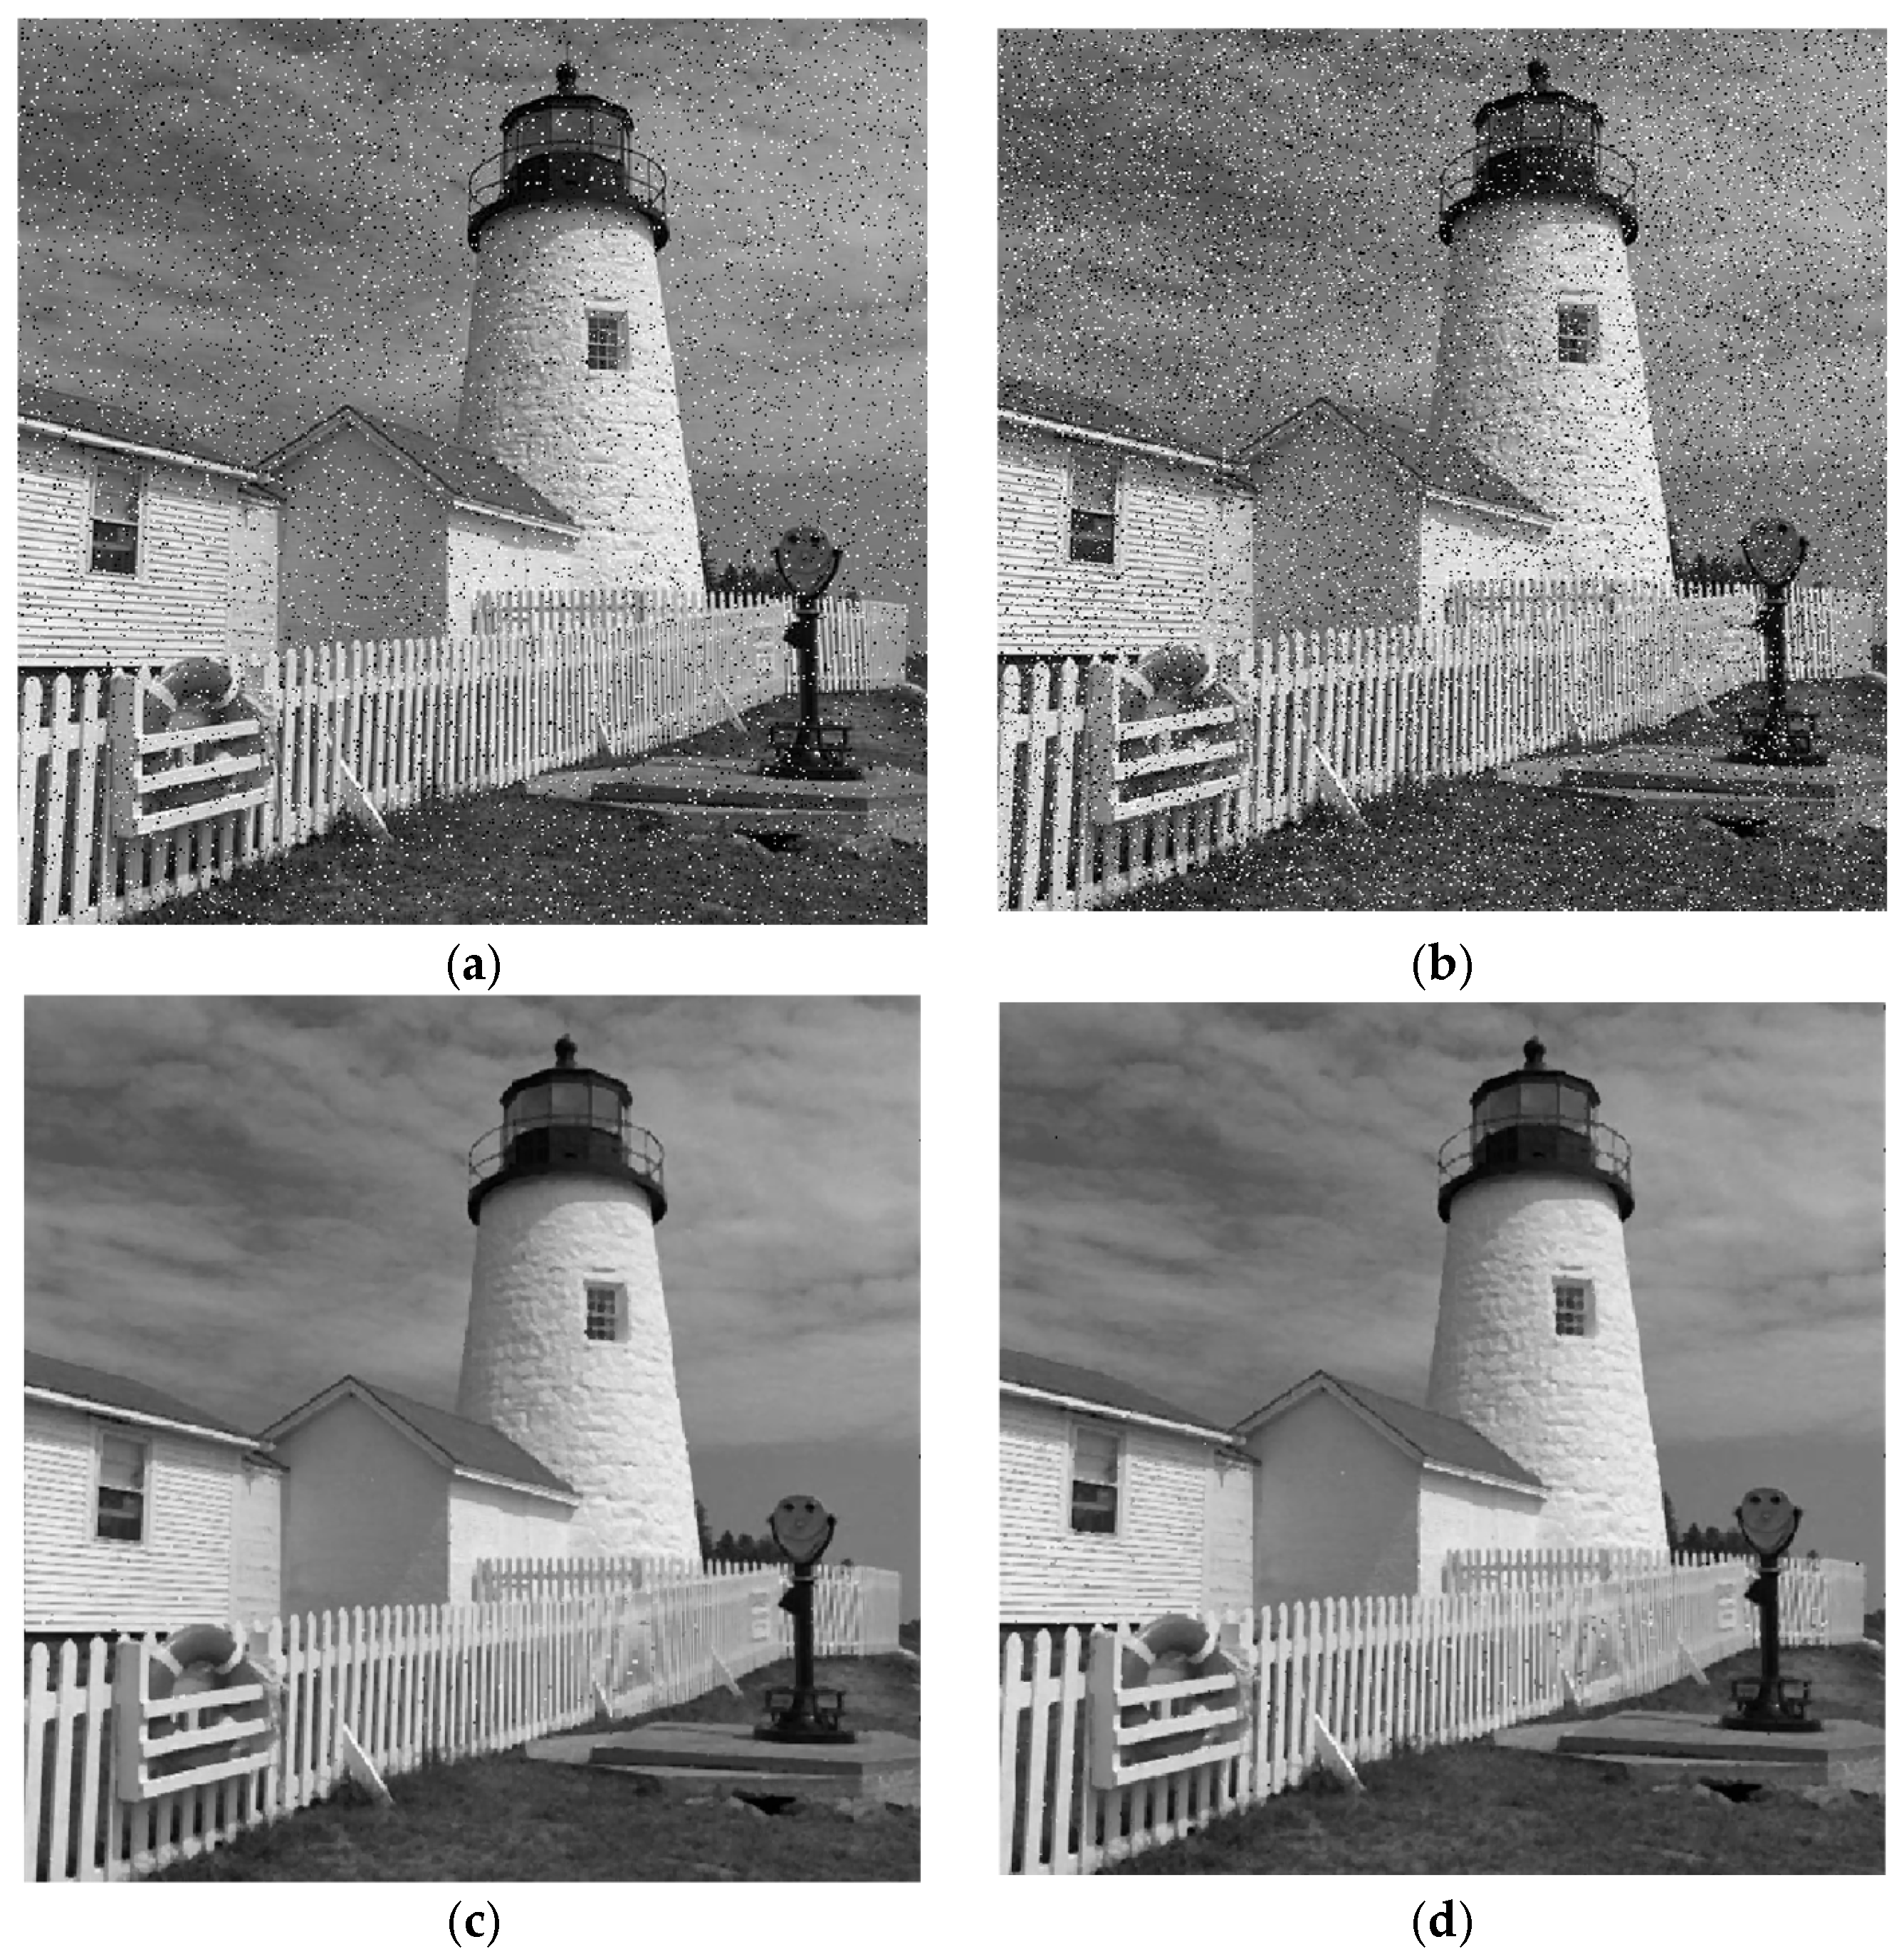
Images before and after removing SPN, showing the effect of the VWDBA-Volterra filter, are shown in Figure 6. Figure 6a,c show images with SPN (d = 10%, d = 20%) as the image-quality evaluation index; Figure 6b,d show images whose noise has been reduced through the use of VWDBA-Volterra. Compared with Figure 6a,b, the noise reduction effect in Figure 6c,d, is evident.
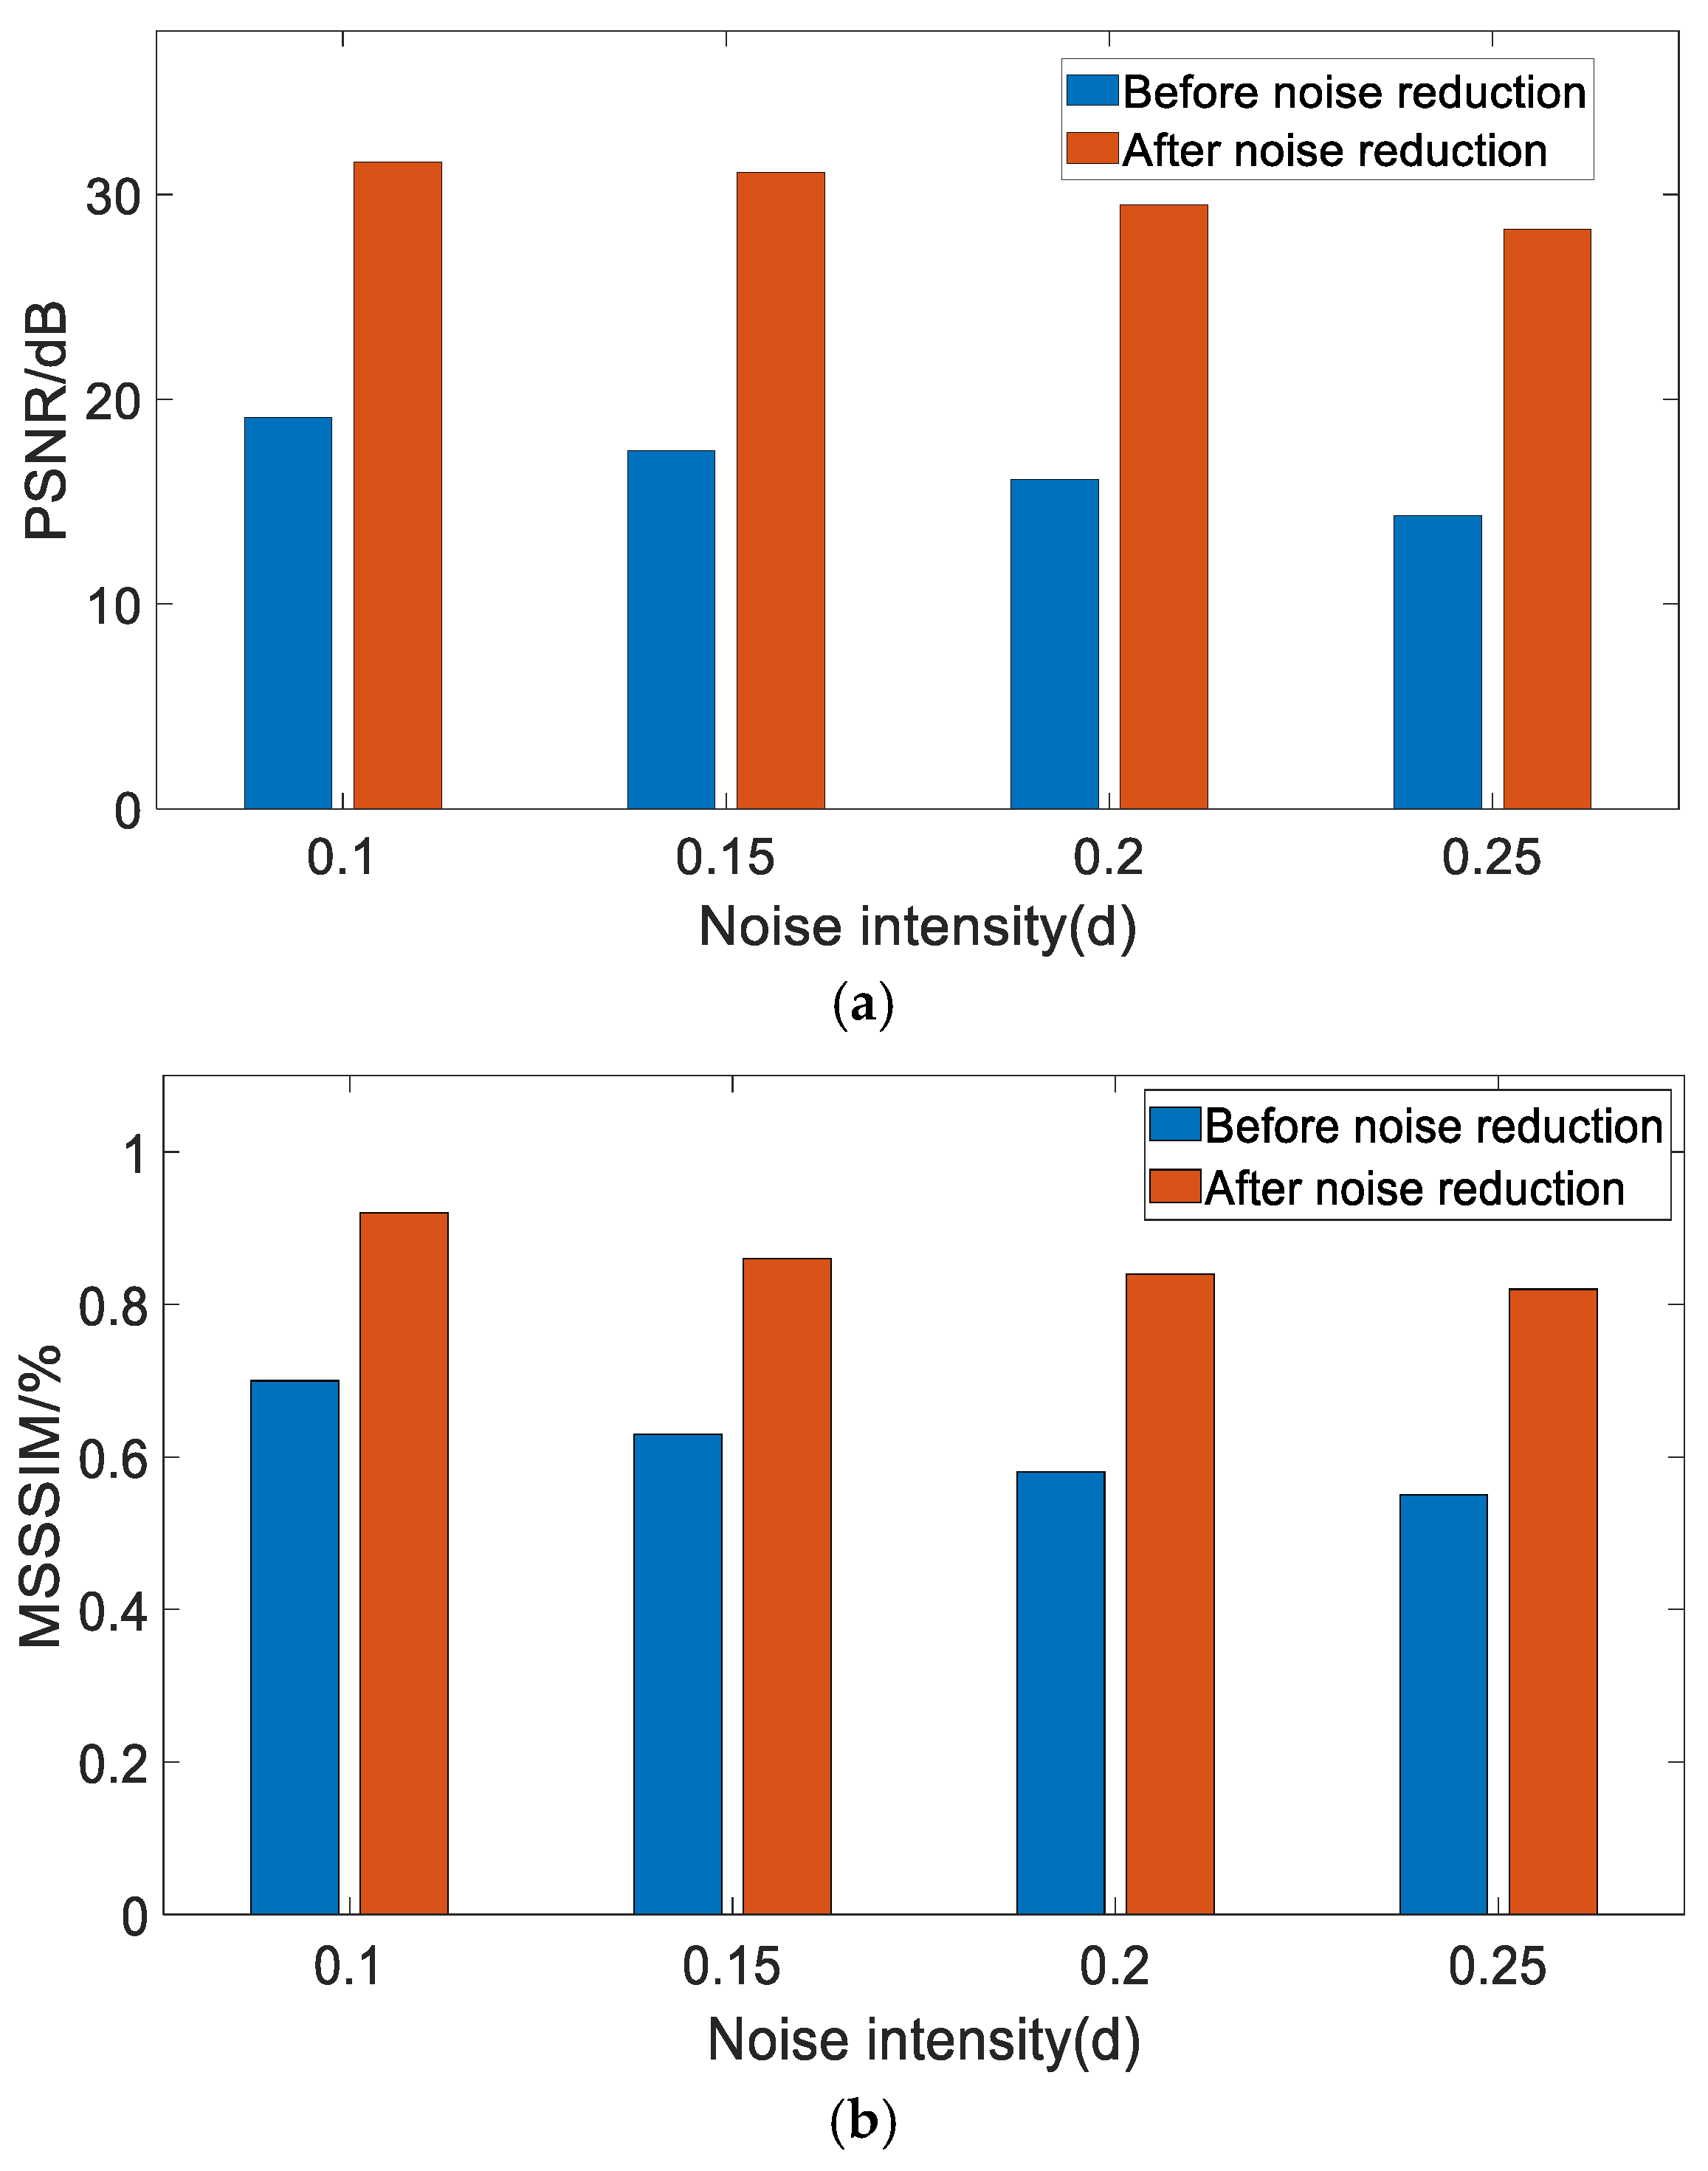
The PSNR and MSSSIM values of the image after noise reduction through the use of VWDBA-Volterra are shown in Figure 7. As shown in Figure 7a, by using VWDBA-Volterra to denoise images with SPN with values of d = 10%, 15%, 20%, 25%, the PSNR value of the images is improved. All the PSNR values of the images after noise reduction reached more than 29, and the differences in PSNR values of image before and after noise reduction are 12.7, 13.4, 13.8, 14.3. The larger the d of SPN contained in the image, the greater the change in PSNR before and after noise reduction, and the better the noise reduction effect. As shown in Figure 7b, the MSSSIM values of images after noise reduction are significantly improved; all are above 0.8. The differences in MSSSIM values before and after noise reduction are 0.23, 0.24, 0.26, 0.28, respectively. The larger d of SPN in the image, the greater the change in MSSSIM before and after the noise reduction and the better the noise reduction effect.
(2)
Results of Experiment 2:
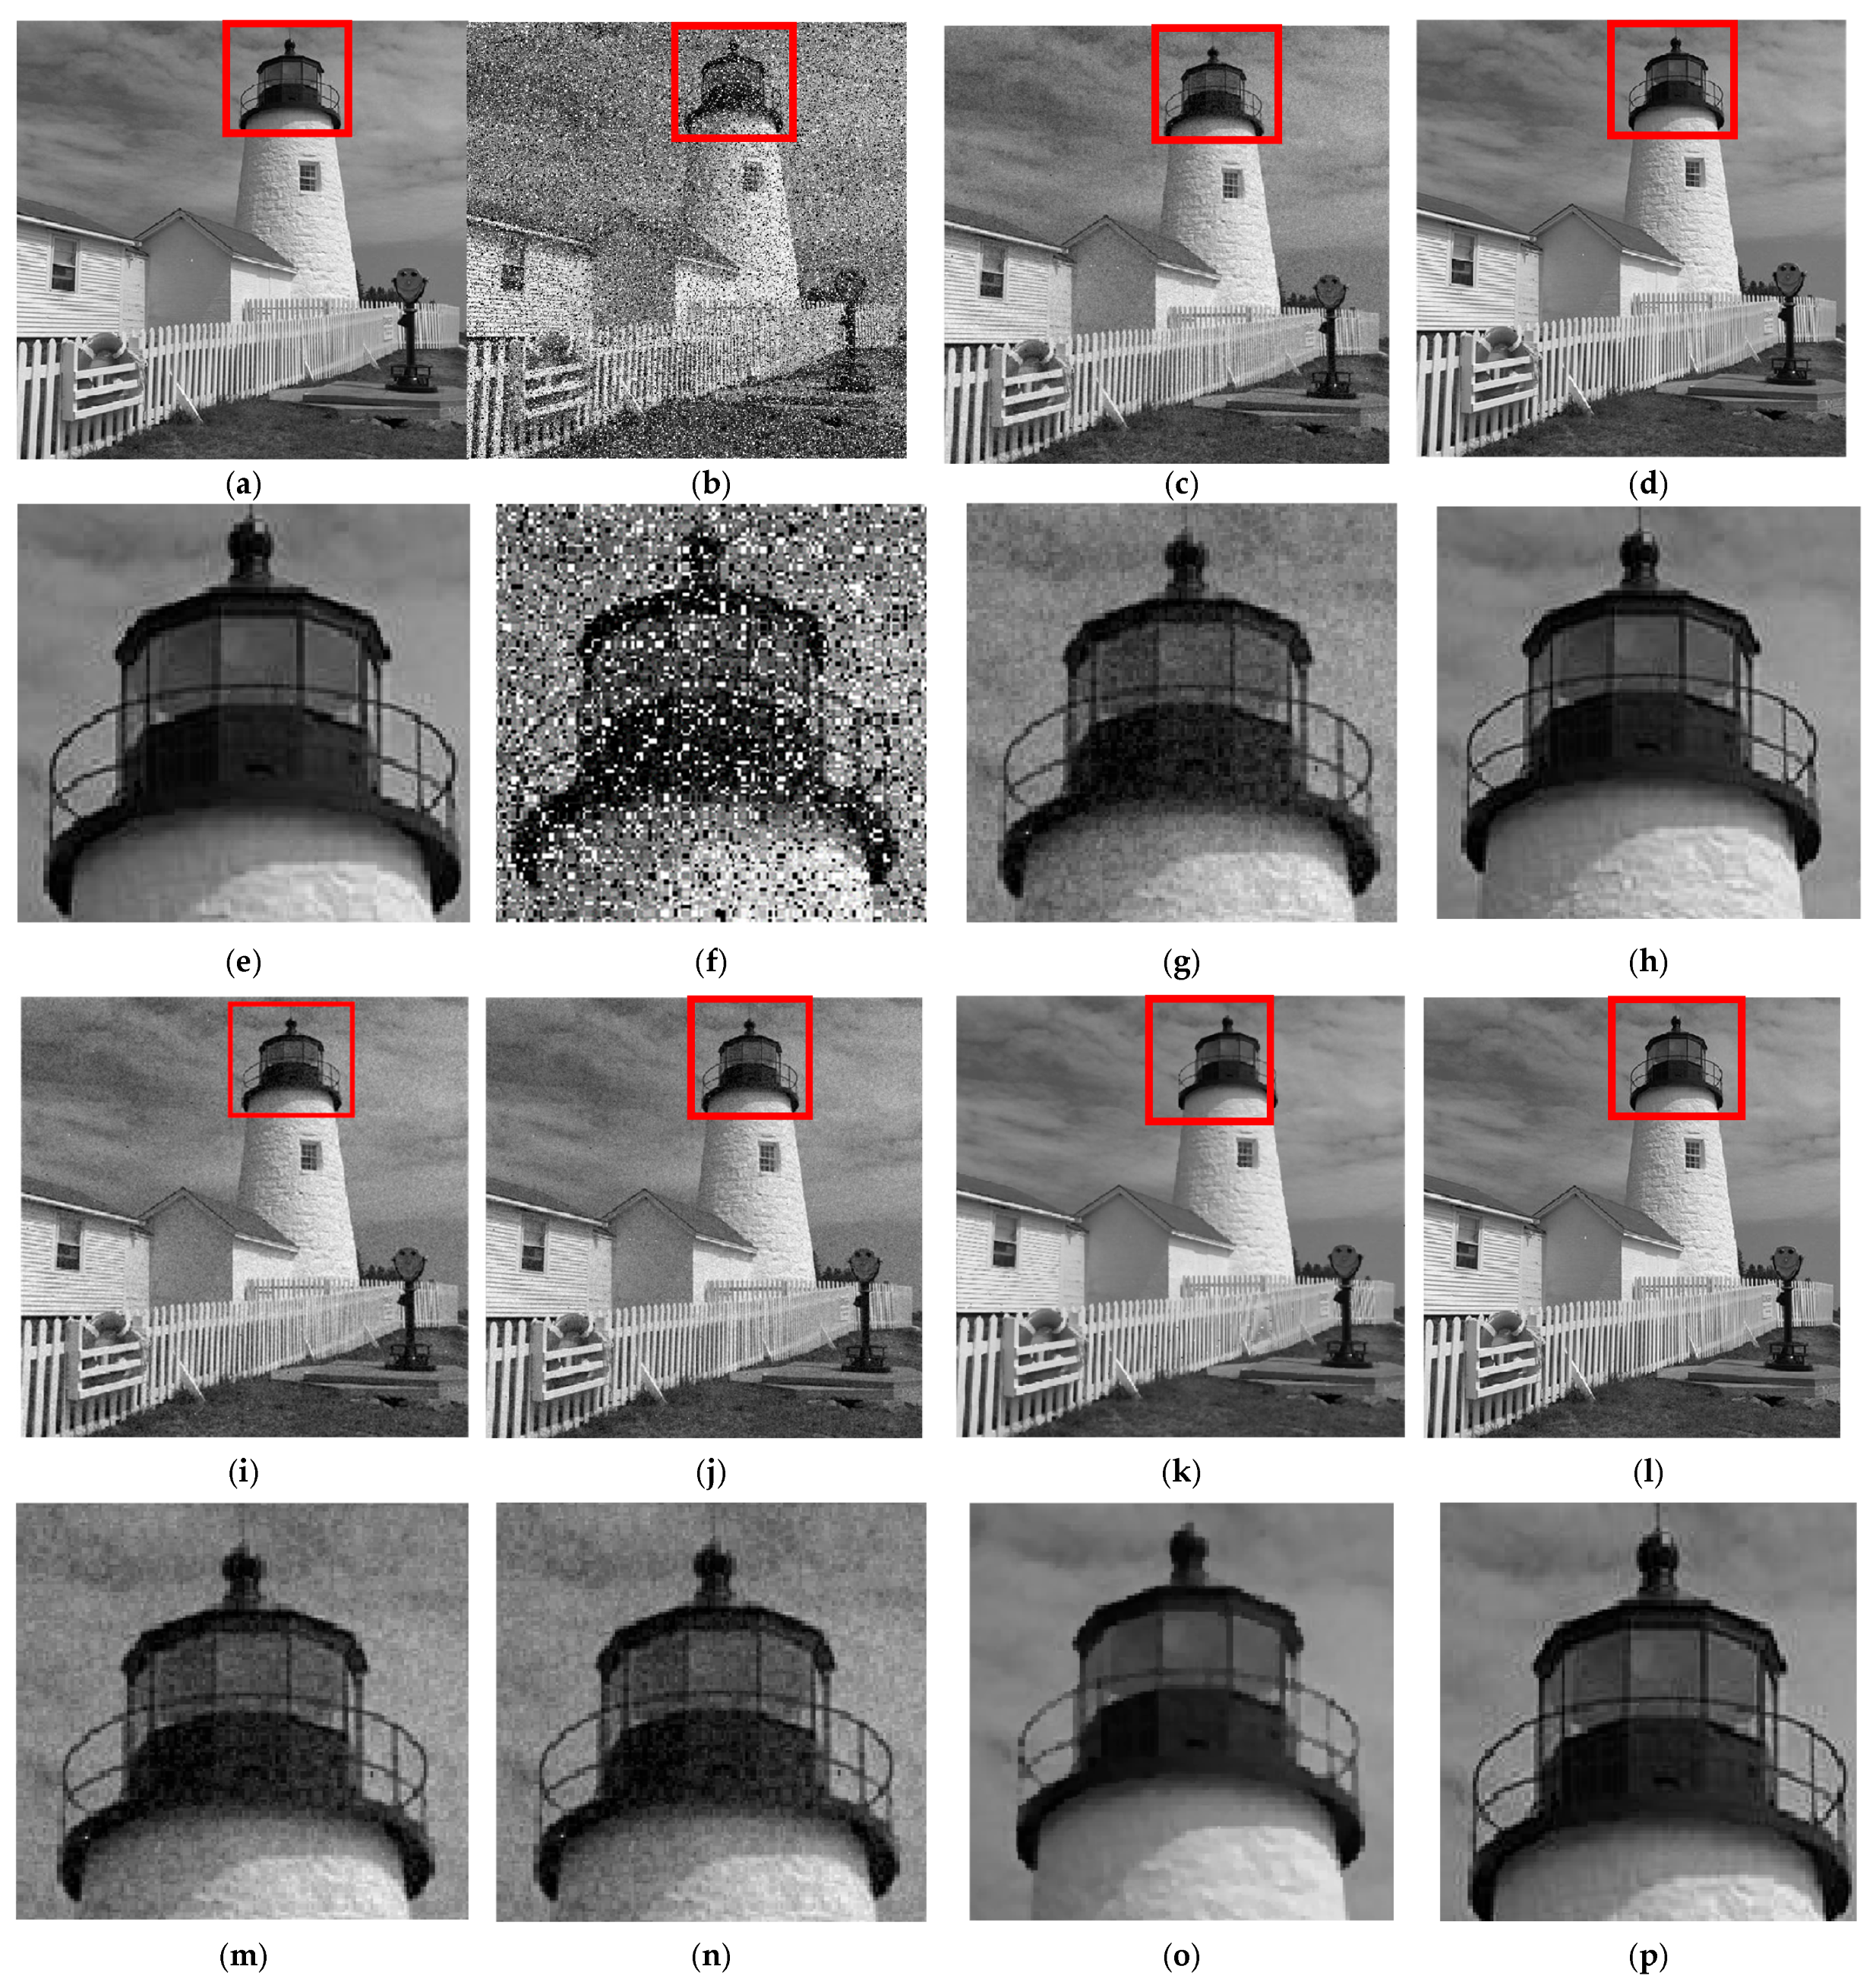
Four groups of mixed noise are added to the test base image, and the noise intensity was [10, 10%], [10, 25%], [25, 10%], [25, 25%], respectively. The second group of [10, 0.25] mixed noise is taken as a example for comparison, and the visual effects of noise reduction using VWDBA-Volterra, WNNM, LRTV, WESNR, LSM-NLR, and Transformer-CNN are shown in Figure 8 (taking an image in the kodak dataset as an example); the visual effects of the denoised images of VWDBA-Volterra, WNNM, LRTV, WESNR, LSM-NLR, and Transformer-CNN after Canny edge recognition are shown in Figure 9. As shown in Figure 8 and Figure 9, it can be seen that WNNM, LRTV, WESNR, LSM-NLR, Transformer-CNN have lost some of the details at the image edge. In WNNM, especially, the denoising in the image is too smooth, and the image details are too little preserved. The WESNR and LRTV algorithms are used for noise reduction; after noise reduction, there are residual artifacts and noise in relatively flat areas (such as the top edge of the image). By using the Transformer-CNN and VWDBA-Volterra method proposed in this paper, more details are kept, and the image after noise reduction is closer to the original image without noise. Meanwhile, as shown in Figure 8e–h,m–p and Figure 9, the filtering method proposed in this paper can effectively filter out the mixed noise while better preserving the details of the image and its edge details.
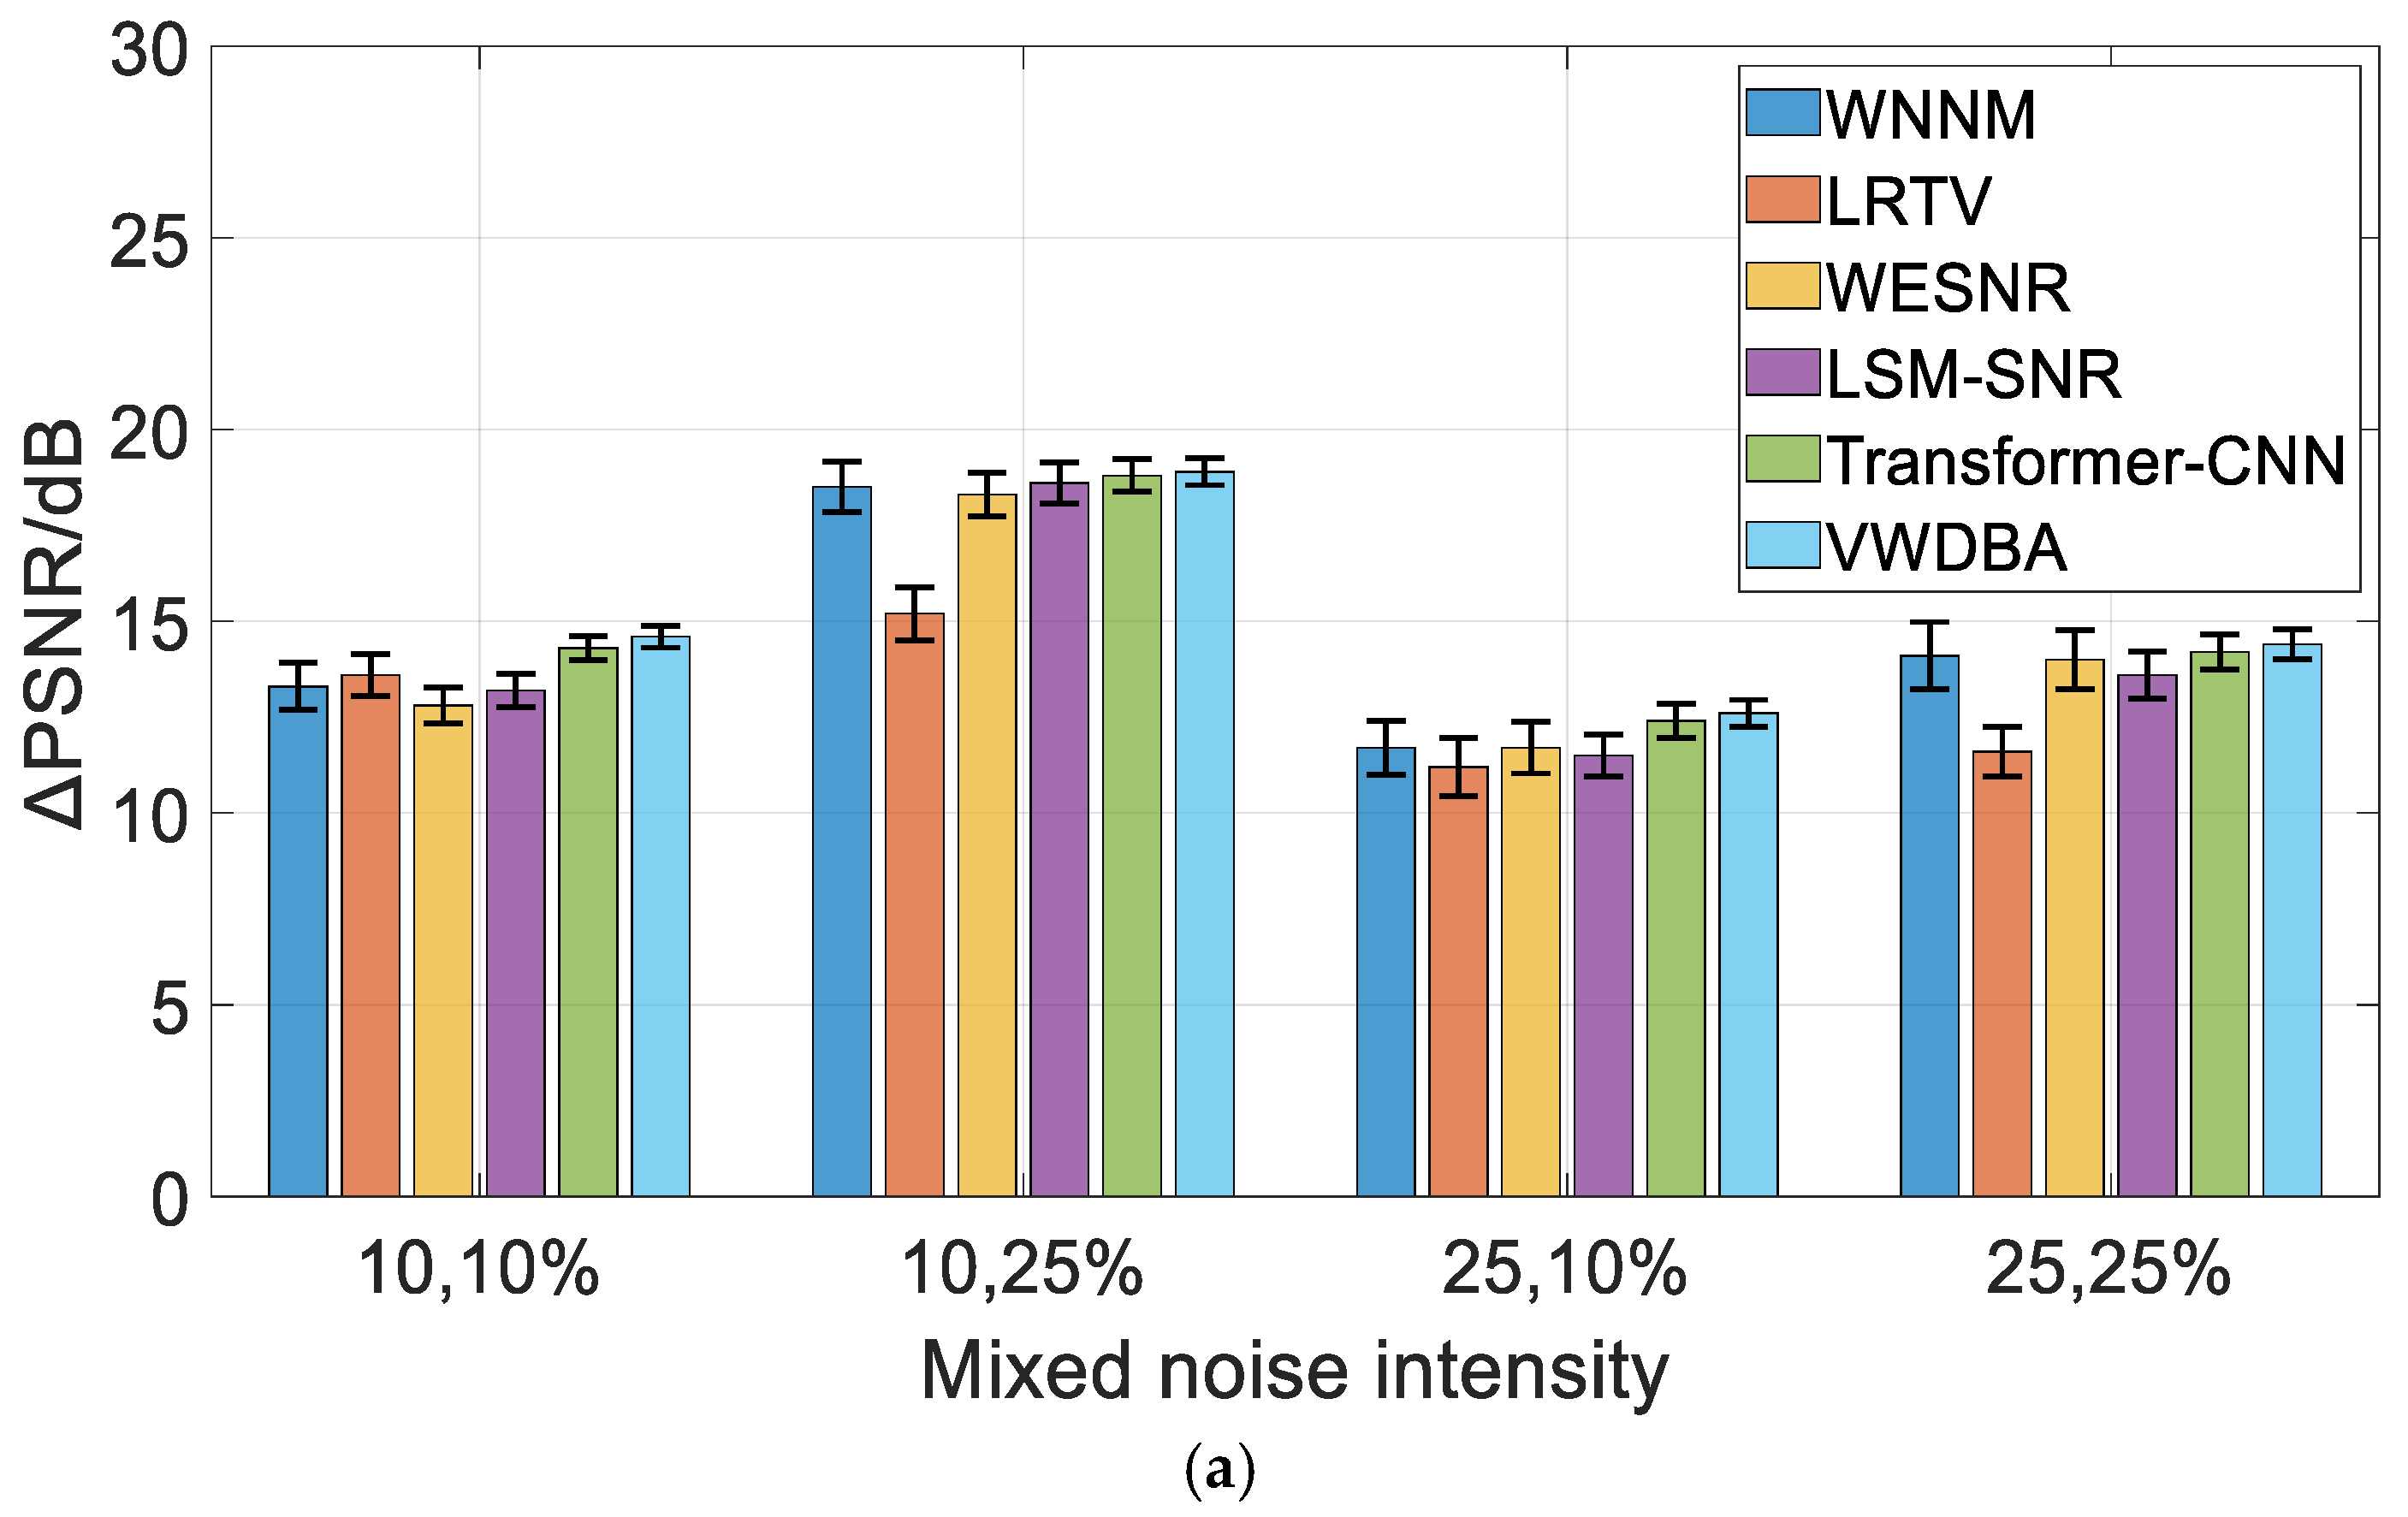
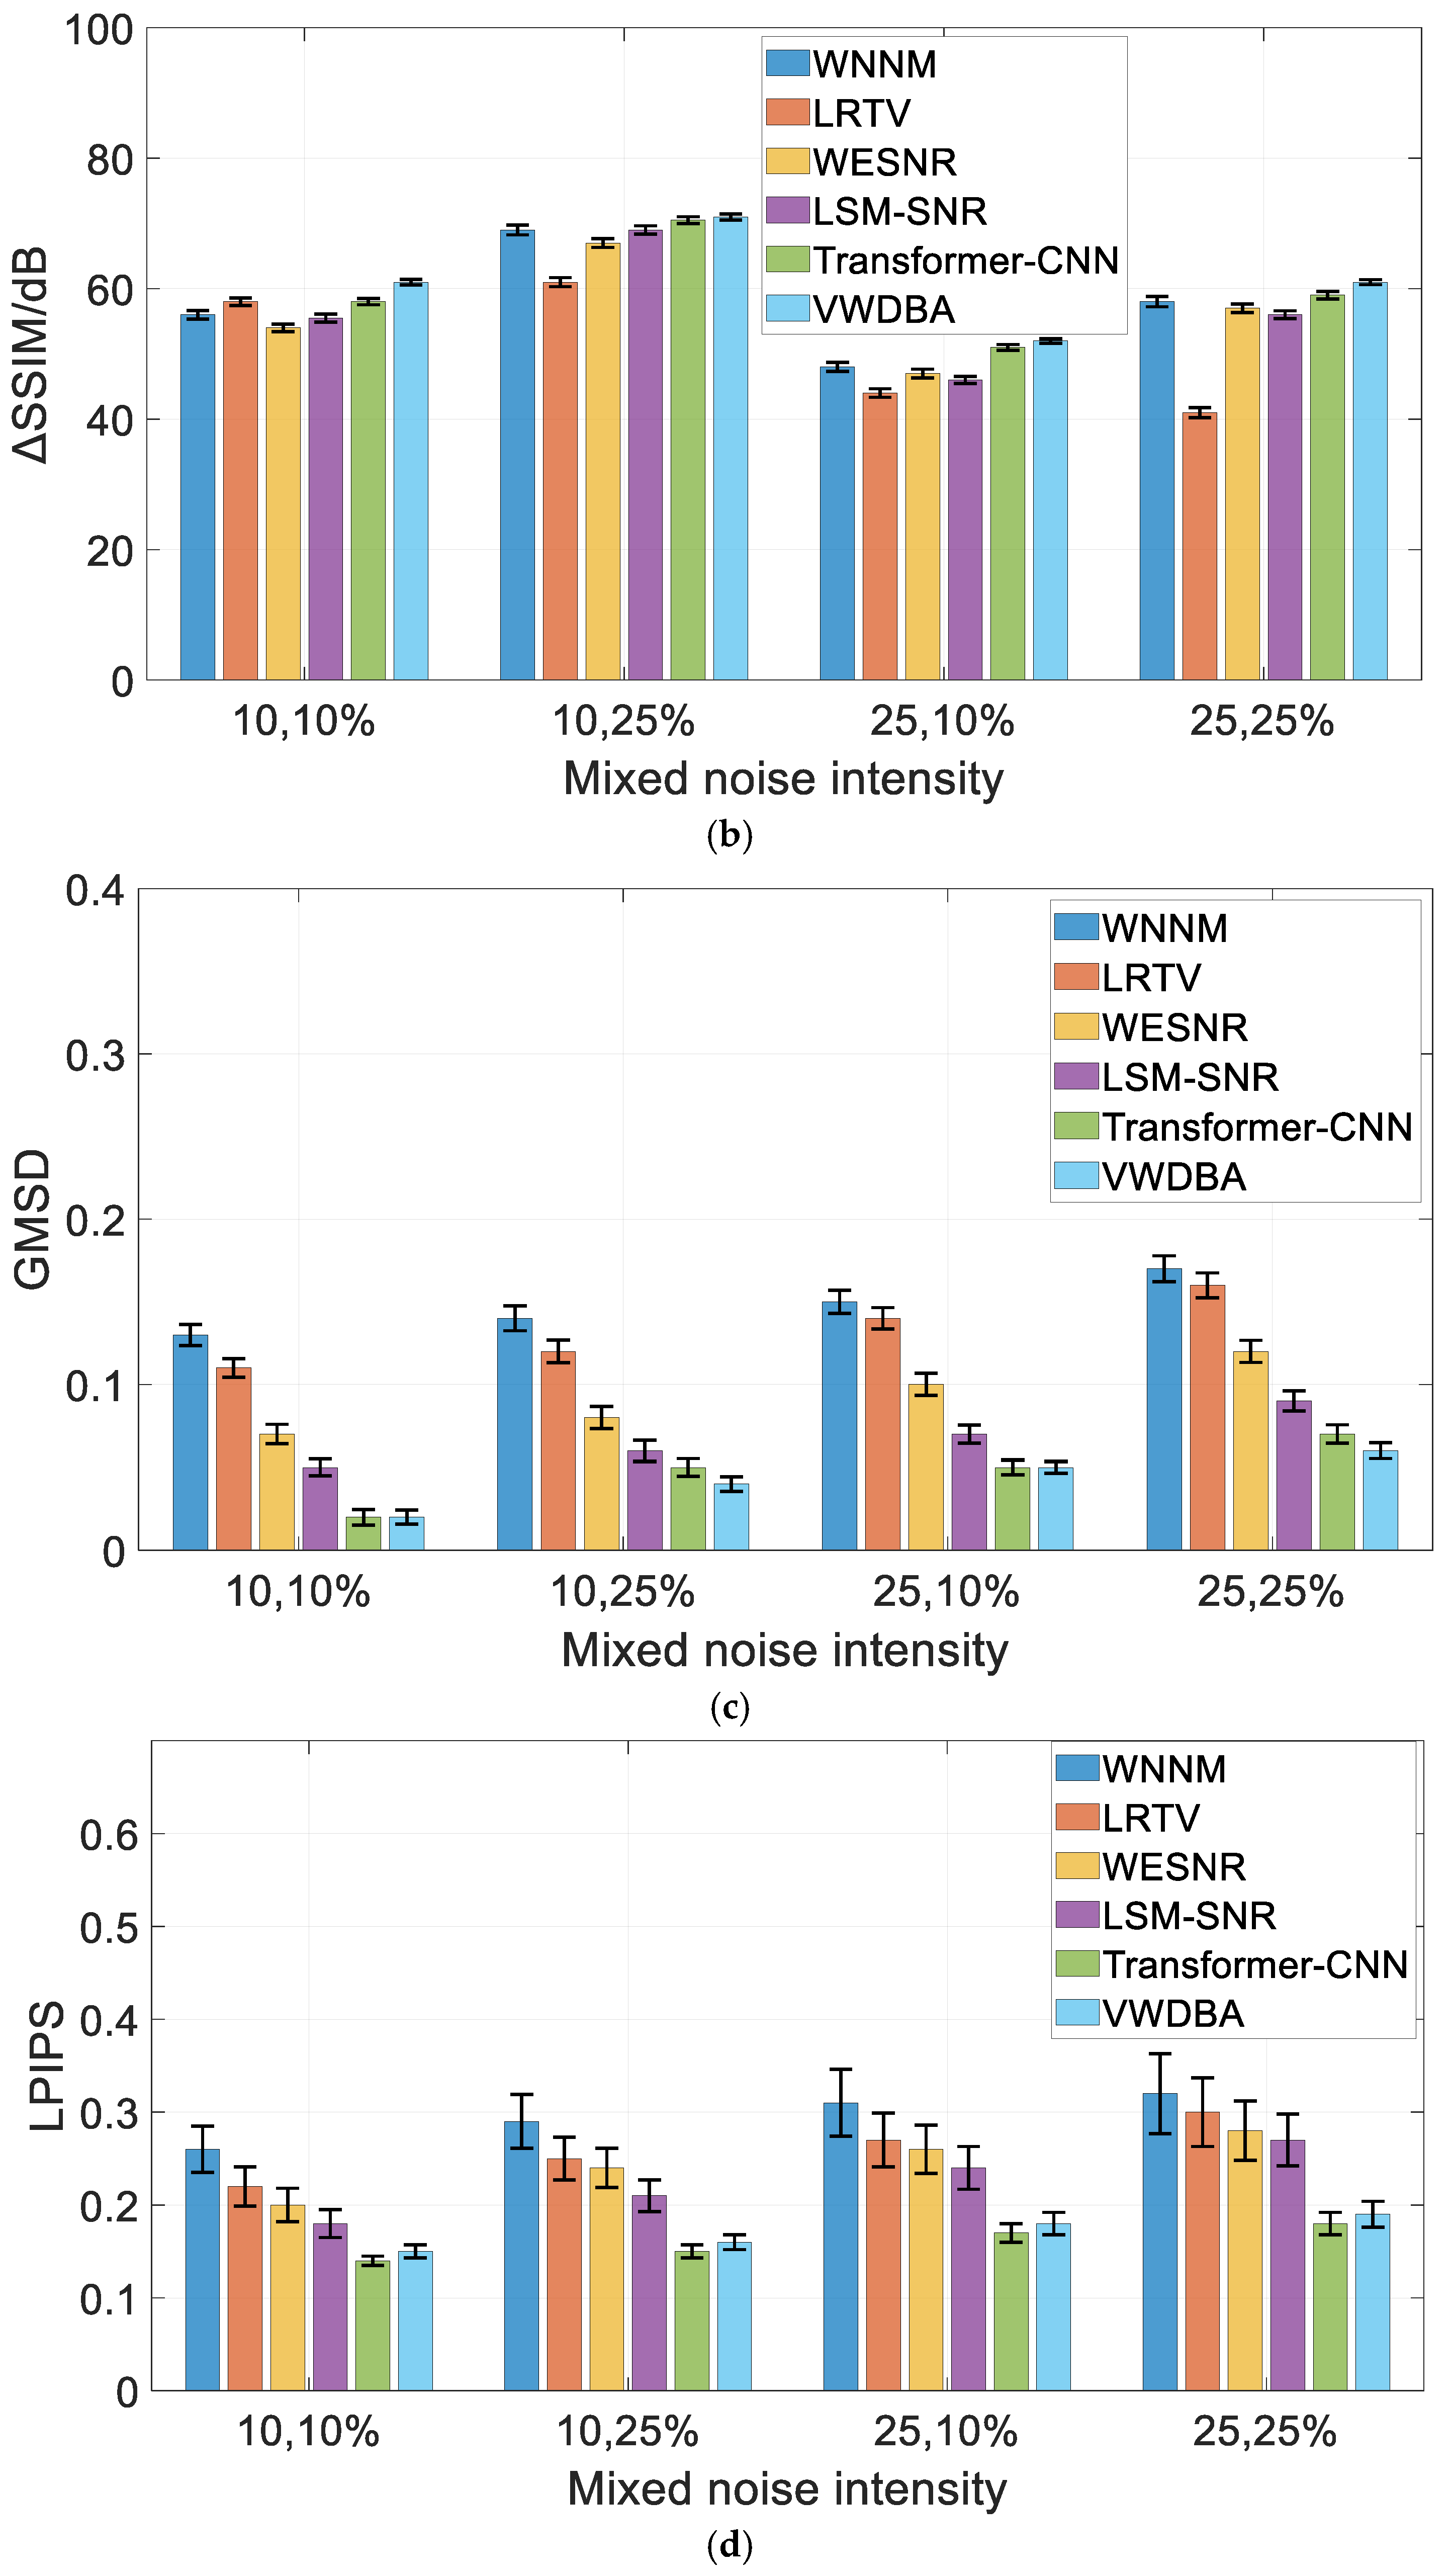
In order to conduct a more comprehensive analysis of the filtering effect, six filtering algorithms such as WWNM were adopted to reduce the noise of 24 images (including mixed noise of different intensities) in the Kodak dataset. Two indicators, average ΔPSNR and average ΔSSIM, were cited to represent the noise reduction and filtering effect. The difference between the PSNR (SSIM) of the denoised image and that of the mixed noise image is described by ΔPSNR (ΔSSIM). The average ΔPSNR and average ΔSSIM of the mixed noise images of different intensifies after denoising using six different filtering methods are shown in Figure 10a,b, respectively. As shown in Figure 10, after denoising with the VWDBA-Volterra filtering method, compared with the methods such as WNNM, the obtained average ΔPSNR and average ΔSSIM are the highest. Taking the noise intensity condition of [10, 10%] as an example, VWDBA-Volterra is 1.3 dB and 5.1% higher than the WNNM algorithm, 1.0 dB and 3.1% higher than the LRTV algorithm, about 1.8 dB and 7% higher than the WESNR algorithm, 1.4 dB and 5.5% higher than the LSM-SNR algorithm, and 0.8 and 2.1% higher than the Transformer-CNN. Under mixed noise intensity conditions such as [10, 25%], [25, 10%], and [25, 25%], the average ΔPSNR and average ΔSSIM obtained by the proposed method in this paper are slightly higher than those obtained by the methods such as WNNM. The average ΔPSNR and average ΔSSIM of VWDBA-Volterra under the four noise intensity conditions are 0.91 dB and 3.9% higher than the WNNM, 2.4 dB and 7.8% higher than the LRTV, about 0.93 dB and 5.8% higher than the WESNR, 0.93 dB and 3.7% higher than the LSM-SNR, 0.53 dB and 1.9% higher than the Transformer-CNN. In terms of improving the stability of the PSNR and SSIM indicators of images, after processing 24 images with mixed noise in the Kodak24 dataset, the standard deviation obtained by the method proposed in this paper is more efficient than that of the other five algorithms. The method proposed in this paper not only has a good noise reduction effect, but also has certain stability and generalization ability, and can be widely applied.
To further analyze the image metrics after filtering, GMSD and LPIPS were adopted as the evaluation index. The comparison of average GMSD after filtering through six different methods is shown in Figure 10c. Taking noise [10, 10%] as an example, the average GMSD values after filtering by the six methods such as WNNM are 0.13, 0.11, 0.07, 0.05, 0.02, and 0.02, respectively. VWDBA-Volterra and Transformer-CNN lose fewer details and more effectively preserve the details at the edge of the image. After filtering other groups of mixed noises of different intensifies, the image quality obtained by the method proposed in this paper is the best, with the smallest average GMSD and the best preservation of image details.
As shown in Figure 10d, using six different algorithms focusing on mixed noise in image noise reduction, with mixed noise intensity [10, 10%], for example, will allow you to obtain average LPIPS index values of 0.26, 0.22, 0.20, 0.18, 0.14, and 0.15. The average LPIPS index value obtained by the Transformer-CNN model is the lowest. The denoised image is closest to the noise-free image. The method proposed in this paper obtains an average LPIPS value of 0.15. Compared with methods such as WNNM, the denoised image is closest to the noise-free image, only slightly larger than that of the Transformer-CNN model. In terms of denoising other images with mixed noises of different intensities, the method proposed in this paper still has certain advantages and is similar to the denoising ability of the Transformer-CNN. However, Transformer-CNN requires a large amount of data for training.
By comparing the standard deviations of the four indicators ΔPSNR, ΔSSIM, GMSD and LPIPS, although the method proposed in this paper is slightly higher than the standard deviation of LPIPS obtained by the Transformer-CNN model, it can be seen that the standard deviations of other indicators are higher than those of the five algorithms, namely WNNM, LRTV, WESNR, LSM-NLR, and Transformer-CNN, demonstrating better adaptability and stability. Therefore, the method proposed in this paper guarantees that the restoration results are closer to the real image in terms of perceived quality. The standard deviation of the method proposed in this paper is relatively small in the vast majority of indicators, which proves that this method has good stability and robustness when dealing with images with different content. Because Transformer-CNN requires a large amount of training data and training time, the VWDBA-Volterra filtering method is superior to the other five algorithms such as WNNM in improving the three indicators of image, namely PSNR, SSIM, and GMSD.
(3)
Results of Experiment 3:
In the WNNM algorithm, each block group requires matrix singular-value decomposition. The LRTV algorithm needs low-rank SVD decomposition + TV regularization optimization. The WESNR algorithm requires sparse coding + non-local regularization. The LSM-NLR algorithm needs robust function calculation + low-rank approximation, but it is more efficient than WNNM. The complexity of the Transformer-CNN model in the training stage is extremely high. Compared with the above five algorithms, this paper proposes that the computational complexity mainly depends on the population size of the bats, the number of iterations, and the number of cores of the Volterra filter. However, this algorithm has no singular-value matrix decomposition process and mainly performs local filtering operations, with a higher operational efficiency than the previous ones. The computational complexity is shown in Table 3. The ranking of computational complexity is as follows: WDBBA-Volterra < Transformer-CNN(inference) < LSM-NLR ≈ WESNR < LRTV < WNNM. The six algorithms are used to filter the images containing noise [10, 10%]. The average calculation time is shown in Table 4.
It can be seen from Table 4 that the filtering algorithm in this paper has the least computational load. The following is a ranking in terms of time consumption (short to long): VWDBA-Volterra < LSM-NLR < WESNR < LRTV < WNNM < Transformer-CNN (Training). Therefore, the method proposed in this paper is a fast and practical hybrid noise-filtering approach, particularly suitable for scenarios with limited computing resources or those requiring real-time processing.
The computing speed of VWDBA-Volterra is much faster than that of WNNM, LRTV, and LSM-NLR. If the application scenario requires near real-time denoising (for example, when previewing medical images or in video processing), VWDBA-Volterra will be the only feasible choice among all the compared algorithms. It can provide significant structural improvements (high ΔSSIM) within strict time constraints.
(4)
Results of Experiment 4:
Under the guidance of the objective function shown in Equation (16), search and optimization are carried out in the parameter space. The VWDBA-Volterra filter model in Experiment 1 was adopted, and the interval of iteration times (t) was selected as [40, 200]. Through 10 separate simulation experiments, the kernel parameters of the Volterra filter are optimized, where the optimal position of the individual bat is the value of the model kernel parameters. Table 5 shows the kernel-parameter optimization results of the third-order Volterra filter after 60 and 120 iterations of the VWDBA algorithm, respectively.
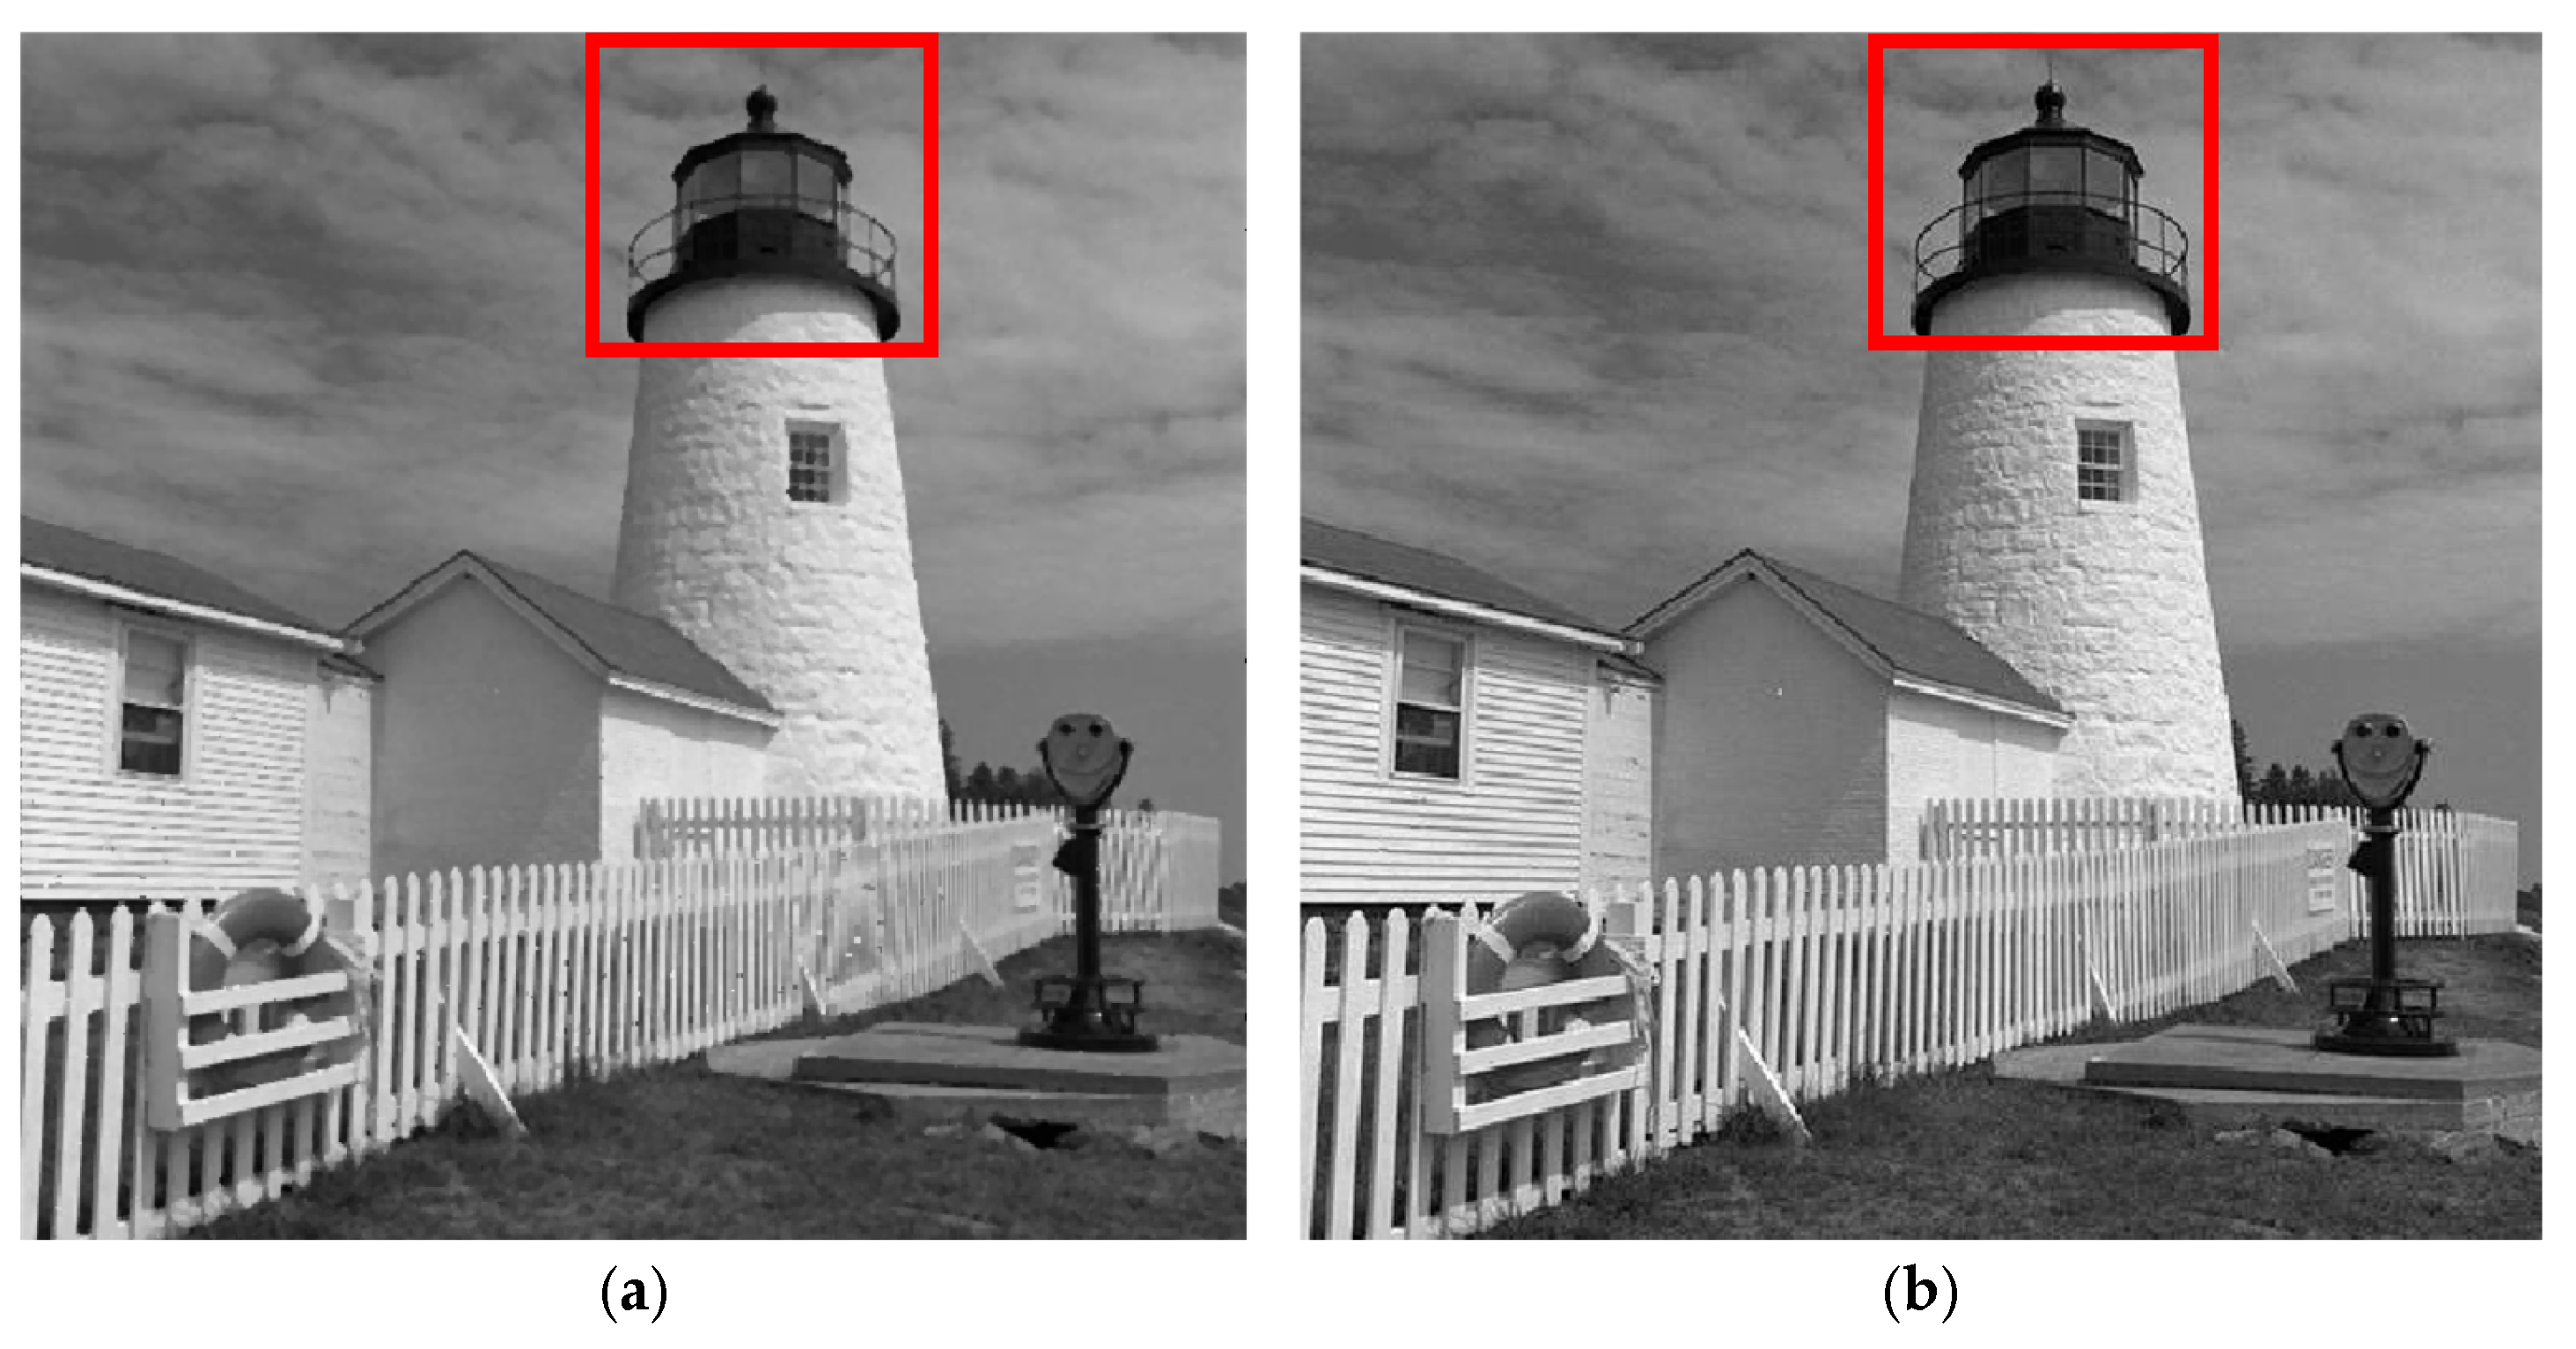
Two VWDBA-Volterra filters with different iterations (60 times and 120 times) are used to denoise images with noise intensities of [10, 25%], and the images after noise reduction are shown in Figure 11. Comparatively, when the number of iterations is 60, the image after noise reduction has residual artifacts in the upper edge (flat region), and more details are lost. After 120 iterations, the artifact phenomenon almost disappears, and the noise reduction effect is obviously better than the filtering effect after 60 iterations; the noise reduction effect is greatly improved.
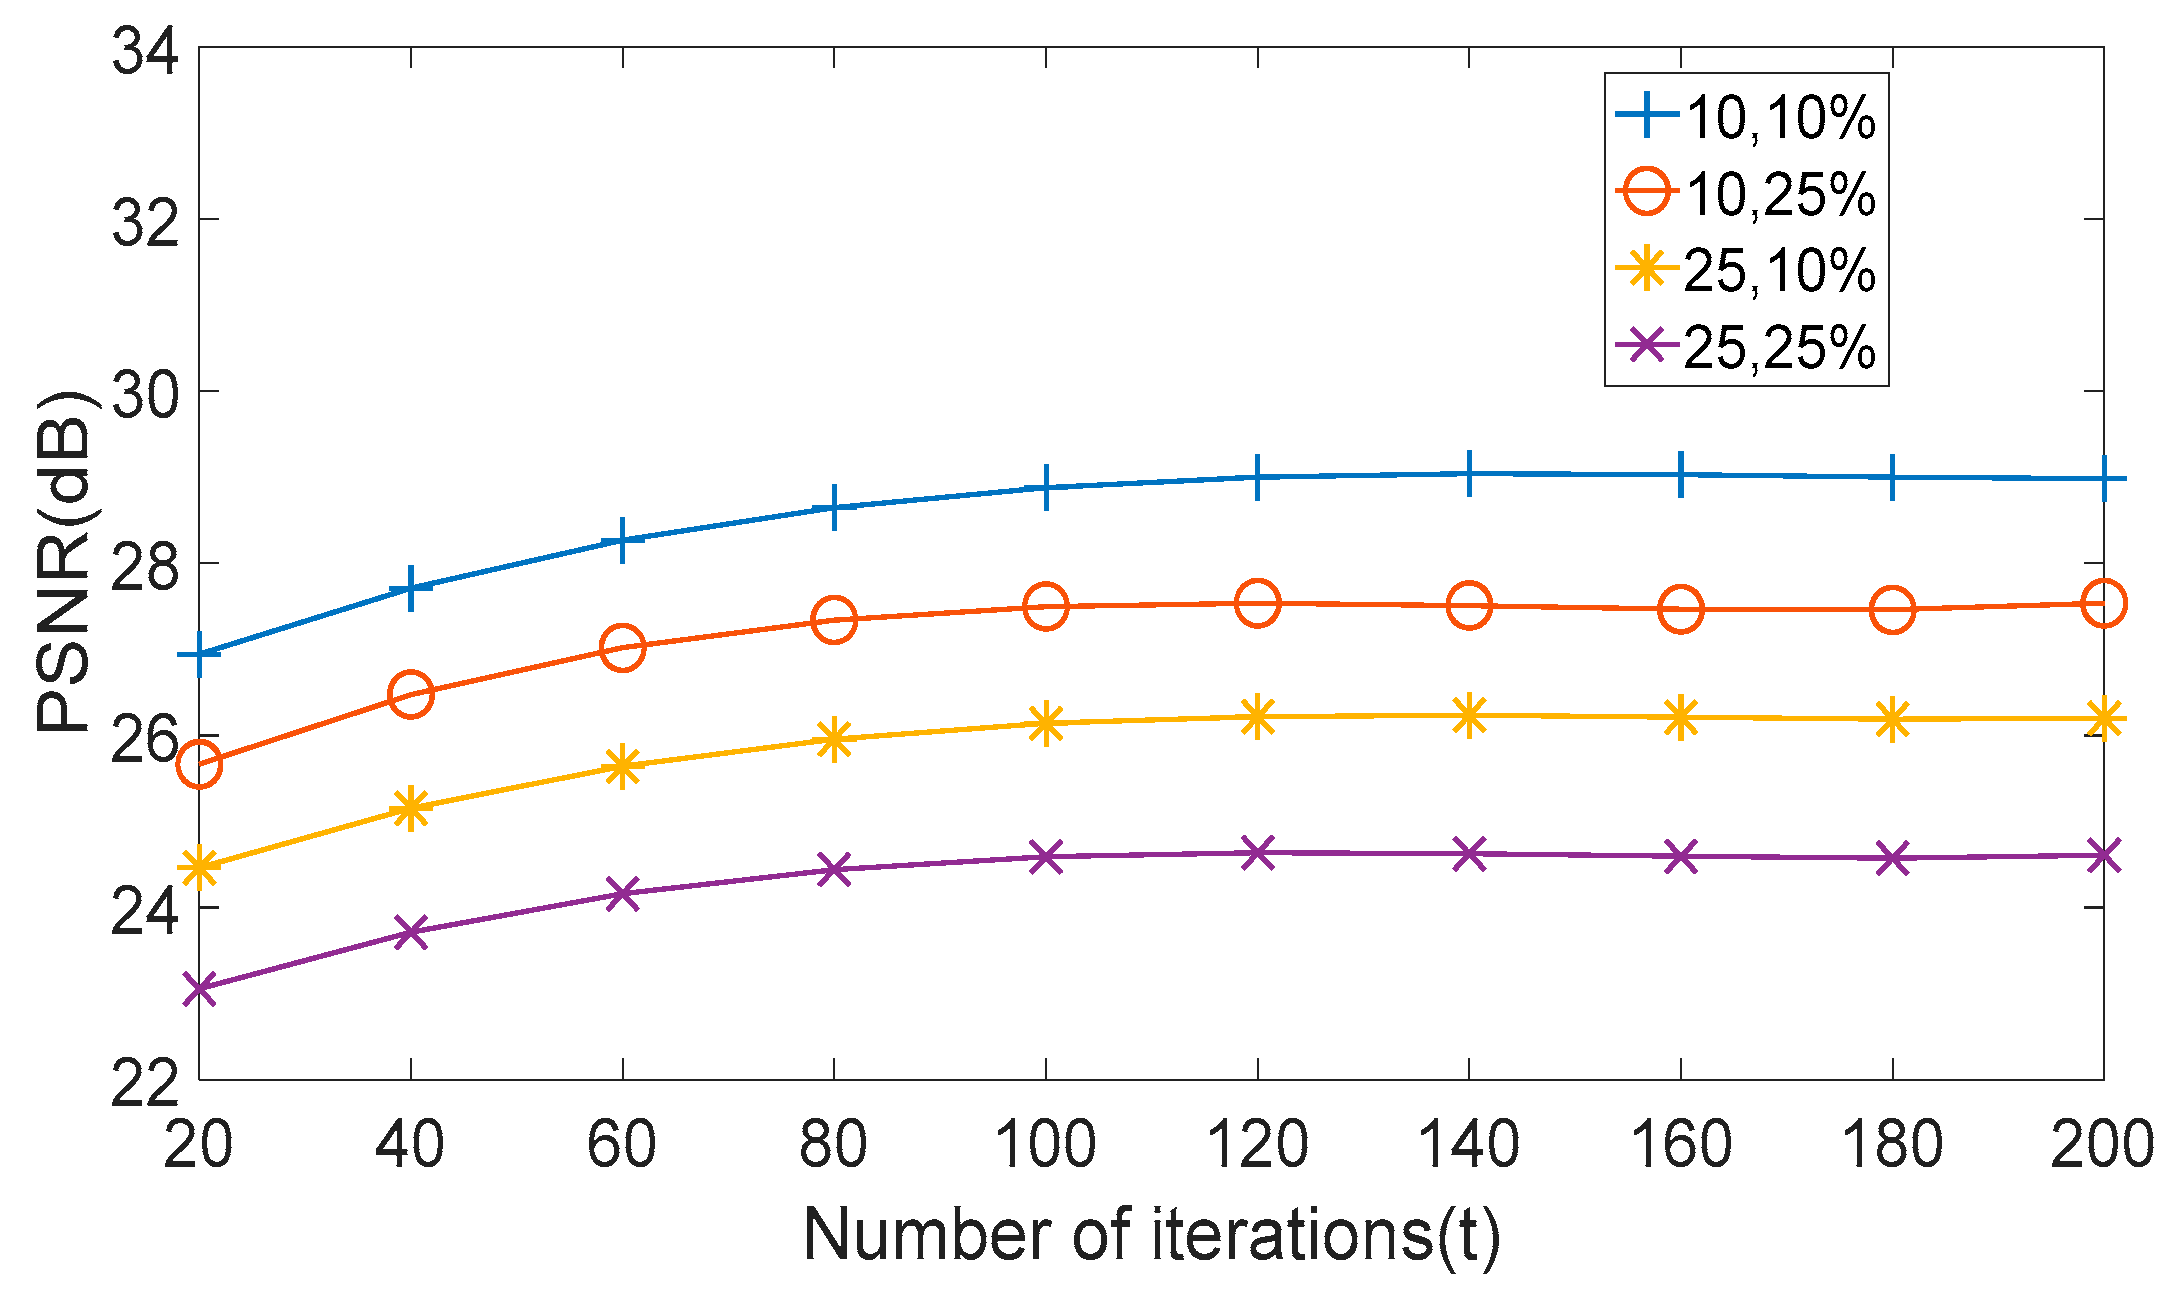
The key to determining the filtering capability of VWDBA-Volterra is its kernel parameters. Under different values of mixed noise intensity, the VWDBA-Volterra method with different iterations is used to reduce the noise in the image, the average PSNR and GMSD values of the image are obtained and analyzed in Figure 12 and Figure 13, and the influence of algorithm iterations on the filter performance is analyzed. According to any change in the curve in Figure 12, when the intensity of the image containing mixed noise is determined, the number of iterations is in the range of about [20, 100]; with the increase in algorithm iterations, the PSNR of the image after noise reduction gradually increases. When the number of iterations reaches 100, PSNR does not change, and stability is independent of noise intensity.
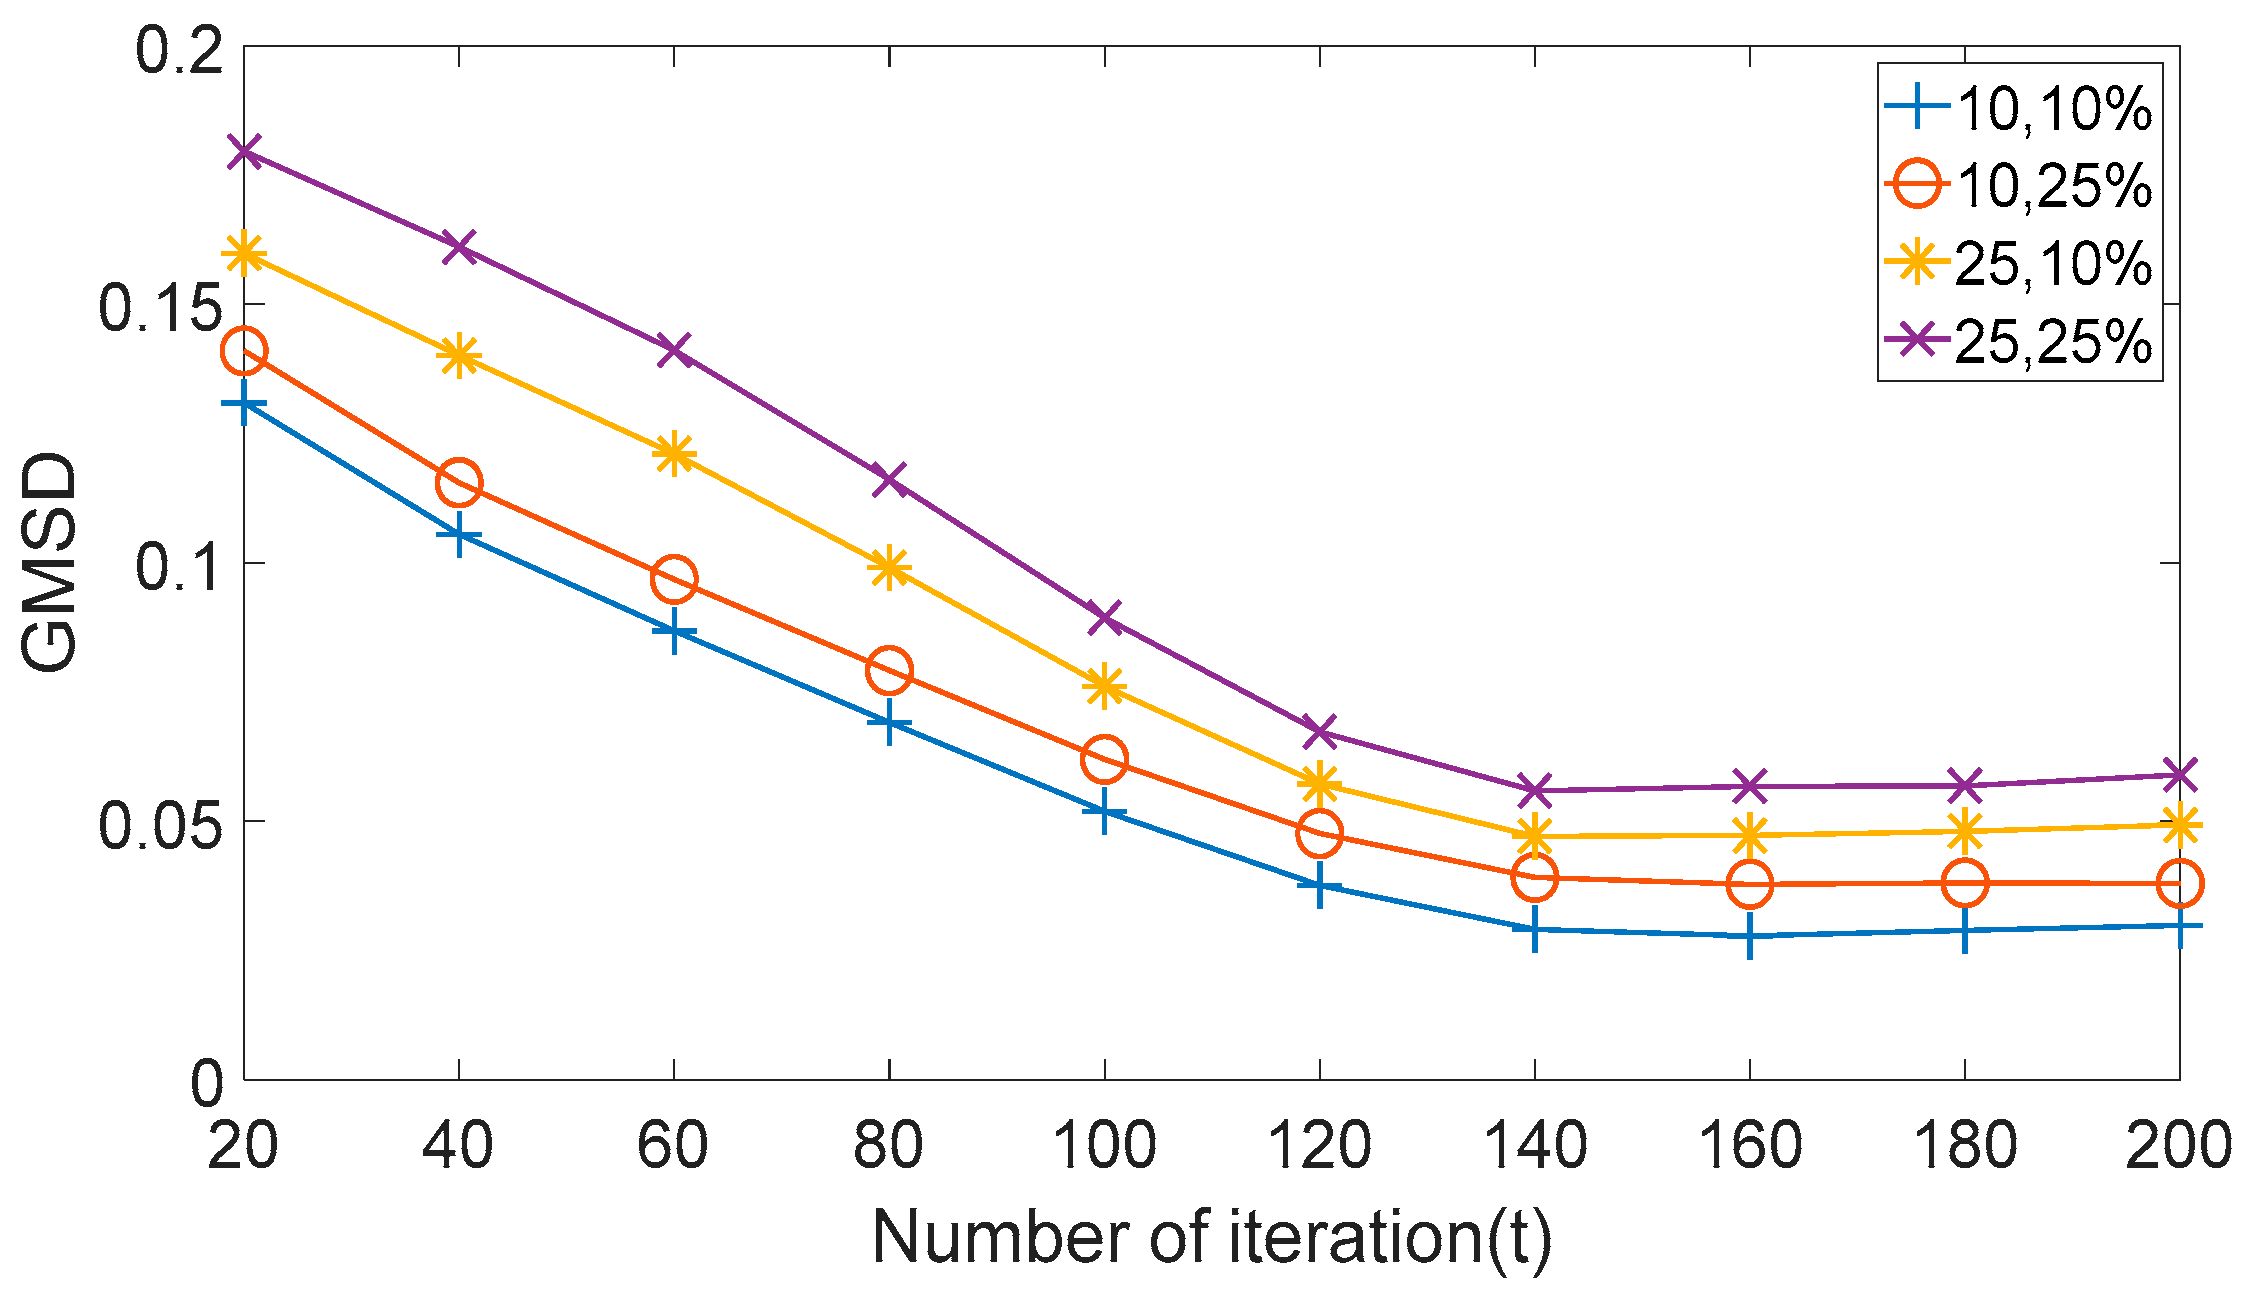
Comparing the four curves in Figure 13, as the number of algorithm iterations increases, the GMSD of the denoised image gradually decreases. When the number of iterations reaches 120, the GMSD remains unchanged, and its stability is independent of the noise intensity.
(5)
Results of Experiment 5:
The effects of different bat population sizes on filter performance in VWDBA-Volterra are tested, the population size interval is selected as [10, 35], and the value interval of each group is 5. The optimal kernel parameters of the model are obtained by 10 independent simulations. The kernel-parameter optimization results of the third-order Volterra filter after 200 iterations with VWDBA populations of 15 and 30 are shown in Table 6, respectively.
Two VWDBA-Volterra filters with different bat population sizes (15 and 30) are used to denoise images with mixed noise intensities of [10, 25%], and the images after noise reduction are shown in Figure 14. By comparison, it is found that the filter with a population number of 30 is better than the filter with a population number of 15 for image filtering with mixed noise. When the size of the bat population is 15, the filtered image is fuzzy and it demonstrates and insufficient ability to display detail. When the size of the bat population is 30, the details are preserved and the noise reduction effect is greatly improved.
The effect of bat population on the performance of VWDBA-Volterra filtering is tested using images with varying amounts of mixed noise. The relationship between algorithm population size and the PSNR of the image after noise reduction is shown in Figure 15. According to Figure 15, when the intensity of the image containing mixed noise is determined, the bat population size is within [15, 35], and the PSNR of the image after filtering gradually increases with the increase in population size. When the population size reaches 25, PSNR tends to be stable, and the stability is independent of noise intensity. According to the four change curves in Figure 10, when the population of VWDBA-Volterra algorithm reaches more than 25, the filter still demonstrates good filtering performance.
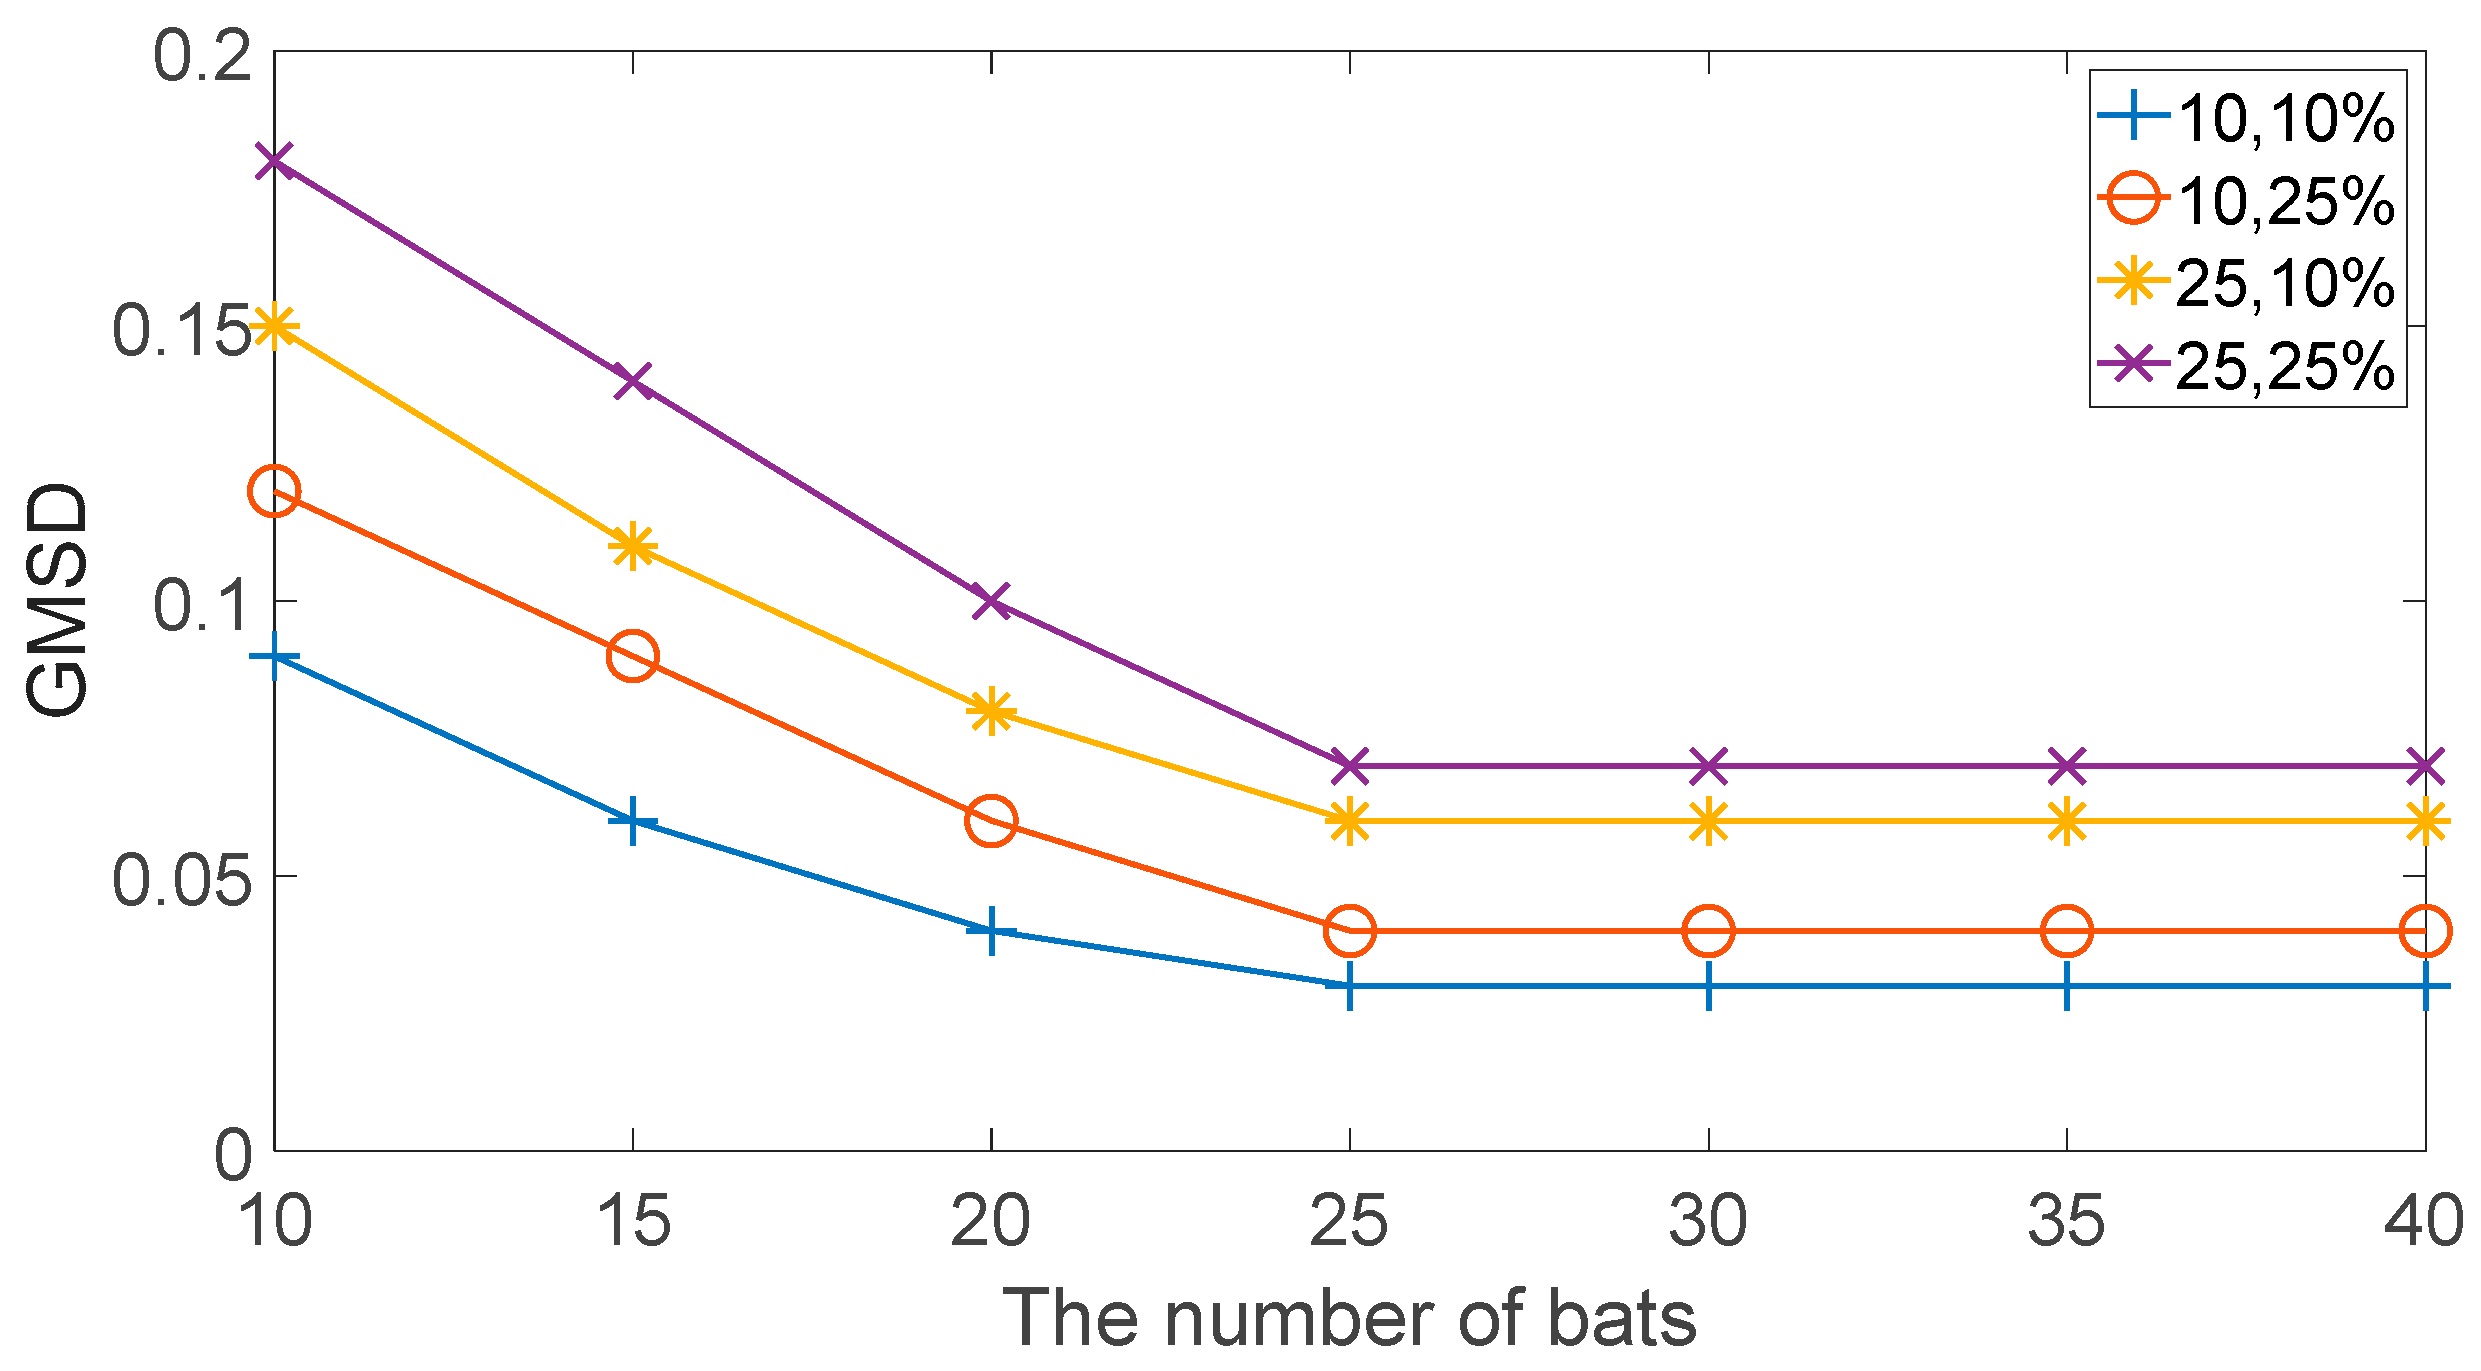
The relationship between algorithm population size and the GMSD of the image after noise reduction is shown in Figure 16. According to Figure 14, when the intensity of the image containing mixed noise is determined, and the bat population size is within [15, 35], the GMSD of the image after noise filtering gradually decreases with the increase in population size. When the population size reaches 25, GMSD tends to be stable, and the stability is independent of noise intensity. When denoising mixed noise images with different intensities, it can be verified that the filter demonstrates good stability and convergence.

5. Results

Aiming to address the issue of noise reduction in images with mixed noise, a nonlinear Volterra method based on VWDBA is proposed, optimizing kernel parameters. When the minimum value of the fitness function is satisfied, VWDBA is used to iteratively solve the kernel parameters of the optimal nonlinear Volterra filter model. The simulation results show that by introducing the velocity inertia-weight perturbation mechanism into individual bats, their optimization ability and the global search and optimization ability of the algorithm are improved, and the kernel parameters of Volterra filter can be optimized more effectively.
Five different noise reduction experiments were conducted using the proposed VWDBA-Volterra filter, and the conclusions are as follows:
(1) For GN or SPN (single noise) with different intensities, the PSNR and MSSSIM of the image after noise reduction are improved. As the σ of GN (or d of SPN) contained in the image increases, the changes in PSNR and MSSSIM of the image before and after noise reduction increase, and the noise reduction effect becomes more evident.
(2) For reduction of mixed noises of different intensifies (GN and SPN), compared with WNNM, LRTV, WESNR, LSM-NLR, and Transformer-CNN, a higher level of detail is retained in the information in the image and residual artifacts are avoided after noise reduction using the VWDBA-Volterra filtering method. The denoised image is more similar to the original noise-free image. Compared with WNNM, LRTV, WESNR, LSM-NLR and Transformer-CNN, the ΔPSNR and ΔSSIM before and after denoising are higher than those of the above five algorithms, and the denoising effect on mixed noise is better. In terms of the GMSD index, the method proposed in this paper achieves the lowest value. Regarding LIPIS, the LPIPS value of the images obtained by the method proposed in this paper is slightly higher than that of the Transformer-CNN algorithm, but higher than that of the other four algorithms, including WNNM, and the images are closer to the noise-free images.
Six algorithms were adopted to denoise 24 images in the Kodak dataset, respectively. The standard deviations of the four indicators of GMSD obtained by the four filtering algorithms were compared. The algorithm proposed in this paper is very similar to the Transformer-CNN algorithm. But the standard deviations in the two ΔPSNR and ΔSSIM indicators are lower than those of Transformer-CNN, which proves that this algorithm has good convergence and stability, is less affected by different images, and has a certain generalization ability. The filtering results further confirm that the method we proposed not only leads to traditional pixel fidelity and structural similarity, but also has significant advantages in perceptual quality and statistical robustness.
(3) As the results of Experiments 2 and 3 show, the method proposed in this paper demonstrates a significant improvement in structural similarity (ΔSSIM). The optimized VWDBA-Volterra can retain a more natural texture appearance. Specifically, for instance, when removing noisy images with clear textures, WDBA-Volterra offers better results. In Experiment 3, due to the low computational complexity, small computational load, and certain real-time performance of the method proposed in this paper, it is the only practical choice among all the algorithms in this study for real-time or resource-constrained application scenarios. At the same time, it can still offer considerable quality improvements and can be applied to medical image previews or real-time video monitoring. Therefore, the method proposed in this paper offers a specific trade-off between high efficiency and high structural fidelity denoising.
(4) In Experiments 4 and 5, as the number of iterations (population) of VWDBA increases, the PSNR of the image after denoising by the VWDBA-Volterra filter gradually increases, and the denoising effect becomes more obvious. When the number of iterations (population) increases to a certain value, the noise reduction effect tends to stabilize, and VWDBA-Volterra has good stability and convergence.
From the above five experiments, the effectiveness of the VWDBA-Volterra filter designed in this paper has been proven. The filtering ability for high-density mixed noise (GN and SPN) is further enhanced by using the filtering method proposed in this paper, effectively reducing artifacts and preserving the details of the image. Due to the avoidance of the noise separation process, compared with the combined filtering method, the VWDBA-Volterra filter demonstrates less computational complexity and good real-time performance, and can more quickly and effectively suppress mixed noise in images.
Although the VWDBA-Volterra method proposed in this study has a certain competitiveness in terms of computational efficiency and structural protection, it also has certain limitations. Firstly, its performance is limited by the inherent expressiveness of the Volterra filtering model, and it may encounter bottlenecks when dealing with extremely complex noises and textures. Secondly, as an optimization-based method, its effectiveness depends on parameter settings and convergence to a certain extent. Future work will explore the combination of this efficient optimization framework with more expressive models (such as lightweight neural networks) to break through existing performance limitations and enhance the generalization ability of the method.

Author Contributions

Conceptualization, W.Z.; methodology, W.Z.; investigation, W.Z.; resources, C.-B.Y. and Y.H.; data curation, W.Z. and H.-J.L.; writing—original draft preparation, W.Z.; writing—review and editing, W.Z. and C.-B.Y.; project administration, W.Z. and Y.H.; funding acquisition, W.Z. and Y.H. All authors have read and agreed to the published version of the manuscript.

Funding

This paper was funded by Guizhou Provincial Major Scientific and Technological Program (No. Qian Kehe Major Special Projects [2024]019), General scientific research project of Zhejiang Education Department No. Y202454911, Research project of Huzhou College No. 2024HXKM02.

Institutional Review Board Statement

Not applicable.

Informed Consent Statement

Not applicable.

Data Availability Statement

The data are available from the corresponding author on reasonable request.

Conflicts of Interest

Author Yue Hu was employed by the company Guizhou Rongbai Lithium Battery Materials Co., Ltd. The remaining authors declare that the research was conducted in the absence of any commercial or financial relationships that could be construed as a potential conflict of interest.

Appendix A

Table A1. Variable table.
Variable NameVariable Definition
u ( t ) input of the Volterra model
y ( t ) output of the Volterra model
h n ( τ 1 , τ 2 , , τ n ) the n-th-order time-domain kernel of the nonlinear Volterra filter model
y ( k ) the discrete time-domain model of the output signal
Nthe highest order
kthe order of the Volterra series
e ( k ) the error of truncation
m i the memory length
h n ( m 1 , m 2 , , m n ) the n-th-order time-domain kernel function of Volterra
i 1 , i 2 , , i n any of the permutations of 1 , 2 , 3 , , n
a i the weight coefficient when the time-domain kernel is symmetric
tthe iteration number
X i ( t ) the bat’s position vector at time t
V i ( t ) the bat’s flight speed vector at time t
X b e s t ( t ) the best position among the bats in the current population
f i the pulse rate used by a bat i when searching for prey
εfollows a random distribution in the interval [0, 1]
A t the average loudness of the bat population at time t
r i 0 the maximum pulse rate of a bat i
r i t + 1 r i t + 1 represents the pulse rate of a bat i at time
γ the pulse rate increase coefficient
A i t represents the sound intensity of the bat i at time t
α the pulse sound intensity decay coefficient, α [ 0 , 1 ]
ω a random variable that follows a normal distribution in [0, 1].
U = [ u ( k ) , u ( k + 1 ) , , u ( k + L 1 ) ] T input matrix
f i t n e s s ( x ) the mean square error (MSE) for calculating the predicted and ideal outputs
u d ( k ) the ideal signal
H ^ d ( k ) the kernel-parameter vector optimized by d-th iteration of the algorithm

References

  1. Wu, L.; Zhang, X.Y.; Tang, M.; Wang, Z.; Wang, Y. Focus+Context semantic representation in scene segmentation. Acta Electron. Sin. 2021, 49, 596–604. [Google Scholar]
  2. Xu, S.P.; Lin, Z.Y.; Zhang, G.Z.; Chen, X.; Li, F. A low-light image enhancement algorithm using the hybrid strategy of deep learning and image fusion. Acta Electron. Sin. 2021, 49, 72–76. [Google Scholar]
  3. Zheng, J.H.; Yu, X.D.; Zhao, S.M.; Wang, L. Ghost Imaging Denoising Based on Mean Filtering. Acta Opt. Sin. 2022, 42, 49–56. [Google Scholar]
  4. Shahdoosti, H.R.; Khayat, O. Image denoising using sparse representation classification and non-subsampled shear-let transform. Signal Image Video Process. 2016, 10, 1081–1087. [Google Scholar] [CrossRef]
  5. Aharon, M.; Elad, M.; Bruckstein, A. K-SVD: An algorithm for designing overcomplete dictionaries for sparse representation. IEEE Trans. Signal Process. 2006, 54, 4311–4322. [Google Scholar] [CrossRef]
  6. Cai, J.F.; Candes, E.J.; Shen, Z.W. A singular value thresholding algorithm for matrix completion. SIAM J. Optim. 2010, 20, 1956–1982. [Google Scholar] [CrossRef]
  7. Gu, S.H.; Xie, Q.; Meng, D.Y.; Zuo, W.; Feng, X.; Zhang, L. Weighted nuclear norm minimization and its applications to low level vision. Int. J. Comput. Vis. 2017, 121, 183–208. [Google Scholar] [CrossRef]
  8. Ning, X.; Yu, L.; Liao, X.; Lai, Z.; Cheng, H.; Liao, D. Extraction of asymptotic edges of microcracks in silicon nitride bearings based on adaptive nonlocal mean filtering and iterative tracking algorithm. Measurement 2025, 242, 116215. [Google Scholar] [CrossRef]
  9. Xiong, T.Z.; Ye, W.H. Improved Adaptive Kalman-Median Filter for Line-Scan X-ray Transmission Image. Sensors 2022, 22, 4993. [Google Scholar] [CrossRef]
  10. Faragallah, S.O.; Ibrahem, M.H. Adaptive switching weighted median filter framework for suppressing salt-and-pepper noise. AEUE Int. J. Electron. Commun. 2016, 70, 1034–1040. [Google Scholar] [CrossRef]
  11. Zhang, B.X.; Zhu, G.P.; Zhu, Z.B. A TV-log nonconvex approach for image deblurring with impulsive noise. Signal Process. 2020, 174, 107631. [Google Scholar] [CrossRef]
  12. He, W.; Zhang, H.Y.; Zhang, L.P.; Shen, H. Total variation regularized low-rank matrix factorization for hyperspectral image restoration. IEEE Trans. Geosci. Remote Sens. 2016, 54, 178–188. [Google Scholar] [CrossRef]
  13. Peng, J.J.; Xie, Q.; Zhao, Q.; Wang, Y.; Yee, L.; Meng, D. Enhanced 3DTV regularization and its applications on HSI denoising and compressed sensing. IEEE Trans. Image Process. 2020, 29, 7889–7903. [Google Scholar] [CrossRef]
  14. Huang, T.; Dong, W.S.; Xie, X.M.; Shi, G.; Bai, X. Mixed noise removal via Laplacian scale mixture modeling and nonlocal low-rank approximation. IEEE Trans. Image Process. 2017, 26, 3171–3186. [Google Scholar] [CrossRef]
  15. Shi, S.; Wang, C.; Xiao, S.; Li, H.; Zhao, X.; Guo, F.; Shi, L.; Zhou, X. Magnetic resonance image denoising for Rician noise using a novel hybrid transformer-CNN network (HTC-net) and self-supervised pretraining. Med. Phys. 2024, 52, 1643–1660. [Google Scholar] [CrossRef] [PubMed]
  16. Wang, S. A hybrid SMOTE and Trans-CWGAN for data imbalance in real operational AHU AFDD: A case study of an auditorium building. Energy Build. 2025, 348, 116447. [Google Scholar] [CrossRef]
  17. Yao, L.; Lin, C.C. Identification of nonlinear systems by the genetic programming based Volterra filter. IET Signal Process. 2009, 3, 93–105. [Google Scholar] [CrossRef]
  18. Wang, J.; Chen, J.; Shen, P.; Guan, X.; Liu, X.; Massari, C.; Wang, Z.; Feng, M.; Wang, Q.; Lu, Y.; et al. Regional-scale intelligent optimization and topography impact in restoring global precipitation data gaps. Commun. Earth Environ. 2025, 6, 671. [Google Scholar] [CrossRef]
  19. Gan, H.P.; Li, N.Z.; Chen, Z.W. Cancellation of mechanical vibration signal noise based on Volterra filter. J. Lanzhou Jiaotong Univ. 2015, 34, 130–135. [Google Scholar]
  20. Li, N.Z.; Wei, X.J.; Ding, W.C.; Lu, K.K. Removing mixed noise in locomotive wheel speed signal with a nonlinear Volterra filter. J. Lanzhou Univ. 2017, 53, 280–286. [Google Scholar]
  21. Li, N.Z.; Feng, X.Y. Volterra series identification method based on adaptive quantum-behaved particle swarm optimization combined with the chaotic strategy. J. Lanzhou Univ. 2014, 50, 128–134. [Google Scholar]
  22. Zhao, W.; Li, Z.Z.; Zhang, H.T.; Wang, D.; Yuan, Y. Nonlinear Volterra filter method for mixed noise reduction in rotate-speed with kernel parameters optimized based on Bat algorithm. J. Nonlinear Convex Anal. 2022, 23, 1895–1911. [Google Scholar]
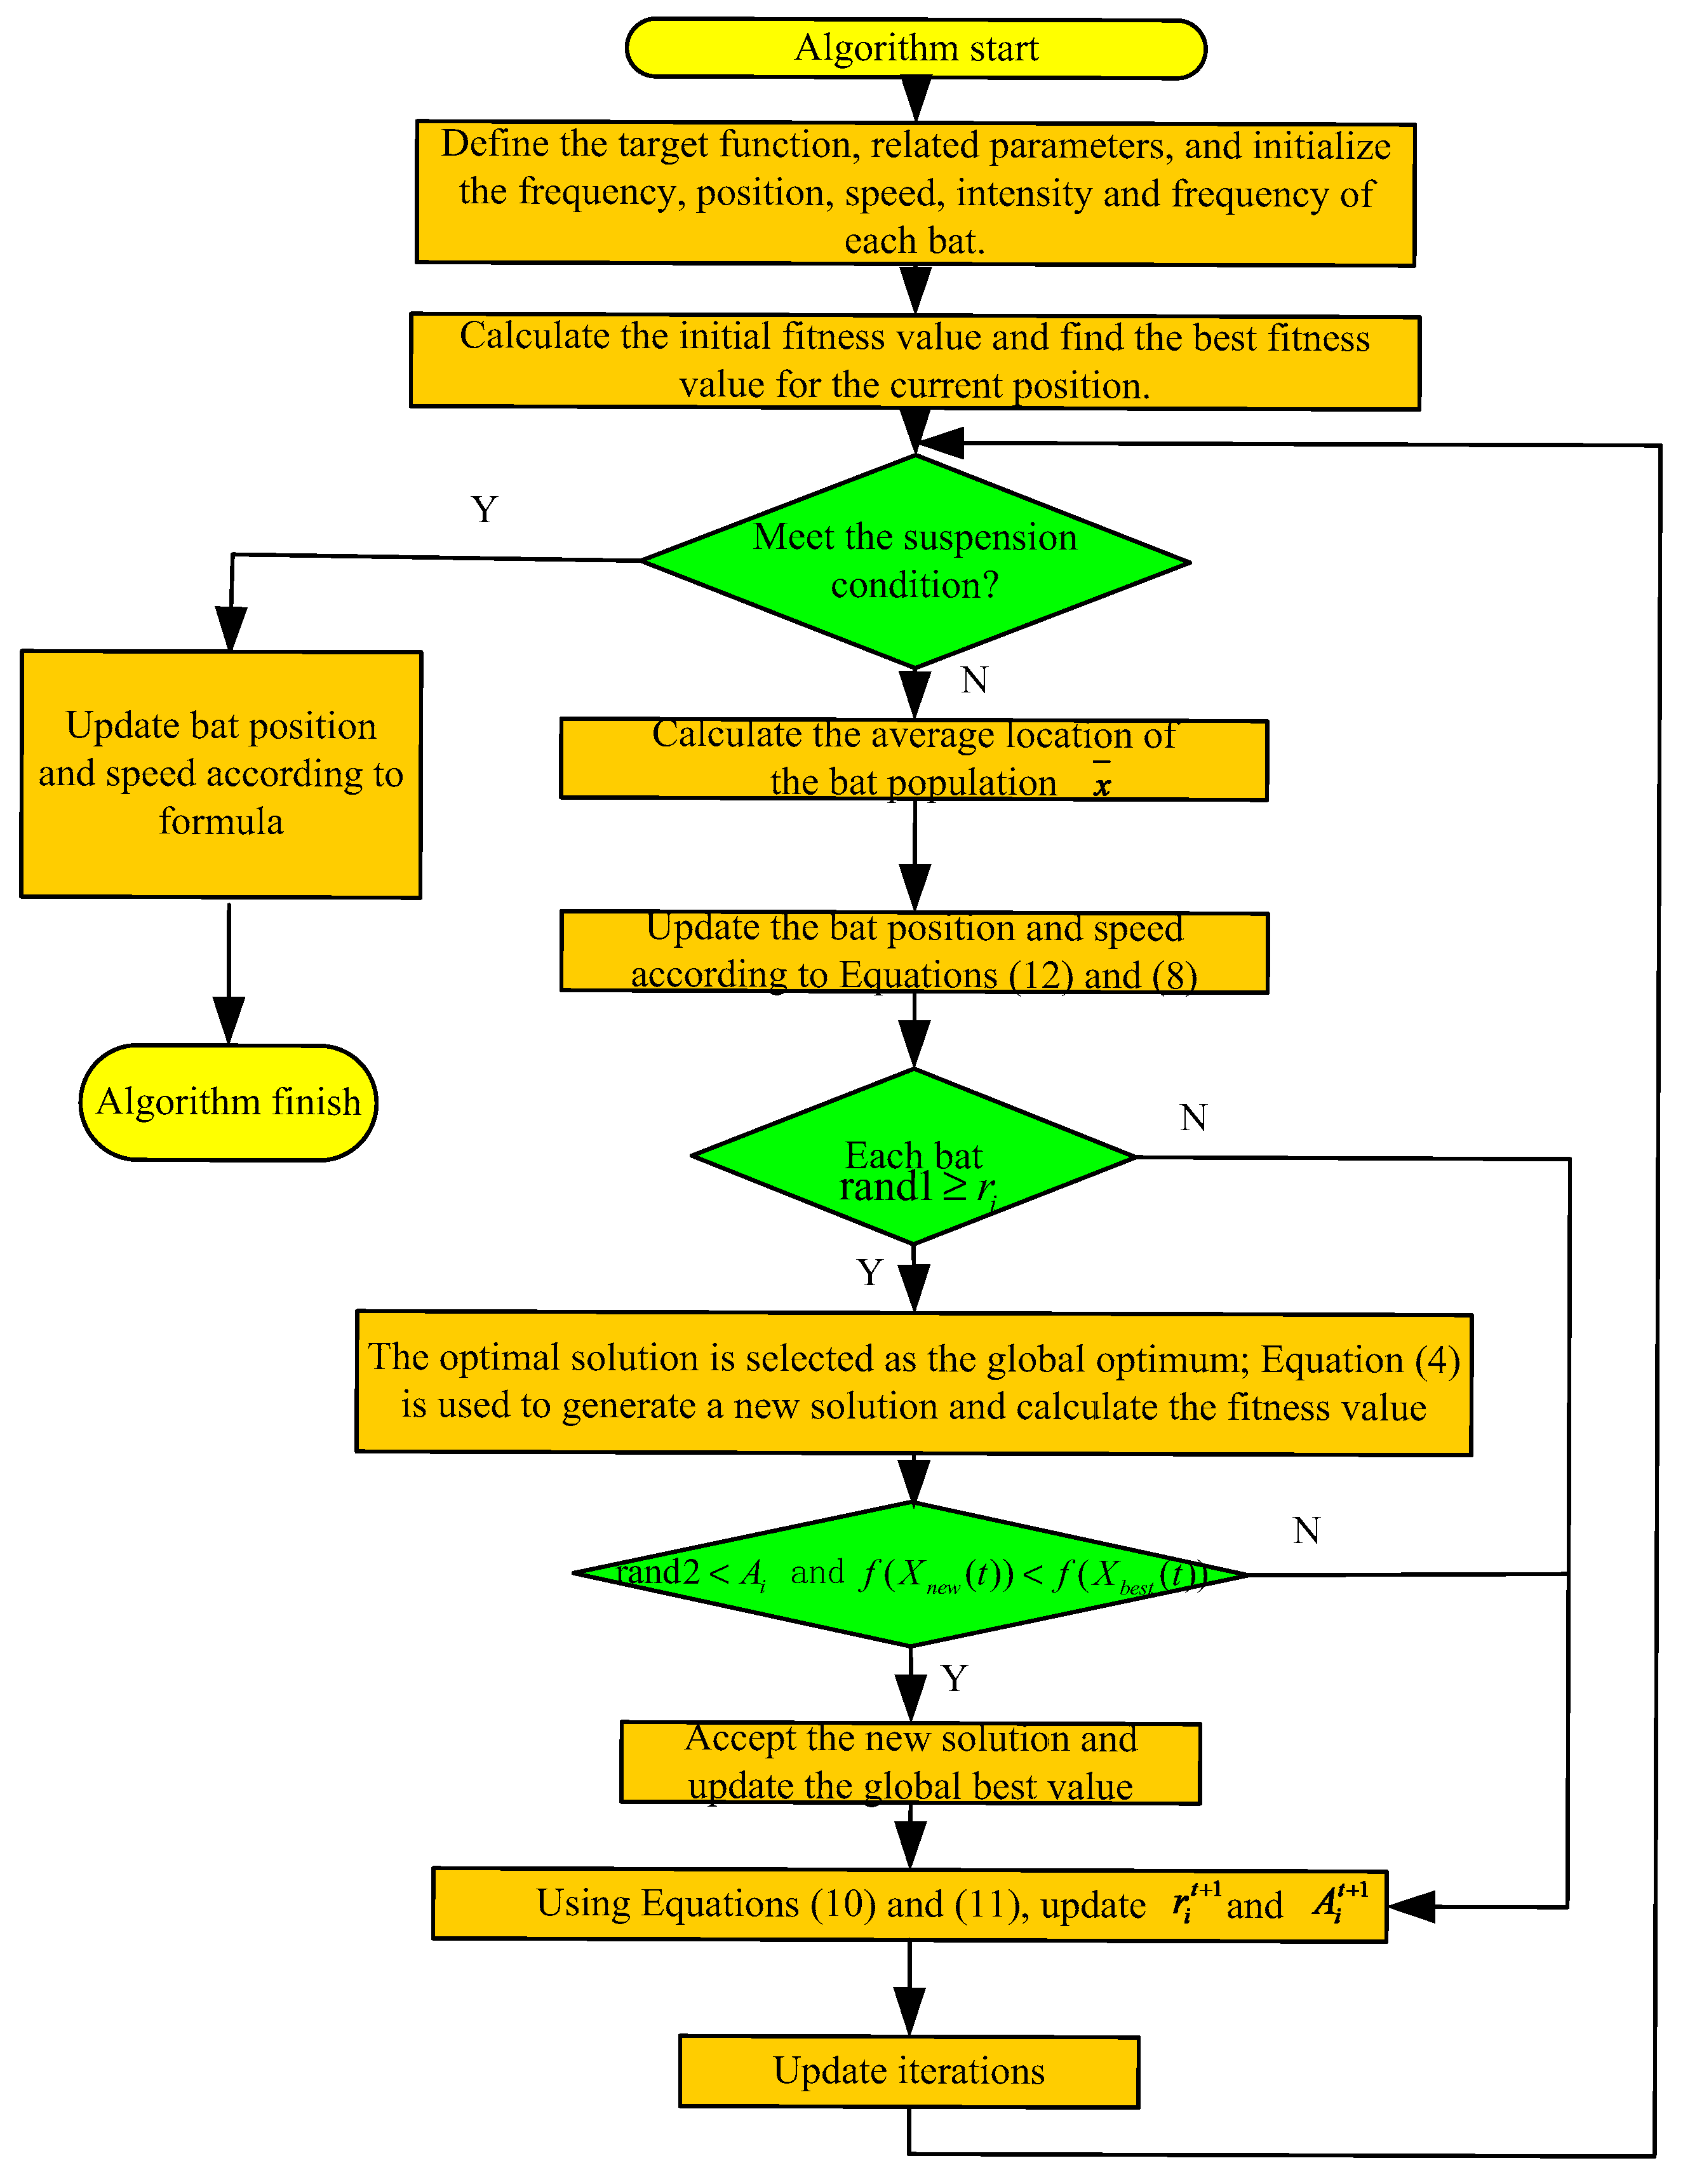
Figure 1. Flowchart of Volterra kernel-parameter optimization based on BA.
Electronics 14 04076 g001
Figure 2. Comparison of VWDBA and BA optimized third-order Volterra filters. Color coding: red—positive kernel value (enhancement); blue—negative kernel value (suppression).
Electronics 14 04076 g002
Figure 3. Evolution curve of test function fitness value: (a) Griewank; (b) Rastrigrin; (c) Schwefel.
Electronics 14 04076 g003aElectronics 14 04076 g003b
Figure 4. A comparison of the images before and after GN is removed: (a) GN with σ = 10; (b) GN with σ = 20; (c) denoised image of GN with σ = 10; (d) denoised image of GN with σ = 20.
Electronics 14 04076 g004
Figure 5. Quality evaluation of images with GN removed by VWDBA-Volterra: (a) PSNR for GN; (b) MSSSIM for GN.
Electronics 14 04076 g005aElectronics 14 04076 g005b
Figure 6. A comparison of the images before and after SPN is removed by VWDBA-Volterra: (a) SPN with d = 10%; (b) SPN with d = 20%; (c) denoised image of SPN with d = 10%; (d) denoised image of SPN with d = 20%.
Electronics 14 04076 g006
Figure 7. Quality evaluation of images with SPN removed by VWDBA-Volterra: (a) PSNR for SPN; (b) MSSSIM for SPN.
Electronics 14 04076 g007
Figure 8. Original image, images with varying amounts of noise intensity [10, 25%], and the denoised image: (a) Original image; (b) image with mixed noise; (c) WNNM; (d) LRTV; (e) partial magnification of (a); (f) partial magnification of (b); (g) partial magnification of (c); (h) partial magnification of (d); (i) WESNR; (j) LSM-NLR; (k) Transformer-CNN; (l) VWDBA-Volterra; (m) partial magnification of (i); (n) partial magnification of (j); (o) partial magnification of (k); (p) partial magnification of (l).
Electronics 14 04076 g008
Figure 9. Original image, images with varying amounts of noise intensity [10, 25%], and the denoised image after Canny edge recognition: (a) Original image; (b) image with mixed noise; (c) WNNM; (d) LRTV; (e) WESNR; (f) LSM-NLR; (g) Transformer-CNN; (h) VWDBA-Volterra.
Electronics 14 04076 g009
Figure 10. Image quality evaluation: (a) ΔPSNR of the image; (b) ΔSSIM of the image; (c) GMSD of the image. (d) LPIPS of the image.
Electronics 14 04076 g010aElectronics 14 04076 g010b
Figure 11. The results of removing mixed noise with different iterations of VWDBA-Volterra (t): (a) t = 60; (b) t = 120; (c) partial magnification of (a); (d) partial magnification of (b).
Electronics 14 04076 g011aElectronics 14 04076 g011b
Figure 12. The relationship between algorithm iterations and the PSNR value of the image after noise reduction.
Electronics 14 04076 g012
Figure 13. The relationship between algorithm iterations and GMSD of image after noise reduction.
Electronics 14 04076 g013
Figure 14. The result of removing mixed noise using VWDBA-Volterra with different population sizes: (a) population size = 15; (b) population size = 30; (c) partial magnification of (a); (d) partial magnification of (b).
Electronics 14 04076 g014
Figure 15. The relationship between algorithm population size and the PSNR of image after noise reduction.
Electronics 14 04076 g015
Figure 16. The relationship between algorithm population size and the GMSD of image after noise reduction.
Electronics 14 04076 g016
Table 1. Test function.
Function NameFunction ExpressionSearch SpaceTheoretical Optimal Solution
Griewank f 2 ( x ) = 1 4000 i = 1 D ( x i 2 ) i = 1 D cos ( x i i ) + 1 600 , 600 D f 1 ( 0 , , 0 ) = 0
Rastrigrin f 3 ( x ) = i = 1 D x i 2 10 cos ( 2 π x i ) + 10 10 , 10 D f 2 ( 0 , , 0 ) = 0
Schwefel f 4 ( x ) = 418.9829 × D i = 1 D x i sin ( x i 500 , 500 D f 3 ( 420.96 , , 420.96 ) = 0
Table 2. Kernel-parameter optimization results.
h 1 ( 1 ) 1.20 × 10⁻¹ h 2 ( 1 , 3 ) 4.05 × 10⁻³ h 3 ( 1 , 1 , 1 ) −1.58 × 10⁻⁴
h 1 ( 2 ) 4.01 × 10⁻¹ h 2 ( 1 , 4 ) −2.21 × 10⁻³ h 3 ( 1 , 1 , 2 ) 8.62 × 10⁻⁵
h 1 ( 3 ) −2.18 × 10⁻¹ h 2 ( 2 , 2 ) −2.08 × 10⁻³ h 3 ( 1 , 2 , 2 ) −7.14 × 10⁻⁴
h 1 ( 4 ) 1.23 × 10⁻¹ h 2 ( 2 , 3 ) −1.24 × 10⁻³ h 3 ( 1 , 2 , 3 ) 9.66 × 10⁻⁵
h 1 ( 5 ) 2.24 × 10⁻¹ h 2 ( 2 , 4 ) 2.11 × 10⁻³ h 3 ( 1 , 3 , 3 ) 1.74 × 10⁻⁴
h 1 ( 6 ) 2.51 × 10⁻¹ h 2 ( 3 , 3 ) 3.49 × 10⁻³ h 3 ( 2 , 2 , 3 ) −2.15 × 10⁻⁴
h 2 ( 1 , 1 ) 2.44 × 10⁻³ h 2 ( 3 , 4 ) 2.46 × 10⁻³ h 3 ( 2 , 3 , 3 ) 3.42 × 10⁻⁴
h 2 ( 1 , 2 ) 1.84 × 10⁻³ h 2 ( 4 , 4 ) 2.42 × 10⁻³ h 3 ( 3 , 3 , 3 ) −6.77 × 10⁻⁴
Table 3. Computational complexity analysis.
AlgorithmComputational ComplexityKey Bottlenecks
WNNMt × B × (m × n × r + r3)t: Number of iterations (typically 10–20); B: Number of patch groups (thousands); m, n: Patch size (e.g., 8 × 8); r: Rank of the patch group
LRTVt × (B × r3+ N log N)t: Number of ADMM iterations; B: Number of non-local patch groups; r: Rank for low-rank approximation; N: Number of pixels
WESNRt × (B × L2+ N × L)t: Number of iterations; B: Number of patch groups; L: Number of dictionary atoms; N: Number of pixels
LSM-NLRt × B × (m × n × r + r3)I: Number of iterations; B: Number of patch groups
Transformer-CNNt × (H × W × C2+ H × W2× C))t: Number of layers; H, W: Feature map size (256 × 256); C: Number of channels
VWDBA-VolterraT × P × N × KT: Number of iterations (typically 50–200) P: Population size; N: Number of pixels (256 × 256 = 65,536); K: Volterra kernel size
Table 4. Computational time comparison (for a 256 × 256 image).
AlgorithmEstimated Computational Time (s)Hardware Dependency and Time Analysis
WNNM243.5CPU: Massive SVD computations are the main bottleneck. Even for a size of 256 × 256, thousands of patch groups need processing.
LRTV123.4CPU: ADMM iteration convergence requires time, alternating between low-rank and TV optimizations.
WESNR56.8CPU: Hybrid model but optimized, typically more efficient than pure WNNM.
LSM-NLR34.5CPU: Specifically designed for mixed noise, employing more efficient robust estimation, typically faster than WNNM.
Transformer-CNN26 hGPU: highly recommended.
Training: Requires extensive data and time for parameter training.
VWDBA-Volterra14.6CPU: Time depends directly on population size × iterations. Adaptive inertia weight may accelerate convergence. Volterra filtering itself is computationally efficient.
Table 5. Kernel-parameter optimization results by two different iterations.
Kernel
Parameters
Optimized ResultsKernel ParametersOptimized ResultsKernel ParametersOptimized Results
t = 60t = 120t = 60t = 120t = 60t = 120
h 1 ( 1 ) 1.25 × 10−11.18 × 10−1 h 2 ( 1 , 3 ) 4.98 × 10−35.36 × 10−3 h 3 ( 1 , 1 , 1 ) −2.41 × 10⁻³−2.31 × 10⁻⁴
h 1 ( 2 ) 3.98 × 10−13.04 × 10−1 h 2 ( 1 , 4 ) −1.25 × 10⁻³−1.56 × 10⁻³ h 3 ( 1 , 1 , 2 ) 1.34 × 10−58.72 × 10−5
h 1 ( 3 ) −2.15 × 10⁻¹−2.16 × 10⁻¹ h 2 ( 2 , 2 ) 2.55 × 10⁻³−2.72 × 10⁻³ h 3 ( 1 , 2 , 2 ) 3.43 × 10⁻³−6.36 × 10⁻⁵
h 1 ( 4 ) 1.77 × 10−11.65 × 10−1 h 2 ( 2 , 3 ) −2.46 × 10⁻³−2.42 × 10⁻³ h 3 ( 1 , 2 , 3 ) 1.19 × 10−48.89 × 10−5
h 1 ( 5 ) 2.24 × 10−12.16 × 10−1 h 2 ( 2 , 4 ) 3.66 × 10−34.21 × 10−3 h 3 ( 1 , 3 , 3 ) 9.63 × 10−52.31 × 10−4
h 1 ( 6 ) 2.66 × 10−12.42 × 10−1 h 2 ( 3 , 3 ) 4.51 × 10−35.41 × 10−3 h 3 ( 2 , 2 , 3 ) −8.23 × 10⁻⁵−1.26 × 10⁻⁴
h 2 ( 1 , 1 ) 1.42 × 10−32.63 × 10−3 h 2 ( 3 , 4 ) 4.78 × 10−39.64 × 10−4 h 3 ( 2 , 3 , 3 ) −1.33 × 10−41.56 × 10−5
h 2 ( 1 , 2 ) 2.38 × 10−32.66 × 10−3 h 2 ( 4 , 4 ) 8.92 × 10−41.34 × 10−3 h 3 ( 3 , 3 , 3 ) −8.29 × 10⁻⁵−5.32 × 10⁻⁵
Table 6. Kernel-parameter optimization results by two different bat population size.
Kernel Parameters Optimized ResultsKernel ParametersOptimized ResultsKernel ParametersOptimized Results
153015301530
h 1 ( 1 ) 1.25 × 10−11.22 × 10−1 h 2 ( 1 , 3 ) 4.23 × 10−34.13 × 10−3 h 3 ( 1 , 1 , 1 ) −1.23 × 10⁻³−1.78 × 10⁻⁴
h 1 ( 2 ) 4.01 × 10−13.99 × 10−1 h 2 ( 1 , 4 ) −3.25 × 10⁻³−2.34 × 10⁻³ h 3 ( 1 , 1 , 2 ) 1.55 × 10−59.32 × 10−5
h 1 ( 3 ) −2.23 × 10⁻¹−2.15 × 10⁻¹ h 2 ( 2 , 2 ) −5.31 × 10⁻³−3.01 × 10⁻³ h 3 ( 1 , 2 , 2 ) 6.13 × 10⁻³−7.35 × 10⁻⁴
h 1 ( 4 ) 1.45 × 10−11.33 × 10−1 h 2 ( 2 , 3 ) −4.68 × 10⁻³−1.2 × 10⁻³ h 3 ( 1 , 2 , 3 ) 2.23 × 10−49.66 × 10−5
h 1 ( 5 ) 2.52 × 10−12.12 × 10−1 h 2 ( 2 , 4 ) 4.78 × 10−32.35 × 10−3 h 3 ( 1 , 3 , 3 ) −6.37 × 10−51.22 × 10−4
h 1 ( 6 ) 2.44 × 10−12.52 × 10−1 h 2 ( 3 , 3 ) 2.51 × 10−33.41 × 10−3 h 3 ( 2 , 2 , 3 ) −2.24 × 10⁻⁴−2.15 × 10⁻⁴
h 2 ( 1 , 1 ) 1.82 × 10−31.75 × 10−3 h 2 ( 3 , 4 ) 4.95 × 10−32.33 × 10−3 h 3 ( 2 , 3 , 3 ) −3.32 × 10−44.55 × 10−4
h 2 ( 1 , 2 ) 2.17 × 10−31.96 × 10−3 h 2 ( 4 , 4 ) 4.91 × 10−32.15 × 10−3 h 3 ( 3 , 3 , 3 ) −3.66 × 10⁻⁴−6.82 × 10⁻⁴
Disclaimer/Publisher’s Note: The statements, opinions and data contained in all publications are solely those of the individual author(s) and contributor(s) and not of MDPI and/or the editor(s). MDPI and/or the editor(s) disclaim responsibility for any injury to people or property resulting from any ideas, methods, instructions or products referred to in the content.