Abstract
The rapid proliferation of residential electric vehicles (EVs), rooftop photovoltaics (PVs), and behind-the-meter batteries is transforming energy communities while introducing new operational stresses to local distribution grids. Short-duration transformer overloads, often overlooked in conventional hourly or optimization-based planning models, can accelerate asset aging before voltage limits are reached. This study introduces a second-by-second, multi-agent-based simulation (MABS) framework that couples empirically calibrated Distributed Energy Resource (DER) adoption trajectories with real-time-price (RTP)–driven household charging decisions. Using a real 160-household feeder in Denmark (2024–2025), five progressively integrated DER scenarios are evaluated, ranging from EV-only adoption to fully synchronized EV–PV–battery coupling. Results reveal that uncoordinated EV charging under RTP shifts demand to early-morning hours, causing the first transformer overload within four months. PV deployment alone offers limited relief, while adding batteries delays overload onset by 55 days. Only fully coordinated EV–PV–battery adoption postponed the first overload by three months and reduced total overload hours in 2025 by 39%. The core novelty of this work lies in combining empirically grounded adoption behavior, second-level temporal fidelity, and agent-based grid dynamics to expose transient overload mechanisms invisible to coarser models. The framework provides a diagnostic and planning tool for distribution system operators to evaluate tariff designs, bundled incentives, and coordinated DER deployment strategies that enhance transformer longevity and grid resilience in future energy communities.
1. Introduction
Electrification of transport, rooftop-solar deployment, and declining battery prices are driving an unprecedented proliferation of residential DERs. EVs, PV arrays, and behind-the-meter storage collectively expand household autonomy and can, in principle, furnish distribution-system flexibility that would otherwise require costly grid reinforcement [1,2]. Yet recent field trials and analytical studies show that each technology also introduces distinct operational stresses when deployed in isolation. Uncoordinated residential EV charging has been observed to raise feeder peaks by 20–40% and to accelerate transformer aging through early-morning load clustering induced by RTP [3,4]. Stand-alone PV generation, although reducing diurnal net imports, often worsens voltage excursions and yields little evening-peak relief in the absence of co-located storage [5,6]. Household batteries can mitigate such effects, but only if their dispatch is synchronized with local load and generation; otherwise, limited capacity is exhausted during daytime PV surplus and unavailable for nocturnal EV charging [7,8]. For distribution-system operators (DSOs), the intersection of stochastic demand, intermittent supply and heterogeneous storage behavior therefore raises acute questions of congestion management, asset lifetime and resilience [9,10].
The academic response has progressed along three methodological strands: optimization-based scheduling frameworks for single DER types [11]; techno-economic studies that pair PV and batteries but assume idealized user behavior [5]; and co-simulation environments that loosely couple traffic and power models [12]. These approaches, while informative, share two limitations. First, they typically adopt hourly or coarser time steps that mask short-duration overloads which dominate transformer loss-of-life [13]. Second, they treat DER adoption as exogenous, overlooking the empirical heterogeneity in household uptake trajectories and price responsiveness. Recent MABS work has begun to model such heterogeneity [14,15], yet no study has systematically compared overload incidence across alternative DER-coupling pathways with sub-second resolution, nor quantified the storage-penetration thresholds at which RTP-induced congestion is alleviated.
To close these gaps, this paper develops a high-fidelity MABS platform that integrates:
- Empirically calibrated logistic adoption curves for EVs, PVs and batteries derived from Danish market data;
- Household-level RTP charging decisions that reflect heterogeneous mobility schedules;
- A power-flow engine that records transformer loading at 1 s intervals.
Five progressively richer scenarios are examined on the real 160-household Nørre Bjert feeder: a DER-free baseline; EV-only adoption; independent EV + PV adoption; staggered EV + PV + battery deployment; and fully synchronized EV–PV–battery uptake reflecting bundled-incentive programs. The framework thereby isolates the individual and joint effects of DER technologies on overload timing, frequency and duration.
The main contribution of this work lies in its unified, data-driven representation of behavioral adoption, temporal fidelity, and system-level impacts. The study provides the first second-by-second assessment of residential transformer overloads under uncoordinated RTP charging and offers a clear comparison of how progressively richer DER portfolios, ranging from EV-only to fully synchronized EV, PV, and battery systems, influence overload timing and duration. By linking empirical adoption curves with operational outcomes, it establishes a quantitative relationship between storage penetration and overload-hour reduction of up to 39 percent. The framework isolates how each configuration affects the timing, frequency, and duration of transformer overloads. The analysis focuses on operational effects, establishing a clear unmanaged baseline for future research on advanced coordination and market-based strategies.
The remainder of this paper is organized as follows. Section 2 reviews the relevant literature and identifies research gaps addressed by this work. Section 3 details the MABS framework, Section 4 introduces the case study feeder and data sources, Section 5 presents the simulation results, Section 6 discusses implications and limitations, and Section 7 concludes with recommendations for coordinated DER deployment in residential grids.
2. Literature Review
2.1. Background: From Isolated DERs to Integrated, Grid-Interactive Portfolios
Early investigations into the electrification of transport identified both the promise and the peril of unmanaged charging. Studies of uncoordinated plug-in hybrid and battery EV demand showed that coincident evening or early-morning charging can trigger voltage deviations, overloading and elevated losses on residential feeders [3,16]. Subsequent work demonstrated that bidirectional “vehicle-to-grid” (V2G) operation could, in principle, absorb renewable surpluses and provide ancillary services, provided reliable high-power interfaces and robust communications are available [17,18,19,20].
In parallel, PV and stationary batteries have matured rapidly. Analyses show that while PV reduces mid-day imports, it offers limited evening-peak relief unless coupled with storage [5]. Reviews of system-wide flexibility measures concluded that coupling supply-side options (e.g., grid expansion, pumped hydro) with demand-side flexibility (demand response, EV storage) is essential as variable renewables approach high penetration levels [1,2,21].
2.2. Modeling Paradigms for DER–Grid Interaction
Optimization and analytical studies. Generation-planning models quantify the system-level cost of “dumb’’ versus “smart’’ EV fleets and show that merely shifting charging in time can deliver most of the economic benefit of full V2G control [22], while quadratic or dynamic programming can temper feeder constraints [11,23]. Robust optimization and chance-constrained programming have also been applied to manage uncertainty in EV and renewable integration [16,24].
Co-simulation environments. Tools such as MOSAIK synchronize power-system solvers with traffic or charging sub-models; they report that empirical Dutch charging patterns can cause local voltage-limit infringements even under moderate PV back-feed [12].
Multi-agent-based and digital-twin frameworks. To capture the heterogeneity of household decisions and DER operation, MABS has been adopted for business-ecosystem analysis [25], generic energy-ecosystem modeling [14], unified flexibility representation [26] and multi-criteria decision-making in Danish feeders [15]. Digital-twin architectures extend MABS with real-time data streams and fine-grained topology mapping [27], enabling what-if studies over decade-long horizons.
Dynamic and multi-physics models. High-resolution dynamical analyses reveal daily oscillations of grid resilience driven by clustered PV output [6], while transformer aging studies show that intensive rural EV charging can cut equipment lifetime [4,13]. Power-quality reviews further document harmonics, voltage imbalance and flicker arising from fast chargers [28].
2.3. Operational Coordination and Control Strategies
Local scheduling and rescheduling. Classic flexible-charging algorithms minimize transformer headroom violations by incorporating voltage and power limits into mixed-integer or genetic-algorithm formulations [11,21,29]. Earliest-deadline strategies were recently out-performed by time-and-energy-aware allocation that served up to 33% more EVs during peaks [30].
Market-based demand response. RTP can shift EV load but may cause secondary peaks when many vehicles respond identically [1]; combining RTP with workplace/delayed charging nearly eliminates demand growth in California and Texas case studies [3,31]. Time-of-use (ToU) distribution tariffs were found most feasible across technical, economic, social and regulatory criteria in Denmark [32], and discrete-choice experiments show that large price gaps are needed to achieve meaningful load-shifting [33]. Deep-reinforcement-learning pricing attains 14% higher station profit while constraining queue-length volatility [34], whereas demand-responsive dynamic tariffs outperform flat rates in European DR potential estimates [23,35,36].
Community and mobile storage. Optimum community energy-storage (CES) sizing studies reveal that lithium-ion banks halve levelized cost versus lead-acid under real-time tariffs [7]. Mobile battery trailers and truck-mounted storage are emerging resilience assets for post-disaster power support [9]. Reliability-oriented placement of PV-fed charging hubs with V2G reduced expected energy-not-charged by 11% [37].
Building-level orchestration. Coordinated control of clustered buildings with EVs and stationary batteries raised self-consumption by 19% and cut bills by 36% [29], while intelligent forecasting plus swarm-based optimization of DER schedules enhances grid stability in commercial complexes [38].
2.4. Economic, Policy and Ecosystem Perspectives
The smart-grid vision hinges on secure, low-latency sensing networks; lightweight cryptographic suites such as SPINS enable confidentiality and freshness in resource-constrained devices [39]. Business-ecosystem ontologies clarify actor roles and value propositions in home-charging markets [25], and architectural simulation shows how tariff design steers adoption trajectories [15]. Comprehensive reviews document storage-technology suitability for grid-scale integration [36] and highlight lingering gaps in standards, incentives and V2G business models [20,40,41,42,43,44]. Hybrid-renewable optimization surveys confirm the superiority of AI-driven and hybrid meta-heuristics for sizing hybrid renewable systems [45].
2.5. Synthesis of Research Gaps
Studies on DER–grid interaction differ in temporal detail and modeling scope, yet most simplify adoption behavior and operational dynamics. Table 1 summarizes representative works by their time resolution, adoption modeling approach, DER scope, and whether transformer overloads were detected.

Table 1.
Summary of representative studies on DER–grid interaction modeling.
As shown in Table 1, most prior studies rely on time steps of several minutes or longer and treat DER adoption as an external input. Only a few consider transformer overloads, often focusing on a single DER type or using simplified coordination schemes. As a result, three main research gaps remain: first, limited modeling of transformer overloads at sub-minute resolution across multiple DER pathways; second, insufficient analysis of how RTP-driven EV charging interacts with co-adopted PV–battery systems within a behaviorally informed agent framework; and third, inadequate examination of how price incentives and physical coordination jointly influence feeder resilience.
The present paper addresses these gaps by unifying empirically derived adoption curves, RTP-driven charging, household-specific PV–battery control and one-second transformer monitoring in a Danish feeder MABS. The scenario design progresses from EV-only adoption to fully synchronized EV, PV, and battery configurations, directly meeting the need identified in the literature for high-resolution, comparative analysis of integrated DER impacts on grid stability.
3. Methodology
This study employs a simulation-based methodology to assess the operational impacts of DER adoption—specifically EVs, PV systems, and household battery storage—on residential low-voltage distribution grids. A modular multi-agent-based simulation framework is developed in AnyLogic (version 8.8.3), integrating empirical data, real-time price-driven decision-making, and dynamic scenario analysis. All processes run at a fixed one-second resolution, continuously updating transformer loading, DER behavior, and power flows over a two-year horizon. This high temporal fidelity enables detection of short-duration overloads that coarser models overlook, providing critical insight into grid stress and congestion under high DER penetration.
3.1. Multi-Agent-Based Simulation Framework
The framework is structured around four interacting modules: DER, Electricity Distribution Grid, Electricity Consumers, and Electricity Systems. Each module contains multiple agent types that interact within and across modules through clearly defined interfaces, enabling decentralized decision-making, asynchronous operation, and realistic modeling of residential energy behavior.
3.1.1. DER Agents
The DER module comprises three main device types: EVs, PVs, and stationary batteries. Each device is modeled as a distinct agent with physical constraints, control logic, and interactions with other agents.
The EV agent simulates trip-based driving schedules and cost-minimizing charging behavior under a RTP scheme [15]. Each EV transitions through four states: idle, driving, connected, and charging states as shown in Figure 1. Charging infrastructure is represented by a separate Charging Box agent, which communicates with the EV to schedule charging based on day-ahead electricity prices. The charging strategy optimizes for minimum cost while satisfying user mobility constraints.

Figure 1.
State chart of EV agent behavior.
The Rooftop PV system is represented by a PV agent coupled with an Inverter agent. The PV agent generates DC power based on irradiance profiles, while the inverter converts it to usable AC power. PV output is determined dynamically from cell area, efficiency, and solar irradiance using Equation (1).
In this Equation, represents the solar irradiance (as provided by the Utility module), denotes the conversion efficiency of the PV cells, represents the number of PV cells in the panel, and signifies the area of each individual PV cell. Inverter selection and panel sizing are handled by the consumer agent at the time of adoption [46].
As shown in Figure 2, the Residential Battery agent transitions from a disconnected to a connected state once it is paired with a Hybrid Converter (AC/DC interface). Charging and discharging are controlled externally by a controller agent, which ensures operation stays within State of Charge (SoC) limits and respects maximum (dis)charging rates and efficiencies.
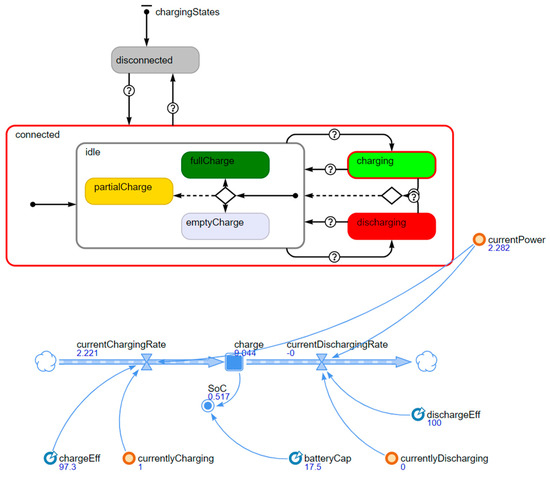
Figure 2.
Battery agent operational states and system dynamics.
The battery enters the charging or discharging state when requested and returns to idle either automatically when SoC limits are reached, or when interrupted by the controller. While idle, it reflects its SoC status through one of three substates: fullCharge, emptyCharge, or partialCharge.
The lower part of the figure models SoC dynamics. Power flow rates (charging or discharging) update the battery’s energy level continuously, while the currentPower variable reflects real-time power exchange with the grid, adjusted for efficiency [46].
3.1.2. Electricity Distribution Grid
The distribution grid is modeled as a radial, tree-structured network composed of transformer, cable boxes, low-voltage lines, and consumer connection points. A central transformer agent aggregates household loads and enforces a 400-kVA capacity limit. Any exceedance is logged as a transformer overload event. Power flow is simplified to a single-phase aggregated representation that considers only active power, consistent with the study’s focus on transformer loading.
Each grid component implements a shared interface indicating its role as a power carrier, enabling unified handling of power flow and topology. Components are connected upstream to a single parent agent and downstream to one or more child agents. Load changes originating from consumer nodes propagate upstream through this structure, allowing dynamic adjustment of aggregated power flows.
Grid topology is auto-generated based on input data from the DSO, using grid IDs assigned to each component. This modular setup supports flexible simulation across multiple feeder configurations with minimal model changes.
3.1.3. Electricity Consumer
Each household is modeled as an Electricity Consumer agent that manages energy demand, DER adoption, and interaction with the grid. Consumers progressively adopt DERs based on scenario parameters. Upon adoption, they assign the appropriate DER and control equipment, then establish physical and logical connections to the grid.
For EVs, the consumer determines driving schedules based on historical load patterns. Each EV performs one trip per day, with departure and arrival times inferred from peak usage intervals. Trip distances are drawn from weekday-specific probability distributions.
3.1.4. Electricity System
System-level agents in the simulation include the DSO, the Transmission System Operator (TSO), the Electricity Supplier, and the DataHub. The DSO monitors transformer loads, detects overloads, and enforces local capacity constraints. The Electricity Supplier provides day-ahead hourly prices used by the RTP agent to schedule EV charging. The DataHub facilitates data exchange among consumers, DERs, and system agents.
To promote local energy balancing, the DSO enforces a zero net flow policy at each household. When a net export or import is detected, the DSO sends a control signal to the battery to adjust its charging or discharging rate as Equation (2):
This reactive control does not anticipate future events and may exhaust battery energy in attempting to neutralize small, persistent imbalances, limiting its effectiveness during sudden peaks. Nonetheless, it enforces a localized balancing constraint that prevents DERs from injecting or drawing power from the upstream grid under normal conditions.
Under this policy, export to the upstream grid is disabled. Consequently, when PV generation exceeds instantaneous household demand, the controller first attempts to charge the battery subject to power and SoC limits. If the battery is at its maximum SoC or charging is rate-limited, the remaining PV output is curtailed at the inverter, that is, the surplus is not used.
3.1.5. Agent Interactions
To ensure modularity and scalability, agent interactions across the four main modules—DERs, Electricity Consumers, Distribution Grid, and Electricity System—are governed by well-defined interface-based communication protocols. Agents store reference variables to other agents they interact with, and connections are dynamically established during initialization based on topology or ownership rules.
At simulation startup, the Distribution Grid agent instantiates all grid components using input topology files. Each grid agent requests upstream and downstream connections to form a radial structure. As power demand or generation changes at consumer connection points, updates propagate upward through cable agents to the transformer, which continuously aggregates total system load.
Electricity Consumer agents serve as central coordinators at the household level. Upon adopting a DER, they assign corresponding charger or inverter agents and connect devices to the grid. They also transmit EV driving schedules and SoC requirements to Charging Box agents, enabling price-based charging coordination.
DER agents do not communicate directly with each other. Instead, their behaviors are indirectly synchronized through shared grid conditions, household control logic, and system-level control signals. For example, when a DSO agent detects imbalance at a consumer connection point, it issues a control signal to a battery’s inverter, prompting a charging or discharging adjustment to minimize net grid flow. The DER then updates its power flow accordingly via its power control agent (e.g., inverter or charging box).
All DERs, grid components, and system agents adhere to standardized interfaces to support consistent interaction logic. This design ensures agents can operate independently unless a valid reference is available, enabling robust and fault-tolerant simulation across varying feeder topologies and adoption scenarios.
3.2. Scenario Design
To evaluate how different configurations of DERs affect residential grid stability, five simulation scenarios were designed. These scenarios serve to systematically examine the isolated and combined operational impacts of EVs, PV systems, and residential battery storage on transformer loading, overload occurrence, and temporal stress distribution within a low-voltage feeder network.
The overarching purpose of this scenario design is twofold. First, it enables a stepwise assessment of how each DER type individually contributes to grid performance under RTP conditions. Second, it facilitates a controlled comparison of how integration structure affects the system’s ability to manage peak demand and avoid transformer overloads.
The five scenarios are constructed in a cumulative and comparative manner. Each scenario adds a new layer of DER complexity or coordination relative to the previous one, allowing both incremental and holistic impacts to be quantified:
- Scenario 1: No DER AdoptionThis baseline case models a feeder with households operating without any DERs. It provides a reference for normal transformer load behavior and system reliability under historical consumption patterns.
- Scenario 2: EV OnlyThis scenario introduces EVs to the system. Adoption follows a logistic curve based on historical data, and charging is governed by RTP without any supporting generation or storage. It isolates the impact of uncoordinated EV charging on grid stability.
- Scenario 3: EV + PV (Independent Adoption)Building on Scenario 2, rooftop PV systems are added, but they are adopted independently of EV ownership. This configuration examines the extent to which standalone solar generation reduces net demand, despite temporal mismatches with EV charging behavior.
- Scenario 4: EV + PV + Battery (Staggered and Partial Integration)In this scenario, PV adoption is coupled with battery storage, simulating a staggered deployment where not all households adopt the complete DER suite. It assesses how localized storage improves system flexibility under partial penetration and uncoordinated control.This represents a partially coordinated case, where DERs are adopted at different rates. EVs follow their own logistic curve, while PV and battery adoption occur independently and at lower penetration levels based on separate empirical growth projections.At the household level, adoption events are randomized: when the logistic curve indicates that a new EV or PV-battery unit is added to the population, the adopting household is randomly selected from those that have not yet adopted the respective technology. As a result, some households own only EVs, some own only PV-battery systems, and a subset eventually own all three. The timing of adoption across technologies is uncorrelated, reflecting staggered and heterogeneous adoption patterns.
- Scenario 5: EV + PV + Battery (Fully Coupled Integration)This final scenario represents the most coordinated configuration. Each household that adopts an EV simultaneously installs a PV system and a battery. All three technologies follow the same logistic adoption curve, based on the EV adoption trajectory, reflecting a fully coordinated adjustment pathway. In this case, adoption is synchronized at the household level: whenever a household is selected to adopt an EV, the same household simultaneously adopts a PV system and a battery. This ensures that all adopters receive the full DER bundle at the same time, aligning generation, storage, and consumption, and providing the highest potential for grid balancing.
By progressing from no DERs to fully integrated configurations, the scenario design allows for a detailed exploration of how both the presence and structure of DER adoption influence residential grid performance.
4. Case Study: Nørre Bjert Residential Distribution Network
The simulation is implemented on the Nørre Bjert residential network, a representative low-voltage feeder located near Kolding in Western Denmark. This real-world distribution system comprises 160 households and reflects typical suburban load profiles, housing density, and infrastructure conditions. The modeled grid is configured as a radial network, with all households connected to a single 400 kVA transformer. A unity power factor is assumed, so the transformer’s 400 kVA rating is treated as 400 kW in the analysis and simulations [15]. Transformer load is monitored at one-second resolution, with any exceedance logged as an overload event. Since no detailed DER data were available, the simulation assumes a clean baseline without pre-existing installations, using historical consumption patterns and theoretical adoption curves to guide DER deployment.
Drawing on innovation adoption theories discussed in [47], the diffusion of DER technologies in residential populations is represented using a logistic growth function, which generates the characteristic S-shaped cumulative adoption curve. This function captures the typical pattern of slow initial uptake among innovators, accelerating adoption during the early- and late-majority phases, and a gradual decline in growth as the market approaches saturation.
In the simulation framework, adoption is modeled through a predefined logistic function rather than through complex social interactions among agents. This approach ensures that the total number of adopters follows an empirically plausible trajectory while keeping the model tractable. The logistic function is defined as Equation (3).
represents the number of DER appliances adopted at time , denotes the initial number of appliances, is the adoption rate, and signifies the maximum potential number of DER appliances within the system.
EV adoption is modeled consistently across all scenarios using historical national registration data from Statistics Denmark [40], which follows an exponential trajectory. The adoption rate is set to 87.1% per year, reflecting the recent exponential growth in EV registrations in Denmark and consistent with national electrification policies [46], resulting in the logistic function defined in Equation (4):
In contrast, PV adoption strategies vary across scenarios. In Scenarios 3 and 4, PV systems are adopted independently of EV ownership, based on projected residential solar capacity growth rates from the Danish Energy Agency [48]. A corresponding growth rate of 6.9% [46] is used to define the independent PV adoption trajectory shown in Equation (5):
At the household level, adoption is randomized so that the specific households adopting EVs or PVs vary, but the aggregated adoption follows the system-level logistic curve. This maintains heterogeneity among agents while ensuring that total adoption is consistent with the predefined trajectories.
In Scenario 4, battery adoption is linked directly to PV installation, so each household adding a PV system also installs a battery. Deployment of these coupled PV–battery units follows the same logistic curve as PV adoption (Equation (5)). In Scenario 5, DER adoption is fully synchronized: each household adopting an EV simultaneously installs a PV system and battery, with all three following the EV adoption trajectory (Equation (4)).
The simulation begins on 1 January 2024, and runs until 31 December 2025. At the outset, the system includes 27 EVs and 24 PV systems among the 160 households. Figure 3 displays the cumulative EV adoption curve over the two-year simulation period, showing an increase to 53 EVs by the end of 2024 and reaching 86 by the end of 2025. Figure 4 presents the independent PV adoption trajectory (applicable to Scenarios 3 and 4), which progresses more gradually, reaching 28 total installations by the end of the simulation period. Battery adoption in Scenario 4 mirrors this curve. In Scenario 5, battery and PV adoption are synchronized with EV adoption and thus follow the trajectory in Figure 3.
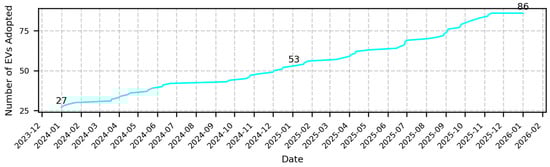
Figure 3.
EV adoption curve from January 2024 to December 2025 across all scenarios.
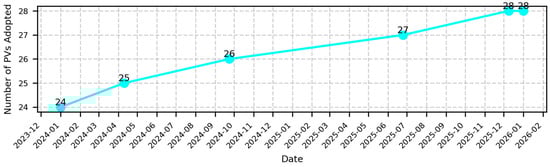
Figure 4.
Independent adoption trajectories for PV and battery systems from January 2024 to December 2025. (PV adoption applies to Scenarios 3 and 4; battery adoption applies only to Scenario 4.).
The base load profiles for all households are derived from historical hourly consumption data from the year 2019, shown as Figure 5. This dataset covers all 160 homes and was selected because 2019 represents a clean baseline year with no DER adoption, ensuring that underlying household demand is not distorted by PV generation or EV charging. These 2019 traces are directly applied as the foundational demand layer in all scenarios for the simulation period 2024 to 2026. Although this approach does not incorporate potential demand growth such as electrified heating, it preserves realistic temporal variability and aggregation effects while allowing the isolated impact of DER adoption to be assessed.

Figure 5.
Aggregated hourly consumption of the 160 consumer consumption data.
Electricity prices used in the simulation are sourced from the Nordic day-ahead market, which is part of the integrated European electricity trading platform. The day-ahead market accounts for over 70% of all electricity transactions in the Nordics. Bids for supply and demand are submitted daily, and the clearing process determines hourly prices for each price area. This study uses hourly spot prices for the DK1 price zone, which includes Western Denmark and is known for its high intraday price volatility due to fluctuating wind generation and cross-border exchanges. Spot price data was retrieved from the ENERGIDATA platform maintained by Energinet [49].
To reflect distribution network-level pricing more accurately, the simulation incorporates Tariff Model 3.0 (TM3), a time-of-use tariff structure proposed by Dansk Energi and anticipated for implementation by 2022 [15]. TM3 introduces differentiated tariffs based on demand peaks and network congestion, providing a stronger economic signal for consumers to adjust their electricity usage patterns. This is especially relevant for modeling price-responsive EV charging behavior.
5. Results
This section evaluates five simulation scenarios representing progressively higher levels of DER integration. Each scenario is analyzed for its impact on transformer loading, overload frequency, and temporal stress patterns to identify key differences in grid performance and the associated benefits and risks of different DER adoption strategies.
5.1. Scenario 1: Baseline—No DER Adoption
Scenario 1 serves as the reference case, modeling the residential grid without any DERs. The load is driven solely by household consumption profiles from 2019. As shown in Figure 6, the total grid load for 2024 and 2025 remains consistently below the transformer’s 400 kVA limit throughout the simulation period. The maximum recorded load is 227.3 kW. Although daily and seasonal variability is present, no overloads are observed. This confirms that the baseline grid operates safely under current consumption level.
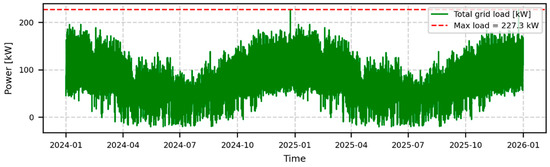
Figure 6.
Aggregated total grid load during 2024 and 2025 under Scenario 1 (no DER adoption).
5.2. Scenario 2: Residential Grid with EV Integration
The introduction of EVs in Scenario 2 results in a notable increase in peak loads, especially during early morning hours when electricity prices are lowest. Figure 7 shows the total grid load rises significantly over time, in line with growing EV penetration. Transformer overloads begin to appear as early as April 2024. Overloads begin to occur as EV adoption rises over time. By the end of 2024, overload duration reaches 18.06 h and increases sharply to 182.22 h in 2025.
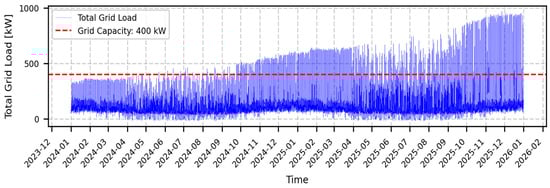
Figure 7.
Aggregated total grid load during 2024 and 2025 under Scenario 2 (EV adoption).
The first transformer overload in Scenario 2 occurred on 20 April 2024, at 03:00, with a peak load of 402.77 kW, as shown in Figure 8. This one-second overload was caused by all 36 adopted EVs initiating charging simultaneously in response to a low electricity price. At this point in the simulation, no PV or battery systems were present, meaning the grid had no alternative sources of generation or storage to mitigate the surge. Most overload events in this scenario occur between 01:00 and 05:00, reflecting the concentration of price-driven EV charging during early morning hours.
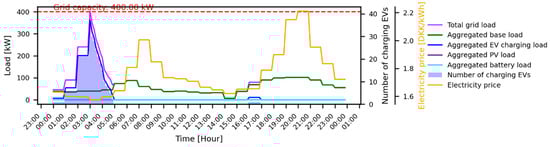
Figure 8.
Grid load profile on 20 April 2024, under Scenario 2.
5.3. Scenario 3: Partial DER Penetration—Independent Adoption of EVs and PVs
Scenario 3 produced overload patterns similar to those observed in Scenario 2. The first transformer overload again occurred on 20 April 2024, at 03:00, reaching a peak load of 402.77 kW, as shown in Figure 9. Although PV systems were added in this scenario, they provided limited mitigation during early morning peak charging periods. PV generation occurs between 07:00 and 18:00, which does not align with the typical EV charging window of 01:00 to 05:00. As a result, PV output had minimal impact on reducing overload risk during critical periods.
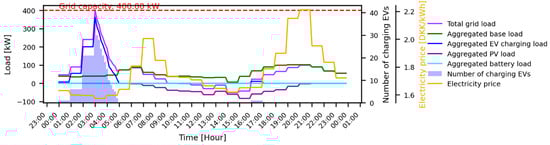
Figure 9.
Grid load profile on 20 April 2024, under Scenario 3.
In the load profile, negative PV load values indicate generation, while positive values represent consumption. Since no batteries were present, any surplus PV generation exceeding household demand was curtailed and could not be stored. These unused energy surpluses appear as negative values in the aggregated grid load. Overload durations were slightly lower than in Scenario 2, totaling 18.06 h in 2024 and 181.71 h in 2025. Despite some mid-day load flattening due to solar output, overall overload risk remained largely unchanged.
5.4. Scenario 4: Incremental DER Coupling—EVs, PVs, and Batteries (Staggered Adoption)
Scenario 4 introduced household battery systems in conjunction with PV adoption. The first transformer overload occurred on 14 June 2024, at 04:00, with a peak load of 420.21 kW, as shown in Figure 10. This represents a delay of nearly two months compared to Scenarios 2 and 3, indicating a modest improvement in grid resilience.
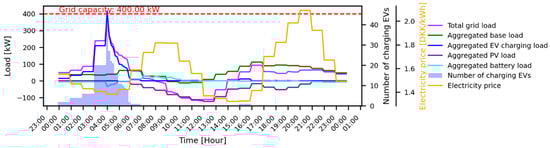
Figure 10.
Grid load profile on 14 June 2024, under Scenario 4.
In this scenario, batteries enable partial load shifting by storing excess PV generation and discharging during periods of high demand. Negative battery load values represent discharging, while positive values indicate charging. However, from 12:00 to 14:00, the aggregated grid load dips below zero due to high PV output, while battery load remains zero. This suggests that batteries reached maximum SoC and could not absorb additional energy, resulting in curtailed PV generation.
Despite these improvements, early morning overloads continued—primarily driven by uncoordinated EV charging among households without storage. Overload durations were reduced to 16.00 h in 2024 and 173.59 h in 2025. Grid profiles showed moderate evening peak reductions for PV-battery households, but the benefits were not sufficient to eliminate transformer stress during critical periods.
5.5. Scenario 5: Fully Coupled DER Integration—Simultaneous EV, PV, and Battery Adoption
Scenario 5 demonstrated the best overall grid performance across all simulation cases. The first transformer overload occurred on 26 July 2024, at 04:00, with a peak load of 406.31 kW, as shown in Figure 11. This represents the latest onset of overload among all scenarios, indicating a significant delay in the emergence of grid stress.

Figure 11.
Grid load profile on 26 July 2024, under Scenario 5.
In this scenario, all EV adopters also install PV systems and batteries, resulting in higher overall DER penetration compared to Scenario 4. The figure illustrates a substantial increase in both PV generation and battery charging activity, reflecting improved energy balancing capabilities. Although the peak PV production period still does not align with peak demand, the increased storage capacity allows surplus solar energy to be stored and later discharged during early-morning EV charging periods.
Overload durations were reduced to 14.33 h in 2024 and 110.90 h in 2025. The higher degree of DER coupling enabled more effective load distribution and a notable reduction in transformer stress. Scenario 5 highlights the benefits of coordinated DER adoption in mitigating overload risk and enhancing temporal load smoothing.
6. Discussion
6.1. Impacts of Integrated DERs on Grid Stability and Evaluation of the Simulation Framework
The simulation results reveal that transformer overloads emerge rapidly once uncoordinated EV charging under RTP is introduced. Independent PV adoption provides limited relief, while adding household batteries postpones overload onset modestly. Only fully integrated EV, PV, and battery adoption significantly enhances grid resilience by reducing total overload hours and delaying the first overload event. These trends are summarized in Table 2, which highlights the progressive benefits of DER coordination.
Table 2.
Summary of DER Configurations, First Overload Events, and Total Overload Hours Across Five Simulation Scenarios.
The results affirm that transformer heating and accelerated aging—rather than feeder-voltage excursions—constitute the first binding constraint under rapid electrification, consistent with rural-feeder case studies from the USA [13]. They also illustrate that DERs must be synchronized, not merely co-located, to exploit their complementary temporal profiles. Furthermore, the zero-net-flow rule enforced at each service point suppresses reverse power flows but sacrifices some PV energy when batteries are filled. A coordinated curtailment-aware dispatch—such as the round-robin or first-come-first-serve schedulers advocated in [40]—could unlock additional headroom without transformer upgrades.
The developed multi-agent-based framework captures household-level decision-making, DER adoption, and grid operation with one-second temporal fidelity, enabling detection of transient overloads often missed in coarser models. Through its modular design, it supports flexible modeling of various network configurations and adoption scenarios, providing DSOs with a practical tool for evaluating localized control and coordination policies. The framework thus bridges behavioral modeling and power-system simulation, offering a unified environment for analyzing the operational and policy implications of high DER penetration.
6.2. Contributions, Limitations and Pathways for Further Research
Previous optimization-centric studies quantified economic savings from smart charging [11,22] or robust micro-grid dispatch [24] but relied on minute-level time-steps and homogeneous agents, obscuring transient stresses. Co-simulation works integrated traffic and power models [12,50] yet lacked endogenous adoption dynamics. The present study advances the state of the art in three respects. Recent multi-agent-based and digital-twin studies have made important progress in capturing DER–grid interactions but typically use 5 min or coarser time-steps [27] and treat adoption as exogenous inputs [12].
First, it couples empirically calibrated logistic adoption curves for three heterogeneous DER types with household-specific RTP response, thereby revealing emergent demand spikes that deterministic uptake models overlook. Second, it monitors transformer loading at 1 s resolution across a full two-year horizon—an order-of-magnitude finer than the 5 min resolution used in digital-twin demonstrations [27]—and thus captures overloads as short as a single duty-cycle of a 22 kW charger. This combination of second-level temporal fidelity and endogenous adoption modeling distinguishes the framework from existing MABS and digital-twin studies, enabling a more realistic quantification of overload risks under unmanaged DER adoption. Third, by incrementally layering DER capabilities the work identifies a storage-penetration threshold beyond which marginal overload reduction accelerates, offering a concrete planning metric that supplements qualitative flexibility taxonomies [1].
Together these advances translate abstract flexibility concepts into quantifiable transformer-life benefits, providing DSOs with a decision-support metric that complements the levelized-cost and self-consumption indicators dominant in past PV-battery analyses [5,7].
Several simplifying assumptions delimit the generality of the findings. Historical 2019 load traces are held static through 2025, omitting upward pressure from electrified heating. DER parameters such as PV efficiency and battery round-trip efficiency were held constant, and effects such as battery aging and inverter degradation were omitted. Behavioral modeling was simplified to reflect perfect price foresight under RTP without capturing variability in user routines or emergency charging. Finally, the analysis focused on a single Danish suburban feeder, which, while representative, may not generalize to urban or meshed networks with different fault-current and congestion characteristics.
Future work will embed stochastic heat-pump loads, adopt battery-degradation-aware V2G control as formulated in [51], and extend the framework to meshed urban feeders where reverse power flows alter fault-current levels. Residential heat-pump electrification is expected to have the strongest impact on overload risk, as it would raise baseline demand and reduce headroom, likely accelerating the onset of transformer stress. Incorporating coordinated fleet-level charging and cross-household V2G strategies could further enhance grid balancing and minimize transformer stress. Validation with high-resolution DSO data and benchmarking against digital-twin models will strengthen confidence in the results. Integrating reinforcement-learning price setters [34] and mobile-storage resilience modules [9] would further enrich the techno-economic design space.
To translate the findings into actionable insights, Table 3 summarizes key recommendations for DSOs and policymakers.
Table 3.
Practical Recommendations for DSOs and Policymakers.
By evidencing that bundled EV–PV–battery incentives can postpone capacity upgrades by multiple years, the study provides actionable guidance for tariff regulators currently debating the roll-out of Denmark’s TM3 distribution tariff [32]. On the scientific front, it demonstrates how agent-based models, long promoted for socio-technical energy research [14], can be upgraded with second-by-second power-system fidelity, creating a sandbox where behavioral economics and transformer physics meet. This bridging of disciplinary scales represents the principal contribution of the work and lays a foundation for investment-grade assessment of DER road-maps aimed at a carbon-neutral, yet secure, residential grid.
7. Conclusions
A two-year, one-second-resolution agent-based simulation of the 160-household Nørre Bjert feeder showed that transformer head-room is ample in the absence of DERs, but is quickly eroded once RTP EV charging is introduced. Uncoordinated RTP shifted demand from the traditional 18:00–20:00 peak to the 01:00–05:00 window, producing the first overload only four months after the study start—consistent with the demand-clustering effect reported in European demand-response trials. Adding stand-alone PVs reduced mid-day imports yet left early-morning stress unchanged. The staggered introduction of household batteries postponed the first overload by roughly two months and shaved 4% of 2025 overload hours, but SoC saturation during solar-rich periods limited their impact. Only the fully synchronized EV–PV–battery pathway deferred the first overload to late July 2024 and cut total overload hours in 2025 by 39% relative to the EV-only case, confirming that storage must accompany generation if RTP is to improve rather than degrade feeder reliability.
The study advances DER research in two dimensions. First, it couples empirically calibrated logistic adoption curves for three heterogeneous DER types with household-specific RTP response, revealing emergent peak clustering that aggregates or hourly models obscure phenomena. Second, it tracks transformer loading at one-second granularity across a multi-year horizon—an order of magnitude finer than digital-twin studies that employ 5–10 min steps. This fidelity exposes sub-minute overloads that drive transformer aging.
The findings underline the risks of incentive structures that promote isolated EV or PV adoption. Bundled programs that tie charger subsidies to minimum on-site storage commitments or dynamic-tariff enrolment can postpone transformer upgrades by several years and reduce curtailment of renewable generation. The results also support the impending Danish Time-of-Use Tariff Model 3.0, but caution that price signals alone are insufficient; they must be combined with co-installation mandates or coordinated charging services to avoid the very congestion they seek to avert.
Three assumptions circumscribe the generality of the conclusions. Household demand is based on 2019 profiles and held constant through 2025, omitting electrified heating growth. DER technical parameters are static, ignoring foreseeable improvements in PV efficiency and battery cost. Finally, EV charging is price-responsive but uncoordinated across households; advanced fleet-level dispatch or V2G strategies are not represented.
Addressing these limitations requires integrating adaptive demand forecasts that capture heat-pump uptake and demographic shifts, embedding battery-degradation-aware V2G control as formulated in recent robustness studies, and extending the framework to meshed urban feeders where reverse power flows alter fault-current levels. Reinforcement-learning price setters and mobile-storage resilience modules should be assessed in combination with tariff reform to map the full techno-economic design space. Linking one-second technical indicators with cost–benefit analysis and asset-life models will convert the overload-hour metric into explicit investment deferral valuations, providing regulators and DSOs with an integrated tool for evidence-based grid-modernization planning.
Author Contributions
Conceptualization, L.C., Z.G.M. and B.N.J.; data curation, L.C.; formal analysis, L.C.; funding acquisition, Z.G.M. and B.N.J.; investigation, L.C.; methodology, L.C., K.C., M.V., Z.G.M. and B.N.J.; project ad-ministration, Z.G.M. and B.N.J.; resources, Z.G.M. and B.N.J.; software, L.C., K.C. and M.V.; supervision, Z.G.M. and B.N.J.; validation, L.C.; visualization, L.C.; writing—original draft preparation, L.C. and Z.G.M.; writing—review and editing, Z.G.M. and B.N.J. All authors have read and agreed to the published version of the manuscript.
Funding
The paper is part of the project “the Danish Participation in IEA ES Task 43—Storage for renewables and flexibility through standardized use of building mass”, funded by EUDP (case number: 134232-510227).
Data Availability Statement
The electricity consumption data utilized in this study is proprietary and cannot be shared. In contrast, the electricity prices data used for the analysis is publicly available and can be accessed through the relevant market data sources.
Conflicts of Interest
The authors declare no conflicts of interest.
Abbreviations
The following abbreviations are used in this manuscript:
| DERs | Distributed Energy Resources |
| EV | Electric Vehicle |
| PV | Photovoltaic |
| RTP | Real-Time Price |
| DSO | Distribution System Operator |
| MABS | Multi-Agent-Based Simulation |
| V2G | Vehicle-to-Grid |
| ToU | Time-of-Use |
| CES | Community Energy-Storage |
| SoC | State of Charge |
| TSO | Transmission System Operator |
| TM3 | Tariff Model 3.0 |
References
- Lund, P.D.; Lindgren, J.; Mikkola, J.; Salpakari, J. Review of energy system flexibility measures to enable high levels of variable renewable electricity. Renew. Sustain. Energy Rev. 2015, 45, 785–807. (In English) [Google Scholar] [CrossRef]
- Papaefthymiou, G.; Dragoon, K. Towards 100% renewable energy systems: Uncapping power system flexibility. Energy Policy 2016, 92, 69–82. [Google Scholar] [CrossRef]
- Clement, K.; Haesen, E.; Driesen, J. The Impact of Charging Plug-in Hybrid Electric Vehicles on the Distribution Grid. In Proceedings of the 2008—4th IEEE BeNeLux Young Researchers Symposium in Electrical Power Engineering, Eindhoven, The Netherlands, 7–8 February 2008. [Google Scholar]
- Raffoul, E.; Li, X. Assessing the Impact of Electric Vehicle Charging on Residential Distribution Grids. In Proceedings of the 2025 IEEE Industry Applications Society Annual Meeting (IAS), Taipei, Taiwan, 15–20 June 2025. [Google Scholar]
- Weniger, J.; Tjaden, T.; Quaschning, V. Sizing of Residential PV Battery Systems. Energy Procedia 2014, 46, 78–87. (In English) [Google Scholar] [CrossRef]
- Smith, O.; Cattell, O.; Farcot, E.; O’Dea, R.D.; Hopcraft, K.I. The effect of renewable energy incorporation on power grid stability and resilience. Sci. Adv. 2022, 8, eabj6734. [Google Scholar] [CrossRef]
- Parra, D.; Norman, S.A.; Walker, G.S.; Gillott, M. Optimum community energy storage system for demand load shifting. Appl. Energy 2016, 174, 130–143. (In English) [Google Scholar] [CrossRef]
- Rafique, S.; Hossain, M.J.; Nizami, M.S.H.; Irshad, U.B.; Mukhopadhyay, S.C. Energy Management Systems for Residential Buildings with Electric Vehicles and Distributed Energy Resources. IEEE Access 2021, 9, 46997–47007. (In English) [Google Scholar] [CrossRef]
- Dugan, J.; Mohagheghi, S.; Kroposki, B. Application of Mobile Energy Storage for Enhancing Power Grid Resilience: A Review. Energies 2021, 14, 6476. (In English) [Google Scholar] [CrossRef]
- Panossian, N.; Muratori, M.; Palmintier, B.; Meintz, A.; Lipman, T.; Moffat, K. Challenges and Opportunities of Integrating Electric Vehicles in Electricity Distribution Systems. Curr. Sustain./Renew. Energy Rep. 2022, 9, 27–40. [Google Scholar] [CrossRef]
- Sundstrom, O.; Binding, C. Flexible Charging Optimization for Electric Vehicles Considering Distribution Grid Constraints. IEEE Trans. Smart Grid 2012, 3, 26–37. (In English) [Google Scholar] [CrossRef]
- Singh, R.S.; Mier, G.; Bosma, T.; Eijgelaar, M.; Bloemhof, G.; Sauba, G. Assessment of EV charging strategies and their effect on residential grids using co-simulation. In Proceedings of the 2022 International Conference on Smart Energy Systems and Technologies (SEST), Eindhoven, The Netherlands, 5–7 September 2022; pp. 1–6. [Google Scholar] [CrossRef]
- Roy, P.; Ilka, R.; He, J.; Liao, Y.; Cramer, A.M.; Mccann, J.; Delay, S.; Coley, S.; Geraghty, M.; Dahal, S. Impact of Electric Vehicle Charging on Power Distribution Systems: A Case Study of the Grid in Western Kentucky. IEEE Access 2023, 11, 49002–49023. (In English) [Google Scholar] [CrossRef]
- Værbak, M.; Ma, Z.; Demazeau, Y.; Jørgensen, B. A generic agent-based framework for modeling business ecosystems: A case study of electric vehicle home charging. Energy Inform. 2021, 4, 28. [Google Scholar] [CrossRef]
- Christensen, K. Multi-Agent Based Simulation Framework for Evaluating Digital Energy Solutions and Adoption Strategies. Ph.D. Thesis, University of Southern Denmark, Odense, Denmark, 2022. [Google Scholar] [CrossRef]
- Li, D.; Zouma, A.; Liao, J.-T.; Yang, H.-T. An energy management strategy with renewable energy and energy storage system for a large electric vehicle charging station. eTransportation 2020, 6, 100076. (In English) [Google Scholar] [CrossRef]
- Lund, H.; Kempton, W. Integration of renewable energy into the transport and electricity sectors through V2G. Energy Policy 2008, 36, 3578–3587. (In English) [Google Scholar] [CrossRef]
- Guille, C.; Gross, G. A conceptual framework for the vehicle-to-grid (V2G) implementation. Energy Policy 2009, 37, 4379–4390. (In English) [Google Scholar] [CrossRef]
- Fachrizal, R.; Lindberg, O.; Kinasih, A.D.S.; Muntean, A.; Widén, J.; Munkhammar, J. Residential building with rooftop solar PV system, battery storage and electric vehicle charging: Environmental impact and energy matching assessments for a multi-family house in a Swedish city. In Proceedings of the 21st Wind & Solar Integration Workshop (WIW 2022), The Hague, The Netherlands, 12–14 October 2022; pp. 565–572. [Google Scholar] [CrossRef]
- Mojumder, M.R.H.; Ahmed Antara, F.; Hasanuzzaman, M.; Alamri, B.; Alsharef, M. Electric Vehicle-to-Grid (V2G) Technologies: Impact on the Power Grid and Battery. Sustainability 2022, 14, 13856. (In English) [Google Scholar] [CrossRef]
- Carere, F.; Gatta, F.M.; Geri, A.; Maccioni, M.; Bragatto, T.; Cresta, M.; Paulucci, M.; Santori, F. Electric Vehicle Charging Rescheduling to Mitigate Local Congestions in the Distribution System. In Proceedings of the 2021 IEEE Madrid PowerTech, Madrid, Spain, 28 June–2 July 2021; pp. 1–6. [Google Scholar] [CrossRef]
- Kiviluoma, J.; Meibom, P. Methodology for modelling plug-in electric vehicles in the power system and cost estimates for a system with either smart or dumb electric vehicles. Energy 2011, 36, 1758–1767. (In English) [Google Scholar] [CrossRef]
- Gils, H.C. Assessment of the theoretical demand response potential in Europe. Energy 2014, 67, 1–18. (In English) [Google Scholar] [CrossRef]
- Shi, R.; Li, S.; Zhang, P.; Lee, K.Y. Integration of renewable energy sources and electric vehicles in V2G network with adjustable robust optimization. Renew. Energy 2020, 153, 1067–1080. (In English) [Google Scholar] [CrossRef]
- Ma, Z.; Christensen, K.; Jørgensen, B.N. Business ecosystem architecture development: A case study of Electric Vehicle home charging. Energy Inform. 2021, 4, 9. [Google Scholar] [CrossRef]
- Brandt, J.; Frost, E.; Ferenz, S.; Tiemann, P.H.; Bensmann, A.; Hanke-Rauschenbach, R.; Nieße, A. Choosing the right model for unified flexibility modeling. Energy Inform. 2022, 5, 10. [Google Scholar] [CrossRef]
- Værbak, M.; Billanes, J.D.; Jørgensen, B.N.; Ma, Z. A Digital Twin Framework for Simulating Distributed Energy Resources in Distribution Grids. Energies 2024, 17, 2503. [Google Scholar] [CrossRef]
- Srivastava, A.; Manas, M.; Dubey, R.K. Electric vehicle integration’s impacts on power quality in distribution network and associated mitigation measures: A review. J. Eng. Appl. Sci. 2023, 70, 32. [Google Scholar] [CrossRef]
- Huang, P.; Lovati, M.; Zhang, X.; Bales, C. A coordinated control to improve performance for a building cluster with energy storage, electric vehicles, and energy sharing considered. Appl. Energy 2020, 268, 114983. (In English) [Google Scholar] [CrossRef]
- Alyami, S. Ensuring Sustainable Grid Stability through Effective EV Charging Management: A Time and Energy-Based Approach. Sustainability 2024, 16, 6149. (In English) [Google Scholar] [CrossRef]
- Needell, Z.; Wei, W.; Trancik, J.E. Strategies for beneficial electric vehicle charging to reduce peak electricity demand and store solar energy. Cell Rep. Phys. Sci. 2023, 4, 101287. (In English) [Google Scholar] [CrossRef]
- Christensen, K.; Ma, Z.; Jørgensen, B.N. Technical, Economic, Social and Regulatory Feasibility Evaluation of Dynamic Distribution Tariff Designs. Energies 2021, 14, 2860. (In English) [Google Scholar] [CrossRef]
- Yang, S.Y.; Woo, J.; Lee, W. Assessing optimized time-of-use pricing for electric vehicle charging in deep vehicle-grid integration system. Energy Econ. 2024, 138, 107852. (In English) [Google Scholar] [CrossRef]
- Zhao, Z.; Lee, C.K.M. Dynamic Pricing for EV Charging Stations: A Deep Reinforcement Learning Approach. IEEE Trans. Transp. Electrif. 2022, 8, 2456–2468. (In English) [Google Scholar] [CrossRef]
- Siano, P. Demand response and smart grids—A survey. Renew. Sustain. Energy Rev. 2014, 30, 461–478. (In English) [Google Scholar] [CrossRef]
- Kebede, A.A.; Kalogiannis, T.; Van Mierlo, J.; Berecibar, M. A comprehensive review of stationary energy storage devices for large scale renewable energy sources grid integration. Renew. Sustain. Energy Rev. 2022, 159, 112213. (In English) [Google Scholar] [CrossRef]
- Reddy, G.H.; Depuru, S.R.; Gope, S.; Narayana, B.V.; Bhukya, M.N. Simultaneous Placement of Multiple Rooftop Solar PV Integrated Electric Vehicle Charging Stations for Reliability Benefits. IEEE Access 2023, 11, 130788–130801. (In English) [Google Scholar] [CrossRef]
- Senthil Kumar, S.; Srinivasan, C.; Sridhar, P. Enhancing grid stability and efficiency in buildings through forecasting and intelligent energy management of distributed energy resources. Electr. Eng. 2024, 106, 7491–7508. (In English) [Google Scholar] [CrossRef]
- Perrig, A.; Szewczyk, R.; Tygar, J.D.; Wen, V.; Culler, D.E. SPINS: Security Protocols for Sensor Networks. Wirel. Netw. 2002, 8, 521–534. (In English) [Google Scholar] [CrossRef]
- Hussain, M.T.; Sulaiman, D.N.B.; Hussain, M.S.; Jabir, M. Optimal Management strategies to solve issues of grid having Electric Vehicles (EV): A review. J. Energy Storage 2021, 33, 102114. (In English) [Google Scholar] [CrossRef]
- Jaworski, J.; Miskiewicz, R.; Miazek, P.; Drozdz, W.; Rzepka, A.; Karnowski, J. Challenges and Solutions for Grid Penetration Caused by EV Charging Stations in Urban Areas. In Proceedings of the International Conference on Business and Technology, Istanbul, Turkey, 1–2 November 2023; Springer: Cham, Switzerland, 2023; pp. 453–462. [Google Scholar]
- Sinha, P.; Paul, K.; Deb, S.; Sachan, S. Comprehensive Review Based on the Impact of Integrating Electric Vehicle and Renewable Energy Sources to the Grid. Energies 2023, 16, 2924. (In English) [Google Scholar] [CrossRef]
- Hu, J.-L.; Bui, N.H.B. The Future Design of Smart Energy Systems with Energy Flexumers: A Constructive Literature Review. Energies 2024, 17, 2039. (In English) [Google Scholar] [CrossRef]
- Khalid, M. Smart grids and renewable energy systems: Perspectives and grid integration challenges. Energy Strategy Rev. 2024, 51, 101299. (In English) [Google Scholar] [CrossRef]
- Thirunavukkarasu, M.; Sawle, Y.; Lala, H. A comprehensive review on optimization of hybrid renewable energy systems using various optimization techniques. Renew. Sustain. Energy Rev. 2023, 176, 113192. (In English) [Google Scholar] [CrossRef]
- Værbak, M. Agent-Based Framework for Simulating Evolution of Distributed Energy Resources in Energy Systems. Ph.D. Thesis, University of Southern Denmark, Odense, Denmark, 2022. [Google Scholar] [CrossRef]
- Rogers, E.M. Diffusion of Innovations, 5th ed.; Free Press: New York, NY, USA, 2003. [Google Scholar]
- The Danish Energy Agency, E. “Solceller-Kapaciteter og Fuldlasttimer,”. Available online: https://ens.dk/sites/ens.dk/files/Hoeringer/2021-08-15_-_af21_-_offentligt_datasaet.xlsx (accessed on 4 July 2022).
- Energinet. Elspot Prices. Available online: https://www.energidataservice.dk/tso-electricity/Elspotprices (accessed on 5 May 2025).
- Mwasilu, F.; Justo, J.J.; Kim, E.-K.; Do, T.D.; Jung, J.-W. Electric vehicles and smart grid interaction: A review on vehicle to grid and renewable energy sources integration. Renew. Sustain. Energy Rev. 2014, 34, 501–516. (In English) [Google Scholar] [CrossRef]
- Uddin, K.; Dubarry, M.; Glick, M.B. The viability of vehicle-to-grid operations from a battery technology and policy perspective. Energy Policy 2018, 113, 342–347. (In English) [Google Scholar] [CrossRef]
Disclaimer/Publisher’s Note: The statements, opinions and data contained in all publications are solely those of the individual author(s) and contributor(s) and not of MDPI and/or the editor(s). MDPI and/or the editor(s) disclaim responsibility for any injury to people or property resulting from any ideas, methods, instructions or products referred to in the content. |
© 2025 by the authors. Licensee MDPI, Basel, Switzerland. This article is an open access article distributed under the terms and conditions of the Creative Commons Attribution (CC BY) license (https://creativecommons.org/licenses/by/4.0/).