Article

Communication Base Station Site Selection Method Based on an Improved Genetic Algorithm

The School of Space Information, Space Engineering University, Beijing 101416, China
*
Author to whom correspondence should be addressed.
Electronics 2025, 14(20), 3977; https://doi.org/10.3390/electronics14203977
Submission received: 4 September 2025 / Revised: 7 October 2025 / Accepted: 7 October 2025 / Published: 10 October 2025
(This article belongs to the Special Issue 5G Technology for Internet of Things Applications)

Abstract

With the large-scale deployment of 5G technology, the rationality of communication base station siting is crucial for network performance, construction costs, and operational efficiency. Traditional site selection methods rely heavily on manual experience, exhibiting strong subjectivity and difficulty in balancing multi-objective optimization. Existing heuristic algorithms suffer from slow convergence speeds and susceptibility to local optima. To address these challenges, this paper constructs a multi-objective base station site selection model that simultaneously minimizes costs, maximizes coverage contributions, and minimizes interference. It achieves quantitative balance among objectives through normalization and weight fusion, while introducing constraints to ensure engineering feasibility. Concurrently, the genetic algorithm underwent targeted optimization by introducing an adaptive migration strategy based on population diversity and a cosine-type parameter adjustment strategy. This approach was integrated with the particle swarm optimization algorithm to balance exploration and exploitation while mitigating premature convergence. Experimental validation demonstrates that the improved algorithm achieves faster convergence and greater stability compared to traditional genetic algorithms and particle swarm optimization, while satisfying engineering constraints such as base station quantity, coverage, and interference. This research provides an efficient and feasible solution for intelligent base station site planning.

1. Introduction

With the large-scale deployment of fifth-generation mobile communication technology (5G) [1,2], metrics such as user experience rate, connection density, and traffic density have all seen dramatic improvements. This presents unprecedented challenges for the planning and construction of wireless access networks. The large-scale deployment of 5G has significantly enhanced network performance, but the research community has already begun looking ahead to 6G networks [3]. 6G is poised to enable unprecedented applications such as immersive holographic communications, ubiquitous intelligence, and the interconnection of all things. This will elevate demands for data rates, latency, connection density, and coverage to unprecedented levels. This evolution presents greater challenges for wireless access network planning and construction, making intelligent and efficient base station siting more critical than ever before. As the foundational infrastructure of wireless networks, the rationality of base station site selection and layout directly determines the overall network performance, construction costs, and long-term operational efficiency. Traditional site selection methods heavily rely on engineer experience, exhibiting strong subjectivity and difficulty in balancing multiple conflicting objectives. They can no longer meet the precision and intelligence demands of modern complex network planning. In complex and dynamic electromagnetic environments, how to rapidly and efficiently complete base station site selection is a critical issue that must be addressed to ensure reliable communications [4].
Base station site selection is a type of coverage problem and is also NP-hard [5]. Constructing efficient algorithms to solve large-scale base station site selection problems holds significant practical importance. Currently, based on different site generation approaches, base station site planning can be categorized into three types: Currently, based on the differing approaches to generating base station locations, base station site selection planning can be categorized into three types: the first is the exact approaches, the second is site selection methods based on heuristic algorithms, and the third is site selection methods based on deep reinforcement learning. All three methods have been studied in the literature [6]. Exhaustive search or global search methods typically yield globally optimal solutions, but the problem with this approach is its inefficiency. To reduce algorithmic complexity, researchers employ heuristic algorithms for solving problems [7], such as genetic algorithms (GA), greedy flame algorithms (GFA) [8], simulated annealing algorithms (SA) [9], particle swarm optimization (PSO) [10], and greedy algorithms [11]. Base station siting primarily considers factors including construction costs, signal coverage, signal strength, and network capacity. Reference [12] considers several factors in the construction of bus systems under practical conditions, constrains transportation demand, sets the planning objective as optimal coverage at minimal economic cost, and employs genetic algorithms to solve this problem. Reference [13] constructs an objective function based on the lowest total cost and a minimum total workload of 90% for base stations. The DBSCAN algorithm is employed to roughly select candidate coordinates for base stations, while the K-Means algorithm refines and further optimizes these candidate coordinates. The simulated annealing method is then used to determine the optimal base station deployment plan that meets the requirements. Reference [14] proposes a DBSCAN clustering algorithm based on immune algorithms and KD-Trees. It transforms the 5G base station site selection problem into a multi-objective problem aiming for maximum coverage area and minimum total construction cost, sets corresponding constraints, and applies immune algorithms for solution. In recent years, deep reinforcement learning has gradually developed, and many scholars have also adopted this method to solve base station site selection problems. Reference [15] models the problem of locating the optimal database station in a backbone-assisted PD-NOMA wireless network as an optimization problem that minimizes uplink transmission delay. To develop a low-complexity algorithm, this problem is formalized as a Markov decision process. A reinforcement learning algorithm based on classical multi-agent deep deterministic policy gradient is proposed, featuring a carefully designed reward function to accelerate convergence. Reference [16] employs feature encoding of network nodes to enable the model to process multiple real-world factors influencing site selection alongside structural information from complex networks. It utilizes two loss functions—feature maximization and feature balance—to control the model’s site selection direction, thereby ranking candidate locations.
Base station site selection is a long-term strategic decision, but the computational complexity of this problem grows exponentially with increasing network scale and optimization objectives. For large-scale practical planning problems, traditional or inefficient algorithms often fail to converge to high-quality solutions within a feasible timeframe, or may become stuck in local optima, resulting in suboptimal network performance. Although heuristic algorithms can efficiently perform global searches and find global optimal solutions through iterative optimization processes, they also suffer from drawbacks such as slow convergence rates and difficulty in parameter tuning. For instance, traditional genetic algorithms employ fixed probabilities for crossover and mutation operations, which may cause the algorithm to become stuck in local optima when tackling complex problems [17]. The evolution in traditional genetic algorithms is blind. Crossover and mutation operations exhibit significant randomness and lack effective directional guidance, necessitating multiple iterations to converge near the optimal solution. Under selection pressure, high-fitness individuals in traditional genetic algorithms are mass-replicated, causing their genes to rapidly spread throughout the population. This leads to excessive genetic similarity among individuals, diminishing the population’s ability to explore other regions of the solution space. Subsequent crossover operations can only occur between similar genes, making it difficult to generate breakthrough new individuals and causing the algorithm to stagnate. Therefore, an efficient algorithm enables network planners to conduct extensive scenario analysis under varying constraints and forecasts, ensuring that long-term site selection strategies are both economically sound and adaptable to future uncertainties.
In summary, this paper’s contributions can be summarized as follows:
Firstly, this paper outlines the site selection issues for communication base stations, considering the varying communication needs of users and constructs a site selection model for communication base stations.
Secondly, this paper introduces a cosine-type adaptive strategy and a migration strategy, integrating them with the particle swarm optimization algorithm to enhance the genetic algorithm. Its effectiveness has been validated through multiple test functions.
Finally, this paper incorporates an improved genetic algorithm into the site selection model for communication base stations, thereby deriving an efficient, economical, and equitable site selection scheme. Through comparison with other algorithms, its superior performance is validated.
The structure of this paper is outlined as follows: Section 1 serves as the introduction to the entire paper. Section 2 introduces issues related to communication base station site selection decisions. Section 3 establishes a site selection model for communication base stations. Section 4 introduces genetic algorithms and our proposed improvement scheme, verifying the performance of the enhanced genetic algorithm. Section 5 presents the application results and comparative experiments of the enhanced genetic algorithm in multi-parameter communication base station site selection problems. Finally, Chapter Six concludes the entire manuscript.

2. Analysis of Issues Related to Communication Base Station Site Selection Decisions

The selection of communication base station sites is not merely a matter of geographic location. When constructing communication base stations, the optimal site layout should be planned based on the actual site environment and service requirements, while considering factors such as coverage, communication capacity, signal quality, and budget constraints [18].

2.1. Principles of Radio Communication

Radio technology transcends temporal and spatial constraints in communication, utilizing radio waves as its primary medium and leveraging frequency properties to transmit and receive signals [19]. Wireless propagation theory describes the propagation patterns of electromagnetic waves from base station transmitters to user receivers, directly determining base station coverage radius, signal attenuation characteristics, and deployment density. It serves as the foundational basis for site selection.

2.1.1. Path Loss Model

Path loss refers to the energy attenuation of electromagnetic waves during propagation through space, caused by energy dispersion and obstruction by obstacles. It must be quantified through mathematical models to determine the maximum coverage distance of base stations. Path loss models vary significantly across different scenarios, directly impacting site selection strategies.
  • Free Space Propagation Model
The free-space propagation model applies to ideal scenarios without obstacles and serves as the fundamental model for path loss calculation. Its formula is represented as follows:
L f s = 32.45 + 20 log 10 ( f ) + 20 log 10 ( d )
Here, L f s represents path loss in dB, d denotes the distance between the base station and the user in km, and f indicates the communication frequency in MHz. It is evident that higher frequencies result in faster loss accumulation with increasing distance, with loss being proportional to the logarithm of distance. Consequently, when deploying base stations in high-frequency bands such as millimeter waves, dense site selection is required; whereas in low-frequency bands, sparse site selection is feasible.
2.
Okumura-Hata Model
The Okumura-Hata model is an extension of the Hata model that incorporates graphical information from the Okumura model. It is primarily used to predict signal loss during radio wave propagation in urban, suburban, and rural environments, with an effective radio frequency range of 150 MHz to 1500 MHz. Building upon the free-space model, this model introduces correction factors such as terrain and building density. It is expressed as follows:
L p = 69.55 + 26.16 lg ( f ) 13.82 lg ( h b ) a ( h m ) + ( 44.9 6.55 lg ( h b ) ) lg ( d )
Here, h b represents the height of the base station antenna, h m denotes the height of the user terminal, both in meters, and a ( h m ) is the user height correction factor. This indicates that in densely populated urban areas with tall buildings, base stations should be deployed closer to users. Conversely, in suburban or rural areas, open terrain can be selected to reduce the number of base stations and lower costs.

2.1.2. Decay Characteristics

During electromagnetic wave propagation, in addition to path loss, “fading” occurs due to reflection, diffraction, and scattering, causing random fluctuations in signal strength. This must be avoided or compensated for during site selection.
1.
Shadow Fading
Caused by large obstructions such as high-rise buildings, mountains, or trees, this phenomenon manifests as a gradual change in signal strength following a log-normal distribution. Therefore, base stations should prioritize locations with unobstructed line-of-sight, avoiding blockage by large structures or mountainous terrain.
2.
Multipath Fading
Caused by the superposition of multipath signals, it manifests as rapid fluctuations in signal strength, following a Rayleigh or Rice distribution. Multipath fading can cause signal amplitude variations of up to 20–30 dB, potentially leading to communication interruptions in severe cases. Therefore, base stations should be avoided in highly reflective environments to minimize the number of multipath signals.
This paper primarily focuses on the macro-level planning of base station deployment. At this planning stage, the dominant factors affecting coverage are large-scale fading phenomena such as path loss and shadowing. Although small-scale fading caused by multipath effects is a critical aspect for link-level performance and quality of service, its impact is highly localized and rapidly varying. Incorporating detailed multipath channel models, such as ray tracing, into large-scale site selection optimization is computationally infeasible.

2.2. Link Budget Theory

Link budget is the accounting of all gains and losses in a communication system, encompassing the transmitter, communication link, propagation environment, and receiver [20]. It is typically used to determine the maximum coverage distance and minimum transmit power for base stations, serving as the primary method for evaluating the coverage capability of wireless communication systems and constituting a critical task in wireless network planning. By examining various factors affecting the propagation paths of downlink and uplink signals within the system, the coverage capability is estimated to determine the maximum allowable propagation loss for the link while maintaining a specified communication quality. The formula is represented as follows:
P r x = P t x + G t x L f s L o t h e r + G r x
Here, P t x represents the transmit power of the base station, G t x denotes the transmit antenna gain, L f s indicates path loss, L o t h e r signifies other losses, G r x stands for the receive antenna gain, and P r x represents the received power.

2.3. Interference Theory

Interference is a core factor affecting communication quality. Base station siting must be based on interference theory to avoid or suppress interference. Interference faced by communication base stations is primarily categorized into three types: co-channel interference, adjacent-channel interference, and spurious interference.

2.3.1. Co-Channel Interference

Co-channel interference is the primary source of disruption. When user equipment receives signals from non-serving base stations operating on the same frequency, these signals combine with the target signal, causing interference. Therefore, during site selection, the locations of surrounding co-channel base stations must be verified, and the minimum separation distance between co-channel base stations must be strictly adhered to, expressed as:
D = 3 N R
Here, N represents the number of base stations, and R denotes the coverage radius of each base station.

2.3.2. Adjacent Channel and Spurious Interference Control

Adjacent channel interference refers to mutual interference caused by wireless signals from adjacent or nearby channels, manifested as leakage power from adjacent channels or sideband components falling within the receiver’s passband. Site selection must avoid areas with direct signal overlap.
Spurious interference arises when poor filtering characteristics of the transmitter’s multiplier stage allow secondary and tertiary harmonic components to be emitted from the transmitter output stage, resulting in spurious radiation signals [21]. Site selection should prioritize locations distant from strong electromagnetic interference sources.

3. Construction of a Site Selection Optimization Model for Communication Base Stations

Coverage objectives and communication quality objectives are two core elements in constructing optimization models for base station site selection decisions [22]. The essence of communication base station site selection is a combinatorial optimization problem under engineering constraints and network performance requirements. It necessitates quantifying site selection objectives, decision variables, and constraints through mathematical models to provide a clear optimization framework for algorithmic solutions. In the site selection decision-making process, the layout and quantity planning of base stations must be fully considered to achieve optimal coverage, ensure basic communication needs, and meet user quality of service requirements [23].

3.1. Core Elements and Decision Variables

Assume there are N pre-screened candidate base station locations, denoted as I = { 1 , 2 , , N } . Candidate locations must satisfy geographical feasibility and obtain latitude and longitude coordinates ( x i , y i ) through field surveys. Assume there are M user density zones, denoted as J = { 1 , 2 , , M } . Each demand point j has coordinates ( a i , b i ) and a weight ω j reflecting the number of users or traffic volume in that area, where ω j > 0 . The Euclidean distance between base station i and demand point j is expressed as:
d i j = ( x i a j ) 2 + ( y i b j ) 2
The distance between base station i and base station l is expressed as:
d i l = ( x i x l ) 2 + ( y i y l ) 2
The base station site selection decision can be represented using binary variables as follows:
x i = 1 Select   candidate   positions 0 Don t   select   candidate   positions ( i I )
The vector form is X = ( x 1 , x 2 , , x N ) { 0 , 1 } N , where { 0 , 1 } N represents a binary space of length N . Each vector X corresponds to a complete base station siting plan.
Therefore, this paper can be viewed as an N -dimensional {0,1} selection problem, and the advanced optimization methods that have emerged in recent years have made it possible to solve it efficiently. For example, reference [24] proposes two activity detection methods under unknown frequency offsets: the Lasso-based method and the sparse constraint method. Both methods are first-order algorithms, suitable for large-scale IoT systems. Reference [25] proposes two algorithms—a greedy-based approach and a penalty-based approach—that jointly optimize the binary unloading mode, CPU frequency, unloading power, unloading time, and IRS phase shift across all devices to minimize total energy consumption. This addresses the challenging non-convex and non-continuous problem. The advantage of these methods lies in avoiding direct high-dimensional searches, enhancing the feasibility of algorithms in large-scale scenarios, and providing valuable insights for future research.

3.2. Multi-Objective Function Design

3.2.1. Cost Minimization

When controlling base station costs, both the construction phase and operational phase must be considered. The economic viability of base station siting can be expressed as:
f 1 ( X ) = i = 1 N x i ( C i + n M i )
Among these, C i represents construction costs, including one-time expenditures such as equipment procurement and construction; M i denotes maintenance costs, encompassing annual expenses like electricity bills, equipment inspections, and labor for operations and maintenance; and n signifies the operational lifespan of the base station.

3.2.2. Coverage Contribution Maximization

Coverage contribution can be quantified as the degree to which a base station satisfies user demand. A demand point is considered covered when it falls within the base station’s coverage radius, with user weights introduced to reflect demand priority.
The coverage status function of a single base station i for a demand point j can be expressed as:
f 1 ( X ) = i = 1 N x i ( C i + n M i )

3.2.3. Interference Minimization

When base stations are positioned too closely together, co-channel interference occurs. The intensity of this interference is inversely proportional to the square of the distance between stations. Interference can be minimized by quantifying interference costs, which can be expressed as:
f 3 ( X ) = k i = 1 N l = i + 1 N x i x l 1 d i l
Here, k represents the interference penalty coefficient. When d i l D min , the interference intensity is negligible.
The interference model in this paper assumes interference-free transmission between links achieved through ideal orthogonal resource allocation. This is equivalent to a system with a frequency multiplexing factor of 1, where the entire network uses a single frequency band and avoids interference through scheduling. This model is suitable for studying the fundamental principles of resource allocation.

3.2.4. Multi-Objective Fusion and Normalization

Due to significant differences in the dimensions and value ranges of the three objective functions, normalization is required before weighted fusion into a single objective function. This paper aims to provide a directly deployable optimization solution for communication base station site selection. The weighted summation method enables network planners to predefine weights α, β, and γ based on actual service priorities—such as prioritizing coverage over cost or vice versa—thereby yielding an optimal solution aligned with specific decision preferences. This approach proves more practical in real-world engineering applications. Each objective undergoes maximum-minimum normalization, mapping its values to the interval [0, 1] to eliminate dimensional effects.
Cost target normalization can be expressed as:
f 1 ( ^ X ) = f 1 ( X ) min f 1 max f 1 min f 1
Coverage target normalization can be expressed as:
f 2 ( ^ X ) = max f 1 f 1 ( X ) max f 2 min f 2
Interference target normalization can be expressed as:
f 3 ( ^ X ) = f 3 ( X ) min f 3 max f 3 min f 3
Among these, max f represents the theoretical maximum value for each objective, while min f denotes the theoretical minimum value.
Weights α, β, and γ are introduced to balance the priorities of the three objectives, satisfying the condition. The final comprehensive cost is:
F ( X ) = α f 1 ( ^ X ) + β f 2 ( ^ X ) + γ f 3 ( ^ X )

3.3. Constraint Conditions

3.3.1. Base Station Quantity Constraint

The base station quantity constraint is the most critical resource limitation. Due to construction budget restrictions, the number of selected base stations cannot exceed the maximum allowable value K , expressed as:
i = 1 N x i < K

3.3.2. Coverage Constraints for Critical Areas

For critical coverage points J , the selected base station must provide coverage; otherwise, the site selection plan is deemed invalid. This can be expressed as:
c j ( X ) = ω j j J

3.3.3. Minimum Distance Constraint Between Base Stations

To prevent co-channel interference between base stations, the distance between any two base stations must not be less than the minimum safe distance D min , expressed as:
d i l D min i , l I , i l

4. Improved Genetic Algorithms

4.1. Genetic Algorithms

Genetic algorithms (GA) are computational models that simulate natural selection in biological evolution and genetic processes to search for optimal solutions [26]. GA exhibits strong global search capabilities and broad applicability, but suffers from slow convergence speeds and potential failure to reach global optima due to premature convergence.

4.2. Improvement Strategies for Genetic Algorithms

4.2.1. Introduction of Adaptive Strategies

In genetic algorithms, the crossover probability and mutation probability significantly influence diversity in the early stages and convergence in the later stages of the algorithm [27]. In the early stages of a genetic algorithm, the population requires greater diversity to explore the solution space. Therefore, higher crossover and mutation probabilities can prevent premature convergence to local optima. As iterations progress and results approach optimal solutions, these probabilities should be gradually reduced to enable more refined searches. The cosine-enhanced adaptive strategy adjusts crossover and mutation probabilities using cosine function characteristics, thereby improving search efficiency and global optimization capabilities. During the early stages of iteration, the cosine function’s rapid value changes enable swift adjustments to the crossover and mutation probabilities, thereby expanding the search scope. In the later stages, the cosine function’s slower value changes stabilize the crossover and mutation probabilities, facilitating the algorithm’s convergence toward the optimal solution. The variation in the crossover probability P c is represented as follows:
P c = P c max + P c min 2 + P c max P c min 2 cos ( f c max f a v g f max f a v g π ) , f c max > f a v g P c max , f c max < f a v g
Here, P c max , P c min represents the upper and lower bounds of the crossover probability, f max denotes the maximum fitness value in the population, f a v g indicates the average fitness value of the population, and f c max signifies the fitness value of the parent with the higher fitness among those participating in the crossover. The variation in the mutation probability P m is represented as follows:
P m = P m max + P m min 2 + P m max + P m min 2 cos ( f m f a v g f max f a v g π ) , f c max > f a v g P m max , f c max < f a v g
Here, P m max , P m min represents the upper and lower bounds of the mutation probability, f max denotes the maximum fitness value in the population, f a v g indicates the average fitness value of the population, and f m signifies the fitness value of the mutated individual.

4.2.2. Hybrid Particle Swarm Optimization

Particle Swarm Optimization (PSO) is a swarm intelligence optimization algorithm proposed by Kennedy and Eberhart in 1995 [28,29]. The Particle Swarm Optimization (PSO) algorithm draws inspiration from the foraging behavior of flocks of birds in nature. Similar to genetic algorithms, it starts from random solutions and iteratively searches for optimal solutions, evaluating solution quality through fitness. However, this algorithm does not employ crossover or mutation operations. Instead, it explores optimal solutions through collaboration and information-sharing mechanisms among individuals within the swarm. Genetic algorithms possess strong global search capabilities but converge relatively slowly. In contrast, particle swarm optimization achieves rapid convergence through information sharing among individuals, yet it is prone to local optima and highly sensitive to initial parameter settings. Combining these two algorithms enables complementary advantages. In this strategy, the genetic algorithm provides global search capability in the early stages, helping the algorithm escape local optima. The particle swarm algorithm then leverages its rapid convergence advantage in the later stages, accelerating the algorithm’s progression toward the optimal solution.

4.2.3. Introduction of Migration Strategy

In the later stages of the algorithm, as it increasingly converges toward the most adaptable individuals, population diversity diminishes and group structures become increasingly similar. Consequently, search efficiency declines, and the algorithm becomes prone to local optima, leading to premature convergence. The migration strategy is a mechanism that enriches population diversity and enhances the algorithm’s adaptability to environmental changes by introducing individuals from external populations. Its core principle involves periodically injecting new random individuals into the current population during algorithm iterations, or selecting high-quality individuals from external archives, while simultaneously eliminating some low-fitness individuals. This prevents the population from losing its ability to explore new solutions due to excessive convergence.
Adaptive migration frequency is a mechanism that dynamically adjusts the timing of migration strategy execution. It automatically determines whether to execute the migration strategy based on the current diversity state of the population, rather than at fixed intervals. When population diversity is too low, increase migration frequency; when diversity is sufficient, reduce or suspend migration. This achieves a balance between “maintaining diversity” and “ensuring convergence efficiency.” As population diversity decreases, individual fitness values within the group become more similar, meaning the population’s fitness variance diminishes. This can be expressed as:
D = i = 1 N | f i f ¯ |
Here, f i represents the fitness value of the i-th individual in the population, N denotes the average fitness value of the population, and D indicates the total number of individuals in the population. When the fitness value falls below a certain threshold, the population is deemed to have insufficient diversity, triggering the implementation of a migration strategy. The adaptive threshold d is set according to the following principle: After algorithm initialization, calculate the initial population’s fitness variance D i n i t . The threshold is set to d = 0.1 × D i n i t , meaning that when population diversity drops to 10% of its initial level, the migration strategy is triggered. This ratio was determined through preliminary experiments on a small number of problems of varying scales, ensuring it maintains population diversity without causing excessive disruption to the algorithm. A rate that is too low delays migration, leading to insufficient diversity, while a rate that is too high triggers migration too frequently, undermining convergence stability.

4.3. Algorithm Flow

The algorithm flow for the improved genetic algorithm primarily consists of three steps: initialization, iterative optimization, and result output. The flowchart is shown in Figure 1.

4.3.1. Initialization

1.
Parameter Initialization
Before the algorithm begins, relevant parameters are adjusted to determine the configuration settings, such as the number of base stations, the number of user demand points, the population size, and the number of iterations.
2.
Population Initialization
The initial population is constructed using binary encoding, where each chromosome is a binary array of length N . The value x i = 1 indicates the selection of the i-th candidate base station, while x i = 0 indicates non-selection. The generation process must satisfy dual constraints: the total number of base stations and the coverage of key users.
3.
Optimizing Variable Initialization
To prepare for subsequent particle swarm fusion and optimal solution tracking, three core variables must be initialized: particle velocity v , individual optimal solution p b e s t , and global optimal solution g b e s t .

4.3.2. Iterative Optimization

1.
Selection Operation
A tournament selection strategy is employed to screen the parent generation, avoiding the issue of high-quality individuals monopolizing the next generation in roulette selection. First, determine the number of individuals to select per round. Randomly select individuals from the population with equal probability to form a group. Based on each individual’s fitness value, choose the highest-fitness individual to enter the offspring population [30]. Repeat this process to form a new population. Identify the most frequently appearing individual within the new population; this individual is deemed the optimal individual.
2.
Cross-Operations
Adjust the crossover probability based on Formula (18). Employ single-point crossover, where parent individuals are paired in pairs, and the crossover point k ( 1 k N ) is randomly selected. Exchange the gene segments at the crossover point to generate two offspring individuals. Repeat until crossover operations are completed for all parent individuals.
3.
Mutation Operation
The mutation operation integrates the velocity update mechanism from particle swarm optimization to enhance the algorithm’s global search capability and prevent becoming stuck in local optima. The mutation probability is adjusted based on the calculation in Formula (18). By combining the optimality of individuals with global optimality to guide the mutation direction, the particle velocity is updated using the following formula:
v n e w = ω v o l d + c 1 r a n d ( ) ( p b e s t x ) + c 2 r a n d ( ) ( g b e s t x )
Here, ω represents the inertia weight, r a n d ( ) denotes a random number between [0, 1], and x signifies the current individual’s chromosome.
Adjust mutation probability based on velocity vectors to flip genes, where higher absolute velocity values correspond to increased mutation probability. After mutation, verify constraints: if the number of base stations exceeds K , prioritize removing stations with the lowest coverage contribution; if critical users remain uncovered, supplement by selecting stations capable of covering them, ensuring the feasibility of the offspring solution.
4.
Population Renewal and Migration Strategy
To balance the inheritance of high-quality parental genes with offspring evolution, a probability p is applied to retain parental individuals, with the remaining positions filled by offspring to form the new generation. This prevents the loss of valuable genetic material that would occur with complete replacement. When population diversity falls below a threshold, 10 new viable solutions are generated and replace the 10 least fit individuals in the current population. This injects new genetic diversity and prevents premature convergence of the algorithm. The generation of new solutions employs a random generation method with the same constraints as the initial population. First, a candidate site set satisfying the maximum base station quantity constraint is randomly selected. Then, the set is checked for coverage of all key users. If coverage is incomplete, sites capable of covering the unserved key users are added with priority, while other sites are randomly removed to maintain the quantity constraint. This method ensures that new solutions are both random and feasible.
5.
Optimal Solution Update
Calculate the fitness of each individual in the new generation and update both the individual optimal and global optimal solutions. If an individual’s current fitness is lower than that of p b e s t , update p b e s t to the current individual. If any individual in the population has a fitness lower than that of g b e s t , update g b e s t to that individual, ensuring g b e s t remains the optimal solution throughout the iteration.

4.3.3. Result Output

Determine whether the maximum iteration count has been reached. If not, proceed to the next generation iteration; if reached, terminate the iteration and output the results. After iteration termination, output the algorithm’s optimization results, including quantitative metrics and visualizations, to provide decision support for actual base station site selection.

4.4. Algorithm Performance Testing

Test functions are fundamental problems in optimization algorithm research, serving to evaluate an algorithm’s performance across various metrics [31]. The CEC function set is primarily used to test and compare the performance of different evolutionary algorithms, including convergence speed, optimization capability, escape from local optima, and exploration ability. It is widely employed to assess the effectiveness of evolutionary algorithms, genetic algorithms, and other optimization algorithms.
To validate the effectiveness and performance of the proposed improved genetic algorithm, three commonly used sets of functions were selected for experimental testing. The three sets of test functions are shown in Table 1.
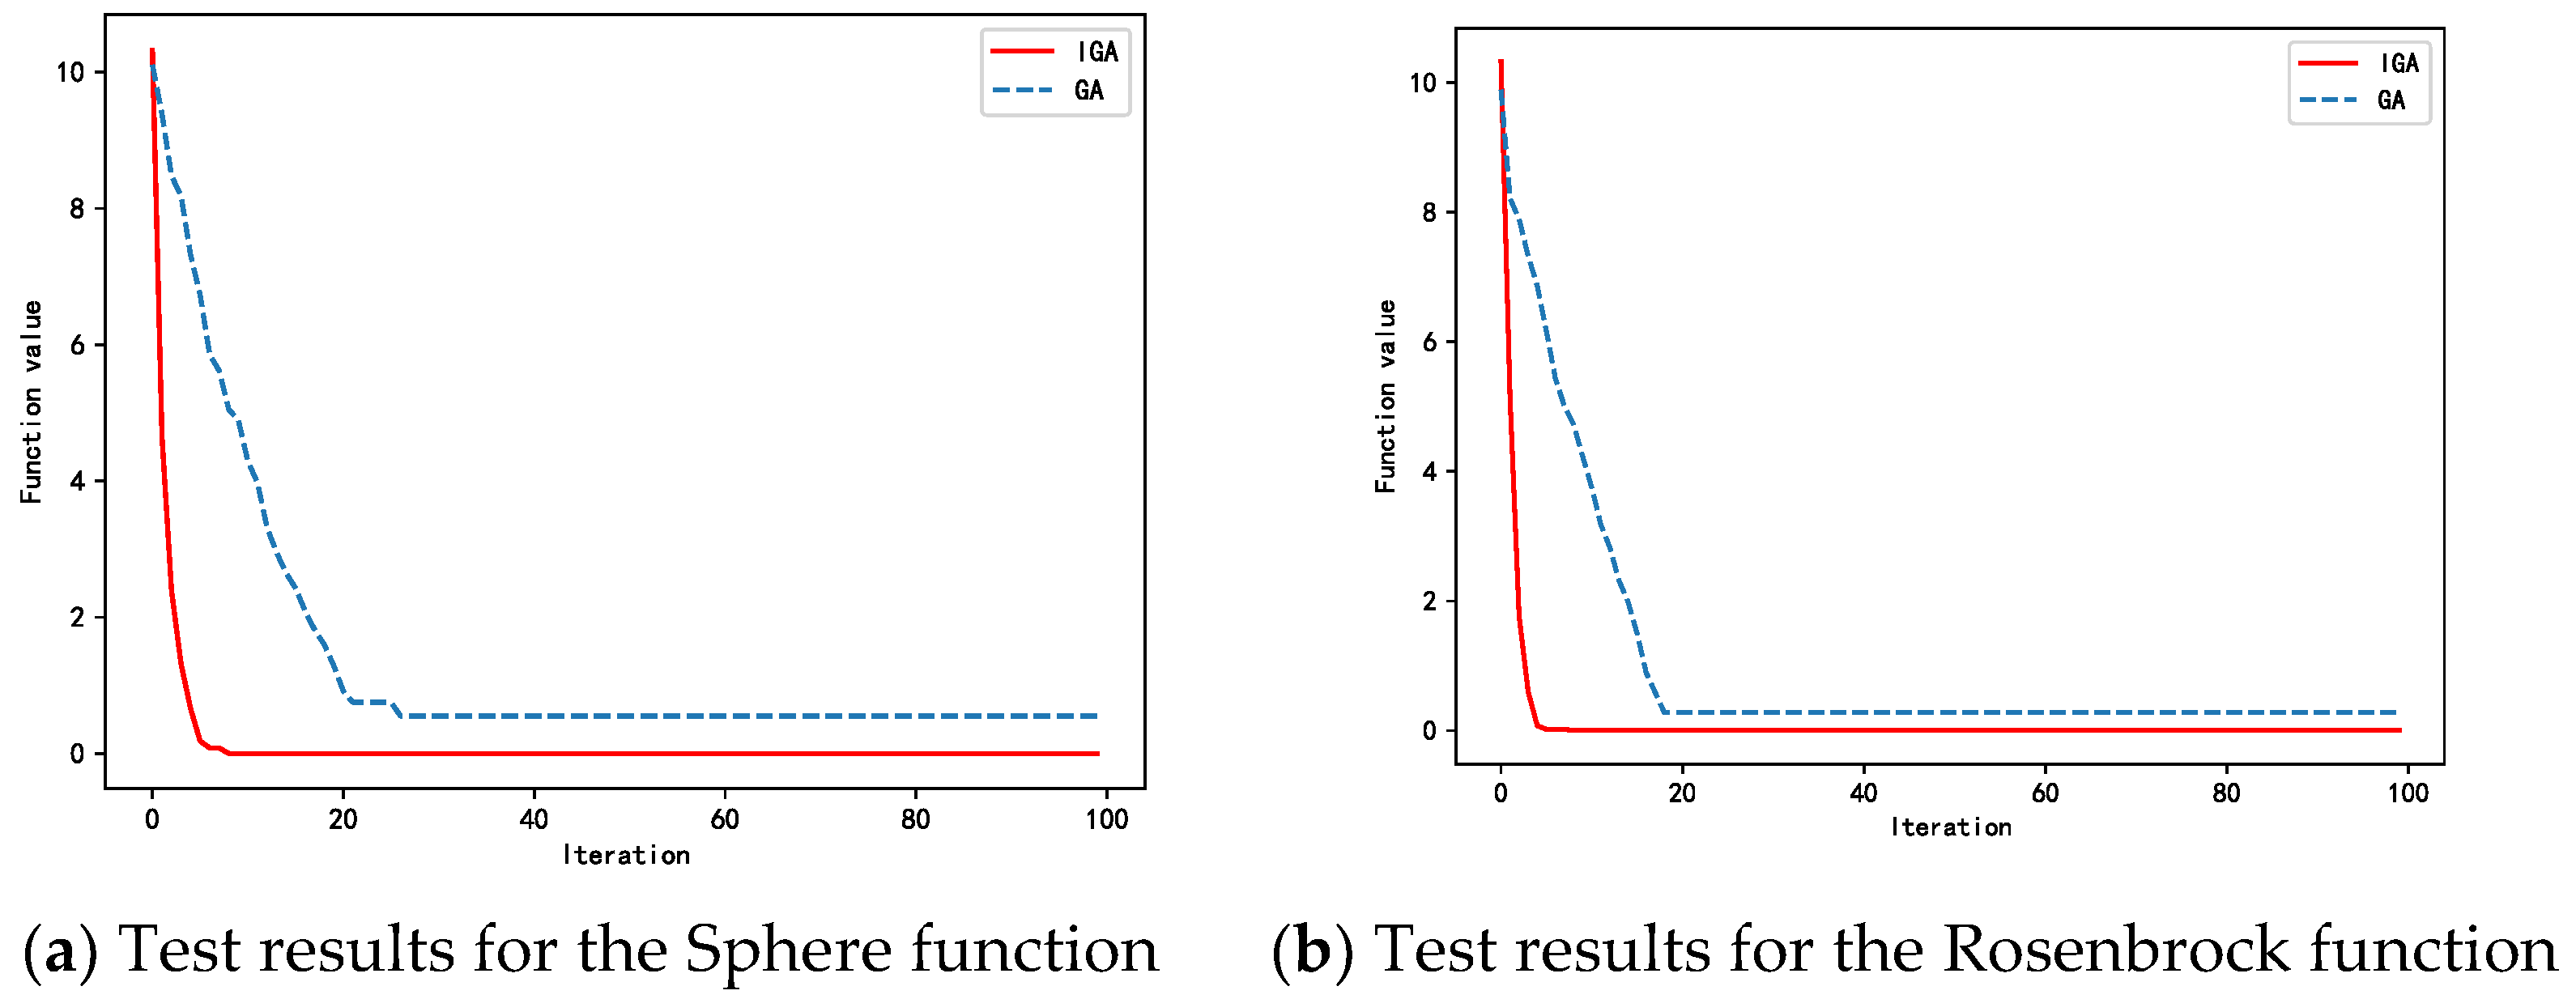
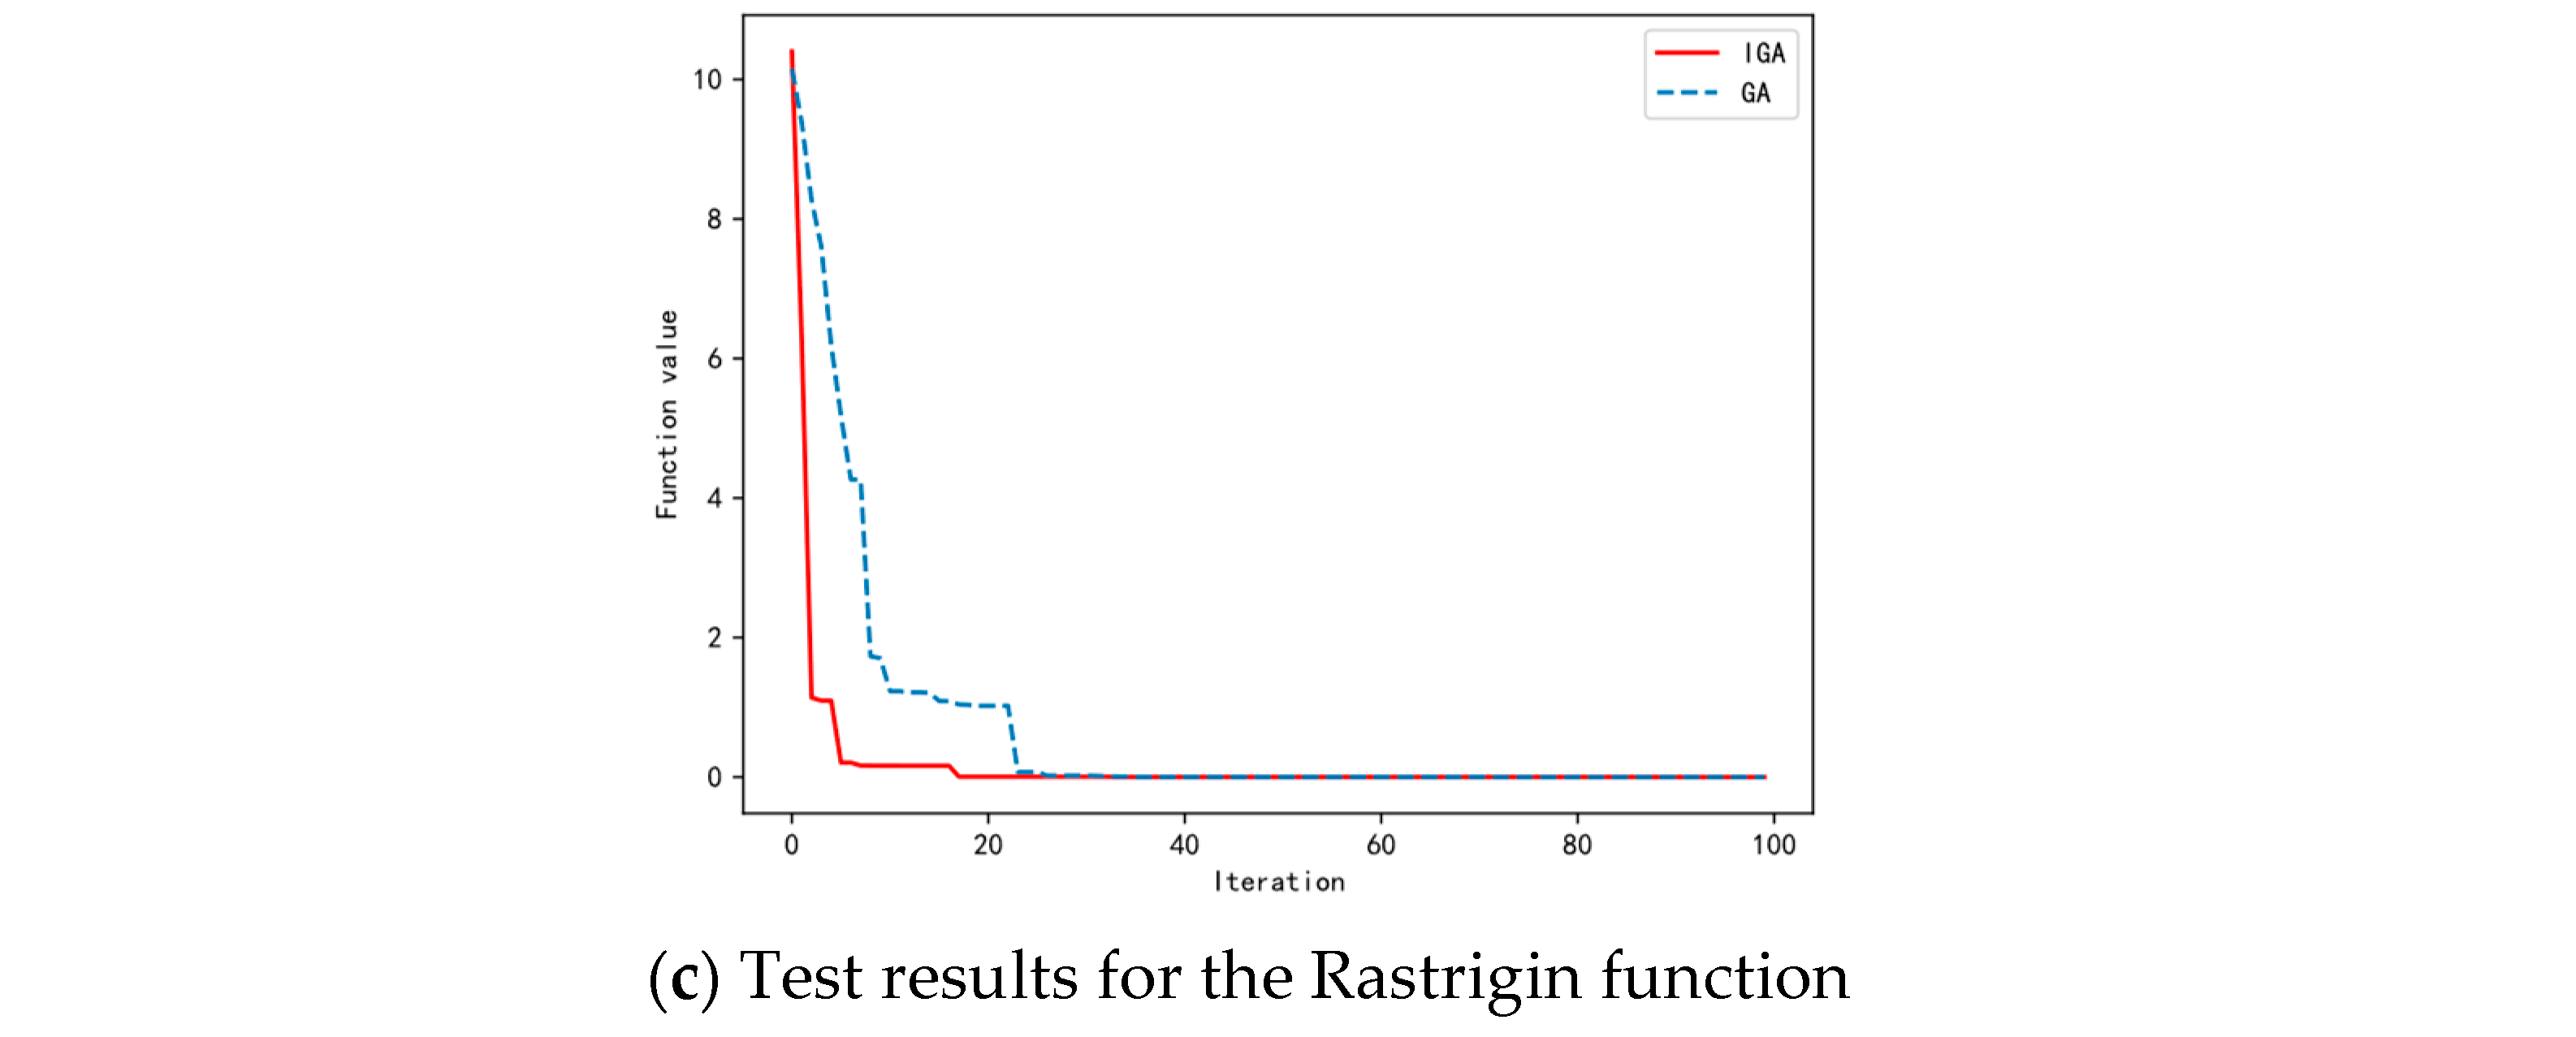
Among these, the Sphere function possesses only one global optimum solution. The global minimum of the Rastigin function is located at the far point (0,0), surrounded by numerous local minima. The Rosenbrock function features multiple local minima in addition to its global minimum point. The three function sets were tested using an improved genetic algorithm and compared with the standard genetic algorithm. The results are shown in Figure 2.

5. Experimental Results and Analysis

5.1. Experimental Setup

5.1.1. Experimental Environment and Tools

The experimental environment is as follows: A PC equipped with an Intel® Core™ i7-13620H 2.40 GHz CPU and 16 GB of memory, running the Windows 11 64-bit operating system. Algorithms were programmed in Python using PyCharm2021.3.2 Community Edition.

5.1.2. Experimental Parameters

Experimental parameters are shown in Table 2.

5.2. Experimental Simulation

5.2.1. Feasibility Verification

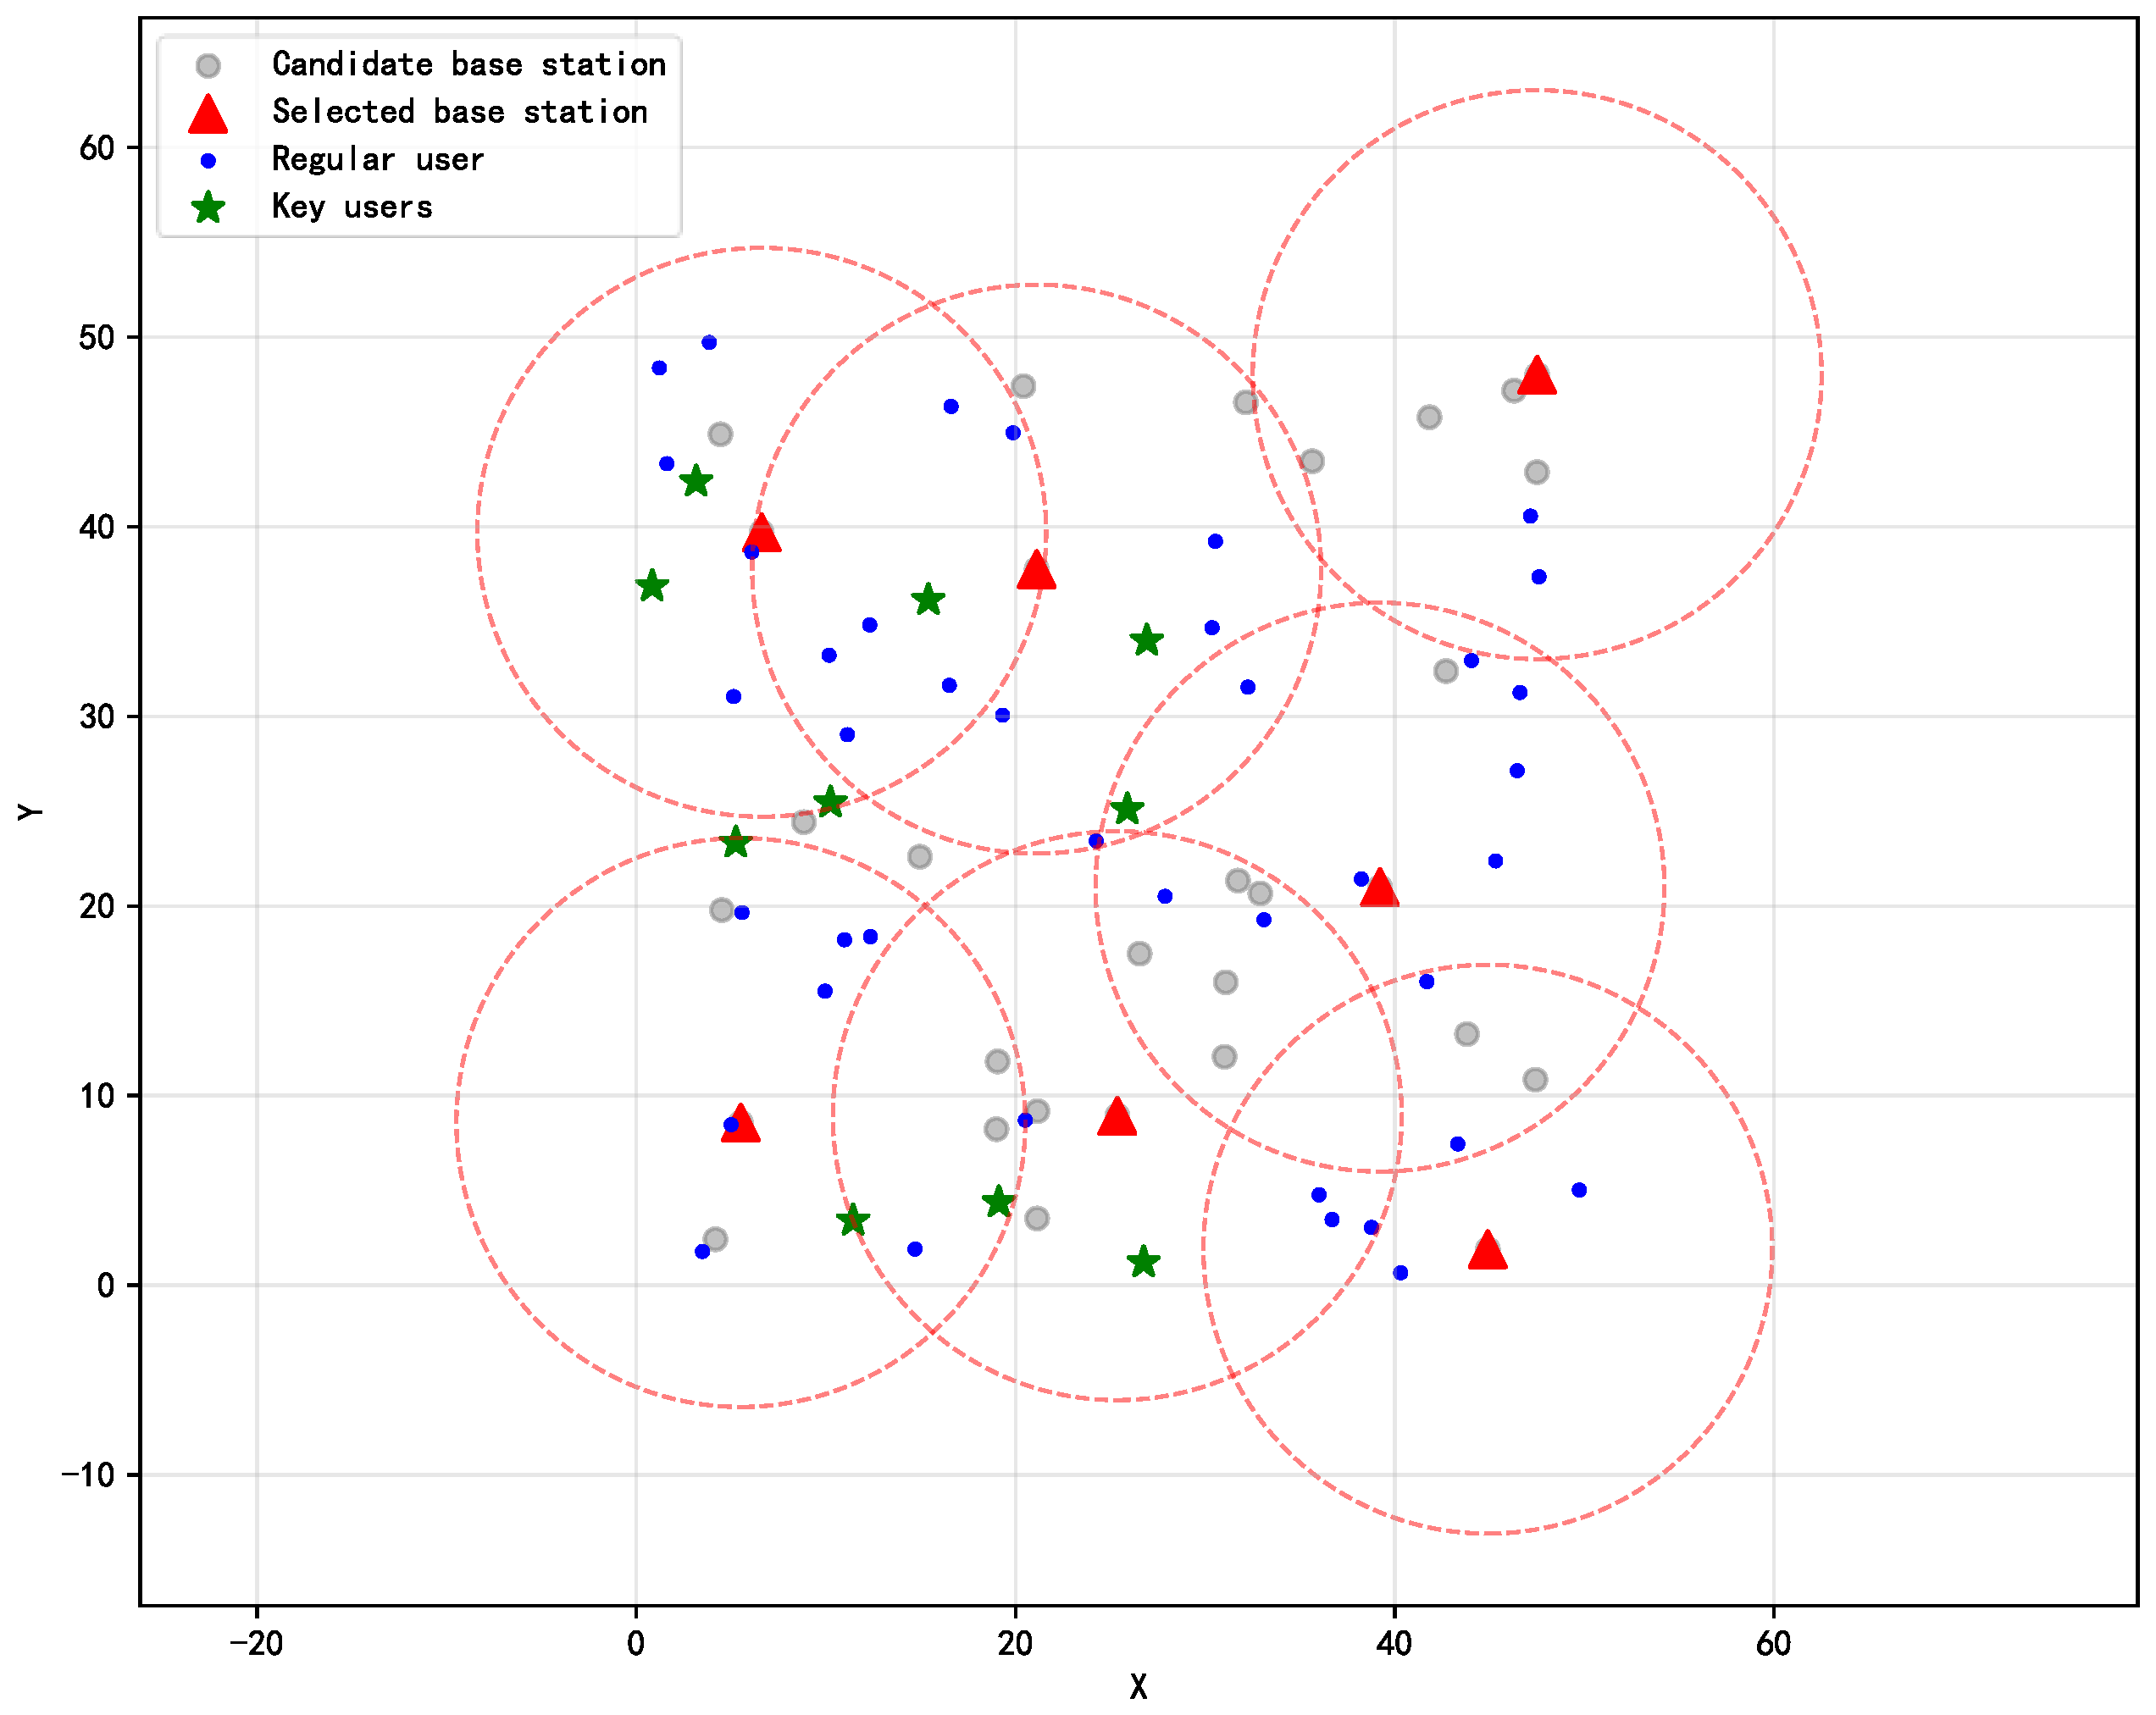
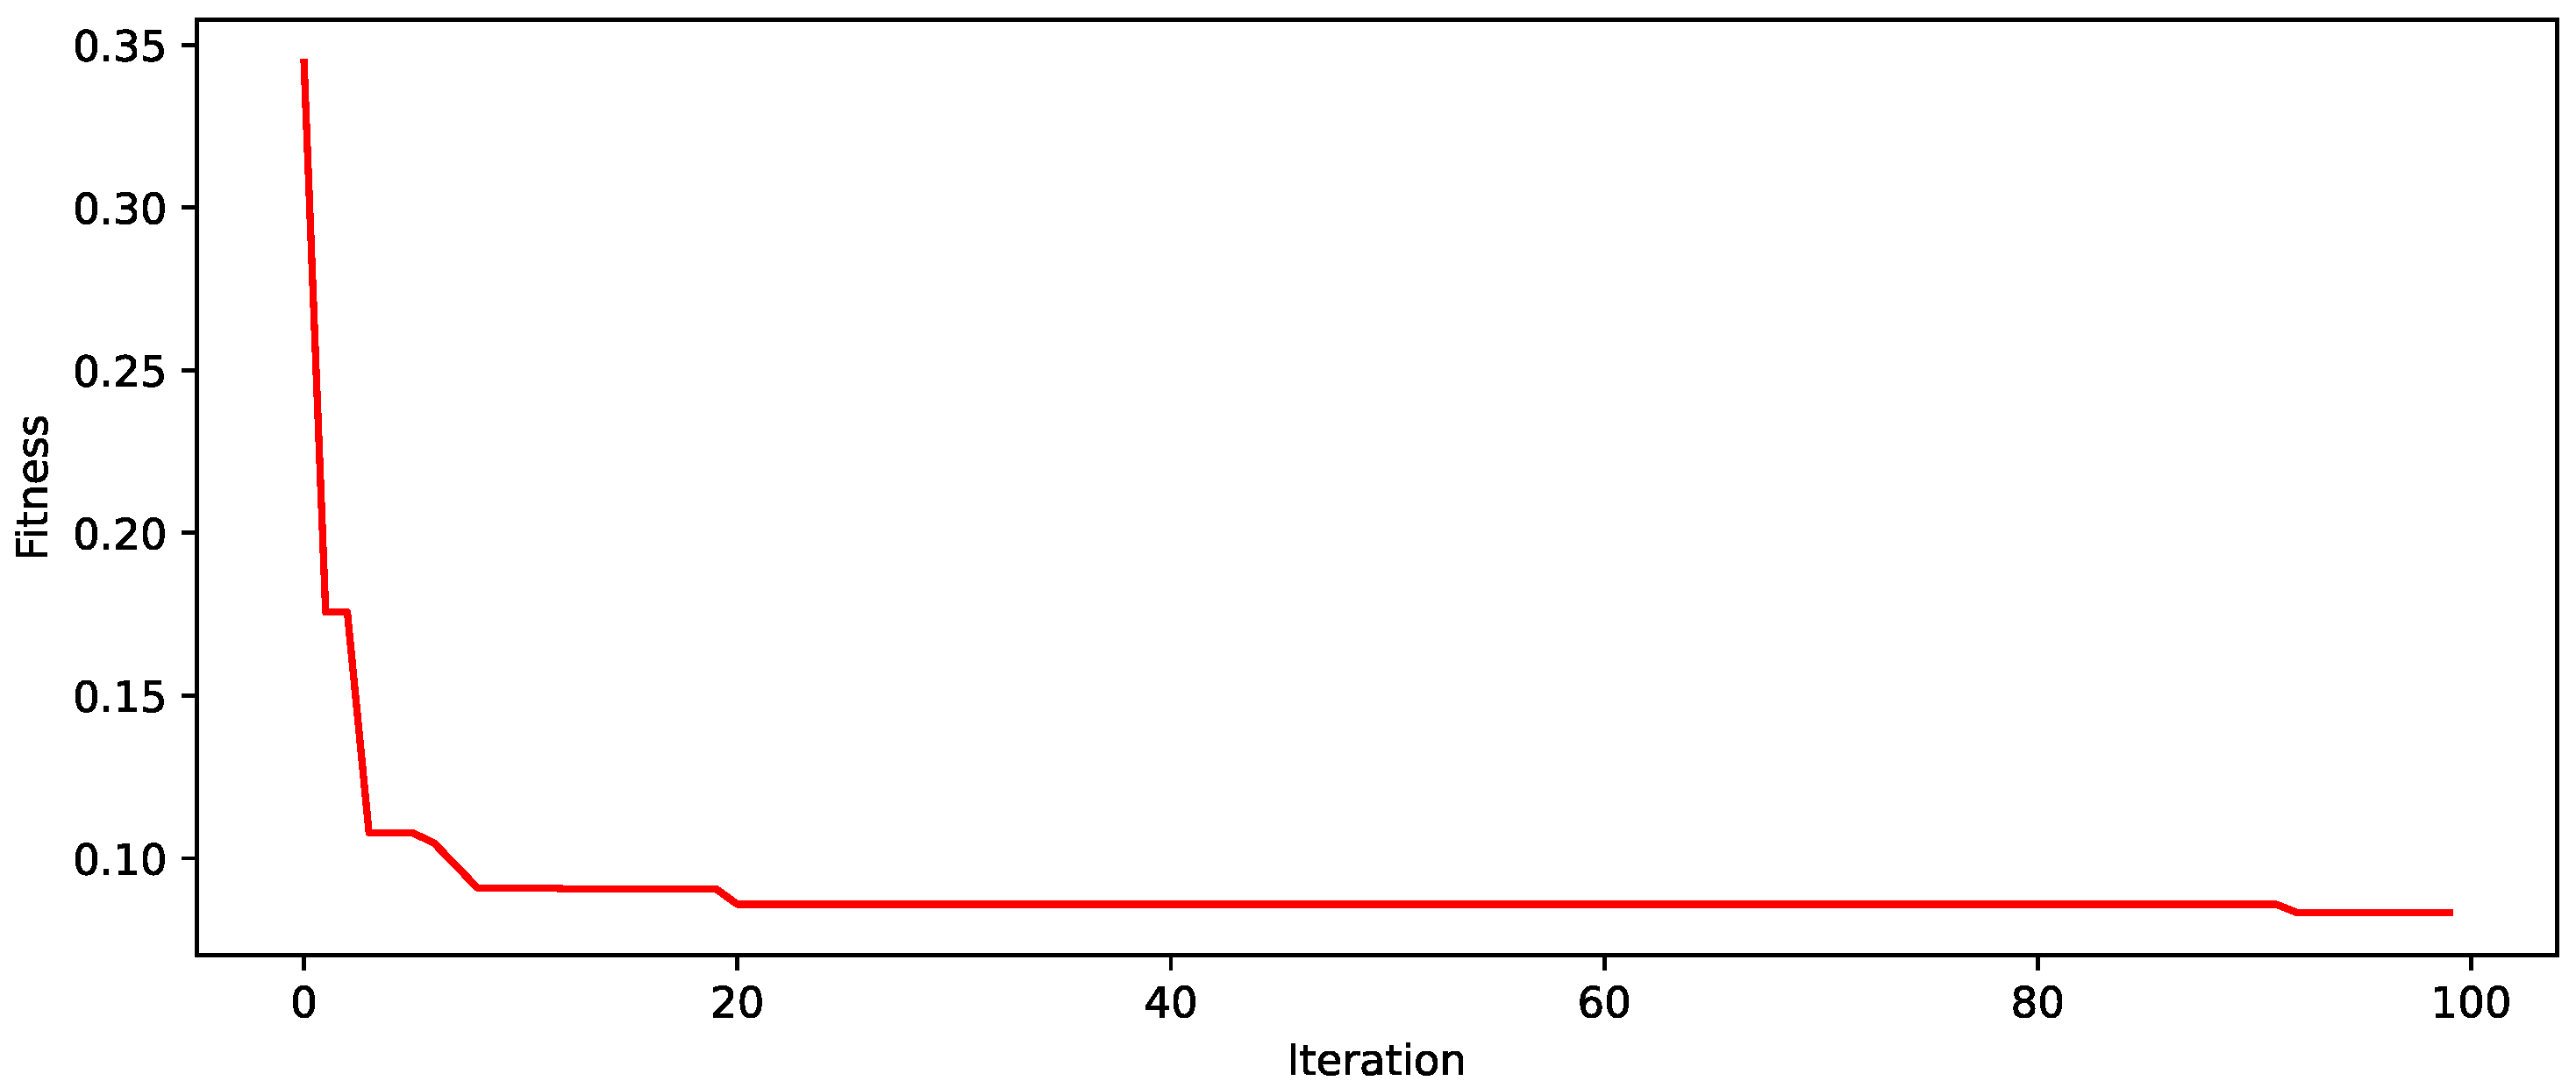
The improved genetic algorithm was employed to address the site selection problem for communication base stations. The resulting site selection outcomes and fitness curves are illustrated in Figure 3 and Figure 4.
As shown in Figure 3, the number of selected base stations is 7, achieving full coverage for key users. As shown in Figure 4, the fitness value stabilizes at the 13th generation, with the optimal fitness value reaching 0.0832. The total construction cost for this site selection plan is 6.2568 million yuan, and the total coverage contribution is 145.51.

5.2.2. Effectiveness Validation

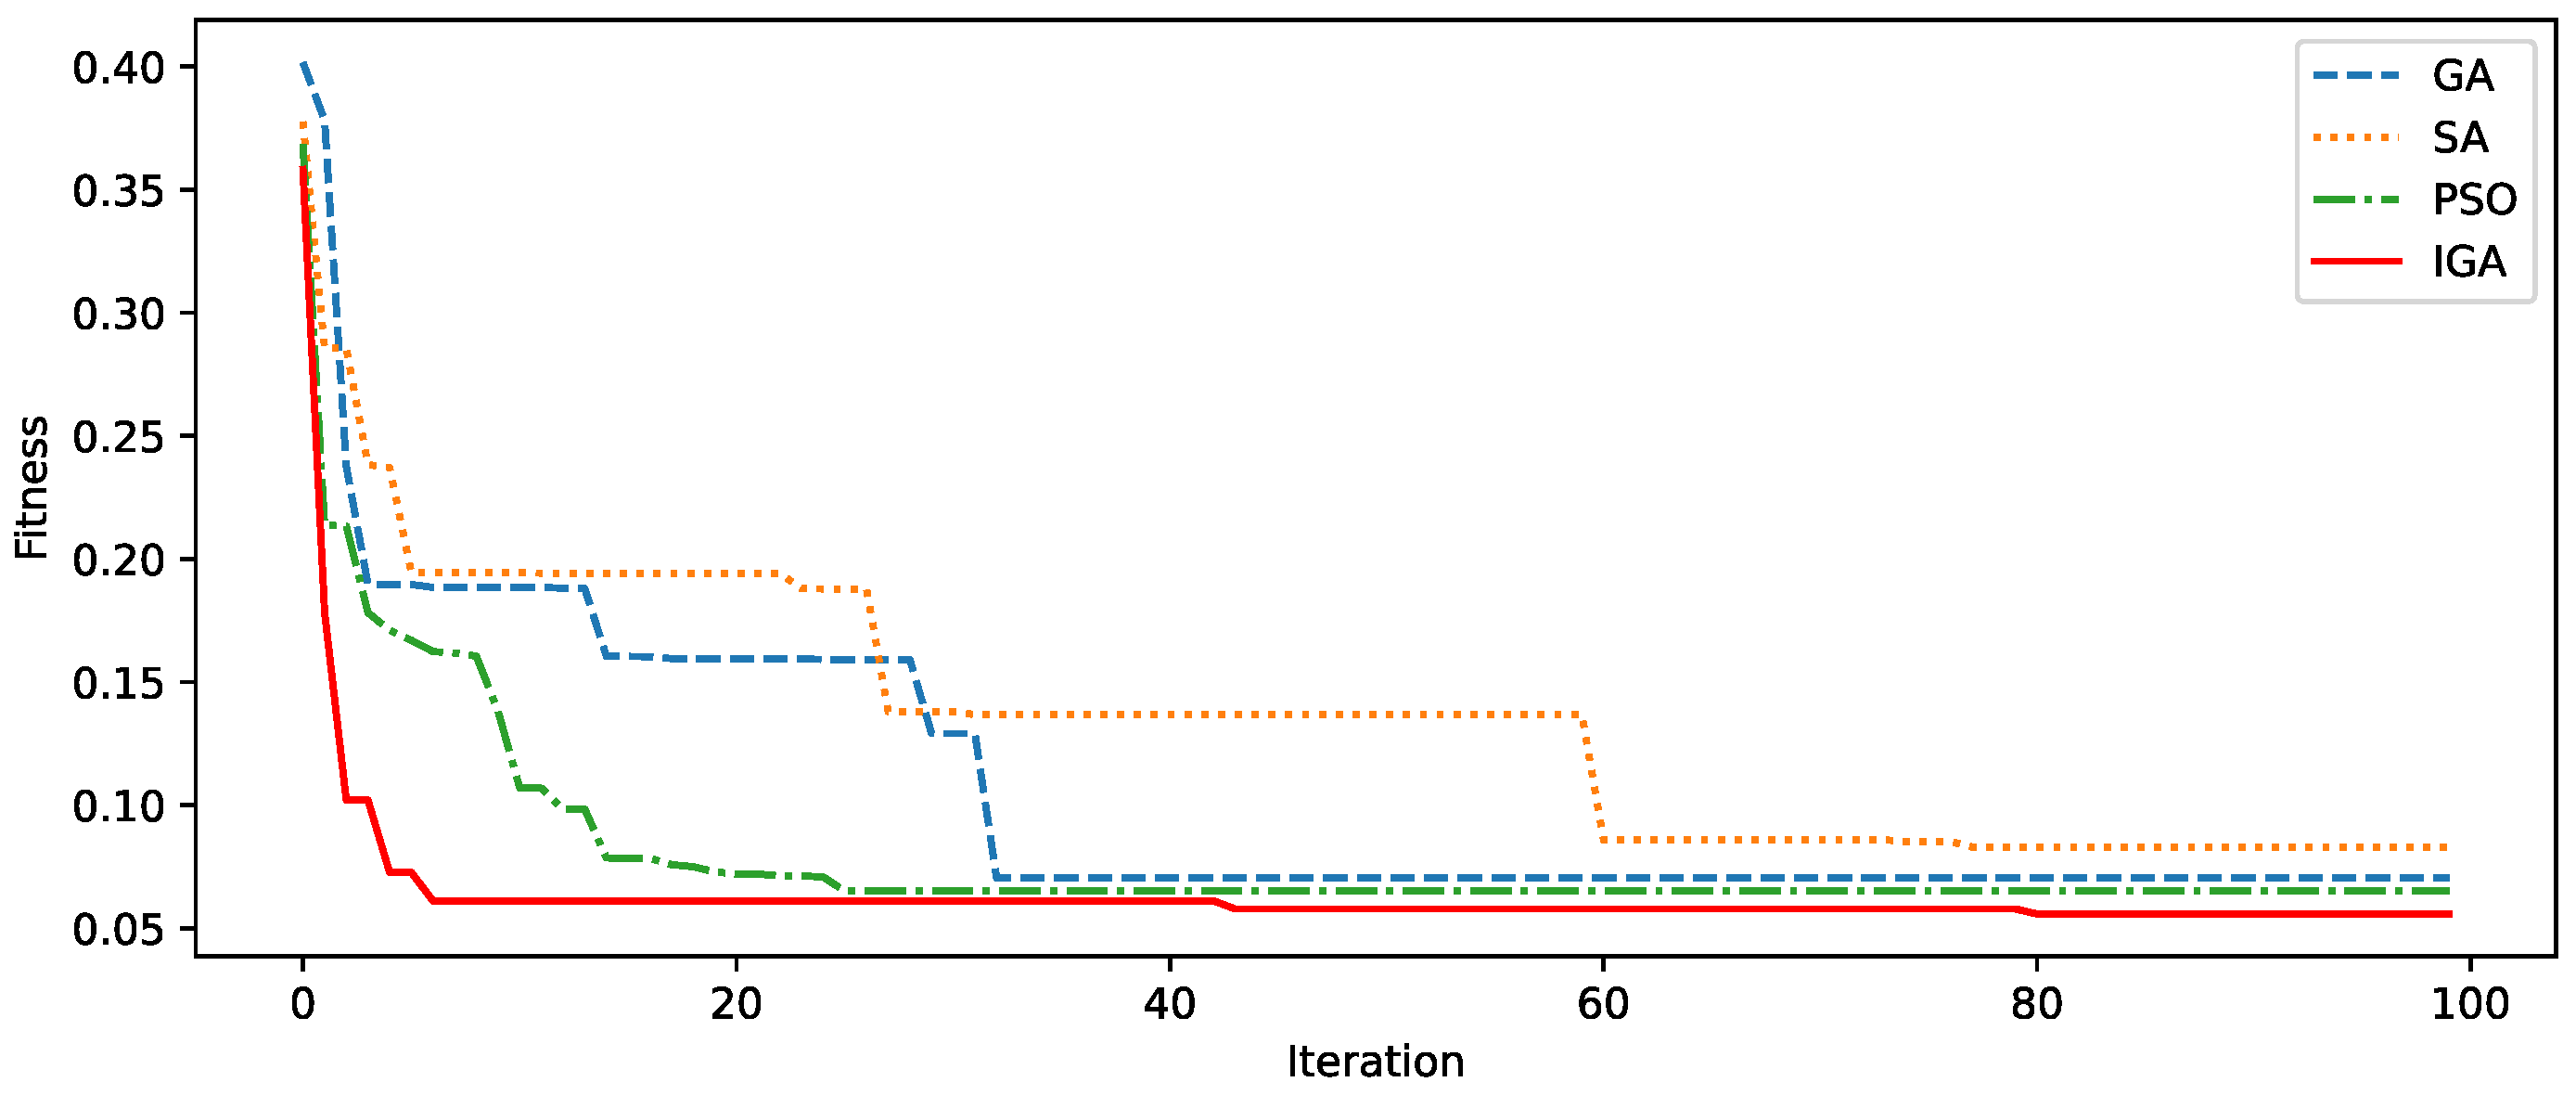
To validate the effectiveness of the improved genetic algorithm, comparative experiments were conducted using genetic algorithms, particle swarm optimization, and simulated annealing algorithm on identical maps. The parameters for each algorithm are shown in Table 3.
Due to the random nature of evolutionary algorithms during initialization, individual experimental results may exhibit randomness [32]. Therefore, to better compare the changes in fitness values during the iteration process of each algorithm, 10 experiments were conducted. The best fitness value from each experiment was recorded, and the results of the 10 experiments for each algorithm were averaged. The resulting fitness convergence curves are shown in Figure 4.
As shown in Figure 5, the comparison of algorithm convergence curves clearly reveals that different intelligent optimization algorithms exhibit distinct convergence characteristics and optimization capabilities when solving this problem. Although GA demonstrated a certain optimization speed during the initial iterations with a rapid decline in fitness, its subsequent convergence process gradually slowed down. The overall convergence accuracy was limited, with the final fitness value reaching 0.0703. SA exhibits a relatively stable convergence process. However, its convergence rate is relatively slow, and its optimization efficiency in the early stages of iteration is significantly lower than that of other algorithms. The final fitness value is 0.0830. PSO converged faster than GA and SA, but tended to become stuck in local optima during later iterations, making it difficult to further improve solution quality. The final fitness value was 0.0651. In contrast, IGA demonstrated significantly superior convergence performance. IGA rapidly reduced the fitness value during the early iterations, exhibiting fast optimization speed. As iterations progressed, it maintained a stable and efficient convergence trend, ultimately converging to a lower fitness value of 0.0558. This indicates that IGA not only possesses strong global search capabilities, enabling rapid convergence toward the optimal solution region, but also excels in local refinement search. It can perform more precise searches near the optimal solution, thereby obtaining higher-precision solutions.
The average values of coverage contribution, construction cost, and interference cost for each algorithm across 10 experiments are shown in Table 4.
As shown in Table 4, the improved algorithm demonstrates significant advantages in optimizing base station site selection. In terms of coverage efficiency, the improved algorithm achieved a value of 147.264, slightly higher than the genetic algorithm’s 147.176 and substantially higher than the simulated annealing algorithm’s 146.635 and the particle swarm optimization algorithm’s 143.942. This indicates that the improved algorithm can more efficiently meet user coverage requirements. Regarding construction costs, the improved algorithm incurred costs of 674.03, lower than the genetic algorithm’s 703.965, the simulated annealing algorithm’s 742.69, and the particle swarm optimization algorithm’s 996.778, demonstrating its superior capability in cost control. Regarding interference cost, all algorithms recorded a value of 0, indicating effective avoidance of inter-base station interference issues. In terms of selected base station count, both the improved algorithm and the genetic algorithm selected 6 stations, fewer than the 7 selected by the simulated annealing algorithm and the 8 selected by the particle swarm optimization algorithm. This signifies that the improved algorithm achieves superior coverage performance and cost control with fewer base station resources.
In summary, when addressing this problem, the improved genetic algorithm demonstrates significant advantages in both convergence speed and convergence accuracy, making it more suitable for solving such optimization problems.
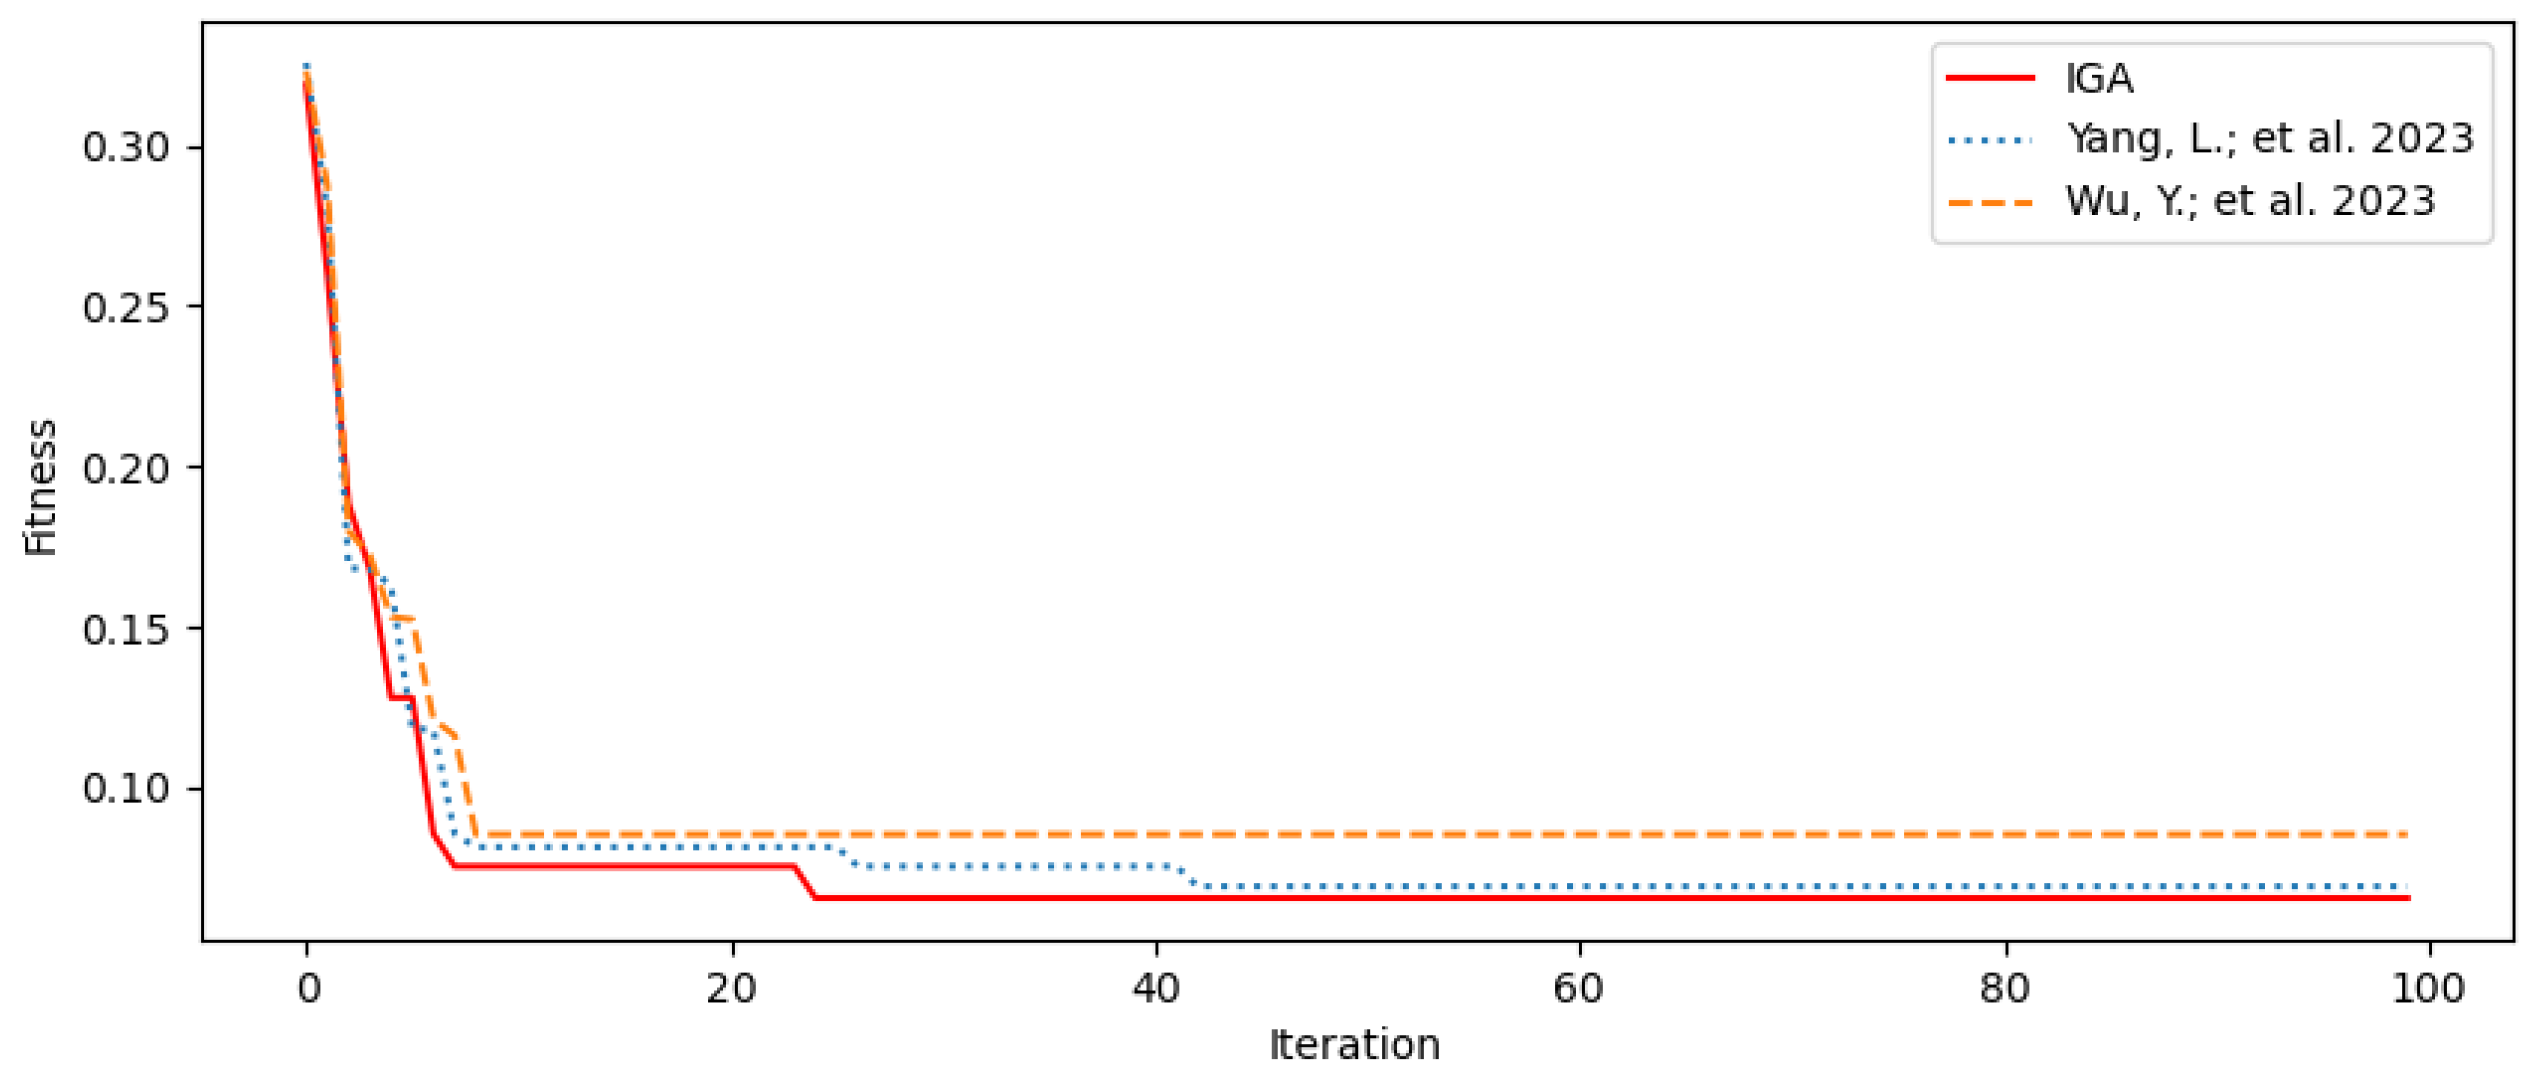
To validate the superiority of IGA and compare it with other advanced optimization algorithms, comparative experiments were conducted using the methods from references [13,14]. To minimize experimental randomness, each algorithm was independently run 10 times. The best fitness value from each run was recorded, and the results were averaged. The resulting fitness convergence curves are shown in Figure 6.
Figure 6 clearly demonstrates that within the same iteration range, the IGA converges faster than the other two comparison algorithms when solving the base station siting problem. Furthermore, during subsequent iterations, IGA consistently maintains a superior fitness level, ultimately converging to a lower fitness value. This indicates that compared to the comparison algorithms, IGA can more efficiently search for superior base station location solutions within the solution space, demonstrating stronger optimization capabilities and convergence efficiency. This validates the effectiveness and superiority of the proposed improved algorithm.
The average values of coverage contributions, construction costs, and interference costs for each algorithm across 10 experiments are shown in Table 5.
Table 5 demonstrates that the improved algorithm performs exceptionally well in base station site selection optimization tasks. In terms of coverage contribution, the improved algorithm achieves 147.201, slightly higher than the literature algorithm’s 147.153, thereby better meeting user coverage requirements. Regarding construction costs, the improved algorithm achieves 647.271, comparable to the literature algorithm’s 647.165, both representing relatively low levels. Furthermore, both the improved algorithm and one of the referenced algorithms select 6 base stations, compared to 7 in the other referenced algorithm, thereby reducing the scale of base station construction and conserving resources. Overall, the improved algorithm demonstrates superior coverage contribution while achieving favorable levels of construction cost and base station count control. This validates its effectiveness and competitiveness in base station site selection optimization.

5.2.3. Ablation Studies

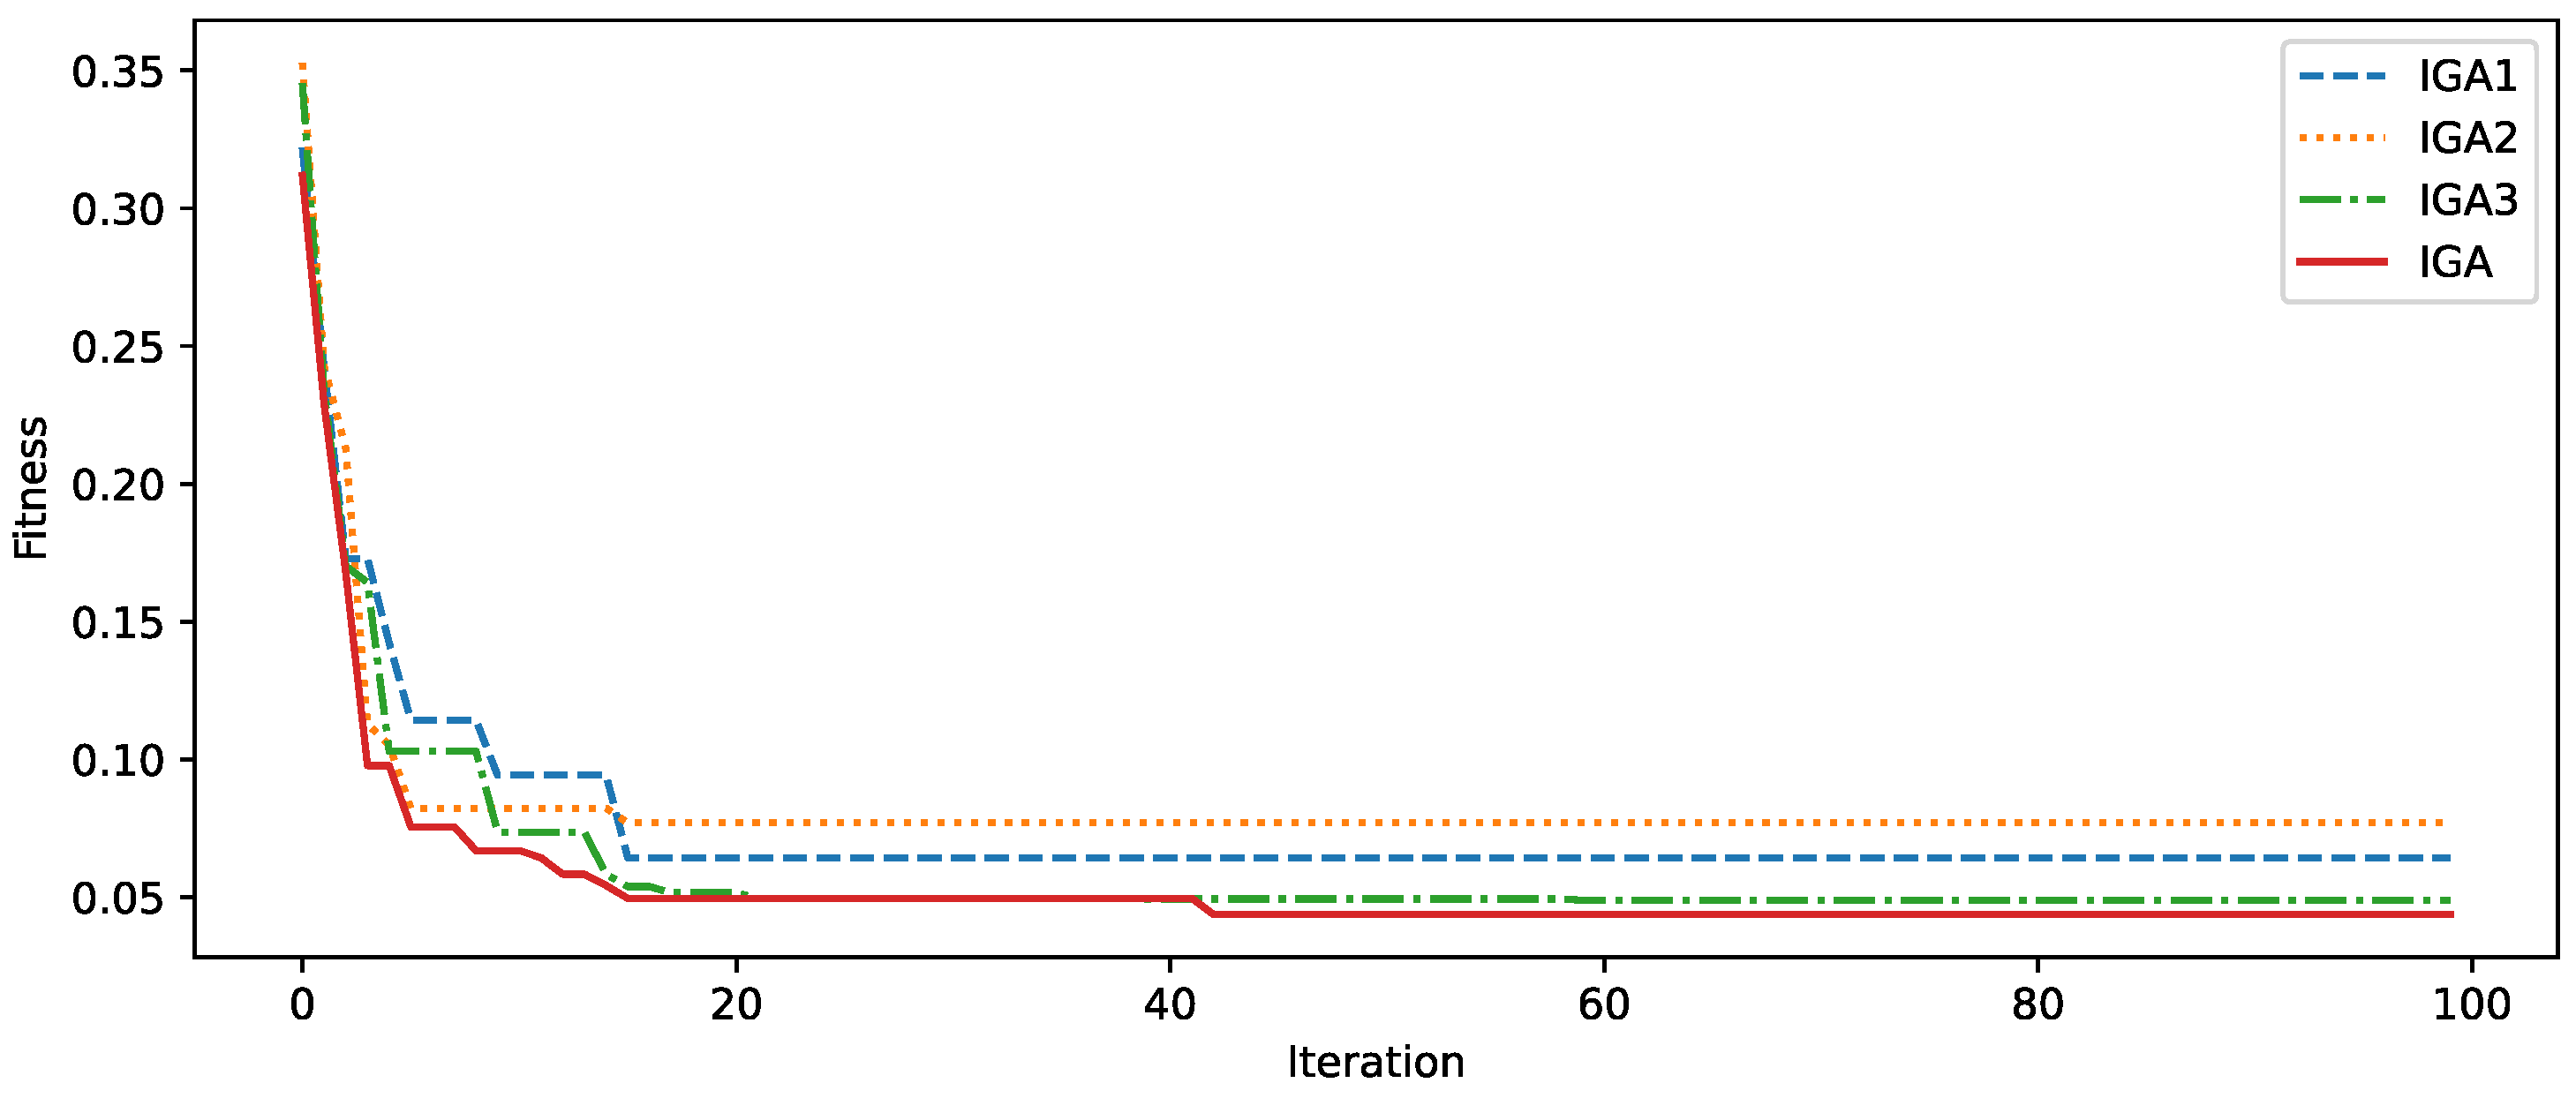
To avoid redundancy in improvement strategies, the effectiveness of three distinct improvement strategies—cosine-type adaptive strategy, fusion particle swarm algorithm, and migration strategy—must be verified independently. Based on the improved genetic algorithm, individual enhancement modules were sequentially removed to derive three algorithms: IGA1 integrates the particle swarm optimization algorithm with the migration strategy; IGA2 incorporates the cosine-type adaptive strategy alongside the migration strategy; and IGA3 combines the cosine-type adaptive strategy with the particle swarm optimization algorithm. Ten experimental runs were conducted comparing the improved algorithms against the aforementioned three approaches, yielding convergence curves as depicted in Figure 7.
As shown in Figure 7, the IGA incorporating the three improved strategies exhibits the fastest convergence rate and highest convergence accuracy throughout the entire evolutionary process. This fully demonstrates the necessity of each improvement strategy and its synergistic effects, highlighting the importance and effectiveness of combining these three improvement strategies to enhance the algorithm’s global optimization performance. During the early stages of iteration, IGA1 converges more slowly than IGA. This indicates that the cosine-type adaptive mechanism, by endowing the algorithm with stronger global exploration capabilities during the initial evolutionary phase, enables it to locate high-quality solution regions more rapidly. This, in turn, ensures the refinement level of subsequent searches. As an effective engineering practice, it mitigates the issue of premature convergence in the algorithm. IGA2 converges more slowly than IGA in the mid-to-late stages, indicating that the particle swarm algorithm provides the population with explicit directional guidance. This enhances the algorithm’s local search capability, enabling it to converge rapidly and accurately. IGA3 exhibits a gradual flattening trend in the later stages of iteration, with its final convergence value slightly exceeding that of IGA. This indicates that without the introduction of external novel genes via migration strategies, the algorithmic population loses diversity prematurely, making it more susceptible to local optima. In summary, this paper constructs a robust and efficient algorithm for base station site selection by organically integrating three strategies.

5.2.4. Parameter Sensitivity Analysis

To validate the model’s robustness to critical parameters—ensuring the algorithm continues to produce stable, high-quality solutions when parameters vary within reasonable ranges—and to avoid issues where minor parameter adjustments cause failure. By appropriately adjusting experimental parameters, we observe how metrics change under different parameter values.
1.
Objective Weight
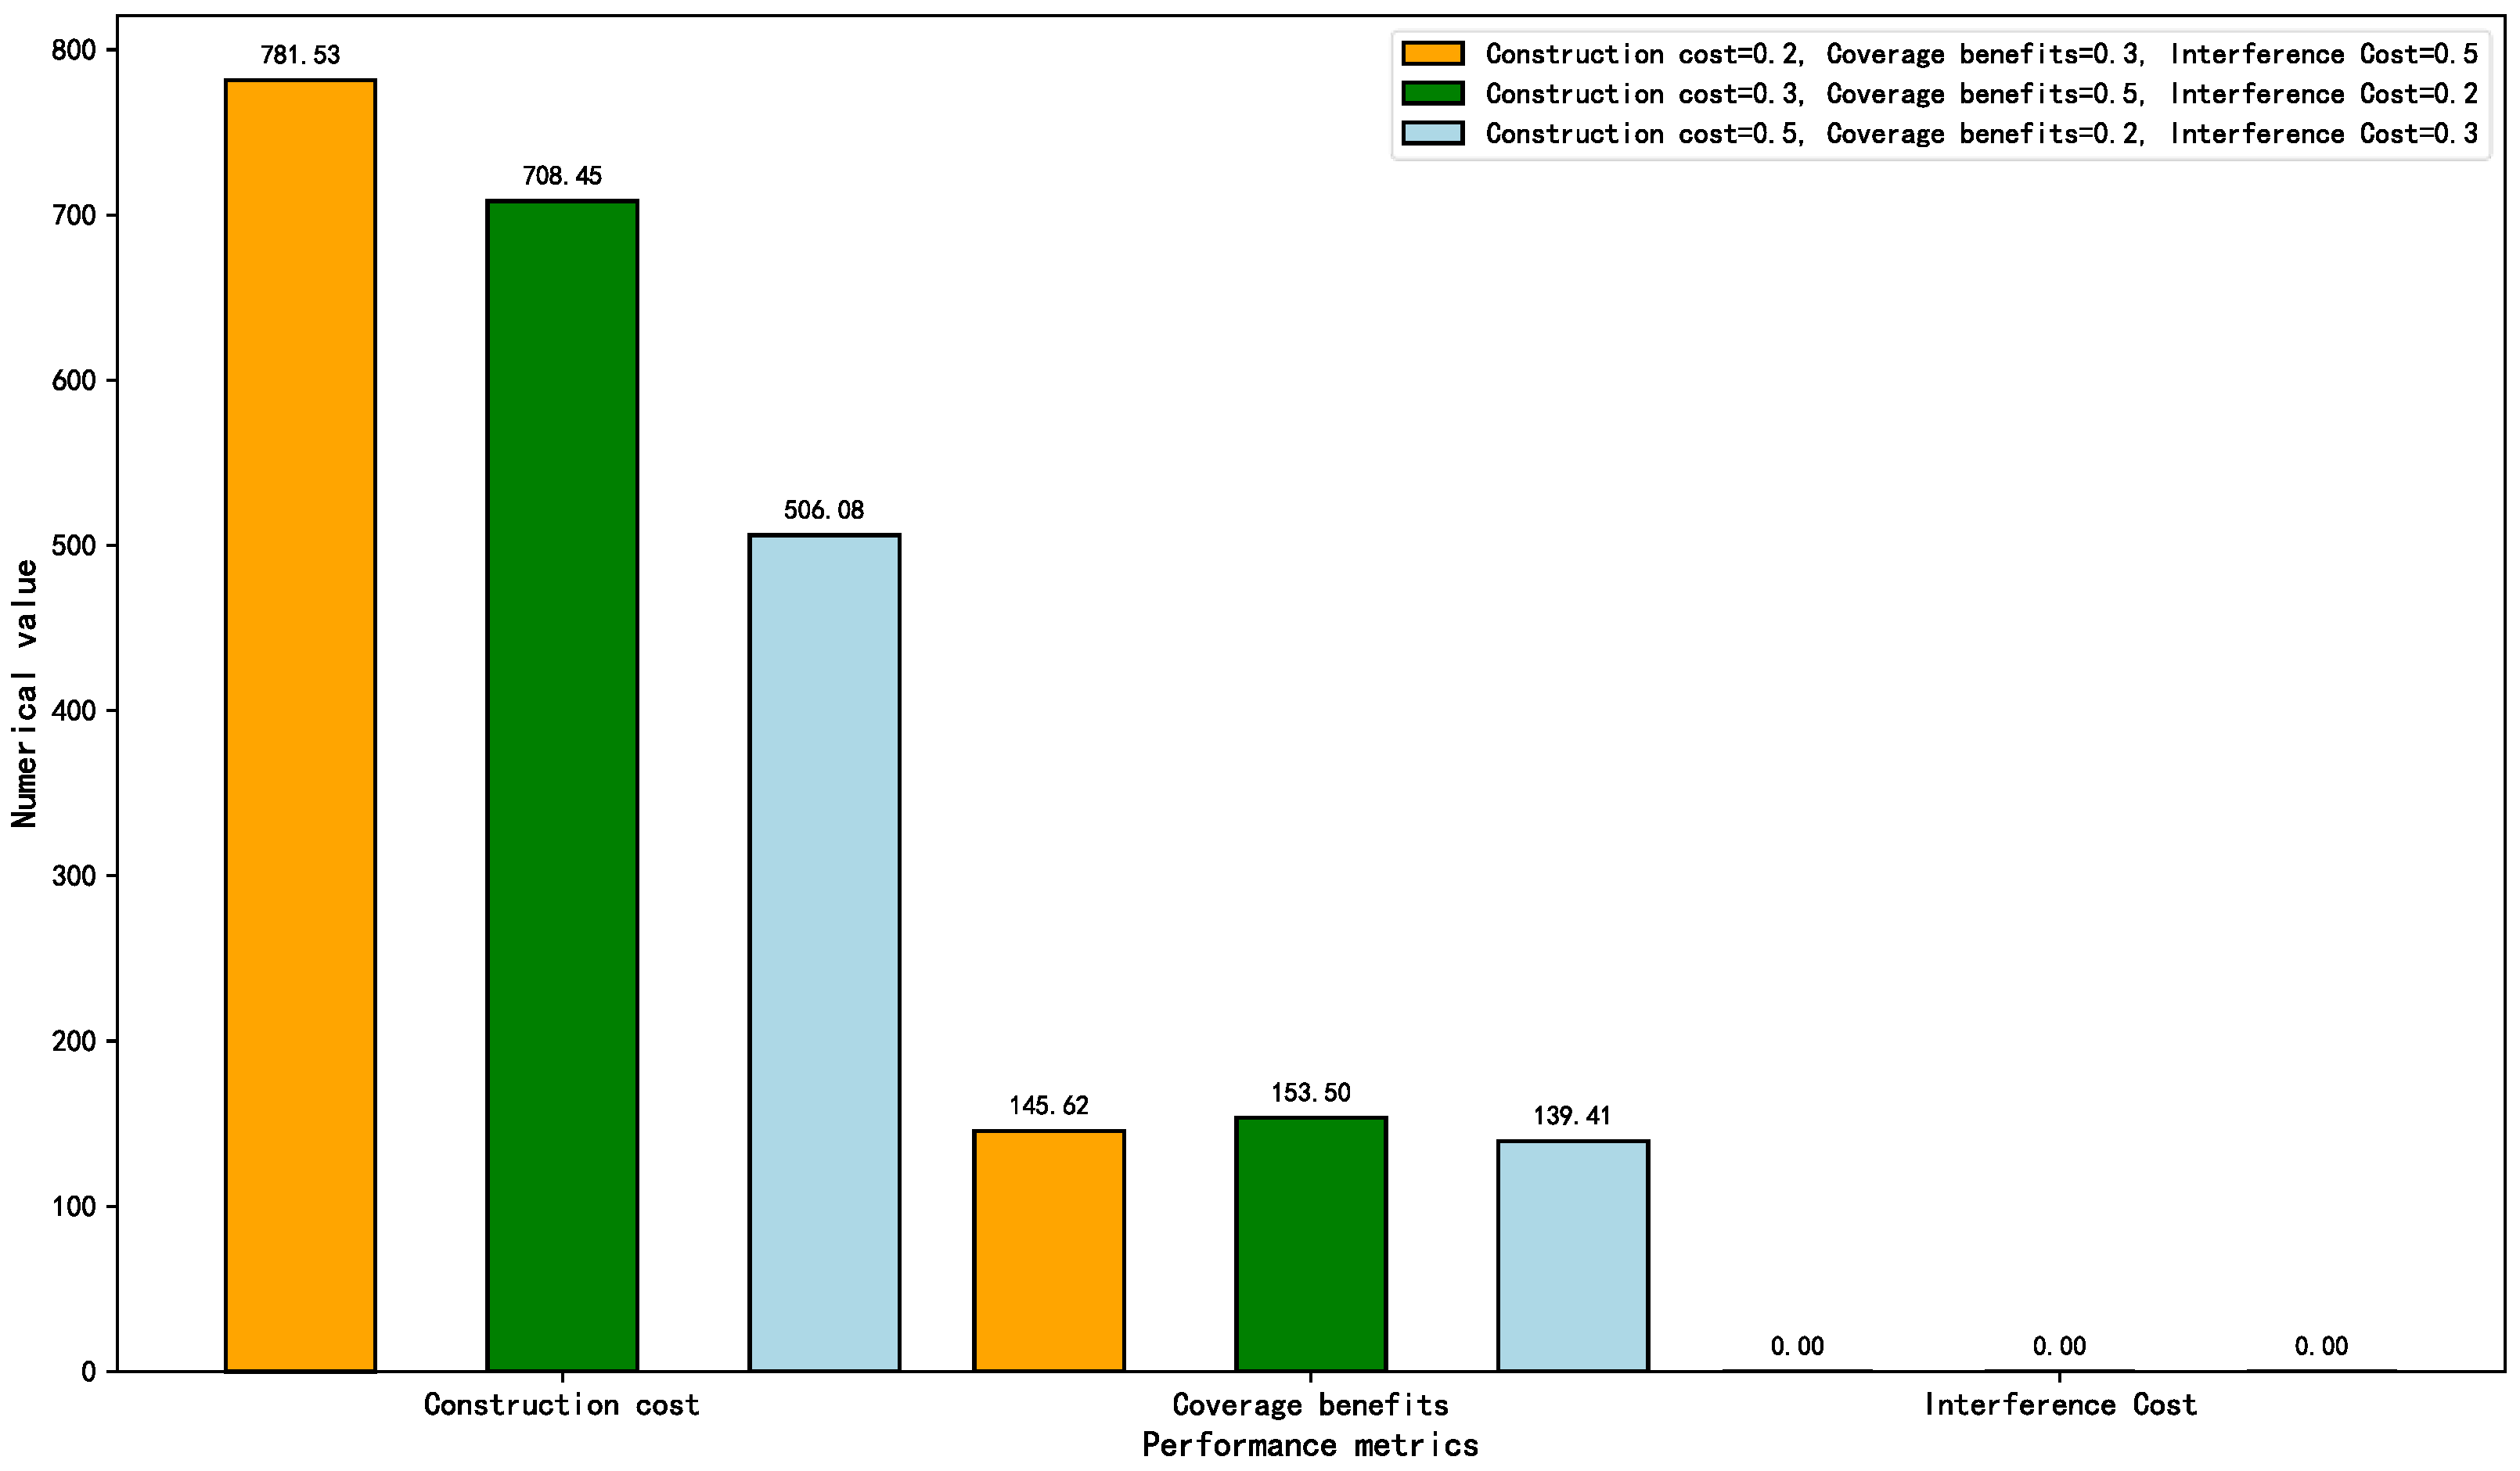
Target weights represent the level of emphasis placed on specific aspects during base station construction. Adjusting these weights allows observation of their impact on experimental outcomes. Weight variations are detailed in Table 6.
Experiments were conducted using new parameters, and the results obtained were compared with those from the original parameters. The experimental results are shown in Figure 8.
As shown in Figure 7, a lower construction cost weight corresponds to higher construction costs. This indicates that within the optimization objective, a higher proportion of cost weight leads to more significant control over construction costs by the algorithm, resulting in lower construction costs. Conversely, a higher coverage contribution weight correlates with greater coverage contributions. Evidently, increasing the coverage weight effectively promotes coverage contribution growth, with coverage contributions reaching their optimum when the coverage weight holds the largest proportion. Meanwhile, interference cost remains at 0 across all weight combinations. This fully demonstrates that the adopted algorithm perfectly avoids interference issues between base stations during site selection, ensuring the rationality and stability of base station layout without being affected by the allocation of weights such as cost and coverage.
2.
Base Station Coverage Radius
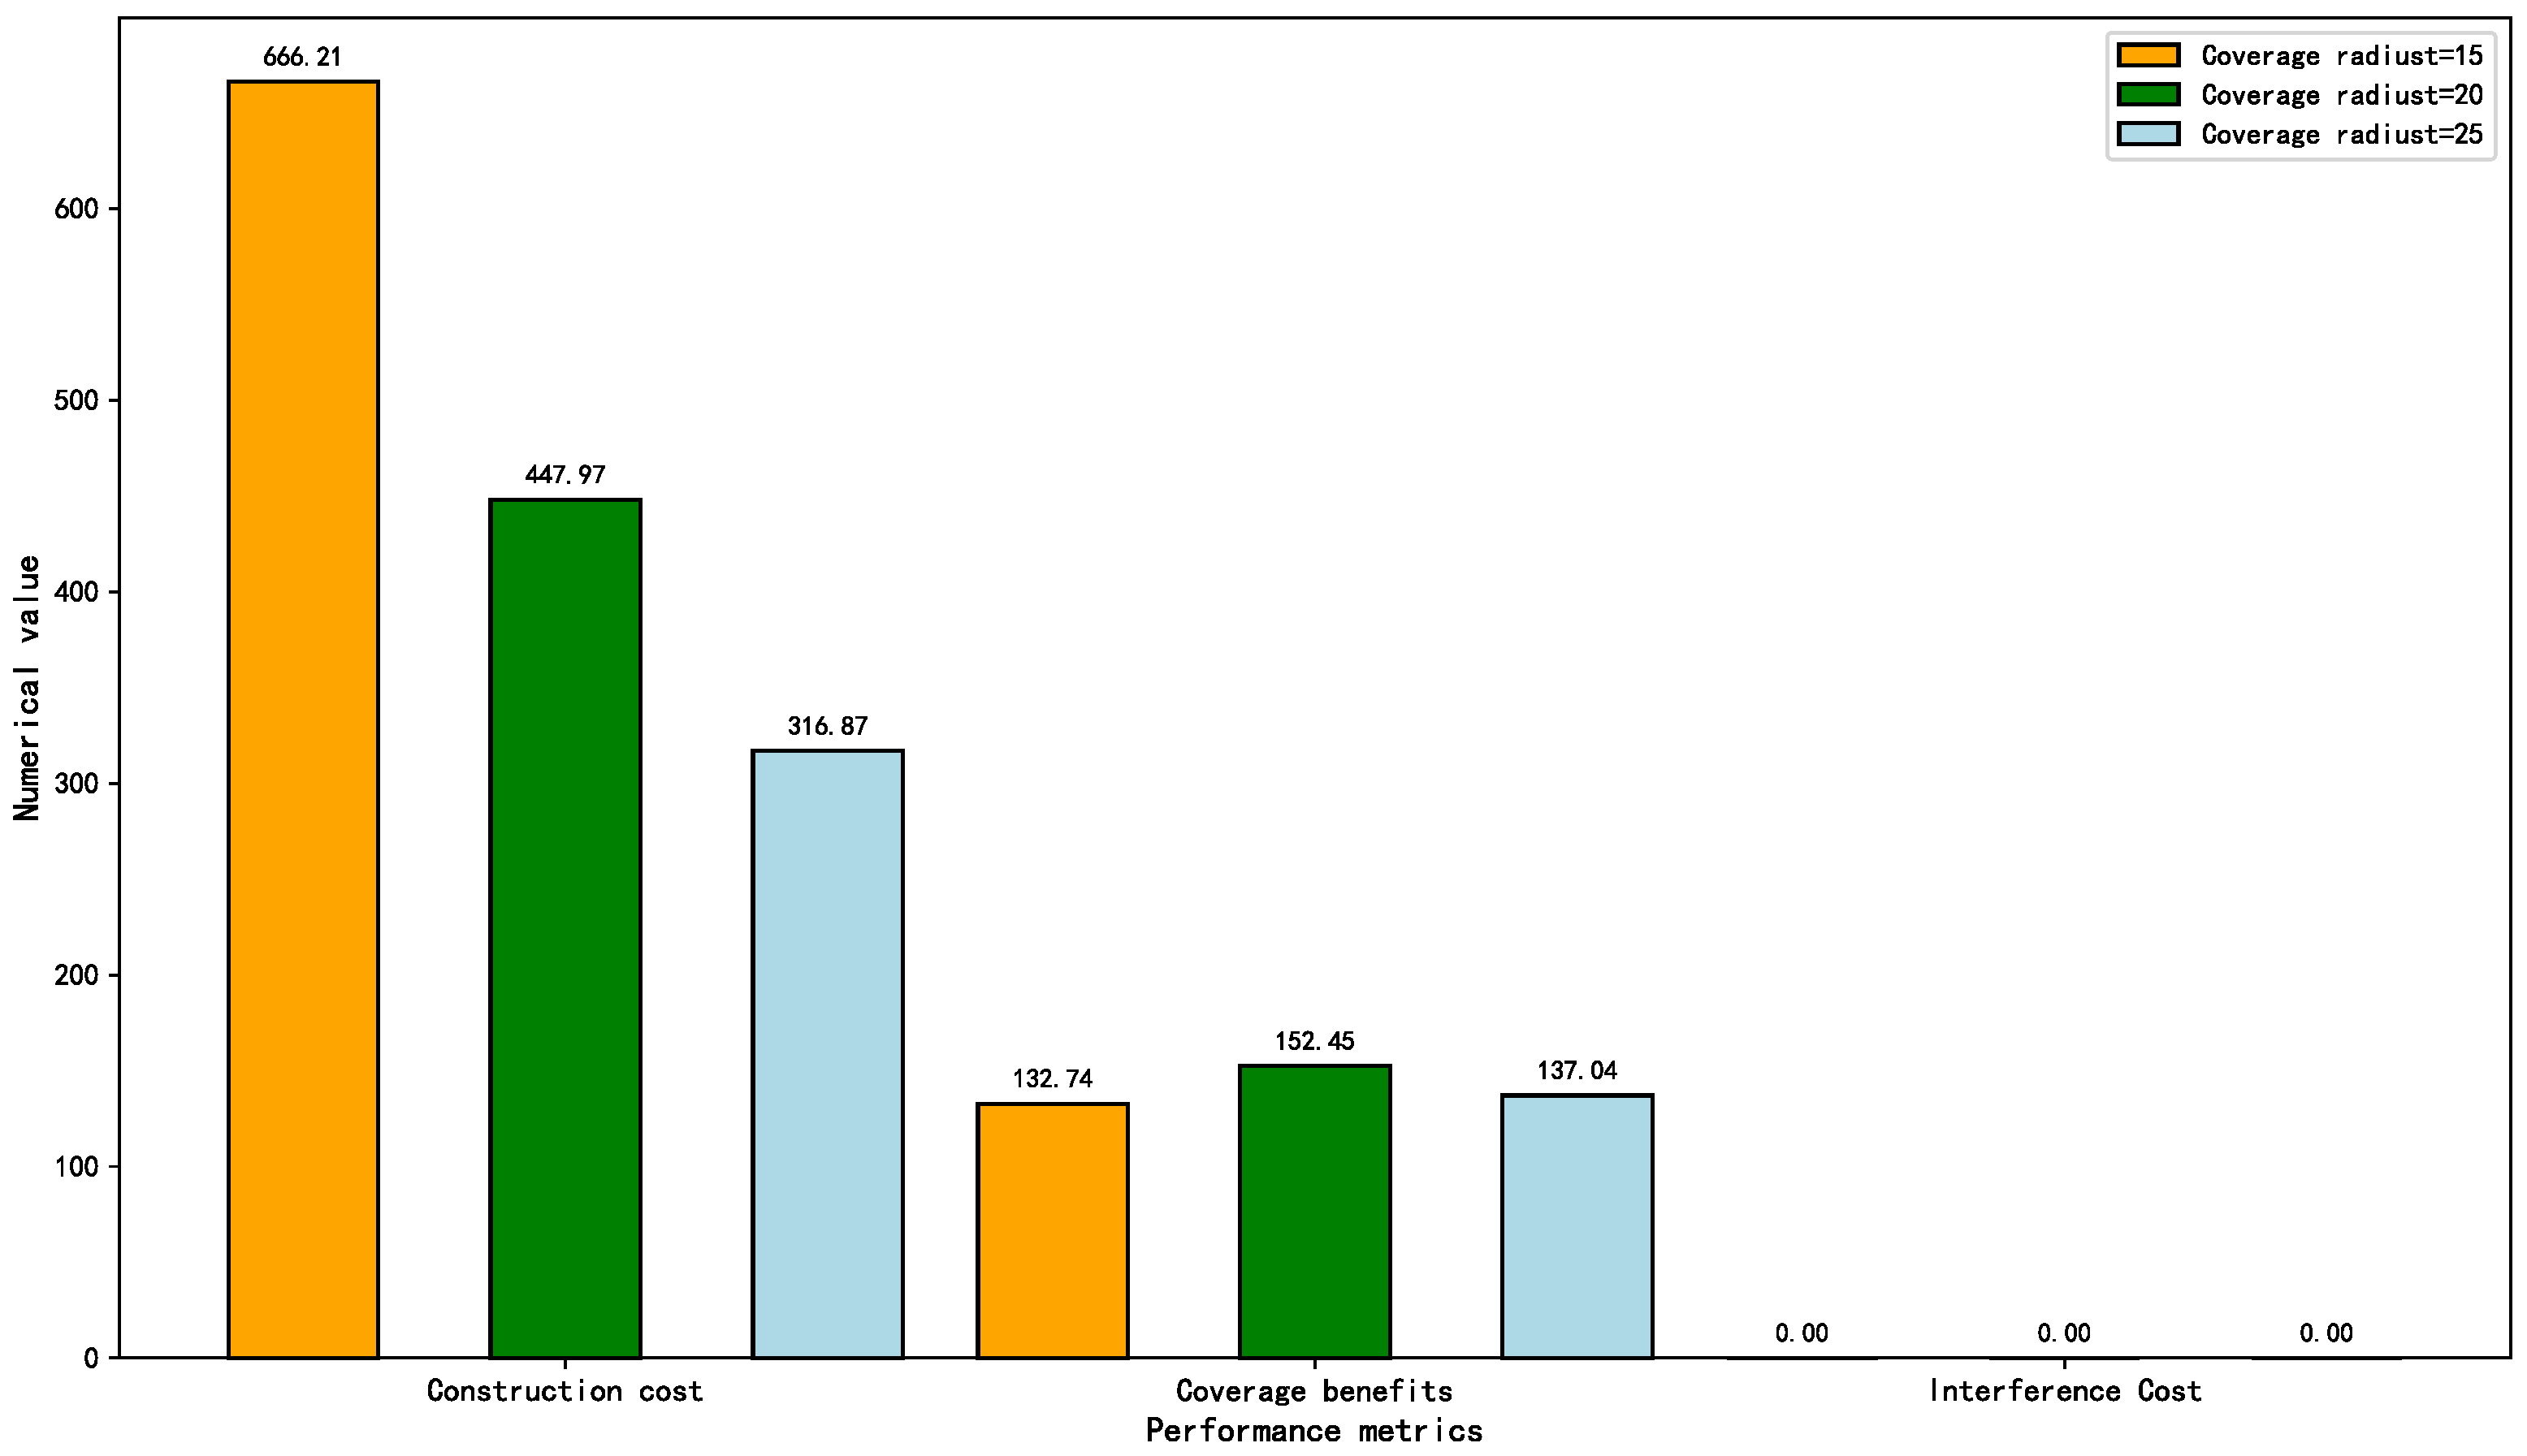
Each base station is considered to have a specific coverage radius R. This radius defines the maximum service distance at which the base station can provide satisfactory signal quality to user equipment. By altering the coverage radius of base stations, comparative experiments were conducted using stations with coverage radii of 15 km, 20 km, and 25 km. The experimental results are shown in Figure 9.
As shown in Figure 9, in terms of construction cost, the highest cost occurs at a coverage radius of 15, reaching 666.21, while the lowest cost is achieved at a coverage radius of 25, amounting to only 316.87. This indicates that as the coverage radius increases, the algorithm’s effectiveness in controlling construction costs becomes increasingly pronounced, with construction costs exhibiting a clear downward trend. Regarding coverage contributions, the coverage contribution is highest at a coverage radius of 20, reaching 152.45, and lowest at a coverage radius of 15, at 132.74. This demonstrates that coverage contributions do not necessarily increase with larger coverage radii; an optimal coverage radius exists that achieves the best coverage contributions. Meanwhile, interference costs remain at 0 across all coverage radii. This indicates that the adopted algorithm effectively avoids interference issues between base stations during site selection, ensuring the rationality and stability of base station layout regardless of coverage radius size.
3.
Immigration rate
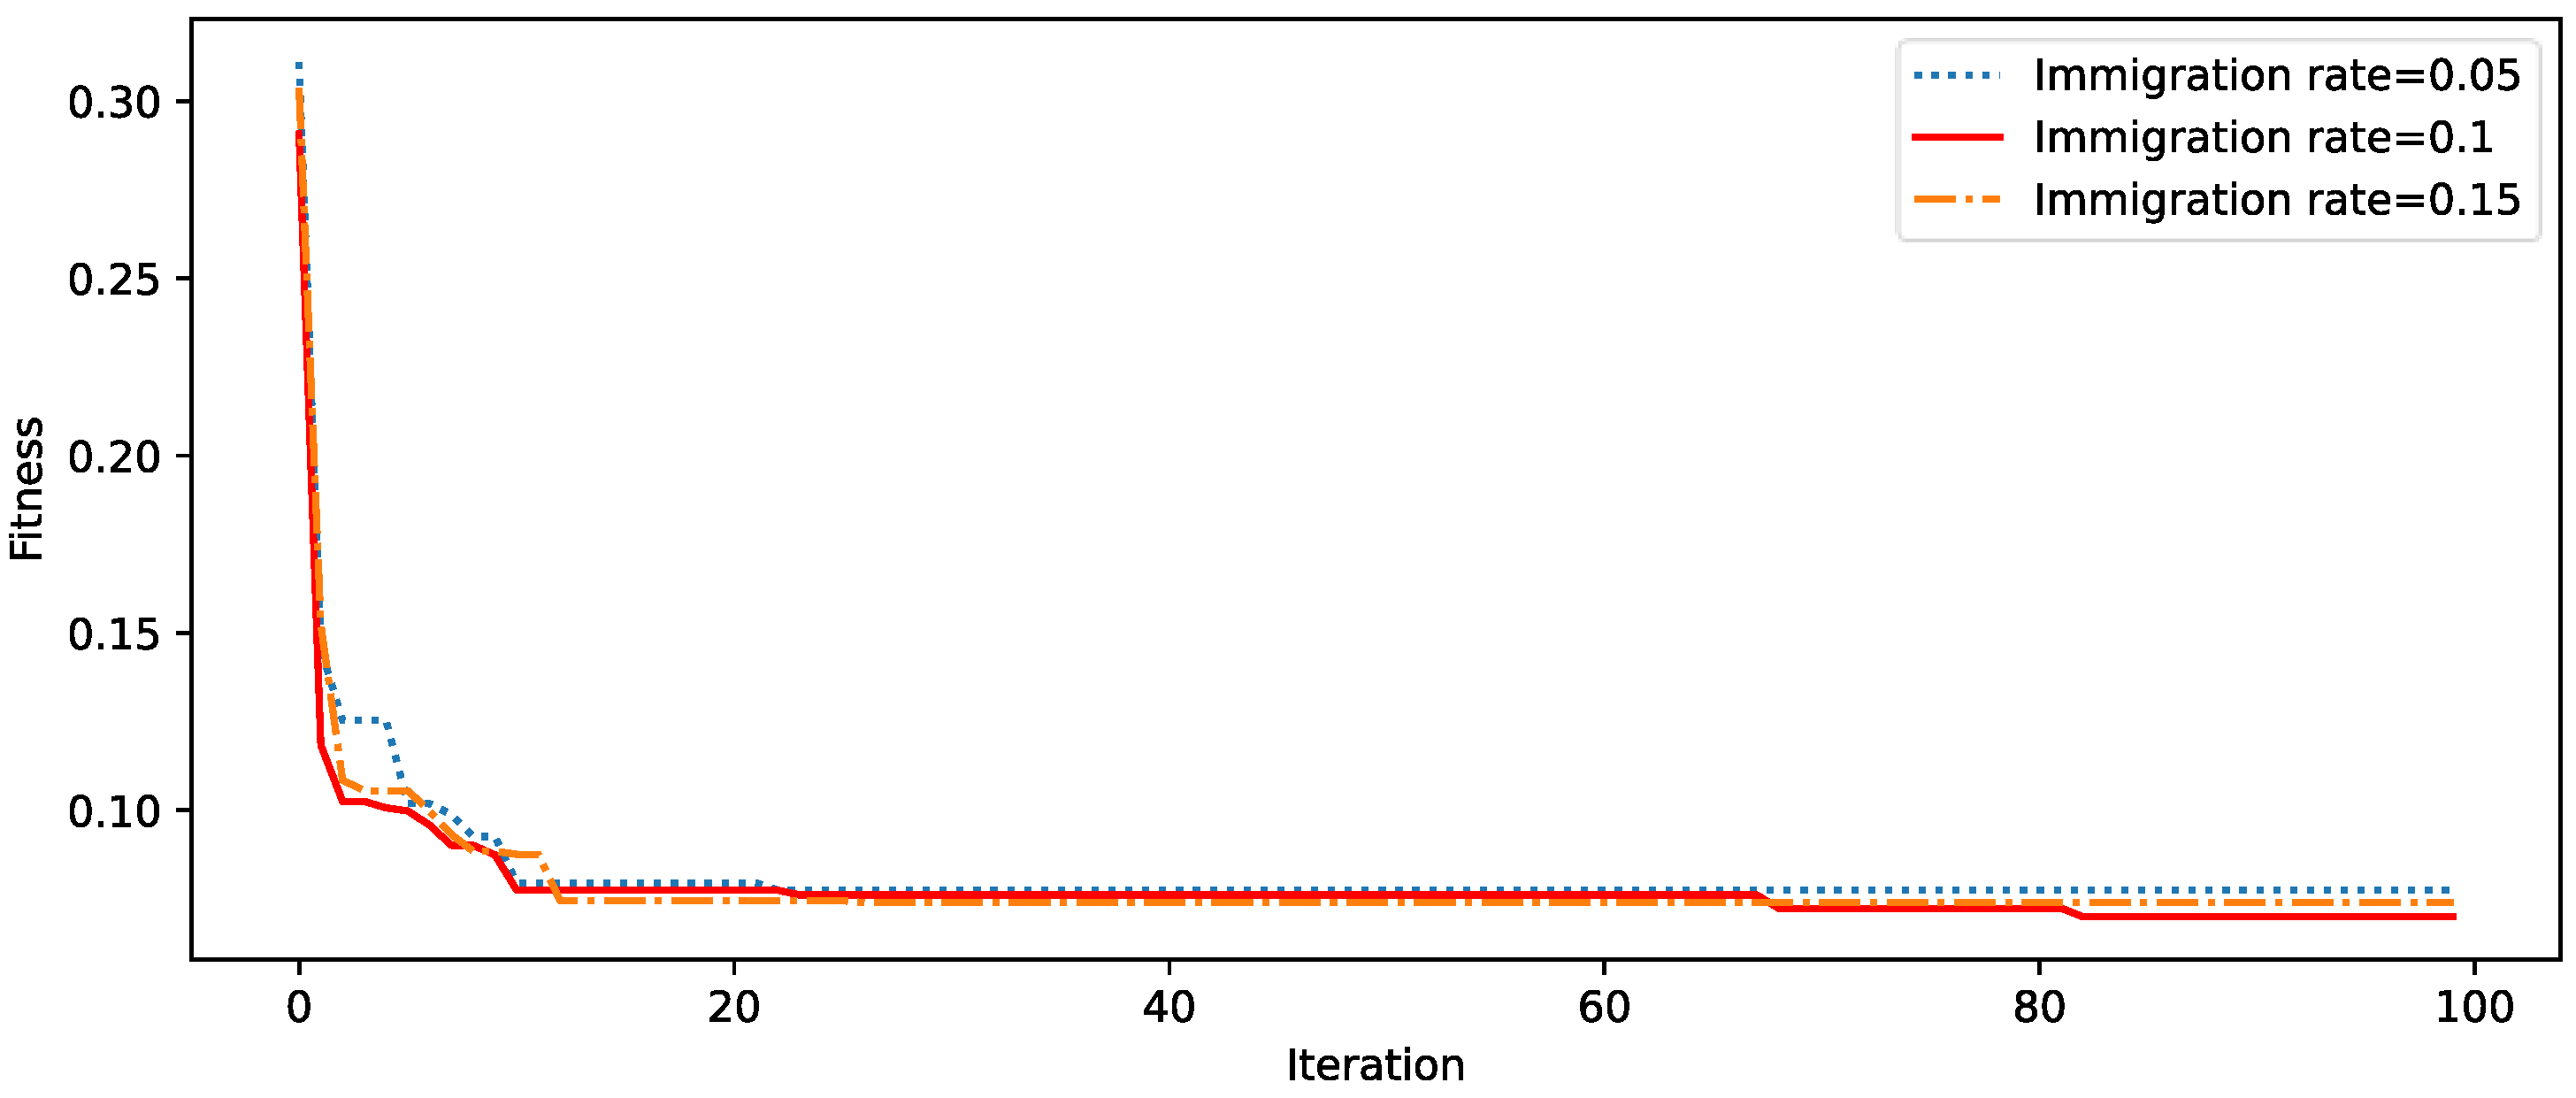
As one of the improvement strategies, the immigrant ratio may also influence the experimental results. Comparative experiments were conducted using base stations with immigrant ratios of 0.05, 0.1, and 0.15, with the results shown in Figure 10.
Figure 10 demonstrates that the migration rate influences both the convergence speed and accuracy of the algorithm. When the migration rate is 0.1, the fitness value decreases most rapidly during the early iterations, enabling the algorithm to quickly approach the optimal solution region. In the middle and late stages of iteration, the fitness value continues to decline steadily, ultimately converging to the minimum fitness value, exhibiting optimal convergence performance. At a migration rate of 0.05, the slower population renewal rate results in a relatively gradual initial convergence rate. While maintaining a certain degree of local search stability, the convergence accuracy is slightly inferior to that of the 0.1 migration rate due to insufficient population diversity in the later stages. When the migration rate increased to 0.15, although the initial decline in fitness accelerated, excessive migration operations during iterations led to over-dilution of high-quality genes in the population. This caused fluctuations in the convergence process, and the final convergence accuracy was inferior to that achieved with a migration rate of 0.1.
4.
Base Station Scale
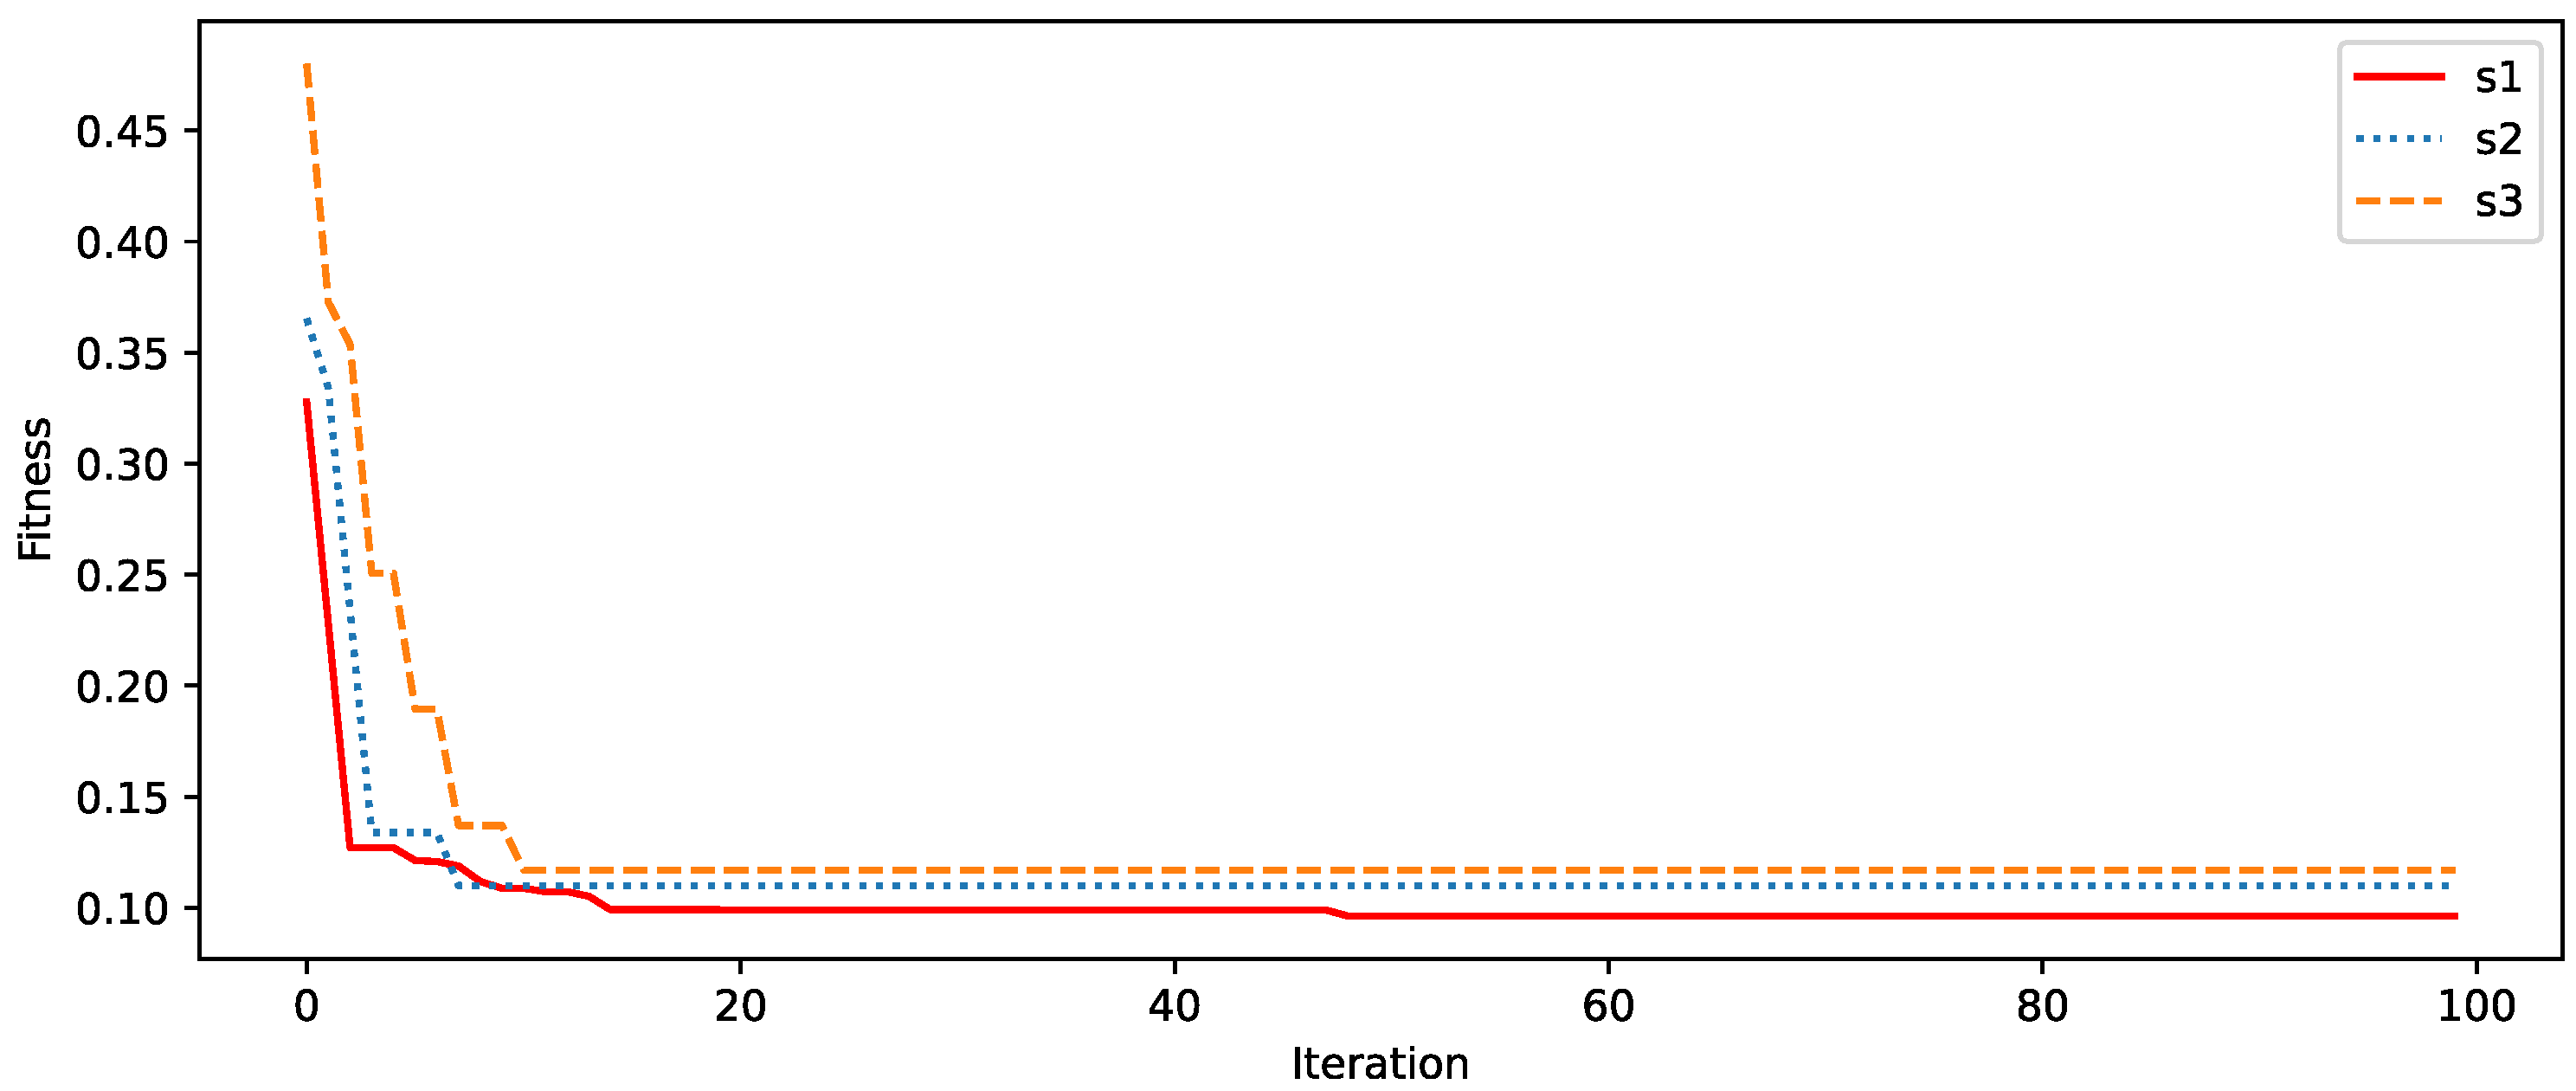
To evaluate the applicability and robustness of the improved genetic algorithm proposed in this paper across different problem scales, multiple test scenarios of varying sizes were designed for verification. The baseline scenario S1 represents the original problem scale. Based on this, a smaller-scale scenario S2 was added: 15 candidate base stations and 25 demand points. Additionally, a larger-scale scenario S3 was introduced: 50 candidate base stations and 80 demand points. For all scenarios, the algorithm parameters remained consistent with those described in Section 5.1.2. The experimental results obtained are shown in Figure 11.
The experimental results demonstrate that the algorithm exhibits excellent performance across scenarios of varying scales. For the smaller-scale scenario S2, the original-scale scenario S1, and the larger-scale scenario S3, the fitness values show a rapid and stable decline as the number of iterations increases, ultimately converging to highly satisfactory levels. This indicates that the proposed algorithm possesses efficient optimization capabilities and strong adaptability in base station siting problems, effectively addressing optimization challenges across small, medium, and large-scale scenarios. It provides reliable methodological support for practical base station siting decisions.

5.3. Experimental Analysis Summary

Experimental results demonstrate that the communication base station site selection method based on an improved genetic algorithm exhibits excellent feasibility, effectiveness, and practicality. It effectively balances the objectives of cost, coverage, and interference in base station site selection, outperforming traditional heuristic algorithms. Furthermore, it possesses parameter robustness and engineering practicality.

6. Conclusions

In conclusion, this paper addresses the limitations of traditional communication base station site selection methods, which rely heavily on manual experience and exhibit strong subjectivity. Existing heuristic algorithms suffer from slow convergence speeds, susceptibility to local optima, and difficulties in balancing multiple objectives. Consequently, this study investigates a communication base station site selection method based on an improved genetic algorithm. To address the aforementioned issues, this paper first constructs a multi-objective site selection model that balances cost minimization, coverage contribution maximization, and interference minimization. Through normalization and weight fusion, it achieves quantitative equilibrium among multiple objectives while defining constraints such as base station quantity, key area coverage, and minimum inter-station distance. Second, the genetic algorithm was optimized and validated through application. Improvements were made to the traditional genetic algorithm by introducing a cosine-type adaptive strategy to dynamically adjust crossover and mutation probabilities, thereby enhancing convergence efficiency. It was integrated with the particle swarm optimization algorithm to strengthen global search capabilities. An adaptive migration strategy was incorporated to maintain population diversity and prevent premature convergence, resulting in an improved genetic algorithm that combines both optimization accuracy and stability. Finally, experimental validation demonstrated the method’s effectiveness. Compared to traditional genetic algorithms and particle swarm optimization, the improved algorithm outperformed in convergence speed, global optimization capability, and stability. Through the above analysis, the improved genetic algorithm proposed in this paper provides a computationally efficient and reliable tool for communication base station site selection. It facilitates data-driven, multi-scenario planning and enables stable long-term infrastructure decisions, particularly as network flexibility and cost-effectiveness become increasingly critical in the evolving landscape of 6G.
However, this study still has certain limitations. First, the model’s consideration of path loss and fading characteristics in complex terrain could be further refined; the current simplified model may affect site selection accuracy in extreme scenarios. Second, dynamic user demands (and their impact on site selection solutions) were not fully accounted for, indicating insufficient dynamic adaptability of the model. Future research will focus on enhancing models to better align with the requirements of 6G networks. First, consider multipath effects and environmental reflections to establish more sophisticated spatial channel models. Explore the use of geometry-based random channel models or leverage site-specific digital twin data to better describe small-scale fading and its impact on base station siting. Integrate these advanced models into our proposed optimization framework to enable reliable communications in 6G environments. Second, extend the model to dynamic scenarios, accounting for the spatiotemporal variations in user demand driven by 6G applications. Investigate incremental site selection algorithms to enable dynamic adjustments and long-term optimization of base station layouts, thereby better aligning with practical engineering requirements.

Author Contributions

Conceptualization, J.L. and S.F.; methodology, J.L.; formal analysis, J.L.; data curation, J.L. and S.Z.; writing—original draft preparation, J.L.; writing—review and editing, Y.F.; supervision, H.W. All authors have read and agreed to the published version of the manuscript.

Funding

This research received no external funding.

Data Availability Statement

The original contributions presented in this study are included in the article material. Further inquiries can be directed to the corresponding authors.

Conflicts of Interest

The authors declare no conflict of interest.

References

  1. Lin, X. 3GPP evolution from 5G to 6G: A 10-year retrospective. Telecom 2025, 6, 32. [Google Scholar] [CrossRef]
  2. Singh, R.; Jadaan, D.; Ghimire, D.; Berger, M.; Skavhaug, A.; Dittmann, L. Comparative Analysis of Power Consumption in LTE, 5G-NSA, 5G-SA, and Private 5G Networks. In Proceedings of the 2025 IEEE 22nd Consumer Communications & Networking Conference (CCNC), Las Vegas, NV, USA, 10–13 January 2025; pp. 1–2. [Google Scholar]
  3. Zhou, Y.; Liu, L.; Wang, L.; Hui, N.; Cui, X.; Wu, J.; Peng, Y.; Qi, Y.; Xing, C. Service-Aware 6G: An Intelligent and Open Network Based on the Convergence of Communication, Computing and Caching. Digit. Commun. Netw. 2020, 6, 253–260. [Google Scholar] [CrossRef]
  4. Auwul, M.R. Robust Statistical Machine Learning Method for Transcriptome Data Analysis. Ph.D. Thesis, Guangzhou University, Guangzhou, China, 2022. [Google Scholar]
  5. Arora, S. Approximation Schemes for NP-Hard Geometric Optimization Problems: A Survey. Math. Program. 2003, 97, 43–69. [Google Scholar] [CrossRef]
  6. Liu, Y.; Huangfu, W.; Zhang, H.; Wang, H.; An, W.; Long, K. An Efficient Geometry-Induced Genetic Algorithm for Base Station Placement in Cellular Networks. IEEE Access 2019, 7, 108604–108616. [Google Scholar] [CrossRef]
  7. Lakshminarasimman, N.; Baskar, S.; Alphones, A.; Iruthayarajan, M.W. Base Station Placement for Dynamic Traffic Load Using Evolutionary Algorithms. Wirel. Pers. Commun. 2013, 72, 671–691. [Google Scholar] [CrossRef]
  8. Ali, H.M.; Liu, J.; Ejaz, W. Planning Capacity for 5G and Beyond Wireless Networks by Discrete Fireworks Algorithm with Ensemble of Local Search Methods. EURASIP J. Wirel. Commun. Netw. 2020, 2020, 185. [Google Scholar] [CrossRef]
  9. Mathar, R.; Niessen, T. Optimum Positioning of Base Stations for Cellular Radio Networks. Wirel. Netw. 2000, 6, 421–428. [Google Scholar] [CrossRef]
  10. Elkamchouchi, H.M.; Elragal, H.M.; Makar, M.A. Cellular Radio Network Planning Using Particle Swarm Optimization. In Proceedings of the National Radio Science Conference, Cairo, Egypt, 13–15 March 2007; pp. 1–8. [Google Scholar]
  11. Berman, O.; Kalcsics, J.; Krass, D. On Covering Location Problems on Networks with Edge Demand. Comput. Oper. Res. 2016, 74, 214–227. [Google Scholar] [CrossRef]
  12. Amine, O.M.; Cilia, Z.; Khireddine, A. Optimal Base Station Planning Using Genetic Algorithm for LTE Network. In Advances on Broad-Band Wireless Computing, Communication and Applications; Barolli, L., Xhafa, F., Conesa, J., Eds.; Springer: Cham, Switzerland, 2018; pp. 731–740. [Google Scholar]
  13. Yang, L.-S.; Wen, B.; Yan, J.-J. Network Site Optimization and Clustering Study Based on Simulated Annealing Algorithm. IEEE Access 2023, 11, 108167–108177. [Google Scholar] [CrossRef]
  14. Wu, Y.; Shen, Y.; Fan, H. Location Planning of 5G Base Station Based on Immune Algorithm and Clustering Algorithm. In Proceedings of the 2023 IEEE Smart World Congress (SWC), Portsmouth, UK, 28–31 August 2023; pp. 1–7. [Google Scholar]
  15. Lv, Z.; Xu, C.; Wei, J. Data Sinks Deployment for Backbone-Assisted Real-Time PD-NOMA Networks Based on Reinforcement Learning. In Proceedings of the 2024 IEEE Smart World Congress (SWC), Nadi, Fiji, 12–15 November 2024; pp. 1091–1097. [Google Scholar]
  16. Guo, Q.; Liu, R.Z.; Liu, J.G. Research on Emergency Logistics Facility Location Based on Graph Neural Networks. J. Shanghai Univ. Sci. Technol. 2025. [Google Scholar]
  17. Li, P.; Cao, J.; Pang, W.; Luo, Y. UAV Base Station Scheduling Optimization Using Genetic Algorithm Based on Population Dynamic Clustering Strategy. J. Inf. Eng. Univ. 2022, 23, 245–252. [Google Scholar]
  18. Wang, C. Site Selection for Communication Base Stations Based on an Improved Particle Swarm Optimization Algorithm. Master’s Thesis, Nanjing University of Posts and Telecommunications, Nanjing, China, 2017. [Google Scholar]
  19. Guo, Y. Research on Base Station Site Selection Methods Based on Communication Visibility. Master’s Thesis, Nanjing Normal University, Nanjing, China, 2021. [Google Scholar]
  20. Yang, C. Research on Coverage Issues in 3G Base Station Site Selection. Master’s Thesis, Huazhong University of Science and Technology, Wuhan, China, 2011. [Google Scholar]
  21. Han, C. Adaptive Mitigation Method for Overlapping Interference in Ship Communication Processes. Nav. Sci. Technol. 2021, 43, 130–132. [Google Scholar]
  22. Wang, Y.; Chen, C.; Yu, Z. Research on 5G Base Station Site Selection Decision-Making and Optimization Based on Particle Swarm Optimization Algorithm. J. Eng. Math. 2024, 41, 1170–1178. [Google Scholar]
  23. Alsan, Y.; Puskely, J.; Janssen, J.H.J.; Geurts, M.; Roederer, A.; Yarovoy, A. Thermal-Aware Synthesis of 5G Base Station Antenna Arrays: An Overview and a Sparsity-Based Approach. IEEE Access 2018, 6, 58868–58882. [Google Scholar]
  24. Li, Y.; Xia, M.; Wu, Y.-C. Activity Detection for Massive Connectivity Under Frequency Offsets via First-Order Algorithms. IEEE Trans. Wirel. Commun. 2019, 18, 1988–2002. [Google Scholar] [CrossRef]
  25. Yang, Y.; Gong, Y.; Wu, Y.-C. Intelligent-Reflecting-Surface-Aided Mobile Edge Computing with Binary Offloading: Energy Minimization for IoT Devices. IEEE Internet Things J. 2022, 9, 12973–12983. [Google Scholar] [CrossRef]
  26. Ma, Y.; Yun, W. Research Progress on Genetic Algorithms. Comput. Appl. Res. 2012, 29, 1201–1206+1210. [Google Scholar]
  27. Yang, C. Application of an Improved Adaptive Genetic Algorithm in Function Optimization. Master’s Thesis, Kunming University of Science and Technology, Kunming, China, 2018. [Google Scholar]
  28. Eberhart, R.; Kennedy, J. A New Optimizer Using Particle Swarm Theory. In Proceedings of the Sixth International Symposium on Micro Machine and Human Science (MHS ‘95), Nagoya, Japan, 4–6 October 1995; pp. 39–43. [Google Scholar]
  29. Kennedy, J.; Eberhart, R. Particle Swarm Optimization. In Proceedings of the IEEE International Conference on Neural Networks, Perth, Australia, 27 November–1 December 1995; Volume 4, pp. 1942–1948. [Google Scholar]
  30. Qian, Q.; Zhang, J. Feasibility Study on Anti-Missile Defense Strategy for a Single Ship Based on Adaptive Genetic Algorithm. Nav. Electron. Eng. 2020, 40, 23–26. [Google Scholar]
  31. Lü, L. Research and Application of an Improved Adaptive Multi-Objective Genetic Algorithm. Master’s Thesis, Tianjin University of Technology and Education, Tianjin, China, 2020. [Google Scholar]
  32. Rong, Y. Research on Evolutionary Algorithm-Based Site Planning Optimization for Boundary-Free Positioning. Master’s Thesis, Xidian University, Xi’an, China, 2023. [Google Scholar]
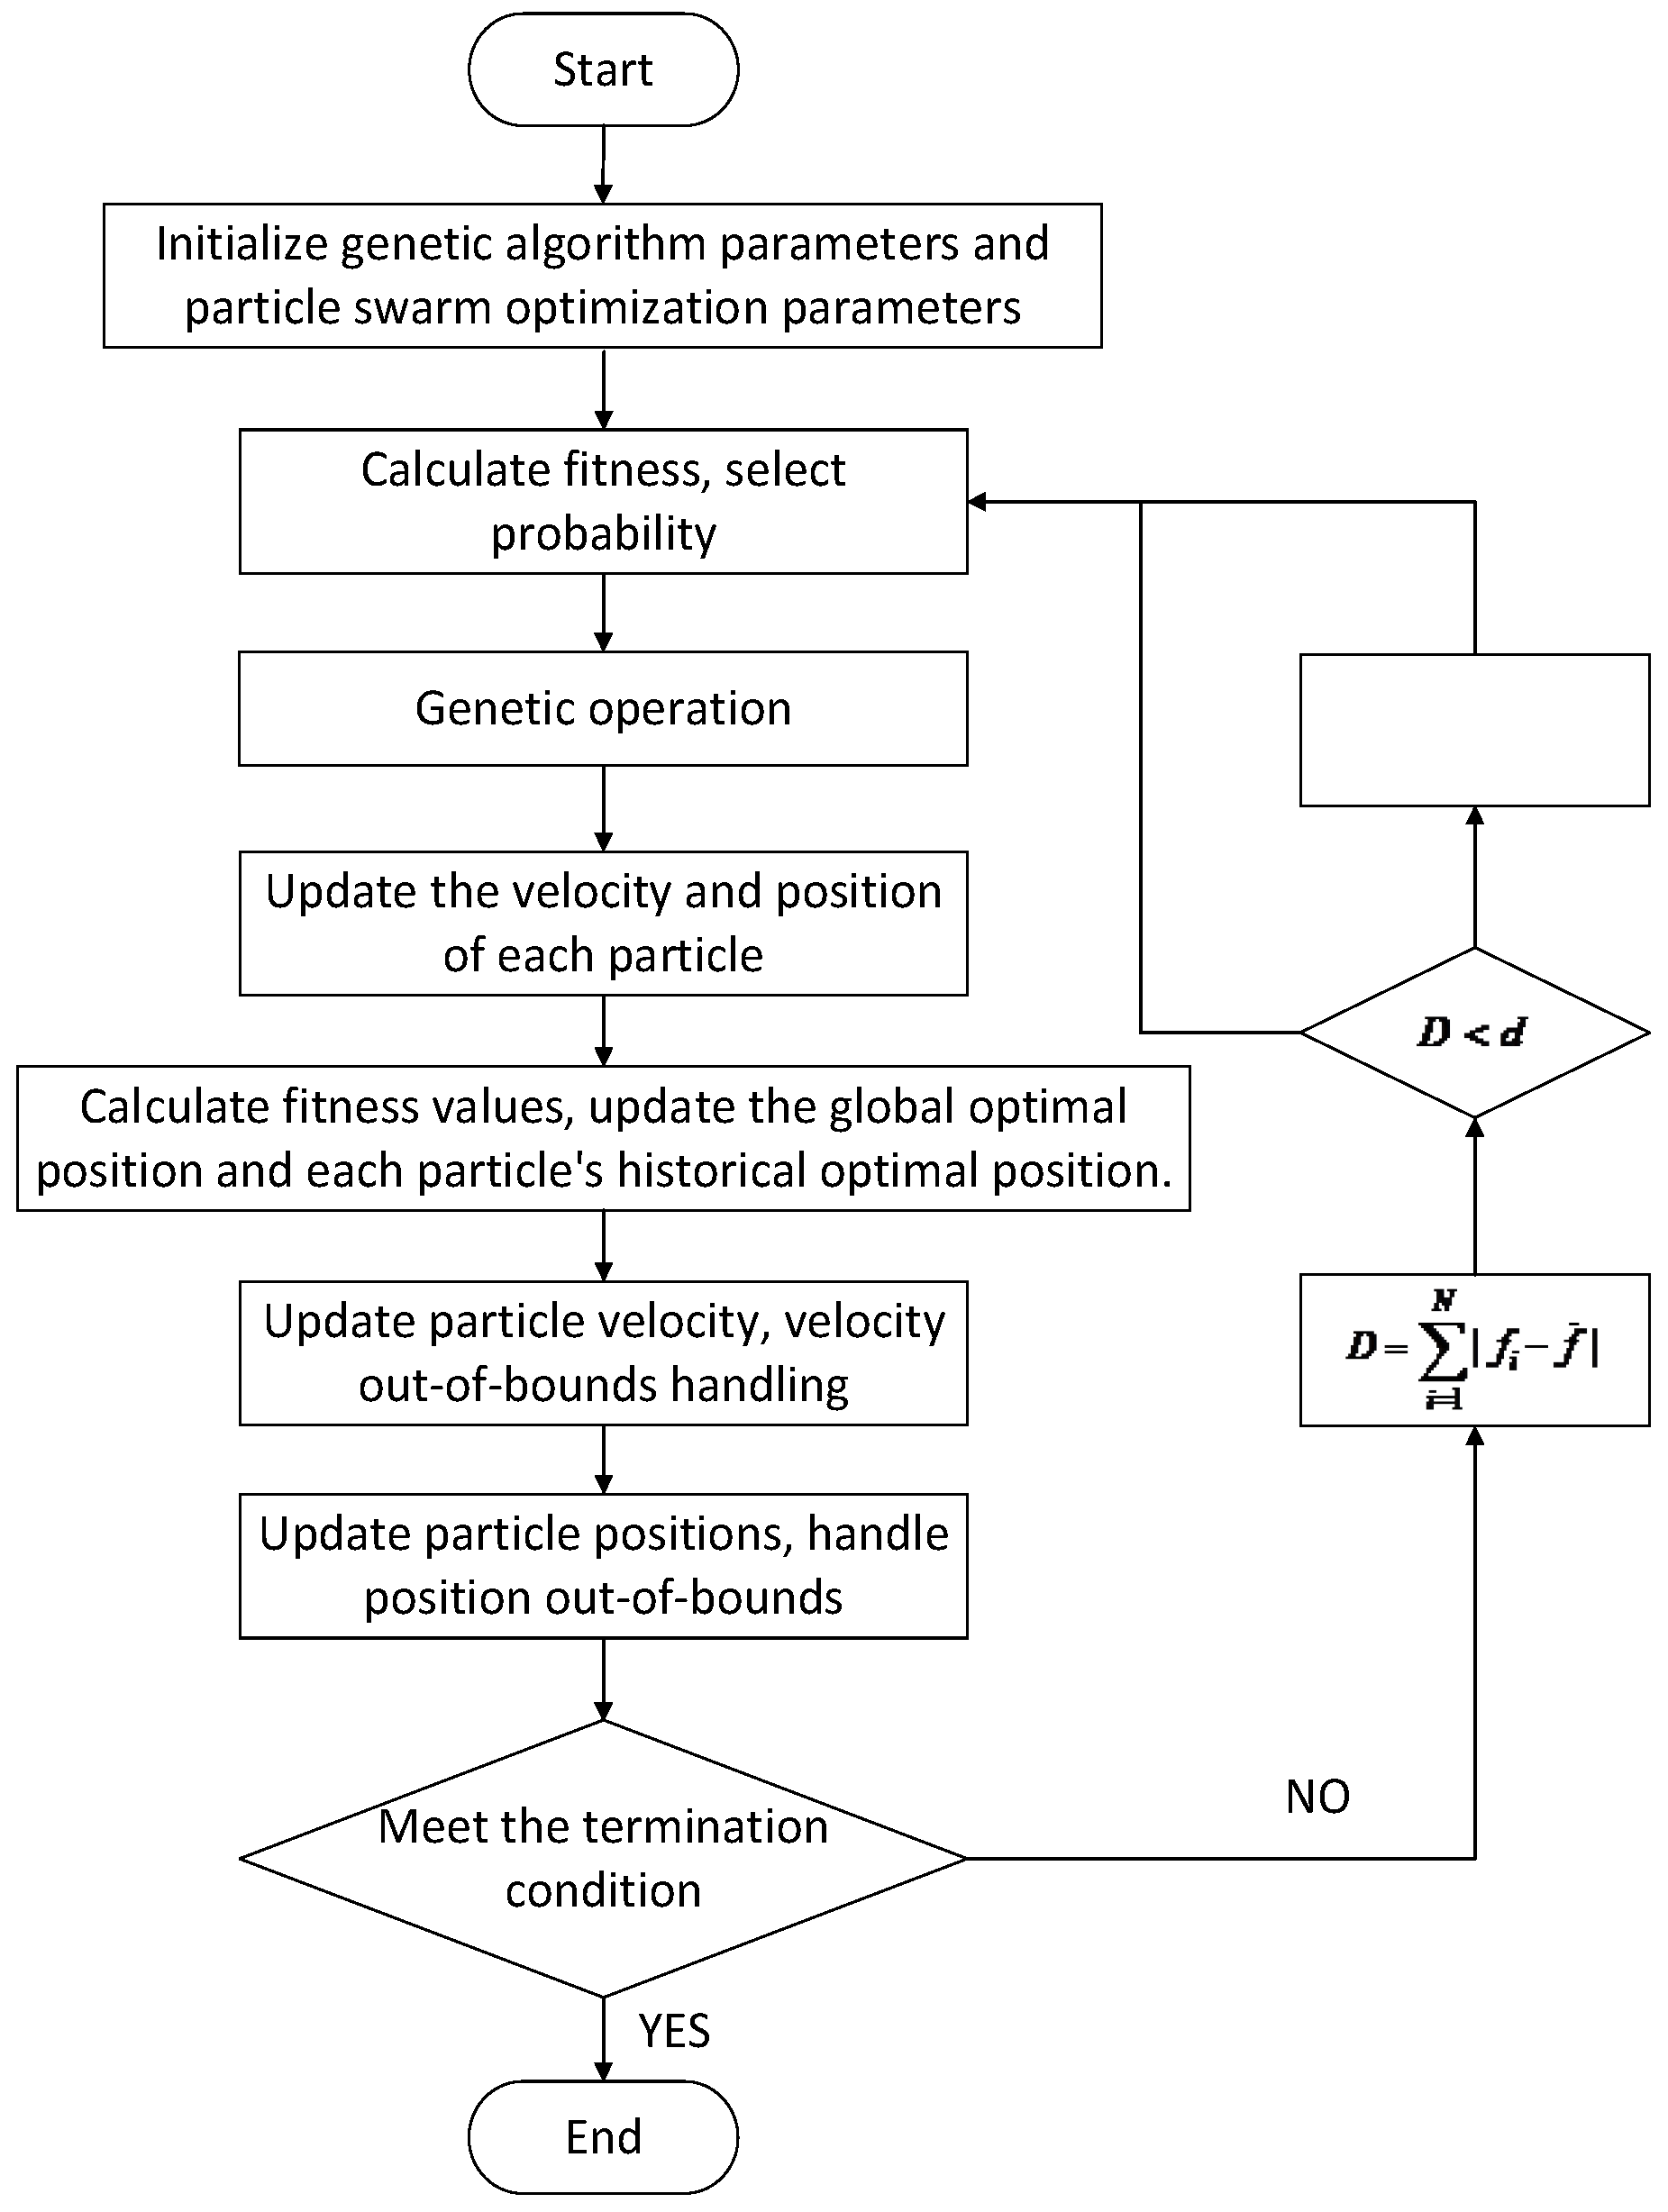
Figure 1. Flowchart of the improved GA algorithm.
Electronics 14 03977 g001
Figure 2. Test results for testing function.
Electronics 14 03977 g002aElectronics 14 03977 g002b
Figure 3. Site Selection Results for Communication Base Stations.
Electronics 14 03977 g003
Figure 4. Fitness Convergence Curve.
Electronics 14 03977 g004
Figure 5. Comparison chart of convergence performance.
Electronics 14 03977 g005
Figure 6. Comparison of fitness curves with other algorithms. The other two algorithms are from Yang, L.; et al., 2023 [13] and Wu, Y.; et al., 2023 [14].
Electronics 14 03977 g006
Figure 7. Comparison chart of convergence performance.
Electronics 14 03977 g007
Figure 8. Comparison of metrics under different weightings.
Electronics 14 03977 g008
Figure 9. Comparison of metrics under different coverage radius.
Electronics 14 03977 g009
Figure 10. Comparison of convergence at different immigration rate.
Electronics 14 03977 g010
Figure 11. Comparison of Convergence at Different Scales.
Electronics 14 03977 g011
Table 1. Testing functions.
Testing FunctionFunction ExpressionDimensionalityValue RangeOptimum ValueError Target
Sphere f ( x ) = i = 1 n x i 2 30[−100, 100]n010−2
Rosenbrock f ( x ) = i = 1 n 1 [ 100 ( x i + 1 x i 2 ) + ( x i 1 ) ] 30[−30, 30]n010−2
Rastrigin f ( x ) = i = 1 n [ x i 2 10 cos ( 2 π x i ) + 10 ] 30[−5.12, 5.12]n010−2
Table 2. Experimental parameters.
Algorithm Basic ParametersPopulation size100
Number of iterations100
Base Station ParametersNumber of Candidate Base Stations30
Number of User Demand Points50
Coverage Radius15
Minimum Distance10
Maximum Number of Base Stations10
Base Station ParametersAdaptive Crossover Probability Base Value0.8
Adaptive Mutation Probability Base Value0.05
Particle Swarm Inertia Weight0.8
Migration Ratio0.1
Maximum particle velocity0.5
Model Target ParametersCost Weight α0.3
Coverage Weight β0.5
Disturbance Weight γ0.2
Table 3. The parameters for each algorithm.
AlgorithmParametersValue
GAPopulation size100
Crossover probability0.8
Mutation probability0.05
PSOPopulation size100
Inertial weight0.8
Cognitive factor (c1)2.0
Social factor (c2)2.0
SAInitial temperature1000
Cooling rate0.95
Long Markov chain100
Termination temperature10−5
Table 4. Comparison of Various Indicators.
AlgorithmCoverage ContributionConstruction Cost (104 CNY)Interference Cost (Dimensionless)Number of Selected
Base Stations
IGA147.264674.0306
GA147.176703.96506
SA146.635742.6907
PSO143.942996.77808
Table 5. Comparison of Various Indicators.
AlgorithmCoverage ContributionConstruction Cost (104 CNY)Interference Cost (Dimensionless)Number of Selected
Base Stations
IGA147.201647.27106
Reference [13]147.153647.16506
Reference [14]146.012691.84207
Table 6. Changes in Target Weight.
Objective WeightParameter Variation
Cost Weight0.3 → 0.2 → 0.5
Coverage Weight0.5 → 0.3 → 0.2
Interference Weight0.2 → 0.5 → 0.3
Disclaimer/Publisher’s Note: The statements, opinions and data contained in all publications are solely those of the individual author(s) and contributor(s) and not of MDPI and/or the editor(s). MDPI and/or the editor(s) disclaim responsibility for any injury to people or property resulting from any ideas, methods, instructions or products referred to in the content.