Article

Estimating Word Lengths for Fixed-Point DSP Implementations Using Polynomial Chaos Expansions

Department of Electrical and Computer Engineering, McMaster University, Hamilton, ON L8S 4L8, Canada
*
Author to whom correspondence should be addressed.
Electronics 2025, 14(2), 365; https://doi.org/10.3390/electronics14020365
Submission received: 14 November 2024 / Revised: 11 January 2025 / Accepted: 13 January 2025 / Published: 17 January 2025

Abstract

:
Efficient custom hardware motivates the use of fixed-point arithmetic in the implementation of digital signal-processing (DSP) algorithms. This conversion to finite precision arithmetic introduces quantization noise in the system, which affects the system’s performance. As a result, characterizing quantization noise and its effects within a DSP system is a challenge that must be addressed to avoid over-allocating hardware resources during implementation. Polynomial chaos expansion (PCE) is a method used to model uncertainty in engineering systems. Although it has been employed to analyze quantization effects in DSP systems, previous investigations have been limited in scope and scale. This paper introduces new techniques that allow the application of PCE to be scaled up to larger DSP blocks with many noise sources, as needed for building blocks in software-defined radios (SDRs). Design space exploration algorithms that leverage the accuracy of PCE to estimate bit widths for fixed-point implementations of DSP blocks in an SDR system are explored, and their advantages will be presented.

1. Introduction

Digital signal-processing (DSP) systems often require fixed-point implementations of signal-processing algorithms to satisfy increasingly stringent power, performance, and area requirements [1]. However, the conversion to fixed-point introduces quantization noise, which degrades performance. As a result, a significant portion of the development time for DSP systems is spent on fixed-point conversion and managing this quantization noise [2,3].
Software-defined radio (SDRs) is an emerging communications platform that serves as a good testbed for fixed-point DSP implementations, given the strict performance requirements imposed by modern communication protocols [4]. In this paper, we explore a method to estimate the word lengths of signals within an SDR system using polynomial chaos expansions (PCEs) [5].
Advances in digital computing have resulted in many traditional signal-processing operations (performed using analog components) being moved into the realm of digital operations in a digital system. These digital systems are referred to as SDRs. Additionally, new algorithms have been developed that exploit the nature of discrete digital signals in order to extract significantly more information from a received signal [6]. However, the wide variety of wireless communication standards available has given rise to a new kind of challenge. Each wireless system requires its own digital system architecture with a highly specific mix of analog and digital components required to implement it. With the gradual slowing of Moore’s Law [7], it is becoming harder to justify single-use dedicated digital systems. Additionally, developing digital radio integrated circuits for every new wireless standard is vastly expensive and time-consuming [8]. Therefore, digital systems that are flexible and reconfigurable are being sought after.
An SDR is a digital system capable of reconfiguring its hardware resources to perform a different set of signal-processing operations from those for which it was initially configured. In doing so, the same SDR hardware is capable of supporting multiple sets of wireless standards. HackRF is an example of an amateur SDR. With a simple software update, HackRF can change its operation from being a GPS receiver [9] to an FM receiver [10].
Additionally, a commercial grade SDR, such as the Universal Software Radio Peripheral (USRP) B210, can operate as an entire base transceiver station (BTS) through the OpenBTS standard [11]. This significantly reduces the cost of bringing Global System for Mobile Communication (GSM) cellular networks to remote regions and underdeveloped regions. In [12], such an experiment was performed to successfully bring GSM access to rural Zambia, with some performance and logistic constraints. Another experiment was performed in [13], where early warning systems were introduced to a rural Colombian coffee plantation by using a USRP device along with OpenBTS to provide support for existing early warning systems.
This paper demonstrates how SDR implementations can be more efficient by converting floating-point designs [14] to fixed-point designs [15]. In particular, we present methods that characterize these quantization errors, as well as algorithms and techniques that demonstrate a good trade-off between quantization effects and resource usage. In Section 2, related work on the importance of modeling quantization effects is presented as well as current methods to do so. In Section 3, a review of the fundamentals of PCE is presented for the sake of completeness. Section 4 describes the methods used for applying PCE to model DSP systems. Section 6 presents some design space exploration algorithms that achieve a good trade-off between quantization effects and resource usage. Lastly, Section 8 quantitatively shows how PCE outperforms currently used methods as well as results on estimating word lengths using PCE.

2. Related Work

Field programmable gate arrays (FPGAs) and DSP processors can be utilized to meet latency and throughput requirements. The difference between FPGAs and DSP processors mainly comes down to the level of flexibility required to implement a design. FPGAs give the designer an unparalleled level of flexibility to fine-tune the design, but there will be some significant development time. To alleviate this issue, tools such as the HDL Coder by MathWorks exist to generate synthesizable hardware description language (HDL) code from MATLAB functions and Simulink models [16].
In addition to the platform itself, a designer needs to decide between using floating-point and fixed-point arithmetic [15]. In order to represent the infinite precision of real numbers using the finite precision of digital values, floating-point or fixed-point numbers need to be used. Fixed-point numbers have the radix point set at a fixed location; in other words, they have a set number of decimal points. Floating-point numbers set the radix point according to the number itself. For example, representing a large number using a floating-point format would require more bits to be allocated to the integer part of the number instead of the fractional part. On the other hand, representing a small number with the same number of bits would allocate more bits to the fractional part available. As a result, floating-point numbers represent large numbers with low precision and small numbers with high precision. Due to a variable radix point in floating-point numbers, the arithmetic requires more hardware resources and computation time. In [17], the authors showed a performance improvement of 27.17% when using a fixed-point unit, even with a hardened floating-point unit on an Intel Arria 10 FPGA. As a result, a trade-off exists where a designer needs to decide between being able to represent calculations accurately or quickly.

2.1. Quantization Effects

Quantization effects arise when attempting to represent infinite precision real-world signals with finite precision representations in the digital domain. The quantization noise is the difference between the real signal and the quantized signal. This noise depends on how the quantization itself is performed. To quantize a real signal, the signal is multiplied by a scale factor and then either rounded or truncated to a set number of bits. This truncation can occur by simply discarding the fractional portion after multiplication, or by considering the fractional portion and rounding the number to the closest representable value [18]. Rounding quantizers generate less quantization noise than truncating quantizers, but this comes at the cost of increased resource requirements.
Quantization noise and round-off noise propagate through a signal-processing system and significantly affect the maximum possible system performance [19]. As a result, these quantization effects need to be modeled as they propagate through an SDR signal-processing chain to ensure the radio system can operate according to its specifications.

2.2. Importance of Modeling Quantization Effects

Quantization effects in linear time-invariant (LTI) systems, such as finite impulse response (FIR) filters, Fourier transforms, etc., have been part of an active and long-standing area of research. This is largely motivated by the fact that implementing a design within a fixed-point implementation is reported to take up to 25% to 50% of the total design time [2,3]. A lot of this research has been in modeling or reducing the quantization effects for a particular block in a DSP system.
Due to the abundance of digital filters in a DSP system, quantization noise modeling for filters is a recurring topic [20,21,22,23,24]. Within a fixed-point implementation of a digital filter, the three sources of quantization error are due to the following:
  • Errors arising from representing infinite-precision filter coefficients with finite-precision coefficients.
  • Round-off errors due to the multiplication of two fixed-point numbers being quantized into fewer bits than required.
  • The quantization of the input signal into discrete levels.
In [25], the effects of coefficient quantization are shown. A 44th-order low-pass FIR filter was designed using the Parks–McClellan algorithm [26] with a cutoff of π / 4 . The resulting double-precision floating-point numbers are quantized to 16 and 12 bits. The original filter had a stop band attenuation of −92 dB. After quantizing into 16 bits, the resulting filter had an attenuation of −83 dB, showing a 9 dB loss in attenuation. When the original filter was quantized into 12 bits, the effect was even more pronounced, and the attenuation was about −60 dB, showing a 32 dB loss in attenuation. From this, the importance of choosing the correct fixed-point configuration for all the signals in the DSP system is highlighted, motivating the need for a framework that can provide an accurate estimation of quantization effects.

2.3. Current Methods in Modeling Quantization Effects

Quantization noise modeling can be performed using a simulation-based approach, an analytical approach, or a combination of both [27]. Traditionally quantization noise effects have been modeled by a very large number of Monte Carlo (MC) simulations. These simulations compare the difference in statistics between an unquantized floating-point signal and a quantized signal. Such an approach is prohibitively expensive both from a time and computational perspective for large SDR systems [19]. Additionally, this approach does not allow for optimizing bit widths to minimize the round-off effects.
The analytical approach involves developing a mathematical model to understand how signal-processing operations impact the statistics of round-off noise at each node in the signal-processing chain. In [28], a noise analysis of a phase-locked loop (PLL) was demonstrated using stochastic differential equations in the presence of white noise sources. It was shown that this approach yields results that cannot be estimated by a traditional linear analysis. The downside to such an approach is that it is a tedious process that is highly problem-specific.
In [29], a computational method based on the satisfiability modulo theory (SMT) was presented, which captures a calculation as a set of constraints. In doing so, an SMT solver can present meaningful bounds on the calculation. This work can be applied here by setting a noise threshold at the nodes in the signal-processing graph and then using the SMT solver to check if an equation for the noise at that node exceeds the set threshold. Results from the solver could be a part of an optimization process to find a set of bit widths that minimize quantization effects. However, this approach is not applicable when there are feedback loops involved. Due to the number of simulation time steps required for the feedback loops to converge, the state space of the SMT solver would blow up to a scale that cannot be solved in a reasonable amount of time.
Another approach is to bind the limits of quantization noise and propagate the bounds through a data flow graph (DFG). Interval arithmetic (IA) can be used to write an expression for the noise range [30]. As an example, consider a measurement that has a value of 21 and an uncertainty in measurements of ±3. In the IA notation, this value would be represented as [18, 24]. The issue with using IA is the so-called dependency problem. To illustrate this issue, consider that there exists a value x = [−1, 1]. We would like to define a new value y = x x . According to the rules of IA, [ a , b ] [ c , d ] = [ a d , b c ] . This implies that y = [ 1 , 1 ] [ 1 , 1 ] = [ 2 , + 2 ] . Although the answer is obviously y = 0 , IA has a bound that is twice that of the input bounds. This overestimation can propagate through computations until the final error bounds are so large they lose all information about the dependencies in the graph.
To resolve the dependency problem, affine arithmetic (AA) is proposed as a solution. In AA, a quantity, x, is represented as x ^ = x 0 + x 1 ϵ 1 + + x n ϵ n , with ϵ i [ 1 , + 1 ] . Here, x 0 denotes the central value and x i , , x n denote partial deviations, and ϵ i , , ϵ n denote noise symbols [30]. A measurement of 21 with an uncertainty of ±3 would be represented in AA as 21 + 3 ϵ 1 . Under the rules of AA, the dependency problem is resolved, and y = x x yields y = 0 . AA is often used for bit width estimation, such as in [31,32,33].
Reference [27] provided a starting point for this paper. Here, an approach was proposed where round-off noise was modeled using AA and propagated through a DFG. Each quantizer in the DFG was modeled as a uniform noise source with a specific mean and variance. The bounds of the uniform distribution were determined from the mean and variance, and, an AA representation of the bounds was propagated through the DFG.
Most of the current methods used in estimating bit widths have used either AA, IA, or MC methods to model the quantization noise. Due to the inability of AA and IA to represent non-linear operations accurately, this results in a significant overestimation of the bit width required. On the other hand, with MC techniques, it is possible to accurately represent quantization noise, but this comes at a significant cost in the number of operations required to run a simulation. In Section 8, it is shown that PCE can provide a comparable level of accuracy to MC, but at a much lower number of operations. While PCE has been used in the literature to explore the trade-off between the signal-to-noise ratio (SNR) and bit widths [34], it has been done from the perspective of modeling overflow errors. In this paper, we focus on modeling quantization noise as it arises from round-off errors and its propagation in fixed-point arithmetic.

3. Elementary Operations Using PCE

Converting floating-point architecture into fixed-point architecture introduces quantization noise; properties of the quantization noise can be captured using statistical distributions. PCE is then used to represent the distributions and model the interactions between different quantization noise sources within a system. In this section, a review of the fundamentals behind PCE is presented, which is also available in the literature and replicated here for the sake of completeness.

3.1. Probability Distribution of Quantization Noise

Quantization noise occurs whenever a signal requiring a certain level of precision is represented using a number system with lower precision. This can happen when a real-world input signal with infinite precision is quantized into a fixed-point representation with finite precision. Additionally, quantization noise can also take the form of round-off noise, where the result of an arithmetic operation is rounded off to the closest representable value. For example, round-off noise can arise when the multiplication of two n-bit signals is quantized and stored in another n-bit register instead of in a 2 n -bit register.
In [27], it was shown that quantization noise can be modeled using a random variable with a uniform probability distribution. The statistics of the uniform noise source depend on the type of quantizer used. Quantizers can either use rounding or truncation to approximate a signal. Assume that x is a real-valued input that is quantized to Q bits to produce the fixed-point number x Q . A rounding quantizer uses Equation (1) to round the input to the nearest integer, while a truncation quantizer uses Equation (2) to truncate the input to an integer. Note that · represents the floor function. The truncation quantizer is the simplest to implement, however, it introduces a bias to the result, whereas the rounding quantizer requires more hardware resources but introduces no bias.
x Q = round ( x · 2 Q )
x Q = x · 2 Q
According to [27], the mean and variance of the quantization noise for a truncation quantizer are given by Equations (3) and (4), while those for a rounding quantizer are given by Equations (5) and (6). In these equations, f w denotes the number of bits required to represent a signal without any loss of precision, and f w Q denotes the number of bits chosen to represent the signal, as follows:
m trunc = 1 2 2 f w Q 2 f w
σ 2 trunc = 1 12 2 2 f w Q 2 2 f w
m r o u n d = 0
σ 2 trunc = 1 12 2 2 f w Q 2 2 f w + 1
Using the mean and the variance, it is possible to find the interval for the uniform distribution [ a , b ] according to Equations (7) and (8). Note that for Equations (7) and (8), m trunc or m r o u n d is used in place of m, and σ 2 t r u n c or σ 2 r o u n d is used in place of σ 2 , depending on whether a rounding or truncation quantizer is used:
a = m 3 σ 2
b = m + 3 σ 2
As an example, consider 100,000 samples taken from a Uniform[0, 1) distribution, also denoted as a U [ 0 , 1 ) distribution. Here, the floating-point samples can be considered infinite-precision; thus, f w = . This signal is then quantized into four bits. If a truncation quantizer is used, then according to Equations (3), (4), (7), and (8), the noise distribution is U [ 0.0625 , 0 ] . The results are shown in Figure 1. The red line represents the predicted distribution while the blue bars show the histogram from the MC simulation.

3.2. Polynomial Chaos Expansion (PCE)

PCE is a spectral projection method in which a random variable is decomposed into a sum of orthogonal polynomial basis functions of additional random variables. The maximum degree of a polynomial within the basis set is denoted by d. One way to think about PCE is as a Fourier analysis for random variables [35]. If the random variable, z, is square-integrable, i.e., E [ | z | 2 ] is finite, then the random variable can be decomposed via PCE over a set of basis functions [34]. Also, if the random variable being decomposed is smooth, the error in the expansion exponentially decays to zero with the addition of more terms in the decomposed function [5]:
z = i = 1 z i P i ζ 1 , ζ 2 , , ζ n
The idea behind PCE is shown using Equation (9). Here, the random variable z is decomposed into PCE coefficients, z i , and the orthogonal PCE basis functions, P i ζ 1 , , ζ n . Here, ζ 1 through ζ n is an independent standard random variable. The distribution choice for ζ n depends on how z is distributed. If z is uniformly distributed, it would make sense for ζ n to also denote a standard uniform distribution. On the other hand, z might be a random variable modeling a more complicated distribution, in which case, it might work better to have each ζ n have different distributions. The ζ distribution choice influences how the polynomials, P i , are constructed:
z i = 1 m z i P i ζ 1 , ζ 2 , , ζ n
m = d + 1
Equation (9) shows that in order to decompose a random variable, an infinite set of polynomial basis functions needs to be constructed. The goal is to simulate a system using PCE via a computer program; thus, an infinite set of coefficients and polynomials is not possible to keep track of. As a result, the maximum number of polynomials is truncated to m in Equation (10). This comes at a cost of a loss in accuracy between the original distribution z, and its PCE representation. The number of polynomials, m, can be related to the degree of the polynomial, d, according to Equation (11). The accuracy of the system model increases as d increases:
z = i = 1 z i P i ζ
As an example, assume that z is a uniform distribution, i.e., z U [ a , b ] . Thus, z can be decomposed into one random variable with a uniform distribution, i.e., ζ U [ 1 , 1 ] . This is represented in Equation (12). Now, a basis set of orthogonal polynomials is required to support ζ . Many systems of orthogonal polynomials exist, and the issue arises on which set to choose. In [36], polynomial chaos expansions were generalized to accommodate various types of probability distributions, and it was proven which orthogonal polynomial systems correspond to specific random variables. This is reproduced in Table 1. For this simple example, Table 1 shows that the Legendre system of orthogonal polynomials should be selected in order to support ζ since ζ is uniformly distributed.

3.3. Non-Standard Distributions

So far, all the distributions are assumed to be standard, i.e., U [ 1 , 1 ] or N ( 0 , 1 ) . As described in Section 3.1, the uniform distribution modeling the statistics of quantization noise has a support that is defined using Equations (7) and (8), rather than over the interval [ 1 , 1 ] . The construction of Legendre polynomials ensures orthogonality over the support [ 1 , 1 ] , but not over a smaller subset as required for the quantization noise model. Similarly, Hermite polynomials are orthogonal for a standard normal distribution, but not for distributions that have a different mean and/or variance. As a result, the construction of polynomials needs to be modified to represent non-standard distributions.
According to [5], a random variable, such as x U [ a , b ] , can be mapped to a standard uniform random variable, ζ , using Equation (13):
x = a + b 2 + b a 2 ζ
Equation (13) implies that a non-standard uniform random variable, x U [ a , b ] , can still be supported by a basis set of standard uniform random variables via a change in PCE coefficients, as shown in Equation (14).
x = i = 1 x i P i ζ , x i = a + b 2 , if i = 0 b a 2 , if i = 1 0 otherwise
Similarly, the authors of [5] show that a non-standard normal random variable, x N ( μ , σ 2 ) , can be mapped to a standard normal random variable, ζ , using Equation (15):
x = μ + σ ζ
Like in the case of the non-standard uniform distribution, a non-standard normal random variable, x N ( 0 , 1 ) , can still be supported by a basis set of standard normal random variables via a change in PCE coefficients, as shown in Equation (16):
x = i = 1 x i P i ζ , x i = μ , if i = 0 σ 2 , if i = 1 0 otherwise

3.4. Multivariate Basis Polynomials

To decompose an input random variable (z) into multiple random variables ( ζ 1 , ζ 2 , ), a multivariate basis set of polynomials needs to be constructed. This is done by taking the tensor product of the individual polynomial sets. Each random variable is supported by its own basis set of polynomials up to a degree, d. The tensor product is obtained by conducting an element-by-element multiplication of the two sets. Note that the sizes of the two basis sets do not have to be equal. In order words, one random variable can be supported using a polynomial basis set of up to degree 3, while another random variable can be supported using a set of up to degree 4, and the multivariate basis set can still be calculated.
As an example, consider two standard uniform random variables: ζ 1 and ζ 2 . Each random variable is represented using its polynomial basis set, limited up to degree d = 2 . For ζ 1 , this is set A, as shown in Equation (17), and for ζ 2 , this is set B, as shown in Equation (18).
A = 1 , ζ 1 , 1 2 3 ζ 1 2 1
B = 1 , ζ 2 , 1 2 3 ζ 2 2 1
To capture the interactions between these two random variables, the multivariate Legendre polynomials basis set P is constructed according to Equation (19). Here, ⊗ represents the tensor product operator, as follows:
P = A B
The resulting polynomials are as follows:
P 0 = 1 · 1 P 1 = 1 · ζ 2 P 2 = 1 · 1 2 3 ζ 2 2 1 P 3 = ζ 1 · 1 P 4 = ζ 1 · ζ 2 P 5 = ζ 1 · 1 2 3 ζ 2 2 1 P 6 = 1 2 3 ζ 1 2 1 · 1 P 7 = 1 2 3 ζ 1 2 1 · ζ 2 P 8 = 1 2 3 ζ 1 2 1 · 1 2 3 ζ 2 2 1
In this example, the maximum degree was chosen to be 2. As a result, P 5 , P 7 , and P 8 are discarded. The final basis polynomial set is given in Equation (20), as follows:
P = P 0 ( ζ 1 , ζ 2 ) = 1 , P 1 ( ζ 1 , ζ 2 ) = ζ 2 , P 2 ( ζ 1 , ζ 2 ) = 1 2 3 ζ 2 2 1 , P 3 ( ζ 1 , ζ 2 ) = ζ 1 , P 4 ( ζ 1 , ζ 2 ) = ζ 1 · ζ 2 , P 5 ( ζ 1 , ζ 2 ) = 1 2 3 ζ 1 2 1
Constraining the maximum degree to a fixed value allows for a finite polynomial basis set. The error in the expansion decays exponentially with more basis functions [5] when the underlying distribution is smooth. However, the computational complexity increases as the number of polynomial basis functions increases. For the systems analyzed in this work, a second-order expansion is sufficient.
The total number of polynomials for n random variables represented by polynomials up to degree d is given by Equation (21). Note that the m in Equation (21) refers to the m in Equation (10). Lastly, Equation (21) shows one of the main drawbacks of this method, in that, the method suffers from the curse of dimensionality as the number of random variables increases:
m = ( n + d ) ! n ! · d ! 1
This method also extends to cases where the random variables follow different distributions. For example, consider the two random variables: ζ 1 U [ 1 , 1 ] and ζ 2 N ( 0 , 1 ) . The resulting basis polynomial set would be the tensor product of the respective Legendre and Hermite polynomial sets.

3.5. Elementary Operations on PCE

Polynomial chaos expansions offer a way to decompose a random variable into a set of coefficients and an associated basis polynomial set. The goal now is to understand how quantization noise, modeled as a probability distribution, is affected by elementary signal-processing operations. Therefore, it is now necessary to define how arithmetic operations are carried out on PCEs as they propagate through the elementary operations in a DSP system. The elementary operations that comprise DSP systems are listed as follows:
  • Scaling.
  • Addition/subtraction.
  • Multiplication.
  • Time delay.
For all the operations below, P i is a polynomial in P , and P is constructed as the tensor product between all the individual sets of basis polynomials, as described in the previous section.

3.5.1. Scaling

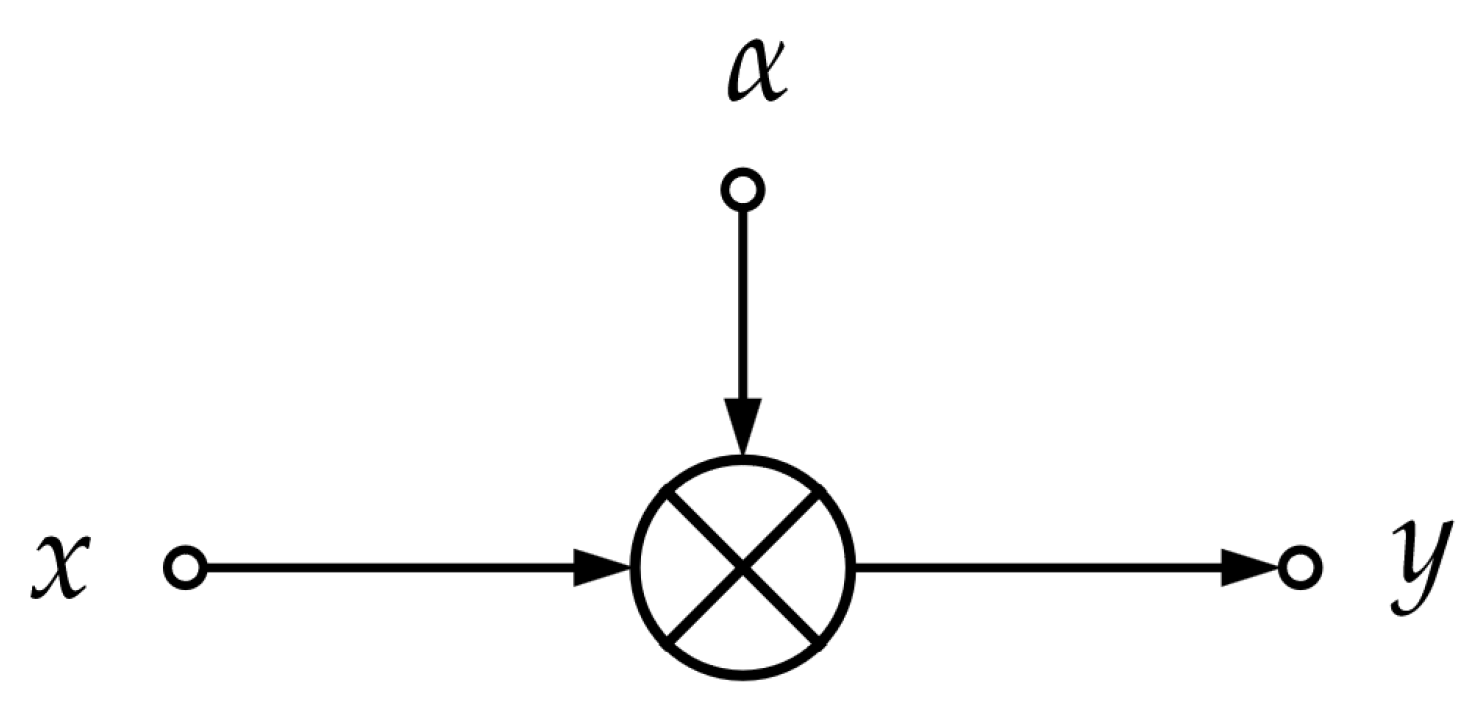
Figure 2 shows a scaling (multiplication by a constant) operation. Here, α is a constant, and x is given as follows:
x = i = 1 m x i · P i
The output y is calculated as follows:
y = i = 1 m y i · P i = α i = 1 m x i · P i = i = 1 m α x i · P i

3.5.2. Addition/Subtraction

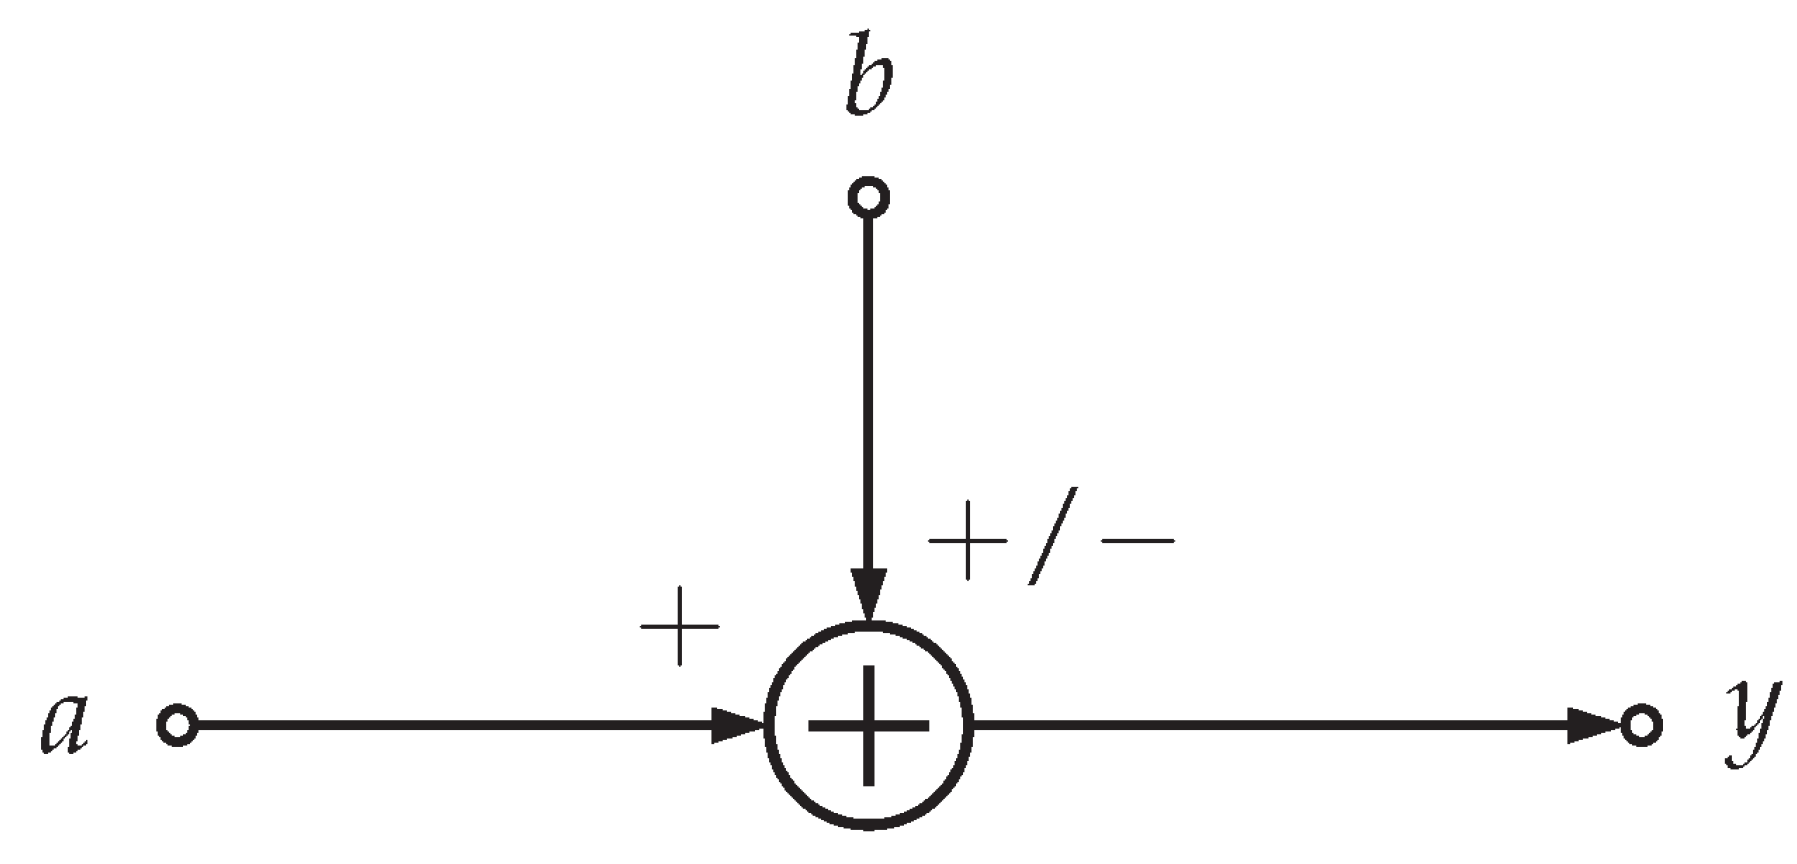
Figure 3 shows an addition/subtraction operation. Here, a and b are inputs to the node and are given by Equations (24) and (25), respectively.
a = i = 1 m a i · P i
b = i = 1 m b i · P i
The output y is then given by the following:
y = i = 1 m y i · P i = i = 1 m a i · P i ± i = 1 m b i · P i = i = 1 m a i ± b i · P i

3.5.3. Multiplication

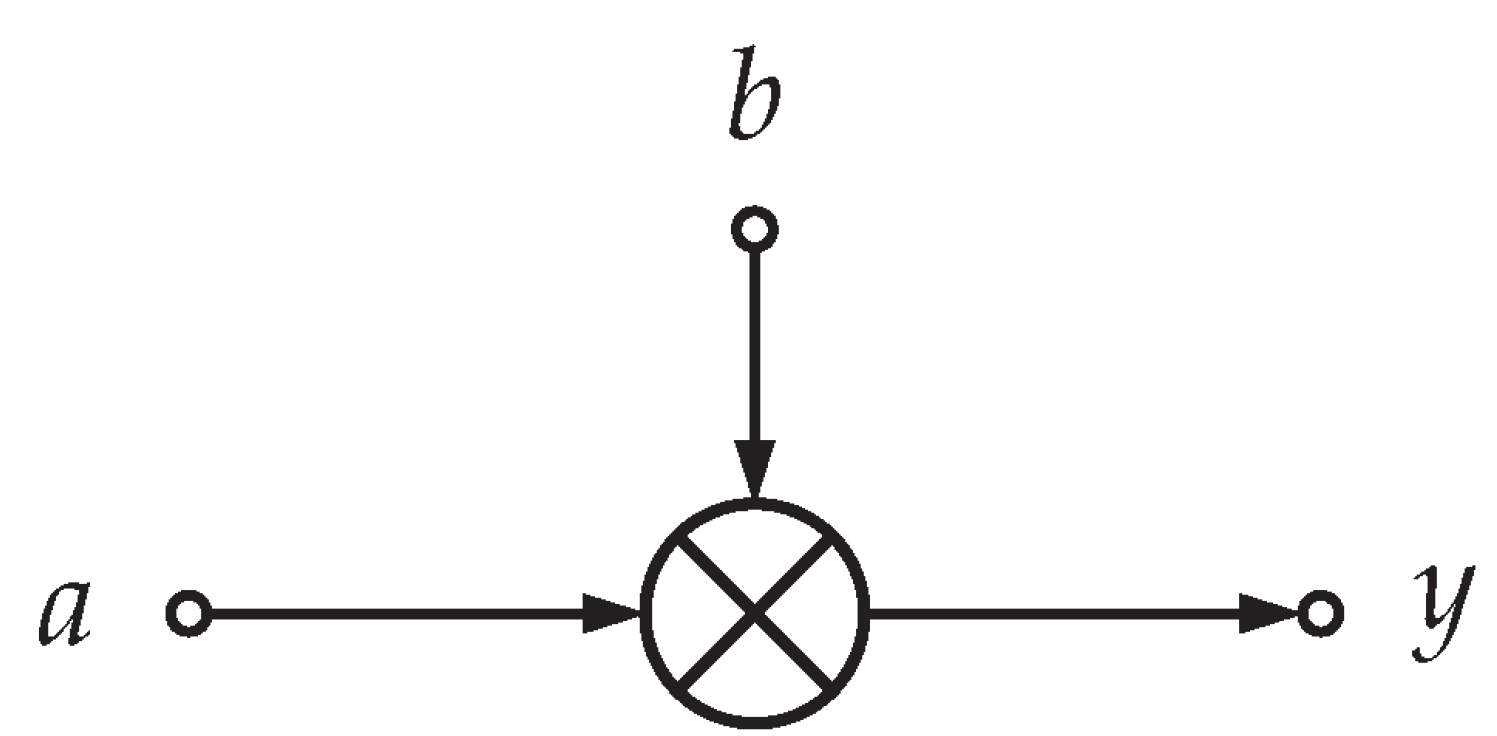
Multiplication of PCEs is more ‘involved’ compared to the other operations. Figure 4 shows a multiplication operation. Here, the objective is to find the coefficients y i of output y such that we have the following:
i = 1 m y i P i = j = 1 m a j P j · k = 1 m b k P k
According to [34], the coefficients of y i are given by Equation (28).
y i = 1 E P i 2 j , k a j b k E P i · P j · P k
Since all the polynomials ( P i , P j , P k ) are functions of independent random variables, the expectations in Equation (28) can be calculated quite easily. For a standard uniform random variable, ζ U [ 1 , 1 ] , the n-th raw moment is defined in Equation (29). Additionally, for a standard normal random variable, ζ U [ 1 , 1 ] , the n-th raw moment is defined in Equation (30) as follows:
E ζ n = ( 1 ) n + 1 2 ( n + 1 )
E ζ n = 0 if n is odd n ! 2 n 2 n ! if n is even
Due to the orthogonality of the Legendre polynomials, matrices containing these three-way expectations are quite sparse. The goal is to eventually be able to simulate larger systems using PCE. Once these expectation matrices are calculated, they can be reused for multiple simulations of the same system, as will be elaborated on in Section 5.

3.5.4. Time Delay

Time delay nodes (Figure 5) are found in many DSP systems, so it is necessary to show how PCE can be applied to a time delay operation.
For systems with time delays, PCEs can be calculated per simulation time step. The input x is written as follows:
x [ n ] = i = 1 m x i [ n ] · P i
For a delay of k steps, the output y is given as follows:
y [ n ] = x [ n k ] = i = 1 m x i [ n k ] · P i

4. PCE for DSP Blocks

DSP systems are composed of signal-processing blocks, which are, in turn, made of numerous elementary signal-processing operations. Previously, it was shown that PCE can be applied to capture how elementary signal-processing operations affect probability distributions of quantization noise. This section demonstrates how PCE can be applied to DSP systems using the following steps:
  • Represent the DSP block as a DFG.
  • Model the input signal to the DSP block using an array of PCE coefficients.
  • Propagate the PCE coefficient array through DFG.
  • Add quantization noise sources to DFG corresponding to a particular bit width configuration.
  • Propagate the signal-and-noise PCE coefficient arrays through DFG.
  • Remove the signal distribution at the output to obtain statistics on the noise distribution.

A Simple Example

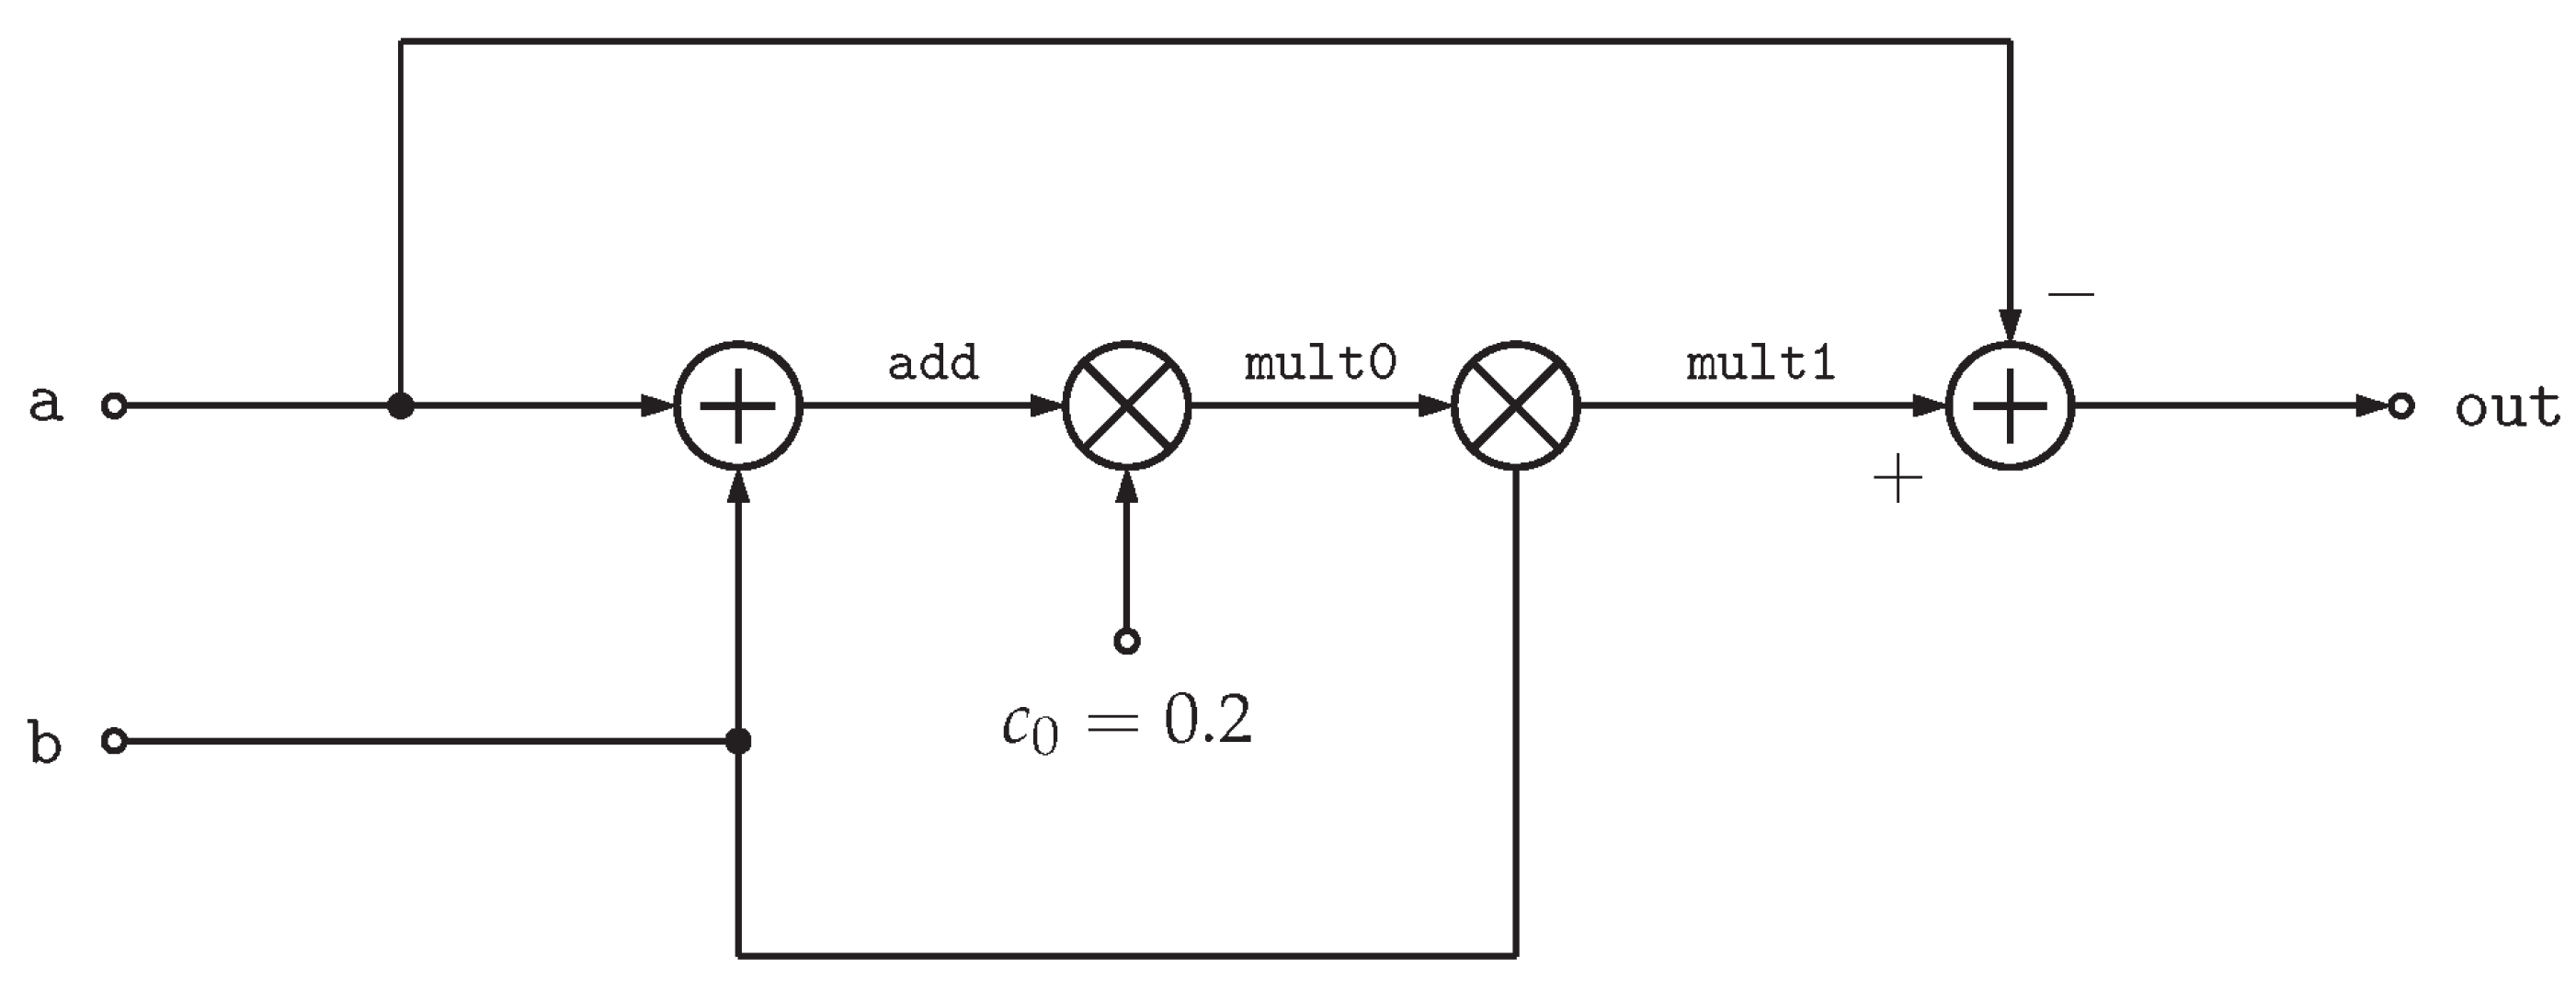
The purpose of this example is to show how applications of PCE can be extended from elementary signal operations to larger signal-processing blocks. Consider the DFG representation of a simple DSP block in Figure 6. The inputs to the system are signal a, which has a uniform distribution, and b, which has a normal distribution. Additionally, there is also a constant, c0, with a value of 0.2. The output is the signal out, and there are three intermediate signals (add, mult0, and mult1).
There are two inputs; the simulation was conducted with a max polynomial degree of 2. Equation (21) with n = 2 and d = 2 , shows that six polynomials are required to form the basis set for this system. Calculating the tensor product of the individual basis polynomial sets and discarding the polynomials that exceed the maximum polynomial degree of 2, the basis set in Equation (33) is obtained:
P = P 0 ( ζ 1 , ζ 2 ) = 1 , P 1 ( ζ 1 , ζ 2 ) = ζ 1 , P 2 ( ζ 1 , ζ 2 ) = ζ 2 , P 3 ( ζ 1 , ζ 2 ) = 1 2 3 ζ 1 2 1 , P 4 ( ζ 1 , ζ 2 ) = ζ 1 ζ 2 , P 5 ( ζ 1 , ζ 2 ) = ζ 2 2 1
Equation (14) is used to calculate the PCE coefficients for the two input signals, namely, a and b (shown in Equation (34) and (35)). (Note that, although the polynomial chaos expansion is only exact for an expansion with infinite terms, the “equals” sign (=) is still used instead of the approximation (≈) in all subsequent expansions for notations).
a = i = 0 5 a i P i = ( 1 ) P 0 + ( 4 ) P 1 + ( 0 ) P 2 + ( 0 ) P 3 + ( 0 ) P 4 + ( 0 ) P 5
b = i = 0 5 b i P i = ( 0 ) P 0 + ( 0 ) P 1 + ( 1 ) P 2 + ( 0 ) P 3 + ( 0 ) P 4 + ( 0 ) P 5
These PCE coefficients can be represented as an array of values, as shown in (36) and (37), respectively.
a = 1 4 0 0 0 0
b = 0 0 1 0 0 0
In the array form, the i-th element is the PCE coefficient for the i-th basis polynomial. Henceforth, the polynomial chaos expansion of a signal will be represented as an array of coefficients. The PCE representation of a signal is the dot product between the vector containing its PCE coefficients and the vector containing the basis functions.
With the basis set and the PCE of the two input signals, the distributions at each of the nodes within the DFG can be calculated according to Section 3.5. The PCE coefficients of each of the nodes are given in Table 2.
The second moment of the output, out, is calculated as shown in Equation (38). This value is the signal power at the output of the DFG.
o u t = 0.8 4 0.2 0 0.8 0.2 2 · E [ P 0 2 ] E [ P 1 2 ] E [ P 2 2 ] E [ P 3 2 ] E [ P 4 2 ] E [ P 5 2 ]
= 473 75 6.3067
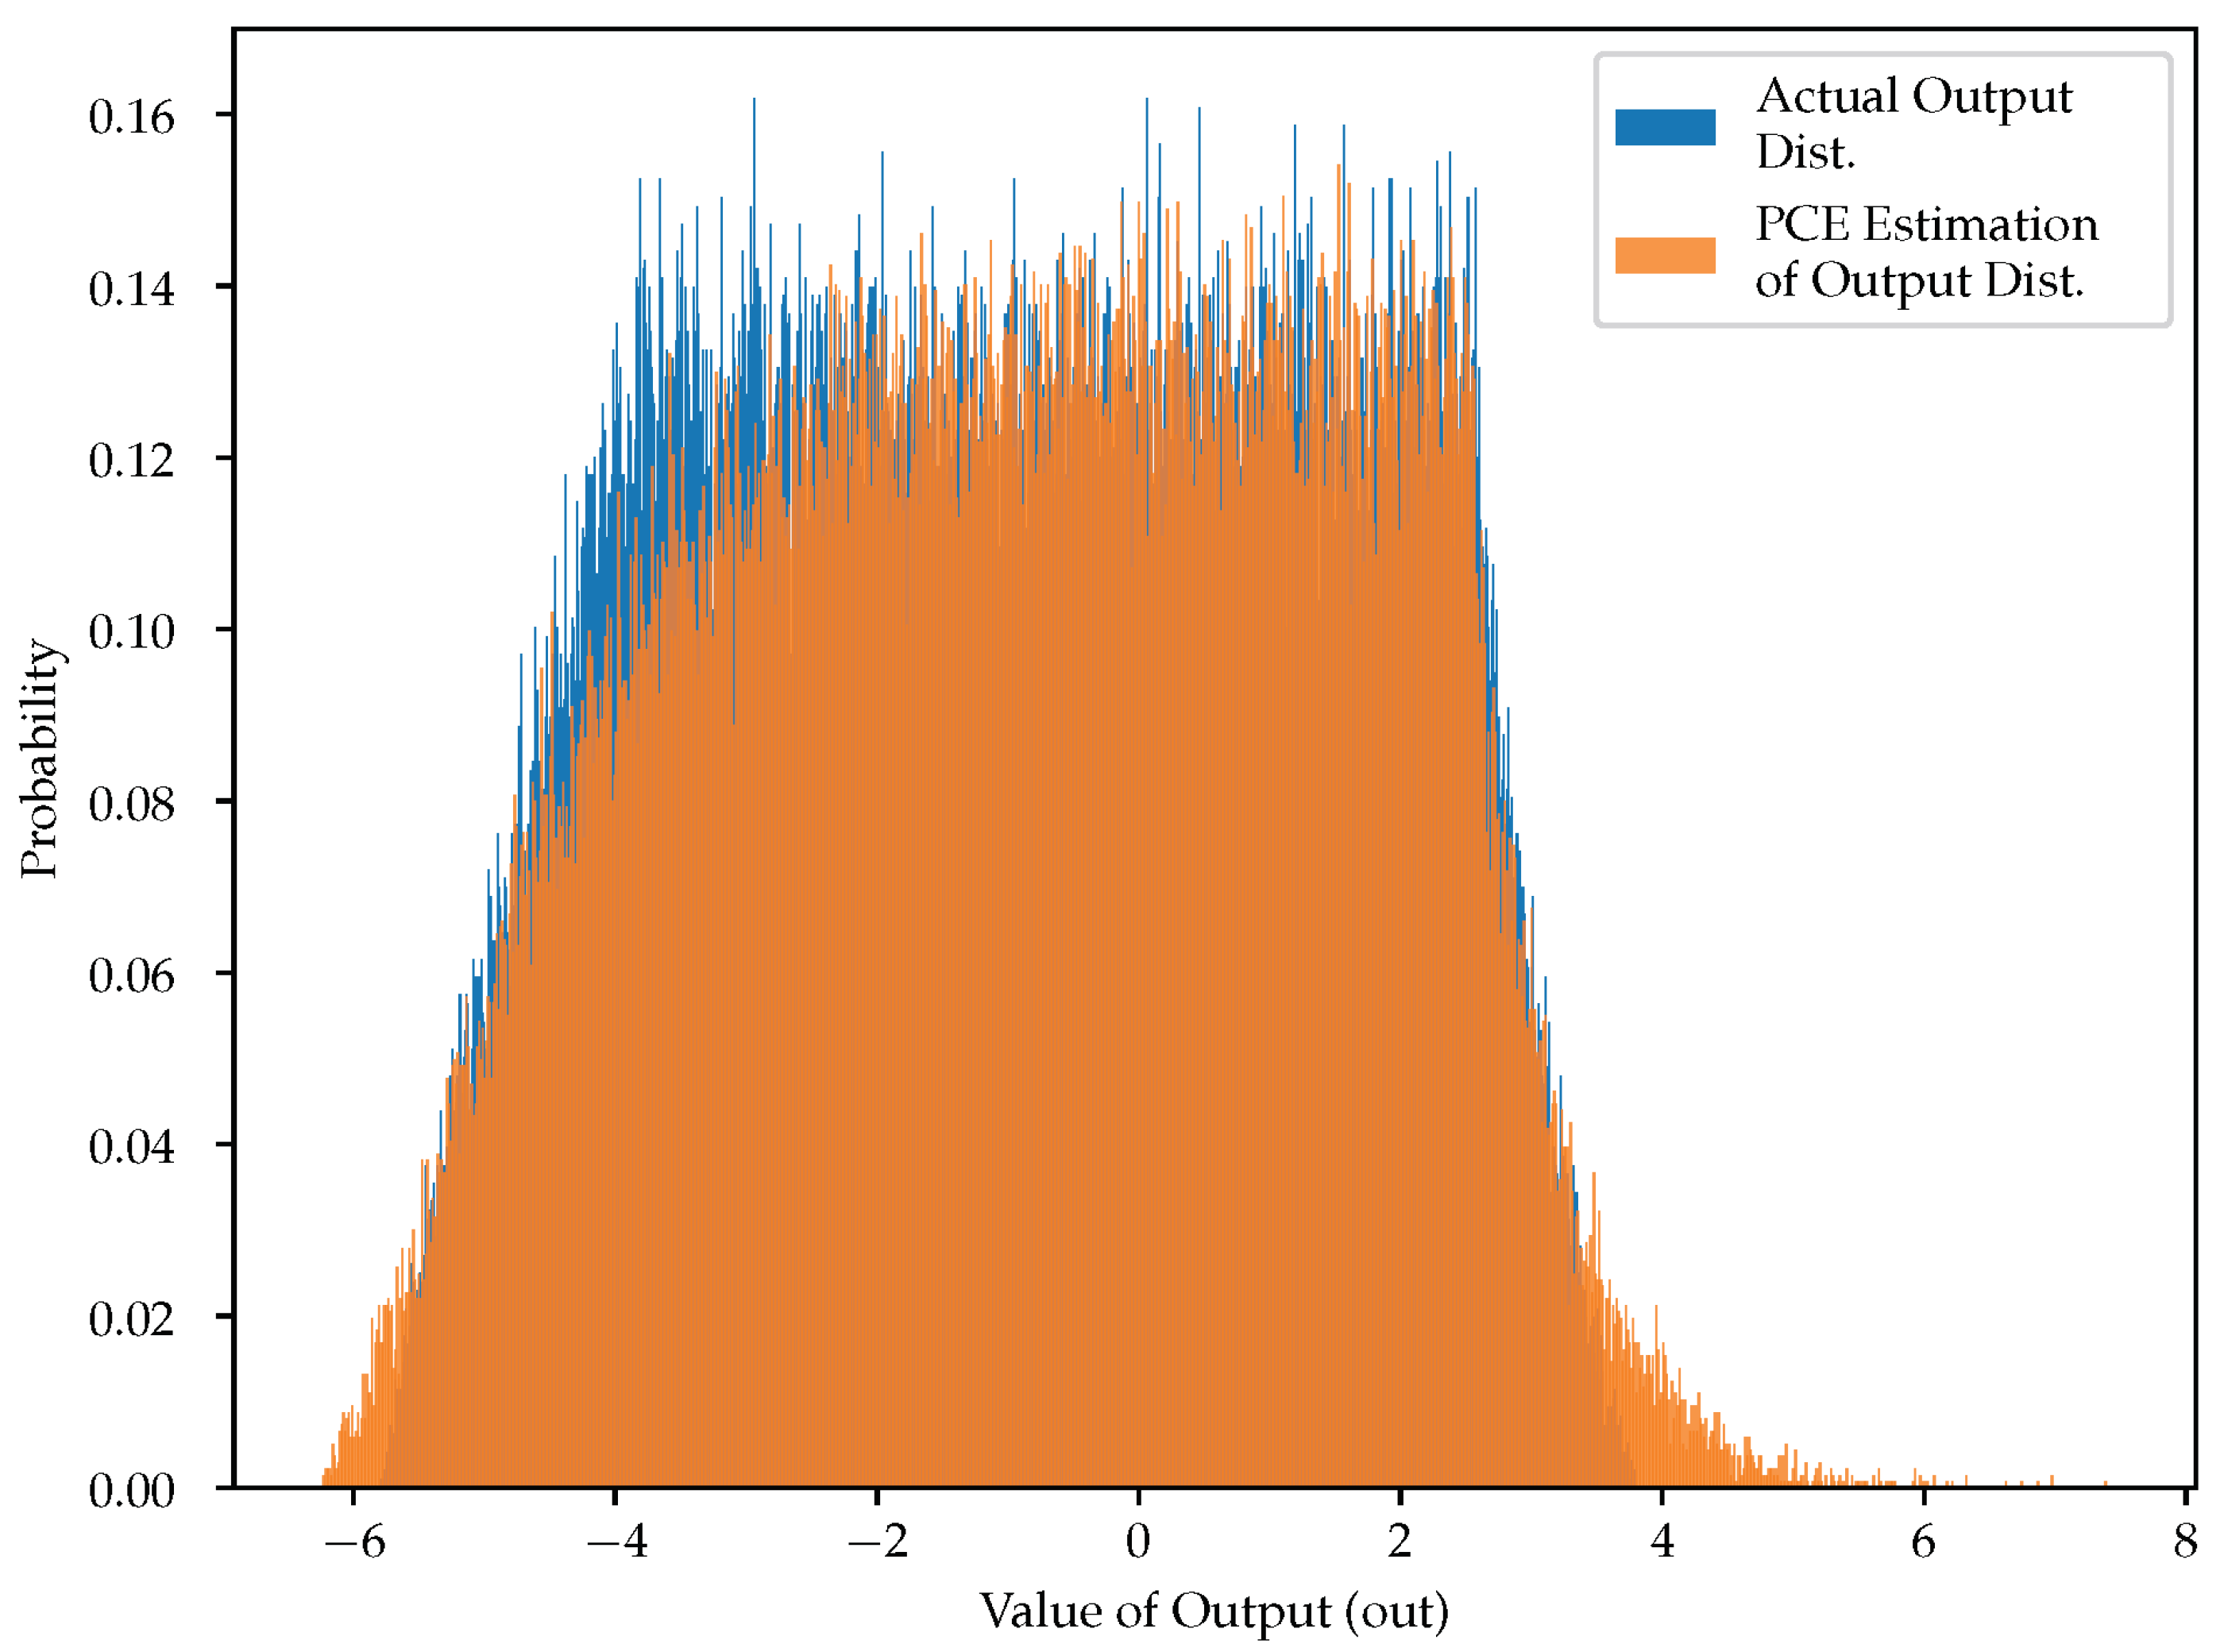
The signal distribution described by the calculated output PCE coefficients is compared to an MC simulation of the system. Moreover, 100,000 samples are generated from their respective distributions of the inputs a and b and are propagated through the DFG in Figure 6. Additionally, 100,000 samples are generated from the calculated PCE representation of the output. The results are illustrated in Figure 7.
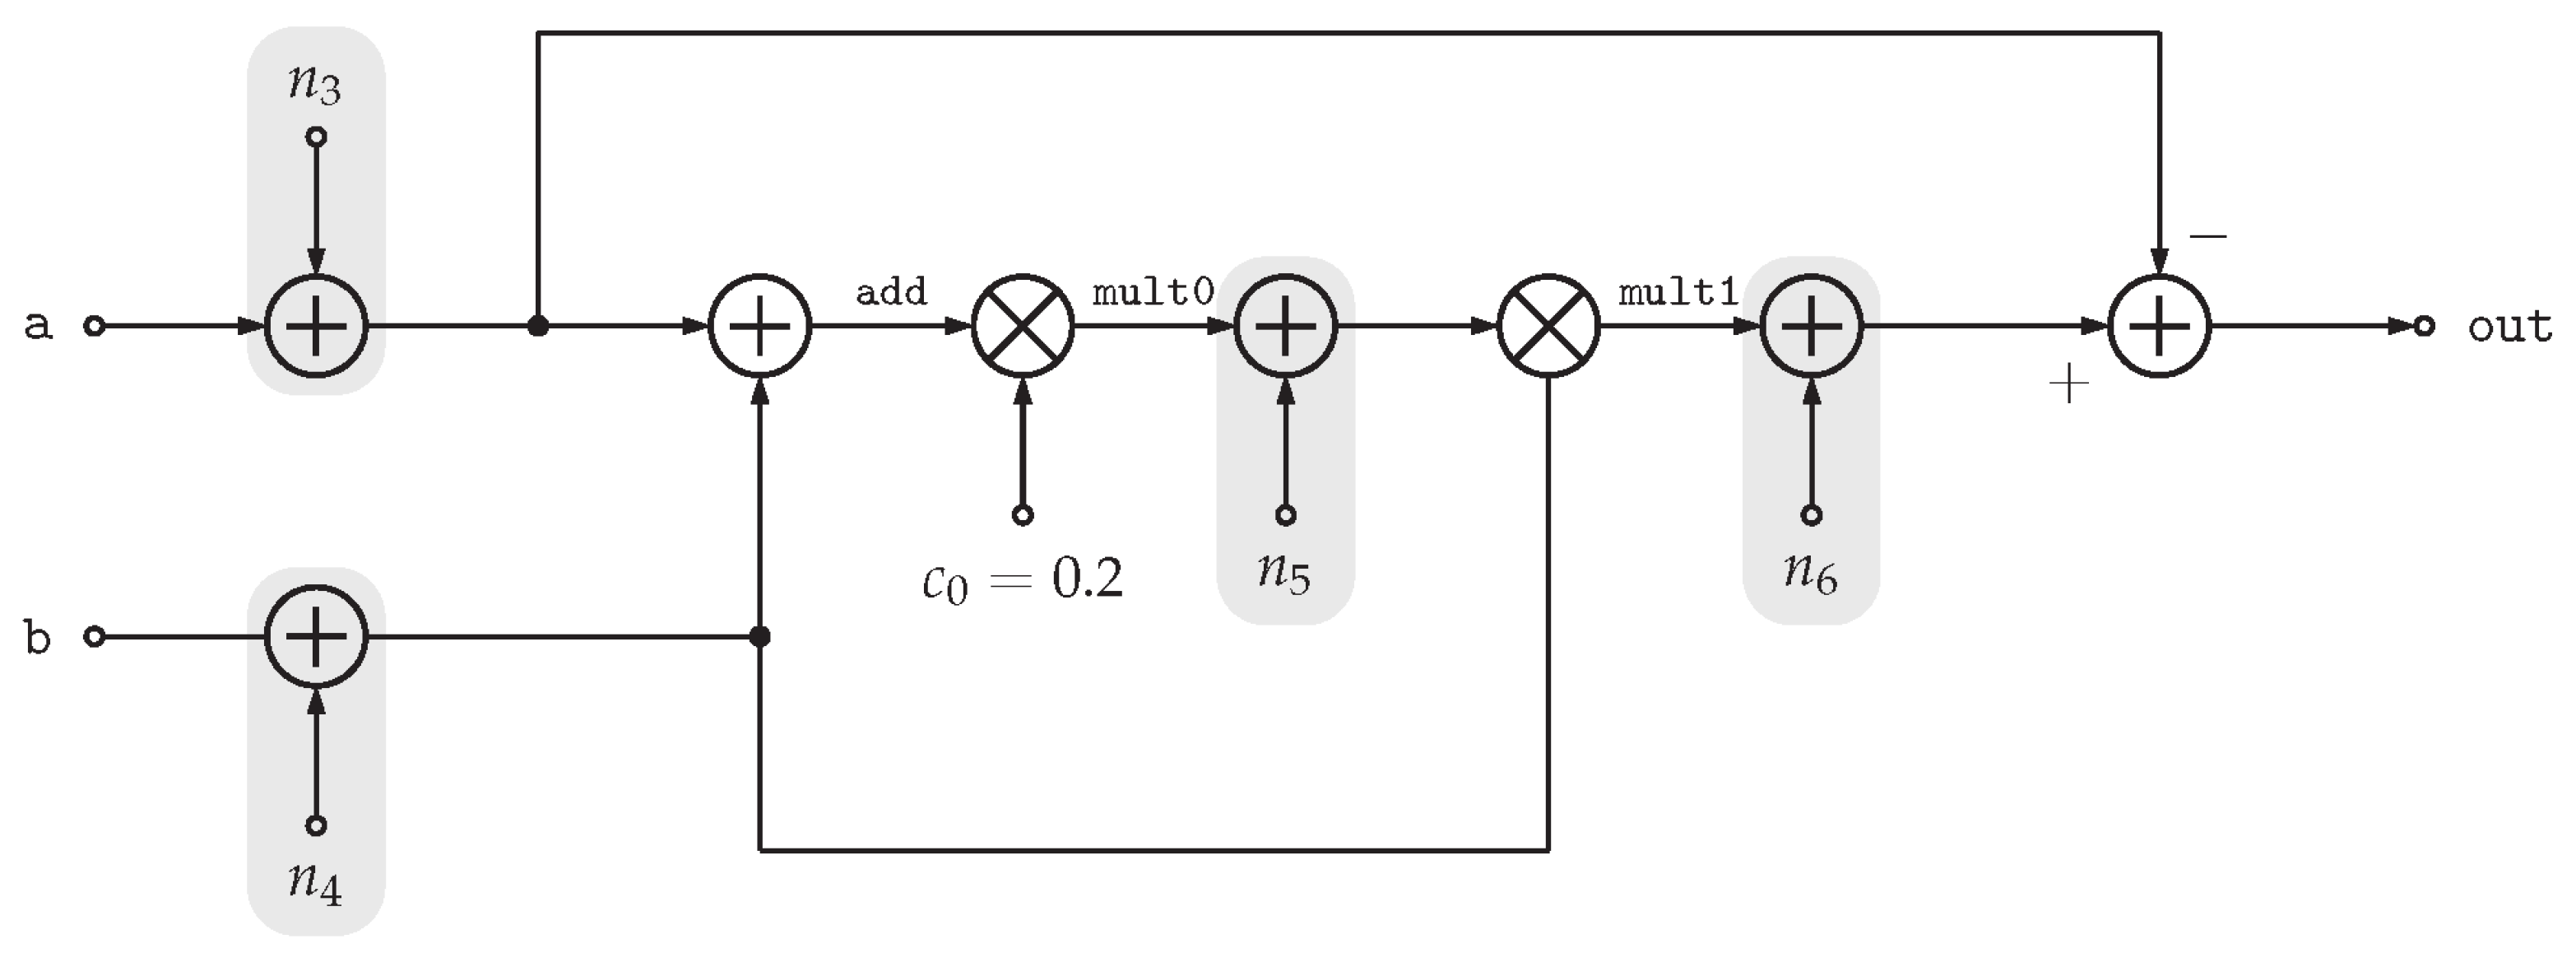
Obtaining the PCE coefficients of the quantization noise signal is done by adding noise nodes to the DFG, propagating the coefficients, and finally subtracting the signal distribution from the total distribution at the output. The new DFG with the noise nodes added (highlighted in gray) is shown in Figure 8.
Each noise injection node added to the DFG is another input that needs to be represented with its own random variable that captures the quantization effects at their respective nodes. The DFG now has six random variables, one for each of the inputs, and four for the noise sources. Adding four random variables for the noise nodes implies that the quantization noise induced at each node is uncorrelated with any other node. The polynomial basis set needs to be expanded to support these new random variables. With a maximum polynomial degree of 2, like before, according to Equation (21), the set of basis polynomials now contains 28 polynomials. The PCE coefficient arrays for each noise input can be calculated, similar to how the arrays for inputs a and b were calculated.
The new PCE representations are propagated through the DFG. The signal PCE coefficient array is subtracted from the resulting PCE array (representing the signal plus noise contribution). Taking the difference between the two arrays yields the noise distribution.
Note that the size of the basis set for the signal plus noise DFG is 28 while the signal PCE coefficient array has a size of 6. As a result, before subtracting the two arrays, the signal PCE coefficient array with size 6 needs to be remapped onto a size 28 coefficient array. The new basis set is a tensor product of the old basis set and the new one, and, assuming that both the basis sets are truncated to the same maximum degree, all the polynomials of the old basis set will appear in the new basis set. The remapping is conducted by placing the old coefficients into their new indices within the new basis set.
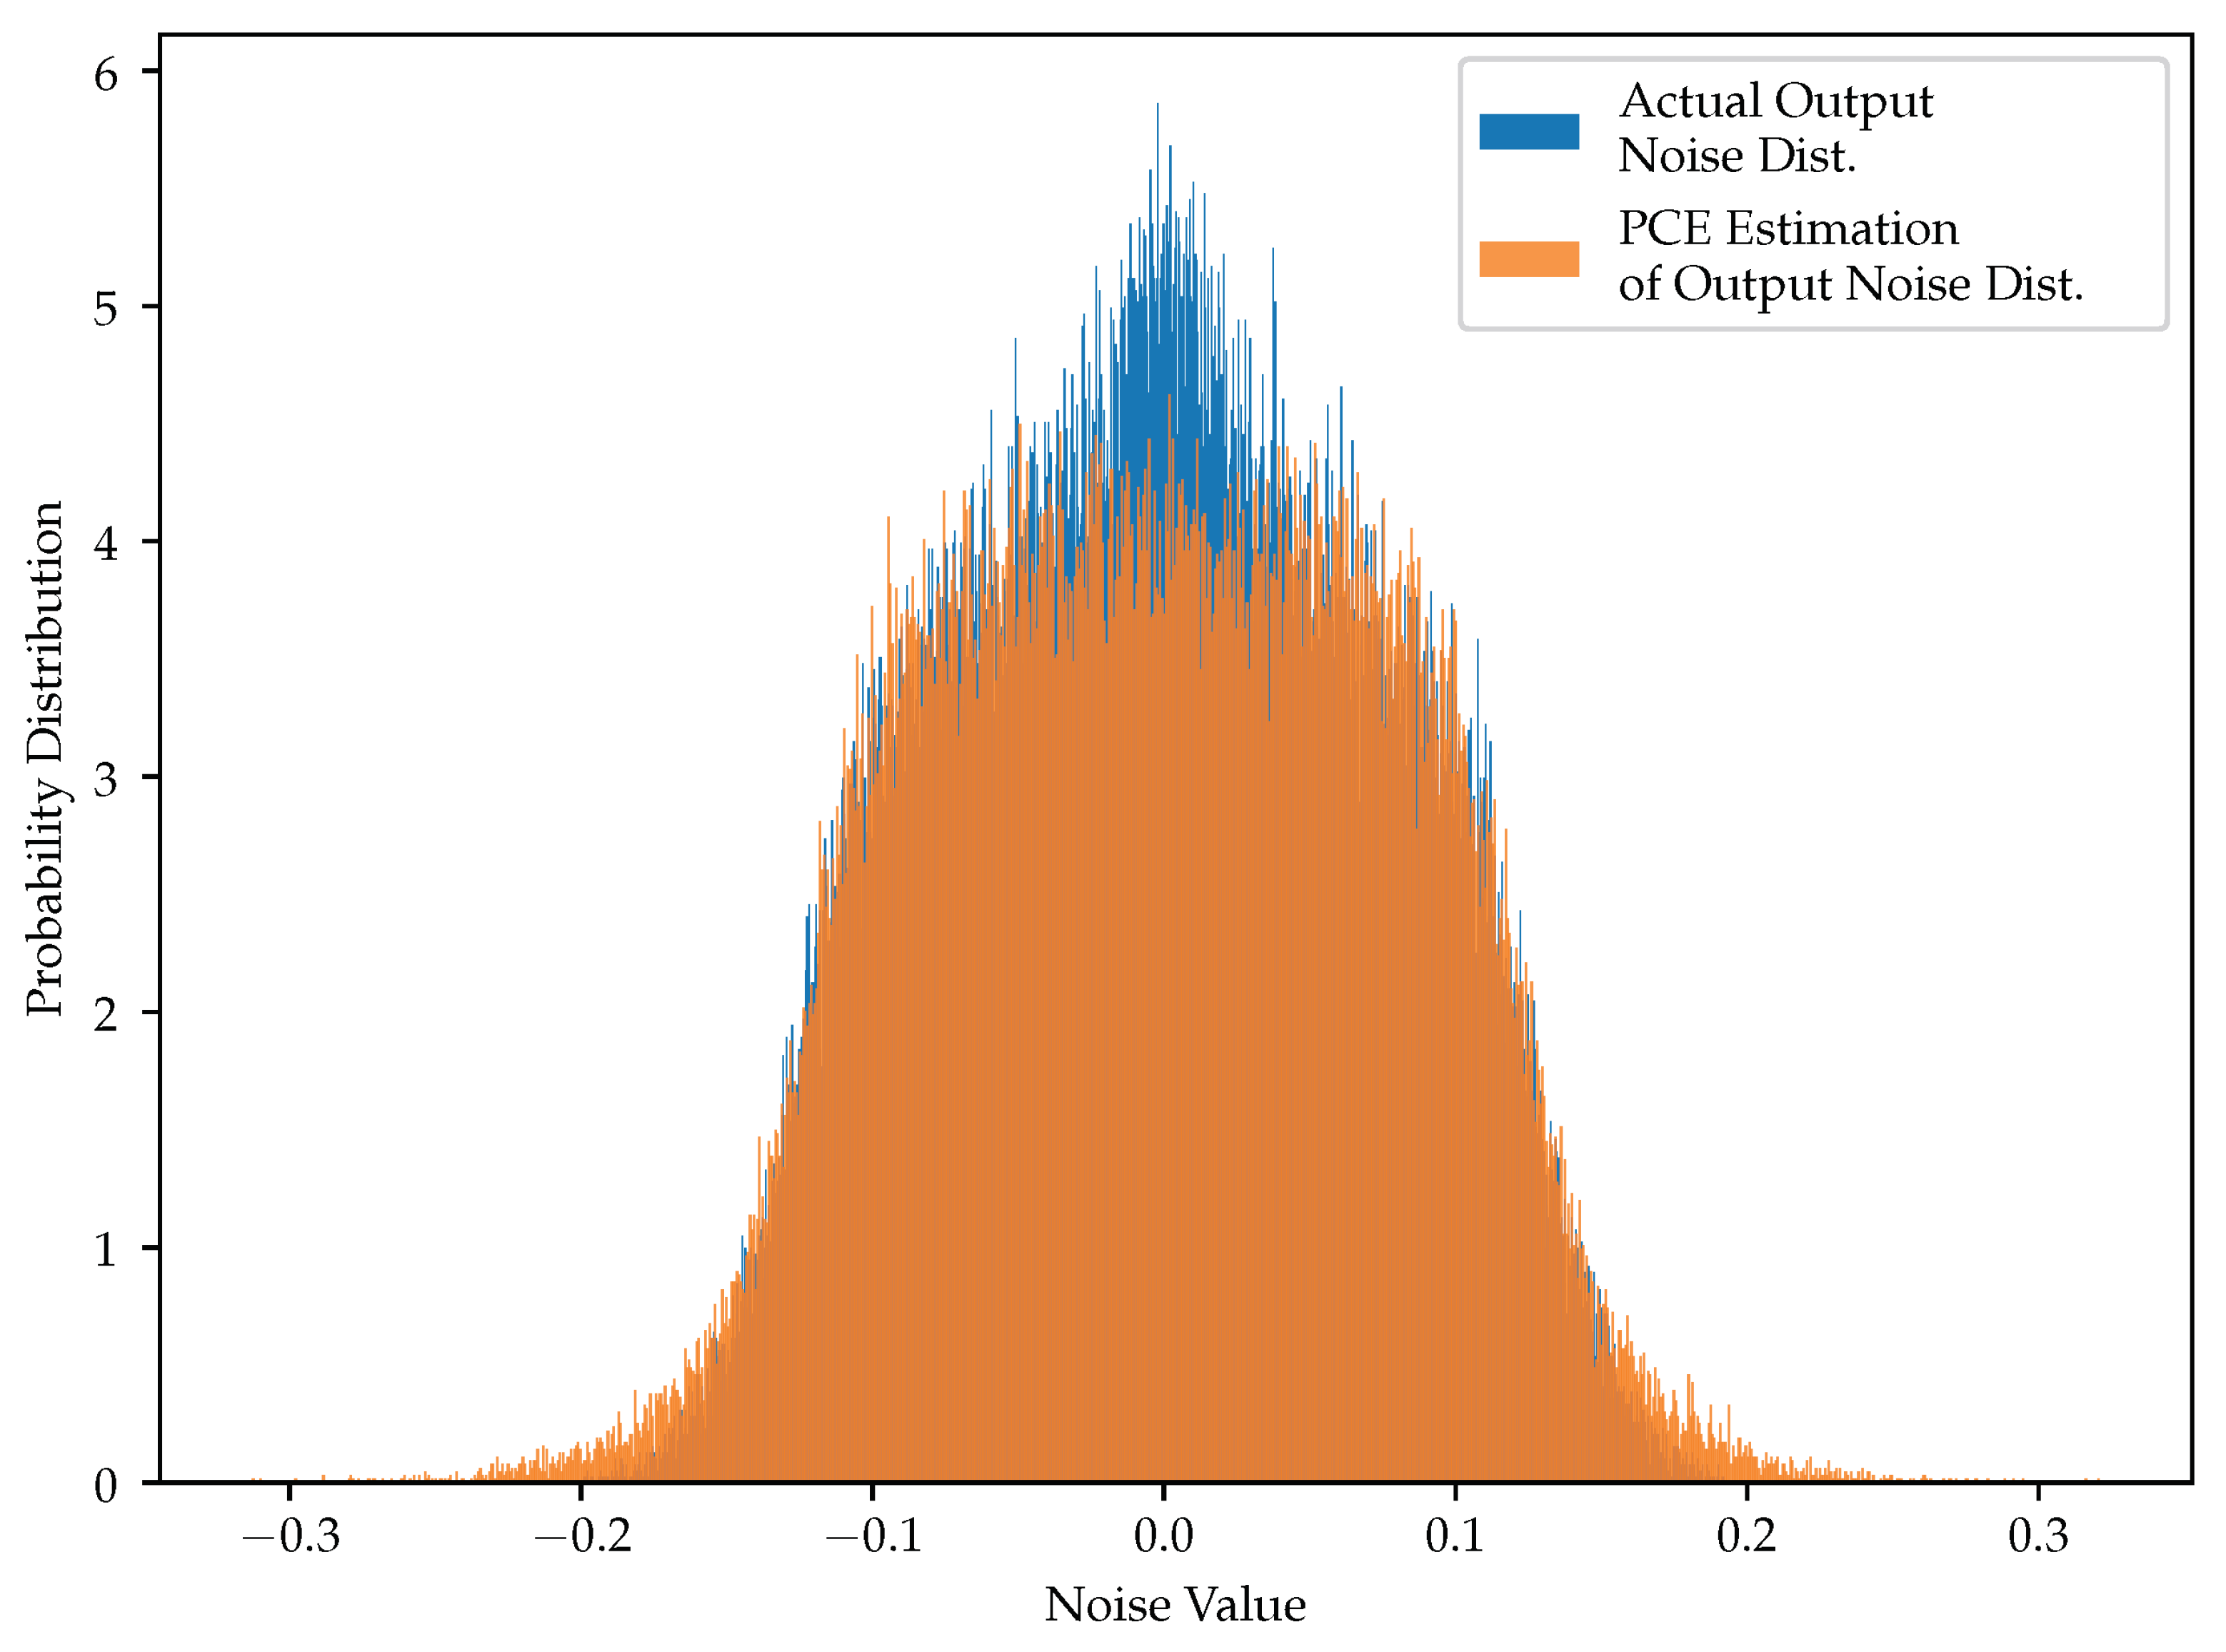
The resulting noise distributions from an MC simulation of the system and the PCE estimation of the noise distribution are shown in Figure 9. Due to the truncation of the PCE’s maximum polynomial degree, higher-order moments of the noise distribution, as seen by the MC simulation, are not captured by the PCE approximation. This is particularly evident in the peak at the center and the sharper drop-off at the edges in the MC simulation of the actual output noise distribution. The trade-off between accuracy and computational costs needs to be considered when conducting PCE simulations.
For this example, with the bit widths given in Table 3, the PCE simulation estimates the quantization noise power to be 0.0063. Combined with the signal power, determined in Equation (38) to be 6.3067, the PCE simulation estimates the signal-to-noise ratio to be 29.78 dB. The MC simulation estimates the SNR to be 30.05 dB.

5. Design Space Exploration

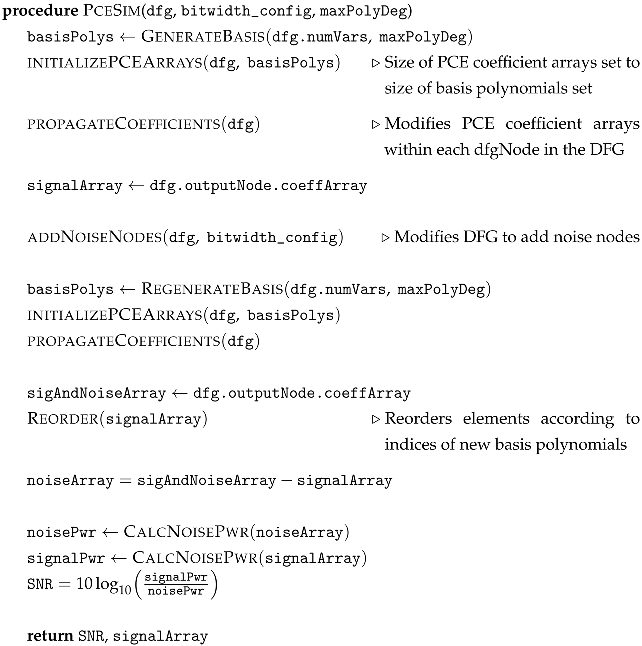
The simple example presented in Section 4 shows how quantization noise effects for a given bit width can be analyzed via PCE. This flow is summarized in Algorithm 1.
Algorithm 1 PCE simulation for a given bit width configuration
Electronics 14 00365 i001
Algorithm 1 returns an SNR estimate for a given bit width configuration. The goal is to try various signal bit widths and choose a configuration that gives the desired SNR. An exhaustive search through all possible configurations is not possible due to the large search space. Instead, the simulated annealing (SA) metaheuristic [37] is used to obtain solutions.

5.1. Using Simulated Annealing to Estimate Bit Widths

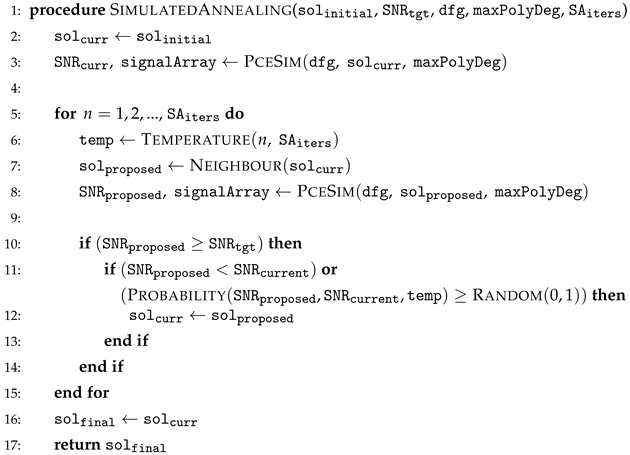
When applying SA, the goal is to identify a bit width configuration that introduces just enough quantization noise to achieve the desired SNR. Given the current bit width configuration, a better configuration would be one whose noise power is less than the maximum acceptable noise power, but, more than the noise power of the current best solution. The SA algorithm primarily tests a given bit width configuration by applying Algorithm 1, decides on whether to accept the trial configuration or not, and finally, identifies a new candidate configuration to test. This is shown in Algorithm 2.
Within Algorithm 2, the target SNR is given as SNRtgt. Also, an initial solution for which the quantization noise exceeds SNRtgt is given as solinitial. This initial solution can be set to the size of a common standard data type as a starting point. The total number of simulated annealing iterations is given as SAiters. Lastly, the DFG and the maximum polynomial degree are given as dfg and maxPolyDeg, respectively.
Algorithm 2 Simulated annealing
Electronics 14 00365 i002
If a bit width configuration yields a higher noise power than the current best, the configuration is chosen since it implies a lower total number of bits. Otherwise, the solution is accepted with a probability, given the Probability() function. This function uses the current temperature (updated by a call to Temperature()) to initially accept worse solutions with the motivation that it might lead to a better solution down the line. The equation for the Probability() function is Equation (40); the cooling curve for a given initial temperature ( t 0 ) and a total number of iterations ( SA iters ) is given in Equation (41):
P ( SNR prop , SNR curr , temp ) = exp SNR prop SNR curr temp
y = t 0 SA iters 2 x 2 2 t 0 SA iters x + t 0
Given a bit width configuration, new candidates to test for are given by the Neighbor() function. The set of neighbors is defined as the set of bit width configurations within a certain distance, Δ , of the current solution. For example, if Δ is 1, then the set of neighbors includes all bit-width configurations where each signal’s bit width is at most one bit higher or lower than the current set of bit widths.

5.2. Improved Design Space Exploration Algorithm

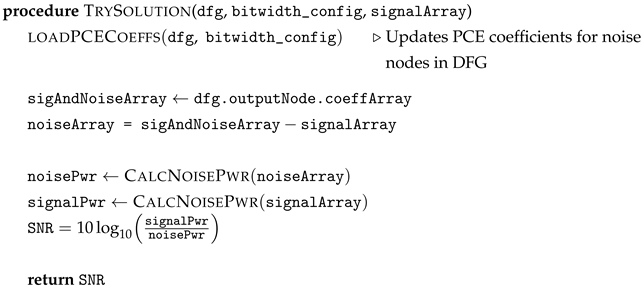
After the first call to Algorithm 1 (line 3), repeated calls do not need to reinitialize the basis polynomials, modify the DFG, or reorder the signal PCE coefficients. Subsequent calls (line 8) can be made to TrySolution instead, as given in Algorithm 3.
Algorithm 3 TrySolution
Electronics 14 00365 i003

5.3. Neighbor Selection

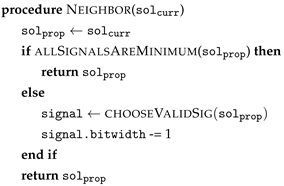
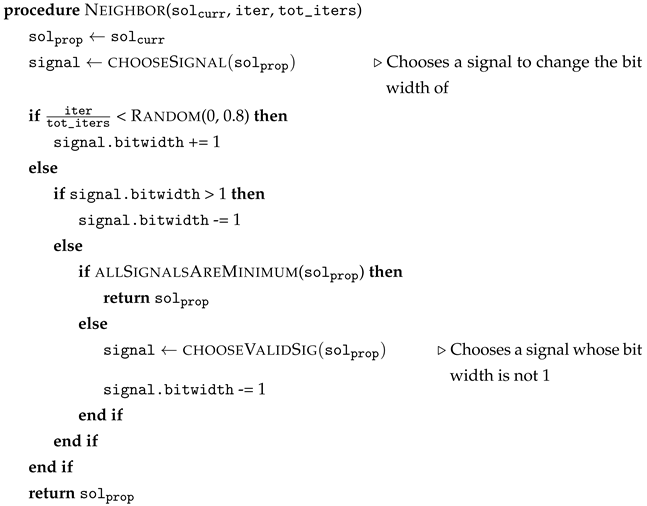
The Neighbor() function determines the set of potential solutions that can be explored from a given solution. Aggressive and non-aggressive neighbor selection algorithms are presented. The aggressive neighbor selection algorithm (Algorithm 4) always considers candidate configurations that have a lower total bit width than the current configuration. The non-aggressive neighbor selection algorithm (Algorithm 5) allows for an increase in the bit width 80% of the time. The rate (80%) is parameterizable and can be changed depending on the application.
Algorithms 4 and 5 are both heuristic methods used to obtain a solution. Choosing between the two algorithms depends on the trade-off between the resulting quality and the computation time available. When a single simulation takes a long time, it might not be possible to iterate over many undesirable solutions due to time constraints. In this scenario, Algorithm 4 may be preferred to attain an acceptable solution, even though it might over-allocate bits, or only come close to (but not achieve) the SNR target.
Algorithm 4 An algorithm for aggressive neighbor selection
Electronics 14 00365 i004
Algorithm 5 A non-greedy neighbor selection algorithm
Electronics 14 00365 i005

6. Results

A common method for bit width estimation involves using AA. However, AA overestimates the necessary bit width due to its approximation of non-linear functions. The next section demonstrates some of the shortcomings of AA in estimating bit widths when compared to PCE.

6.1. PCE vs. AA

Consider the simple DSP block in Figure 6, with two inputs: a U [ 3 , 5 ] and b N ( 0 , 1 ) . The first limitation of AA is evident from the fact that input b cannot be represented using AA since it is a normal distribution. For the sake of comparison, input b is changed to a U [ 1 , 1 ] distribution.
Input signals a and b are bounded over [ 3 , 5 ] and [ 1 , 1 ] respectively, and so, their AA representations are given in Equations (42) and (43), as follows:
a ^ = a 0 + i = 1 n a a i ε i = 1 + 4 ε 1
b ^ = b 0 + i = 1 n b b i ε i = 1 ε 2
Following the AA propagation rules, the AA representations of the signals are shown as follows:
add = 1 + 4 ε 1 + 1 ε 2 mult 0 = 0.2 + 0.8 ε 1 + 0.2 ε 2 mult 1 = 0.3 ε 2 + 1.2 ε 3 out = 1 + ( 4 ) ε 1 + 0.2 ε 2 + 1.2 ε 3
Finally, the signal power is calculated to be 6.826.
Next, the noise nodes are added to the DFG as shown in Figure 8. With a rounding quantizer, the AA representations of the noise inputs are shown as follows:
n 3 = ( 1 64 ) ε 4 n 4 = ( 1 64 ) ε 5 n 5 = ( 1 16 ) ε 6 n 6 = ( 1 8 ) ε 7
Propagating these coefficients through the DFG, the AA representation of the output signal out, is shown in Equation (44):
out = 1 + ( 4 ) ε 1 + 0.2 ε 2 + 0.2 64 ε 5 + 1.2 + 0.4 64 + 1 16 1 + 1 64 ε 7
The signal plus noise power is calculated to be 6.8921. Finally, the SNR of this bit width configuration, as estimated by AA, is shown in Equation (45):
S N R = 10 log 10 6.826 6.90 6.826 = 19.68 dB
A comparison of the AA estimation with the PCE estimation along with an MC simulation is presented in Table 4.
Estimating bit widths using affine arithmetic overestimates the hardware resources; this can be observed in Table 4. For a given bit width, AA estimates the SNR to be much lower than it is, in this case, about 11 dB less than the Monte Carlo estimate. As a result, when evaluating potential bit widths within a search space, an AA-based estimation would produce a solution that is a significant overestimate of resources. PCE simulations, on the other hand, can estimate the SNR significantly better. Table 4 shows that even when the maximum polynomial degree of the basis set in PCE is set to 1, it still yields a good estimate of the SNR predicted by the MC simulations.
The AA simulation claims that for the bit width configuration {a,b = 5, mult0 = 3, mult1 = 2}, the SNR is estimated to be about 19.68 dB. As described earlier, this is an over-allocation of resources. To obtain a measure of how much of an over-allocation it is, Algorithm 2 can be used to estimate a bit width configuration for a target SNR of 20 dB. Doing so gives the configuration shown in Table 5.
If all the signals are quantized to 1-bit using a rounding quantizer, the 20 dB SNR target can be met. Compared to the AA solution, mult0 and mult1 can be 1-bit multipliers instead of 3-bit and 2-bit multipliers, respectively. Hardware resource requirements scale quadratically with the bit width of a multiplier and linearly with the bit width of an adder.

6.2. PCE vs. MC

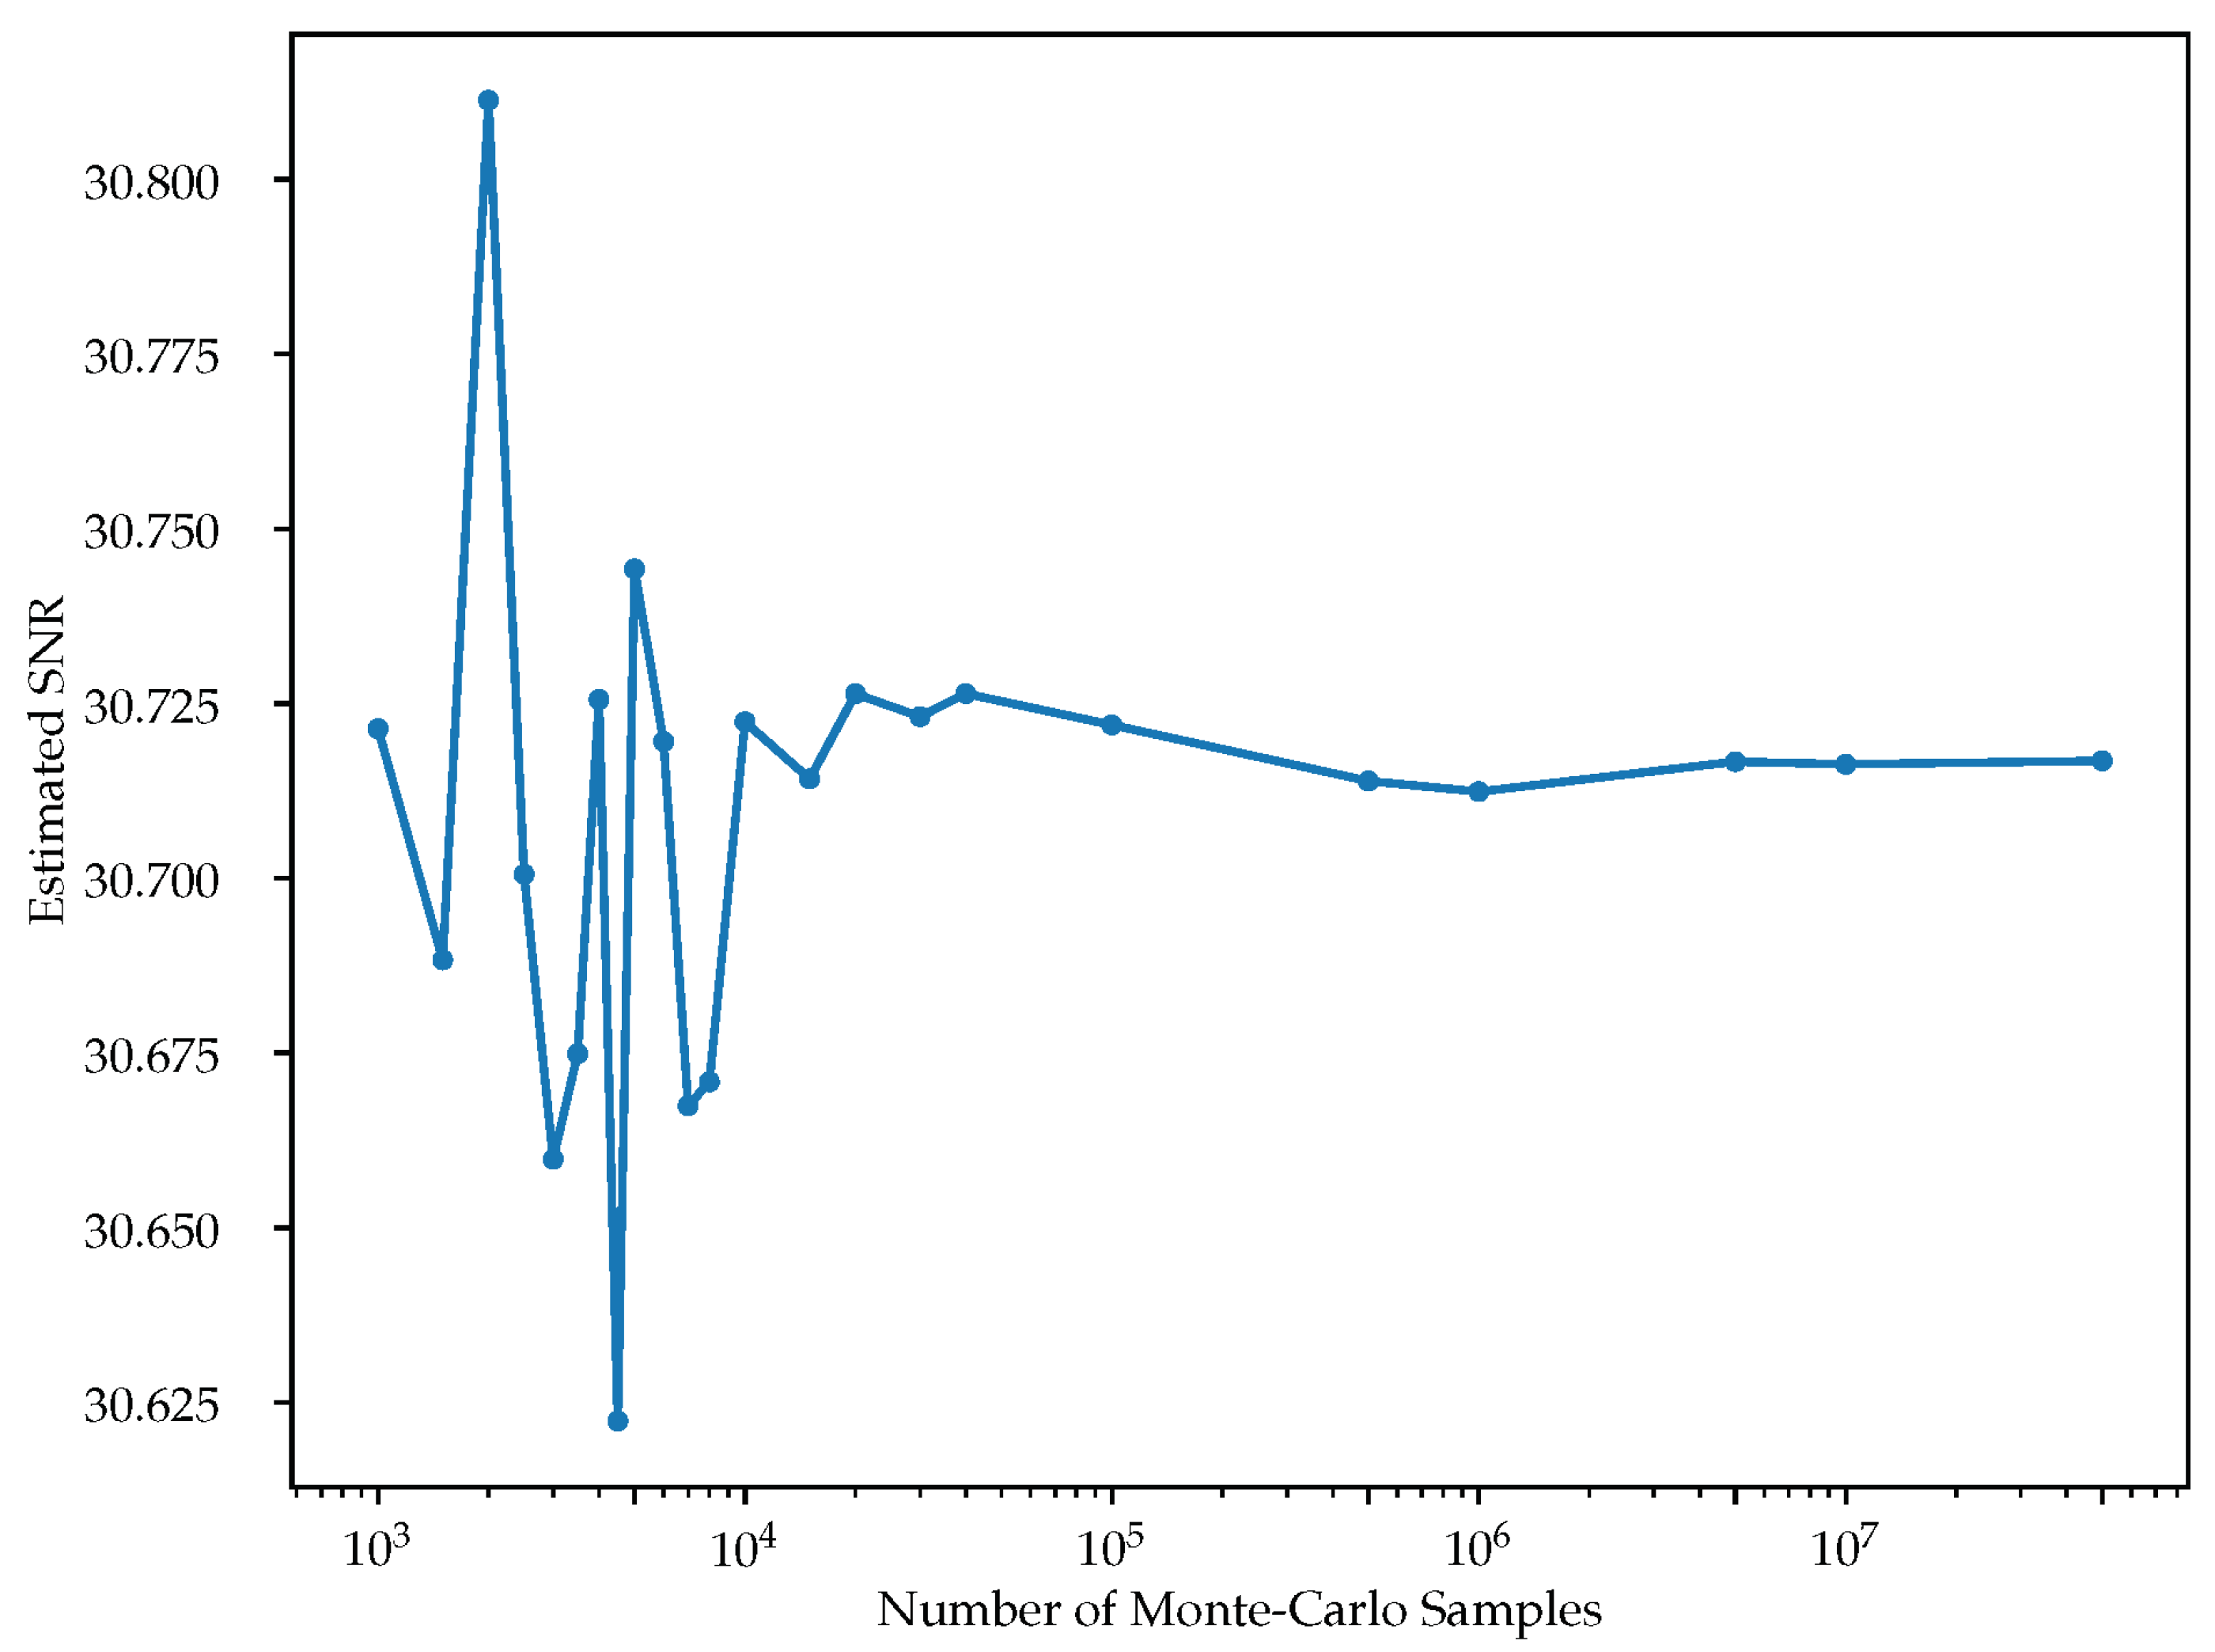
This section demonstrates that for the DSP block in Figure 6, the PCE SNR estimation is comparable to an MC simulation with 1,000,000 samples. Figure 10 shows the SNR estimate converging to around 30.715 as the number of MC samples increases from 1000 to 50,000,000.
The PCE representation used to analyze the quantization noise for the DSP block in Figure 6 has six random variables. With a first-degree expansion, Equation (21) shows that the basis polynomial set has six polynomials. To propagate N PCE coefficients through the DSP block, the add, subtract and constant multiply nodes require N operations each. The non-linear multiply requires N 3 operations. Therefore, with 6 coefficients, it requires 234 operations to estimate the SNR.
An MC simulation with N samples requires 4 N operations to propagate the samples to the output of the block. Figure 10 shows that the SNR estimate converges at around 1,000,000 samples, which requires 4,000,000 operations. It can be observed that while PCE suffers from the curse of dimensionality, a low order expansion is enough to estimate the bit widths accurately when compared to MC simulations with high sample numbers.
MC simulations can be parallelized very well, reducing the total simulation runtime. However, this advantage cannot always be exploited due to the significantly lower number of operations required by PCE for primitive DSP blocks. For example, with the DSP block shown in Figure 6, a PCE simulation requires 234 operations while MC requires around 4,000,000 operations. Reducing the runtime to around that of PCE requires a parallelization speed-up by a factor of more than 17,000. This requires significantly more computational resources.

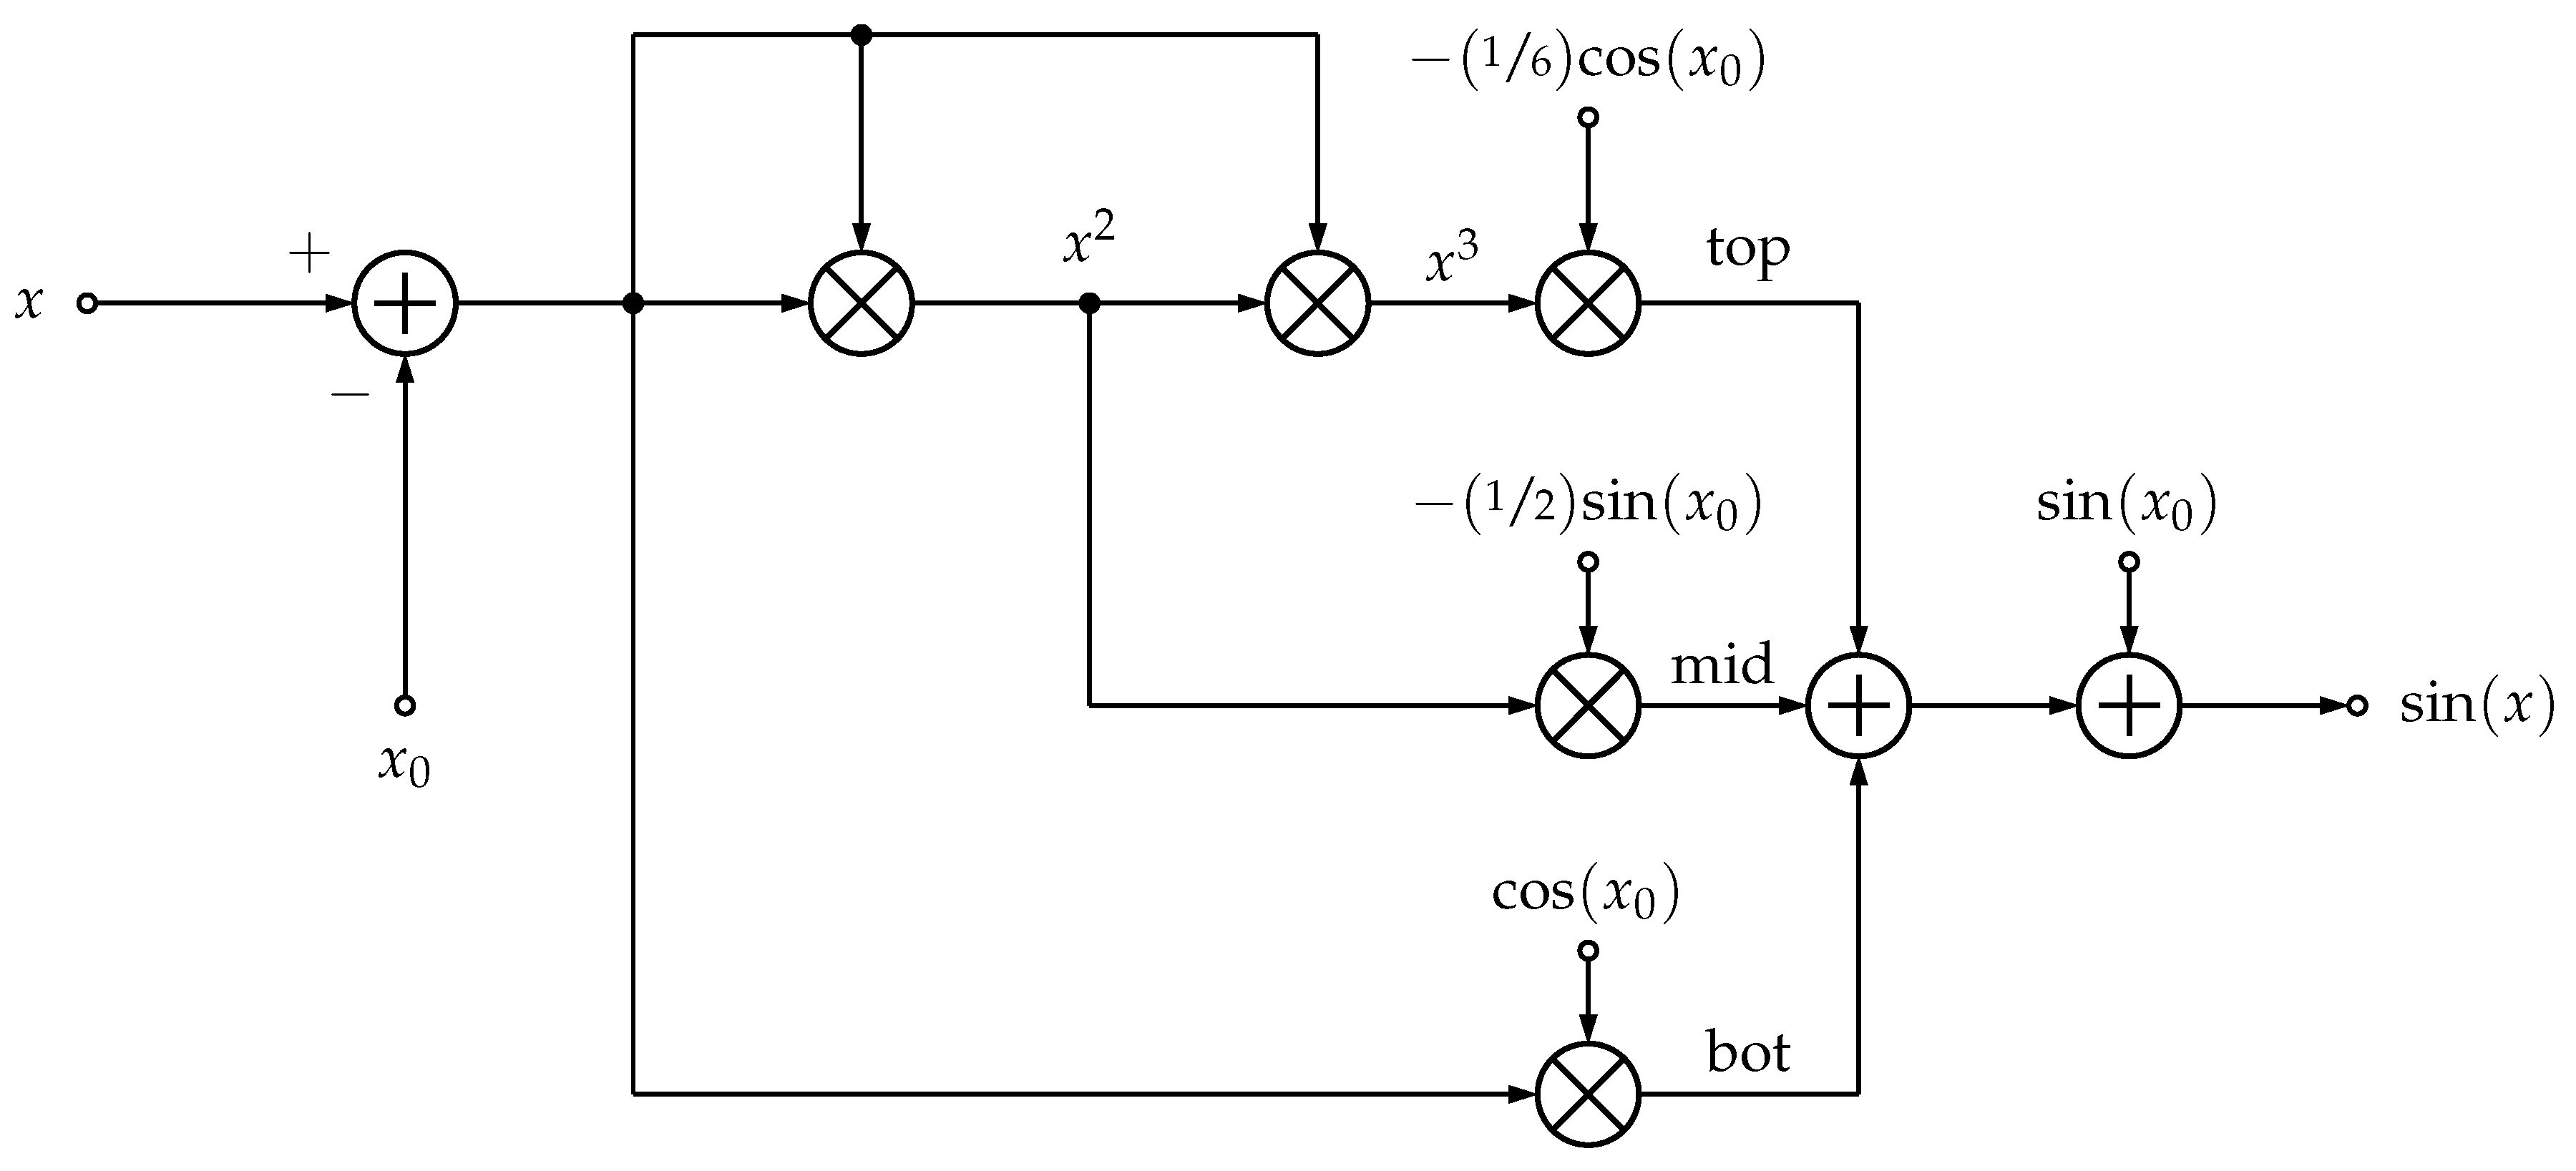
6.3. Third-Order Taylor Series Sine/Cosine Expansion Around x 0 = 2.0

Figure 11 shows a DSP block, which calculates the Taylor series expansion around x = x 0 . The input signal in this example varies from 0 to 2 π uniformly and its PCE coefficients are given in Equation (46), as follows:
x = π π 0
This DFG has seven random variables (one input and six noise sources), requiring thirty-six basis polynomials.
The results from 10,000 iterations of the simulated annealing algorithm, using the aggressive neighbor selection (Algorithm 4) as the Neighbor() function and an initial temperature of 1.0, are shown in Table 6. It can be seen that even with second-degree polynomials and an aggressive design space exploration algorithm, it is possible to achieve a fine level of control over the desired quantization noise power at the output, even though the signal-processing chain is non-linear.
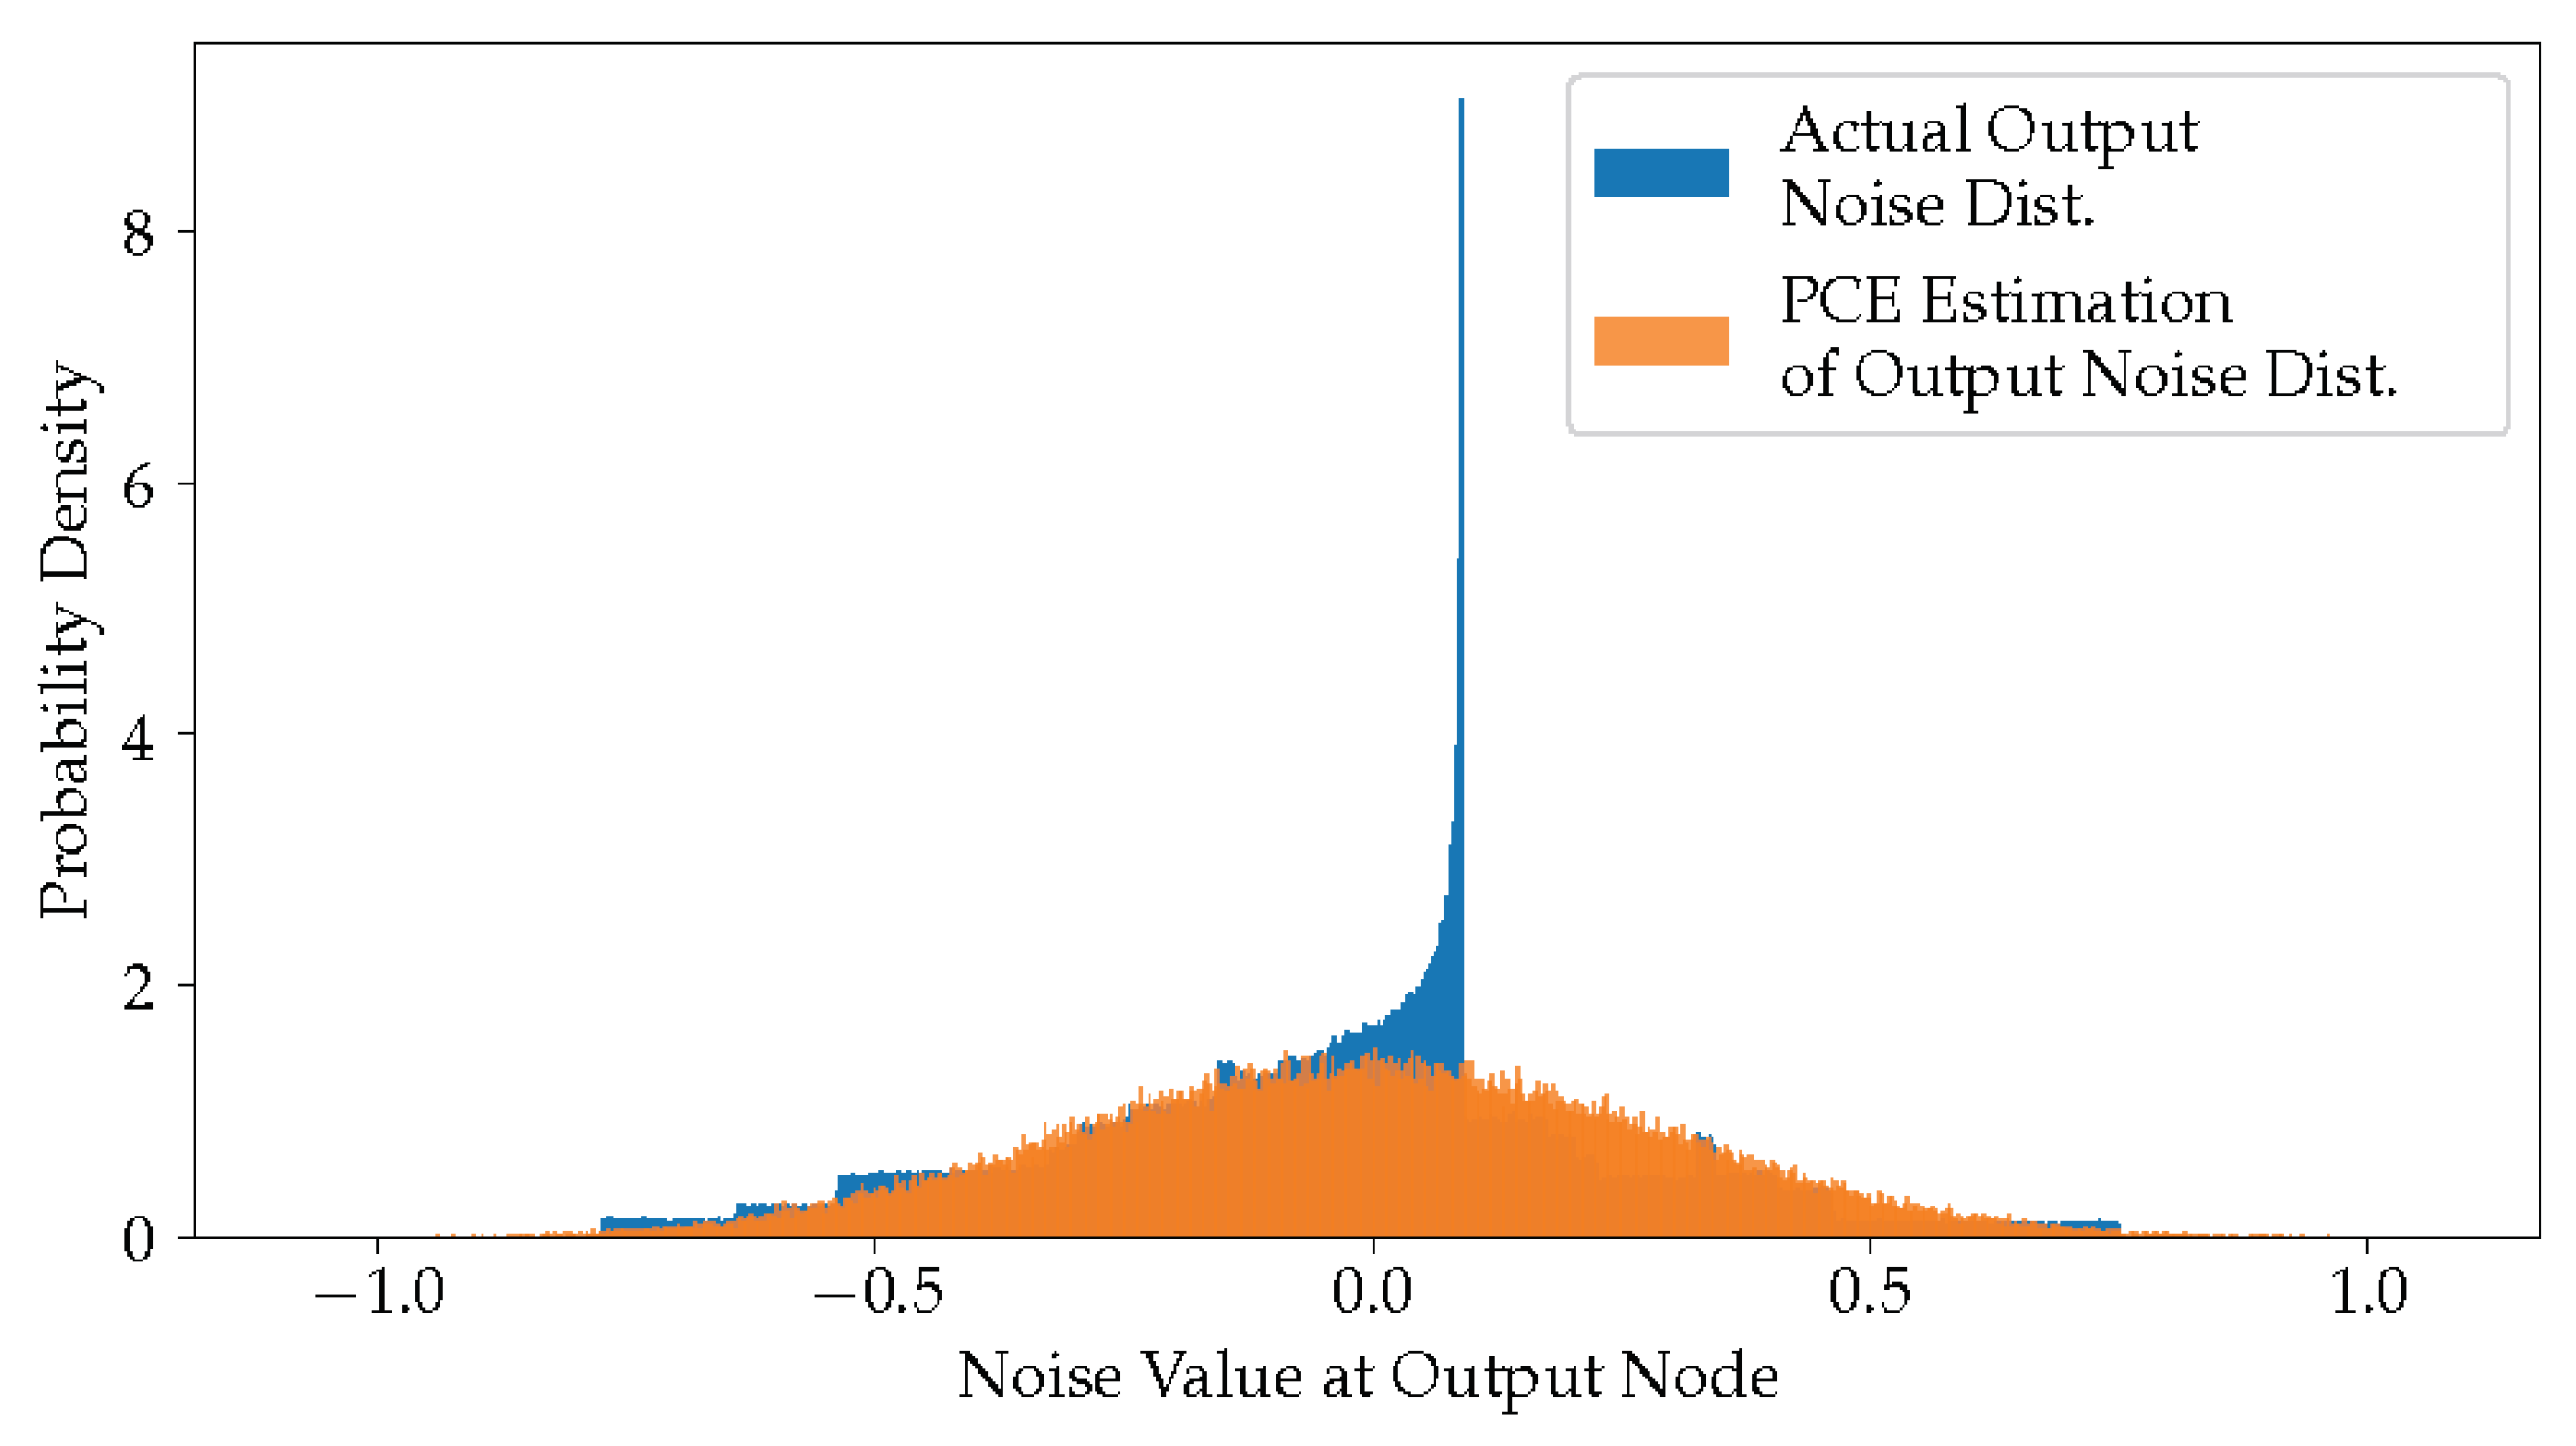
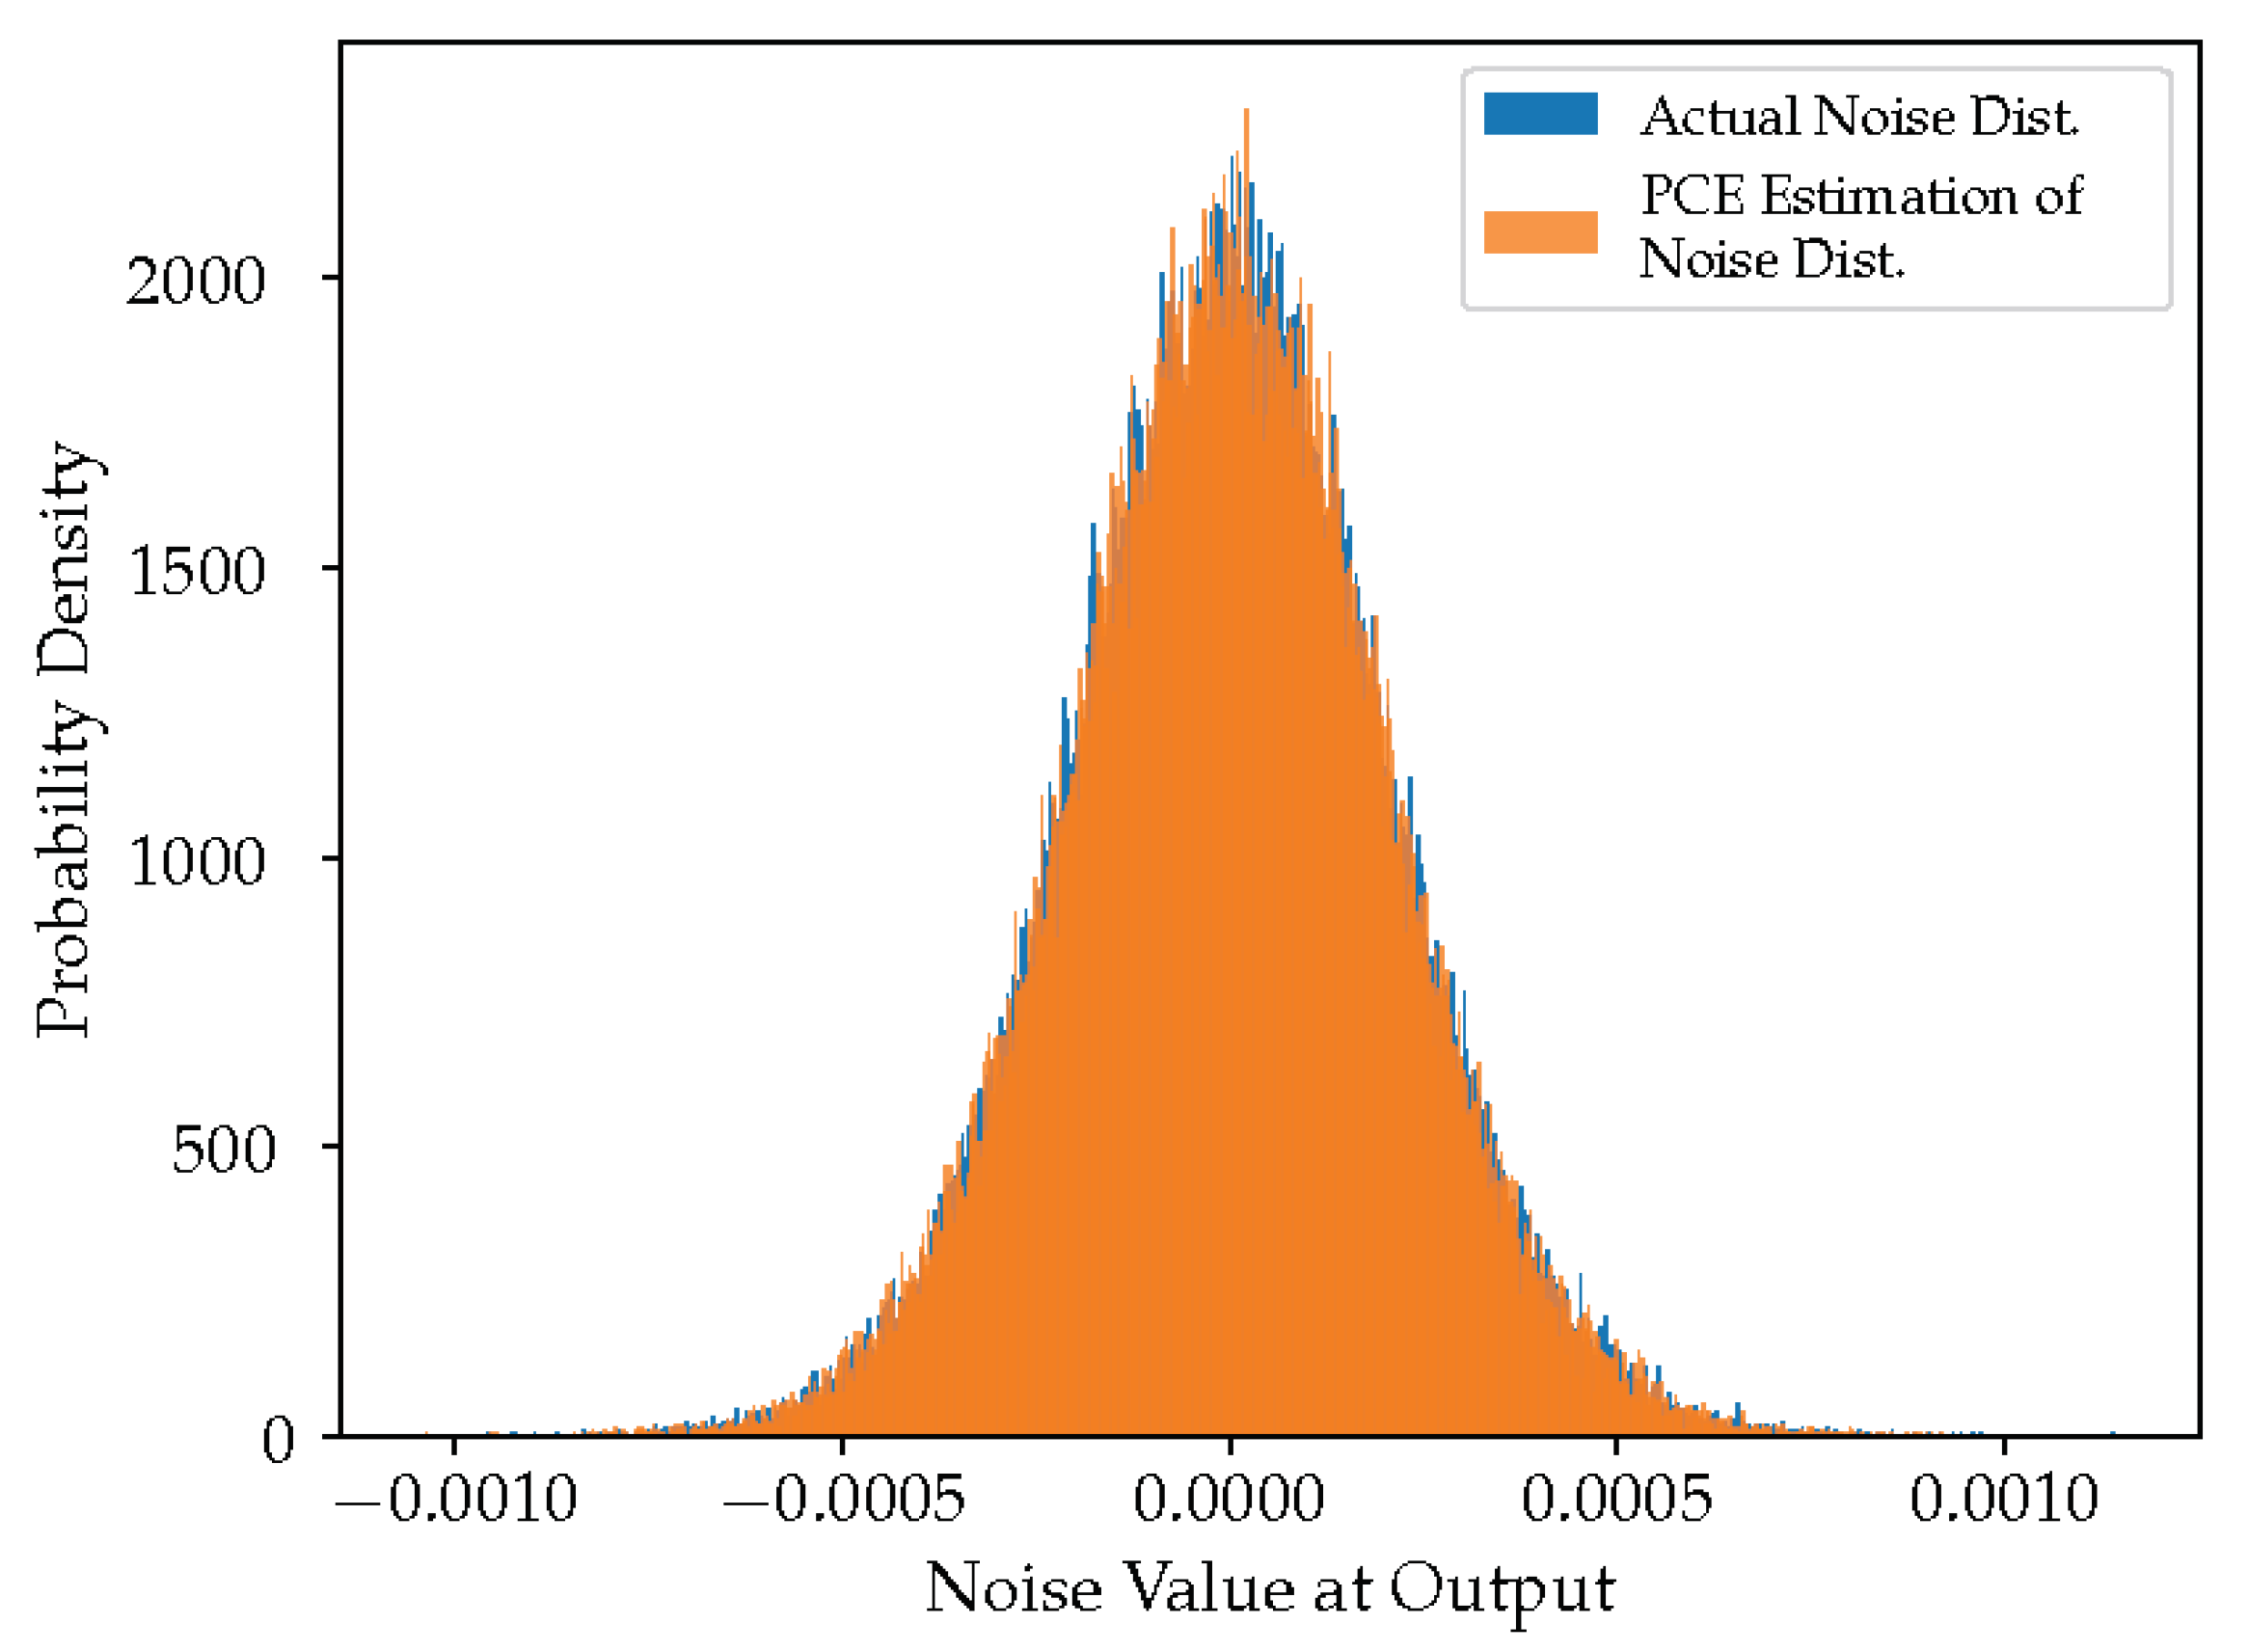
Figure 12 shows the shape of the noise distribution at the output obtained by an MC simulation (blue) and a PCE simulation (orange). The actual noise distribution is not smooth and has many peaks, signifying that a high maximum polynomial degree for the basis functions should be used to accurately capture all the higher-order moments of the distribution. However, since only the second-order moments are of interest when determining noise powers, the histogram and Table 6 show that truncating the maximum polynomial degree to two is sufficient to provide accurate results.

6.4. FM Demodulator

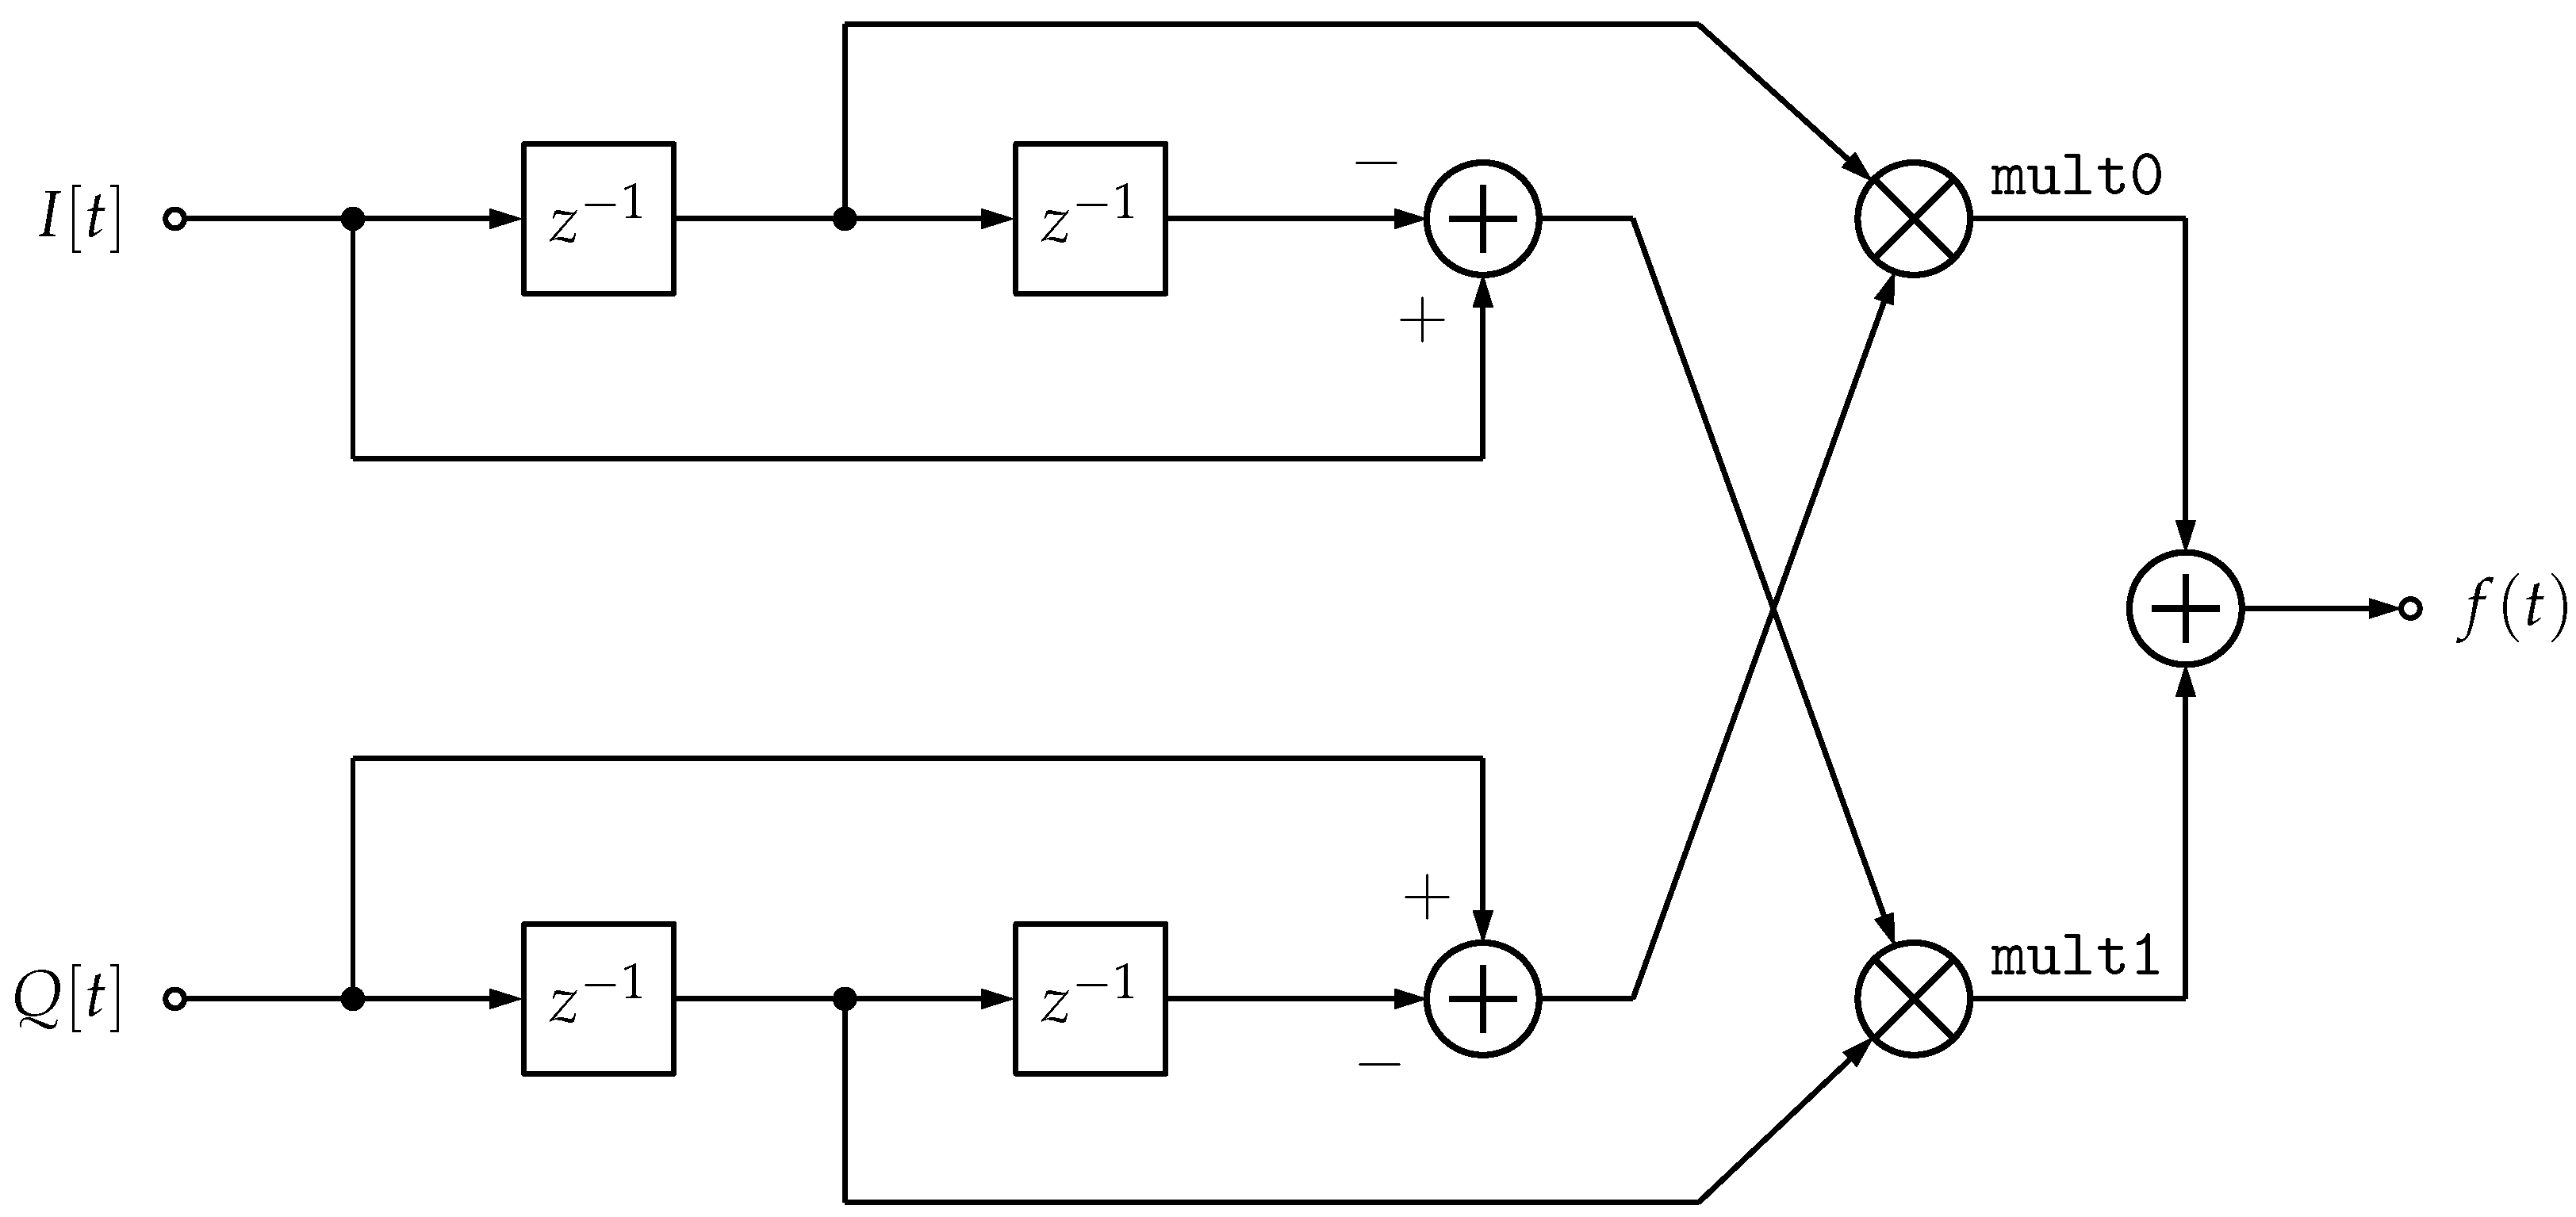
Figure 13 shows the DFG for an FM demodulator. The architecture used for the demodulator was elaborated on in [38]. Due to the presence of three time-delay elements, each input signal preceding the time-delay blocks in Figure 13 requires three input variables. The noise sources from the two multipliers after the time delays require only one random variable each. This results in the system implementation requiring a total of 14 random variables and 120 basis polynomials.
Analyzing Equation (28) shows that the number of operations required by a multiplier to compute its output is given by m 3 , where m denotes the size of the basis set. As a result, with 120 basis polynomials, and a PCE simulation of three time steps, the total number of operations performed by a single multiplier is 3 × ( 120 ) 3 = 5,184,000, which takes about 70 milliseconds (ms) per multiplier per time step for each PCE simulation. If the simulated annealing algorithm, as shown in Algorithm 2, is run for 10,000 iterations, then this simulation would require the following:
70 ms multiplier × 2 multiplier time step × 3 time step simulation × 10,000 simulation = 4,200,000 ms = 70 min
To improve this runtime, sparse matrix multiplication libraries can be used to improve the milliseconds-per-multiplier factor, or the number of iterations of the simulated annealing algorithm can be reduced. The latter approach is taken here and the number of simulations is reduced from 10,000 to only 100. This puts more of an emphasis on the Neighbor().
The results from 100 iterations of the simulated annealing algorithm using Algorithm 4 as the Neighbor selection function are shown in Table 7. It can be seen that all SNR targets are met with a high level of accuracy even with significantly reduced simulated annealing iterations. In this example, due to the reduced number of total simulated annealing iterations, there was not enough time to perform any form of hill climbing to attain a better solution. Thus, when the number of total iterations is low, it is better to use a greedy neighbor selection algorithm, like Algorithm 4, to obtain solutions.
Additionally, due to the presence of only two multipliers, this DSP system is well characterized by basis functions with a maximum polynomial degree of 2. This can be seen in the close match between the MC histogram, and the PCE-predicted histogram in Figure 14.

6.5. Single Pole IIR Filter

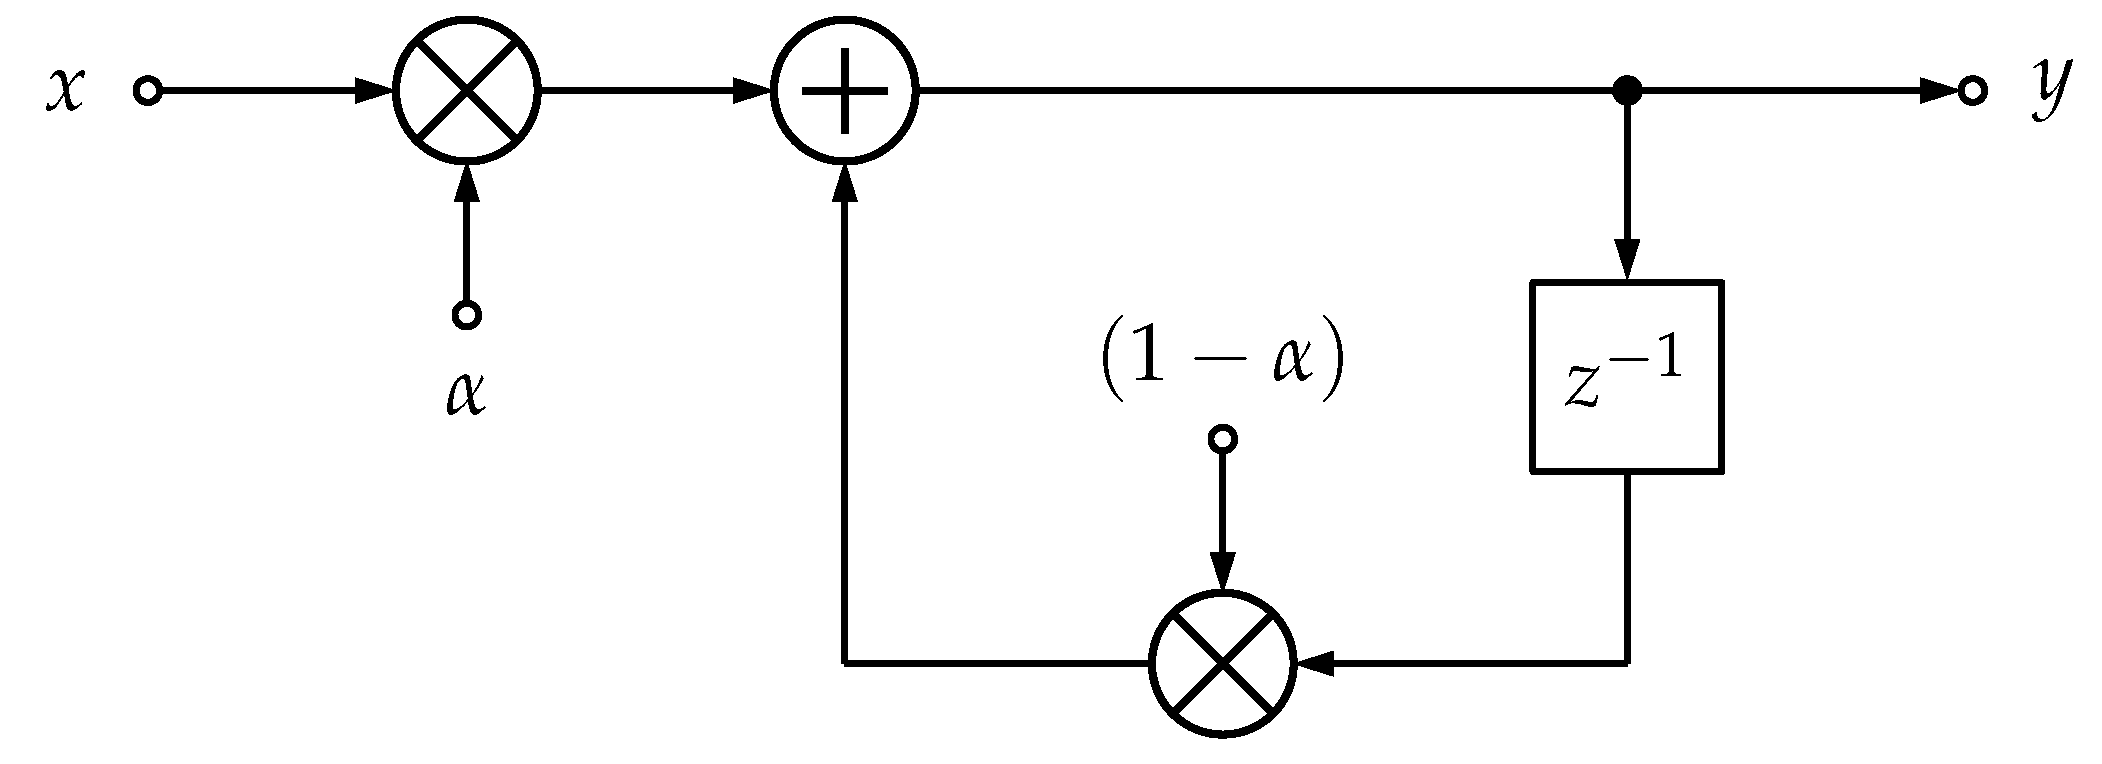
Figure 15 shows the DFG for an IIR filter. An IIR filter uses all past inputs to calculate its current input. As a result, to simulate an IIR filter using PCE, a new random variable must be introduced at each simulation time step.
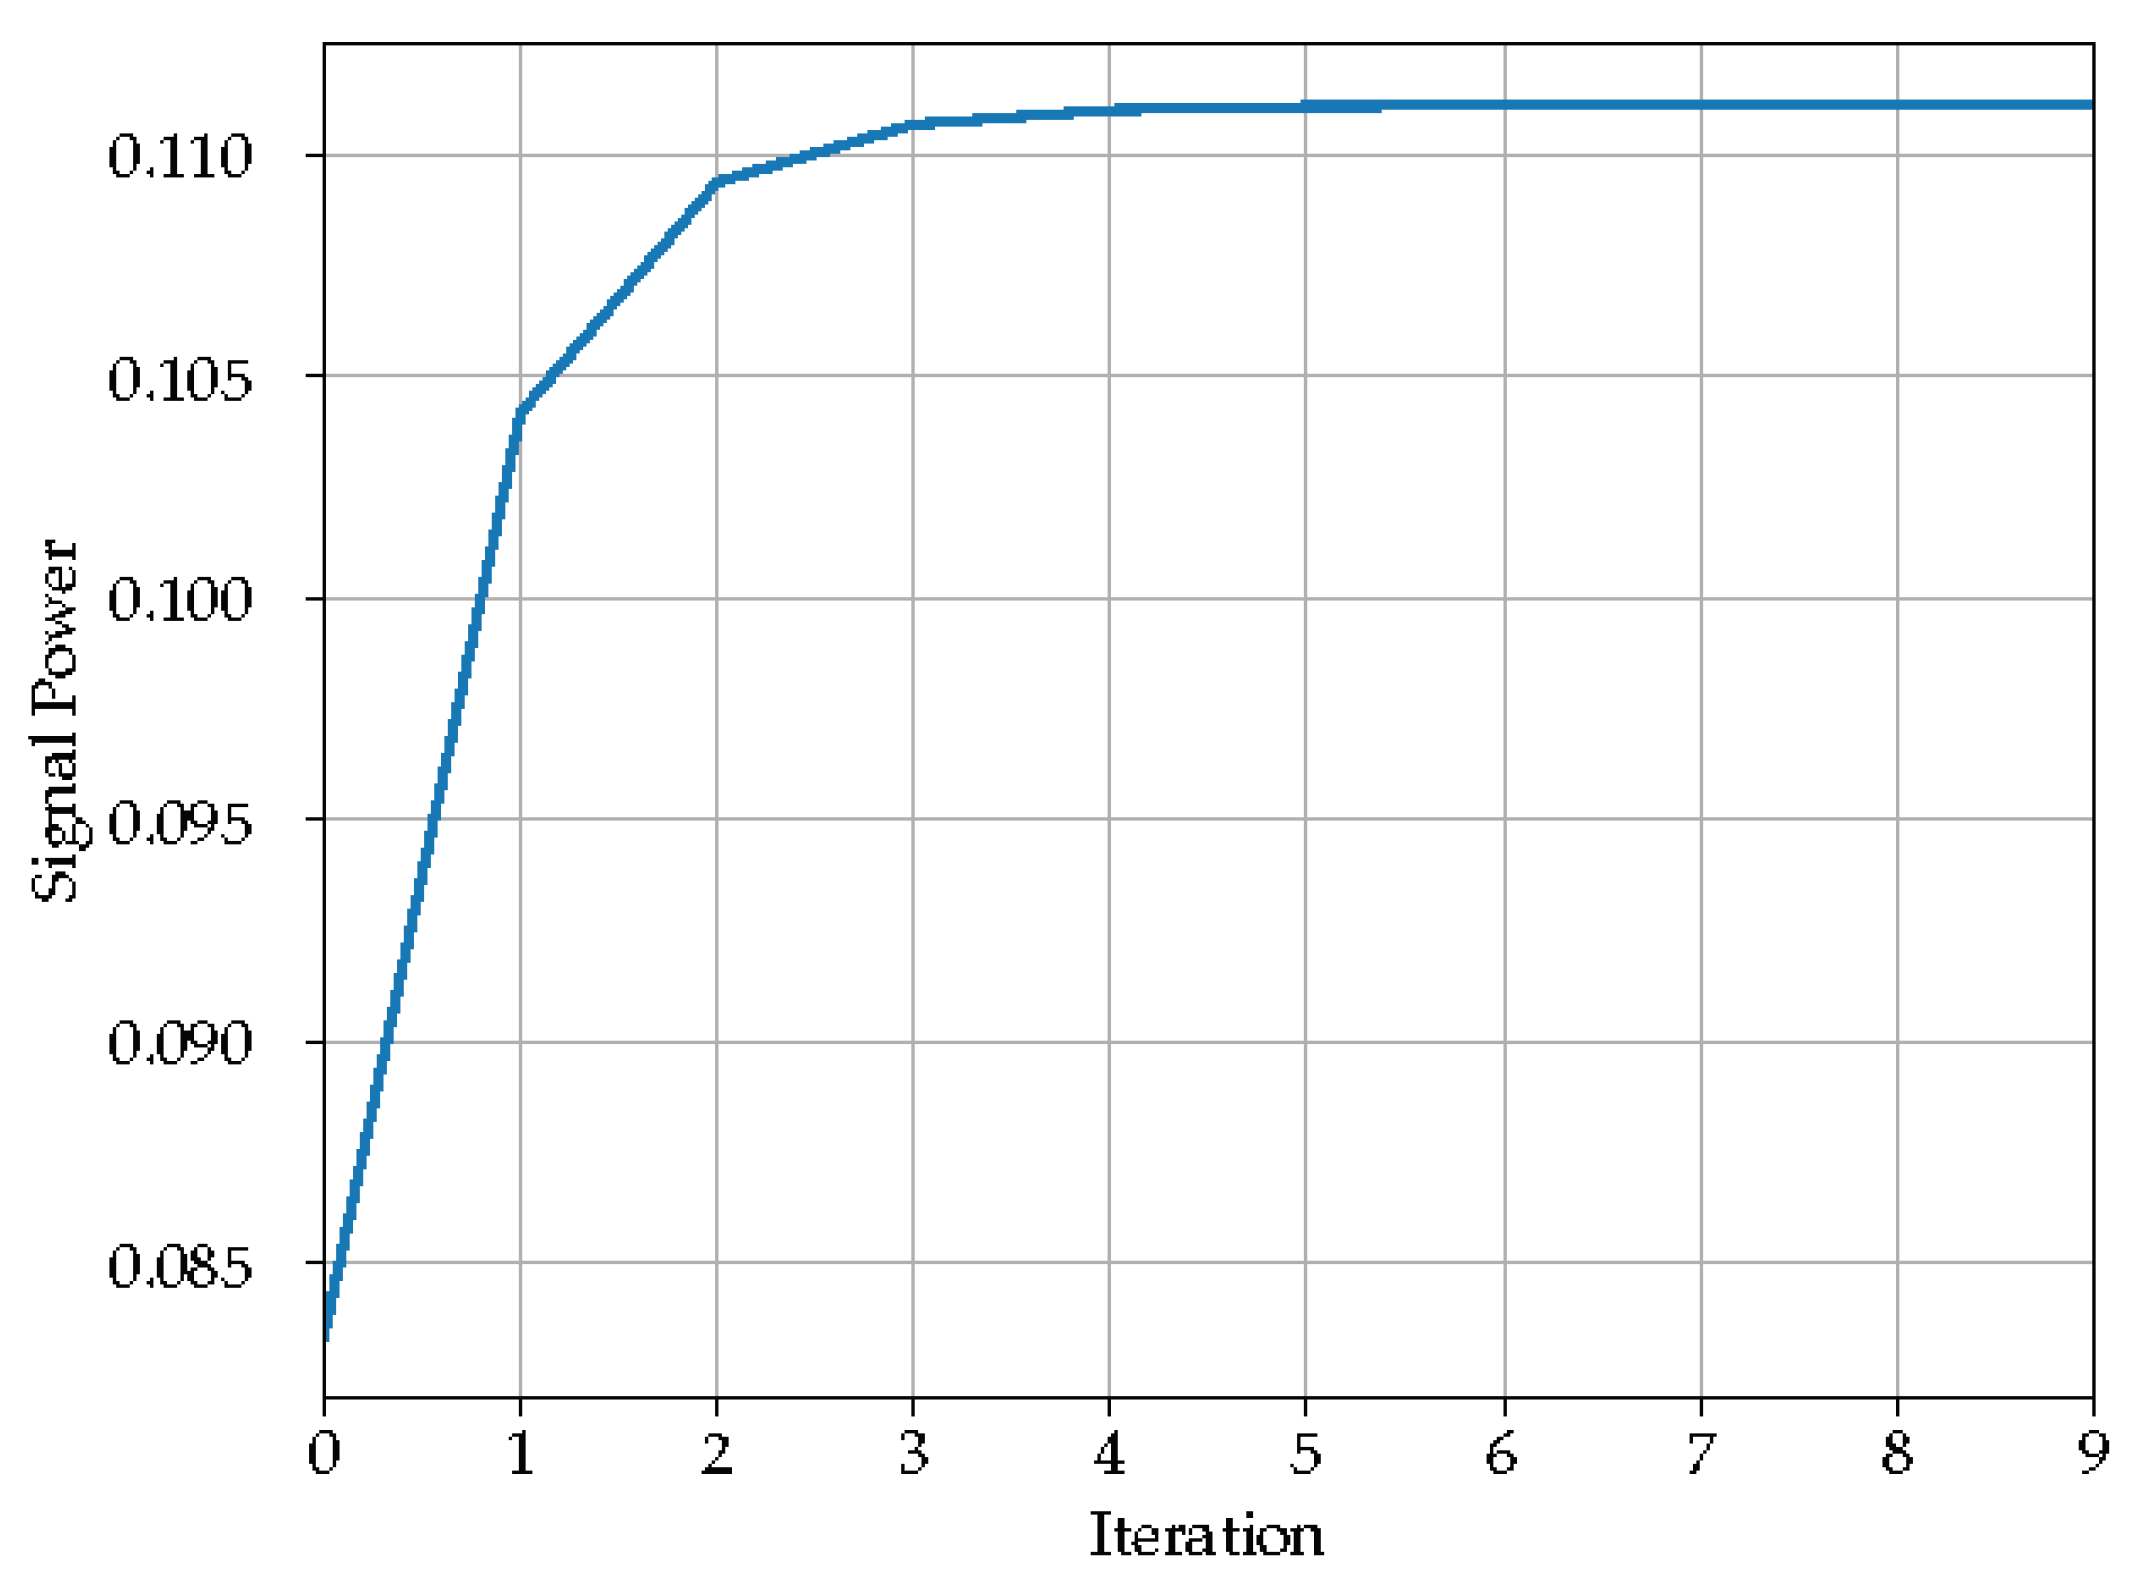
Figure 16 shows that the estimate of the second moment, i.e., the signal power, converges to a final value after about four time steps. As a result, at least four random variables need to be injected per input of the system.
The simulated annealing algorithm is run for 10,000 iterations with an initial temperature of 1 and using Algorithm 4 for neighbor selection. The results are shown in Table 8. Two of the SNR targets (30 dB and 100 dB) are not reached. This is primarily due to the aggressive neighbor selection algorithm used for the simulated annealing algorithm.
In order to meet all the SNR targets, the non-greedy neighbor selection algorithm (Algorithm 5) can be used instead. The results from this neighbor selection algorithm are shown in Table 9.
It can be observed that the 30 dB and 100 dB SNR targets are reached, as well as an overall trend toward solutions that slightly over-allocate resources. Often, not achieving a target SNR can significantly affect the reliability of the signal-processing operation itself. As a result, it is better to over-allocate resources to ensure all target SNRs are achieved, rather than minimize resource usage at the risk of failing to meet an SNR target.

6.6. FIR Filters

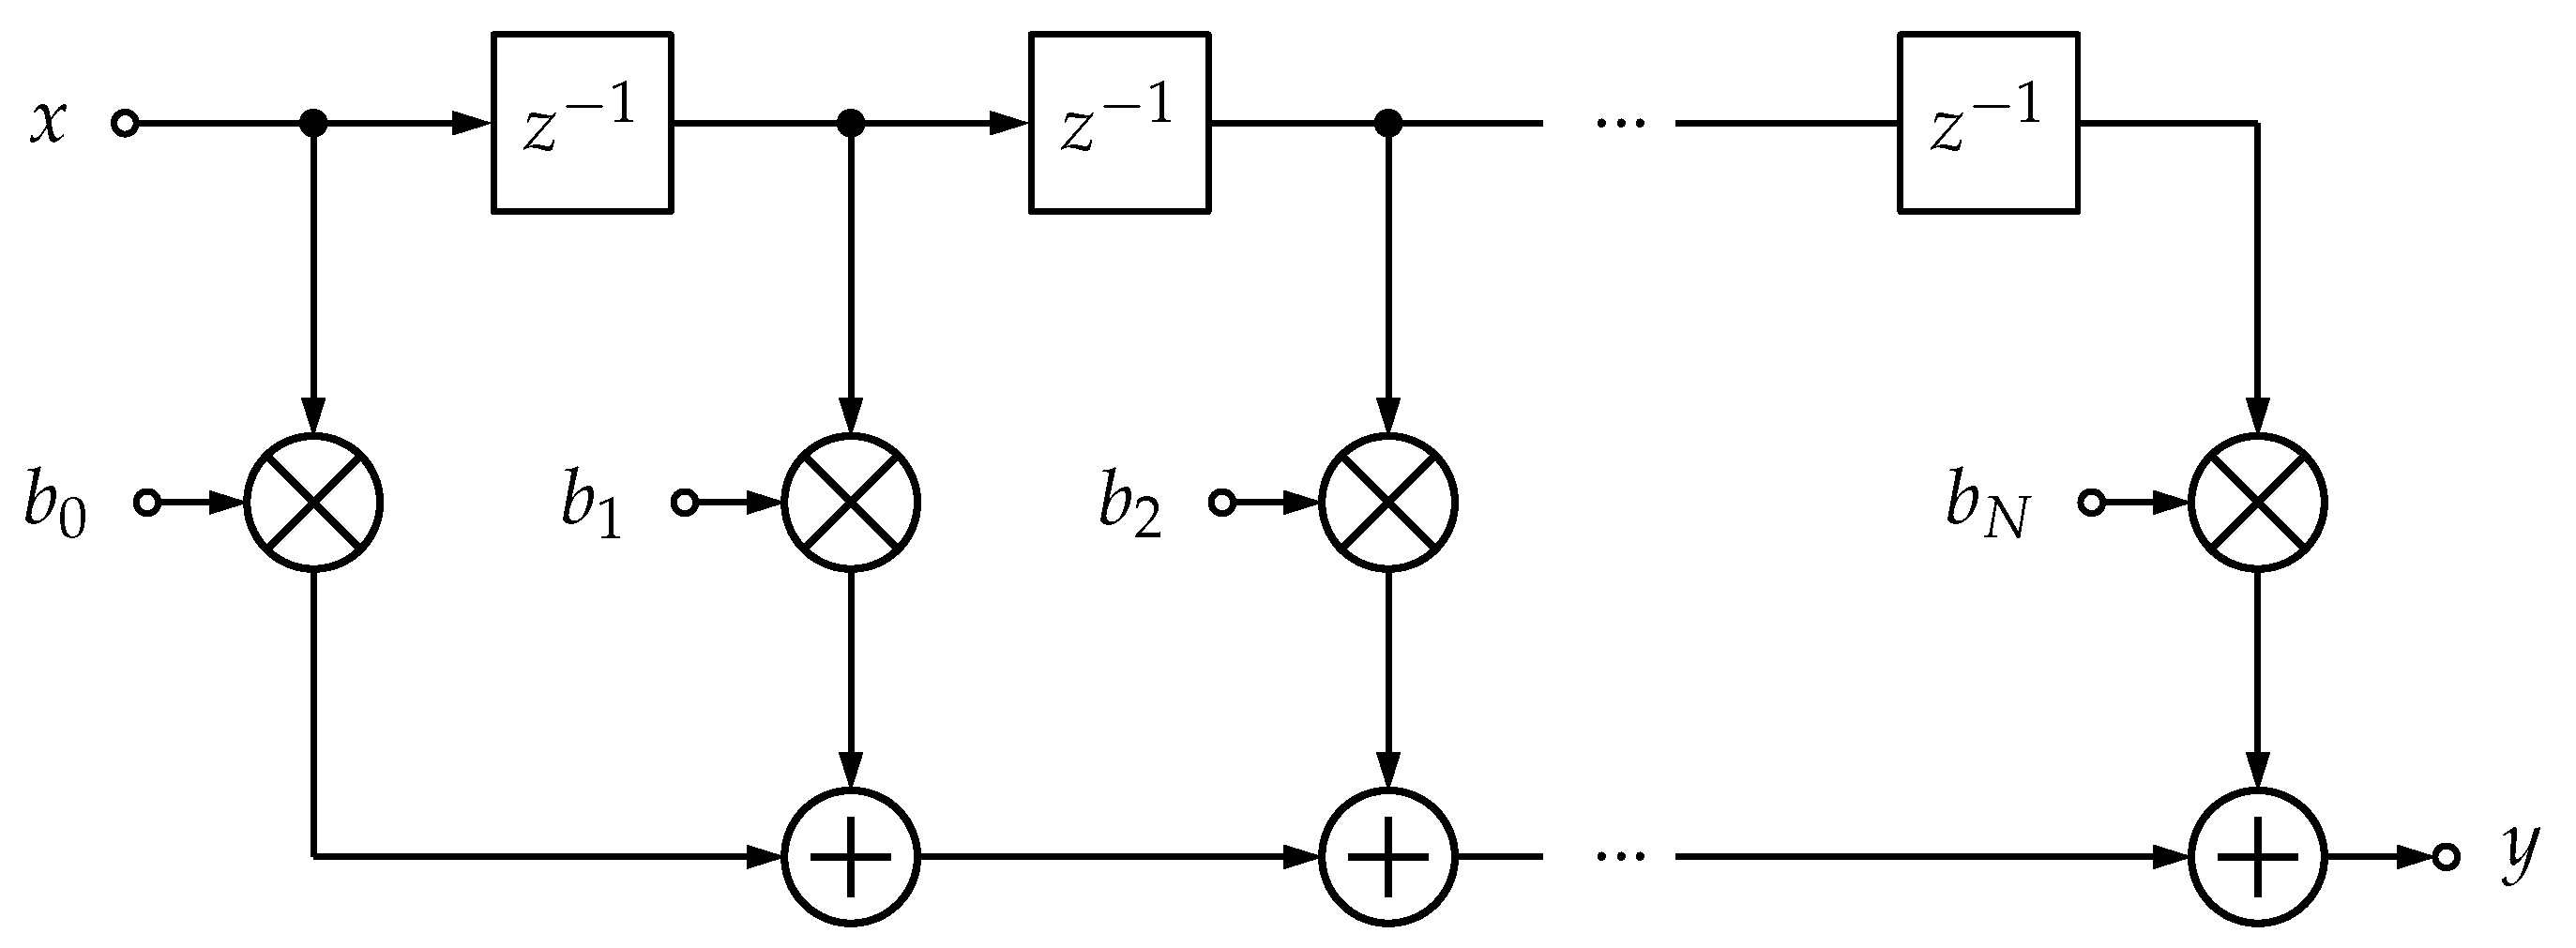
The FIR filter, shown in Figure 17, is a basic building block within modern DSP systems. The target signals for which the bit widths need to be determined are the input and the branches themselves. It can be assumed that all the branches are of the same bit width.
Using 10,000 iterations of the simulated annealing algorithm with the aggressive neighbor selection algorithm (Algorithm 4) and an initial temperature of 1, the following bit widths were obtained for different SNR targets, as shown in Table 10. The FIR filter for this table is a 101-tap low-pass filter with a cutoff of 100 kHz and a sampling rate of 2.4 MHz.
As another example, the results from using Algorithm 5, SAiters=10,000, with an initial temperature of 1 for a 25-tap FIR filter (cutoff = 2 kHz and sampling rate = 8 kHz), are shown in Table 11.
Lastly, the results from using Algorithm 5, SAiters = 100, with an initial temperature of 0.1 for a 251-tap FIR filter (cutoff = 3 kHz and sampling rate = 8 kHz), are shown in Table 12.

6.7. Phase-Locked Loop (PLL)

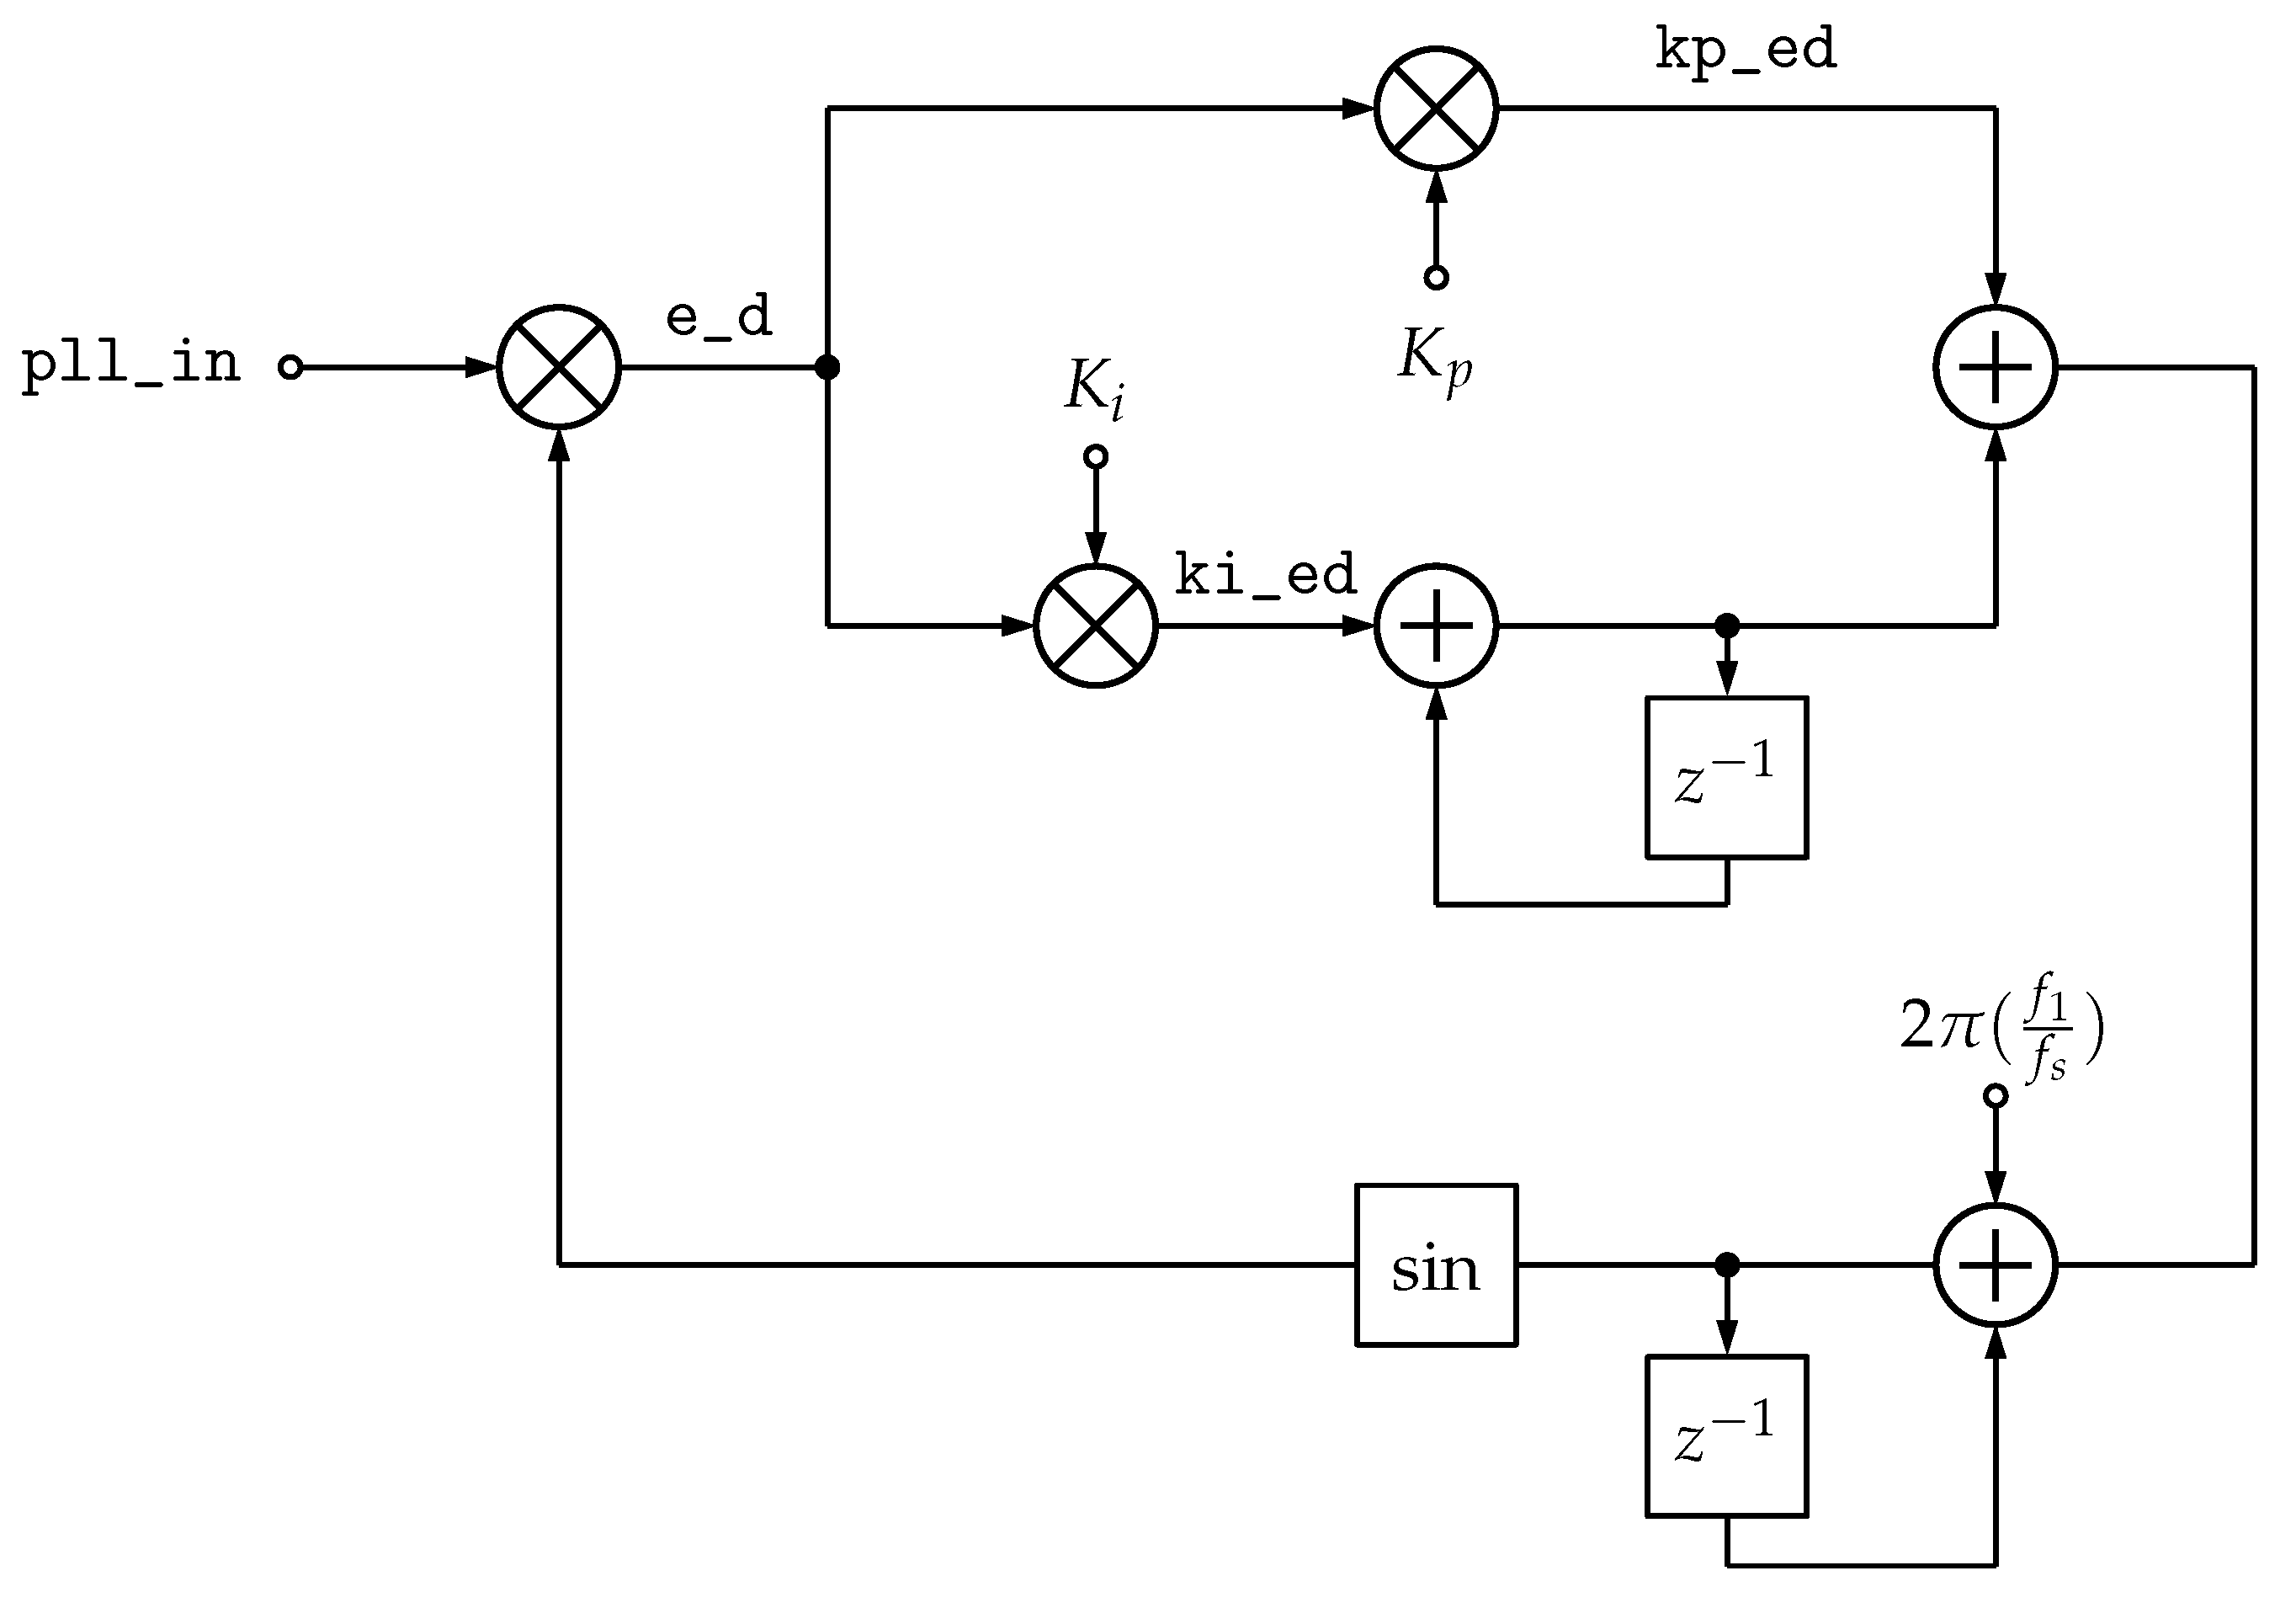
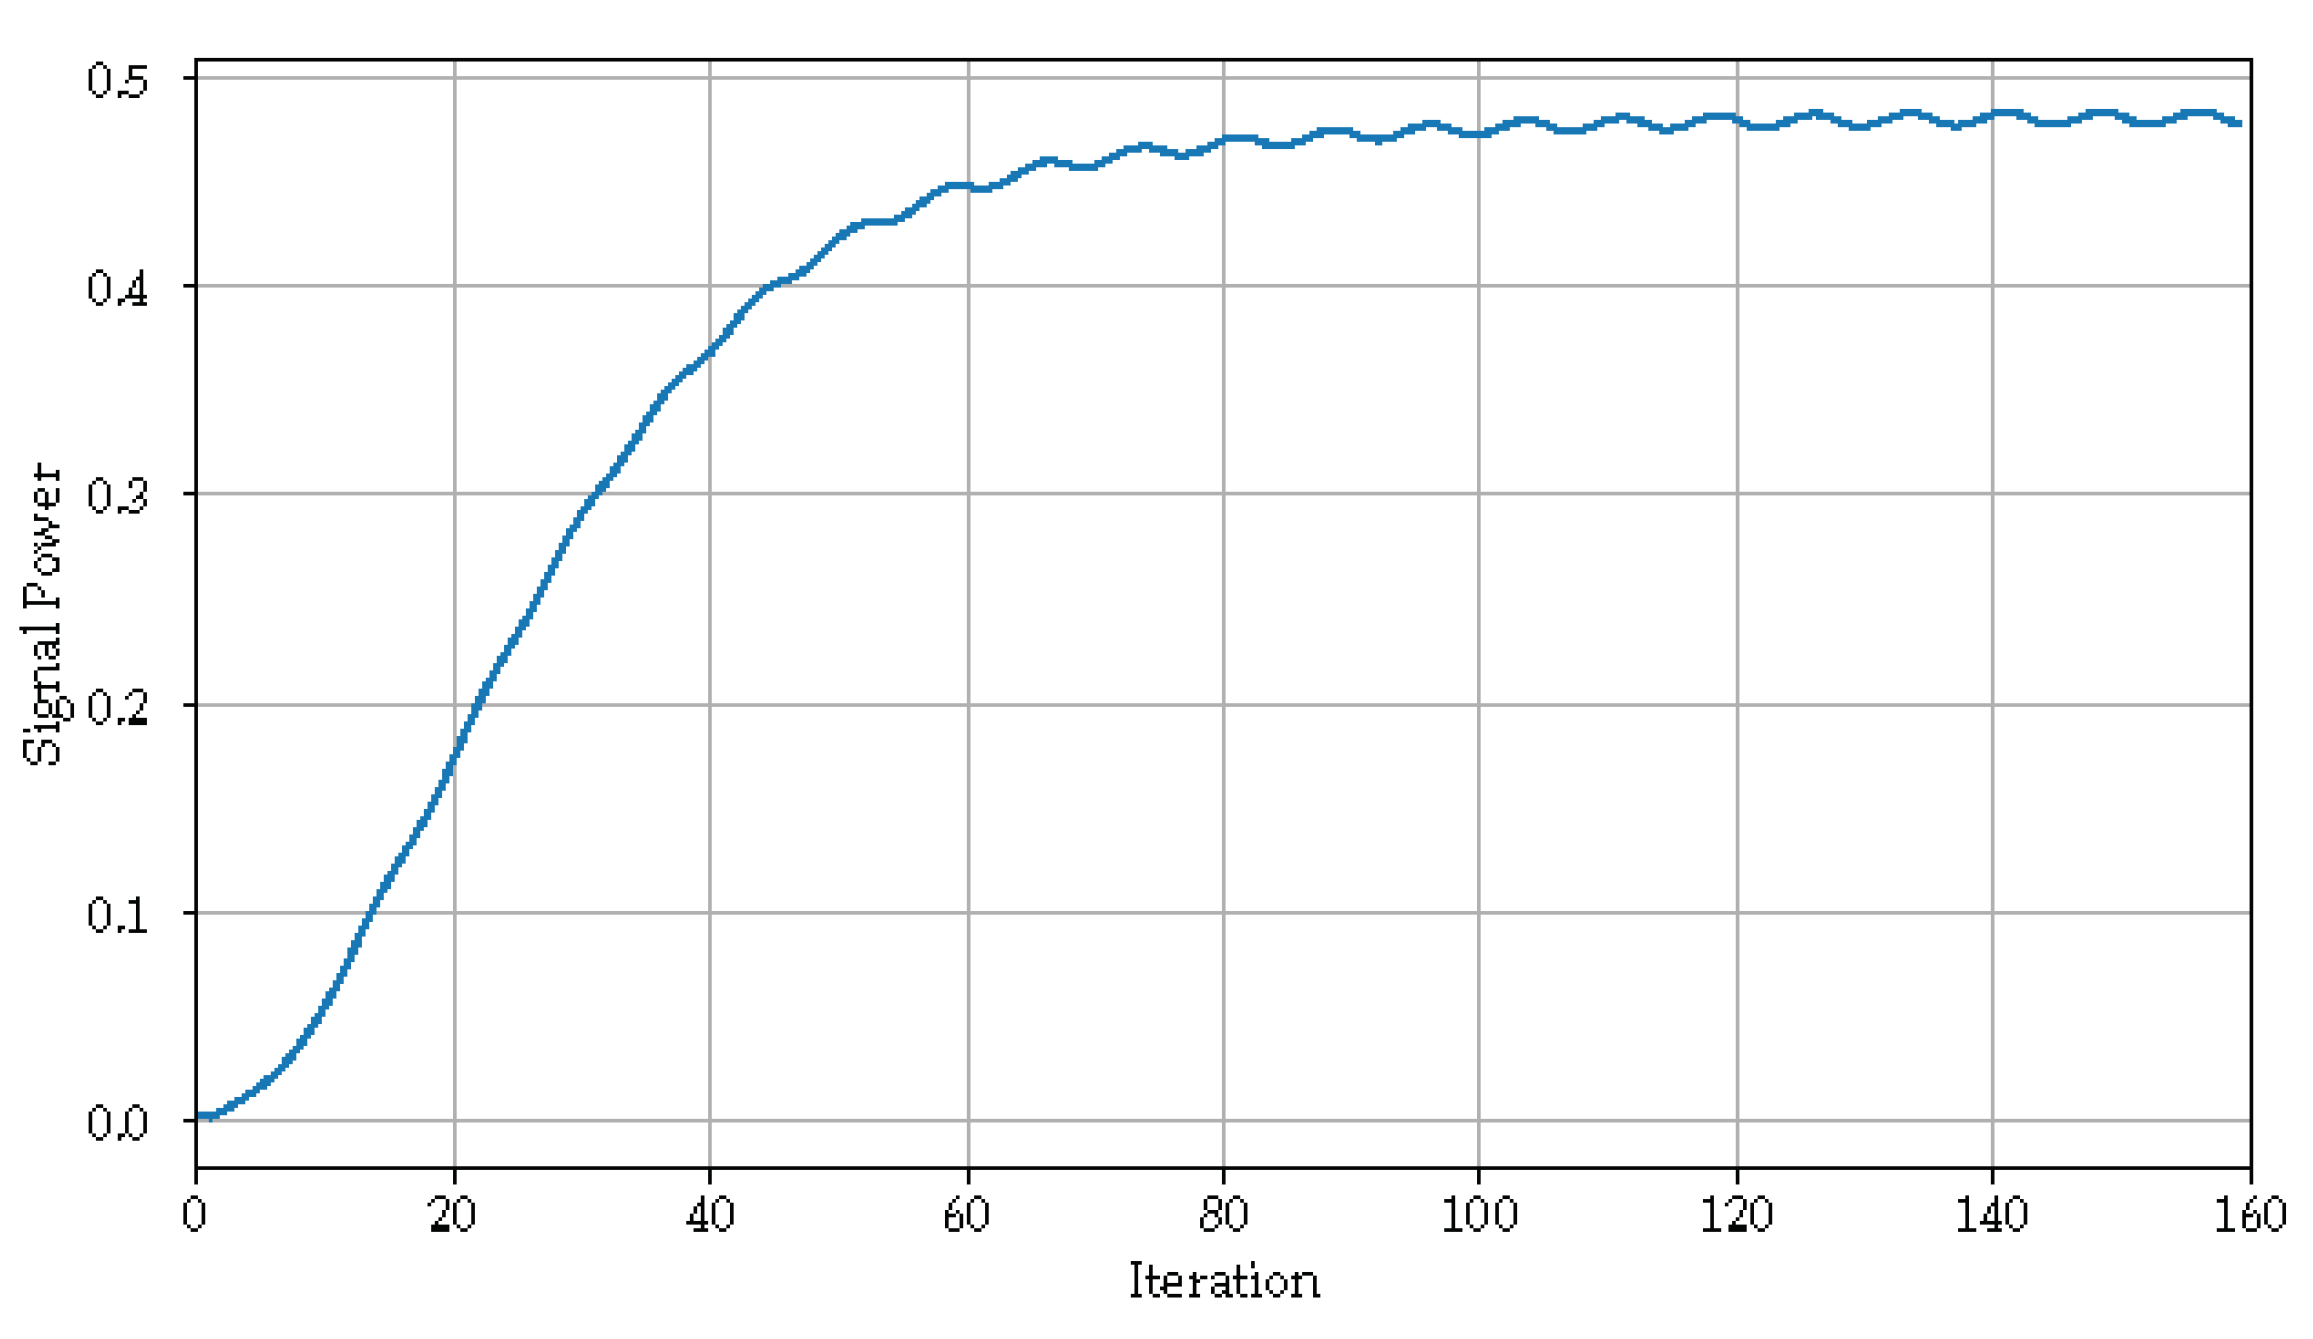
Figure 18 shows the DFG for a phase-locked loop (PLL). The PLL is stable when it tracks a sinusoid within its dynamic operational limits; as a result, the PLL is stabilized for PCE analysis by superimposing a sinusoidal wave on the 0-th index PCE coefficient. A consequence of superimposing this sinusoid is an oscillatory pattern still present even as the signal power PCE estimate converges (as seen in Figure 19).
The PLL has two accumulating structures within it. As a result, a new variable needs to be injected for each PCE simulation time step to accurately model the system. Additionally, like in the IIR filter example, the PCE simulation must be run for a sufficient number of time steps for the output to converge to a final value. Experimentally, it has been observed that this convergence takes about 100 simulation time steps (Figure 19). Since the size of the basis polynomial set increases factorially with the number of random variables (Equation (21)), and the runtime of a multiplier exhibits a cubic dependency on the size of the basis set (Equation (28)), it is clear that 100 random variables cannot be supported. To address this issue, only one distribution with a time-varying mean is propagated. However, this is a big approximation, and the effects of such an estimation will be seen in later results.
The target signals whose bit widths need to be determined are the signals within the loop filter (kp_ed and ki_ed). Using 1000 iterations of the simulated annealing algorithm with Algorithm 4 and an initial temperature of 0, the results in Table 13 can be obtained. Note that using an initial temperature of zero in Equation (41) results in a cooling curve that is always zero. Combining this with the neighbor selection algorithm in Algorithm 4 converts the design space exploration algorithm from a simulated annealing-based approach to a purely greedy algorithm.
More results are presented in Table 14. These results look at the effects of using the simulated annealing algorithm with a non-greedy neighbor selection algorithm (Algorithm 5) and an initial temperature of 10.0.
Table 15 shows that the simulated annealing algorithm either outperforms the greedy algorithm at every target SNR or, at worst, delivers a solution of equivalent quality. The metric used to assess the two solution sets is the overall total bit-width cost required to implement the system. For example, for the 20 dB target with the greedy algorithm, 29 bits were required to attain the 20 dB SNR target. However, by using simulated annealing, which can accept some bad solutions as valid, a solution with 23 total bits can be obtained. Regarding the 20 dB target—by allowing the pll_in signal to be represented with 4 bits instead of 3, the kp_ed and ki_ed signals can have lower bit widths.

7. Discussion

Current methods in bit width estimation such as AA and MC offer either fast or accurate estimates for the round-off noise in a DSP system, but not both. In [31,32,33], AA is used to model the quantization error as it propagates through a DFG. While AA methods are fast, they significantly overestimate the bit widths required. Reference [33] limited the application of AA to LTI and differentiable systems only. As a result the overestimation, while still present, was reduced. In [24], a unique bit width optimization method was presented; however, the authors also stated that expanding this approach to non-linear systems may result in unrealistic error estimates.
While PCE was applied to estimate bit widths in [39], the focus was on overflow error. That paper also highlighted that this approach may be extended to model round-off noise. In this work, we extended PCE to model round-off noise propagation through various blocks used in DSP systems. In addition, we provided algorithms that effectively searched through the design space and obtained bit widths for a desired SNR. Lastly, we showed that while PCE suffers from the curse of dimensionality, by constraining the maximum polynomial degree of the basis set, it is possible to obtain SNR estimates that are comparable to a high number of MC simulations while conducting a fraction of the number of calculations, as would be required in MC.

8. Conclusions

This paper shows that although PCE suffers from the curse of dimensionality, it can still be applied to DSP blocks (often with low dimensionality) to obtain accurate bit widths for its signals within a reasonable runtime. For all the DSP blocks analyzed, PCE bit width estimation was able to obtain accurate estimates of the required bit widths. Compared to affine arithmetic, a significant increase in accuracy is also demonstrated. With respect to MC simulations, a significant increase in runtime even under parallelization is shown. The runtime advantage and the accuracy of the methods presented in this work make them particularly valuable in the early stages of designing fixed-point DSP systems when it is too computationally expensive to carry out MC simulations.

Future Work

Numerous potential future avenues of research are rooted in the application of PCE for estimating bit widths in DSP systems. Similar to other methods used in estimating bit widths, PCE faces challenges in scaling to complex DSP systems. However, we believe that PCE methods have reached a level of maturity such that they can be applied to state-of-the-art FM receivers and DSP systems of similar complexity.
Currently, much of the work used in estimating bit widths can be categorized into analytical methods with simplistic noise models, simulation-based approaches that require significant computing resources, or a combination of the two. Adopting relatively new uncertainty quantification techniques [5,40] for bit width estimation remains unexplored. As a result, exploring how these new techniques can be adapted to this problem would be beneficial.
Additionally, this work has investigated how PCE can be applied to DSP blocks. Increasing the scope and applying PCE to full DSP systems would be beneficial. Due to the curse of dimensionality in PCE, the trade-off between simulation time and simulation accuracy would need to be explored when modeling entire receivers. The Gauss–Legendre quadrature methods for PCE coefficient estimations [5] would be particularly effective to explore.
Lastly, control systems utilizing feedback, such as PLLs, are frequently used in practical DSP systems. However, modeling their behavior using PCE has been a challenge. Extending the approach presented in this work to account for the temporal correlation in the input distributions would help in obtaining better bit width estimates in feedback systems.

Author Contributions

Conceptualization, M.R. and N.N.; methodology, M.R.; software, M.R.; validation, M.R.; investigation, M.R.; visualization, M.R.; supervision, N.N.; funding acquisition, N.N. All authors have read and agreed to the published version of the manuscript.

Funding

This research was funded by the Natural Sciences and Engineering Research Council (NSERC) of Canada, grant number RGPIN-2020-06884.

Data Availability Statement

The data that support the findings of this study are available from the corresponding author, M.R., upon request.

Conflicts of Interest

The authors declare no conflicts of interest.

References

  1. Bishop, P. A Tradeoff Between Microcontroller, DSP, FPGA and ASIC Technologies. EE Times. 2009. Available online: https://www.eetimes.com/a-tradeoff-between-microcontroller-dsp-fpga-and-asic-technologies/ (accessed on 12 January 2025).
  2. Martin, C.; Mike, M.; Dave, J.; Darel, L.; The MathWorks, Inc. Accelerating Fixed-Point Design for MB-OFDM UWB Systems. 2005. Available online: https://www.design-reuse.com/articles/9559/accelerating-fixed-point-design-for-mb-ofdm-uwb-systems.html (accessed on 12 January 2025).
  3. Hill, T. Floating- to Fixed-Point MATLAB Algorithm Conversion for FPGAs. 2007. Available online: https://www.eetimes.com/floating-to-fixed-point-matlab-algorithm-conversion-for-fpgas/ (accessed on 12 January 2025).
  4. Wyglinski, A.; Getz, R.; Collins, T.; Pu, D. Software-Defined Radio for Engineers; Artech House Mobile Communications Series; Artech House: Norwood, MA, USA, 2018; Available online: https://books.google.ca/books?id=cKR5DwAAQBAJ (accessed on 12 January 2025).
  5. McClarren, R.G. Uncertainty Quantification and Predictive Computational Science, 1st ed.; Springer International Publishing: Basel, Switzerland, 2018. [Google Scholar]
  6. Zhou, S.; Gao, W.; Mu, W.; Zheng, Y.; Shao, Z.; He, Y. Machine Learning Based Waveform Reconstruction Demodulation Method for Space Borne AIS Signal. In Proceedings of the 2023 IEEE Globecom Workshops (GC Wkshps), Kuala Lumpur, Malaysia, 4–8 December 2023; pp. 2123–2128. [Google Scholar] [CrossRef]
  7. Lammers, D. Moore’s Law Milestones. 2022. Available online: https://spectrum.ieee.org/moores-law-milestones (accessed on 12 January 2025).
  8. Theodore, S. Rappaport. Wireless Communications: Principles and Practice, 2nd ed.; Pearson Education: Philadelphia, PA, USA, 1996. [Google Scholar]
  9. Fernández–Prades, C.; Arribas, J.; Closas, P.; Avilés, C.; Esteve, L. GNSS-SDR: An Open Source Tool For Researchers and Developers. In Proceedings of the 24th International Technical Meeting of The Satellite Division of the Institute of Navigation (ION GNSS 2011), Portland, OR, USA, 20–23 September 2011; pp. 780–794. [Google Scholar]
  10. Ossmann, M. Software Defined Radio with HackRF, Lesson 1. Available online: https://greatscottgadgets.com/sdr/1/ (accessed on 12 January 2025).
  11. OpenBTS—Ettus Knowledge Base. 2016. Available online: https://kb.ettus.com/OpenBTS (accessed on 12 January 2025).
  12. Mpala, J.; van Stam, G. Open BTS, a GSM Experiment in Rural Zambia. In e-Infrastructure and e-Services for Developing Countries, Proceedings of the 4th International ICST Conference, AFRICOMM 2012, Yaounde, Cameroon, 12–14 November 2012; Jonas, K., Rai, I.A., Tchuente, M., Eds.; Springer: Berlin/Heidelberg, Germany, 2013; pp. 65–73. [Google Scholar]
  13. Plazas, J.E.; Rojas, J.S.; Corrales, J.C. Improving Rural Early Warning Systems Through the Integration of OpenBTS and JAIN SLEE. Rev. Ing. Univ. Medellín 2015, 16, 195–207. [Google Scholar] [CrossRef]
  14. Goldberg, D. What every computer scientist should know about floating-point arithmetic. ACM Comput. Surv. 1991, 23, 5–48. [Google Scholar] [CrossRef]
  15. Parhami, B. Computer Arithmetic Algorithms and Hardware Designs; Oxford University Press: New York, NY, USA, 2009. [Google Scholar]
  16. Chung, C.; Kintali, K. HDL Coder Self-Guided Tutorial. 2023. Available online: https://github.com/mathworks/HDL-Coder-Self-Guided-Tutorial/releases/tag/1.72.0 (accessed on 12 January 2025).
  17. Hettiarachchi, D.L.N.; Davuluru, V.S.P.; Balster, E.J. Integer vs. Floating-Point Processing on Modern FPGA Technology. In Proceedings of the 2020 10th Annual Computing and Communication Workshop and Conference (CCWC), Las Vegas, NV, USA, 6–8 January 2020; pp. 0606–0612. [Google Scholar] [CrossRef]
  18. Oberstar, E.L. Fixed-Point Representation & Fractional Math. Oberstar Consulting. 2007. Available online: http://darcy.rsgc.on.ca/ACES/ICE4M/FixedPoint/FixedPointRepresentationFractionalMath.pdf (accessed on 12 January 2025).
  19. Esteban, L.; López, J.A.; Sedano, E.; Hernández-Montero, S.; Sánchez, M. Quantization Analysis of the Infrared Interferometer of the TJ-II Stellarator for its Optimized FPGA-Based Implementation. IEEE Trans. Nucl. Sci. 2013, 60, 3592–3596. [Google Scholar] [CrossRef]
  20. Liu, B. Effect of finite word length on the accuracy of digital filters—A review. IEEE Trans. Circuit Theory 1971, 18, 670–677. [Google Scholar] [CrossRef]
  21. Chan, D.; Rabiner, L. Analysis of quantization errors in the direct form for finite impulse response digital filters. IEEE Trans. Audio Electroacoust. 1973, 21, 354–366. [Google Scholar] [CrossRef]
  22. Rabiner, L.; McClellan, J.; Parks, T. FIR digital filter design techniques using weighted Chebyshev approximation. Proc. IEEE 1975, 63, 595–610. [Google Scholar] [CrossRef]
  23. Kan, E.; Aggarwal, J. Error analysis of digital filter employing floating-point arithmetic. IEEE Trans. Circuit Theory 1971, 18, 678–686. [Google Scholar] [CrossRef]
  24. Sarbishei, O.; Radecka, K.; Zilic, Z. Analytical Optimization of Bit-Widths in Fixed-Point LTI Systems. IEEE Trans. Comput.-Aided Des. Integr. Circuits Syst. 2012, 31, 343–355. [Google Scholar] [CrossRef]
  25. Rowell, A.S. Digital Filters with Quantized Coefficients: Optimization and Overflow Analysis Using Extreme Value Theory. Ph.D. Thesis, Stanford University, Stanford, CA, USA, 2012. [Google Scholar]
  26. McClellan, J.; Parks, T.; Rabiner, L. A computer program for designing optimum FIR linear phase digital filters. IEEE Trans. Audio Electroacoust. 1973, 21, 506–526. [Google Scholar] [CrossRef]
  27. López, J.; Caffarena, G.; Carreras, C.; Nieto-Taladriz, O. Fast and accurate computation of the round-off noise of linear time-invariant systems. IET Circuits Devices Syst. 2008, 2, 393. [Google Scholar] [CrossRef]
  28. Mehrotra, A. Noise analysis of phase-locked loops. IEEE Trans. Circuits Syst. I Fundam. Theory Appl. 2002, 49, 1309–1316. [Google Scholar] [CrossRef]
  29. Kinsman, A. A Computational Approach to Custom Data Representation for Hardware Accelerators. Ph.D. Thesis, McMaster University, Hamilton, ON, USA, 2010. [Google Scholar]
  30. de Figueiredo, L.H.; Stolfi, J. Affine Arithmetic: Concepts and Applications. Numer. Algorithms 2004, 37, 147–158. [Google Scholar] [CrossRef]
  31. Vakili, S.; Langlois, J.M.P.; Bois, G. Enhanced Precision Analysis for Accuracy-Aware Bit-Width Optimization Using Affine Arithmetic. IEEE Trans. Comput.-Aided Des. Integr. Circuits Syst. 2013, 32, 1853–1865. [Google Scholar] [CrossRef]
  32. Lee, D.U.; Gaffar, A.; Cheung, R.; Mencer, O.; Luk, W.; Constantinides, G. Accuracy-Guaranteed Bit-Width Optimization. IEEE Trans. Comput.-Aided Des. Integr. Circuits Syst. 2006, 25, 1990–2000. [Google Scholar] [CrossRef]
  33. Caffarena, G.; Carreras, C.; López, J.A.; Fernández, Á. SQNR Estimation of Fixed-Point DSP Algorithms. EURASIP J. Adv. Signal Process. 2010, 2010, 171027. [Google Scholar] [CrossRef]
  34. Wu, B. Dynamic range estimation for systems with control-flow structures. In Proceedings of the Thirteenth International Symposium on Quality Electronic Design (ISQED), Santa Clara, CA, USA, 19–21 March 2012; pp. 370–377. [Google Scholar] [CrossRef]
  35. Grupp, A.; Albaraghtheh, T. Polynomial Chaos Expansion. Available online: https://dictionary.helmholtz-uq.de/content/PCE.html (accessed on 12 January 2025).
  36. Xiu, D.; Karniadakis, G.E. The Wiener–Askey Polynomial Chaos for Stochastic Differential Equations. SIAM J. Sci. Comput. 2002, 24, 619–644. [Google Scholar] [CrossRef]
  37. Kirkpatrick, S.; Gelatt, C.D.; Vecchi, M.P. Optimization by Simulated Annealing. Science 1983, 220, 671–680. [Google Scholar] [CrossRef] [PubMed]
  38. Lyons, R.G. Understanding Digital Signal Processing, 3rd ed.; Prentice Hall: Philadelphia, PA, USA, 2010. [Google Scholar]
  39. Wu, B.; Zhu, J.; Najm, F. An analytical approach for dynamic range estimation. In Proceedings of the 41st Design Automation Conference, San Diego, CA, USA, 7–11 July 2004; pp. 472–477. [Google Scholar]
  40. Sullivan, T.J. Introduction to Uncertainty Quantification, 1st ed.; Texts in Applied Mathematics; Springer International Publishing: Cham, Switzerland, 2015. [Google Scholar]
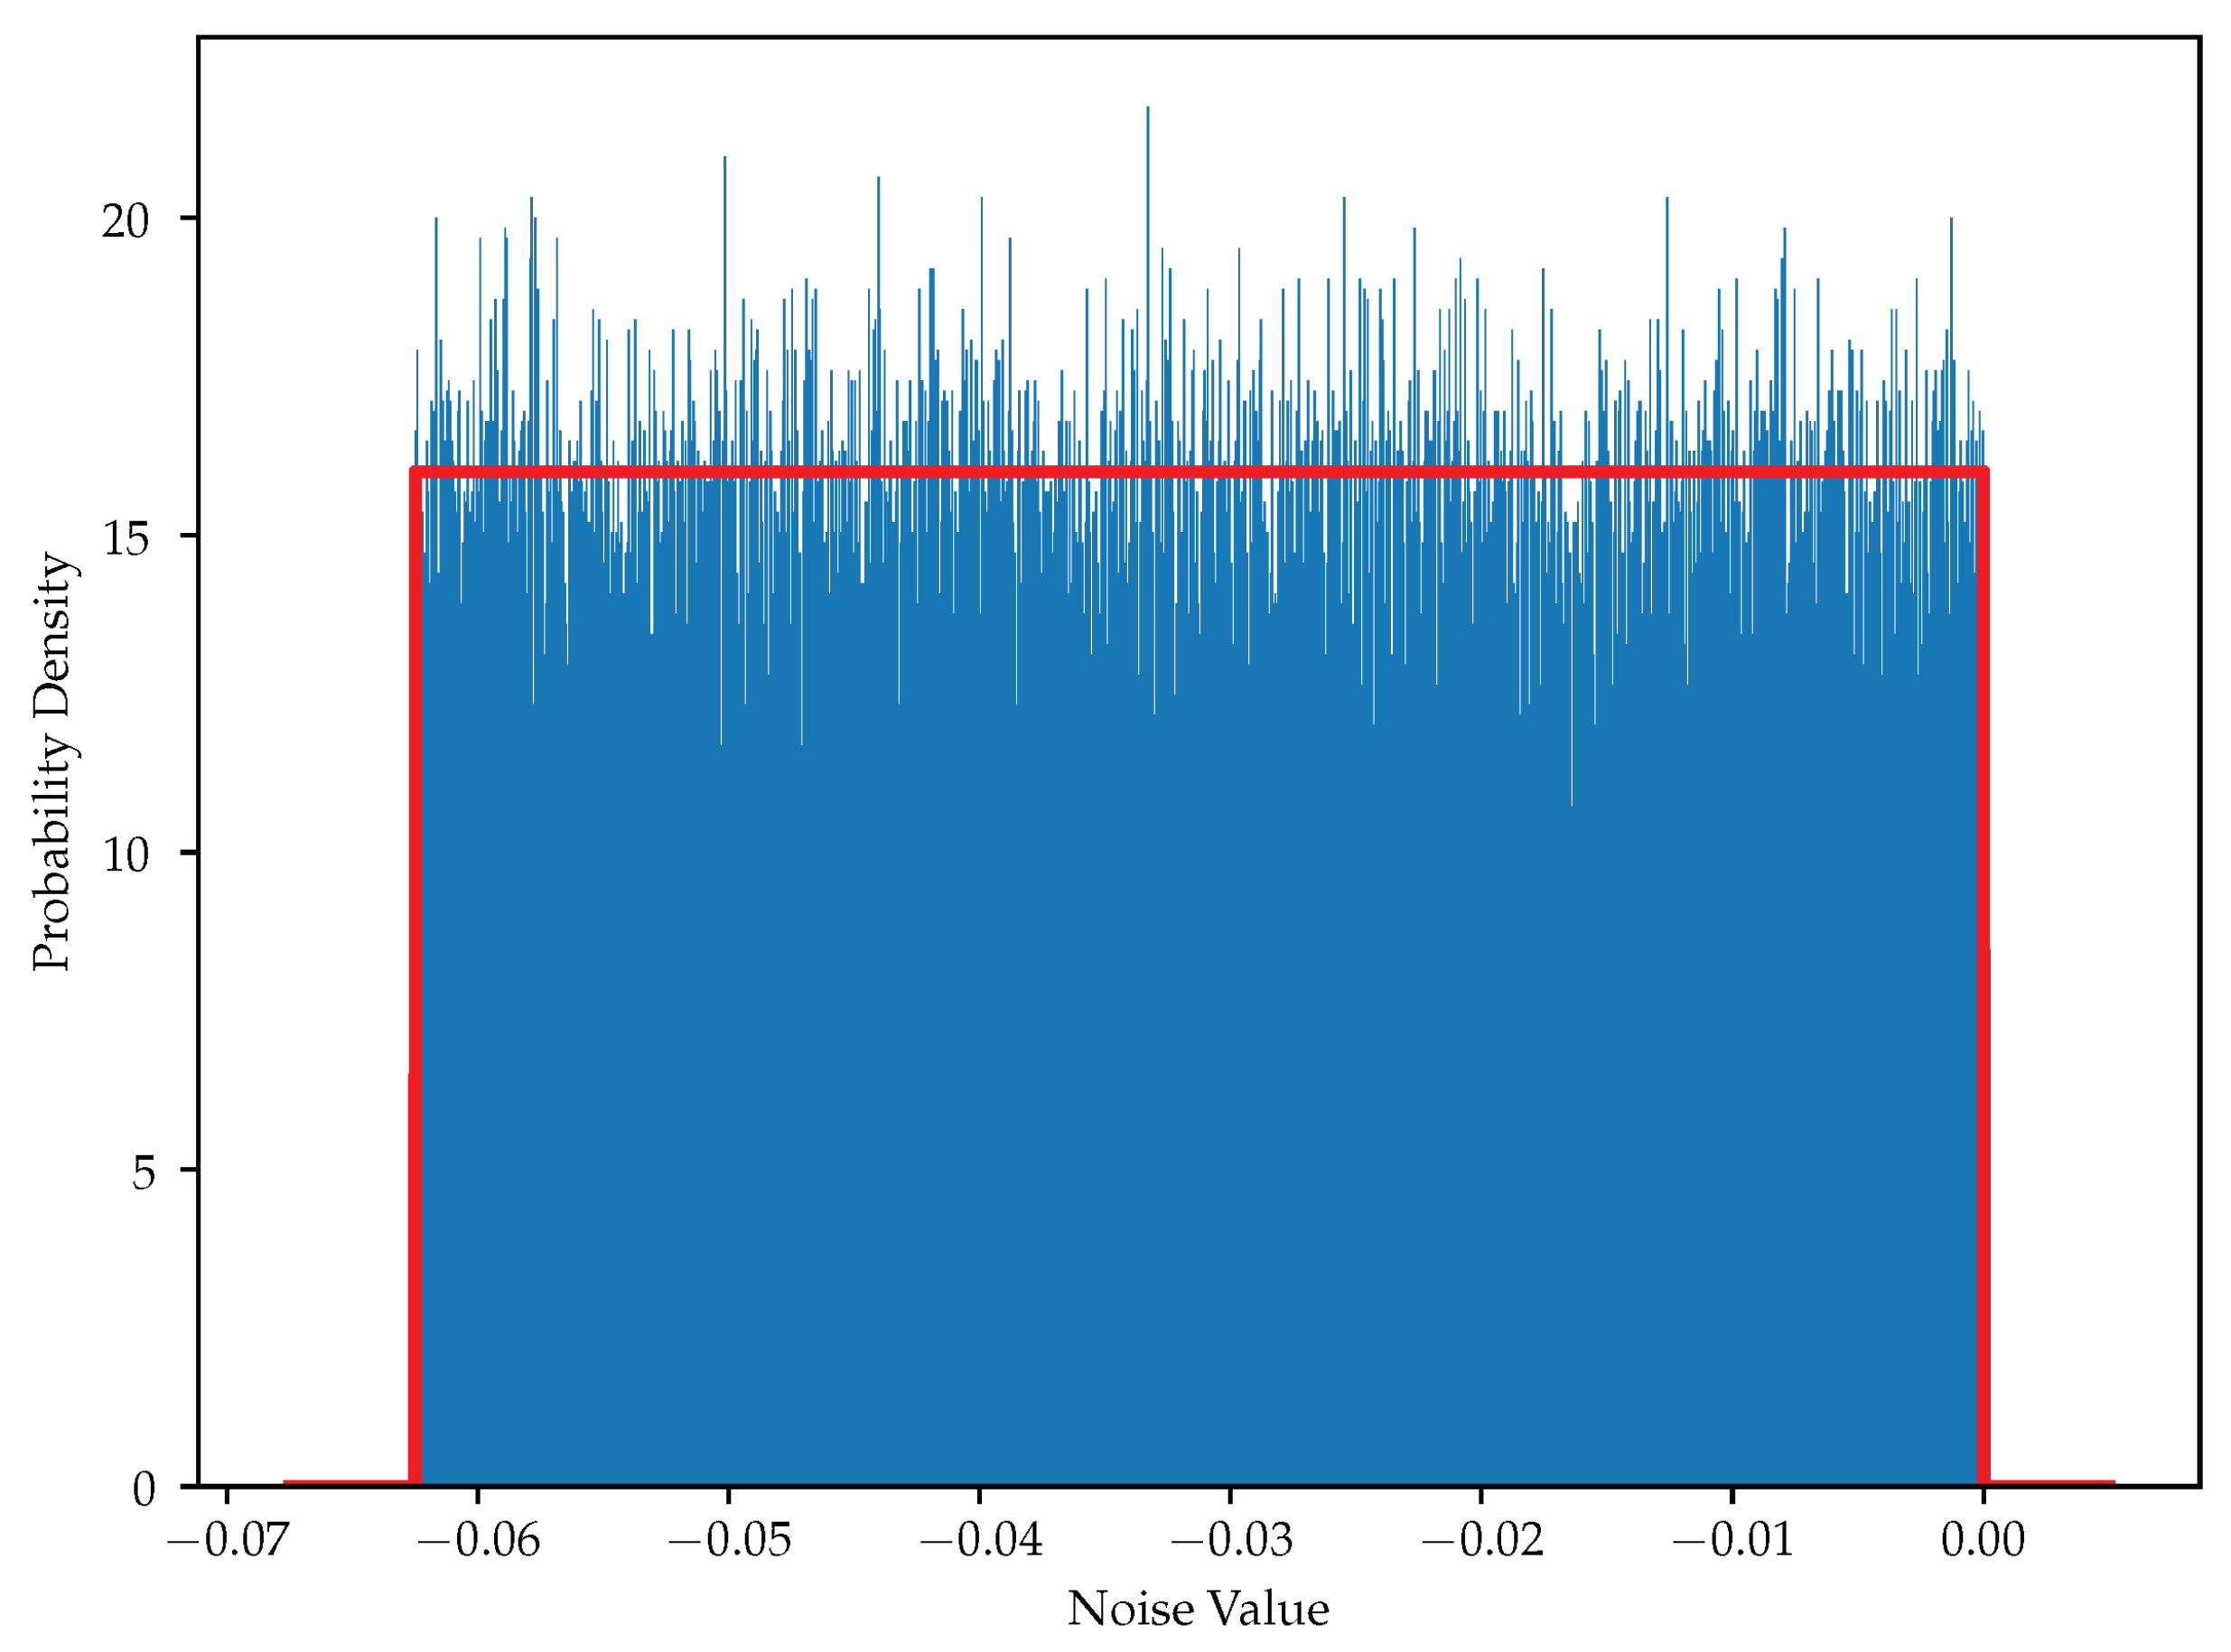
Figure 1. Truncation quantizer.
Electronics 14 00365 g001
Figure 2. Scaling operation.
Electronics 14 00365 g002
Figure 3. Addition/subtraction operation.
Electronics 14 00365 g003
Figure 4. Multiplication operation.
Electronics 14 00365 g004
Figure 5. Delay operation.
Electronics 14 00365 g005
Figure 6. Simple DSP system.
Electronics 14 00365 g006
Figure 7. Histogram of actual and PCE-predicted distributions at the output.
Electronics 14 00365 g007
Figure 8. DFG with noise nodes added.
Electronics 14 00365 g008
Figure 9. Histogram of actual and PCE-predicted noise distributions at output.
Electronics 14 00365 g009
Figure 10. SNR estimate vs. number of MC samples.
Electronics 14 00365 g010
Figure 11. Data flow graph for a third-order Taylor series approximation of sin ( x ) around x = x 0 .
Electronics 14 00365 g011
Figure 12. Histogram of the predicted and actual noise distribution, along with the bit-widths corresponding to 15 dB.
Electronics 14 00365 g012
Figure 13. Data Flow Graph for an FM Demodulator.
Electronics 14 00365 g013
Figure 14. FM demodulator histogram of predicted and actual noise distribution with bit widths corresponding to 70 dB.
Electronics 14 00365 g014
Figure 15. Single pole IIR filter.
Electronics 14 00365 g015
Figure 16. Convergence of signal power at the IIR filter output.
Electronics 14 00365 g016
Figure 17. N-Tap FIR filter.
Electronics 14 00365 g017
Figure 18. Phase-locked loop data flow graph.
Electronics 14 00365 g018
Figure 19. Convergence of signal power at the PLL output.
Electronics 14 00365 g019
Table 1. Distributions and their associated polynomials [36].
DistributionBasis Functions for PCE
UniformLegendre polynomials
GaussianHermite polynomials
BetaJacobi polynomials
GammaLaguerre polynomials
PoissonCharlier polynomials
Negative binomialMeixner polynomials
BinomialKrawtchouk polynomials
HypergeometricHahn polynomials
Table 2. PCE coefficients at each node of the DFG.
Node LabelPCE Coefficient
a 1 4 0 0 0 0
b 0 0 1 0 0 0
add 1 4 1 0 0 0
mult0 0.2 0.8 0.2 0 0 0
mult1 0.2 0 0.2 0 0.8 0.2
out 0.8 4 0.2 0 0.8 0.2
Table 3. Signal bit width configuration.
SignalBit Width
a5
b5
mult03
mult12
Table 4. Accuracy of AA and PCE compared to MC.
Simulation MethodSNR
MC (10,000,000 samples)30.71 dB
MC (100,000 samples)30.78 dB
AA19.68 dB
PCE with maximum polynomial degree = 130.70 dB
Table 5. Bit widths for a target SNR of 20 dB.
SNR tgt (dB)Signal Bit Width (Bits) SNR MC (dB)
abmult0mult1
20111120.93
Table 6. Bit widths for the DFG in Figure 11 with x 0 = 2 .
SNR tgt (dB)Signal Bit Width (Bits) SNR MC (dB)
x x 2 x 3 topmidbot
1511111115.93
2022131320.37
2551142426.00
3053236330.63
3547544835.18
4056156640.18
4565267745.79
5087497650.26
60111141011860.24
70128912121070.17
801111912131382.25
901412916141690.07
100161512151515100.22
Table 7. FM demodulator bit widths.
SNR tgt (dB)Signal Bit Width (Bits) SNR MC (dB)
IQmult0mult1
15332215.04
20363320.18
25444525.46
30847830.02
35587635.17
40677740.03
45877945.05
50989850.80
60101291260.08
701112121270.13
801513131380.18
901715141690.08
10018181616100.27
Table 8. IIR filter bit widths using Algorithm 4.
SNR tgt (dB)Signal Bit Width (bits) SNR MC (dB)
xx_cy_dc
1523417.15
2034420.08
2545526.14
3047629.12
3557735.15
4067941.89
4578947.15
5089950.24
6011111263.22
7012131270.82
8013141480.32
9014161790.06
10016181797.62
Table 9. IIR filter bit widths using Algorithm 5.
SNR tgt (dB)Signal Bit Width (Bits) SNR MC (dB)
xx_cy_dc
1524517.79
2035523.09
2546629.17
3067634.69
3568738.23
4078844.17
45791047.92
508101053.21
6010131162.28
7012131374.27
8013151583.32
9016161793.34
100171818104.44
Table 10. Bit widths of a 101-tap low-pass FIR filter using Algorithm 4.
SNR tgt (dB)Signal Bit Width (Bits) SNR MC (dB)
xbranch_bitwidth
154718.95
205824.59
2541029.08
3041630.13
3561139.01
4091141.69
4591247.40
50101353.34
60111564.85
70141671.49
80151883.36
90162094.82
1001921101.65
Table 11. Bit widths of a 25-tap low-pass FIR filter using Algorithm 5.
SNR tgt (dB)Signal Bit Width (Bits) SNR MC (dB)
xbranch_bitwidth
153520.75
203723.74
255732.26
305834.87
356940.75
4071046.69
4581049.96
5081253.66
60101364.67
70131475.30
80141685.95
90151894.71
1001819105.31
Table 12. Bit widths of a 251-tap low-pass FIR filter using Algorithm 4.
SNR tgt (dB)Signal Bit Width (Bits) SNR MC (dB)
xbranch_bitwidth
153722.41
205726.85
255830.84
3051035.34
3561039.66
4091043.15
4591148.59
50101254.51
60101565.32
70141572.42
80151784.19
90161995.43
1001920102.42
Table 13. PLL signal bit widths with a greedy algorithm.
SNR tgt (dB)Signal Bit Width (Bits) SNR MC (dB)
pll_ine_dkp_edki_ed
15344927.34
203491332.75
256561036.30
30105101345.57
357771244.79
408781451.67
45109111360.34
50911101459.14
601011131678.24
701213131879.47
801416142087.03
9017151823103.23
10018171923111.16
Table 14. PLL signal bit widths with simulated annealing.
SNR tgt (dB)Signal Bit Width (Bits) SNR MC (dB)
pll_ine_dkp_edki_ed
15344927.34
204451033.06
254561137.41
306661237.82
356871244.70
408781451.76
459891455.77
5099101558.93
601011131670.86
701213131682.17
801414152089.14
901617162198.78
10015171622110.84
Table 15. Savings in bit widths using a non-greedy neighbor selection vs. a greedy neighbor selection.
SNR tgt (dB)Total Number of BitsBit Savings
Greedy AlgorithmNon-Greedy Algorithm
1520200
2029236
2527261
3038308
3533330
4037370
4543403
5044431
6050500
7056542
8064631
9073703
10077707
Disclaimer/Publisher’s Note: The statements, opinions and data contained in all publications are solely those of the individual author(s) and contributor(s) and not of MDPI and/or the editor(s). MDPI and/or the editor(s) disclaim responsibility for any injury to people or property resulting from any ideas, methods, instructions or products referred to in the content.