Article

A GNN-Based Placement Optimization Guidance Framework by Physical and Timing Prediction

National ASIC System Engineering Center, Southeast University, Nanjing 210096, China
*
Author to whom correspondence should be addressed.
Electronics 2025, 14(2), 329; https://doi.org/10.3390/electronics14020329
Submission received: 21 December 2024 / Revised: 8 January 2025 / Accepted: 14 January 2025 / Published: 15 January 2025

Abstract

:
Placement is crucial in physical design flow with significant impact on later routability and ultimate manufacturability in terms of performance, power, and area (PPA), which may deviate from finding the optimal solution and/or lead to unnecessary iterations suffering from interleaved optimization steps and inaccurate PPA estimation. To solve this issue, we propose a physical- and timing-related placement optimization guidance framework which provides candidate gate sizing and buffer insertion solutions as well as a path group for potential violated paths based on graph neural networks (GNNs) to improve placement quality significantly and efficiently. Experimental results on the OpenCores benchmarks with 22 nm technology demonstrate that the proposed placement optimization guidance framework achieves up to 35.66% and 43.51% worst negative slack (WNS) and total negative slack (TNS) improvement and 52.17% reduction in the number of violating paths (NVP), which is beneficial to later routing stages with 2.33% wirelength decrease.

1. Introduction

Placement is crucial in the physical implementation of circuit design, which directly influences performance, power consumption, area efficiency, routing, and manufacturing of the final chip [1]. In order to ensue that the placement satisfies design constraints while achieving the desired objectives, interleaved optimization operations including gate sizing and buffer insertion are performed aiming at timing closure. This results in changes in functional behavior in terms of netlist topology and the related physical and timing performance, which introduce severe challenges to prior heuristic or analytic placement methods, leading to sub-optimal optimization results and increased turnaround time [2].
The impact of placement optimization is significant and is reflected in two key perspectives. From the physical perspective, the operations of gate sizing and buffer insertion would have a profound impact on the interconnect lengths and potential routing cost for later design flow. With consideration of topology reconstruction as well as the related load capacitance information, the solution for the NP-hard combinational issue of cell placement would be sub-optimal [3,4]. In spite of the availability of machine learning (ML) approaches which focus on the prediction or generation of the sizing and buffering solutions at the placement stage [5,6], few of them apply the predicted sizing and/or buffering solutions into modern design flow so as to guide placement optimization with quality and efficiency improvement. From the timing perspective, timing-driven placement is preferred to produce immediate performance benefits rather than only focusing on the interconnect [7]. Without considering the influence of interleaved optimization steps, the circuit timing would be dramatically overestimated or underestimated so that the placement may be misled. Moreover, for path group-based timing optimization in traditional design flow, only the most critical path is targeted for optimization while the other sub-critical paths are ignored to save runtime [8], which may suffer from additional iterations for the purpose of fixing all violated paths. Recent ML-based methods have been applied for accurate cross-stage timing prediction but few of them take the impact of circuit optimization as well as ad hoc optimization strategies to sub-critical paths into consideration [9,10].
To take the above issues into full consideration, we propose a universal placement optimization guidance framework that provides comprehensive physical- and timing-related guidance generated by a graph neural network (GNN) to enhance the quality and efficiency of detail placement, where the candidate gate sizing and buffer insertion solutions as well as the path group for potential violated paths are predicted to guide the optimization at later detail placement stages. Our key contributions are summarized as follows:
  • A physical- and timing-related placement guidance framework is proposed based on a GNN to achieve significant quality improvement over traditional design tool flow with candidate solutions for gate sizing and buffer insertion as well as weighted path groups for potential violated paths.
  • The physical-related prediction is proposed with a matricized encoding and decoding mechanism for buffer tree representation for accurate and efficient prediction of candidate buffer insertion solutions.
  • The proposed framework was validated by benchmark circuits with commercial design flow, demonstrating significant timing improvement at detail placement and later routing stages without any unacceptable runtime and area cost.
The rest of the paper is organized as follows: In Section 2, related learning-based works and the motivation for the study are introduced. Section 3 explains how we utilize our proposed GNN-based model to generate placement optimization guidance. Section 4 reports our experimental results. Finally, we conclude the paper in Section 5.

2. Related Work and Motivations

2.1. Learning-Based Physical Prediction

Gate sizing and buffer insertion are commonly used optimization techniques during placement. In recent years, plenty of learning-based placement optimization approaches struggled to perform optimization solution prediction using the random forest (RF) model [5], Transformer [6,11], or reinforcement learning (RL) algorithms [12]. The concept of placement guidance is presented in the works of [13,14] to advance the PPA quality of design tools effectively by providing soft constraints. In spite of the prior research undertaken, the design guidance which is predicted at early stages to improve PPA quality remains uninvestigated.

2.2. Learning-Based Timing Prediction

Fast and accurate timing prediction at the early design stage is vital for high-quality timing-driven placement optimization. Extensive research has been stimulated for early timing prediction with learning engines including linear regression [9], random forest (RF) [5,9,10], XGboost [15], and GNN [16]. However, most existing works are devoted to addressing the challenge due to the absence of wirelength information but neglect the considerable impact of netlist change during timing-driven placement optimization. Furthermore, how to utilize the predicted timing metrics to improve placement quality is not discussed in any of the previous learning-based works.

2.3. Graph Neural Network
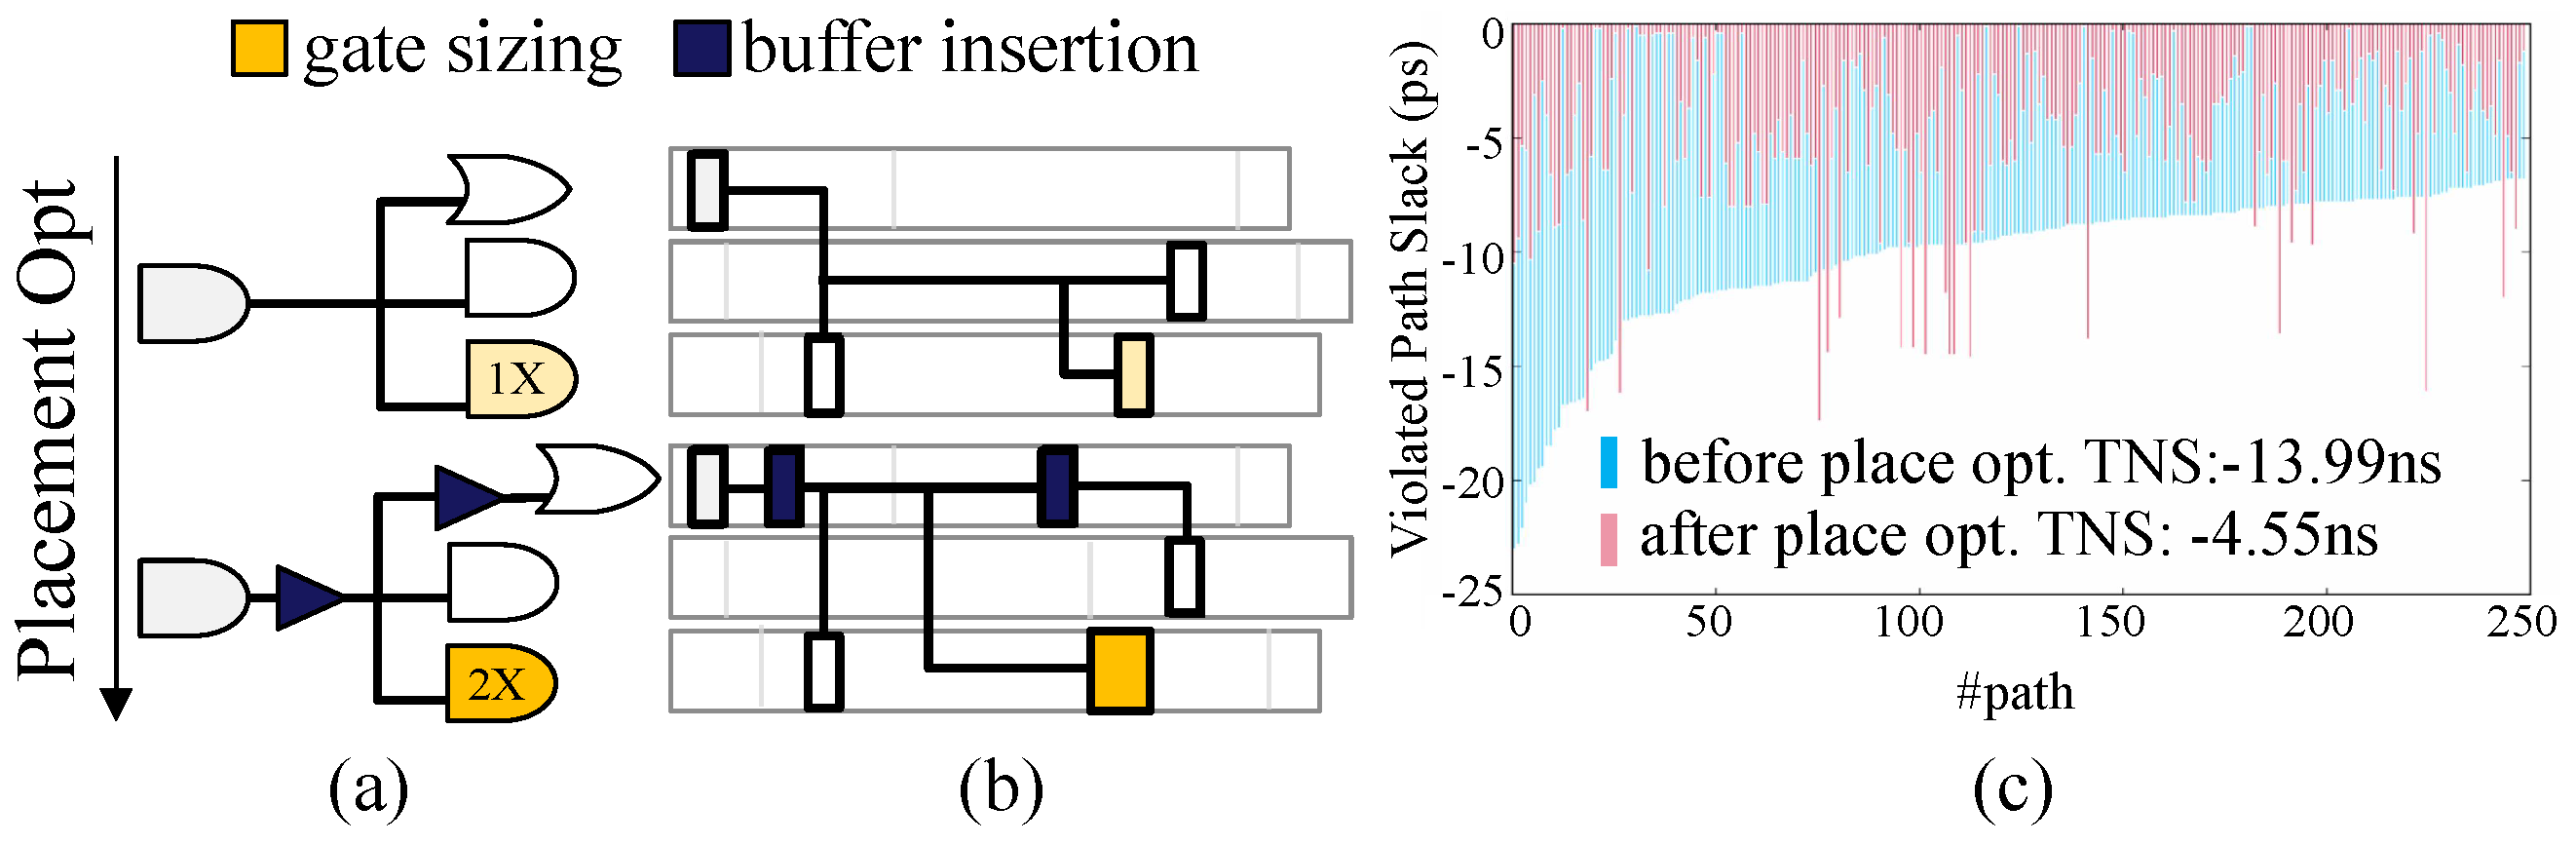
GNNs have been widely employed in the electronic design automation (EDA) field for various design tasks [17,18] to perform effective graph representation learning. As a variant of the GNN, the graph attention network (GAT) introduces a self-attention mechanism based on node features. When taking the neighbors into account, it is rational to give more attention to the nodes similar to the node of interest. The input GAT layer is a set of node features, h = { h 1 , h 2 , , h N } , h i R F , where N is the number of nodes, and F is the number of features in each node. The layer produces a new set of node features (of potentially different cardinality F ), h = { h 1 , h 2 , , h N } , h i R F , as its output. A weight matrix, W R F × F , is applied to every node. The attention mechanism a is a single-layer feedforward neural network, parametrized by a weight vector a R 2 F , and applying the LeakyReLU nonlinearity. The coefficients computed by the attention mechanism can be expressed as [19]:
α i j = exp LeakyReLU a T [ W h i W h j ] k N i exp LeakyReLU a T [ W h i W h k ]
where superscript T represents the transposition operation and ∥ is the concatenation operation. The attention coefficient α i j indicates the importance of node j’s features to node i, where N i is some neighborhood of node i in the graph.
The multi-head attention coefficients are used to compute a linear combination of the features corresponding to them, to serve as the final output features for every node:
h i = σ 1 K k = 1 K j N i α i j k W k h j
where α i j k are the normalized attention coefficients computed by the k-th attention mechanism ( a k ), and W k is the corresponding input linear transformation’s weight matrix.

2.4. Motivations

Gate sizing and buffering are commonly utilized techniques during placement optimization, which can have a profound influence on wirelength and interconnect parasitics as well as circuit timing. Current timing-driven placement preferentially considers immediate benefits rather than future possible outcomes, which may lead to worse quality and even re-placement overhead [7].
An example of placement optimization is demonstrated in Figure 1 with a logical and physical view for gate sizing and buffer insertion. Undoubtedly, the layout change in Figure 1b during placement optimization induced by logical netlist modification in Figure 1a would cause a nonnegligible impact to the timing metric in terms of cell delay and estimated net delay using a Steiner tree or Half-Perimeter Wire Length (HPWL) approximate model [20]. Due to this, the timing-driven placement may deviate from finding the optimal solution and/or lead to unnecessary iterations. A timing view for a real design compares the slacks of violated paths before and after placement optimization with sizing and buffering, as demonstrated in Figure 1c, where the paths are sorted in ascending order on the horizontal axis according to the slacks before optimization. Although the total negative slack (TNS) is remarkably alleviated from −13.99 ns to −4.55 ns with timing improvement for most of the violated paths, a substantial discrepancy could be found such that as a result of placement optimization, the slacks for all paths are not sorted in ascending order any more, and for a few paths, the slacks may be even worse, indicating the considerable risk for timing-driven optimization of guiding with inaccurate timing estimation results.
Inspired by the different views of placement optimization as illustrated in Figure 1, it could be considered that the early estimation of potential sizing and buffering solutions as well as timing change would be beneficial to achieve efficient placement optimization and could be utilized as useful guidance to improve placement optimization. Since the circuit netlist could be represented as a directed acyclic graph (DAG) by treating the logic cells and the interconnect between them as graph nodes and edges, respectively, it is naturally appropriate to apply a GNN to perform PPA prediction and further guide circuit optimization. Motivated by this, a GNN-based placement optimization guidance framework is proposed with physical and timing prediction.

3. Proposed Placement Optimization Framework
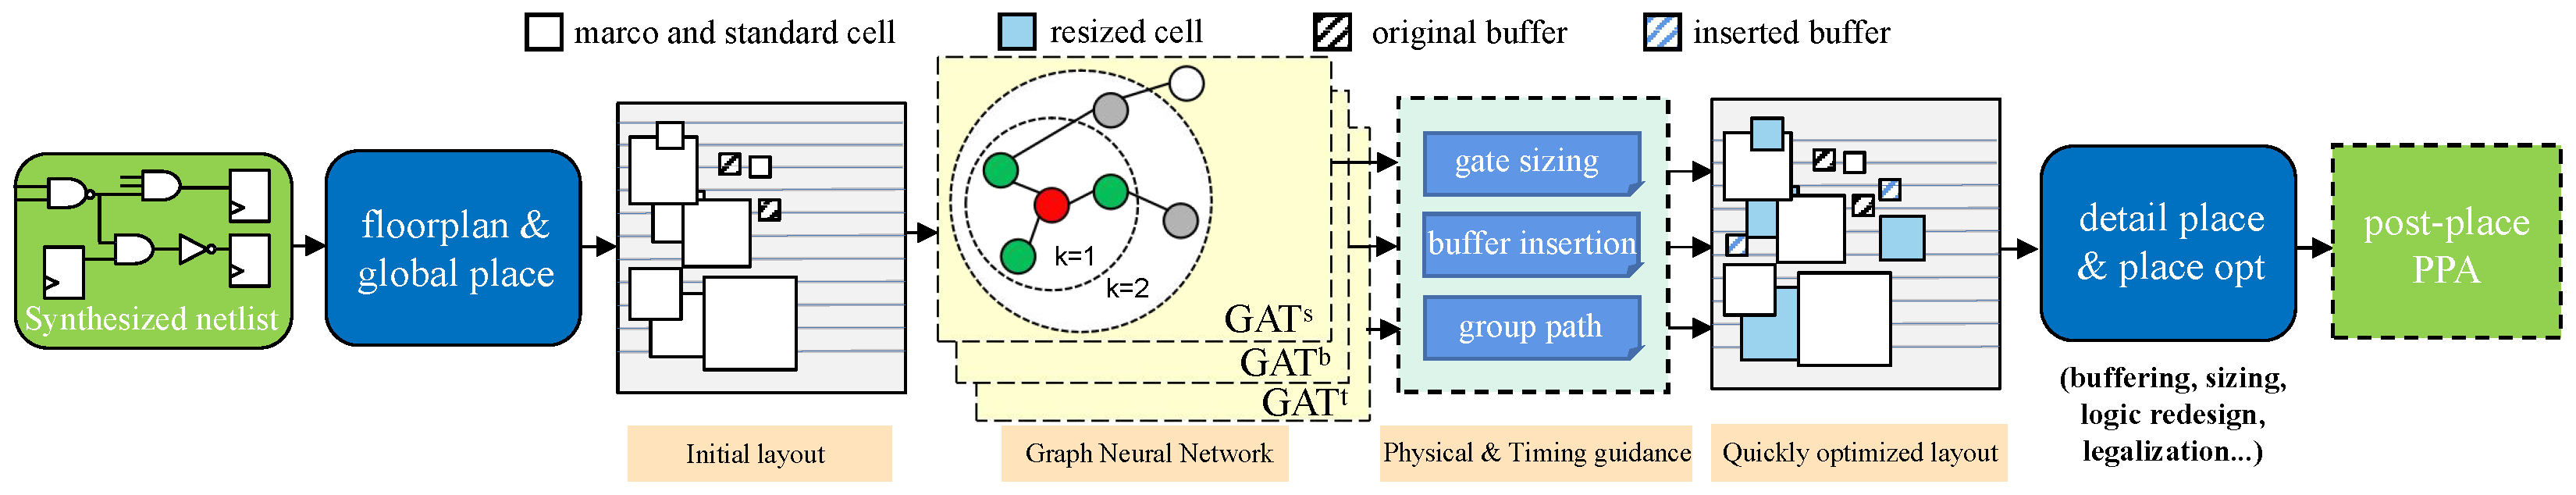
3.1. Overview

An overview of the proposed GNN-based placement optimization guidance framework is illustrated in Figure 2, where the guidance for detail placement optimization is generated by the physical and timing prediction with graph learning and integrated into tool flow to improve placement quality.
As shown in Figure 2, the initial netlist after global placement is first converted into a directed acyclic graph (DAG) where the logic cells are represented as graph nodes while the connections between them are graph edges. By sampling and aggregating node features from their k-hop neighbors, the candidate optimization solutions for gate sizing and buffer insertion at detail placement are predicted separately by the corresponding GAT models, G A T s and G A T b . Meanwhile, the potential violated paths at detail placement are predicted by the model G A T s and categorized into different groups with customized weights. The predicted solutions for sizing and buffering as well as the weighted path groups are further used as physical- and timing-related placement guidance for the design tool by transforming them into command scripts, which would be extremely beneficial for later tool-driven optimization during detail placement to achieve better PPA metrics.

3.2. Node Representation

In order to learn the physical and timing information from the circuit netlist at the global placement stage, the node features are extracted from timing reports and the design layout, as listed in Table 1. There are 13 parameters of these models. The adjacency matrix is constructed by the graph edges of the logic cell to generate high-dimensional node embeddings for fast and accurate prediction tasks. Furthermore, in order to predict the solution for buffer insertion precisely, the original buffers in the circuit netlist are not included in the graph.
As listed in Table 1, the timing features are composed of the worst input/output slack, maximum input/output slew, and worst cell delay for the given cell after global placement as well as that for its 1-hop neighbouring cells, e.g., the fanin and fanout cells. The physical features include the area, coordinate, driving strength, maximum Manhattan distance with the fanin cells of the given cell, as well as the output load capacitance and the numbers of fanin/fanout cells.

3.3. Loss Function

The potential physical- and timing-related optimization results at the global placement stage are predicted by the GAT with the appropriate loss functions, where the physical-related loss function is defined for the classification of sizing and buffering solutions while the timing-related loss function is used to predict the path slacks.

3.3.1. Physical Classification Loss

We pose the prediction of the gate sizing and buffer insertion solution as a classification problem that assigns a Softmax score. The loss function is defined as Equation (3) to represent the cross-entropy between the predicted driving strength of sized cells or inserted buffers, P, and the ground-truth, Y, where n denotes the number of driving strengths of the cells or buffers while N is the number of all nodes in the circuit graph.
L 1 = i = 1 N c = 1 n Y i c log P i c
It should be noted that in the case of placement optimization with buffer insertion, a buffer tree would be commonly inserted after the driven cell instead of a single buffer. Therefore, in order to predict the candidate buffering solution for detail placement optimization, the buffer tree is split into multiple stages and the driving strengths of each single stage of the buffers are predicted, starting from the driver cell with the loss function in Equation (3).

3.3.2. Timing Prediction Loss

The predicted path delay induced by placement optimization, P, is calculated by accumulating the predicted timing arc delay along the path, whose ground-truth value is represented as Y. The loss function is defined as the mean-squared error between the predicted result and the ground-truth, as formulated in Equation (4).
L 2 = 1 n i = 0 N ( Y i P i ) 2

3.4. Physical Prediction

By extracting the physical and timing attributes of the logic cells in the netlist after global placement and representing them as node features, the potential physical-related optimization result is predicted for detail placement by the models of G A T s and G A T b , implemented to provide the candidate solution for the gate sizing and buffer insertion, respectively.

3.4.1. Gate Sizing Prediction Model

With the node features, the sizing solution for each cell is predicted by computing the multi-head attention coefficients of G A T s as Equation (3), where the classification results indicate the candidate driving strength of each given cell for detail placement. Considering that the numbers of the driving strengths of the cell vary in a standard cell library, when the classification result is not available for the specific cell, the closest downsized cell would be chosen as the candidate solution.

3.4.2. Buffer Insertion Prediction Model

Different from the prediction of a gate sizing solution, the candidate solution of buffer insertion for detail placement is much more complex since, commonly, a buffer tree would be inserted between a specific driven cell and its multiple fanout cells instead of a single buffer, which poses a severe challenge to the prediction process for buffer insertion.
To solve this issue, the technique of buffer matrix encoding is proposed in this work to represent the buffer tree in the circuit netlist as a buffer matrix in the graph representation. Based on the GNN, the presence of inserted buffers and their driving strengths are predicted for each driven cell stage-by-stage in a pipelined fashion. The width of the buffer tree is dependent on the number of fanout cells, while the depth is associated with the maximum stage of the buffer tree to the fanout. By expanding the buffer tree to the matrix, each row indicates the buffer chain for a specific fanout cell, while each column denotes the stage of the buffers for all fanouts starting from the driven cell.
The training and inference processes of the G A T b model for buffer insertion prediction could be performed as the buffer tree and buffer matrix illustrated in Figure 3. As can be seen in Figure 3a, for a fanin cell and three corresponding fanout cells, f1, f2, and f3, in a circuit netlist, the buffer instances with varied driving strengths are inserted in a tree-like structure. The inserted buffer tree could be encoded into a matrix-like manner in the graph representation, as shown in Figure 3b, where the buffer node indicates the absence or the driving strength of the inserted buffer. Each row of the buffer matrix represents the buffer chain for each fanout cell, while each column indicates the stage of the inserted buffer from the fanin cell to the fanout, namely, s1∼s4. For those common buffers shared by different fanout cells, they are encoded separately in the corresponding rows. During the training process, by encoding the buffer tree into a buffer matrix, the absence or the driving strength information of the buffer node are extracted as the labels to train the G A T b model stage-by-stage starting from the fanin cell in a pipelined fashion. During the inference process, each column of the buffer matrix is also predicted stage-by-stage from the fanin cell, which is then decoded into the buffer tree as the predicted candidate buffer insertion solution.

3.5. Timing Prediction

Since the circuit timing is highly related to the optimization solutions, including gate sizing and buffer insertion, the learnt physical-related optimization guidance for detail placement would be extremely beneficial to the accurate prediction of potential timing change after detail placement, which could be positively significant if provided to the placer as timing-related guidance to advance placement quality.
Motivated by this consideration, the timing-related optimization guidance for detail placement is generated by binning the potential violated paths into optimizable path groups with different weights, which are predicted based on the model G A T t by utilizing the candidate detail placement optimization solution along with the initial node features, as shown in Figure 4. The learnt embeddings from G A T s and G A T b for gate sizing and buffer insertion, respectively, are concatenated with the embedding of the initial node features from G A T t to perform timing prediction for the timing arc delay of each edge with a multi-layer perceptron (MLP). Using the timing arcs cumulative aggregated result and the clock constraint of the circuit, we can calculate the path slack results. With the predicted timing slacks, the potential violated paths are binned into multiple groups according to the normalized negative slacks by clock period, where the worst path group is specified with a larger weight to guide the placement tool to perform optimization with higher effort.

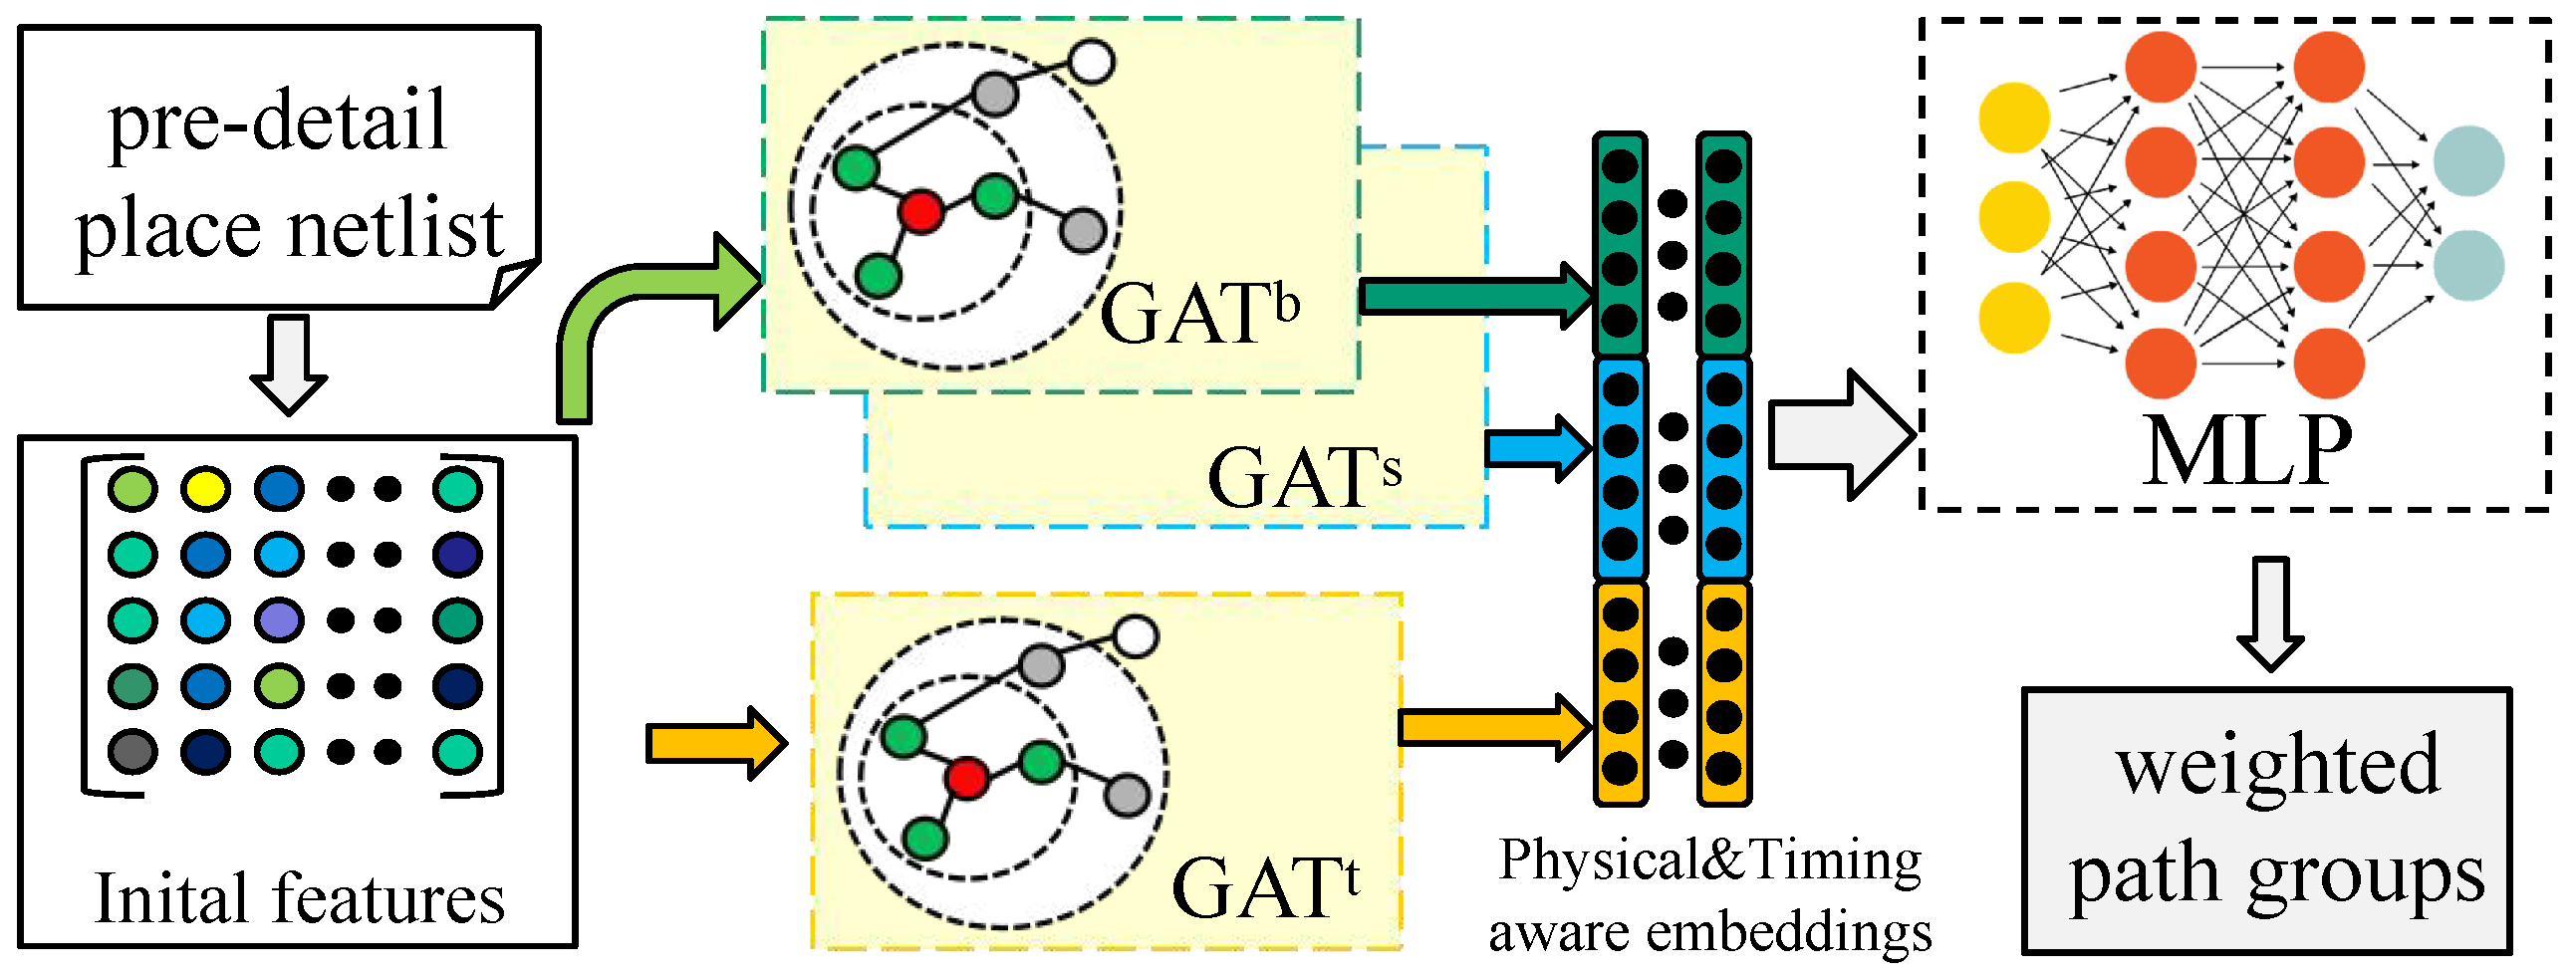
3.6. Optimization Guidance with Physical and Timing Prediction

In order to provide the guidance to the detail placement optimization, the commands for design tools are generated as script according to the physical and timing prediction results and integrated into the tool flow. In this work, Synopsys IC Compiler 2018.06-SP5 is used as the placement tool and guided via the following commands.
  • size_cell According to the predicted gate sizing solution by G A T s , the logic cells in the pre-detail placement netlist are upsized or downsized by this command.
  • insert_buffer According to the predicted buffer insertion solution by G A T b , the candidate buffer trees are inserted between the logic cells with different driving strengths.
  • group_path According to the predicted path group solution by G A T t , the selected paths are grouped separately using this command and set with the appropriate weights.

4. Experiment Results

4.1. Experiment Setup

The proposed placement optimization guidance framework was implemented with Pytorch 1.11.0 and PyG 2.2.0. Model training and testing were performed on a Linux machine made by New H3C technologies company in Hangzhou, China and equipped with an NVIDIA Tesla V100 GPU and two Intel Xeon CPUs at 2.20 GHz and 256 GB memory. The layer number and multi-head-attentions numbers of the GAT are, respectively, 3 and 8. The parameters of a GNN include the number of elements in all weight matrices and bias vectors. For G A T s , G A T b , and G A T t , the number of neurons in the hidden layers are 32, 64, and 256. The number of parameters for each GAT model is close to 20 K, with a total of 60 K parameters for the whole framework. The learning rate is 0.001 and the weight decay is 0.0001.
Nine OpenCores circuit designs were used to validate the optimization framework, which were synthesized and placed by Synopsys Design Compiler 2019.12-SP4 and Synopsys IC Compiler 2018.06-SP5, respectively, while the TSMC 22 nm process and the ground-truth timing slacks were analyzed with Synopsys PrimeTime 2019.12-SP4. Six designs were used for training and the remaining three for test, whose statistics after global and detail placement by Synopsys IC Compiler are shown in Table 2 in terms of the number of cells and buffers after global placement, # cell and # buf, and the number of sized cells and added buffers after detail placement, # sized cell and # add buf. It can be seen that for all validation designs, over 31.3%/35.1% cells were sized in the training/test set while over 111.3%/160.3% buffers were added, indicating a significant optimization effort and nonnegligible inaccurate timing estimation during timing-driven placement. For the training circuits shown in Table 2, the total training process requires approximately 6.4 h on the server platform utilized in this work.

4.2. Physical and Timing Prediction Evaluation

The proposed GNN-based models were trained by the multi-objective loss function in Equations (3) and (4) to predict the candidate placement optimization solution for gate sizing and buffer insertion as well as the potential path groups for violated paths. The predictions for gate sizing, buffer insertion, and path group are defined as multi-class classification problems, whose accuracy is evaluated by the F1-score and compared with prior ML-based approaches for buffer insertion prediction [5], gate sizing prediction [5,6], and timing prediction [10], as shown in Table 2. The F1-score is calculated as the harmonic mean of the precision and recall, where the precision and the recall are calculated by the total number of correct predictions normalized by the false positives and the false negatives, respectively. In this work, the correct predictions are identified as those predicted gate sizes, buffer strengths, and the binned path groups which are consistent with the results from the design and analysis tools, including Synopsys Design Compiler and Synopsys PrimeTime.
As can be shown in Table 2, owing to the models G A T s , G A T b , and G A T t , the F1-score of gate sizing, buffer insertion, and path group with slacks achieves 92.62%, 93.46% and 88.46% for the seen designs in the training set and 80.32%, 78.93%, and 77.17% for the unseen designs in the test set on average. The competitive methods implemented by the RF model [5,10] and Transformer network [6] predict the buffer type, gate sizing, and path group with slacks at the average F1-score of 74.62%, 69.44%, 77.59%, and 69.83%, respectively, for the test set, which are considerably inferior to this work, although the gap is slight for the training set. This shows that the RF-based prediction models are prone to over-fitting since the features used for RF only include those for the target cell and cannot capture local information from its surrounding neighbors. For the Transformer network, little global information is captured during the sequentially sizing solution prediction. As for the GNN-based models in this work, the larger receptive field contributes to more local information and shows better results in the test set. Moreover, the concatenated embeddings for the netlist change information used by this work are highly beneficial to the prediction accuracy for path group classification.
Although the prediction accuracy of the proposed GNN-based framework for the testing set is inferior to that for the training set, it should be noted that a modest reduction in prediction accuracy does not substantially impact the effectiveness of the suggested placement optimization guidance, which could be validated for the post-placement optimization and post-routing stages.

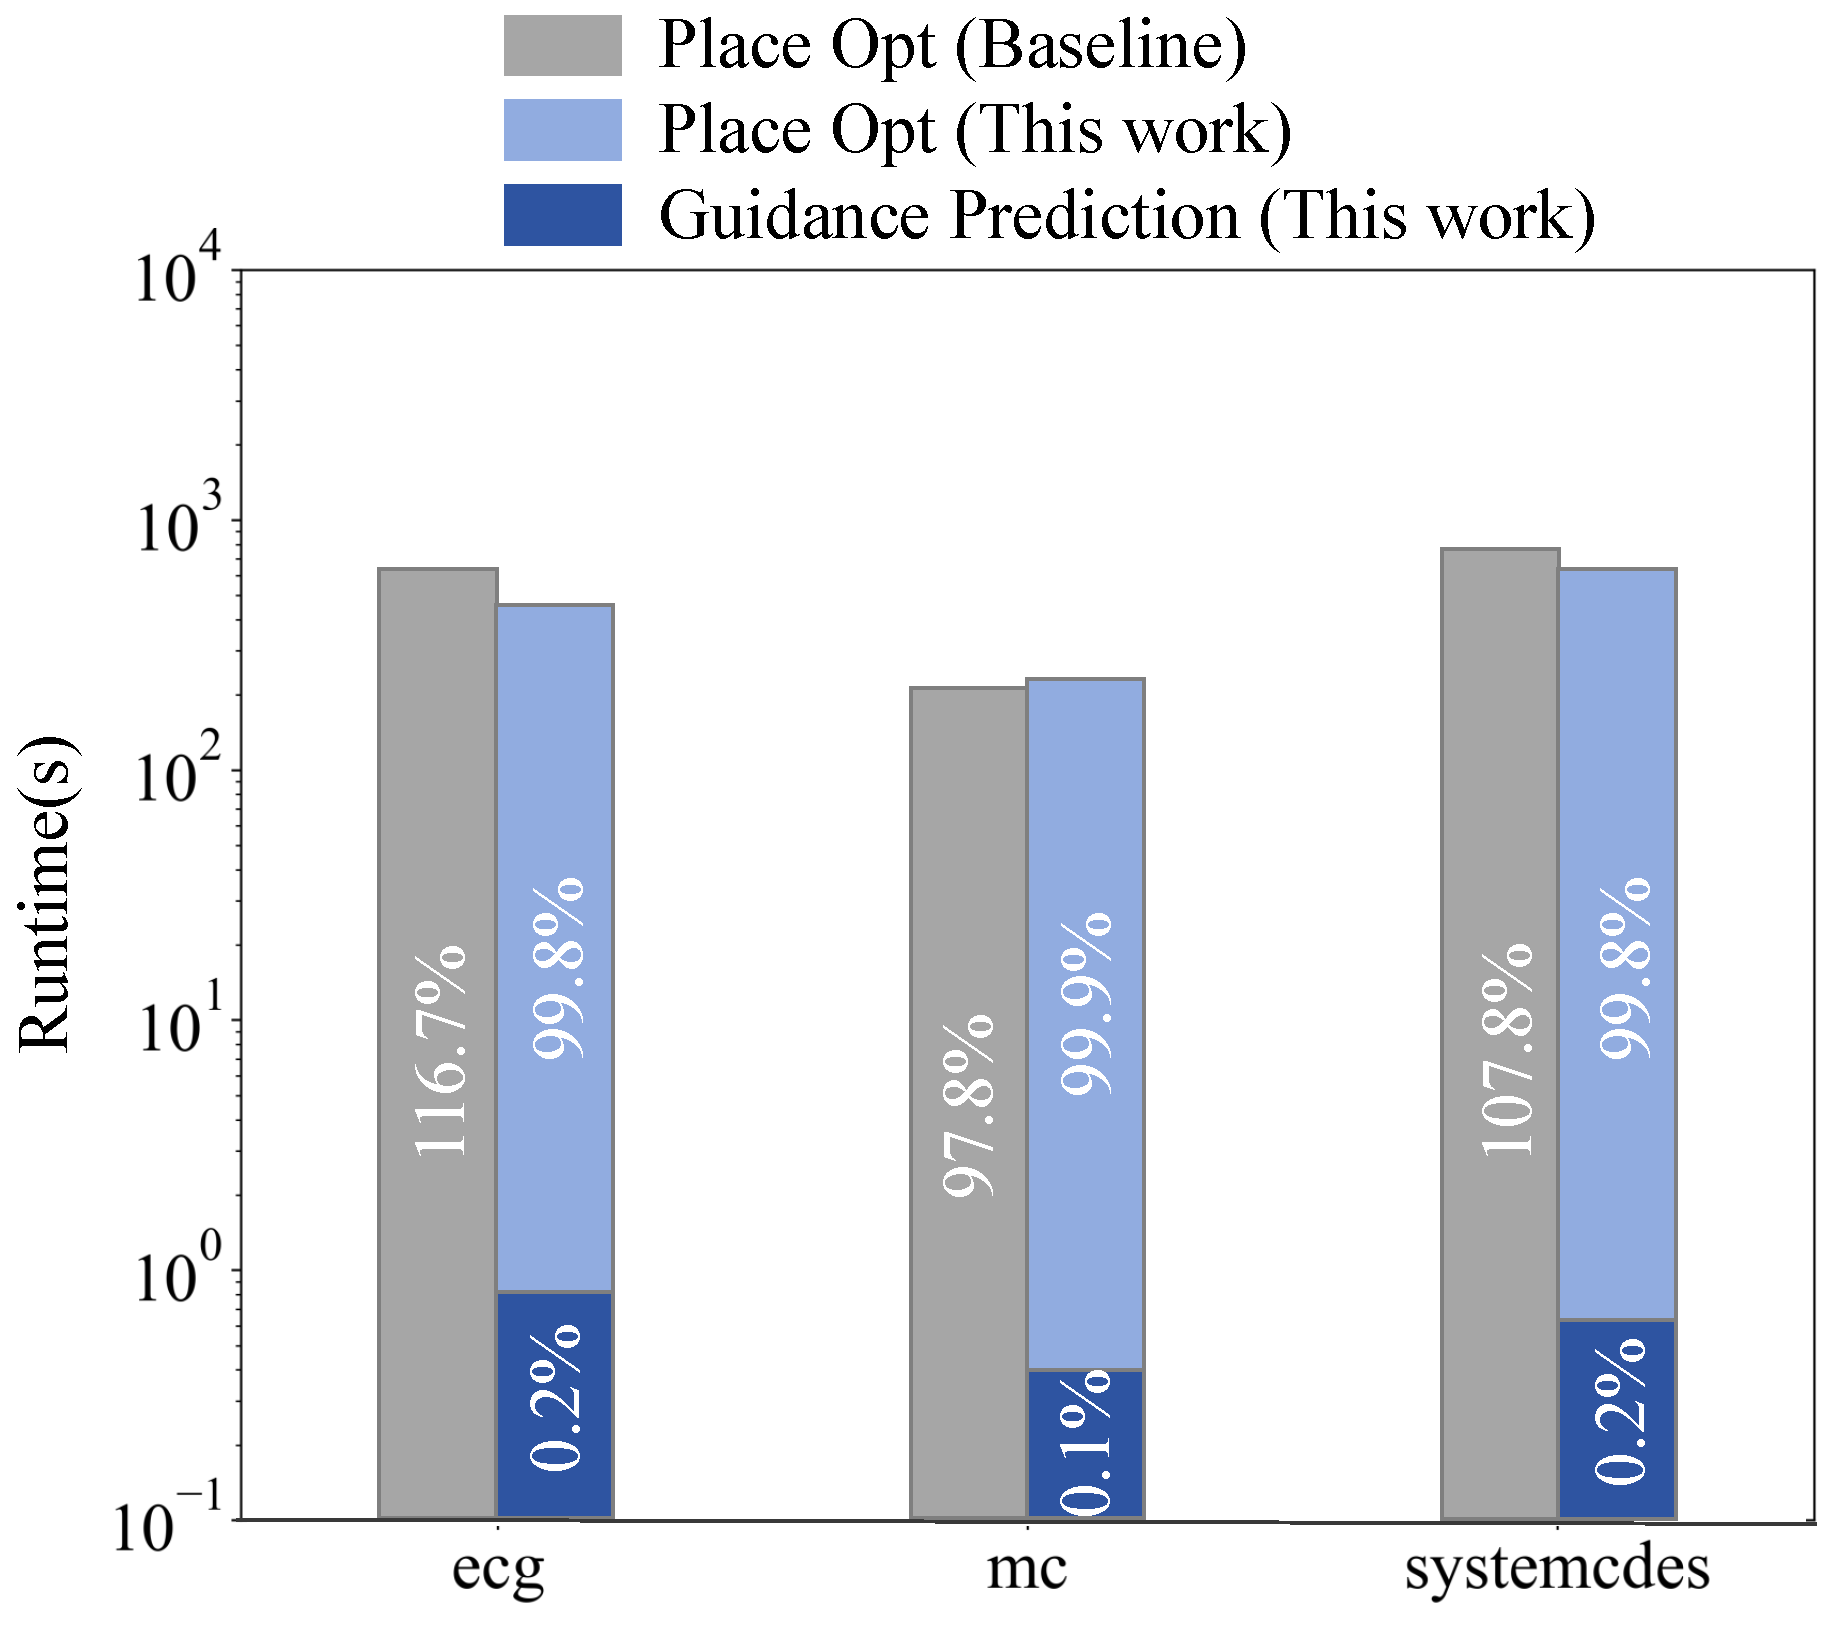
4.3. Physical- and Timing-Related Optimization Evaluation

In order to analyze the improvement in the detail placement with the proposed optimization framework, Table 3 compares the results from the baseline solution by the IC Compiler and the guided solution with the predicted physical and timing results for the testing circuits, where the placement quality is evaluated by the worst negative slack (WNS), total negative slack (TNS), the number of violated paths (NVP), and the circuit area. Moreover, the ablation studies are included in Table 3 to evaluate the improvement by the physical- and timing-aware guidance separately.
It can be seen from Table 3 that compared with the baseline, the guided solution achieves an average of 35.66%, 43.51%, and 52.17% reduction for WNS, TNS, and NVP reduction, respectively, which indicates the outstanding placement quality of the proposed optimization guidance framework for unseen circuits due to the accurate physical and timing prediction. The improvement could even be up to 61.02% and 82.88% WNS and TNS reduction for the mc design. The ablation study shown in Table 3 confirmed the necessity of jointly considering physical- and timing-related guidance. The sole physical-related guidance leads to inferior timing quality with an average of 8.30% and 22.27% WNS and TNS deterioration and 29.34% NVP increase, especially for the systemcdes design with 58.33%, 41.03%, and 123.11% degradation for WNS, TNS, and NVP, respectively. The sole timing-related guidance results in 11.84%, 2.57%, and 0.13% decrease for WNS, TNS, and NVP, respectively.
It is worth noting that, as can be seen in Table 3, for certain cases with physical or timing guidance only, the timing quality after placement optimization may even be inferior to the baseline results, which is due to the fact that the optimization quality is jointly affected by the physical and timing prediction at the early stage. On the one hand, the circuit timing is highly related to the optimization solutions including sizing and buffering. On the other hand, the candidate sizing and buffering solutions are not sufficient to inherently provide the corresponding timing impact. Thus, the absence of any of them may lead to over-optimized or under-optimized solutions, which could even result in negative results for the timing metric in certain cases.
The runtime overhead for the proposed framework is compared with the baseline tool, as illustrated in Figure 5. The runtime for the baseline solution is that used by the design tool, while the runtime for this work includes the inference time to generate the placement guidance with physical and timing prediction and the runtime occupied by the guided tool flow. It is observed that each testing circuit requires less than 1 s to generate the optimization guidance, accounting for less than 0.2% of the overall placement optimization time. The operations in tool flow with more than 99% of total runtime are composed of the placement guidance settings according to the predicted solutions and placement optimization. The settings of the placement guidance are performed with the commands of size_cell, insert_buffer, and group_path, as mentioned in Section 3.6, with almost no runtime overhead. Placement optimization is performed by the command of place_opt in an iterative manner to generate a legalized placed netlist and address the timing closure with the dominant runtime. The overall runtime of this work is comparable with the runtime of the baseline tool, indicating that the PPA improvements are achieved without a considerable increase in runtime.
The improved PPA quality of the proposed optimization framework could be further evaluated at a later routing stage, as shown in Table 4. In order to demonstrate the impact of placement optimization guidance for further routing stages, the improved PPA quality is evaluated and compared with the baseline solution and recent work [21], where a routability-aware placement flow is proposed based on a Hierarchical Density-Based Spatial Clustering of Applications with Noise (HDBSCAN) algorithm to generate soft placement guidance, aiming to achieve better results and help to reduce routing overflow. It can be observed that owing to the physical- and timing-related guidance at the detail placement stage, the proposed framework achieves significantly better quality with an average of 24.21% TNS reduction, 31.32% NVP reduction, and 2.33% wirelength (WL) reduction than the baseline tool and outperforms [21] in general.
By providing superior initial solutions for the netlist, PTA-GNN facilitates a more efficient placement process, while the potential violation path guidance effectively minimizes the number of iterations of the placement algorithm. Furthermore, the enhanced placement outcomes are instrumental in promoting rapid convergence of the routing without excessive iterations.

5. Conclusions

In this work, a placement optimization guidance framework is proposed to improve PPA and speedup timing closure with physical- and timing-related prediction based on a GNN, which outperforms prior works with an average of 43.51% and 24.21% TNS reduction after placement and routing, respectively, compared to the baseline flow, as well as 2.33% wire length reduction at the routing stage. In the future, we aim to expand our framework for full-flow optimization.

Author Contributions

Conceptualization, P.C.; Methodology, W.D.; Validation, Z.L. and W.D.; Writing—original draft, P.C. and W.D.; Writing—review & editing, P.C.; Visualization, Z.L.; Funding acquisition, P.C. All authors have read and agreed to the published version of the manuscript.

Funding

This work was supported in part by the National Natural Science Foundation of China under Grant (62174031) and in part by the Fundamental Research Funds for the Central Universities.

Data Availability Statement

The original contributions presented in this study are included in the article. Further inquiries can be directed to the corresponding author.

Conflicts of Interest

The authors declare no conflicts of interest.

References

  1. He, W.; Li, X.; Song, X.; Hao, Y.; Zhang, R.; Du, Z.; Chen, Y. Chip design with machine learning: A survey from algorithm perspective. Sci. China Inf. Sci. 2023, 66, 211101. [Google Scholar] [CrossRef]
  2. Kahng, A.B. Advancing Placement. In Proceedings of the 2021 International Symposium on Physical Design, Virtual, 22–24 March 2021. [Google Scholar]
  3. Li, W. Strongly NP-hard discrete gate sizing problems. In Proceedings of the IEEE International Conference on Computer Design: VLSI in Computers and Processors, (ICCD), Cambridge, MA, USA, 3–6 October 1993. [Google Scholar]
  4. Shi, W.; Li, Z.; Alpert, C. Complexity analysis and speedup techniques for optimal buffer insertion with minimum cost. In Proceedings of the Asia and South Pacific Design Automation Conference (ASP-DAC), Yokohama, Japan, 27–30 January 2004. [Google Scholar]
  5. Krishna Kashyap, S.; Ozev, S. IMPRoVED: Integrated Method to Predict PostRouting Setup Violations in Early Design Stages. ACM Trans. Des. Autom. Electron. Syst. 2023, 28, 49. [Google Scholar] [CrossRef]
  6. Nath, S.; Pradipta, G.; Hu, C.; Yang, T.; Khailany, B.; Ren, H. TransSizer: A Novel Transformer-Based Fast Gate Sizer. In Proceedings of IEEE International Conference on Computer Aided Design (ICCAD), San Diego, CA, USA, 29 October–3 November 2022. [Google Scholar]
  7. Liao, P.; Guo, D.; Guo, Z.; Liu, S.; Lin, Y.; Yu, B. DREAMPlace 4.0: Timing-Driven Placement With Momentum-Based Net Weighting and Lagrangian-Based Refinement. IEEE Trans. Comput.-Aided Des. Integr. Circuits Syst. 2023, 42, 3374–3387. [Google Scholar] [CrossRef]
  8. Synopsys. IC Compiler Implementation User Guide; Synopsys: Sunnyvale, CA, USA, 2011. [Google Scholar]
  9. Barboza, E.C.; Shukla, N.; Chen, Y.; Hu, J. Machine Learning-Based Pre-Routing Timing Prediction with Reduced Pessimism. In Proceedings of the Design Automation Conference, (DAC), Las Vegas, NV, USA, 2–6 June 2019. [Google Scholar]
  10. He, X.; Fu, Z.; Wang, Y.; Liu, C.; Guo, Y. Accurate Timing Prediction at Placement Stage with Look-Ahead RC Network. In Proceedings of the Design Automation Conference, (DAC), San Francisco, CA, USA, 10–14 July 2022. [Google Scholar]
  11. Liang, R.; Nath, S.; Rajaram, A.; Hu, J.; Ren, H. BufFormer: A Generative ML Framework for Scalable Buffering. In Proceedings of the Asia and South Pacific Design Automation Conference, (ASP-DAC), Tokyo, Japan, 16–19 January 2023. [Google Scholar]
  12. Lu, Y.C.; Nath, S.; Khandelwal, V.; Lim, S.K. RL-Sizer: VLSI Gate Sizing for Timing Optimization using Deep Reinforcement Learning. In Proceedings of the Design Automation Conference, (DAC), San Francisco, CA, USA, 5–9 December 2021. [Google Scholar]
  13. Lu, Y.C.; Pentapati, S.; Lim, S.K. The Law of Attraction: Affinity-Aware Placement Optimization Using Graph Neural Networks. In Proceedings of the International Symposium on Physical Design, (ISPD), Virtual, USA, 22–24 March 2021. [Google Scholar]
  14. Lu, Y.C.; Yang, T.; Lim, S.K.; Ren, H. Placement Optimization via PPA-Directed Graph Clustering. In Proceedings of the ACM/IEEE International Symposium on Machine Learning for CAD, (MLCAD), Virtual, China, 12–13 September 2022. [Google Scholar]
  15. Cheng, H.H.; Jiang, I.H.R.; Ou, O. Fast and Accurate Wire Timing Estimation on Tree and Non-Tree Net Structures. In Proceedings of the Design Automation Conference, (DAC), San Francisco, CA, USA, 20–24 July 2020. [Google Scholar]
  16. Xie, Z.; Liang, R.; Xu, X.; Hu, J.; Chang, C.C.; Pan, J.; Chen, Y. Preplacement Net Length and Timing Estimation by Customized Graph Neural Network. IEEE Trans. Comput.-Aided Des. Integr. Circuits Syst. 2022, 41, 4667–4680. [Google Scholar] [CrossRef]
  17. Lu, Y.C.; Nath, S.; Kiran Pentapati, S.S.; Lim, S.K. A Fast Learning-Driven Signoff Power Optimization Framework. In Proceedings of the IEEE International Conference on Computer-Aided Design, (ICCAD), San Diego, CA, USA, 2–5 November 2020. [Google Scholar]
  18. Wang, Z.; Liu, S.; Pu, Y.; Chen, S.; Ho, T.Y.; Yu, B. Restructure-Tolerant Timing Prediction via Multimodal Fusion. In Proceedings of the Design Automation Conference, (DAC), San Francisco, CA, USA, 9–13 July 2023. [Google Scholar]
  19. Veličković, P.; Cucurull, G.; Casanova, A.; Romero, A.; Liò, P.; Bengio, Y. Graph Attention Networks. arXiv 2018. [Google Scholar] [CrossRef]
  20. Qiu, J.; Reda, S.; Hassoun, S. Fast, Accurate a Priori Routing Delay Estimation. In Proceedings of the 24th ACM/IEEE Workshop on System Level Interconnect Pathfinding, (SLIP), Anaheim, CA, USA, 13 June 2010. [Google Scholar]
  21. Cheng, C.Y.; Wang, T.C. Routability-aware Placement Guidance Generation for Mixed-size Designs. In Proceedings of the 2023 24th International Symposium on Quality Electronic Design (ISQED), San Francisco, CA, USA, 5–7 April 2023. [Google Scholar]
Figure 1. Example of circuit design before and after placement optimization with (a) logical, (b) physical, and (c) timing view.
Electronics 14 00329 g001
Figure 2. Overview of optimization guidance framework based on physical and timing prediction to improve placement quality.
Electronics 14 00329 g002
Figure 3. Illustration of buffer insertion solution represented by (a) buffer tree in the circuit netlist and (b) buffer matrix in the graph representation.
Electronics 14 00329 g003
Figure 4. Path classification flow using embedding fusion technique.
Electronics 14 00329 g004
Figure 5. Illustration of runtime comparsion.
Electronics 14 00329 g005
Table 1. Initial node features for feature matrix construction.
TypeParametersDescription
timing
feature
wst input slackworst slack of input pin (s)
wst output slackworst slack of output pin
max input slewmax slew of input pin (s)
max output slewmax slew of output pin
wst delayworst delay of cell
physical
feature
cell areaarea of the given cell
cell x/y coordinatecoordinate of the given cell
driving strengthdriving strength of cell
total output captotal output load capacitance
faninsfanin number of cell
fanoutsfanout number of cell
max cell distancemax Manhattan distance
Table 2. Benchmark statistics and prediction accuracy comparison.
BenchmarkCircuit StatisticsF1-Score of Target
#Cell#Sized Cell#Buf#Add BufBuffering[5]Sizing[5][6]Path Group[10]
training set
ac9778963384616107198.54%90.74%84.01%86.06%81.32%92.87%88.35%
aes4124153998010092.14%86.94%96.56%94.84%93.53%91.57%85.23%
des13755961336889.39%84.32%92.46%83.28%88.34%90.51%77.76%
vga_enh48,7284980115796892.43%93.87%97.67%94.19%96.74%88.54%83.52%
eth32,98511,22653793697.67%92.21%92.23%91.07%93.58%80.21%83.32%
pci_bridge3211,897243548785190.56%88.53%92.79%87.98%91.54%87.08%87.21%
ave.17,8344026 (31.3%)651665 (111.3%)93.46%89.43%92.62%89.57%90.84%88.46%84.23%
testing set
ecg52,40125,4741607462771.68%69.43%72.33%68.44%76.41%72.55%64.32%
mc506458248765782.34%74.43%87.61%67.71%80.63%80.11%73.32%
systemcdes146366332118781.16%80.01%81.04%72.16%75.74%78.86%71.85%
ave.19,6428906 (35.1%)8051823 (160.3%)78.93%74.62%80.32%69.44%77.59%77.17%69.83%
Table 3. Placement optimization quality comparison. The unit for WNS and TNS is in ns, for runtime in s and for area in μm2. The best results are marked in bold.
BenchmarkBaselinew/Physical Guidance Onlyw/Timing Guidance Onlyw/Full Guidance (This Work)
WNSTNSNVPareaWNSTNSNVPWNSTNSNVPWNSTNSNVPArea
ecg−0.076−7.056550233,701.4−0.0568
(−25.26%)
−0.0568
(39.46%)
2353
(−57.23%)
−0.0628
(−17.37%)
−3.81
(−46.00%)
908
(−83.50%)
−0.0683
(−10.13%)
−5.232
(−25.85%)
2323
(−57.78%)
33,763.4
(0.18%)
mc−0.049−2.43616264487.83−0.045
(−8.16%)
−0.0399
(−13.38%)
1986
(22.14%)
−0.0401
(−18.16%)
−3.37
(38.34%)
1928
(18.57%)
−0.0191
(−61.02%)
−0.417
(−82.88%)
736
(−54.74%)
4534.37
(1.04%)
systemcdes−0.012−0.0782251161.89−0.019
(58.33%)
−0.039
(41.03%)
502
(123.11%)
−0.012
(0.00%)
−0.09
(15.38%)
372
(65.33%)
−0.0077
(−35.83%)
−0.061
(−21.79%)
126
(−44.00%)
1147.58
(−1.23%)
average0%0%0%0%8.30%22.37%29.34%−11.84%−2.57%0.13%−35.66%−43.51%−52.17%0.003%
Table 4. Detailed comparison after routing. The unit for WL is in m. The best results are marked in bold.
BenchmarkBaselineISQED’23 [21]This Work
TNSNVPWLTNSNVPWLTNSNVPWL
ecg −68.6125,4896.31−65.45 (−4.61%)21,435 (−15.90%)6.35 (0.63%)−74.94 (9.22%)13,791 (−45.89%)6.33 (0.32%)
mc −6.6493930.57−5.89 (−11.29%)8965 (−4.56%)0.56 (−1.75%)−5.53 (−16.78%)8467 (−9.86%)0.61 (7.01%)
systemcdes−1.0434,0480.15−0.87 (−16.34%)30,431 (−10.62%)0.15 (0.0%)−0.36 (−65.09%)2438 (−92.83%)0.12 (−20%)
average0%0%0%−10.75%−10.36%−0.37%−24.21%−31.32%−2.33%
Disclaimer/Publisher’s Note: The statements, opinions and data contained in all publications are solely those of the individual author(s) and contributor(s) and not of MDPI and/or the editor(s). MDPI and/or the editor(s) disclaim responsibility for any injury to people or property resulting from any ideas, methods, instructions or products referred to in the content.

