Article

RFID Unpacked: A Case Study in Employing RFID Tags from Item to Pallet Level

by
Ethan Claucherty
1,
Danielle Cummins
1 and
Bahar Aliakbarian
1,2,*
1
The Axia Institute, Michigan State University, 1910 W. St. Andrews Rd., Midland, MI 48640, USA
2
Department of Biosystems and Agricultural Engineering, Michigan State University, 524 S Shaw Lane, East Lansing, MI 48824, USA
*
Author to whom correspondence should be addressed.
Electronics 2025, 14(2), 278; https://doi.org/10.3390/electronics14020278
Submission received: 27 November 2024 / Revised: 3 January 2025 / Accepted: 7 January 2025 / Published: 11 January 2025
(This article belongs to the Special Issue RFID Technology and Its Applications)

Abstract

:
As the use of passive ultra-high frequency (UHF) radio frequency identification (RFID) tags continues to surge in supply chain management, it becomes crucial to optimize their application at various levels of packaging to ensure reliability. These packaging levels play a pivotal role in achieving maximum readability and widespread adoption within the industry. This research paper aims to determine the most suitable passive UHF RFID tag for consumer goods filled with liquid and wrapped in foil packaging. In this study, two distinct RFID tags from separate manufacturers were evaluated. The research focused on critical factors such as reader height, distance, and item configuration across different packaging levels (item, case, and pallet). The results demonstrated that the packaging configuration impacts the readability of RFID tags at each packaging level. Through rigorous testing, it was found that achieving a tag readability rate higher than 99.7% is feasible and readability can be optimized by adjusting the reader position, packaging configuration, and tag design. The optimized configuration and testing platform developed in this study can be used for comparable products in other supply chains such as consumer goods, pharmaceuticals, and food. The results of this study emphasize RFID’s potential to revolutionize supply chain management.

1. Introduction

The rapid development of Internet of Things (IoT) technologies in recent years [1,2] has begun to merge the gap between the digital world and reality, uprooting the conventional methods of supply chain management [3]. Following the needs demanded by the COVID-19 pandemic [4], countless industries have turned to the technological developments included in Industry 4.0 innovations [5]. Radio Frequency Identification (RFID) technology has solidified its place in this sphere as it is a seamlessly interoperable method of identification, allowing for data mining and real-time tracking [6].
While most popularly used in retail [7,8,9,10,11,12], RFID’s applications across different fields are far-reaching and ever-changing [13,14]. RFID is a wireless communication technology that can be used to acquire data connected to a variety of different identification traits including date of purchase, serial number, batch number, and expiration date [15,16]. Unlike traditional universal product code (UPC) barcodes, RFID does not require a line of sight [17,18]. Today, there are two main classifications of RFID tags, active and passive, with the main differentiator being that active RFID tags require a battery source, and passive tags do not [19]. Passive RFID tags working within the ultra-high frequency (UHF) range are commonly used within supply chains for tracking products [20]. Products tagged with UHF RFID tags contain a unique electronic product code (EPC) that allows them to be identified individually [21]. The EPCs are recognized when the readers send out radio waves that activate a chip within the integrated circuit of the tag. When the chip is activated, it can be sensed by readers, communicating the information stored within. A system or process enabled with RFID generates substantial amounts of data. The system is able to document information—timestamps, location, product ID, and product quality—which allows for real-time tracking [22]. This generated information, when combined with data analytics and machine learning, can improve process operations and product visibility within the supply chain [23]. Several researchers have demonstrated the benefits of traceability in logistics and supply chain management based on the implementation of smart technologies. One use case of smart logistics was shown in the development of a sustainable city and digital asset tracking [23]. Pan et al. [24] described a RFID-based logistical solution for storage positioning in large-scale warehouses. They demonstrated that the combined wireless sensor network and RFID could help improve the intelligence level of logistic supply chain management. In another study performed in 2021 [25], the authors demonstrated the effectiveness of using the global positioning system to track the transformation of tobacco products, and they discussed the benefits of a smart logistics to provide a more secure transportation and communication protocol. Other researchers have examined the use of RFID and blockchain technology in agri-logistics systems for enhancing product traceability in China [26]. However, although the use of RFID has grown and expanded, adoptability is lagging due to performance concerns, cost, and complexity of implementation [27,28,29].
Integrating RFID has proven crucial in mitigating inventory inaccuracies, allowing for mistakes to be quickly identified, located, remediated, and adjusted accordingly [21]. RFID has gained popularity due to increased interest in its uses for sustainability, ethical consumption, and trustworthy supply chains [30,31], and also for its potential to address government initiatives. In the United States, a series of legislative actions have been passed in recent years to address the sustainability and safety issues seen in a variety of supply chains. One of them is the Uyghur Forced Labor Prevention Act (UFLPA), which aims to prevent the consumption of tomatoes, cotton, and polysilicon made with forced labor from entering the United States market [32]. Other recent laws include the Food and Drug Administration’s (FDA) Drug Supply Chain Security Act (DSCSA), as well as the Food Safety Modernization Act (FSMA). The DSCSA specifies requirements for prescription drug traceability [33,34]. The objective is to mitigate the introduction of counterfeit drugs, which are considered to be one of the greatest threats to human safety in modern healthcare [35]. Concurrently, FSMA stipulates requirements intended to ensure the safety of the food throughout the supply chain [36]. These requirements are enforced by several rules focusing on preventative measures, improving traceability, and stakeholder communication [37,38,39,40,41]. Although Automatic Identification and Data Capture (AIDC) technologies, such as RFID, are recognized as promising tools for improving product traceability and ensuring regulatory compliance, there remains limited information on how packaging and reader configurations affect RFID performance across various packaging sizes and shapes throughout the supply chain.
The objective of this study is to determine whether there is a discernible difference in readability between two distinct passive UHF RFID tags selected for consumer products filled with liquid and wrapped in foil packaging. Additionally, this study aims to determine whether the readability of these tags can be optimized to enhance product tracking capabilities within cases and pallets in real-world supply chain applications. The study presents a step-by-step framework to test our hypothesis: The readability of RFID tags can be optimized by selecting the best tag design and adjusting key factors such as reader distance, height, location, item configuration, and reading time. These adjustments are analyzed across different packaging levels, including item, case, and pallet.

2. Materials and Methods

2.1. Literature Review to Define the Knowledge Gap and Best Strategy

To determine the best strategy for presenting the research framework and addressing critical elements of RFID performance evaluation and study design, several papers were first reviewed on packaging configurations and how these configurations affect RFID performance.
Singh et al. [42] established that numerous factors significantly impact the ultimate readability of RFID-tagged cases. These factors encompass not only case configurations, tag orientations, and the pallet’s rotational velocity, but also the influence of material handling equipment, electromagnetic fields in the vicinity, and method of unitization. Moreover, products with strong dielectric properties are disruptive in an RF system and require adaptive solutions to persevere [43]. The presence of liquids and metals near RFID tags can also interfere with tag readability and performance [44,45,46,47]. Furthermore, tags are known to behave differently in large populations, inhibiting communication with readers [48,49]. Grabia and Markowski [50] presented a study that attempts to maximize the readability of an RFID-enabled chamber. In their study, tagged parcels were placed in two bins that were inserted into a chamber and read [50]. Claucherty et al. also explored the correlation between drug formulation and RFID performance. To this end, a variety of complex pharmaceutical formulations were assessed in isolation and in a population. While both studies investigated differing degrees of dense tag environments inside a testing chamber, they shed light on the optimization of packaging configurations, an area that has been relatively unexplored.
Additional work can be conducted to enhance efficiency in this process by supporting the needs of “high-value” products. Some of this is exemplified in the processes described by Tomasz Korbiel [51], who discusses innovative applications of Industry 4.0 technologies to the traditional wood transport pallet. They explore the addition of sensors linked to the pallet itself as a means of monitoring temperature and humidity, supporting the needs and safety requirements for high-value products. Additionally, there could be benefits to exploring the effects of free space on general readability in case and pallet design. Free space would likely increase the RF penetration and result in a higher read ratio. This is supported by the research conducted by Clarke et al. [52] and others [9,42], which described the benefits of air gaps in the product packaging configuration. Integrating free space into case and pallet designs could expand the uses of the RF system in the long term. However, the exact configuration of products within a case, and cases within a pallet, as well as their impact on RFID readability, has not been thoroughly explored.
In one study, Hellström and Saghir [8] divided packaging into three tiers of packaging, namely, primary, secondary, and tertiary. In their study, they defined primary packaging as the containment of the product itself, a singular item. They characterized secondary packaging as containing several primary packages, and tertiary as packaging containing an assembly of primary or secondary packages on a pallet bound in stretch wrap [8]. Other studies have been conducted over the years investigating the best configurations for tagged products. In 2006, Clarke et al. [52] looked into the effects of product type and tag orientation on overall readability. The testing was performed on containers filled with water, rice, and air in various positions. They found that a product’s material composition and tag orientation significantly affected the readability of the product samples, as no sample was able to produce 100% readability. The authors communicated that RFID had limitations that required novel solutions for it to be used to its fullest potential within a supply chain. Since this study, several tags have been developed to improve RF performance in the presence of dielectric materials [53,54,55].
Based on the literature review described above, a gap was identified in the academic references regarding the best practices for rigorously testing the impact of reader and pallet configuration on RFID-tagged products at different packaging levels. The current study looks to explore a standardized method and establish a benchmark framework for implementing RFID into a consumer product packaging system that promotes the best RF performance at the pallet level. This framework can be used as a practical showcase of the real-world relevance of RFID in hierarchical packaging systems. This was performed using the materials and methods in the subsequent sections.

2.2. RFID-Tagged Consumer Products

The consumer products for this study were provided and shipped to our laboratory located in Midland, MI, USA from Brady Corporation. This study used 60 cases of commercially available consumer products. Each case contained six prepackaged packages, with each package containing four consumer products. A total of 1440 RFID-tagged consumer products were used. Each product consisted of a small volume of aqueous solution enclosed in a foil pouch. These products were tagged by Brady Corporation and then packaged into shipping packages, each containing 40 units in an 8.2 L carton.

2.3. Passive UHF RFID Tags

Two distinct UHF RFID tags, operating within the 902–928 MHz range (North America Federal Communications Commission (FCC)), with varying antenna designs and dimensions, were provided by Brady Corporation for assessment in this study, as shown in Figure 1. Tag 1 had antenna dimensions of 94 mm × 24 mm (L × H). The dimensions of Tag 2 were 22 mm × 22 mm. To address industry privacy concerns, we intentionally anonymized the data by labeling each tag as Tag 1 and Tag 2.

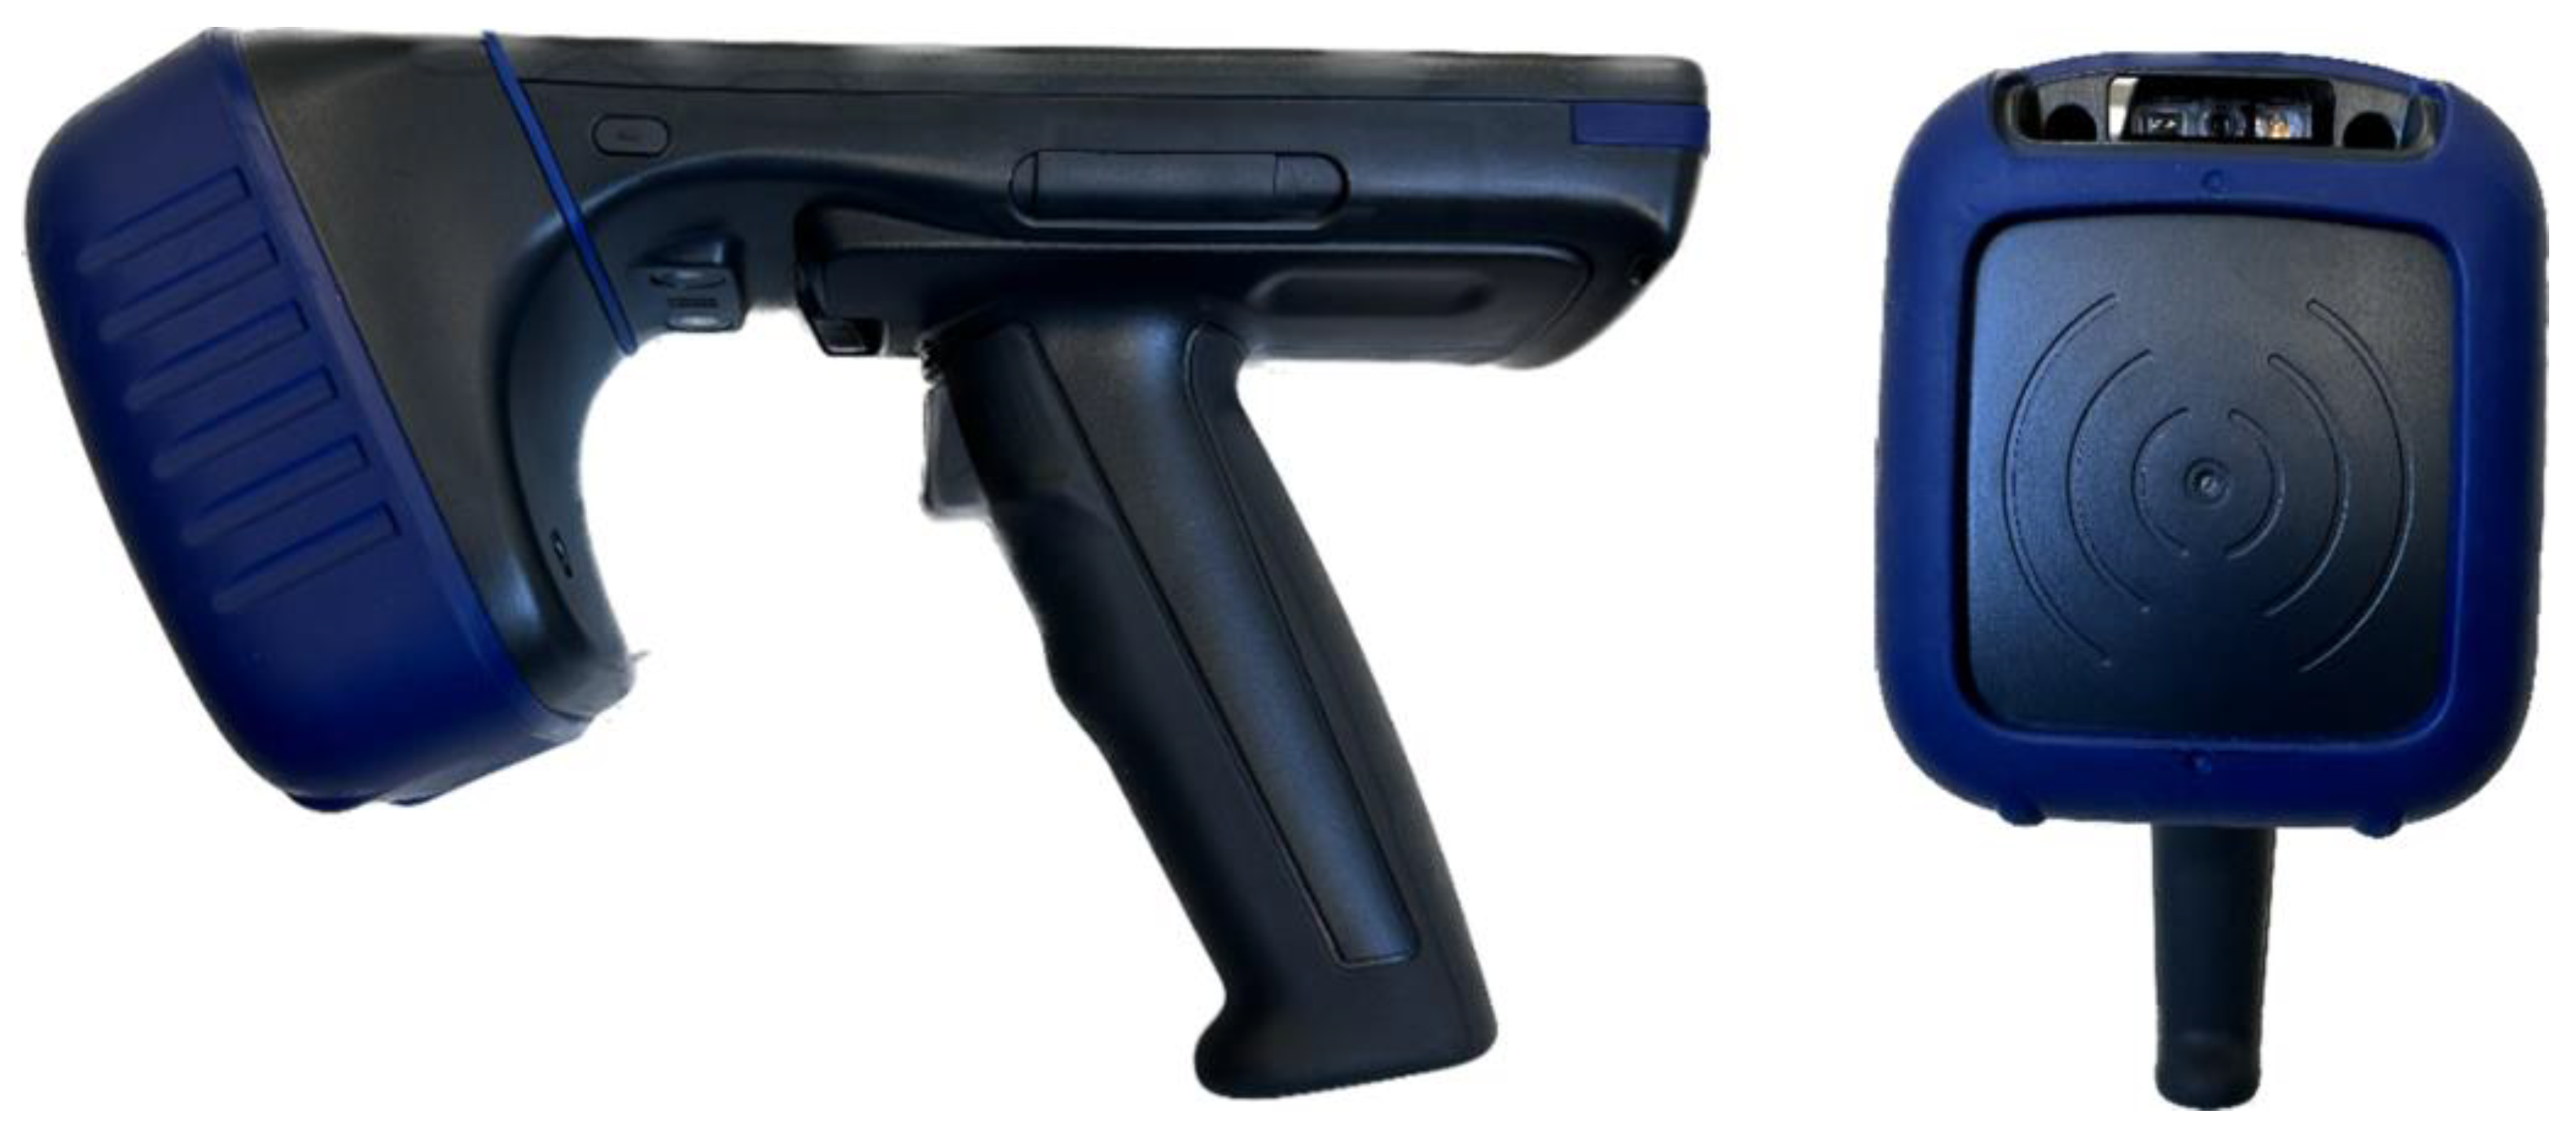
2.4. Brady HH85 RFID Handheld Scanner

A Brady HH85 handheld scanner from Brady Corporation, Milwaukee, WI, USA, as shown in Figure 2, was used to scan and read all tags. The scanner measured 214 mm in height, 87 mm in width, and 135 mm in depth. It featured a Nordic ID NUR2-1W scanner module with software-controllable antenna polarizations, which was used to perform the readings with circular polarization.

2.5. Synergy5 Stretch Wrapping System

A Synergy5 stretch wrapping system from Highlight Industries, Wyoming, MI, USA was used to stretch-wrap the pallets while reading the RFID tags.

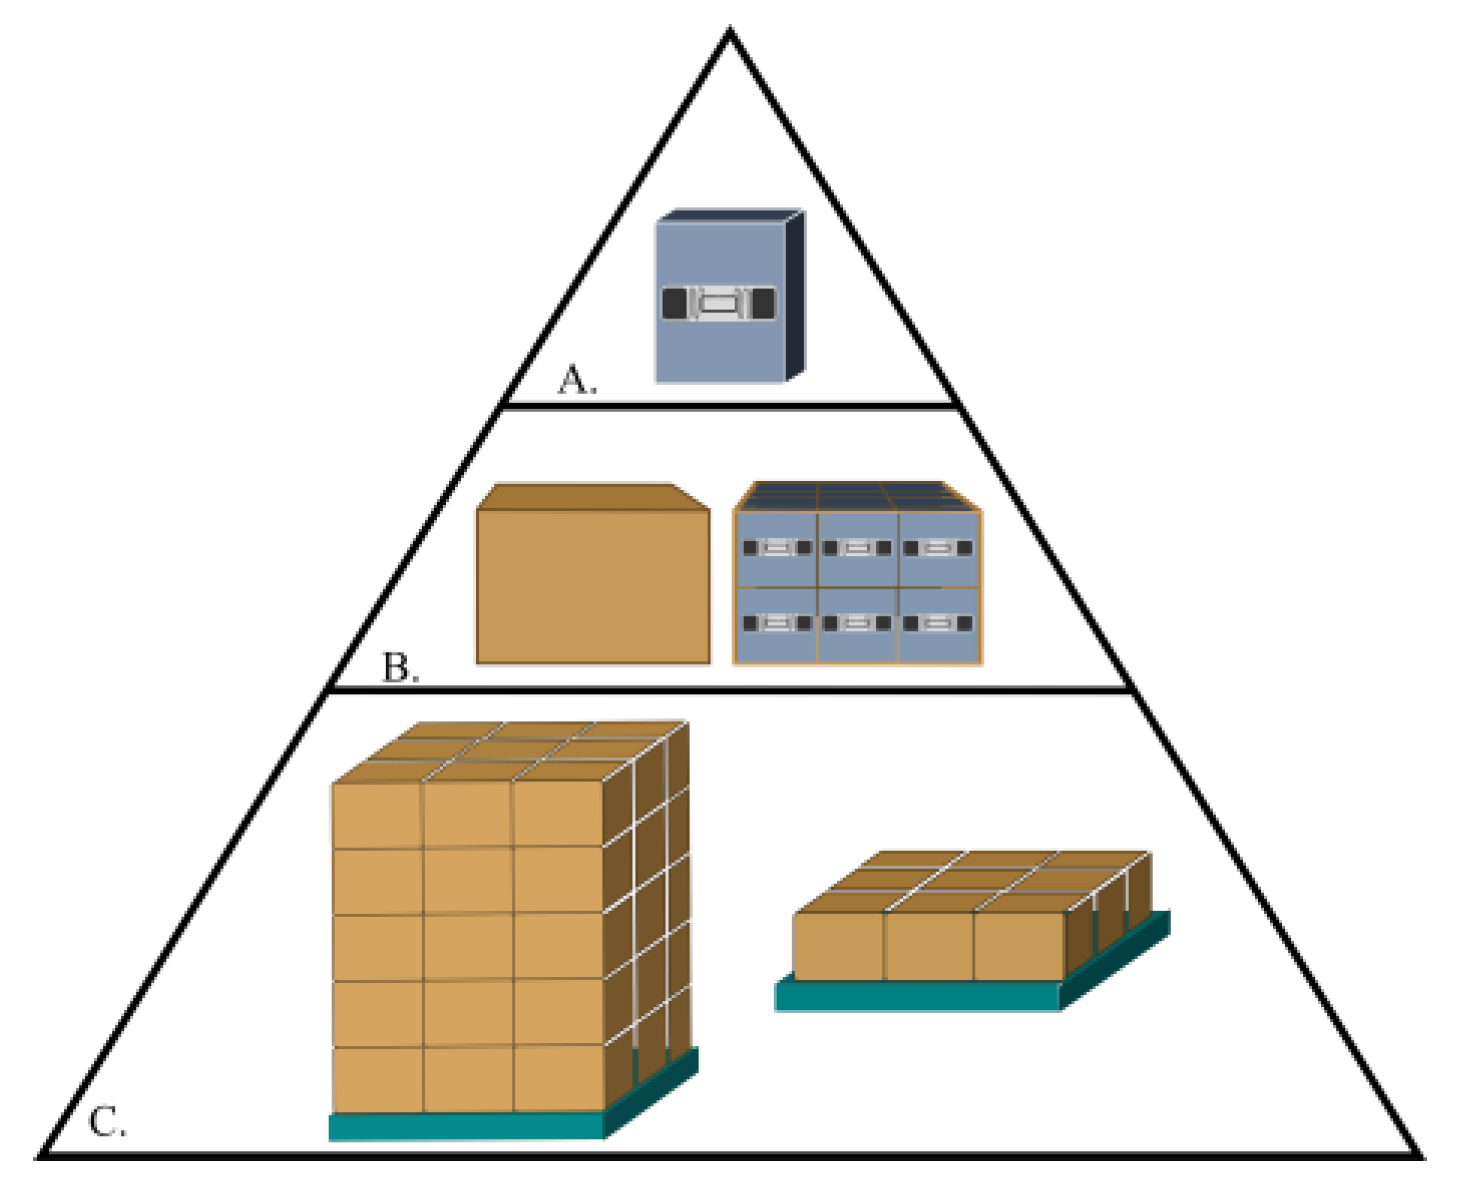
2.6. RFID Readability Assessment at Different Packaging Levels

In this study, the RFID readability of the tagged consumer products was evaluated using a circularly polarized handheld RFID scanner, as described above, at various packaging levels, including the case, layer, and pallet levels. RFID readability was assessed and quantified as a readability ratio, dividing the number of tags read over a given time period by the total number of expected tags (Equation (1)).
r e a d a b i l i t y   r a t i o % = n u m b e r   o f   t a g s   r e a d t o t a l   n u m b e r   t a g s × 100
Several factors were evaluated during each phase of testing to determine the optimal setup for pallet level readability, including reader distance, reader height, reader location, item configuration, and reading time. The hierarchical framework of packaging described by Hellström et al. [8] was employed, with the tiers of packaging divided into primary, secondary, and tertiary levels. These categories are exemplified in Figure 3.
Two complete pallet loads of the same consumer products, containing liquid and pre-wrapped in aluminum foil, were provided by Brady Corporation. The company also provided two distinct UHF RFID tags, designated as Tag 1 and Tag 2. To address industry privacy concerns, Brady Corporation requested that we label the tags anonymously, without including specific manufacturer details. The products were tagged as sellable units by the Brady Corporation (first level of packaging or item level) prior to being delivered to the Axia Lab, located in Midland, MI, USA. The distinct phases of the testing methodology and the decision matrix for each phase are summarized in Figure 4, and all four individual testing phases are described within Section 2.6.1, Section 2.6.2, Section 2.6.3, Section 2.6.4 and Section 2.6.5.

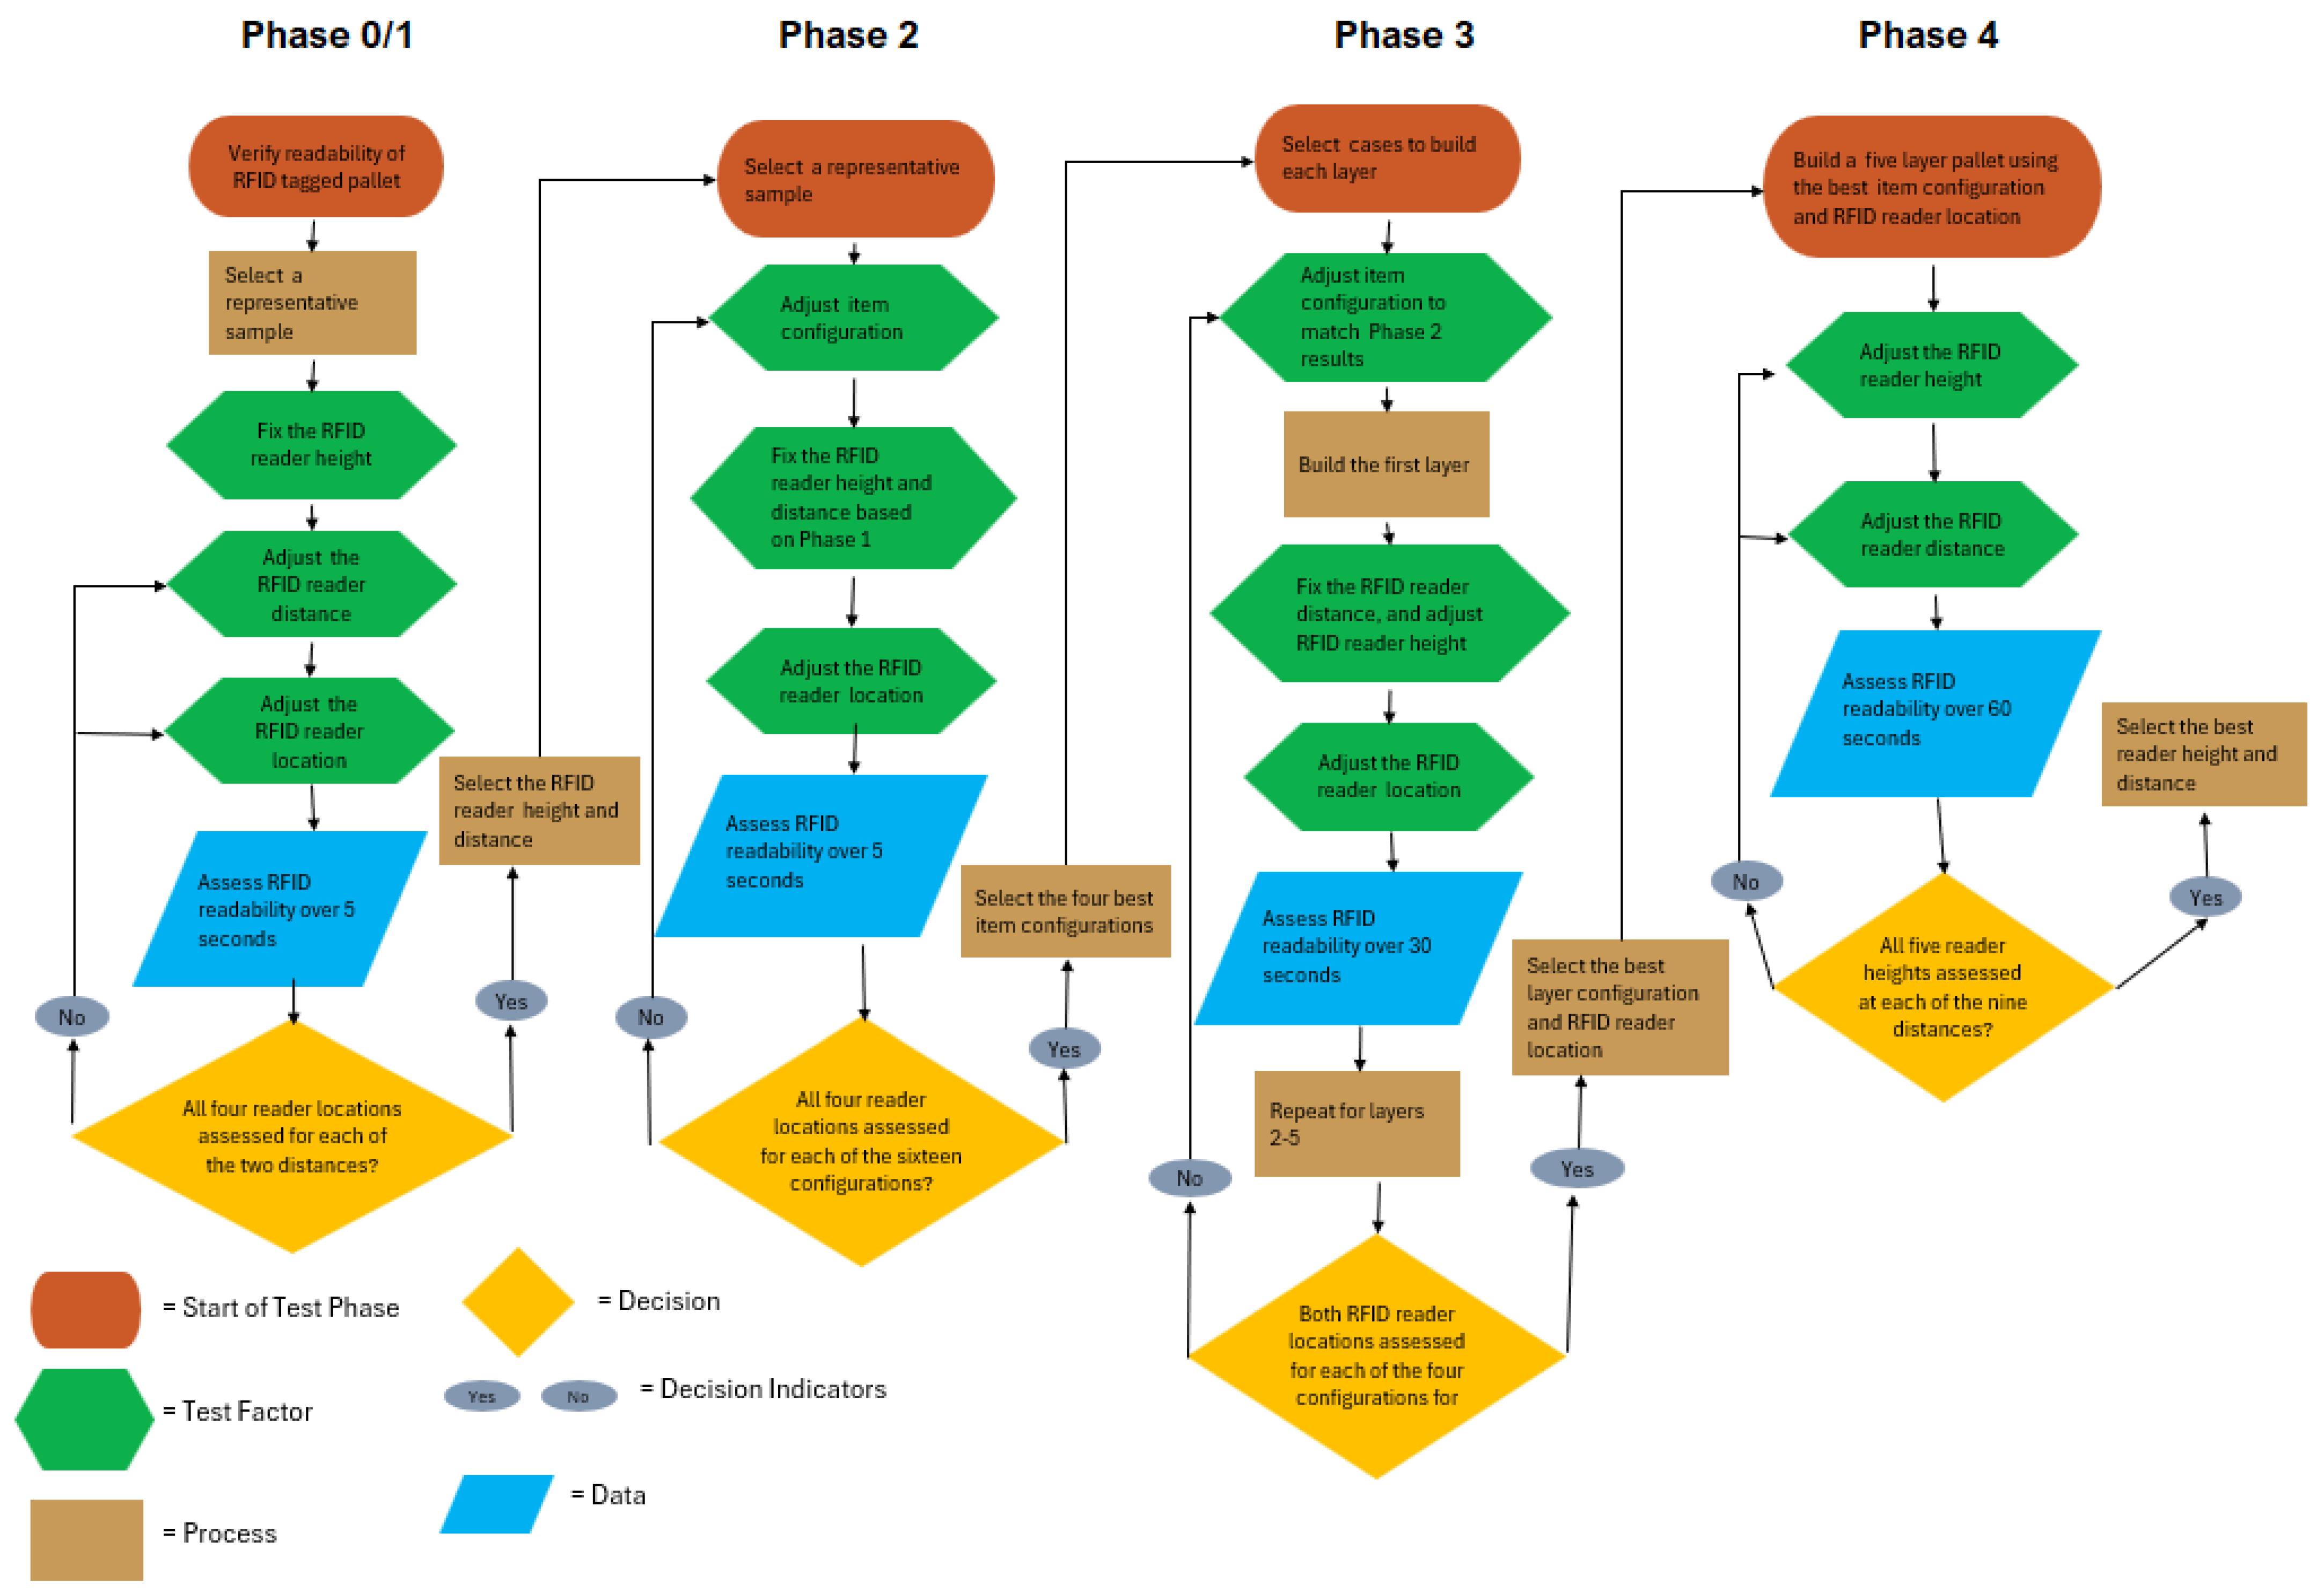
2.6.1. Phase 0: Inspection

Upon arrival, the product cases underwent documentation and inspection for any potential damage. While damage was observed on the exterior of two cases, the items inside remained intact. Each case contained six pre-wrapped packages, with each package holding four consumer products. The total number of tagged items was 1440 tags, as provided by Brady Corporation. Subsequently, the cases were removed from the pallet and sequentially assigned numbers from 1 to 60. Employing a random number generator, five cases were selected to advance to Phase 1.

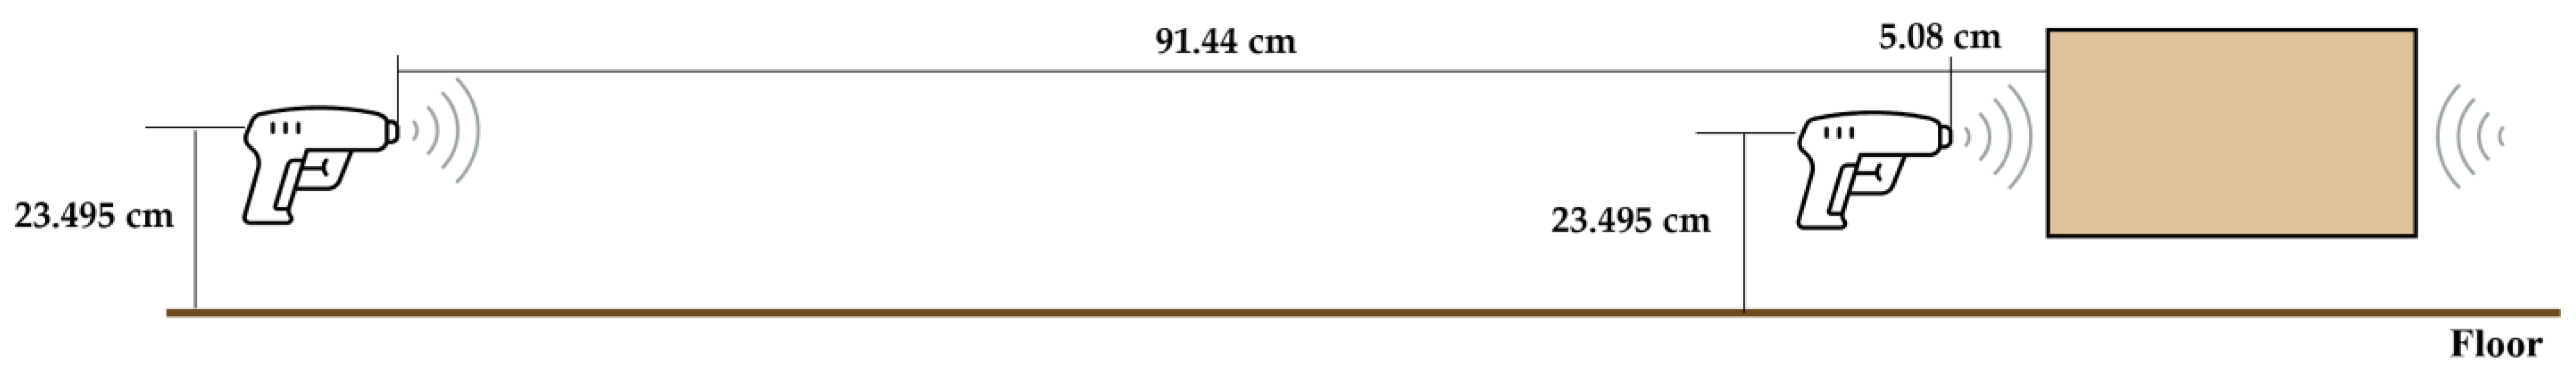
2.6.2. Phase 1: Reading Distance and Reader Position at Case Level

The readability of each randomly selected box from Phase 0 was determined using the same handheld scanner previously described. The internal configuration of the items within the case remained unchanged from their original packaging condition. The readability ratio was calculated by determining the number of tags detected within a five-second interval (based on preliminary testing of maximum time to confirm tag population) on the four sides of the case: the left, right, front, and back. To ensure alignment, the case was elevated to a height of 23.495 cm (9.25 inches) above the surface, thereby aligning the reader with the center of the case. The handheld scanner was placed on an adjustable stand positioned at two fixed distances: 5.08 cm (2 inches, the closest readable distance) and 91.44 cm (36 inches, the maximum readable distance), as shown in Figure 5. Each test was repeated five times to ensure repeatability. The goal of Phase 1 testing was to determine the optimal reader distance for Phase 2.

2.6.3. Phase 2: Item Configuration at the Case Level

A random number generator was utilized to select two cases from Phase 1 for configuration testing. The primary objective of this phase was to refine the product configuration to maximize the desired read rate. A total of 16 different configurations were tested, with the RFID tags on the pre-wrapped products oriented either to the right (R) or left (L). The position of the tags was selected and optimized by Brady Corporation. To preserve the integrity of the products as received by the Brady Corporation, the pre-wrapping was not opened in this study, and readability tests were conducted on all four faces of the case using the same handheld scanner. Based on the results from Phase 1, the reader remained fixed at a distance of 5.08 cm from the case during testing, and the height remained at 23.495 cm. The 16 configurations that were tested are illustrated in Figure 6. The top four configurations that resulted in the highest readability were selected to proceed to the next phase.

2.6.4. Phase 3: Layer Level Item Configuration

In Phase 3, a random number generator was used to select twelve cases, which were then used to construct each layer of the pallet. To ensure the reliability of the results, each layer was tested twice (n = 2). Four distinct configurations from Phase 2 were tested, with each layer retaining the same configuration. The four selected configurations are shown in Figure 7, accompanied by their corresponding numerical identifiers. These configurations were chosen specifically for their feasibility in an industrial setting, as all pre-wrapped items in each row were placed in the same orientation.
The RFID tags were read for a period of 30 s. This time is based on a preliminary evaluation in which the reader did not pick up any more reads. To ensure repeatability, the readings were repeated five times. Subsequently, an additional layer was added, and the process was repeated until the pallet reached a height of five layers. Throughout the test, the reader was positioned at a distance of 5.08 cm from the pallet and held at a height midway between each layer. Readings were conducted on both the front and back faces of the pallet, as illustrated schematically in Figure 8.

2.6.5. Phase 4: Height and Distance at the Pallet Level

In this phase of the study, the height and distance of the reader were examined by using a single configuration and testing a single face to determine the optimal position for optimal readability of a full five-layer pallet. The reader was placed at five different heights, and six to nine distances. The distances were chosen to represent the minimum and maximum number of tags that the reader could detect in a full pallet. The selected heights were chosen to match either the middle or top of a layer. Each test was conducted for 60 s to evaluate the effect of read time on a tag readability on a stationary pallet. The schematic for this phase is shown in Figure 9.

2.7. Rotating Table Tests

To investigate the effect of pallet blind spots and determine how readability could be further maximized, additional testing was conducted using a rotating table. This test assessed the impact of a rotating pallet wrapper on readability, compared to a stationary five-layer pallet. A preliminary investigation was conducted to ascertain the optimal reader position when utilizing the rotating table. The item and case configurations were maintained in the same conditions as those tested in Phases 3 and 4. The pallet was read for a period of 60 s (to compare with the stationary pallet test), with the reader remaining fixed in a single position throughout each trial. A total of twelve tests were performed. Four distances, 15.24 cm, 30.48 cm, 45.72 cm, and 91.44 cm, were evaluated at three different heights: 46.355 cm, 57.78 cm, and 80.01 cm. This series was conducted in replicates of five.
The outcomes of the preliminary test were employed to devise a three-phase test, which was performed over a 180 s period. For each phase, the reader was maintained at a consistent distance, as determined by the initial test. For the first 60 s, the reader was held at a height of 46.35 cm, before being paused and elevated to a height of 57.78 cm. The height was maintained for 60 s, after which it was paused and raised to a height of 80.01 cm. After the final 60 s, the overall readability was recorded. The schematic for this test can be seen in Figure 10. A similar series of tests was performed on a stationary pallet for comparison.

2.8. Statistical Analysis

All data analyses were performed using Microsoft Excel with the Data Analysis Tool-pak (version 2312, Redmond, WA, USA). All tests were conducted in replicates of five or two, and results are presented as the mean ± SD. In particular, one-way ANOVA was used, and the tag design (Tag 1 and Tag 2) and reader configurations (distance, height, and time) were analyzed separately to isolate their individual effects. This was followed by a post hoc Student’s t-test with a significance level of p < 0.05, to evaluate the validity of the research hypothesis. The hypothesis states that RFID tag readability can be optimized by selecting the best tag design and adjusting key factors such as reader distance, height, location, item configuration, and reading time. Statistical significances are explained in the text and shown in tables using letters denoting significance where applicable.

3. Results and Discussion

3.1. Phase 1: The Effect of Reader Distance and Position on RFID Readability at the Case Level

The goal of this phase was to determine the optimal RFID reader distance and position to achieve maximum readability at the case level using two different RFID tag designs. As evidenced by the data presented in Table 1a,b, the readability ratio was significantly impacted by the reading distance, with a clear preference for readings taken at a closer distance of 5.08 cm compared to the distance of 91.44 cm. A notable statistical difference (p < 0.05) was observed (indicated by letters (a–b) across the rows) in the performance of each tag, suggesting that distance and reader placement play a significant role in tag readability. The impact of reading distance was more pronounced in the case of Tag 1, where the highest read rate achieved at 5.08 cm was 96.7% ± 2.1 at the reader facing back of the case, while the read rate dropped to 22.2% ± 7.6 at 91.44 cm. Furthermore, While Tag 1 achieved a maximum read rate of 96.7% ± 2.1 at a distance of 5.08 cm, Tag 2 demonstrated 100% ± 0.0 readability across all case faces. This confirms that both reader distance and tag design are contributing factors to the overall readability. Other researchers have observed analogous trends of decreasing read rates of UHF RFID tags with increasing reader distance [56]. Furthermore, a notable statistical difference (p < 0.05) indicated by capital letters (A–D) within the columns in Table 1 was observed in the tag performance of each reader position with the exception of Tag 2 at 5.08 cm, suggesting that reader positioning may play another significant role in tag readability. Given the results of this phase, a reading distance of 5.08 cm was selected for the following phases, and the four reader configurations were again selected for evaluation in Phase 2.

3.2. Phase 2: The Effects of Item Configuration Within a Case on RFID Readability

The goal of Phase 2 was to determine the impact of item configuration and tag design on readability at the fixed distance of 5.08 cm identified in Phase 1. Each case contained six pre-wrapped packages of four RFID-tagged items, arranged in two distinct rows. Based on the total number of products within each case, a total of 16 configurations were initially created, as illustrated in Figure 6. The results of the read ratios for all 16 configurations at the 5.08 cm reader distance are presented in Table 2. The results of this phase were found to be consistent regardless of the item configuration. This could be attributed to the use of a circularly polarized (CP) reader antenna, which has a shorter read range compared to a linearly polarized (LP) antenna. However, it is capable of reading tags in different orientations [57].
Overall, Tag 2 demonstrated better performance, exhibiting a readability of 100% ± 0.0 in all tested orientations, with the exception of one configuration (RRR/LLL) where the reader faced the left side of the case. For Tag 1, readability was generally higher when the reader faced the front or back of the case, with two configurations (LLL/LLL and RLR/LLL) yielding a readability of 100% ± 0.0. The lowest readability observed for Tag 1 was 80.4% ± 12.0 in the LLL/RRL configuration, with the reader facing the right side of the case. Based on the results, the front and back reader placements were selected to proceed to Phase 3 testing. In conjunction with the reader placement, the configurations selected for Phase 3 were LLL/LLL, RRR/RRR, LLL/RRR, and RRR/LLL. These item configurations were chosen based on ease of replication at the manufacturing level within the industry.

3.3. Phase 3: The Effect of Configuration of the Layers in a Pallet on RFID Readability

The objective of Phase 3 was to investigate the effect of placement of the reader (either at the front or back of the cases) on RFID readability in one layer of tagged items. The RFID tags were read for a period of 30 s, with the reader fixed at a distance of 5.08 cm from the layer. Subsequently, the height of the reader was adjusted to align with the center height of the total number of layers, following the addition of each layer. The results of this phase are presented in Table 3a,b. The results of the statistical analysis (p < 0.05), indicated by capital letters A and B within a column, show that there were minimal differences between the front and back reader positions. The only statistically significant differences between reader positions were seen with Tag 1 in layer 2 of corresponding inverse setups (RRR/RRR and LLL/LLL, and RRR/LLL and LLL/RRR). This finding corroborates the hypothesis that the positioning of readers has no impact on readability when contrasting the front and back.
Consequently, a comparison of Tag 1 and 2 was performed for each layer, which revealed a statistically significant difference (p < 0.05), indicated by letters a and b, for all RRR/RRR and LLL/LLL configurations, with the exception of layer 3, and all LLL/RRR and RRR/LLL configurations, with the exception of layers 3 and 4. This could be attributed to a number of factors, including the design of the tag antenna, increased RF reflections from nearby tags, environmental effects, and the orientation of tags within the cases [9]. In general, tag readability decreased as the number of layers increased. For example, Tag 1’s highest readability was 93.5% ± 0.4 in a single-layer configuration, which then decreased to 63.2% ± 0.7 in a full five-layer pallet. Following a similar trend, Tag 2’s highest readability was 96.9% ± 0.9 in a single-layer configuration and decreased to 74.3% ± 0.9 in a full five-layer pallet configuration. This decrease in readability in a full pallet was anticipated due to tag density and tag-to-tag interference [58]. Based on these results and the need for a configuration that is easily accommodated in a manufacturing setting, a single configuration with all the tagged products facing the same direction (LLL/LLL or RRR/RRR) was selected.

3.4. Phase 4: The Effect of Reader Height at Pallet Level on RFID Readability

Following the determination of the optimal reader direction and case configuration for a pallet in Phase 3, Phase 4 was focused on determining the best reader positioning to maximize readability of each tag for a full five-layer pallet. A total of nine distances were evaluated, ranging from 5.08 cm to 91.44 cm, and five heights were considered, corresponding to the top and center of layers 2, 3, and 4, with values between 46.355 cm (18.25 inches) and 102.87 cm (50.5 inches). The data pertaining to the readability ratios are presented in Table 4. The results indicate that the reader distances of 7.62 cm and 10.16 cm had the best readability ratios for Tag 1, although the distances 30.48 cm, 45.72 cm, and 91.44 cm were not evaluated. Tag 2 generally performed better at 20.32 cm and 30.48 cm. As the reader was positioned further from the layers, the readability decreased, a finding that has been previously documented by other researchers [56]. However, between the distances of 15.24 cm and 45.72 cm, the readability of Tag 2 increased, indicating a correlation between height and distance.
Additional factors to consider are the differences in tag antenna design, as well as environmental and packaging factors such as tag density, free space on the pallet, and residual RF waves [9]. The highest readability produced by Tag 1 was 64.5% with the reader positioned at a height of 57.78 cm and a reader distance of 7.62 cm, and 10.16 cm from the pallet. Tag 2 achieved a maximum readability of 79.7% ± 0.9 at a reader height of 80.01 cm and a distance of 20.32 cm. Statistical differences (p < 0.05) were observed between Tag 1 and Tag 2 for the majority of the heights and distances tested, indicating that one tag generally performed better than the other. These significant differences between the tags are noted with different letters (a–b), with the exception of reader distances from 30.48 cm, as these results were not available for Tag 1. A schematic of the optimal reader position for each tag is shown in Figure 11.

3.5. General Comparison of Tag 1 and Tag 2

The performance of Tag 2 exceeded that of Tag 1 in each phase of testing. In Phases 1 and 2, the tag demonstrated 100% readability at both the item and case levels. In Phase 3, Tag 2 achieved a maximum readability of 74.3% ± 0.9, in comparison to Tag 1’s 63.2% ± 0.7. In Phase 4, the maximum readability of Tag 2 increased to 79.7% ± 0.9, in comparison to Tag 1, which only increased to 64.5% ± 0.2. The selection of tags in an RF system is imperative for maximizing its capabilities. The tagged items in this study were composed of foil and a small quantity of liquid, both of which are known to possess strong dielectric properties [59]. Consequently, the tags selected for this sample set were chosen with the material composition of the items in mind. However, the observed variation in performance indicates that further research and development in RFID tag implementation is necessary to determine the best fit for the application.

3.6. Additional Testing to Improve the Overall Readability at the Pallet Level: The Impact of Rotation

Given that the overall tag readability on the full five-layer pallet was less than 74.3% ± 0.9, it was decided that an additional test should be conducted to evaluate the improvement factor. The rotating table was utilized to evaluate its impact on RF readability and to determine if it could enhance the granularity of the system. The introduction of the rotating table allowed the RF reader to access a greater range of angles, thereby improving the ability to sense tags in a more comprehensive manner than would be possible with a stationary pallet. Initially, a preliminary test was conducted at three different heights, alternating between four and five different distances, each replicated five times. The results are shown in Table 5.
The results for Tag 1 showed a maximum readability of 93.6% ± 0.5 when the reader was positioned 15.24 cm from the pallet at a height of 57.78 cm. The lowest readability, 67.7% ± 0.5, was observed at a height and distance of 68.58 cm and 91.44 cm, respectively. The test results for Tag 2 showed a maximum readability of 97.8% ± 0.4 when the reader was situated 45.72 cm from the pallet at a height of 68.58 cm. The lowest readability of 87.7% ± 0.5 was observed at a height of 46.35 cm and a distance of 91.44 cm. In consideration of the capabilities of both tags, an optimal distance was identified that ensured readability without compromising safety while the pallet was in motion. At this distance, the pallet would not collide with the reader or a potential user as it rotated, while still yielding the highest readability for each tag. The results are presented in Table 6a,b.
A comparison of the results between the non-rotating table and the rotating table revealed a notable 10.8% increase in readability for Tag 1, and a 7% increase in readability for Tag 2. By moving the reader in a vertical direction while utilizing the rotating table, the sensors’ capacity to penetrate the dense tag environment was enhanced. This effect was further advanced by allowing the reader to dwell at each desired height for 60 s, thereby providing the sensor a sufficient amount of time to identify as many EPCs as possible. This strategy proved to be effective based on the results. Other researchers have investigated the effect of three-dimensional scanning methods using fixed readers on a gate with mechanized scanning directions and changing scanning patterns and compared them to one and two-dimensional reading techniques [60]. Their methodology and results are analogous to this study in that the addition of three-dimensional rotation increased the readability of the tags. A statistically significant difference (p < 0.05) was observed between Tag 1 and Tag 2 at each reader height, with the exception of 46.355 cm on the rotating table. Furthermore, a significant difference (p < 0.05) was observed in readability between each height indicated by capital letters (A–C) in each column. The comparison of rotating versus non-rotating table results demonstrated that for Tag 1, the use of a rotating table increased readability from 65.4% ± 0.3 to 90.1% ± 0.8. Similarly, for Tag 2, readability increased from 67.4% ± 0.7 to 90.6% ± 0.3 at 46.355 cm. Overall, as with the non-rotating configuration, Tag 2 demonstrated superior performance compared to Tag 1, indicating the effect of static and dynamic palletizers coupled with enhanced coverage from height.

4. Conclusions

This study aimed to explore the feasibility of achieving high RFID readability within complex pallet configurations containing liquids and aluminum foil. To evaluate the feasibility of using RFID in this context, a step-by-step muti-phase approach was developed. In this approach, a circularly polarized handheld scanner and two distinct UHF RFID tag designs were used to assess factors such as reader distance, reader height, packaging configuration, and the impact of static and dynamic palletizers on tag readability. The results confirmed the hypothesis that reader configuration, and specifically height, distance, and reading time, is crucial for achieving maximum RFID readability. Furthermore, under the optimized pallet and reader configuration, one tag outperformed the other, achieving a readability rate of 99.7%.
The discrepancies between Tag 1 and Tag 2 highlighted the necessity of considering both the impact of tag design and the specific RFID environment, including the reading mechanism (e.g., conveyor, handheld, or portal). The final test, conducted on a rotating table, revealed that, after all, other variables affecting readability were optimized, rotation on a pallet wrapper enhanced the tag exposure to the reader, thereby improving the overall readability.
While the existing literature offers numerous approaches to enhance RFID readability, it is imperative to emphasize that each use case demands individual consideration to truly capitalize on the potential of this technology. It is essential to prioritize comprehensive training and a deeper understanding of RFID concepts in conjunction with robust research and development efforts for its successful deployment and utilization. The overarching aim of this research was to develop a straightforward methodology for the selection of optimal RFID tag locations and effective strategies for achieving higher read rates. The results demonstrated the critical impact of the factors influencing RFID readability, including tag design, packaging, and tag configurations, in addition to reader orientation. It is also recommended that a rotating table be utilized, as this has been shown to enhance readability by minimizing blind spots that typically arise in densely populated RF environments. The step-by-step methodology outlined in this paper can serve as a framework for research and development to refine the optimal configuration, orientation, and placement of the tag for effective readability within the available resources.
Despite the emphasis of this research on logistics and packaging configuration to maximize readability, it is important to acknowledge the versatility of the field of packaging and logistics. This topic is multi-purpose, meaning it can be applied across a wide variety of fields, including pharmaceuticals, food, advanced manufacturing, and others. This research establishes a foundation for further investigations into the application of RFID in other sectors, particularly in terms of tracking and traceability capabilities, as well as the integration of RFID into IoT platforms.

Author Contributions

Conceptualization, B.A. and E.C.; methodology, E.C. and D.C.; software, E.C.; validation, E.C., D.C. and B.A.; formal analysis, E.C.; investigation, E.C.; resources, B.A.; writing—original draft preparation, E.C.; writing—review and editing, E.C., D.C. and B.A.; visualization, E.C. and D.C.; supervision, B.A.; project administration, B.A. All authors have read and agreed to the published version of the manuscript.

Funding

This project was funded by Brady Corporation (DY100181).

Data Availability Statement

The authors confirm that the data supporting the findings of this study are available within the article. All other relevant data supporting the findings of this study are available from the corresponding authors upon reasonable request.

Acknowledgments

The authors acknowledge Brady Corporation for the supply of the scanner, tags, and necessary products. The authors would like to thank Robert Clarke for his recommendations during the development of this study and Aditya Purandare for his assistance during the testing procedures.

Conflicts of Interest

The authors declare no conflicts of interest.

References

  1. Nizioł, M.; Jankowski-Mihułowicz, P.; Węglarski, M. Determination of Parameters of Radio Frequency Identification Transponder Antennas Dedicated to IoTT Systems Located on Non-Planar Objects. Electronics 2024, 13, 2800. [Google Scholar] [CrossRef]
  2. Li, Y.; Ma, Y.; Tian, C.; Su, D.; Yang, B. DNCL: Hybrid DOA Estimation and NMDS Cooperative Multi-Target Localization for RFID. Electronics 2023, 12, 1742. [Google Scholar] [CrossRef]
  3. Song, C.; Wu, Z.; Gray, J.; Meng, Z. An RFID-Powered Multisensing Fusion Industrial IoT System for Food Quality Assessment and Sensing. IEEE Trans. Ind. Inform. 2024, 20, 337–348. [Google Scholar] [CrossRef]
  4. Raj, A.; Mukherjee, A.A.; de Sousa Jabbour, A.B.L.; Srivastava, S.K. Supply chain management during and post-COVID-19 pandemic: Mitigation strategies and practical lessons learned. J. Bus Res. 2022, 142, 1125–1139. [Google Scholar] [CrossRef] [PubMed]
  5. Tian, S.; Wu, L.; Pia Ciano, M.; Ardolino, M.; Pawar, K.S. Enhancing innovativeness and performance of the manufacturing supply chain through datafication: The role of resilience. Comput. Ind. Eng. 2024, 188, 109841. [Google Scholar] [CrossRef]
  6. Khan, Y.; Su’ud, M.B.M.; Alam, M.M.; Ahmad, S.F.; Ahmad, A.Y.A.B.; Khan, N. Application of Internet of Things (IoT) in Sustainable Supply Chain Management. Sustainability 2022, 15, 694. [Google Scholar] [CrossRef]
  7. Bix, L.; Sansgiry, S.S.; Clarke, R.; Cardoso, F.; Shringarpure, G.S. Retailers’ tagging practices: A potential liability? Packag. Technol. Sci. 2004, 17, 3–11. [Google Scholar] [CrossRef]
  8. Hellström, D.; Saghir, M. Packaging and logistics interactions in retail supply chains. Packag. Technol. Sci. 2006, 20, 197–216. [Google Scholar] [CrossRef]
  9. Singh, S.P.; McCartney, M.; Singh, J.; Clarke, R. RFID research and testing for packages of apparel, consumer goods and fresh produce in the retail distribution environment. Packag. Technol. Sci. 2008, 21, 91–102. [Google Scholar] [CrossRef]
  10. Tao, F.; Wang, L.; Fan, T.; Yu, H. RFID Adoption Strategy in a Retailer-Dominant Supply Chain with Competing Suppliers. Eur. J. Oper. Res 2022, 302, 117–129. [Google Scholar] [CrossRef]
  11. Zohar, N. Divide and Conquer: Detecting and Tracking Passive RFID Tags in Retail Spaces. In Proceedings of the 2022 IEEE Wireless Communications and Networking Conference (WCNC), Austin, TX, USA, 10–13 April 2022; pp. 1443–1448. [Google Scholar]
  12. Casamayor-Pujol, V.; Gastón, B.; López-Soriano, S.; Alajami, A.A.; Pous, R. A Simple Solution to Locate Groups of Items in Large Retail Stores Using an RFID Robot. IEEE Trans. Ind. Inform. 2022, 18, 767–775. [Google Scholar] [CrossRef]
  13. Shen, E.; Duan, S.; Guo, S.; Yang, W. Object Localization and Sensing in Non-Line-of-Sight Using RFID Tag Matrices. Electronics 2024, 13, 341. [Google Scholar] [CrossRef]
  14. Wang, H.; Du, W.; Qin, B.; Pan, R.; Pang, S. A Real-Time System Status Evaluation Method for Passive UHF RFID Robots in Dynamic Scenarios. Electronics 2024, 13, 4162. [Google Scholar] [CrossRef]
  15. Chetouane, F. An Overview on RFID Technology Instruction and Application. IFAC-PapersOnLine 2015, 48, 382–387. [Google Scholar] [CrossRef]
  16. Claucherty, E.; Cummins, D.; Aliakbarian, B. Exploring the correlation between drug formulation and radio frequency performance in RFID-enabled pharmaceutical products. Int. J. RF Technol. 2024, 14, 33–52. [Google Scholar] [CrossRef]
  17. Kumar, P.; Reinitz, H.W.; Simunovic, J.; Sandeep, K.P.; Franzon, P.D. Overview of RFID technology and its applications in the food industry. J. Food Sci. 2009, 74, R101–R106. [Google Scholar] [CrossRef]
  18. Htun, N.N.; Wiśniewska, A.; Nocella, G.; Santa Cruz, E.; Peracaula-Moner, A.; Vehmas, K.; Hakola, L.; Liczmańska-Kopcewicz, K.; Bridgett, L.; Verbert, K. Smart tag packaging technologies: A qualitative investigation of consumers’ needs and expectations. Packag. Technol. Sci. 2023, 36, 595–613. [Google Scholar] [CrossRef]
  19. Ghaani, M.; Cozzolino, C.A.; Castelli, G.; Farris, S. An overview of the intelligent packaging technologies in the food sector. Trends Food Sci. Technol. 2016, 51, 1–11. [Google Scholar] [CrossRef]
  20. Zhang, J.; Tian, G.Y.; Marindra, A.M.J.; Sunny, A.I.; Zhao, A.B. A Review of Passive RFID Tag Antenna-Based Sensors and Systems for Structural Health Monitoring Applications. Sensors 2017, 17, 265. [Google Scholar] [CrossRef] [PubMed]
  21. Sriram, V.P.; Raj, K.B.; Srinivas, K.; Pallathadka, H.; Sajja, G.S.; Gulati, K. An Extensive Systematic Review of RFID Technology Role in Supply Chain Management (SCM). In Proceedings of the 2021 6th International Conference on Signal Processing, Computing and Control (ISPCC), Solan, India, 7–9 October 2021; pp. 789–794. [Google Scholar]
  22. Tan, W.C.; Sidhu, M.S. Review of RFID and IoT integration in supply chain management. Oper. Res. Perspect. 2022, 9, 100229. [Google Scholar] [CrossRef]
  23. Grunt, M.; Błażejewski, A.; Pecolt, S.; Królikowski, T. BelBuk System—Smart Logistics for Sustainable City Development in Terms of the Deficit of a Chemical Fertilizers. Energies 2022, 15, 4591. [Google Scholar] [CrossRef]
  24. Pan, C.; Liu, M. Optimization of Intelligent Logistics Supply Chain Management System Based on Wireless Sensor Network and RFID Technology. J. Sens. 2021, 2021, 8111909. [Google Scholar] [CrossRef]
  25. Chen, C.-L.; Lim, Z.-Y.; Liao, H.-C.; Deng, Y.-Y.; Chen, P. A Traceable and Verifiable Tobacco Products Logistics System with GPS and RFID Technologies. Appl. Sci. 2021, 11, 4939. [Google Scholar] [CrossRef]
  26. Tian, F. An agri-food supply chain traceability system for China based on RFID & blockchain technology. In Proceedings of the 2016 13th International Conference on Service Systems and Service Management (ICSSSM), Kunming, China, 24–26 June 2016; pp. 1–6. [Google Scholar]
  27. Kineber, A.F.; Oke, A.E.; Elseknidy, M.; Hamed, M.M.; Kayode, F.S. Barriers to the Implementation of Radio Frequency Identification (RFID) for Sustainable Building in a Developing Economy. Sustainability 2023, 15, 825. [Google Scholar] [CrossRef]
  28. Lui, A.K.H.; Lo, C.K.Y.; Ngai, E.W.T.; Yeung, A.C.L. A Tough Pill to Swallow? The Lessons Learned from Mandatory RFID Adoption. Int. J. Prod. Econ. 2023, 258, 108811. [Google Scholar] [CrossRef]
  29. Popova, I.; Abdullina, E.; Danilov, I.; Marusin, A.; Marusin, A.; Ruchkina, I.; Shemyakin, A. Application of the RFID technology in logistics. Transp. Res. Procedia 2021, 57, 452–462. [Google Scholar] [CrossRef]
  30. Ferdous, R.M.; Reza, A.W.; Siddiqui, M.F. Renewable energy harvesting for wireless sensors using passive RFID tag technology: A review. Renew. Sustain. Energy Rev. 2016, 58, 1114–1128. [Google Scholar] [CrossRef]
  31. Rozhok, A.; Adorni, E.; Revetria, R. Literature Review on Supply Chain Operations Reference Model. In Proceedings of the Modelling and Simulation 2023—European Simulation and Modelling Conference 2023, ESM 2023, Toulouse, France, 24–26 October 2023; pp. 383–388. [Google Scholar]
  32. Public Law 117–78 117th Congress, 135 STAT. 1525. An Act to Ensure That Goods Made with Forced Labor in the Xinjiang Uyghur Autonomous Region of the People’s Republic of China Do Not Enter the United States Market, and for Other Purposes. 23 December 2021. Available online: https://www.congress.gov/117/plaws/publ78/PLAW-117publ78.pdf (accessed on 9 June 2024).
  33. Public Law 113–54 113th Congress, 127 STAT. 587. An Act to Amend the Federal Food, Drug, and Cosmetic Act with Respect to Human Drug Compounding and Drug Supply Chain Security, and for Other Purposes. 27 November 2013. Available online: https://www.congress.gov/113/statute/STATUTE-127/STATUTE-127-Pg587.pdf (accessed on 9 June 2024).
  34. Brechtelsbauer, E.D.; Pennell, B.; Durham, M.; Hertig, J.B.; Weber, R.J. Review of the 2015 Drug Supply Chain Security Act. Hosp. Pharm. 2016, 51, 493–500. [Google Scholar] [CrossRef]
  35. Bapatla, A.K.; Mohanty, S.P.; Kougianos, E. PharmaChain 3.0: Efficient Tracking and Tracing of Drugs in Pharmaceutical Supply Chain Using Blockchain Integrated Product Serialization Mechanism. SN Comput. Sci. 2024, 5, 149. [Google Scholar] [CrossRef]
  36. Public Law 111–353 111th Congress, 124 STAT. 3885. An Act to Amend the Federal Food, Drug, and Cosmetic Act with Respect to the Safety of the Food Supply. 4 January 2011. Available online: https://www.govinfo.gov/content/pkg/PLAW-111publ353/pdf/PLAW-111publ353.pdf (accessed on 9 June 2024).
  37. Grover, A.K. Out of the frying pan and into the fire? Uncovering the impact of FSMA’s sanitary food transportation rule on the food logistics industry. Bus. Horiz. 2023, 66, 203–214. [Google Scholar] [CrossRef]
  38. Vahidi, A.; Gebremariam, A.T.; Di Maio, F.; Meister, K.; Koulaeian, T.; Rem, P. RFID-based material passport system in a recycled concrete circular chain. J. Clean. Prod. 2024, 442, 140973. [Google Scholar] [CrossRef]
  39. Walden, J.; Steinbrecher, A.; Marinkovic, M. Digital Product Passports as Enabler of the Circular Economy. Chem. Ing. Tech. 2021, 93, 1717–1727. [Google Scholar] [CrossRef]
  40. Panza, L.; Bruno, G.; Lombardi, F. A Collaborative Architecture to support Circular Economy through Digital Material Passports and Internet of Materials. IFAC-PapersOnLine 2022, 55, 1491–1496. [Google Scholar] [CrossRef]
  41. European Commission, COM(2022) 140 Final. Communication from the Commission to the European Parliament, the Council, the European Economic and Social Committee and the Committee of the Region: On Making Sustainable Products the Norm. Brussels. 30 March 2022. Available online: https://eur-lex.europa.eu/legal-content/EN/TXT/?uri=celex%3A52022DC0140 (accessed on 9 June 2024).
  42. Singh, J.; Olsen, E.; Vorst, K.; Tripp, K. RFID tag readability issues with palletized loads of consumer goods. Packag. Technol. Sci. 2009, 22, 431–441. [Google Scholar] [CrossRef]
  43. Bogataj, U.; Maček, M.; Muck, T.; Gunde, M.K. Readability and Modulated Signal Strength of Two Different Ultra-high Frequency Radio Frequency Identification Tags on Different Packaging. Packag. Technol. Sci. 2011, 25, 373–384. [Google Scholar] [CrossRef]
  44. He, S.; Zhang, Y.; Li, L.; Lu, Y.; Zhang, Y.; Liu, H. High Performance Uhf Rfid Tag Antennas on Liquid-Filled Bottles. Prog. Electromagn. Res. 2019, 165, 83–92. [Google Scholar] [CrossRef]
  45. Periyasamy, M.; Dhanasekaran, R. Assessment and Analysis of Performance of 13.56 MHz Passive RFID in Metal and Liquid Environment. In Proceedings of the 2014 International Conference on Communications and Signal Processing (Iccsp), Melmaruvathur, Tamilnadu, India, 3–5 April 2014. [Google Scholar]
  46. Yu, Y.S.; Qu, Y. Research on Environmental Factors Affecting RFID Reading Performance. In Proceedings of the 2020 IEEE 5th Information Technology and Mechatronics Engineering Conference (Itoec 2020), Chongqing, China, 12–14 June 2020; pp. 763–766. [Google Scholar]
  47. Bertolini, M. Performance measurement and analysis for an RFID technology application to commercial products. Int. J. RF Technol. Res. Appl. 2009, 1, 279–305. [Google Scholar] [CrossRef]
  48. Chai, J.; Ma, C.; Ruan, Z.; Li, Y.; Qin, L.; Ren, K. A Receiving Gain Monitoring and Dynamic Regulation Method for High Frequency RFID System with Dense Tags. In Proceedings of the 2023 5th International Conference on Intelligent Control, Measurement and Signal Processing (ICMSP), Chengdu, China, 19–21 May 2023; pp. 917–922. [Google Scholar]
  49. Yang, W.; Cheng, X.; Guo, Z.; Sun, Q.; Wang, J.; Wang, C. Design, Fabrication and Applications of Flexible RFID Antennas Based on Printed Electronic Materials and Technologies. J. Mater. Chem. C 2023, 11, 406–425. [Google Scholar] [CrossRef]
  50. Grabia, M.; Markowski, T. A chamber for stocktaking of courier parcels in a dense environment. In Proceedings of the 2022 IEEE International Conference on RFID (RFID), Las Vegas, NV, USA, 17–19 May 2022; pp. 70–74. [Google Scholar]
  51. Korbiel, T. Diagnostics of Logistics Processes Using Pallet 4.0®. In Proceedings of the Advances in Technical Diagnostics II, Cham, Switzerland, 14–16 September 2022; pp. 115–122. [Google Scholar]
  52. Clarke, R.H.; Twede, D.; Tazelaar, J.R.; Boyer, K.K. Radio Frequency Identification (RFID) Performance: The Effect of Tag Orientation and Package Contents. Packag. Technol. Sci. 2006, 19, 45–54. [Google Scholar] [CrossRef]
  53. Bouazza, H.; Lazaro, A.; Bouya, M.; Hadjoudja, A. Parameters Affecting UHF RFID Tag Performances. In Proceedings of the 2019 IEEE International Conference on RFID Technology and Applications (IEEE RFID-Ta 2019), Pisa, Italy, 25–27 September 2019. [Google Scholar]
  54. Sharif, A.; Ouyang, J.; Raza, A.; Hussain, S.; Nasir, M.; Arshad, K.; Assaleh, K.; Ramzan, N.; Imran, M.A.; Abbasi, Q.H. UHF RFID Tag Design Using Theory of Characteristics Modes for Platform-Tolerant and Harsh Metallic Environments. IEEE J. Radio Freq. Identif. 2022, 6, 524–533. [Google Scholar] [CrossRef]
  55. Sohrab, A.P.; Huang, Y.; Hussein, M.; Kod, M.; Carter, P. A UHF RFID Tag With Improved Performance on Liquid Bottles. IEEE Antennas Wirel. Propag. 2016, 15, 1673–1676. [Google Scholar] [CrossRef]
  56. Bolton, J.; Jones, E.; Punugu, R.K.; Addy, A.; Okate, S. Performance and Benchmarking of Multisurface UHF RFID Tags for Readability and Reliability. J. Sens. 2017, 2017, 3467593. [Google Scholar] [CrossRef]
  57. Athauda, T.; Marin, J.C.L.; Lee, J.; Karmakar, N.C. Robust Low-Cost Passive UHF RFID Based Smart Shopping Trolley. IEEE J. Radio Freq. Identif. 2018, 2, 134–143. [Google Scholar] [CrossRef]
  58. Xu, W.; Song, Z.; Sun, Y.; Wang, Y.; Lai, L. Capture-Aware Dense Tag Identification Using RFID Systems in Vehicular Networks. Sensors 2023, 23, 6792. [Google Scholar] [CrossRef] [PubMed]
  59. Manzi, G.; Feliziani, M. Impact of UHF RFID IC Impedance on the RFID System Performances in Presence of Dielectric Materials. In Proceedings of the 2008 International Symposium on Electromagnetic Compatability—EMC Europe, Hamburg, Germany, 8–12 September 2008. [Google Scholar]
  60. Choi, S.H.; Yang, B.; Cheung, H.H. A mechanised 3D scanning method for item-level radio frequency identification of palletised products. Comput. Ind. 2015, 72, 36–46. [Google Scholar] [CrossRef]
Figure 1. (a) Image of Tag 1. (b) Image of Tag 2.
Electronics 14 00278 g001
Figure 2. Brady HH85 handheld scanner which was used for the scanning of UHF RFID tags.
Electronics 14 00278 g002
Figure 3. Representation of (A) the first level of packaging, a single tagged item; (B) secondary level of packaging, a group of tagged items in a case; and (C) tertiary level of packaging, a group of cases arranged on a pallet for shipment.
Electronics 14 00278 g003
Figure 4. Testing methodology structure and logical flow.
Electronics 14 00278 g004
Figure 5. Reader set up for distance testing on a single case for Phase 1.
Electronics 14 00278 g005
Figure 6. The 16-item configurations selected to assess optimal orientation at Phase 2. The numbers 1–4 represent the four case configurations selected for Phase 3 testing.
Electronics 14 00278 g006
Figure 7. Case configurations used for Phase 3. The numbers 1–4 represent the four case configurations selected from Phase 2 testing.
Electronics 14 00278 g007
Figure 8. Layer set up for read distance for one layer in Phase 3.
Electronics 14 00278 g008
Figure 9. Set up for reader heights and distances at Phase 4.
Electronics 14 00278 g009
Figure 10. (a) Schematic of rotating table testing. The arrows represent a pallet rotating on a table. (b) real-time setup.
Electronics 14 00278 g010
Figure 11. (a) A visual representation of the optimal reader position for Tag 1. (b) A visual representation of the optimal reader position for Tag 2.
Electronics 14 00278 g011
Table 1. (a) Percentage of Tag 1 readability (%) on four faces using two distances. (b) Percentage of Tag 2 readability (%) on four faces using two distances.
a
Reader DirectionTag 1 at 5.08 cm Tag 1 at 91.44 cm
Front92.3 ± 4.3 aB28.7 ± 6.1 bC
Back96.7 ± 2.1 aA22.2 ± 7.6 bD
Left91.0 ± 2.0 aB43.3 ± 7.3 bA
Right84.5 ± 7.6 aC34.2 ± 9.1 bB
b
Reader DirectionTag 2 at 5.08 cmTag 2 at 91.44 cm
Front100.0 ± 0.0 aA99.2 ± 1.9 bA
Back100.0 ± 0.0 aA68.3 ± 2.3 bC
Left100.0 ± 0.0 aA86.7 ± 1.9 bB
Right100.0 ± 0.0 aA70.0 ± 1.9 bC
Data are shown as mean value ± standard deviation (n = 5). Different letters (a, b) within rows indicate a significant difference (p < 0.05) in mean values between reader distance. Different capital letters (A–D) within columns indicate a significant difference (p < 0.05) in mean values between reader direction.
Table 2. Total tag readability (%) after five seconds using sixteen case configurations and four reader faces at a 5.08 cm distance and 23.495 cm height.
Case Config.Read OrientationTag 1Tag 2Case Config.Read OrientationTag 1Tag 2
LLLFront93.8 ± 6.6100.0 ± 0.0RRLFront96.7 ± 3.8100.0 ± 0.0
Back100.0 ± 0.0100.0 ± 0.0Back96.7 ± 3.8100.0 ± 0.0
LLLLeft87.9 ± 4.1100.0 ± 0.0RRRLeft87.1 ± 3.6100.0 ± 0.0
Right87.9 ± 8.4100.0 ± 0.0Right94.2 ± 2.2100.0 ± 0.0
RRRFront96.3 ± 4.1 100.0 ± 0.0LLRFront96.7 ± 3.8100.0 ± 0.0
Back96.3 ± 4.6 100.0 ± 0.0Back95.4 ± 5.0100.0 ± 0.0
RRRLeft89.6 ± 4.5 100.0 ± 0.0RRRLeft90.0 ± 4.0100.0 ± 0.0
Right93.3 ± 4.0 100.0 ± 0.0Right88.8 ± 2.8100.0 ± 0.0
LLLFront93.8 ± 6.6100.0 ± 0.0RRRFront96.3 ± 4.1100.0 ± 0.0
Back94.2 ± 6.3100.0 ± 0.0Back93.3 ± 4.5100.0 ± 0.0
RRRLeft87.9 ± 3.1100.0 ± 0.0RLRLeft95.4 ± 5.0100.0 ± 0.0
Right81.3 ± 4.5100.0 ± 0.0Right92.5 ± 5.5100.0 ± 0.0
RRRFront97.1 ± 4.0100.0 ± 0.0RRRFront93.8 ± 6.6100.0 ± 0.0
Back91.3 ± 9.5100.0 ± 0.0Back97.9 ± 2.2100.0 ± 0.0
LLLLeft93.8 ± 3.5 97.9 ± 0.5RRLLeft83.3 ± 9.0100.0 ± 0.0
Right90.0 ± 2.9100.0 ± 0.0Right92.9 ± 4.4100.0 ± 0.0
LLLFront92.9 ± 2.0100.0 ± 0.0RRRFront99.6 ± 1.3 100.0 ± 0.0
Back95.8 ± 4.4100.0 ± 0.0Back97.5 ± 2.2100.0 ± 0.0
RLRLeft85.0 ± 4.0100.0 ± 0.0LLRLeft88.3 ± 2.6100.0 ± 0.0
Right74.2 ± 9.8100.0 ± 0.0Right90.0 ± 4.0100.0 ± 0.0
LLLFront95.8 ± 4.4 100.0 ± 0.0RLRFront100.0 ± 0.0100.0 ± 0.0
Back97.9 ± 2.2100.0 ± 0.0Back92.9 ± 7.6100.0 ± 0.0
RRLLeft92.9 ± 4.4100.0 ± 0.0LLLLeft90.0 ± 5.6100.0 ± 0.0
Right80.4 ± 12.0100.0 ± 0.0Right87.5 ± 3.4100.0 ± 0.0
LLLFront91.3 ± 5.0100.0 ± 0.0RRLFront95.8 ± 4.4100.0 ± 0.0
Back92.1 ± 8.4100.0 ± 0.0Back95.8 ± 4.4100.0 ± 0.0
LLRLeft95.8 ± 0.0100.0 ± 0.0LLLLeft90.4 ± 2.0100.0 ± 0.0
Right77.1 ± 8.6100.0 ± 0.0Right87.9 ± 6.0100.0 ± 0.0
RLRFront95.4 ± 5.0100.0 ± 0.0LLRFront95.4 ± 3.6100.0 ± 0.0
Back90.4 ± 6.8 100.0 ± 0.0Back91.7 ± 8.8100.0 ± 0.0
RRRLeft91.3 ± 1.3100.0 ± 0.0LLLLeft90.4 ± 5.9100.0 ± 0.0
Right83.8 ± 2.4100.0 ± 0.0Right86.7 ± 2.6100.0 ± 0.0
Data are shown as mean value ± standard deviation (n = 2). Note: Case configuration represents the direction the tags were facing inside the case for each of the six packs of consumer products inside a case.
Table 3. (a) Total layer tag readability (%) after 30 s using two case configurations and two reader faces at a 5.08 cm distance and height aligning with the center of each layer. (b) Total layer tag readability (%) after 30 s using two inverse case configurations and two reader faces at a 5.08 cm distance and the height aligning with the center of each layer.
a
Layer 1Layer 2Layer 3Layer 4Layer 5
Case Config.Reader DirectionTag 1Tag 2Tag 1Tag 2Tag 1Tag 2Tag 1Tag 2Tag 1Tag 2
RRRFront92.4 ± 0.5 bA96.9 ± 0.9 aA85.8 ± 0.9 bA92.5 ± 0.6 aA80.4 ± 0.6 aA79.1 ± 1.3 aA72.2 ± 0.6 aA71.3 ± 0.9 bA62.3 ± 0.8 bA72.3 ± 0.9 aA
RRRBack92.6 ± 0.5 bA96.7 ± 1.1 aA84.1 ± 0.8 bB92.0 ± 1.2 aA80.1 ± 0.9 aA79.4 ± 1.0 aA73.0 ± 1.0 aA70.9 ± 1.9 bA61.2 ± 3.8 bA74.3 ± 0.9 aA
LLLFront92.7 ± 0.6 bA96.0 ± 0.7 aA86.3 ± 0.7 bA91.9 ± 0.4 aA81.4 ± 0.7 aA79.3 ± 0.5 aA72.2 ± 1.0 aA70.6 ± 2.0 bA61.6 ± 2.0 bA74.1 ± 0.8 aA
LLLBack92.4 ± 0.6 bA95.1 ± 0.7 aA84.6 ± 1.2 bB91.5 ± 0.7 aA79.1 ± 1.9 aA78.1 ± 1.3 aA71.7 ± 1.6 aA71.0 ± 1.6 bA60.0 ± 2.6 bA71.9 ± 1.1 aA
b
Layer 1Layer 2Layer 3Layer 4Layer 5
Case Config.Reader DirectionTag 1Tag 2Tag 1Tag 2Tag 1Tag 2Tag 1Tag 2Tag 1Tag 2
LLLFront89.8 ± 0.4 bA96.7 ± 0.6 aA86.5 ± 2.2 bA91.4 ± 0.6 aA79.9 ± 0.5 aA78.8 ± 0.3 aA72.0 ± 1.2 aA72.2 ± 0.7 aA61.4 ± 0.8 bA69.1 ± 1.3 aA
RRRBack92.6 ± 0.5 bA96.0 ± 0.5 aA83.9 ± 0.9 bB91.6 ± 0.5 aA76.4 ± 0.6 aA78.9 ± 0.5 aA71.4 ± 0.7 aA72.0 ± 2.1 aA59.2 ± 0.6 bA69.7 ± 0.7 aA
RRRFront93.5 ± 0.4 bA95.6 ± 1.3 aA86.4 ± 0.4 bA91.2 ± 0.5 aA77.0 ± 0.7 aA78.2 ± 0.7 aA71.6 ± 2.5 aA71.4 ± 0.7 aA63.2 ± 0.7 bA70.0 ± 1.3 aA
LLLBack92.6 ± 0.2 bA95.4 ± 1.5 aA84.7 ± 1.1 bB91.2 ± 0.6 aA76.7 ± 0.8 aA78.4 ± 0.6 aA72.4 ± 1.3 aA72.6 ± 1.3 aA61.1 ± 2.4 bA69.2 ± 1.2 aA
Data are shown as mean value ± standard deviation (n = 2). Different letters (a, b) within rows indicate a significant difference (p < 0.05) in mean values between tags. Different capital letters (A, B) with a column indicate significant differences (p < 0.05) in mean values between reader direction. Note: Case configuration represents the direction the tag was facing for each of the six packs of consumer products inside a case.
Table 4. The effect of reader distance and height on total tag readability (%) in a full five-layer pallet after 60 s, using one case configuration and one reader face.
Reader Height (cm)46.35557.7868.5880.01102.87
Reader Distance (cm)Tag 1Tag 2Tag 1Tag 2Tag 1Tag 2Tag 1Tag 2Tag 1Tag 2
5.0858.2 ± 0.2 b71.3 ± 0.9 a64.0 ± 0.5 b69.1 ± 0.6 a61.6 ± 0.3 b70.1 ± 0.9 a61.8 ± 0.4 b72.9 ± 0.5 a57.5 ± 0.2 b58.7 ± 0.8 a
7.6259.2 ± 0.5 b67.9 ± 0.7 a64.5 ± 0.3 a64.0 ± 0.9 a63.6 ± 0.2 a64.4 ± 1.0 a62.4 ± 0.5 b68.8 ± 0.5 a59.4 ± 0.4 a54.6 ± 0.4 b
10.1659.9 ± 0.8 b67.7 ± 0.5 a64.5 ± 0.2 b65.1 ± 0.5 a64.0 ± 0.3 a64.5 ± 0.5 a62.7 ± 0.5 b69.9 ± 0.5 a59.1 ± 0.3 a57.5 ± 0.9 b
12.759.7 ± 0.5 b68.6 ± 0.4 a64.1 ± 1.2 b67.8 ± 0.6 a64.2 ± 0.4 b69.0 ± 0.4 a62.5 ± 0.1 b69.9 ± 0.8 a57.7 ± 0.7 b61.8 ± 0.6 a
15.2456.6 ± 0.6 b72.3 ± 0.2 a62.6 ± 0.4 b71.9 ± 0.7 a63.7 ± 0.3 b75.1 ± 0.6 a63.8 ± 0.4 b73.7 ± 0.3 a56.3 ± 0.4 b67.0 ± 0.5 a
20.3254.5 ± 0.3 b77.8 ± 0.7 a61.4 ± 0.8 b73.3 ± 0.7 a61.3 ± 0.6 b76.0 ± 0.5 a64.4 ± 0.4 b79.7 ± 0.9 a59.8 ± 0.5 b71.3 ± 0.9 a
30.48N/A72.8 ± 0.9N/A69.6 ± 1.0N/A76.3 ± 0.9N/A78.2 ± 0.3N/A70.5 ± 0.7
45.72N/A68.2 ± 0.4N/A67.5 ± 0.5N/A69.9 ± 1.2N/A78.4 ± 0.9N/A69.2 ± 1.0
91.44N/A57.4 ± 0.8N/A61.6 ± 1.2N/A59.7 ± 0.9N/A66.5 ± 0.7N/A61.1 ± 0.8
n = 2. Data represents mean ± standard deviation. Different letters (a, b) in each row indicate the statistical differences (p < 0.05) in mean values between Tag 1 and Tag 2 at each reader height. Note: Case configuration represents the direction the tag was facing for each of the six packs of consumer products inside a case. N/A represents distances not assessed for Tag 1.
Table 5. The effect of reader distance, height, and rotating table on total tag readability (%) in a full five-layer pallet after 60 s using one case configuration.
Reader Height (cm)46.35557.7868.58
Reader Distance (cm)Tag 1Tag 2Tag 1Tag 2Tag 1Tag 2
15.2492.4 ± 0.392.8 ± 0.693.6 ± 0.595.3 ± 0.789.2 ± 0.395.4 ± 0.3
20.32N/A92.6 ± 0.5N/A95.3 ± 0.4N/A95.4 ± 0.7
30.4888.6 ± 0.892.5 ± 0.993.3 ± 0.795.1 ± 0.487.4 ± 0.496.8 ± 0.3
45.7285.4 ± 0.594.0 ± 0.687.1 ± 0.995.3 ± 0.383.5 ± 0.297.8 ± 0.4
91.4479.3 ± 0.787.7 ± 0.577.0 ± 0.790.1 ± 0.367.7 ± 0.589.9 ± 0.9
n = 2. Data represents mean ± standard deviation. Note: N/A represents a distance not assessed for Tag 1.
Table 6. (a) Comparison of the non-rotating table tag readability (%) of a full five-layer pallet using one case configuration from three reader heights over 180 s (60 s per height). (b) Comparison of the rotating table tag readability (%) of a full five-layer pallet using one case configuration from three reader heights over 180 s (60 s per height).
a
Non-Rotating (Static) Pallet
Reader Height (cm)Tag 1Tag 2
46.35565.4 ± 0.3 bC67.4 ± 0.7 aC
57.7880.7 ± 0.8 bB86.1 ± 1.2 aB
60.32586.9 ± 0.8 bA92.7 ± 0.7 aA
b
Rotating Pallet
Reader Height (cm)Tag 1Tag 2
46.35590.1 ± 0.8 aC90.6 ± 0.3 aC
57.7895.4 ± 0.5 bB96.8 ± 0.4 aB
60.32597.7 ± 0.2 bA99.7 ± 0.1 aA
n = 2. Data represents mean ± standard deviation. Different letters (a, b) in each row indicate the statistical differences (p < 0.05) between means within Tag 1 and Tag 2. Different capital letters (A–C) in each column indicate the statistical differences (p < 0.05) between means within reader heights.
Disclaimer/Publisher’s Note: The statements, opinions and data contained in all publications are solely those of the individual author(s) and contributor(s) and not of MDPI and/or the editor(s). MDPI and/or the editor(s) disclaim responsibility for any injury to people or property resulting from any ideas, methods, instructions or products referred to in the content.

