Abstract
Neonatal mortality remains a critical global challenge, particularly in resource-limited settings with restricted access to advanced diagnostic tools. Early detection of life-threatening conditions like Sepsis and Respiratory Distress Syndrome (RDS), which significantly contribute to neonatal deaths, is crucial for timely interventions and improved survival rates. This study investigates the use of newborn cry sounds, specifically the expiratory segments (the most informative parts of cry signals) as non-invasive biomarkers for early disease diagnosis. We utilized an expanded and balanced cry dataset, applying Self-Supervised Learning (SSL) models—wav2vec 2.0, WavLM, and HuBERT—to extract feature representations directly from raw cry audio signals. This eliminates the need for manual feature extraction while effectively capturing complex patterns associated with sepsis and RDS. A classifier consisting of a single fully connected layer was placed on top of the SSL models to classify newborns into Healthy, Sepsis, or RDS groups. We fine-tuned the SSL models and classifiers by optimizing hyperparameters using two learning rate strategies: linear and annealing. Results demonstrate that the annealing strategy consistently outperformed the linear strategy, with wav2vec 2.0 achieving the highest accuracy of approximately 90% (89.76%). These findings highlight the potential of integrating this method into Newborn Cry Diagnosis Systems (NCDSs). Such systems could assist medical staff in identifying critically ill newborns, prioritizing care, and improving neonatal outcomes through timely interventions.
1. Introduction
In 2023, the global under-five child mortality rate was about 38 deaths per 1000 live births, with neonatal mortality (deaths within the first 28 days) estimated at 17 per 1000 [1]. In 2022, neonatal deaths reached approximately 2.3 million worldwide, averaging 6300 deaths daily, with most occurring in low-income countries due to limited access to healthcare [2]. Early diagnosis of life-threatening conditions like sepsis and RDS in newborns is particularly critical, as infants under two months old are among the most vulnerable. Without timely intervention, sepsis can rapidly escalate to septic shock and multi-organ failure, while untreated RDS can lead to severe respiratory failure. Current diagnostics often require resources unavailable in low-income regions, contributing to high mortality rates. Sepsis is implicated in approximately to of neonatal deaths [3], and RDS mortality can exceed when critical interventions are delayed [4]. Between 2016 and 2020, RDS was a leading cause of postpartum deaths in Canada, resulting in the loss of nearly 100 newborn lives during that period [5]. Reducing neonatal mortality is a critical global health priority, necessitating diagnostic tools that are both accessible and capable of early, accurate detection, especially in low-resource settings.
As early as the 20th century, researchers observed that the cries of neonates diagnosed with certain pathologies differed significantly from those of healthy infants [6]. Recent advances suggest that NCDSs, which analyze acoustic patterns in infant cries as non-invasive biomarkers, could enable early health issue detection. By prioritizing attention for at-risk infants, NCDSs act as early warning tools. While not a substitute for medical treatment, they facilitate timely interventions and potentially save lives.
This study aims to develop an accessible and accurate NCDS for the early detection of life-threatening neonatal conditions, specifically sepsis and RDS. To achieve this, we utilize a private dataset of infant cry audio, expanding the sample size by approximately 2.5 times and ensuring equal numbers of babies per class (RDS, Healthy, and Sepsis) to enhance robustness and representativeness. In comparison to previous works, in our group, pre-emphasis filtering was applied to highlight vocal tract features, followed by the segmentation of expiratory cry parts using manual annotations to isolate relevant segments for analysis. This study leverages SSL models to capture intricate cry patterns directly from raw audio, eliminating the need for manual feature engineering. A classifier placed on top of these SSL models enables the distinction between RDS, Sepsis, and Healthy conditions. This approach provides a precise representation of underlying health issues and lays a strong foundation for developing advanced NCDSs capable of distinguishing pathological cries.
The structure of this paper is organized as follows: Section 2 reviews the relevant literature to contextualize our study. Section 3 describes the Materials and Methods, including an overview of the dataset, self-supervised learning models used, fine-tuning self-supervised learning models, hyperparameter optimization of fine-tuning models, experimental details, and evaluation criteria. Section 4 presents the Experimental Results, focusing on the performance of models fine-tuned with annealing and linear learning rates. Finally, Section 5 discusses the results and concludes the paper.
2. Literature Review
Machine learning algorithms have demonstrated remarkable effectiveness in recognizing and classifying infant cries, achieving accuracy rates as high as , compared to around for professional human listeners in distinguishing cries of hunger, pain, and discomfort [7]. Although recognizing cries related to basic needs has shown promising results, classifying diseases remains challenging due to the complex acoustic patterns in pathological cries. However, binary classification, distinguishing between a single disease and healthy cries or between unhealthy and healthy cries, has achieved better outcomes than multiclass disease classification. Building on these advancements, researchers have pursued three main approaches in cry-based disease classification: first, distinguishing healthy from unhealthy cries; second, identifying specific diseases like sepsis or respiratory distress syndrome from healthy cries; and third, expanding to multiclass classification to differentiate multiple diseases within a single framework.
First, distinguishing healthy from unhealthy cries, several studies were conducted in our lab, all utilizing the same private dataset but with different numbers of samples and pathological groups. In [8], support vector machines (SVMs) were trained on auditory-inspired amplitude modulation (AAM) and mel-frequency cepstral coefficients (MFCCs) extracted from expiration segments (EXPs). Similarly, ref. [9] combined gammatone frequency cepstral coefficients (GFCCs) and MFCCs, enhanced with the Canonical Correlation Discriminant Features (CCDFs) algorithm, as inputs to a long short-term memory (LSTM) classifier. In addition to our group’s efforts, other works have also contributed to this area. In [10], Constant Q Cepstral Coefficients (CQCCs), along with Short-Time Fourier Transform (STFT), MFCCs, and Linear Frequency Cepstral Coefficients (LFCCs), were extracted from the Baby Chillanto database, achieving the best results using Gaussian Mixture Models (GMMs). Ref. [11] utilized Linear Predictive Cepstral Coefficients (LPCCs) from the same database to classify healthy and unhealthy cries, including deaf and asphyxia cries, using a probabilistic neural network (PNN). In [12], data augmentation was applied to the iCOPE dataset, and features such as MFCCs, Constant-Q Chromogram (CQC), and spectrogram-based texture features were extracted. SVM classifiers were combined with other classifiers for improved accuracy.
Second, three studies by our former colleagues focused on distinguishing specific diseases from healthy cries. In [13], MFCCs served as short-term features, while Tilt and Rhythm captured F0 variations and long-term patterns for each EXP and INSV episode. The best SVM performance, with a linear kernel, was achieved by combining MFCCs, Tilt, and Rhythm to distinguish healthy cries from RDS. Two methods were proposed to distinguish between sepsis and healthy cries. In [14], MFCCs and prosodic features (intensity, rhythm, and tilt) were extracted from expiration and inspiration units. Individual and combined feature sets were tested with various classifiers and majority voting. The highest F-score for expiration was achieved with an SVM using all features, while the best result for inspiration data was achieved by combining tilt with a quadratic discriminant classifier. Similarly, in [15], MFCCs, spectral entropy cepstral coefficients (SENCCs), and spectral centroid cepstral coefficients (SCCCs) were extracted. Fuzzy entropy, with a fuzzy c-means clustering algorithm, was applied for feature selection, followed by optimized k-nearest neighbor (KNN) and SVM algorithms. The best performance was achieved by combining MFCC and SENCC features from the expiration dataset using an SVM.
Furthermore, various methods have been developed to distinguish between asphyxia and healthy cries. In [16], MFCCs were used as input to a CNN to classify healthy and asphyxiated cries. Similarly, ref. [17] extracted MFCC, Chromogram, Spectral Contrast, and Tonnetz features for deep learning classifiers. CNNs performed best with MFCCs, while deep neural networks (DNNs) showed superior results with the combined feature set. In [18], a pre-trained CNN (AlexNet) used waveform images from the Baby Chillanto Database to classify asphyxia and normal cries. Ref. [19] converted cry signals into waveform images and used them as inputs for ImageNet and Google Net, with Google Net outperforming ImageNet. In [20], Weighted Prosodic Features, including the energy of the sound, pitch, intensity, F0, and formants, were extracted. These attributes were trained on a DNN, where the output layer consisted of two neurons recognizing healthy or asphyxiated cries. Moreover, MFCCs and weighted prosodic attributes were combined to create a mixed matrix feature, which was then fed into another DNN to identify cry signals. In [21], four acoustic features—wavelet decomposition coefficients, MFCCs, wavelet-based mel-frequency cepstral coefficients (DWT-MFCCs), and LPCCs—were extracted to classify babies with Autism Spectrum Disorder (ASD) and healthy babies using SVM and CNN classifiers. SVM performed best with DWT-MFCCs, offering high identification rates and strong noise resistance, while CNNs achieved higher identification rates with MFCCs, though DWT-MFCCs remained superior in noise resistance. In [22], time-frequency features from STFT spectrograms were used to differentiate healthy and deaf cries. These features were used to train a General Regression Neural Network (GRNN), MLP, and Time Delay Neural Network (TDNN), with GRNN showing the best classification performance. In [23], a private dataset was used to manually extract cry segments, removing inhalation sounds, irrelevant data, and noise. Various features, including mel-frequency cepstrum, MFCCs, dynamic MFCC features, gammatone cepstral coefficients, and spectral features, were extracted. A sequential feature selection method was applied to diagnose hypoxic–ischemic encephalopathy (HIE) by iteratively optimizing the feature set for maximum classification accuracy. The study utilized a deep network with a bidirectional LSTM layer, a fully connected layer, and a SoftMax layer for cry classification. In [24], 22 features—including length, estimated F0, and various F-statistics—were extracted to distinguish between pre-term and full-term cries. A Genetic Algorithm was used to identify key attributes, and classifiers were tested on feature sets of different sizes. The best results were achieved with a Random Forest (RF) using a 10-feature subset, which included eight selected features, the median of F0, and the mean of F3.
Third, multiclass disease classification has been explored: ref. [25] trained a CNN, a multiclass SVM, and a pre-trained ResNet50 using spectrograms from their training dataset, which included deaf, asphyxia, normal, hunger, and pain cries. SVM and ResNet50 demonstrated better accuracy. To improve accuracy, an ensemble learning method was devised, integrating the predictions of both models. In [26], 16 MFCC coefficients were extracted from each 50-millisecond frame in a self-recorded infant cry database. Principal Component Analysis (PCA) was applied to reduce dimensionality, and the processed vectors were used in a neuro-fuzzy system to classify deafness, asphyxia, and normal cries. In [27], cry samples from the Baby Chillanto and Malaysian infant cry datasets were combined to extract a feature set of 568 attributes, including wavelet packet transform energies, non-linear entropies, LPCC-based cepstral features, and MFCCs. The Improved Binary Dragonfly Optimization algorithm was used to reduce the feature set to 204 attributes, which were then used to train an Extreme Learning Machine (ELM) kernel classifier to classify cries as deafness, asphyxia, or normal. In [28], a multi-stage CNN was used with a combined feature set and prior knowledge to classify infant sounds. “Oah: sleepy” and “Neh: hungry” were distinguished in the first step and excluded from the waveform CNN. Next, the waveform CNN classified “Heh: discomfort”, “Eh: burping”, and “Eairh: belly pain” using waveform images. In the final step, only “Eh” and “Eairh” were classified using prosodic features, as “Heh” had already been accurately classified. In [29], spectrogram features were extracted using a pre-trained CNN on ImageNet and combined with prosodic features such as HR and GFCCs to classify RDS, Sepsis, and Healthy cries. These fused features were then input into RF, SVM, and DNN models, with the deep learning model achieving the highest accuracy using the combination of spectrogram, HR, and GFCC features. In [29], spectrogram features were extracted using a pre-trained CNN on the ImageNet and combined with prosodic features such as HR and GFCCs to classify RDS, Sepsis, and Healthy. These fused features were then input into RF, SVM, and DNN, with the deep learning model achieving the highest accuracy using the combination of spectrogram, HR, and GFCC features. Similarly, ref. [30] used the dataset from [29] to classify RDS, Sepsis, and Healthy cries by converting EXP samples into spectrograms. Transformer models were then used to process these visual representations, leveraging the attention mechanism to focus on key features in the spectrograms.
The literature reveals three significant gaps: a notable lack of studies exploring multiclass classification for pathological cry signals, particularly for diseases with high mortality rates. While some multiclass classification studies do exist [29,30], they often rely on small subsets of data, which provide promising insights but still require larger, more comprehensive datasets to improve generalization and effectiveness. Additionally, the absence of audio feature sets capable of capturing the intricate patterns and properties of various diseases further limits multiclass classification. This limitation leads many methods to rely on manually engineered features, focusing on binary scenarios or applying feature fusion techniques in multiclass tasks. Lastly, research tends to focus on a narrow range of pathological conditions, overlooking the broader diversity of diseases that could be detected through infant cries in both full-term and pre-term infants, thereby limiting the diagnostic potential.
This paper presents one development and one key contribution. The development is twofold: (1) we have expanded the cry audio samples by approximately 2.5 times, representing a significant increase compared to earlier works in our lab [8,9,13,14,15,29,30], thereby strengthening the robustness of our findings, and (2) we have addressed the issue of biased data in prior studies. Although previous research in our lab used equal samples for each class, the distribution of newborns across classes was uneven. For the first time, we have included cry signals from 17 newborns in each class—RDS, Healthy, and Sepsis—ensuring a more balanced and unbiased dataset.
The key contribution introduces robust deep audio feature sets that capture intricate details of newborns’ cry signals, extracted directly from raw audio without explicit manual feature extraction. This approach is inspired by advancements in speech processing, particularly through self-supervised learning, where models are trained on unlabeled data to learn general features applicable to various tasks and then fine-tuned on smaller labeled datasets. Initially developed in computer vision for tasks like relative positioning and colorization, these techniques have since been adapted for audio and speech processing. By applying similar methods, our work provides a more precise representation of underlying health conditions and serves as a necessary step toward developing a multiclass NCDS system capable of distinguishing between various pathological cry signals.
3. Materials and Methods
The methodology involves using raw waveforms as input features for the NCDS, employing self-supervised learning models as feature extractors, and utilizing a fully connected layer as the classifier. Figure 1 illustrates the corresponding diagram.
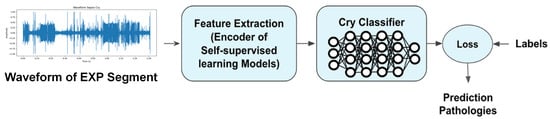
Figure 1.
Methodology for Newborn Cry Diagnosis System: leveraging raw waveforms, self-supervised learning models for feature extraction, and an MLP for classification.
3.1. Dataset Overview
In this section, we detail the process of collecting the newborns’ cry audio signals (CASs), outline the dataset’s characteristics, explain the pre-processing steps, and provide information about the participants in our experiments.
3.1.1. Data Collection Procedure
The study utilized data collaboratively established with Al-Raee and Al-Sahel hospitals in Lebanon, as well as Saint Justine Hospital in Montreal, Canada. In line with the granted ethical approval, informed consent was obtained from each newborn’s guardian prior to recording, including details on the study’s aims, the nature of the cry recordings, and their intended use. CASs were captured using a 2-channel WS-650M Olympus digital voice recorder at a sampling frequency of 44.1 kHz and 16-bit resolution. Recording took place directly in authentic clinical environments—including maternity rooms and Neonatal Intensive Care Units (NICUs)—without imposing strict procedural controls. As a result, these recordings inherently included ambient hospital noises such as staff conversations, medical equipment alarms, and cries from other infants. Rather than excluding these acoustic elements, we preserved them to maintain the ecological validity of the dataset, ensuring it accurately reflects the complexity and variability of real-world neonatal care settings. This approach is intended to train a model robust enough to handle unpredictable and noisy conditions often found in practical scenarios. The recorder was positioned within a range of 10 to 30 cm from the newborn’s mouth during data acquisition. The health condition of the newborns was assessed through post-birth screenings, and their cries were categorized as healthy or linked to specific pathologies based on medical reports.
Although this study did not explicitly estimate or compensate for room impulse responses (RIRs) due to practical constraints and the historical nature of the dataset, we acknowledge that such characterization could improve acoustic modeling [31]. Future work may involve techniques to approximate or incorporate RIRs to mitigate reverberation effects, thereby enhancing the model’s robustness to diverse clinical recording environments.
3.1.2. Data Attributes
- The clinical personnel from the hospitals gathered the CASs from a total of 769 newborns.
- The dataset included 96 different types of diseases. Some pathologies were represented by only one infant, but several CASs were recorded for that individual.
- Cry recordings varied in duration, ranging from 1 to 4 min, with an average length of 90 s. Each newborn contributed up to five recordings.
- The dataset comprises infants aged between one day and 208 days.
- The newborn cries in the dataset were elicited by various stimuli, such as hunger, discomfort, diaper changes, blood tests, showers, and the birthing process. The term “reason for crying” refers specifically to the immediate triggers that initiate crying episodes in newborns and is unrelated to their underlying health conditions.
- The dataset encompasses CASs with attributes such as the reason for crying, gestational age, birth weight, Apgar1 score, gender, hospital name, disease type, infants’ age during recording, and prematurity status.
- The dataset includes newborns from diverse races, origins, and genders, representing ethnic groups such as half-Caucasian and half-Haitian, African, Arabic, Caucasian, Latino, Native Hawaiian, and Québécois.
- The inclusion of newborns from various linguistic backgrounds is crucial, as unborn infants begin learning prosodic features during the last three months of pregnancy, which influences the prosodic aspects of CAS production.
3.1.3. Data Pre-Processing
Convert Stereo Channel to Mono Channel
Due to the use of a 2-channel recorder during data collection, the channels must first be averaged to obtain a single-channel signal. This was achieved by applying a mean function across both channels.
Pre-Emphasization
We adopted a first-order high-pass FIR filter to pre-emphasize the signal. This step compensates for the spectral effect of the glottal source by introducing a zero near [32]. Thus, we applied the filter specified in Equation (1) [33,34] before extracting the features or characteristics related solely to the vocal tract.
Segmentation
A CAS consists of a series of expirations and inspirations, during which behaviors like grunting and fussing may occur, along with background noises that are irrelevant for processing. Moreover, the number of available CASs is insufficient for classification purposes. To address these issues, our previous colleagues manually annotated each part of the CASs through a perceptual process. They used WaveSurfer, which provides options for visualizing the waveform and spectrogram and manual labeling. Table A1 outlines the assigned labels and their descriptions. Building on this work, we segmented each selected CAS based on its corresponding manual annotation text file, categorizing various segments as outlined in Table A1. These segments were treated as individual cry samples for further analysis. In this study, we specifically focus on the expiratory segments of CASs, as they represent the most informative portions of cries compared to other segments.
3.1.4. Data Utilization
After converting CASs to mono channel and applying FIR filters, three pathological groups were selected: RDS, Sepsis, and Healthy, based on the criteria outlined below:
- The age range of the newborns was limited to 1 to 53 days. This restriction is because infants within this age range generally cannot voluntarily control their cries [35]. Additionally, the average fundamental frequency of their cries does not show any significant increasing or decreasing trend during this time [36].
- Only full-term newborns were included in the study, as pre-term newborns were excluded due to their distinct acoustic features compared to full-term babies [37]. As a result, all subjects had a gestational age of at least 37.2 weeks.
There were a total of 53 recordings from 17 newborns with Sepsis, 102 recordings from 33 newborns with RDS, and 782 recordings from 303 newborns in the Healthy group. To ensure a balanced number of newborns in each category, we chose 17 newborns of both genders from each class for segmentation. Table 1 provides an overview of the selected CASs, the participants involved, the number of EXP segments, and their duration range.

Table 1.
Overview of the dataset and the participants involved.
To ensure robustness and consistency, cry samples shorter than 40 ms were systematically excluded during pre-processing. In our dataset, fewer than five samples fell below this threshold, making the impact of this exclusion minimal. This threshold aligns with the model’s frame rate of 50 frames per second (20 ms per frame), ensuring that all inputs retain sufficient information for effective learning. Further details are provided in the fine-tuning self-supervised learning models section. We randomly selected 2799 EXP samples from each pathology group for balanced representation.
This sample count represents a 2.5-fold increase in sample size compared to previous works [8,9,13,14,15,29,30], offering a wider range of infant cries that capture more diverse acoustic characteristics, noise levels, and clinical contexts. Such variety reduces the risk of overfitting and encourages the model to learn robust, generalizable representations, ultimately making it more adaptable to novel, real-world inputs. In addition, by including equal numbers of newborns per class (RDS, Healthy, and Sepsis), the dataset not only becomes larger but also more balanced. This balanced composition reduces class bias, prompting the model to learn features that are broadly applicable rather than relying on patterns from a dominant category. Consequently, the model is better equipped to handle diverse clinical presentations, ultimately improving its generalization and ensuring more consistent, reliable performance in real-world neonatal care scenarios. Finally, samples were selected entirely at random, with no predetermined criteria, to create training, validation, and testing datasets in a 70%, 15%, and 15% split, ensuring the proposed NCDS remains unbiased regarding race, reason for crying, origin, age, and gender (Table 2).
Table 2.
Number of samples used for training, testing, and validation stages.
3.2. Self-Supervised Learning Models
In machine learning, self-supervised learning has emerged as a powerful technique for deriving general data representations from unlabeled samples, which can subsequently be fine-tuned using labeled data [38]. One effective approach for learning general audio features from unlabeled data involves extracting labels directly from the signal itself, which is precisely what is carried out in the context of self-supervised learning. This method entails applying known transformations to the input data and using the resulting outcomes as labels to establish a meaningful objective function. Self-supervised learning models typically include the components shown in Figure 2. The Transformer-based encoder is a neural network that converts raw signals into abstract, high-level features. Label extraction involves defining a pretext task and generating labels directly from the input signal. The pretext model is specifically designed to tackle this pretext task, enabling the network to learn meaningful representations from the data. The loss function quantifies the discrepancy between the pretext model’s predictions and the extracted labels, guiding the training process of both the encoder and the pretext model to minimize this error, similar to supervised learning.
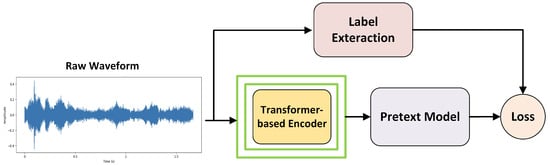
Figure 2.
Self-supervised learning.
After training the model using self-supervised learning, a classifier is added on top of the encoder. Both the encoder and the classifier are then fine-tuned with a small supervised dataset to adapt the model for a specific downstream task.
wav2vec 2.0, HuBERT, and WavLM are advanced architectures designed to extract robust and versatile features from diverse audio data. Leveraging Transformer-based encoders and distinct pretext tasks, these models have demonstrated exceptional performance in learning meaningful audio representations. In this study, they are employed to classify neonatal cries into Healthy, Sepsis, and RDS categories. The following sections outline their core features and methodologies.
3.2.1. wav2vec 2.0
In [38], the wav2vec 2.0 model aims to enhance the quality and efficiency of learning representations from raw audio waveforms for various speech-related tasks, such as speech recognition, speaker identification, and emotion recognition. wav2vec 2.0 is composed of two key components: a convolutional feature encoder, which converts raw audio into latent representations (Z), and a Transformer-based context network, which processes these representations into higher-level context vectors (C). The Z vectors capture local information, while the C vectors represent the global context.
For the pretext task, the authors randomly masked certain time steps in the latent representation Z, tasking the Transformer with predicting the corresponding context vector C for the masked steps. Instead of directly reconstructing the missing C values, the model employed contrastive learning. Specifically, the model had to identify the correct masked Z from a set of candidates, consisting of the true Z and K distractors sampled from the same sequence. However, the model was not trained to identify the actual Z but rather a quantized version of it, referred to as q, which the authors found to be more effective than using the continuous Z. Quantized, discrete representations were observed to better capture categorical information, such as phonemes, speaker identities, and languages. Additionally, these discrete representations were more robust to noise, as small changes in the input were less likely to alter the output [38].
For the pre-training phase of the wav2vec 2.0 models, the authors used unlabeled data from the LibriSpeech corpus—specifically, 960 h of audio (LS-960) for the wav2vec 2.0 Base model—and from LibriVox, which provided around 60,000 h of audio (LV-60k) to train the wav2vec 2.0 Large model. After pre-processing the LibriVox data, they ended up with 53,200 h of audio for pre-training the Large model. The feature encoder in wav2vec 2.0 consists of seven blocks, each with 512-channel temporal convolutions and specific strides and kernel widths. This configuration results in an output frequency of approximately 50 Hz and a receptive field covering 20 ms of audio. For modeling relative positional embeddings, the convolutional layer employs a kernel size of 128 and 16 groups.
Two model configurations were tested, both using the same encoder but differing in their Transformer setups:
- BASE: 12 Transformer blocks, model dimension of 768, inner dimension of 3072, and 8 attention heads, resulting in approximately 95 million parameters.
- LARGE: 24 Transformer blocks, model dimension of 1024, inner dimension of 4096, and 16 attention heads, resulting in approximately 317 million parameters [38].
3.2.2. HuBERT
Hidden-Unit BERT (HuBERT), as a self-supervised speech representation learning model, is an alternative to wav2vec 2.0. It also employs a CNN encoder and a masked Transformer architecture, which learns by predicting masked portions of the input data [39].
The pretext task in HuBERT introduces a unique approach by first applying a k-means clustering algorithm to MFCC features extracted from raw audio. This clustering produces noisy labels, treated as pseudo-acoustic units that the model learns to predict. After the initial training, clustering is re-applied—this time on the learned features instead of the original MFCCs—to refine the pseudo-labels and improve the model’s learning. This iterative refinement enables HuBERT to capture more meaningful speech representations from unlabeled data, enhancing its effectiveness for a variety of downstream speech processing tasks. A crucial aspect of HuBERT is applying the prediction loss only over masked regions, compelling the model to learn both acoustic and language representations from continuous speech inputs.
For the pre-training phase, HuBERT’s BASE model is trained on 960 h of LibriSpeech data, while the LARGE and X-LARGE models are trained on 60,000 h of Libri-Light data. The X-LARGE configuration is not mentioned in the original paper but is included in the repository (facebook/hubert). The HuBERT model comes in three configurations: BASE, LARGE, and X-LARGE. Each model uses a CNN encoder. The Transformer component varies across the models, with the BASE model having 12 layers, an embedding dimension of 768, and 8 attention heads. The LARGE model includes 24 layers, an embedding dimension of 1024, and 16 attention heads. The X-LARGE model features 48 layers, an embedding dimension of 1280, and 16 attention heads. The number of parameters increases from 95 million in the BASE model to 317 million in the LARGE model and 964 million in the X-LARGE model [39].
3.2.3. WavLM
WavLM is designed for full-stack speech processing tasks and is built on the HuBERT framework. It includes a Transformer-based architecture with a convolutional feature encoder and a Transformer encoder. As a pretext task, WavLM introduces a masked speech denoising and prediction framework during pre-training. This task involves masking parts of the input speech, simulating noisy or overlapped speech, and training the model to predict the original speech content in the masked regions. WavLM improves upon HuBERT and wav2vec 2.0 by incorporating masked speech denoising, expanding its capabilities beyond phoneme classification and Automatic Speech Recognition (ASR) to a wider range of speech tasks.
WavLM also enhances performance by utilizing more extensive pre-training data from diverse sources, referred to as “Mix 94k hr”. This includes Libri-Light, a large-scale dataset used in previous SSL models; VoxPopuli, a multilingual dataset with 24k h of English data derived from European Parliament event recordings; and GigaSpeech, a 10k h subset of well-processed audio from audiobooks, podcasts, and YouTube, covering both read and spontaneous speaking styles. The WavLM model features a convolutional encoder consisting of seven blocks of temporal convolution, followed by layer normalization and GELU activation, designed to effectively capture speech features. The Transformer component is enhanced with a gated relative position bias, which better captures the sequence ordering of input speech.
WavLM Base and WavLM Base+ share the same architecture, featuring 12 Transformer encoder layers, 768-dimensional hidden states, and 8 attention heads, resulting in 94.70 M parameters. WavLM Large, a larger model, includes 24 Transformer encoder layers, 1024-dimensional hidden states, and 12 attention heads, resulting in 316.62 M parameters. The WavLM Base model is pre-trained for 400,000 steps on 960 h of LibriSpeech audio, using pseudo-labels generated by clustering the 6th Transformer layer output of the 1st-iteration HuBERT Base model. In contrast, the WavLM Base+ and WavLM Large models are pre-trained on 94,000 h of Mix data, with Base+ trained for 1,000,000 steps and Large trained for 700,000 steps, using pseudo-labels generated by clustering the 9th Transformer layer output of the 2nd-iteration HuBERT Base model. Additionally, masked speech denoising is applied to 20% of the training utterances, with the mixing noise probability set to 0 for WavLM Base and 10% for both WavLM Base+ and WavLM Large. For a detailed comparison of the architectures of Wav2Vec 2.0, HuBERT, and WavLM Base Plus, refer to Table A2, which highlights their shared components and key differences.
3.3. Fine-Tuning Self-Supervised Learning Models
In this experiment, we employ Transformer-based encoders from pre-trained self-supervised models—specifically wav2vec2.0 Base (Model repository: facebook/wav2vec2-base) [38], HuBERT Base (Model repository: facebook/hubert-base-ls960) [39], and WavLM Base+ (Model repository: microsoft/wavlm-base-plus) [40]—each integrated with a classifier layer. Unlike traditional approaches in our group and the broader literature, which often rely on a two-step process involving manual feature extraction followed by classification, our method bypasses explicit feature extraction by directly utilizing raw audio signals as input to the SSL models. While most manually engineered features have demonstrated effectiveness in distinguishing individual diseases, they generally lack the flexibility to capture complex patterns across multiple conditions. In contrast, our approach leverages SSL models to autonomously learn representations suited for our three-class dataset—comprising RDS, Sepsis, and Healthy—and thereby capture intricate patterns across these pathological classes.
To adapt these models for classifying the three pathological groups, we fine-tune both the encoder and classifier using the EXP dataset, which consists of labeled segments specifically from the voiced expiration part of a cry cycle. This supervised fine-tuning process, illustrated in Figure 3, tailors the models to accurately distinguish between the classes, with further details on the fine-tuning procedure and implementation strategies provided in the following sections.
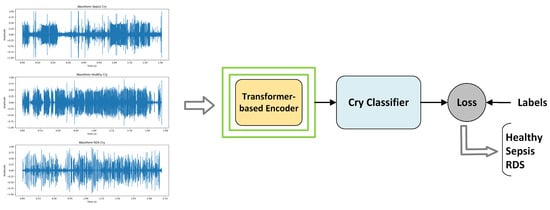
Figure 3.
Supervised fine-tuning: Transformer-based encoder for feature extraction and a cry classifier implemented as a single fully connected layer.
3.3.1. Downsampling EXPs
Since the models’ filters and learned representations are based on 16 kHz data, feeding them segments sampled at 44.1 kHz can result in a mismatch. This discrepancy may lead to suboptimal feature extraction and reduced model performance. So, the first step is to convert the sampling rate of the EXP segments to 16 kHz to ensure compatibility and maximize performance.
3.3.2. Fine-Tuning Transformer-Based Encoder
In the models, the raw audio waveform is heavily downsampled through multiple convolutional layers. For example, in wav2vec 2.0, a 4.5 s cry segment sampled at 16 kHz (72,000 samples) is first processed by a series of convolutional layers. The initial layer reduces the input by a factor of 5, transforming the single-channel audio signal into 512-dimensional feature vectors. Each of the subsequent six convolutional layers further downsamples the signal by a factor of 2, maintaining the 512-dimensional representation at each stage. This progressive downsampling results in an overall downsampling factor of 320, thereby reducing the 72,000 samples to 225 feature frames; we have a frame rate of 50 frames per second (20 ms per frame). Thus, the number of feature frames can be determined by considering both the downsampling factor and the duration of the signal. Each of these 225 frames is a 512-dimensional vector that encapsulates high-level audio features extracted from the raw signal. EXP segments shorter than 40 ms (less than two feature frame lengths) lack sufficient information after downsampling, making it difficult for the model to identify meaningful patterns. Although such segments were rare (fewer than five in the dataset), their exclusion ensures that the remaining inputs are sufficiently informative, enhancing the robustness and reliability of the classification process.
After convolutional downsampling, the output from the convolutional layers, consisting of a sequence of 512-dimensional vectors, is projected into a 768-dimensional space through a linear transformation. This projection is crucial for aligning the feature dimensions with the input requirements of the Transformer-based encoder. The encoder itself comprises 12 stacked Transformer layers, each meticulously designed to capture and model complex temporal dependencies and intricate patterns within the audio signal.
At the heart of each Transformer layer lies the multi-head self-attention mechanism. This component enables the model to weigh the significance of different frames relative to one another within the sequence. Specifically, the 768-dimensional input vectors are linearly projected into three distinct spaces to generate queries, keys, and values. Multiple attention heads operate in parallel, each focusing on different aspects of the input, thereby allowing the model to capture diverse relationships and interactions across the temporal sequence. The outputs from all attention heads are then concatenated and linearly transformed to maintain the original dimensionality.
Following the self-attention sub-layer, each Transformer layer incorporates a two-layer fully connected feed-forward network (FFN). The FFN introduces non-linearity and enhances the model’s capacity to learn complex feature transformations. The first linear layer expands the dimensionality from 768 to 3072 and applies the Gaussian Error Linear Unit (GELU) activation function to introduce non-linearity. The second linear layer projects the dimensionality back to 768, ensuring consistency across layers. Stacking 12 such Transformer layers enables the encoder to progressively refine the feature representations, capturing both local and global dependencies within the audio signal. Upon passing through all Transformer layers, the encoder produces a sequence of 768-dimensional vectors, each corresponding to a 20 ms frame of the input audio.
To transition from these frame-level representations to a comprehensive summary of the entire audio segment, a mean pooling layer is applied across the temporal dimension. This pooling operation averages all 768-dimensional vectors within each EXP segment, producing a single 768-dimensional vector that encapsulates the overall characteristics of the input segment, regardless of its duration. The aggregated vector is then passed through a one-layer fully connected classifier, consisting of a single linear layer, which maps the 768-dimensional input to three output logits corresponding to the pathological classes: Healthy, Sepsis, and RDS. A softmax activation function is applied to these logits to produce class probabilities, enabling the model to assign the input audio segment to the most probable pathological category.
We employed two strategies for fine-tuning the models. First, separate optimizers were used for the Transformer-based encoder and the linear classifier. To preserve the valuable pre-learned representations in the self-supervised encoder, a smaller learning rate was applied to the encoder, while a higher learning rate was assigned to the classifier to enable faster adaptation. Both optimizers utilized a learning rate annealing strategy, where the learning rate was reduced whenever the validation error increased or when performance improvements fell below a specific threshold. This dynamic adjustment ensured better generalization and prevented overfitting. Starting with an initial learning rate, the annealing factor, improvement threshold, and the ratio between the learning rates were carefully fine-tuned to optimize performance during training.
In the second strategy, a single optimizer trained both the Transformer-based encoder and the linear classifier as an integrated system, with the learning rate decreasing linearly from an initial value to a final value over a set number of epochs. The Adam optimizer was used in both strategies for fine-tuning, as it adjusts learning rates based on gradients, enabling faster convergence and more efficient optimization. To adapt the models for classifying three pathological classes in this project, the softmax function converts logits into probability distributions, and the model selects the class with the highest probability using argmax, without defining a decision threshold. The Negative Log Likelihood (NLL) Loss, as shown in Formula (2), is applied to penalize incorrect classifications by minimizing the logarithm of the predicted probability for the correct class, thereby helping the model improve its accuracy over time. Additionally, Weight decay, implemented via the PyTorch framework [41], prevents overfitting by discouraging large weights during optimization. Rather than adding a penalty term to the loss function, it directly adjusts the weight update rule, reducing each weight proportionally at every step. This technique fosters smaller, more stable weights, effectively balancing model complexity and regularization. As a result, it enhances the model’s performance, improving generalization and robustness, particularly when dealing with noisy or imbalanced datasets.
where N is the number of samples, and denotes the predicted probability for the true class of each sample i in the multiclass case (or in the binary case).
3.4. Hyperparameter Optimization of Fine-Tuning Models
Due to the significant GPU memory required by our models, which consist of seven CNN layers and 12 Transformer layers, we tested only small batch sizes in our experiments. Consequently, we applied a limited grid search algorithm and cross-validation in each experiment to determine the optimal hyperparameters. The names of the hyperparameters, their tested ranges, optimal values, and the best outcomes achieved are discussed in the Experimental Results section.
3.5. Experimental Details
The experiments were conducted using the computational power of the Narval server, provided by the Digital Research Alliance of Canada (the Alliance) at École de Technologie Supérieure [42]. The Narval server features advanced hardware, including Nvidia A100 GPUs and AMD Milan CPUs. For the experiments, each job utilized one GPU per node with 25 GB of memory allocated per GPU. The TorchAudio library [43] and the Librosa package [44] were used for data pre-processing, while the Transformers library [45], SpeechBrain [46], and PyTorch [41] were employed for the fine-tuning process.
3.6. Evaluation Criteria
The performance of fine-tuned models in distinguishing between pathological classes—RDS, Sepsis, and Healthy—is evaluated using the confusion matrix, which comprises false positives (FPs), false negatives (FNs), true positives (TPs), and true negatives (TNs). From this, key performance indicators such as accuracy, precision, recall, and the F1 score are derived to comprehensively assess the model’s classification ability. Accuracy evaluates overall correctness by calculating the ratio of correct predictions (true positives and true negatives) to the total instances. Precision, defined as the ratio of true positive predictions to total positive predictions, measures the model’s effectiveness in minimizing false positives. Recall, or sensitivity, quantifies the model’s ability to identify all actual positive cases by comparing true positives to total actual positives. The F1 score, calculated as the harmonic mean of precision and recall, offers a balanced evaluation, particularly valuable for imbalanced datasets. Together, these metrics provide a detailed view of the model’s classification performance, as summarized in Table 3.
Table 3.
Evaluation criteria and their corresponding formulas.
4. Experimental Results
This section presents the results of the fine-tuned models in distinguishing between the pathological classes: RDS, Sepsis, and Healthy. Three models were tested using two learning rate strategies—linear and annealing—introduced in the previous section.
4.1. Results of Fine-Tuned Models with the Annealing Learning Rate
Table 4 outlines the hyperparameter values tested and their optimal configurations for the wav2vec 2.0, HuBERT, and WavLM+ models using the annealing learning rate strategy. Key parameters, such as the number of epochs, batch size, weight decay, learning rates, and annealing factors, were evaluated to determine the best-performing settings for each model.
Table 4.
Hyperparameter values and their optimal settings for wav2vec 2.0, HuBERT, and WavLM+ models with an annealing learning rate.
The optimal number of epochs ranged between 11 and 12, with a consistent batch size of 8. The weight decay was consistently for all models. The annealing factor ranged from 0.5 to 0.85, varying by model. The optimal SSL learning rates were for wav2vec 2.0, for HuBERT, and for WavLM+. The MLP learning rates were 10 times higher than the SSL model learning rates, a ratio determined through experimental testing.
In Figure 4, plots (a), (b), and (c) illustrate the training and validation performance of wav2vec2.0, WavLM+, and HuBERT models, respectively, trained with annealing learning rates under optimal configurations. Each plot depicts training loss, validation error rate, and learning rate adjustments (vertical dashed lines), with the minimum validation error (“Min Error”) marked by a cross. For wav2vec2.0 (plot a), training loss decreases from 1.06 to 0.03, while validation error improves from 0.473 to 0.224 at epoch 9, following a learning rate adjustment at epoch 8 that enhances generalization. WavLM+ (plot b) shows training loss reducing from 0.969 to 0.0323 over 12 epochs, with validation error dropping from 0.436 to 0.198 at epoch 11, supported by rate adjustments at epochs 6, 8, and 10. The HuBERT model (plot c) achieves a loss reduction from 0.9 to 0.0236 and validation error improvement from 0.365 to 0.221 at epoch 9, guided by adjustments at epochs 4, 6, and 8. Models at these optimal points were selected for test phase evaluation. Table 5 presents a summary of the optimized models’ performance, including accuracy, precision, recall, and F1 scores.
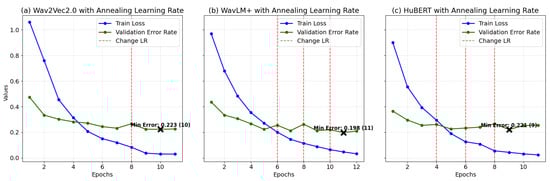
Figure 4.
Training loss and validation error for models (a) Wav2Vec2.0, (b) WavLM+, and (c) HuBERT with annealing LR: curves correspond to the best settings for each model, determined through the optimization process.
Table 5.
Model performance metrics for wav2vec 2.0, WavLM Base+, and HuBERT models using the annealing learning rate.
Figure 5 and Table 5 illustrate the classification performance of the self-supervised models—wav2vec2.0, WavLM Base+, and HuBERT—in categorizing baby cries into Healthy, Sepsis, and RDS conditions. The models demonstrate strong generalization for this complex task, achieving accuracies ranging from 88.33% to 89.76%, highlighting their effectiveness in addressing this challenging classification problem.
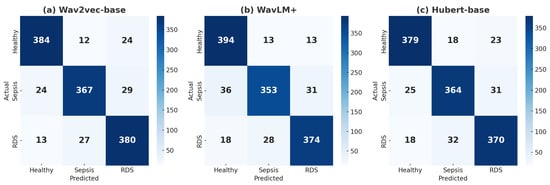
Figure 5.
(a) Confusion matrix for wav2vec 2.0, (b) confusion matrix for WavLM+, and (c) confusion matrix for HuBERT with annealing LR, all showing classifications for Healthy, Sepsis, and RDS.
wav2vec2.0 demonstrated strong overall performance. For the Healthy class, the wav2vec2.0 model correctly classified 384 samples, with 12 misclassified as Sepsis and 24 as RDS, achieving a precision of 91.21% and recall of 91.43%, effectively minimizing false positives and negatives. In the Sepsis class, 367 samples were correctly identified, with 24 misclassified as Healthy and 29 as RDS, resulting in a precision of 90.39% and a slightly lower recall of 87.38%, reflecting a solid balance between correctly identifying positive cases and minimizing misclassifications. For the RDS class, 380 samples were correctly classified, with 13 misclassified as Healthy and 27 as Sepsis, achieving a high recall of 90.48%, demonstrating its effectiveness in detecting this critical condition. Overall, the model achieved an accuracy of 89.76%, making it a reliable choice for clinical applications requiring balanced detection across all classes.
WavLM Base+ achieved an accuracy of 88.97% and excelled in identifying Healthy cases. It correctly classified 394 Healthy samples, with only 13 misclassified as Sepsis and 18 as RDS, resulting in the highest recall (93.81%) among the models. For Sepsis, 353 samples were correctly classified, but its recall (84.05%) was slightly lower, indicating a higher tendency to miss some Sepsis cases despite a precision of 89.59%. In the RDS class, 374 samples were correctly classified, with 18 misclassified as Healthy and 28 as Sepsis, achieving a precision of 89.47% and recall of 89.05%. The model’s strength in minimizing false negatives for the Healthy class makes it valuable for prioritizing accurate identification of normal conditions.
The HuBERT model demonstrated consistent but slightly lower performance, achieving an accuracy of 88.33%. For the Healthy class, 379 samples were correctly classified, with 18 misclassified as Sepsis and 23 as RDS, achieving a precision of 89.81% and recall of 90.24%. indicating reliable identification of Healthy cases but with slightly higher misclassifications than WavLM Base+. For Sepsis, 364 samples were correctly classified, but 25 were misclassified as Healthy and 31 as RDS. With a precision of 87.92% and recall of 86.67%, the model showed a moderate ability to handle Sepsis cases but with a slightly higher rate of false negatives. For the RDS class, 370 samples were correctly classified, with 18 misclassified as Healthy and 32 as Sepsis. With precision at 87.26% and recall at 88.10%, the model showed balanced performance. HuBERT’s consistent metrics across classes make it reliable, though further optimization may be needed for critical conditions like Sepsis and RDS.
In summary, while each model demonstrated strengths in specific areas, their performance varied across disease classes. wav2vec2.0 stood out with its robust balance across all conditions, particularly in detecting RDS. WavLM Base+ excelled in identifying Healthy cases but showed limitations in Sepsis recall. HuBERT, though consistent, faced challenges with higher false negatives for critical conditions. Together, these results highlight both the strengths and shared challenges of the models, particularly the difficulty in reducing false negatives for Sepsis, underscoring areas for future optimization.
4.2. Results of Fine-Tuned Models with the Linear Learning Rate
Table 6 summarizes the tested hyperparameters and optimal values for the models using the linear learning rate strategy. Key hyperparameters, such as the number of epochs, batch size, weight decay, and initial learning rates, were evaluated to determine the best settings. The optimal number of epochs were 9 and 12, with a consistent batch size of 8 across all models. The initial learning rates were fine-tuned to for wav2vec 2.0, for HuBERT, and for WavLM+, all converging to a final learning rate of .
Table 6.
Hyperparameter values and their optimal settings for wav2vec 2.0, HuBERT, and WavLM+ models with a linear learning rate.
Figure 6 presents the training loss and validation error rates for the wav2wec 2.0, WavLM+, and HuBERT models, trained using a linear learning rate strategy with epoch-wise adjustments. These plots reflect the models’ performance under optimized configurations, with the epochs corresponding to the minimum validation error—marked by a cross in each plot—selected for the test phase. The wav2vec 2.0 model (plot a) demonstrates a training loss reduction from 1.13 to 0.0061 and a validation error decrease from 0.667 to 0.229 over 12 epochs, achieving optimal performance at epoch 12. For the WavLM+ model (plot b), training loss drops from 0.985 to 0.0166, and validation error decreases from 0.404 to 0.227, with optimal performance at epoch 8 despite minor variability post-epoch 6. The HuBERT model (plot c) shows consistent improvement, with training loss decreasing from 0.908 to 0.0931 and validation error improving from 0.384 to 0.213, reaching optimal performance at epoch 9. Performance metrics, including accuracy, precision, recall, and F1 scores, are detailed in Table 7.
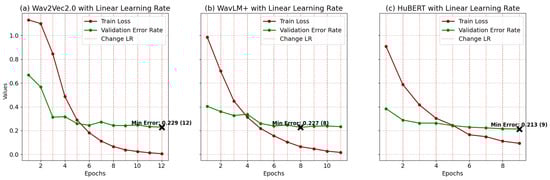
Figure 6.
Training loss and validation error for models (a) wav2wec 2.0, (b) WavLM+, and (c) HuBERT with linear LR: curves correspond to the best settings for each model, determined through the optimization process.
Table 7.
Model performance metrics for wav2vec 2.0, WavLM Base+, and HuBERT models using a linear learning rate.
The results, presented in Figure 7 and Table 7, reveal comparable accuracy across the three models in the linear learning rate experiments. wav2wec2.0 achieves the highest accuracy at 88.73%, followed closely by WavLM Base+ at 88.65% and HuBERT at 88.02%, demonstrating their effectiveness in classifying baby cries into Healthy, Sepsis, and RDS categories. wav2vec2.0 demonstrates strong performance in detecting Healthy cases, with 385 true positives, 10 false positives, and 25 false negatives, resulting in balanced Precision, Recall, and F1 scores of 91.67%. For RDS, it achieves reliable results with 377 true positives, 27 false positives, and 16 false negatives, yielding a high recall of 89.76% and an F1 score of 86.97%. However, its performance in Sepsis detection is slightly weaker, with 356 true positives, 45 false negatives, and 19 false positives, leading to a lower recall of 84.76%, despite strong precision of 90.59%. These results indicate that wav2vec2.0 is highly effective in detecting Healthy and RDS cases but may miss some Sepsis cases, making it better suited for applications that prioritize these conditions.
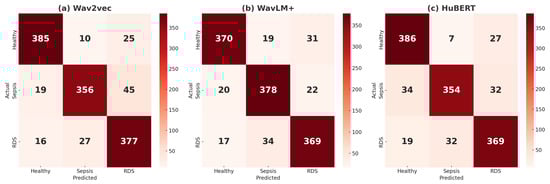
Figure 7.
(a) Confusion matrices for the classification of Healthy, Sepsis, and RDS using a linear learning rate are presented for the following models: (a) wav2vec2.0, (b) WavLM+, and (c) HuBERT.
WavLM Base+ demonstrates reliable performance across all conditions. For Healthy cases, it identifies 370 true positives with 19 false positives and 31 false negatives, resulting in a balanced F1 score of 89.48%. In Sepsis detection, the model excels with 378 true positives, 22 false negatives, and 20 false positives, achieving a high recall of 90.00% and an F1 score of 88.84%. For RDS cases, it performs strongly with 369 true positives, 17 false negatives, and 34 false positives, maintaining balanced precision (87.44%) and recall (87.86%). These results highlight WavLM Base+ as particularly effective for detecting Sepsis with high recall while ensuring robust performance across Healthy and RDS classifications.
HuBERT excels in Healthy detection, achieving the highest recall (91.90%) with 386 true positives, just 7 false positives, and 27 false negatives, reflecting minimal misclassification. For Sepsis detection, its performance is less robust, with 354 true positives, 32 false negatives, and 19 false positives, resulting in a recall of 84.29% and a solid precision of 90.08%. In RDS classification, HuBERT achieves consistent performance with 369 true positives, 19 false negatives, and 32 false positives, yielding a precision of 86.21%, a recall of 87.86%. While HuBERT’s outstanding accuracy in Healthy classification makes it highly reliable in this area, its lower recall for Sepsis limits its suitability for scenarios that demand high sensitivity to critical conditions like Sepsis.
Overall, among the models, wav2vec2.0 demonstrates the strongest overall performance, excelling in Healthy and RDS detection with consistent results. WavLM Base+ stands out as the most balanced model, particularly excelling in Sepsis detection while maintaining strong performance across all classes. HuBERT performs best in Healthy detection but faces challenges in Sepsis classification. Across all models, Sepsis emerges as the most difficult class to detect, while Healthy and RDS are consistently well classified. These results highlight the models’ strengths and the need for improvements in addressing Sepsis detection.
Figure 8 presents the precision, recall, and F1 scores for each model—wav2vec 2.0, WavLM Base+, and HuBERT—evaluated across the three classes: Healthy, Sepsis, and RDS. The comparison of learning rate strategies, annealing and linear, is visually represented using shades of blue for annealing and shades of red for linear. The results highlight that the annealing strategy consistently delivers superior performance across all models, specifically enhancing F1 scores and accuracy for classifying cases in each class, demonstrating its effectiveness over the linear approach in optimizing model performance.
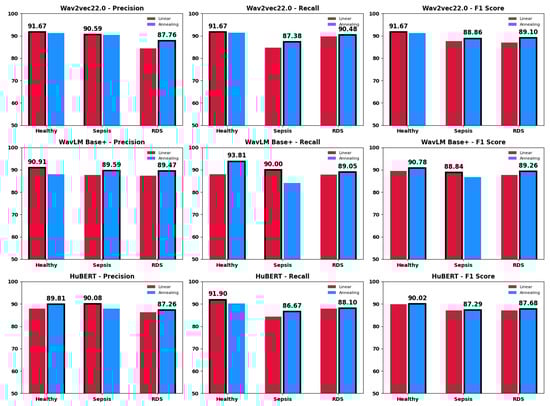
Figure 8.
The class-specific metrics for each model under both annealing and linear learning rate strategies.
We compared our proposed method with two previous studies, refs. [29,30], which classified infant cries into Sepsis, RDS, and Healthy categories. Table 8 summarizes key differences and results, including the number of samples per class, the number of newborns, minimum duration filters, input features, and overall F1 scores.
Table 8.
Key parameters and results compared to prior studies.
5. Discussion
This study underscores the efficacy of the annealing learning rate strategy, which consistently surpassed the linear approach across all three models—wav2vec 2.0, WavLM Base+, and HuBERT—reaching a maximum accuracy of approximately 90% with wav2vec 2.0. By incorporating dataset expansion, self-supervised learning models, and the annealing LR strategy, the proposed approach shows strong potential for practical applications in neonatal disease detection. Such advancements are particularly important for NCDSs, where accurate and timely detection is crucial for improving infant health outcomes.
Despite the demonstrated advances, a consistent challenge across most experiments, irrespective of the learning rate strategy, lies in the slightly lower recall for Sepsis compared to Healthy and RDS. This underscores the persistent challenge of accurately detecting Sepsis, driven by (1) its higher proportion of short-duration samples and inherent class imbalance, and (2) the subtle, complex patterns that set Sepsis apart from other classes. While the proposed approach improves overall performance, further research is necessary to address these complexities in Sepsis classification, which remains notably more challenging than distinguishing either RDS or Healthy cases.
In data processing, as outlined in the Data Utilization section, we excluded samples under 40 ms to align with our approach’s frame rate of 50 frames per second (20 ms per frame). Notably, Sepsis samples include a significantly higher proportion of short-duration segments, with 20 out of 2799 samples falling between 40 and 60 ms, compared to only three in Healthy and one in RDS. Although the total duration for each class remains comparable—1982.90 s for Sepsis, 1983.77 s for RDS, and 1961.35 s for Healthy—the higher frequency of short segments in Sepsis may limit the model’s capacity to identify intricate trends essential for reliable classification. Furthermore, Sepsis presents inherently complex and subtle patterns, rendering it more challenging to distinguish than the other two classes.
To further understand these limitations, we conducted binary classification experiments using our proposed framework, first by focusing only on Sepsis and Healthy classes while testing the impact of raising the minimum duration threshold above 40 ms. The results suggested that shorter segments often lack the level of detail required for robust classification, a shortcoming exacerbated by the class imbalance in Sepsis. Next, we ran two additional binary scenarios in which we separated Sepsis and Healthy in one case, and RDS from Healthy in another. After hyperparameter tuning, our approach achieved slightly better performance when distinguishing RDS from Healthy than when classifying Sepsis, underscoring the persistent challenge of accurately detecting Sepsis. Ultimately, two main factors hinder Sepsis recognition: (1) the elevated proportion of short samples, and (2) the subtle, complex nature of Sepsis itself.
Our study expands upon previous works [29,30] that classified infant cries into Sepsis, RDS, and Healthy categories using smaller subsets of the dataset with fewer EXP segments and an uneven distribution of newborns across classes. These prior studies used 1132 and 1300 samples per class, respectively, compared to our balanced and comprehensive dataset of 2799 samples per class, derived from 17 infants per category. Unlike these studies, which relied on feature extraction and combination techniques before classification, our approach processes the raw waveform of EXP segments without explicit feature extraction. Notably, ref. [30] excluded all segments shorter than 200 ms, arguing they lack sufficient information for cry analysis. Similarly, ref. [29] stated that
samples less than 17 s were excluded as they were noninformative recordings that may have disturbed the training process.
By contrast, our inclusion of samples as short as 40 ms expands the dataset’s size and variety, enhancing the model’s generalization to real-world scenarios where infant cries may occur in brief bursts. This broader inclusion criterion likely increases data variability, making the model more adaptable to diverse practical applications.
While our approach demonstrates strong performance, particularly through the use of self-supervised learning models, an annealing learning rate strategy, and an expanded dataset, the reduced accuracy in detecting Sepsis underscores the need for more in-depth research to address challenges posed by shorter-duration samples, class imbalance, and the inherently complex patterns of Sepsis. Future efforts could explore advanced signal processing techniques to enhance features in short samples and complex phenomena, develop models specifically optimized for imbalanced and variable-length data, and incorporate stratified k-fold cross-validation to ensure robust evaluation and fair representation of all classes. By refining feature representation and tailoring models to these specific challenges, future research can build on the strong foundation established in this study to further enhance diagnostic accuracy.
In conclusion, this study demonstrates the potential of combining annealing learning rates, self-supervised learning models, and diverse data inclusion to advance infant cry-based disease classification. While Sepsis detection remains more challenging compared to RDS and Healthy, the approach establishes a strong foundation for further advancements in neonatal healthcare applications. By addressing current limitations, such as class imbalance and the complexity of short-duration samples, future research can build on these findings to enhance diagnostic accuracy and improve outcomes in neonatal care.
Author Contributions
Conceptualization, S.V.S. and C.T.; data curation, S.V.S.; formal analysis, S.V.S.; investigation, S.V.S.; methodology, S.V.S. and C.T.; project administration, C.T.; resources, C.T.; software, S.V.S.; supervision, C.T.; validation, S.V.S.; visualization, S.V.S.; writing—original draft, S.V.S.; writing—review and editing, S.V.S. and C.T. All authors have read and agreed to the published version of the manuscript.
Funding
This research received no external funding.
Institutional Review Board Statement
The study was conducted according to the guidelines of the Declaration of Helsinki and approved by the Ethics Committee of École de Technologie Supérieure (#H20100401). Approval date: 4 March 2022.
Informed Consent Statement
Informed consent was obtained from all subjects involved in the study.
Data Availability Statement
Data supporting the reported results are not publicly available due to privacy and ethical restrictions.
Conflicts of Interest
The authors declare no conflicts of interest.
Appendix A. Description of CAS Label Units
Table A1.
Different units of CAS labels and their descriptions.
Table A1.
Different units of CAS labels and their descriptions.
| Label | Definition |
|---|---|
| EXP | Voiced expiratory segment during a period of cry |
| EXPN | Unvoiced expiratory segment during a period of cry |
| INS | Unvoiced inspiratory segment during a period of cry |
| INSV | Voiced inspiratory segment during a period of cry |
| EXP2 | Voiced expiratory segment during a period of pseudo-cry |
| INS2 | Voiced inspiratory segment during a period of pseudo-cry |
| PSEUDOCRY | Other sounds than cries produced by the baby |
| Speech | Human speech |
| Background | A kind of noise that is very low in power, characterized by silence with little noise interference |
| Noisy cry | Any sound heard with the cry (BIP, water, diaper changing, etc.) |
| Noisy pseudo-cry | Any sound heard with the pseudo-cry |
| Noise | Sound caused by various sources |
| BIP | Sound from medical instruments next to the baby |
Appendix B. Comparison of Model Architectures
From an architectural perspective, WavLM Base Plus, wav2vec 2.0, and HuBERT share a similar structure. They feature convolutional layers for feature extraction, followed by linear projections that transform inputs from 512 to 768 dimensions, and 12 Transformer-based encoder layers. Each model employs GELU activations, layer normalization, and feed-forward networks that expand the hidden dimensions from 768 to 3072 before projecting them back to 768, with dropout applied for regularization. The primary distinction lies in the attention mechanisms: WavLM utilizes GRU-based relative positional embeddings, while wav2vec 2.0 and HuBERT rely on standard self-attention mechanisms, differing primarily in their training objectives. The layers of each model are detailed in Table A2.
Table A2.
Comparison of WavLM Base Plus, wav2vec 2.0, and HuBERT architectures.
Table A2.
Comparison of WavLM Base Plus, wav2vec 2.0, and HuBERT architectures.
| Component | wav2vec 2.0 | HuBERT | WavLM Base Plus |
|---|---|---|---|
| Feature Extractor | Six Conv layers with GroupNorm and GELU | ||
| Conv1d (Layer 0) | Conv1d(1, 512, kernel = 10, stride = 5), GroupNorm, GELU | Same as wav2vec 2.0 | Same as wav2vec 2.0 |
| Conv1d (Layers 1–4) | Conv1d(512, 512, kernel = 3, stride = 2), GELU | Same as wav2vec 2.0 | Same as wav2vec 2.0 |
| Conv1d (Layers 5–6) | Conv1d(512, 512, kernel = 2, stride = 2), GELU | Same as wav2vec 2.0 | Same as wav2vec 2.0 |
| Feature Projection | Linear transformation from 512 to 768 dimensions, Dropout(0.1) | ||
| LayerNorm | LayerNorm(512) | Same as wav2vec 2.0 | Same as wav2vec 2.0 |
| Projection | Linear(512 → 768), Dropout(0.1) | Same as wav2vec 2.0 | Same as wav2vec 2.0 |
| Encoder | Transformer encoder with 12 layers | ||
| Positional Conv Emb | Conv1d(768, 768, kernel = 128, stride = 1, groups = 16), GELU | Same as wav2vec 2.0 | Same as wav2vec 2.0 |
| Attention Layers | wav2vec 2.0SdpaAttention: , Linear, GELU | Same as wav2vec 2.0 | Adds GRU-based relative positional embeddings |
| Feed-Forward Layers | wav2vec 2.0FeedForward: Linear(768 → 3072), GELU, Linear(3072 → 768), Dropout(0.1) | Same as wav2vec 2.0 | Same as wav2vec 2.0 |
| Encoder Layers | 12 Transformer layers | Same as wav2vec 2.0 | Same as wav2vec 2.0 |
In the Attention Layers row, the terms k/q/vproj(768 → 768) refer to the key, query, and value projections. These are linear transformations that map the input from 768 dimensions to 768 dimensions within the self-attention mechanism. These projections enable the model to determine which parts of the input sequence to focus on. After these projections, a Linear layer combines the attention output, incorporating GELU for nonlinearity. Additionally, WavLM Base Plus incorporates GRU-based relative positional embeddings to better capture positional relationships in the input.
References
- UNICEF. Levels and Trends in Child Mortality: Report 2023. United Nations Inter-Agency Group for Child Mortality Estimation (UN IGME). Available online: https://data.unicef.org/resources/levels-and-trends-in-child-mortality-2024/ (accessed on 7 October 2024).
- UNICEF. Levels and Trends in Child Mortality: Report 2022. United Nations Inter-Agency Group for Child Mortality Estimation (UN IGME). Available online: https://resourcecentre.savethechildren.net/document/levels-and-trends-in-child-mortality-report-2022/ (accessed on 7 October 2024).
- Merck. Neonatal Sepsis. Merck Manuals Professional Edition. 2023. Available online: https://www.merckmanuals.com/professional/pediatrics/infections-in-neonates/neonatal-sepsis (accessed on 7 October 2024).
- Kamath, B.D.; MacGuire, E.R.; McClure, E.M.; Goldenberg, R.L.; Jobe, A.H. Neonatal Mortality From Respiratory Distress Syndrome: Lessons for Low-Resource Countries. Pediatrics 2011, 127, 1139–1146. [Google Scholar] [CrossRef] [PubMed]
- Statistics Canada. Leading Causes of Death, Infants; Statistics Canada: Ottawa, ON, Canada, 2022.
- Michelsson, K.; Sirviö, P.; Wasz-Höckert, O. Pain cry in full-term asphyxiated newborn infants correlated with late findings. Acta Pædiatrica 1977, 66, 611–616. [Google Scholar] [CrossRef] [PubMed]
- Mukhopadhyay, J.; Saha, B.; Majumdar, B.; Majumdar, A.; Gorain, S.; Arya, B.K.; Bhattacharya, S.D.; Singh, A. An evaluation of human perception for neonatal cry using a database of cry and underlying cause. In Proceedings of the 2013 Indian Conference on Medical Informatics and Telemedicine (ICMIT), Kharagpur, India, 28–30 March 2013; pp. 64–67. [Google Scholar]
- Salehian Matikolaie, F.; Kheddache, Y.; Tadj, C. Automated newborn cry diagnostic system using machine learning approach. Biomed. Signal Process. Control 2022, 73, 103434. [Google Scholar] [CrossRef]
- Khalilzad, Z.; Tadj, C. Using CCA-Fused Cepstral Features in a Deep Learning-Based Cry Diagnostic System for Detecting an Ensemble of Pathologies in Newborns. Diagnostics 2023, 13, 879. [Google Scholar] [CrossRef] [PubMed]
- Patil, H.A.; Patil, A.T.; Kachhi, A. Constant Q Cepstral Coefficients for Classification of Normal vs. Pathological Infant Cry. In Proceedings of the IEEE International Conference on Acoustics, Speech and Signal Processing (ICASSP), Singapore, 23–27 May 2022; pp. 7392–7396. [Google Scholar]
- Hariharan, M.; Chee, L.S.; Yaacob, S. Analysis of Infant Cry Through Weighted Linear Prediction Cepstral Coefficients and Probabilistic Neural Network. J. Med. Syst. 2012, 36, 1309–1315. [Google Scholar] [CrossRef] [PubMed]
- Felipe, G.Z.; Aguiar, R.L.; Costa, Y.M.G.; Silla, C.N.; Brahnam, S.; Nanni, L.; McMurtrey, S. Identification of Infants’ Cry Motivation Using Spectrograms. In Proceedings of the 2019 International Conference on Systems, Signals and Image Processing (IWSSIP), Osijek, Croatia, 5–7 June 2019; pp. 181–186. [Google Scholar]
- Matikolaie, F.S.; Tadj, C. On the use of long-term features in a newborn cry diagnostic system. Biomed. Signal Process. Control 2020, 59, 101889. [Google Scholar]
- Matikolaie, F.S.; Tadj, C. Machine Learning-Based Cry Diagnostic System for Identifying Septic Newborns. J. Voice 2022, 38, 963.e1–963.e14. [Google Scholar] [CrossRef]
- Khalilzad, Z.; Kheddache, Y.; Tadj, C. An Entropy-Based Architecture for Detection of Sepsis in Newborn Cry Diagnostic Systems. Entropy 2022, 24, 1194. [Google Scholar] [CrossRef] [PubMed]
- Zabidi, A.; Yassin, I.M.; Hassan, H.A.; Ismail, N.; Hamzah, M.M.A.M.; Rizman, Z.I.; Abidin, H.Z. Detection of asphyxia in infants using deep learning Convolutional Neural Network (CNN) trained on Mel Frequency Cepstrum Coefficient (MFCC) features extracted from cry sounds. J. Fundam. Appl. Sci. 2018, 9, 768. [Google Scholar] [CrossRef]
- Ting, H.-N.; Choo, Y.-M.; Ahmad Kamar, A. Classification of asphyxia infant cry using hybrid speech features and deep learning models. Expert Syst. Appl. 2022, 208, 118064. [Google Scholar] [CrossRef]
- Sachin, M.U.; Nagaraj, R.; Samiksha, M.; Rao, S.; Moharir, M. GPU based deep learning to detect asphyxia in neonates. Indian J. Sci. Technol. 2017, 10, 110617. [Google Scholar] [CrossRef]
- Moharir, M.; Sachin, M.U.; Nagaraj, R.; Samiksha, M.; Rao, S. Identification of asphyxia in newborns using GPU for deep learning. In Proceedings of the 2017 2nd International Conference for Convergence in Technology (I2CT), Mumbai, India, 7–9 April 2017; pp. 236–239. [Google Scholar]
- Ji, C.; Xiao, X.; Basodi, S.; Pan, Y. Deep Learning for Asphyxiated Infant Cry Classification Based on Acoustic Features and Weighted Prosodic Features. In Proceedings of the 2019 International Conference on Internet of Things (iThings) and IEEE Green Computing and Communications (GreenCom) and IEEE Cyber, Physical and Social Computing (CPSCom) and IEEE Smart Data (SmartData), Atlanta, GA, USA, 14–17 July 2019; pp. 1233–1240. [Google Scholar]
- Wu, K.; Zhang, C.; Wu, X.; Wu, D.; Niu, X. Research on Acoustic Feature Extraction of Crying for Early Screening of Children with Autism. In Proceedings of the 2019 34th Youth Academic Annual Conference of Chinese Association of Automation (YAC), Changsha, China, 6–8 June 2019; pp. 290–295. [Google Scholar]
- Hariharan, M.; Sindhu, R.; Yaacob, S. Normal and hypoacoustic infant cry signal classification using time—Frequency analysis and general regression neural network. Comput. Methods Programs Biomed. 2012, 108, 559–569. [Google Scholar] [CrossRef]
- Satar, M.; Cengizler, C.; Hamitoglu, S.; Özdemir, M. Audio analysis based diagnosis of hypoxic ischemic encephalopathy in newborns. Audio Anal. Based Diagn. Hypoxic Ischemic Enceph. Newborns 2022, 1, 28–42. [Google Scholar]
- Orlandi, S.; Reyes Garcia, C.A.; Bandini, A.; Donzelli, G.; Manfredi, C. Application of pattern recognition techniques to the classification of full-term and preterm infant cry. J. Voice 2016, 30, 656–663. [Google Scholar] [CrossRef]
- Le, L.; Kabir, A.N.M.H.; Ji, C.; Basodi, S.; Pan, Y. Using transfer learning, SVM, and ensemble classification to classify baby cries based on their spectrogram images. In Proceedings of the 2019 IEEE 16th International Conference on Mobile Ad Hoc and Sensor Systems Workshops (MASSW), Monterey, CA, USA, 4–7 November 2019; pp. 106–110. [Google Scholar]
- Reyes-Galaviz, O.F.; Tirado, E.A.; Reyes-Garcia, C.A. Classification of infant crying to identify pathologies in recently born babies with ANFIS. In Computers Helping People with Special Needs; Miesenberger, K., Klaus, J., Zagler, W.L., Burger, D., Eds.; Springer: Berlin/Heidelberg, Germany, 2004; Volume 3118, pp. 408–415. [Google Scholar]
- Hariharan, M.; Sindhu, R.; Vijean, V.; Yazid, H.; Nadarajaw, T.; Yaacob, S.; Polat, K. Improved binary dragonfly optimization algorithm and wavelet packet based non-linear features for infant cry classification. Comput. Methods Programs Biomed. 2018, 155, 39–51. [Google Scholar] [CrossRef] [PubMed]
- Ji, C.; Basodi, S.; Xiao, X.; Pan, Y. Infant sound classification on multi-stage CNNs with hybrid features and prior knowledge. In Artificial Intelligence and Mobile Services—AIMS 2020; Xu, R., De, W., Zhong, W., Tian, L., Bai, Y., Zhang, L.-J., Eds.; Springer International Publishing: Berlin/Heidelberg, Germany, 2020; Volume 12401, pp. 3–16. [Google Scholar]
- Zayed, Y.; Hasasneh, A.; Tadj, C. Infant cry signal diagnostic system using deep learning and fused features. Diagnostics 2023, 13, 2107. [Google Scholar] [CrossRef]
- Mohammad, A.; Tadj, C. Transformer-based approach to pathology diagnosis using audio spectrogram. J. Pathol. Audio Diagnosis 2024, 1, 45–58. [Google Scholar]
- Kuttruff, H. Room Acoustics, 6th ed.; CRC Press: Boca Raton, FL, USA, 2016. [Google Scholar]
- Deller, J.R.; Proakis, J.G.; Hansen, J.H. Discrete Time Processing of Speech Signals, 1st ed.; Prentice Hall PTR: Paramus, NJ, USA, 1993; ISBN 0023283017. [Google Scholar]
- Rabiner, L.R. Digital Processing of Speech Signals; Pearson Education India: Noida, India, 1978. [Google Scholar]
- Young, S.; Evermann, G.; Gales, M.; Hain, T.; Kershaw, D.; Liu, X.; Moore, G.; Odell, J.; Ollason, D.; Povey, D.; et al. The HTK Book; Cambridge University Engineering Department: Cambridge, UK, 2002; Volume 3, p. 12. [Google Scholar]
- Boukydis, C.Z.; Lester, B.M. Infant Crying: Theoretical and Research Perspectives; Plenum Press: New York, NY, USA, 1985. [Google Scholar]
- Lind, K.; Wermke, K. Development of the vocal fundamental frequency of spontaneous cries during the first 3 months. Int. J. Pediatr. Otorhinolaryngol. 2002, 64, 97–104. [Google Scholar] [CrossRef] [PubMed]
- Kheddache, Y.; Tadj, C. Identification of diseases in newborns using advanced acoustic features of cry signals. Biomed. Signal Process. Control 2019, 50, 35–44. [Google Scholar] [CrossRef] [PubMed]
- Baevski, A.; Zheng, S.; Auli, M. Wav2vec2 2.0: A Framework for Self-Supervised Learning of Speech Representations. arXiv 2020, arXiv:2006.11477. Available online: https://arxiv.org/abs/2006.11477 (accessed on 2 October 2024).
- Hsu, W.-N.; Bolte, B.; Tsai, Y.-H.H.; Lakhotia, K.; Salakhutdinov, R.; Mohamed, A. HuBERT: Self-Supervised Speech Representation Learning by Masked Prediction of Hidden Units. IEEE/ACM Trans. Audio Speech Lang. Process. 2021, 29, 3451–3460. [Google Scholar] [CrossRef]
- Chen, S.; Wang, C.; Chen, Z.; Wu, Y.; Liu, S.; Chen, Z.; Li, J.; Kanda, N.; Yoshioka, T.; Wei, F.; et al. WavLM: Large-Scale Self-Supervised Pre-Training for Full Stack Speech Processing. IEEE J. Sel. Top. Signal Process. 2022, 16, 1505–1518. [Google Scholar] [CrossRef]
- Paszke, A.; Gross, S.; Massa, F.; Lerer, A.; Bradbury, J.; Chanan, G.; Killeen, T.; Lin, Z.; Gimelshein, N.; Antiga, L.; et al. PyTorch: An Imperative Style, High-Performance Deep Learning Library. Available online: https://pytorch.org/ (accessed on 2 October 2024).
- Digital Research Alliance of Canada. Narval Supercomputing Cluster. Available online: https://alliancecan.ca/en/services/advanced-research-computing/narval (accessed on 2 October 2024).
- Yang, Y.-Y.; Hira, M.; Ni, Z.; Chourdia, A.; Astafurov, A.; Chen, C.; Yeh, C.-F.; Puhrsch, C.; Pollack, D.; Genzel, D.; et al. TorchAudio: An Audio Library for PyTorch. Available online: https://pytorch.org/audio/ (accessed on 2 October 2024).
- McFee, B.; Raffel, C.; Liang, D.; Ellis, D.P.W.; McVicar, M.; Battenberg, E.; Nieto, O. librosa: Audio and Music Signal Analysis in Python. In Proceedings of the 14th Python in Science Conference, Austin, TX, USA, 6–12 July 2015; pp. 18–24. Available online: https://librosa.org/ (accessed on 2 October 2024).
- Wolf, T.; Debut, L.; Sanh, V.; Chaumond, J.; Delangue, C.; Moi, A.; Cistac, P.; Rault, T.; Louf, R.; Funtowicz, M.; et al. Transformers: State-of-the-Art Natural Language Processing. Available online: https://github.com/huggingface/transformers (accessed on 2 October 2024).
- Ravanelli, M.; Parcollet, T.; Plantinga, P.; Rouhe, A.; Cornell, S.; Lugosch, L.; Subakan, C.; Dawalatabad, N.; Heba, A.; Zhong, J.; et al. SpeechBrain: A General-Purpose Speech Toolkit. arXiv 2021, arXiv:2106.04624. Available online: https://arxiv.org/abs/2106.04624 (accessed on 2 October 2024).
Disclaimer/Publisher’s Note: The statements, opinions and data contained in all publications are solely those of the individual author(s) and contributor(s) and not of MDPI and/or the editor(s). MDPI and/or the editor(s) disclaim responsibility for any injury to people or property resulting from any ideas, methods, instructions or products referred to in the content. |
© 2025 by the authors. Licensee MDPI, Basel, Switzerland. This article is an open access article distributed under the terms and conditions of the Creative Commons Attribution (CC BY) license (https://creativecommons.org/licenses/by/4.0/).