Abstract
To enhance the utilization efficiency of wind and solar renewable energy in industrial parks, reduce operational costs, and optimize the charging experience for electric vehicle (EV) users, this paper proposes a real-time scheduling strategy based on the “Dual Electricity Price Reservation—Surplus Refund Without Additional Charges Mechanism” (DPRSRWAC). The strategy employs a Gaussian Mixture Model (GMM) to analyze EV users’ charging and discharging behaviors within the park, constructing a behavior prediction model. It introduces reservation, penalty, and ticket-grabbing mechanisms, combined with the Interval Optimization Method (IOM) and Particle Swarm Optimization (PSO), to dynamically solve the optimal reservation electricity price at each time step, thereby guiding user behavior effectively. Furthermore, linear programming (LP) is used to optimize the real-time charging and discharging schedules of EVs, incorporating reservation data into the generation-side model. The generation-side optimal charging and discharging behavior, along with real-time electricity prices, is determined using Dynamic Programming (DP). In addition, this study explicitly considers the battery aging cost associated with V2G operations and proposes a benefit model for EV owners in V2G mode, thereby incentivizing user participation and enhancing acceptance. A simulation analysis demonstrates that the proposed strategy effectively reduces park operation costs and user charging costs by 8.0% and 33.1%, respectively, while increasing the utilization efficiency of wind and solar energy by 19.3%. Key performance indicators are significantly improved, indicating the strategy’s economic viability and feasibility. This work provides an effective solution for energy management in smart industrial parks.
1. Introduction
As the global energy structure transitions toward low-carbon and environmentally friendly alternatives, the share of renewable energy sources such as wind and photovoltaic power in global energy supply has been increasing annually. However, due to the volatility and uncertainty of these renewable energy sources, power systems face significant imbalances during peak demand or low generation periods [1,2]. In industrial parks, in particular, the instability of wind and solar energy supply at different times directly affects the economic and operational stability of energy use within the park. Therefore, improving the capacity for wind and solar energy integration has become a critical issue that urgently needs to be addressed [3,4].
The rapid development of electric vehicles (EVs) has introduced new opportunities for efficiently utilizing renewable energy. As both loads and energy storage devices, EVs can charge during periods of excess renewable energy generation [5,6] and supply power back to the park during high-demand periods through the Vehicle-to-Grid (V2G) mechanism. This helps alleviate supply–demand imbalances caused by renewable energy fluctuations [7,8,9]. Existing research has extensively explored energy management solutions for parks with integrated EVs. However, most studies have not fully utilized the bidirectional regulation capabilities of V2G [10,11]. Although some studies have considered the potential of V2G, they primarily focus on charging optimization for EVs and do not address the role of reservation mechanisms in balancing charging demands and stabilizing electricity prices [12,13]. Moreover, some studies have attempted to introduce reservation mechanisms into EV charging management [14], but due to significant electricity price fluctuations, large-scale reservations often lead to cumulative price effects and increased user costs. Controlling the cumulative price effects caused by reservations remains an unresolved challenge [15].
Several studies have explored optimizing EV charging costs. For instance, references [16,17] utilize various algorithms to determine electricity prices under reservation mechanisms, while references [18,19] focus on optimizing total park costs or user costs by reallocating resources to reduce expenses. However, most of these studies address only a single optimization objective and fail to consider both EV user charging costs and total generation-side operational costs within a single strategy. Effectively controlling EV charging costs and park generation costs while ensuring renewable energy integration and aligning EV charging and discharging behavior with the dynamic park load remains a pressing challenge in smart park energy management [20].
In the field of Demand Side Management (DSM), reference [21] focuses on the classification and usage frequency of existing algorithms (such as Genetic Algorithm and Particle Swarm Optimization). Although it provides a rich set of tools for DSM, it lacks an in-depth discussion of electric vehicles (EVs) and industrial park scenarios. Furthermore, it does not propose innovative solutions for renewable energy integration or dynamic EV scheduling. As for reference [22], while it excels in V2G scheduling and heuristic algorithm applications, it mainly targets single-parking-lot scenarios, with insufficient consideration of wind and solar variability and large-scale industrial load characteristics. Reference [23], on the other hand, considers the expansion planning of EV charging stations from the perspective of investors, employing a bi-level optimization model to assess profitability and risks. However, it primarily emphasizes grid infrastructure expansion, with insufficient exploration of direct integration of renewable energy sources such as wind and photovoltaics.
Reference [24] focuses on flexibility services for Distribution System Operators, addressing the role of EV aggregators in providing regulation during grid congestion. Nevertheless, its discussion on renewable energy fluctuation management is relatively limited. Reference [25] introduces a multi-stage optimization and Vehicle-to-Vehicle energy exchange mechanism, which significantly enhances parking lots’ responsiveness to grid load fluctuations. However, it does not extend to industrial park scenarios, nor does it propose direct optimization strategies for wind and photovoltaic variability. Reference [26] demonstrates a high degree of innovation in the collaborative scheduling, security, and load balancing of multiple charging stations. However, due to the lack of a comprehensive user-side and renewable energy complementary mechanism, it struggles to effectively perform peak shaving and valley filling during significant wind and solar output fluctuations.
From the perspective of Virtual Power Plants (VPPs) and grid-level operations, reference [27] focuses on the joint scheduling of EVs and energy storage systems under uncertainty, making it suitable for macro-grid stability analysis. However, its depiction of renewable energy utilization and active user response is relatively limited. It also falls short in exploring wind and solar fluctuation management within industrial park scenarios. References [28,29] apply machine learning or deep learning methods to enhance the accuracy of grid load forecasting, with a primary focus on macro-level load management. However, they lack scenario-based applications for industrial parks or EV charging and discharging scheduling, paying little attention to the interaction mechanisms between renewable energy and EVs.
In other areas of demand response, reference [30] introduces a multi-objective optimization model for industrial steam heating systems, incorporating time-of-use pricing and thermal storage capacity. However, compared to EV scheduling models, this scheme exhibits relatively weak research on user flexibility and real-time price response. Although reference [16] proposes a bi-level optimization and user behavior response model, improving grid load balancing, it still falls short in integrating renewable energy variability and spatial dispatch modeling. References [31,32] focus on smart home and microgrid scheduling, employing advanced algorithms such as reinforcement learning and deep learning to address load forecasting uncertainty. However, these studies primarily serve household energy use or microgrid VPP scenarios, and lack comprehensive analysis of large-scale EV collaborative scheduling and renewable energy integration within industrial parks.
To address these issues, this paper proposes a dual-layer real-time scheduling strategy for EV charging and discharging in a microgrid park based on the “Dual Electricity Price Reservation—Surplus Refund Without Additional Charges Mechanism” (DLRTS-DPRSRWAC). This comprehensive strategy consists of two primary components:
- (1)
- Dual-Layer Real-Time Scheduling Strategy (DLRTS): This layer manages both electric vehicle (EV) charging/discharging schedules and the microgrid’s renewable energy dispatch in real-time. By operating on two layers, the system can simultaneously optimize user charging demands and renewable energy utilization, ensuring balanced and efficient energy flow within the microgrid park.
- (2)
- Dual Electricity Price Reservation—Surplus Refund Without Additional Charges Mechanism (DPRSRWAC):
- Dual Price Reservation (DPR): EV users reserve charging/discharging time slots in advance at a predetermined reservation price, locking in their desired time periods and fixing energy costs, providing financial predictability for users.
- Surplus Refund Without Additional Charges (SRWAC): If the real-time electricity price during the reserved slot is lower than the reservation price, users receive a refund for the difference. Conversely, if the real-time price exceeds the reservation price, users are not charged any additional fees beyond the reservation price. This mechanism protects users from price fluctuations and encourages early reservations.
The DLRTS-DPRSRWAC mechanism aligns EV charging behavior with renewable energy supply, achieving the following innovative objectives: (1) In industrial park scenarios, real-time pricing and reservation mechanisms guide EVs to charge during periods of wind and solar energy surplus, reducing renewable energy curtailment. (2) While optimizing user costs, the strategy also balances grid operational economics and the need to regulate renewable energy fluctuations. (3) A dual-layer real-time scheduling method is proposed, providing more flexible load management tools for the high penetration of renewable energy. This research effectively bridges theoretical models with practical applications and addresses the gaps in the existing literature regarding improving renewable energy utilization and providing economic incentives for EV users in industrial parks.
The operational steps of the DLRTS-DPRSRWAC mechanism are as follows: First, the Gaussian Mixture Model (GMM) is employed to model and predict EV user behavior in the park, accurately capturing changes in user charging demands [33]. Subsequently, reservation, penalty, and ticket-grabbing mechanisms are introduced. By combining the Interval Optimization Method (IOM) [34] with the Particle Swarm Optimization (PSO) algorithm [35], the optimal reservation electricity price is determined at each time step to guide users in reasonable charging and discharging behavior. Linear Programming (LP) is utilized to optimize EV charging and discharging scheduling, integrating reservation data into the generation-side model. Additionally, Dynamic Programming (DP) further determines the optimal generation-side charging and discharging behavior and the actual EV charging prices, ensuring efficient renewable energy utilization [36,37]. Through the development of the DLRTS-DPRSRWAC model and simulation based on case studies, this research conducts an in-depth analysis of user behavior, scheduling effectiveness, V2G penetration, and impacts on grid electricity prices. The results demonstrate that this strategy effectively reduces both user charging costs and park generation costs while ensuring timely completion of charging tasks. It verifies the feasibility and effectiveness of the “Dual Electricity Price Reservation—Surplus Refund Without Additional Charges Mechanism” in the real-time scheduling of park EVs.
2. Charging and Discharging System and Mechanism for Park EVs
2.1. Charging and Discharging System for Park EVs
This study develops a smart park electric vehicle (EV) charging and discharging system comprising a wind power supply system, power regulation system, information center, park load system, and EV charging and discharging system [38], as shown in Figure 1.

Figure 1.
EV Charging and Discharging System Diagram for the Park.
The system operates as follows: electricity generated by wind and solar energy is prioritized to meet the park’s load demand, with any surplus absorbed through EV charging and battery storage. When wind and solar energy supply is insufficient, the system first utilizes stored energy from batteries and EVs to supplement the deficit. If the demand still cannot be met, the system, following economic principles, activates gas turbines (GTs) for power generation or purchases electricity from the grid to achieve peak shaving and valley filling. EVs serve not only as loads to absorb surplus renewable energy but also as energy providers through the V2G model, feeding electricity back to the grid when prices are high. During these peak price periods, EV owners earn income from discharging, thereby reducing their overall electricity costs. This dual mechanism simultaneously achieves economic benefits for EV owners and balances the system load.
To realize these objectives, it is essential to rationally regulate the charging and discharging behaviors of EVs and batteries while coordinating GT power generation and grid electricity purchases. This scheduling task is critical to achieving efficient system operation and is the core focus of this study.
2.2. DPRSRWAC Mechanism
To efficiently schedule the charging and discharging of EVs, accurately understanding the distribution of users’ charging times is crucial [39]. Due to the uncertainty of user behavior, reservation mechanisms have garnered attention for their precision advantages compared to traditional forecasting methods. To enhance users’ participation in reservations, reference [40] proposed a scenario-based stochastic optimization strategy. However, this approach may lead to increased charging costs, adding to users’ financial burden. To address this issue, this paper proposes the DPRSRWAC mechanism, which combines the concepts of “pay first, settle later” and “difference refund”. Before each scheduling period, the system publishes reference electricity prices for N future time periods t, where N is determined by the scheduling and reservation periods. Users are encouraged to make reservations and prepay fees based on the published reference prices. If the actual electricity price exceeds the reference price at the time of reservation, users do not need to make any additional payments. Conversely, if the actual electricity price is lower than the reference price, the system automatically refunds the difference to the user. The mechanism’s workflow is illustrated in Figure 2, and its mathematical model is expressed in Equation (1).
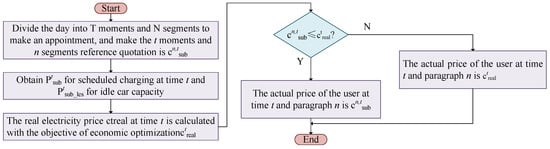
Figure 2.
Process flowchart of the DPRSRWAC mechanism.
In the equation, , , and represent the adjusted electricity price, actual electricity price, and reservation electricity price, respectively, under the multi-refund mechanism at time t. This mechanism adopts a “pay first, settle later” approach, optimizing real-time electricity prices based on actual EV electricity usage data to ensure system economic efficiency. The “difference refund” principle guarantees that reservation users do not pay more than the actual electricity price. This mechanism not only incentivizes reservations but also mitigates the risk of continuous electricity price increases.
2.3. Default Penalty Mechanism
To optimize scheduling, this paper designs a breach penalty mechanism [14]. The mechanism requires EV owners to connect their vehicles to the charging pile at least 15 min before the reserved time to prepare for charging/discharging. Failure to connect on time is considered a breach, with breach duration t categorized into three levels: minor, moderate, and severe. Minor breaches occur when the vehicle is not connected 15 min in advance; moderate breaches occur if the vehicle remains unconnected until 20% of the reservation period T has elapsed; severe breaches occur if the vehicle has not reached the charging pile by 50% of the reservation period T.
To reduce breach rates, the mechanism allows users to cancel one reservation unconditionally within 30 min of making it. Additionally, one hour before the reservation time, the system sends a reminder via SMS or app notification to help users fulfill their reservations on time [41]. Given the differences in load across time periods, breaches during peak periods have a greater impact on the system. Therefore, the penalty coefficient for peak-period breaches is set to 0.7, while that for non-peak periods is 0.5, meaning that breaches during peak periods incur higher penalties. The specific calculation method for breach penalties is shown in Equation (2):
In the equation, represents the breach penalty, , and are coefficients for different levels of breaches, and T is the time period coefficient.
2.4. Ticket-Grabbing Mechanism Design
To maximize resource utilization and optimize EV charging scheduling in the park, this paper designs a ticket-grabbing mechanism aimed at quickly filling vacant charging slots caused by reservation cancellations [42]. In the EV charging reservation system, charging station resources may be wasted when users cancel reservations or terminate charging prematurely. The ticket-grabbing mechanism addresses this issue through information transparency and rapid response, improving system efficiency and scheduling flexibility.
When a user cancels a reservation within one hour of the reserved time, the system immediately detects the vacant charging slot and disseminates its details, including the charging time slot, charging volume, and electricity price, to all park users through instant notification methods such as SMS and app push notifications. Other users can evaluate their vehicle needs and participate in ticket grabbing based on a first-come, first-served principle to secure the charging opportunity. The ticket price is determined according to predefined rules, as shown in Equation (21).
By leveraging information transparency and dynamic pricing strategies, the ticket-grabbing mechanism encourages users to promptly fill vacant slots when reservations are canceled, reducing idle time at charging stations and improving the operational efficiency of charging facilities. Additionally, this mechanism provides users with a flexible and cost-effective charging option, achieving the goal of maximizing system resource utilization.
3. DLRTS-DPRSRWAC Strategy
To balance the generation cost with the tracking rate of the surplus renewable energy generation curve from wind and solar for EV owners, this paper proposes a dual-layer real-time scheduling strategy for the generation side and EV charging and discharging, named the DLRTS-DPRSRWAC. This strategy aims to optimize the scheduling of EV charging and discharging times, park energy storage management, gas turbine (GT) startup and shutdown, and the purchasing behavior from the grid. It seeks to meet the electricity demand of park users, reduce generation costs, and improve the renewable energy utilization rate.
3.1. Detailed Explanation of the EV Real-Time Charging and Discharging
The EV real-time charging and discharging scheduling strategy comprises the following three key steps:
- (1)
- Analysis of User Behavior Determinism and Charging Preferences: By collecting and analyzing data such as the number of charging EVs, electricity prices, and time slots, the GMM is employed to identify user behavior patterns and charging preferences. This step provides data support for subsequent electricity price setting and the formulation of charging and discharging strategies.
- (2)
- Optimization of EV Charging and Discharging Scheduling: Based on the dual electricity price and no-refund mechanism, the Linear Programming (LP) method is used to optimize the scheduling of EV charging and discharging. By precisely controlling the charging and discharging times of EVs, the strategy ensures supply–demand balance while maximizing the utilization of renewable energy.
- (3)
- Setting of Reservation Prices and Ticket-Grabbing Prices: To fully utilize EV resources, the IOM is first employed to determine the appropriate range for reservation prices. Subsequently, with the goal of minimizing user charging costs, the PSO algorithm is used to calculate the optimal reservation prices and ticket-grabbing prices. Combined with penalty and ticket-grabbing mechanisms, the strategy further regulates user behavior, enhances the utilization efficiency of charging resources, and maximizes the economic benefits of the system. The workflow is illustrated in Figure 3.
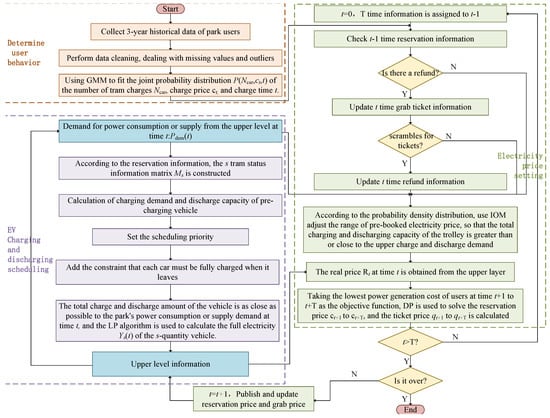 Figure 3. EV charging and discharging real-time scheduling strategy.
3.1.1. Modeling User Charging Behavior
To implement an effective scheduling strategy, it is necessary to clarify the relationship between user charging behavior, electricity price, and charging time in the park. Based on historical charging data, this study uses the GMM to fit the joint probability density distribution of the number of charging EVs, charging prices, and charging times.
The formula is as follows: , normal distribution; , weight of each component; , reservation electricity price at time t; and , number of EVs reserved at time t.
3.1.2. Optimization of EV Charging and Discharging Scheduling
The day is divided into T time slots. The core objective of EV charging and discharging scheduling is to precisely control the charging and discharging behavior of each EV during each time slot so that the total charging and discharging volume of all EVs closely matches the remaining power demand in the park at time t. At the same time, it ensures that each EV meets the user’s expected battery level upon departure.
The formula is as follows: , wind and solar power generation at time t; and , baseline load power of the park at time t.
3.1.3. Battery Aging Model and Owner Revenue Mechanism Under V2G
In the Vehicle-to-Grid (V2G) system, electric vehicle (EV) batteries provide services such as frequency regulation and peak shaving through frequent charging and discharging processes. However, this mode of operation inevitably accelerates battery aging, leading to capacity degradation and a shortened lifespan, thereby affecting the interests of vehicle owners. Therefore, developing an accurate battery aging model and designing a reasonable owner revenue mechanism is essential for mitigating battery degradation and encouraging vehicle owners to participate in V2G services.
- (1)
- Battery Aging Model
Battery aging primarily consists of cyclic aging and calendar aging. Cyclic aging occurs during the charge–discharge process and is closely associated with the depth of discharge (DOD), charge/discharge rates, and the number of cycles. Calendar aging, on the other hand, occurs during idle periods and is influenced by temperature and the state of charge (SOC). Under high-temperature or extreme SOC conditions, side reactions take place inside the battery, leading to capacity loss and increased internal resistance, accelerating battery degradation.
To quantify the battery aging process, this study adopts a battery aging model based on the Arrhenius equation. This model effectively describes the influence of temperature and time on the battery degradation rate. The mathematical expression is as follows:
where denotes the amount of battery capacity loss; A is a constant related to the material properties of the battery; t represents the operational or storage duration; z is the aging rate coefficient; E denotes the activation energy, reflecting the sensitivity of battery aging to temperature; R is the gas constant; and T represents the absolute temperature of the battery environment.
The model results indicate that the battery aging rate increases exponentially with rising temperature and prolonged time, with degradation being more pronounced under high-temperature and deep-discharge conditions. Therefore, optimizing the charge–discharge process and controlling the operating temperature and SOC range are effective strategies for mitigating battery aging. To meet grid frequency regulation requirements while minimizing battery aging rates, this study introduces the Model Predictive Control (MPC) method. MPC enables real-time prediction and dynamic adjustment of battery charge–discharge power based on battery status and grid demand, thereby extending battery life and optimizing the charge–discharge trajectory. The optimization objective function is expressed as
where and denote charging and discharging power, while and represent weighting coefficients aimed at balancing battery aging and grid frequency regulation demands. Additionally, to prevent overcharging or over-discharging, charge–discharge power and SOC must comply with the following constraints:
where represents the SOC at time t, and denote the safe SOC limits, represents the charge–discharge power, and and represent the allowable power limits. These constraints ensure that the battery operates within a safe range at all times, preventing high-rate charging and discharging from adversely affecting battery health, thereby extending battery lifespan.
- (2)
- Revenue Model and Owner Revenue Mechanism
Although optimized control strategies can reduce battery aging rates to a certain extent, completely avoiding battery degradation is impractical. Therefore, designing a reasonable owner revenue mechanism is crucial for incentivizing vehicle owners to participate in V2G services and compensating for battery degradation losses. The net revenue of vehicle owners during V2G operations is determined by the electricity selling price and the amount of electricity fed back to the grid, while the cost of battery degradation caused by discharging must also be incorporated into the revenue calculation. The cost of battery life degradation can be quantified by the following formula:
where represents the degradation cost of the battery at time t, is the amount of electricity discharged to the grid, and k denotes the degradation cost coefficient per unit of discharged electricity. The net revenue function for the vehicle owner can be expressed as
where represents the electricity selling price at time t. The system dynamically adjusts electricity prices to encourage discharging during peak price periods, thereby maximizing economic returns. The cumulative net revenue over the scheduling period is expressed as
This expression reflects the maximization of the owner’s net revenue over the scheduling period, balancing electricity sales income with battery degradation costs. By dynamically adjusting the electricity price and providing appropriate compensation, the system ensures that vehicle owners are incentivized to participate in V2G services, contributing to both economic benefits and battery health optimization.
To achieve the objective, a state matrix must be constructed for each vehicle. Assume the total number of EVs in the park is S, indexed from 1 to S. Based on the reservation charging information, the remaining battery capacity of each EV is known. At time t, each vehicle can be described by six states: 1. whether it supports V2G (a); 2. whether it is parked and connected to a charging station (b); 3. remaining parking time (c); 4. remaining battery energy (d); 5. remaining capacity (e); and 6. charging/discharging status (f). Here, a and b are binary variables 0/1; c represents the remaining parking time ; d and e denote the remaining battery energy and available capacity at time t, respectively; f takes values of 1, 0, or −1, indicating charging, idle, or discharging status, respectively. The state of an EV throughout the day is represented by a 5 × T matrix . At time t, the renewable energy capacity that can be absorbed and the energy available for renewable energy supplementation can be expressed using Equation (11):
Once the charging demand for each vehicle is determined, its charging rate must be calculated, and constraints must be set to ensure that the charging and discharging behavior of each vehicle remains within the allowable limits of battery capacity, charging/discharging rate, and minimum discharging threshold. Additionally, it is necessary to ensure that each vehicle meets its charging requirements before departure. Next, the charging order of vehicles is determined by calculating their priorities. Vehicles with higher priority typically have lower battery levels and shorter remaining parking times, thus requiring immediate charging. Based on the total charging and discharging amount initially calculated by , the charging and discharging behavior of the vehicles is adjusted accordingly. If the total charging amount is too high, the charging amount of low-priority vehicles is appropriately reduced, or some vehicles are instructed to discharge. If the total charging amount is insufficient, the charging rate of high-priority vehicles is increased. The relevant formula is shown in Equation (12):
In the formula, is the amount of electricity a vehicle needs to charge before departure, determined by the user’s required battery level and the current battery level .
The desired charging rate of vehicle s at time t is denoted as . The priority of vehicle s, represented by , is determined by its charging demand and remaining parking time. Higher-priority vehicles typically have shorter remaining parking times and lower battery levels, indicating a more urgent need for charging. The weight coefficient adjusts the influence of priority. The denominator of the Sigmoid function, , represents the influence of whether the vehicle is connected to a charging station. Finally, denotes the amount of electricity that vehicle s needs to charge or discharge at time t.
After completing the above preparations, the charging and discharging behavior of EVs can be adjusted. When the total charging amount exceeds the upper demand , adjustment is made using Equation (13); otherwise, Equation (14) is applied.
In the equation, and are adjustment coefficients for the vehicles. Adjusting ensures that vehicles with lower priority have larger adjustment amounts, while adjusting makes the vehicles with higher priority experience more significant changes, thereby obtaining more charging resources. To accurately calculate the optimal charging and discharging behavior for each vehicle, this study uses the Linear Programming (LP) algorithm to solve the problem. The objective function is defined by Equation (19), and the constraints are given by Equation (20).
3.1.4. Setting of the Next Moment’s Reservation Electricity Price and Ticket-Grabbing Price
The central idea of the system strategy is to guide the charging and discharging behavior of EVs through pricing, making it very important to reasonably set the reservation electricity price and ticket-grabbing price. To ensure the full utilization of EV resources, it is first necessary to determine an appropriate range for the reservation electricity price to meet the following conditions:
- (1)
- When represents surplus upper-level power, EV charging is required. The objective is to adjust the price such that absorbs as much surplus power as possible; if this cannot be achieved, the aim is to bring it as close as possible to .
- (2)
- When represents insufficient upper-level power, EV discharging is required. The objective is to adjust the price so that absorbs as much surplus power as possible; if this cannot be achieved, the aim is to bring as close as possible to .
In order to meet the above requirements, the value range of is determined using the IOM according to Equation (15). At the same time, considering user satisfaction and rationality, the three mechanisms mentioned earlier are introduced. The objective is to minimize the total daily charging cost for users, taking into account the impacts of reservation electricity prices and ticket-buying prices, while simultaneously meeting the users’ electricity demand. A PSO algorithm is employed to solve for the optimal reservation electricity price and ticket-buying price within the range of . The objective function , ticket-buying price , and state transition equation are given by Equation (21), with the constraint condition defined by Equation (22).
3.2. Real-Time Dispatch Strategy for Charging and Discharging on the Generation Side
When the power generation from renewable energy sources, after being scheduled through EV charging and discharging, is still unable to meet the load demand of the park, or when there is an excess supply of renewable energy, further dispatching of generation-side resources such as batteries, gas turbines (GTs), and purchasing electricity from the grid is required to optimize the operational costs on the generation side.
The dispatch of the generation side is implemented by controlling the behavior and real-time status of the equipment. First, a state matrix for key equipment on the generation side is defined, with the objective of minimizing the total cost of the generation side over the scheduling period T. A dynamic programming (DP) approach is used to solve for the optimal parameter combination of the state matrix, determining the operating mode of each device at every moment. After the optimization is completed, the real supply cost of electricity to the park at time t is calculated based on the dispatch results, and the real electricity price is set accordingly, ensuring that the generation side operates without losses while reasonably distributing costs. The logical structure of the real-time dispatch strategy for charging and discharging on the generation side is shown in Figure 4.
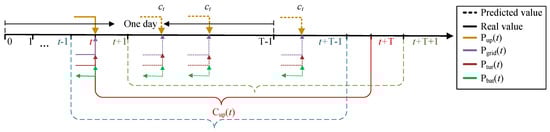
Figure 4.
Real-time Scheduling Diagram for Charging and Discharging on the Generation Side.
3.2.1. Definition of the State Matrix
The state of the battery, gas turbine (GT), and electricity purchasing behavior at each time step can be represented by two types of information: the operational state k and the operating duration w. Thus, three 2-row, T-column state information matrices, , , and , can be defined using Equation (16):
3.2.2. Real-Time Dispatch on the Generation Side
This paper aims to minimize the total cost of the generation side throughout the day. A dynamic programming (DP) approach is used to solve for the dispatch results from time t to t + T-1, and the results are updated continuously over time. The objective function is given by Equation (23), and the constraint conditions are provided in Equations (25) and (26).
3.2.3. Setting the Real Electricity Price
The expression for the real electricity price is given by Equation (17):
where and represent the solved EV charging cost at time t and the upper-level cost, respectively.
The purpose of setting the real electricity price in this way is not only to prevent continuous increases in electricity prices but also to minimize the actual charging cost for EV users, thereby improving user satisfaction while ensuring that the park does not incur losses.
4. DLRTS-DPRSRWAC Model
4.1. System Modeling
There has been extensive research on system modeling related to this topic, as discussed in references [43,44,45,46,47,48], and will not be elaborated here. This paper provides only the modeling of EV battery charging and discharging with a focus on setting the EV charging and discharging priority, as shown in Equation (18):
In the equation, the charging power at time t, , and the discharging power at time t, , represent the charging and discharging power, respectively. The change in state of charge, , denotes the state of charge (SOC). The battery capacity is represented by (Ah). The charging efficiency and discharging efficiency are denoted by and , respectively. The state of health at time t, , indicates the state of health (SOH), and the battery health degradation rate is represented by (%/h). The maximum output power of the battery is (kW), and the maximum output power of the charging pile is (kW). The load demand power at time t is . The initial state of charge is . The charging power function, , is dynamically adjusted according to SOC, and the temperature influence function, , is used to adjust the discharging power.
4.2. Objective Function and Constraints
According to the strategy classification in Section 2, this paper has three optimization objectives: adjusting the EV charging and discharging behavior to closely match the surplus generation curve of the power generation side; setting the reservation electricity price and ticket-buying price to minimize user charging costs within a reasonable range; and scheduling the operation states and behaviors of the generation-side equipment to minimize the total generation cost.
4.2.1. Optimization of EV Charging and Discharging Scheduling
For the optimization of EV charging and discharging behavior, this paper first prioritizes meeting the power generation side’s demand from the park. Using the LP algorithm, the state of each EV from time t to t + T-1 is solved to achieve real-time scheduling of the EV charging and discharging behavior within the park. The objective function for this process is shown in Equation (19), and the constraints are described in Equation (20):
Specifically, the four core constraints cover the following: each EV must achieve the expected charge level upon departure; the battery capacity of each EV must remain between the physical upper and lower limits; the charging and discharging rates of each EV must not exceed its capability range; and the charging/discharging power must not exceed the maximum power of the charging pile.
4.2.2. Setting the Reservation Electricity Price and Ticket-Buying Price
Based on the scheduling results at time t, the electricity price at time t + 1 is set within a reasonable range using the IOM, with the objective of minimizing the total charging cost for all EVs. The PSO algorithm is used to solve for the reservation electricity price and ticket-buying price from time t to t + T. The objective function , ticket-buying price , and state transition equation are given by Equation (21), with the constraint conditions defined by Equation (22):
In the equations, is the number of ticket purchases, is the ticket-buying price coefficient, and is the expected number of EVs charging at time t.
4.2.3. Real-Time Scheduling on the Generation Side
The real-time scheduling strategy for the generation side aims to minimize the generation cost. A dynamic programming (DP) algorithm is used to solve the state matrix parameters of the generation side for the time interval from t to t + T-1, enabling real-time scheduling of all devices and actions on the generation side. The objective function is defined in Equation (23):
In the equation, , , and represent the unit costs of power generation by the gas turbine (GT), electricity purchased from the grid, battery discharging, and battery charging, respectively. is the step function. The cost of battery discharging is generally higher than that of charging, depending on the battery’s lifespan and the charging/discharging cycle. The expression is provided in Equation (24):
In the equation, and represent the battery’s charging and discharging lifespans in hours; and are the time in hours required for one full charging-and-discharging cycle; and are the number of charge and discharge cycles; is the battery efficiency; is the fixed maintenance cost (CNY); and and are the maintenance costs per unit time for charging and discharging (CNY). The power balance constraint between the generation side and the EV charging side is given by Equation (25), where is the remaining charging and discharging power of the generation side at time t. Other constraints are specified in Equation (26):
In the equation, , , and are the lower limits for battery capacity, GT startup, and GT shutdown, respectively; , , and are the upper limits for battery capacity, battery power, and GT output, respectively; and , , and correspond to the priority levels for purchasing electricity, GT generation, and battery charging and discharging. The six constraints represent the following: battery capacity constraints, battery power constraints, GT startup constraints, GT shutdown constraints, GT output constraints, and priority constraints.
4.3. Related Evaluation Indicators
This paper selects five evaluation indicators for the scheduling results: the total generation cost for the generation side over one day, the total charging cost for EVs, the tracking rate of the EV charging and discharging curve at time t, the renewable energy abandonment rate throughout the day, and the electricity purchase rate , as shown in Equation (27):
In the equation, and represent the total wind and photovoltaic output available to the park at time t; and is the actual cost of purchasing electricity at time t.
5. Case Study Analysis
5.1. Simulation Method and Case Data Description
This paper uses the Python 3.11 platform to complete the joint probability density fitting and solve the DP and IOM models; the PSO and LP solutions are based on the Matlab R2020a platform. The simulation data are sourced from an industrial park in Northwest China between 2021 and 2023, covering the electricity consumption data of 318 EV users and the park’s load demand data. Additionally, a survey was conducted with 96 EV users in the park regarding their attitudes toward V2G Vehicle-to-Grid, commissioned by the park’s management. Among them, only 27 users declined to support V2G due to concerns about damaging the EV battery’s lifespan. Based on this, the support rate for V2G among the park’s EV users is set at 72%. The renewable energy system in the industrial park consists of wind turbines and photovoltaic (PV) panels, with a total installed capacity of 4920 kW. Wind turbines account for approximately 53% of the total renewable energy capacity and are located in an open area 3 km north of the main load center. PV panels make up around 47% and are distributed across the rooftops of buildings within the park. The charging stations are equipped with bidirectional charging and metering devices, capable of accurately measuring energy flow to facilitate charging fees, refunds, and penalties.
The system operates based on the real-time data collection of charging loads and energy states by smart meters, which transmit the data to the central scheduling platform via low-latency communication. The scheduling platform dynamically adjusts electricity prices and charging reservation strategies while ensuring system security and user privacy through identity verification and data encryption. The energy storage system is equipped with a Battery Management System (BMS) and Power Conditioning System (PCS), which interact with the scheduling platform to further balance loads and renewable energy output. Additionally, the gas turbine controller features remote monitoring and dynamic adjustment functions, enabling operation adjustments based on real-time load demands and wind/PV output, thereby enhancing system flexibility and stability.
To maximize the consumption of wind and solar power, the model proactively attracts more EVs for charging when high wind or PV generation is predicted, reducing renewable energy curtailment. Users can reserve charging slots through the reservation mechanism, charging during peak wind and solar generation periods (such as early morning, afternoon, and evening to nighttime), storing surplus energy in EVs. The PV and wind systems regularly report generation output to the scheduling platform, ensuring precise matching between EV loads and renewable energy output.
This strategy significantly improves the utilization efficiency of wind and solar energy, reducing the wind curtailment rate by 19.3%. The results indicate that further optimization of battery storage configurations and real-time electricity price signals can facilitate more efficient integration of renewable energy and minimize unnecessary energy waste. The detailed equipment parameters are provided in Table 1 [49].

Table 1.
Equipment parameters in industrial parks.
5.2. User Behavior Analysis
Based on the historical data provided by the industrial park from 2021 to 2023, this paper presents a three-dimensional distribution plot of time, electricity price, and the number of vehicles charging as shown in Figure 5a. The joint probability density distribution of these three variables is calculated using the GMM, as given in Equation (28):
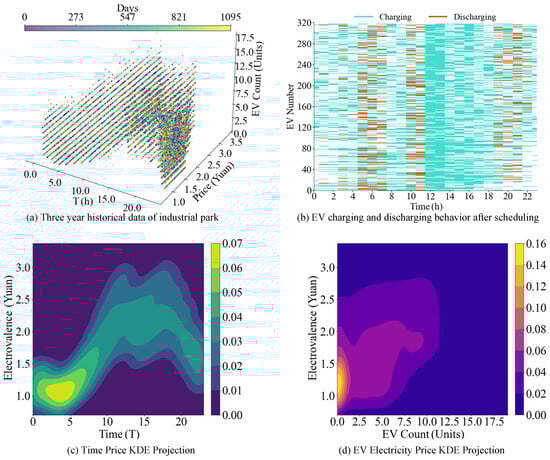
Figure 5.
User behavior analysis diagram.
To facilitate the analysis and presentation of the time–price probability density and the EV–price probability density relationship, Kernel Density Estimation (KDE) projections were performed, with the results shown in Figure 5c,d. Figure 5c reveals the dependency between the charging behavior of park users and the electricity price during different time periods. As time progresses, the electricity price exhibits significant fluctuations. During the early hours (0:00–5:00), the price remains relatively stable in the lower range. This phenomenon aligns with the ‘price-sensitive’ hypothesis, as the park’s electricity demand is lower during this period, and supply is sufficient, leading to relatively favorable prices. Therefore, by appropriately lowering the reservation price at night, more users can be attracted to schedule their charging during nighttime, thus achieving a better balance between the park’s load supply and renewable energy consumption.
Figure 5d further reveals the relationship between the number of vehicles and the electricity price. When the electricity price is in the range of CNY 1.0–1.5, the number of charging vehicles peaks. As the price increases, the number of charging vehicles significantly decreases, especially when the price exceeds CNY 2.5, where the number of vehicles charging drops sharply. This indicates that users tend to make more cautious choices when facing higher electricity prices. In summary, by utilizing the “demand shifting” behavior of users, charging prices can be controlled at around CNY 1 when renewable energy consumption is needed. Additionally, further reducing the price for nighttime charging can encourage more users to charge at night and discharge during the period between the 5:00 and 10:00.
Figure 5b shows the charging and discharging behavior of 318 EVs in the park after scheduling with the DLRTS-DPRSRWAC mechanism strategy. Regarding charging behavior, EVs concentrate their charging between 12:00 and 14:00 due to the significant increase in wind and solar generation during this period. The system effectively absorbs surplus renewable energy by guiding vehicles to charge during this time. Meanwhile, the charging behavior between 16:00 and 18:00 is mainly driven by users charging after returning home from work. As for discharging behavior, more vehicles discharge between 6:00 and 8:00, 10:00 and 12:00, and 18:00 and 22:00, as these periods experience an increase in load demand while renewable energy generation is insufficient, requiring vehicles to discharge and supplement the energy gap.
In conclusion, the DLRTS-DPRSRWAC scheduling strategy fully integrates and utilizes user behavior patterns. The scheduling results are reasonable and effectively optimize the load distribution and renewable energy absorption within the park.
5.3. Scheduling Results Analysis
After scheduling optimization, the real-time total charging and discharging power of EVs and batteries, the real-time power of the gas turbine (GT), and the electricity purchase power from the grid were measured and are shown in Figure 6a; a comparison of EV charging and discharging power before and after scheduling is shown in Figure 6.
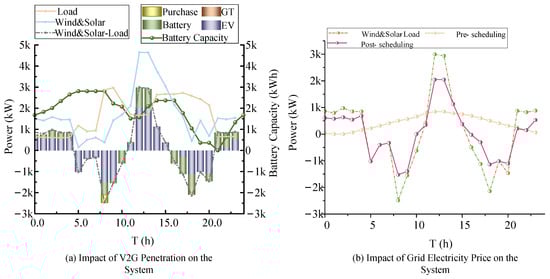
Figure 6.
Scheduling effect diagram.
As seen in Figure 6a, the four types of power supply behaviors—EV charging and discharging, battery charging and discharging, GT generation, and grid electricity purchase—dynamically combine their power outputs to always meet the park’s real-time load demand. This indicates that the scheduling strategy can effectively coordinate multiple energy supply pathways, ensuring a real-time balance between energy supply and demand within the park. Notably, the initial and final battery charge levels remain consistent, indicating that the battery achieves a dynamic balance of charging and discharging throughout the day. This balancing characteristic ensures system stability during long-term operation.
From Figure 6b, it can be observed that the EV charging and discharging power curve after optimization is closely aligned with the generation-side demand curve of the park, especially during the early morning hours between 4:00 and 5:00, where the two curves almost completely coincide, significantly improving the renewable energy absorption capacity. Compared to the pre-scheduling case, the EV charging and discharging curve now more closely follows the trends of wind and solar power generation output and the park’s load fluctuations. This optimization effectively achieves peak shaving and valley filling, reducing electricity purchase demands during high-load periods while maximizing the utilization of renewable energy.
In summary, after the DLRTS-DPRSRWAC scheduling strategy optimization, the park has seen significant improvements in renewable energy consumption and load response capability. This result not only validates the applicability and effectiveness of the scheduling strategy in complex energy management scenarios but also provides practical support for the park’s economic and sustainable development.
Table 2 compares five key indicators of the system before and after scheduling over the course of one day: total generation-side cost, total EV charging cost, EV charging and discharging tracking rate, renewable energy abandonment rate, and the park’s electricity purchase rate. The results show that after scheduling optimization, the overall performance of the system improved significantly.
Table 2.
Comparison of results before and after scheduling.
First, the total system cost and the total EV charging cost decreased by 8.0% and 33.1%, respectively, indicating that the scheduling strategy was highly effective in reducing operating costs, especially in optimizing EV charging costs. By introducing a dual electricity pricing mechanism, the system not only achieves economic optimization but also further protects the economic interests of EV users. The EV charging and discharging tracking rate increased by 53%, suggesting that the scheduling strategy significantly enhanced the system’s response to renewable energy output, making the EV charging and discharging behavior more aligned with the park’s surplus power curve.
Meanwhile, the renewable energy abandonment rate decreased by 19.3%, indicating that the system can more efficiently utilize renewable energy after scheduling, reducing waste and further improving the park’s energy utilization efficiency. The electricity purchase rate dropped by 21.4%, reflecting a significant reduction in the system’s reliance on the external grid after optimization, demonstrating the system’s ability to meet the park’s electricity demand through internal resource scheduling.
Quantifying the potential environmental benefits of the scheduling mechanism involves assessing emissions. A comparison was conducted to analyze the change in the industrial park’s average daily grid electricity purchase before and after the implementation of the proposed strategy. Based on the typical regional grid emission factor (0.4326 kg /kWh), the reduction in electricity purchases by 21.4% corresponds to an approximate daily decrease of 4331.95 kg of emissions (calculated using the park’s typical daily load of 46,793.34 kWh as a baseline). Furthermore, by reducing wind and solar curtailment by 19.3%, renewable resources such as wind and solar energy are more effectively utilized, thereby avoiding additional emissions associated with fossil-fuel-based backup power generation. Although these results are preliminary, they underscore the significant ecological benefits of the proposed scheduling strategy and highlight its potential to promote more sustainable energy consumption patterns.
Although the scheduling optimization reduced the total cost, the reduction in total costs (8.0%) was not as significant as the reduction in EV charging costs (33.1%) due to the need to compensate for the difference between the reserved electricity price and the actual electricity price under the dual pricing mechanism. This also reflects the park’s “moderate sacrifice” of some economic benefits in order to enhance user satisfaction. By lowering user charging costs, the system effectively incentivized users to participate in reserved charging, thus improving the utilization rate of renewable energy output and increasing user participation. This strategy not only satisfies user interests but also reflects a focus on humanistic care in line with current trends promoting sustainable development and user experience.
Overall, all indicators after scheduling optimization perform better than before, fully validating the effectiveness and feasibility of the dual pricing mechanism and real-time scheduling strategy in optimizing energy management within the park.
5.4. Sensitivity Analysis
This paper further analyzes the impact of V2G penetration and grid electricity prices on five system performance indicators: total generation-side cost, total EV charging cost, EV charge–discharge tracking rate, renewable energy curtailment rate, and electricity purchase rate. Figure 7a illustrates the changing trends of these five indicators as the V2G penetration rate increases from 0% to 100%. Figure 7b shows the system’s response to these indicators as the grid electricity price varies from 0.2 times to 2.5 times the baseline price.
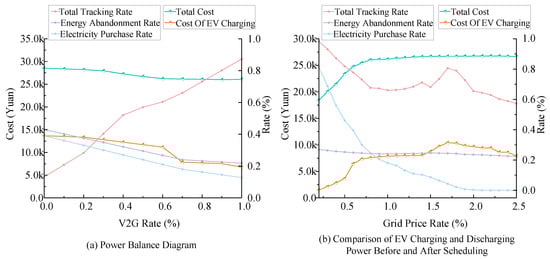
Figure 7.
Impact of V2G penetration and electricity prices on the system.
5.4.1. Impact of V2G Penetration
As shown in Figure 7a, with the increase in V2G penetration, both the system operation cost and the EV charging cost gradually decrease. As the V2G penetration rises from 0% to 100%, the total generation cost decreases from CNY 28,501 to CNY 26,150, while the EV charging cost drops from CNY 13,104 to CNY 8754. This indicates that under the V2G model, electric vehicles not only act as loads to absorb renewable energy but also discharge to the grid to generate profits, significantly reducing both the system’s operation cost and the EV charging cost.
Simultaneously, both the renewable energy curtailment rate and electricity purchase rate decrease as the V2G penetration rate increases, with particularly notable reductions when the penetration exceeds 20%. This demonstrates that the system can utilize renewable energy more efficiently and reduce its reliance on grid electricity at higher V2G penetration levels. Additionally, the total EV charge–discharge tracking rate initially increases and then decreases, with a significant improvement observed in the 20–70% penetration range. This suggests that the system’s responsiveness to renewable energy output is optimally improved within this range.
From the sensitivity analysis results, the 20–70% V2G penetration range has the most significant impact on the system. In this range, system cost reduction and renewable energy utilization show the greatest improvements, highlighting the optimization potential of V2G at this level of penetration. When penetration exceeds 70%, the system’s scheduling capability for EV charge–discharge behavior is further enhanced, and renewable energy utilization efficiency approaches its optimal level. Therefore, policies and user education should actively encourage more EV users to enable V2G functionality, particularly aiming to increase the proportion of V2G-compatible EVs to over 70%, to maximize system benefits.
The analysis results show that the V2G model not only significantly reduces system operating costs but also enhances the utilization of renewable energy, creating a win–win scenario for overall energy management in the park and for optimizing EV user charging costs. Through well-designed incentive policies and guided user behavior, the park can achieve more efficient energy management, reduce operating costs, and improve user satisfaction simultaneously.
5.4.2. Analysis of the Impact of Grid Electricity Prices
As shown in Figure 7b, there is a positive correlation between the gradual increase in grid electricity prices and the growth of total system costs, while the electricity purchase rate exhibits a decreasing trend. Specifically, when the grid electricity price increases to twice its original level, the growth rate of total system costs begins to slow; when the price reaches 2.3 times the original level, total system costs stabilize. This phenomenon indicates that as grid electricity prices rise, the park gradually reduces its reliance on grid power and increasingly favors power generation using gas turbines. Particularly at high grid electricity prices, the economic feasibility of purchasing electricity diminishes significantly, and gas turbine generation progressively replaces grid electricity purchases. The park’s system demonstrates strong self-sufficiency and independent operational characteristics under these conditions.
Further analysis from the perspectives of total EV charging costs and the EV charge–discharge tracking rate reveals that when grid electricity prices are low, park users show limited enthusiasm for scheduled charging, resulting in a low EV charging tracking rate. However, as grid electricity prices rise to 0.7 times the original level, the economic benefits of charging within the park increase significantly, leading to a sharp rise in users’ willingness to schedule charging. This, in turn, aligns EV charge–discharge behavior more closely with the park’s energy demands. As grid electricity prices continue to rise, the increasing cost of external charging further incentivizes EV users to charge within the park. When the grid price reaches approximately twice the original level, the demand for EV charging within the park is greatly stimulated. This growth in demand effectively supports the park’s EV charging scheduling, resulting in reduced charging costs for EV users despite high electricity prices. This outcome further validates the feasibility and effectiveness of the DLRTS-DPRSRWAC scheduling strategy.
However, when grid electricity prices are excessively low (below 0.3 times the original level), the park’s electricity price, constrained by the requirement not to exceed grid prices, severely limits the effectiveness of the scheduling mechanism, rendering it nearly ineffective. This suggests that excessively low grid electricity prices weaken the system’s ability to regulate user charging behavior, leading to a significant reduction in the performance of the scheduling strategy. Therefore, while the DLRTS-DPRSRWAC scheduling strategy excels in enhancing system benefits and user satisfaction, its effectiveness is somewhat dependent on maintaining a reasonable level of grid electricity prices.
In summary, the DLRTS-DPRSRWAC scheduling strategy demonstrates excellent regulatory performance under higher grid electricity prices, effectively guiding user charging behavior within the park and improving the system’s autonomous operational capabilities. However, when grid electricity prices are too low, the effectiveness of the scheduling strategy is substantially diminished. Thus, maintaining reasonable grid electricity price levels is crucial for ensuring the successful implementation of the scheduling strategy.
6. Conclusions
This paper innovatively proposes a strategy called the dual-layer real-time scheduling strategy for EV charging and discharging in a microgrid park based on the “Dual Electricity Price Reservation—Surplus Refund Without Additional Charges Mechanism” (DLRTS-DPRSRWAC), aimed at optimizing the charging and discharging behavior of electric vehicles (EVs) in the park and improving the efficiency of renewable energy utilization. By precisely controlling EV charging and discharging, managing generation-side equipment, and reasonably setting reservation prices and ticket mechanisms, the proposed strategy achieved real-time and efficient energy supply–demand balance within the park, significantly reducing total system operating costs while enhancing the user charging experience.
Through simulations and analysis based on real-world case studies, the following key conclusions are drawn:
- 1.
- Improved Operational Efficiency and Economic Performance
Implementing the DLRTS-DPRSRWAC scheduling strategy significantly improves the park’s overall operational efficiency and economic performance. The strategy not only reduces the park’s total costs, with EV charging costs decreasing by 33.1%, but also enhances system economics through a rational dual-tariff mechanism and scheduling optimization, ensuring that users benefit economically while maintaining system efficiency. Moreover, the strategy effectively schedules EV charging/discharging and generation-side equipment, improving renewable energy utilization by reducing the curtailment rate by 19.3% and decreasing dependency on the external grid with a 21.4% drop in electricity purchase rates, showcasing the enhanced self-sufficiency of the system.
- 2.
- Impact of V2G Penetration
As Vehicle-to-Grid (V2G) penetration increases, total system costs and EV charging costs further decrease. This indicates that at higher penetration levels, EVs not only consume more renewable energy but also discharge power to supply the system, significantly enhancing overall system stability and economic benefits. Therefore, increasing V2G penetration is a critical factor for achieving optimized park operation.
- 3.
- Influence of Grid Electricity Prices
Grid electricity prices have a significant impact on the effectiveness of the scheduling strategy. When grid electricity prices are too low, the effectiveness of the scheduling strategy weakens, and the system struggles to regulate user behavior effectively. As grid prices rise, the park increasingly reduces reliance on grid electricity and shifts towards gas turbine generation, demonstrating greater self-sufficiency in power supply. Higher grid prices also effectively encourage EV users to charge within the park, optimizing the scheduling process. Thus, maintaining reasonable grid electricity price levels is crucial to the successful implementation of the scheduling strategy.
In the future, advancements in high-capacity battery technology, grid flexibility, and real-time data analysis will significantly optimize scheduling strategies, providing smarter and more efficient energy management solutions for industrial parks. Next-generation batteries with high energy density and fast charging capabilities will enhance the system’s ability to manage wind and solar fluctuations, enabling peak shaving and deep discharging without compromising battery life, thereby increasing renewable energy penetration. The development of smart grids—such as automated demand response, self-healing networks, and blockchain energy trading—offers new opportunities for scheduling expansion. Blockchain smart contracts can ensure transparency and reliability in EV charging and discharging transactions, while AI-based grid control systems dynamically adjust electricity prices. Although the proposed scheduling strategy has significantly reduced wind and solar curtailment, limitations in battery capacity, grid flexibility, and data analysis accuracy still hinder large-scale renewable energy integration. Additionally, user acceptance of Vehicle-to-Grid (V2G) technology and uncertainties in user behavior pose challenges to stable system scheduling. Future research will focus on dynamic pricing mechanism optimization, high-capacity batteries, self-healing grids, and the application of blockchain and AI in power scheduling. Continuous strategy refinement will improve the system’s responsiveness to renewable energy fluctuations, lower costs, reduce environmental impact, and enhance reliability, providing more efficient, reliable, and sustainable energy management solutions for industrial parks.
Author Contributions
Conceptualization, L.S. and C.X.; methodology, L.S. and C.X.; software, Y.D. and G.Z.; validation, L.S., C.X. and Y.G.; formal analysis, L.S.; investigation, L.S., C.X. and Y.G.; resources, Y.G.; data curation, C.X., Y.D. and J.L.; writing—original draft preparation, L.S.; writing—review and editing, L.S., Y.D. and G.Z.; visualization, J.L. and Y.D.; supervision, L.S. and J.L.; project administration, L.S. and J.L.; funding acquisition, L.S. and C.X. All authors have read and agreed to the published version of the manuscript.
Funding
This This research was funded by The Key Research and Development Program of the Xinjiang Uygur Autonomous Region (2022B01016).
Data Availability Statement
Data are contained within the article.
Conflicts of Interest
Author Jixun Liu was employed by the company Xinjiang Fukang Pumped Storage Co., Ltd. The remaining authors declare that the research was conducted in the absence of any commercial or financial relationships that could be construed as a potential conflict of interest.
Abbreviations
The following abbreviations are used in this manuscript:
| EV | Electric Vehicle |
| V2G | Vehicle-to-Grid |
| DSM | Demand Side Management |
| VPP | Virtual Power Plants |
| GMM | Gaussian Mixture Model |
| IOM | Interval Optimization Method |
| PSO | Particle Swarm Optimization |
| LP | Linear Programming |
| DP | Dynamic Programming |
| GT | Gas Turbine |
| DPRSRWAC | Dual Electricity Price Reservation—Surplus Refund Without Additional Charges Mechanism |
| DPR | Dual Price Reservation |
| SRWAC | Surplus Refund Without Additional Charges |
| DLRTS-DPRSRWAC | Dual-Layer Real-Time Scheduling Strategy for EV Charging and Discharging in a Microgrid Park Based on the “Dual Electricity Price Reservation—Surplus Refund Without Additional Charges Mechanism” |
| DOD | Depth of Discharge |
| SOC | State of Charge |
| MPC | Model Predictive Control |
| PV | Photovoltaic |
| BMS | Battery Management System |
| PCS | Power Conditioning System |
| KDE | Kernel Density Estimation |
| AI | Artificial Intelligence |
| SMS | Short Message Service |
| CNY | Chinese Yuan |
| KDE | Kernel Density Estimation |
References
- Jiang, H.; Du, E.; Zhang, N.; Zhuo, Z.; Wang, P.; Wang, Z.; Zhang, Y. Renewable Electric Energy System Planning Considering Seasonal Electricity Imbalance Risk. IEEE Trans. Power Syst. 2023, 38, 5432–5444. [Google Scholar] [CrossRef]
- Sun, X.; Zhou, B.; Zheng, T.; Wei, W.; Tian, Y.; Pan, L. Analysis of New Energy Accommodation Capacity of Regional Power Grid with Energy Storage Based on Improved Typical Daily Method. In Proceedings of the 2022 7th Asia Conference on Power and Electrical Engineering (ACPEE), Hangzhou, China, 15–17 April 2022; pp. 331–336. [Google Scholar]
- Lin, K.; Lu, X.; Wu, F.; Shi, L. Evaluation of the Renewable Energy Accommodation Capacity in the Regional Power Grid. In Proceedings of the 2020 12th IEEE PES Asia-Pacific Power and Energy Engineering Conference (APPEEC), Nanjing, China, 20–23 September 2020; pp. 1–4. [Google Scholar]
- Zhang, Y.; Chen, Z.; Zhao, Q.; Zhang, Y. Study on the Accommodation Ability and Development Demand with High Proportion Renewable Energy Integrated into Grid in China. In Proceedings of the 2020 IEEE Sustainable Power and Energy Conference (iSPEC), Chengdu, China, 23–25 November 2020; pp. 559–564. [Google Scholar]
- Yan, Q.; Zhang, B.; Kezunovic, M. Optimized Operational Cost Reduction for an EV Charging Station Integrated With Battery Energy Storage and PV Generation. IEEE Trans. Smart Grid 2019, 10, 2096–2106. [Google Scholar] [CrossRef]
- Oladigbolu, J.; Mujeeb, A.; Li, L. Optimization and energy management strategies, challenges, advances, and prospects in electric vehicles and their charging infrastructures: A comprehensive review. Comput. Electr. Eng. 2024, 120, 109842. [Google Scholar] [CrossRef]
- Wei, Y.; Huang, H.; Han, X.; Lu, L.; Ouyang, M.; Pang, K.; Qin, Y. Whole-system Potential and Benefit of Energy Storage by Vehicle-to-grid (V2G) under Carbon Neutrality Target in China. In Proceedings of the 2022 IEEE 5th International Electrical and Energy Conference (CIEEC), Nangjing, China, 27–29 May 2022; pp. 4006–4012. [Google Scholar]
- Qazi, A.; Hussain, F.; Rahim, N.A.B.; Hardaker, G.; Alghazzawi, D.; Shaban, K.; Haruna, K. Towards Sustainable Energy: A Systematic Review of Renewable Energy Sources, Technologies, and Public Opinions. IEEE Access 2019, 7, 63837–63851. [Google Scholar] [CrossRef]
- Chaudhari, K.; Ukil, A.; Kollimalla, S.K.; Manandhar, U. Energy storage management for EV charging stations: Comparison between uncoordinated and statistical charging loads. In Proceedings of the IECON 2016—42nd Annual Conference of the IEEE Industrial Electronics Society, Florence, Italy, 23–26 October 2016; pp. 4109–4114. [Google Scholar]
- Gunes, F.; Zehir, M.A. Development of a Vehicle-to-Grid (V2G) Energy Management System to Mitigate Local Operational Challenges in Low Voltage Distribution Networks with Photovoltaics. In Proceedings of the 2022 4th Global Power, Energy and Communication Conference (GPECOM), Nevsehir, Turkey, 14–17 June 2022; pp. 389–394. [Google Scholar]
- Asghar, R.; Sulaiman, M.H.; Mustaffa, Z.; Ali, Z.; Ullah, Z. Integration of electric vehicles in smart grids: A review of the advantages and challenges of vehicle-to-grid technology. In Proceedings of the 2022 International Conference on IT and Industrial Technologies (ICIT), Chiniot, Pakistan, 3–4 October 2022; pp. 1–7. [Google Scholar]
- Chauhan, B.; Jain, S.K. Scheduling of Electric Vehicle’s Power in V2G and G2V Modes Using an Improved Charge–Discharge Opportunity-Based Approach. IEEE Trans. Transp. Electrif. 2024, 10, 811–822. [Google Scholar] [CrossRef]
- Chen, K.; Niu, Y. Real-Time Scheduling Strategy for Electric Vehicles Based on V2G Technology. Power Syst. Prot. Control 2019, 47, 1–9. [Google Scholar]
- Li, C.; Xu, M.; Cai, S. Two-Stage Optimal Scheduling Strategy for Microgrids Considering Uncertainty of EV Default. Trans. China Electrotech. Soc. 2023, 38, 1838–1851. [Google Scholar]
- Yan, R.; Wang, D.; Wang, X. A V2G Charging and Discharging Control Strategy for EVs Based on the Demands of the Grid and Users. In Proceedings of the 2023 International Conference on Power System Technology (PowerCon), Jinan, China, 21–22 September 2023; pp. 1–4. [Google Scholar]
- Zhang, L.; Sun, C.; Cai, G.; Koh, L.H. Charging and discharging optimization strategy for electric vehicles considering elasticity demand response. eTransportation 2023, 18, 100262. [Google Scholar] [CrossRef]
- Li, C.; Cai, S.; Xu, M. Reservation-Default Charging Mechanism and Optimal Decision Model for Electric Taxis. Power Syst. Technol. 2022, 46, 4444–4455. [Google Scholar]
- Zang, Y.; Cui, J.; Wang, S.; Zhao, Y.; Ge, W.; Li, C. Low-carbon economic optimization strategy for industrial loads in parks considering source-load-price multivariate uncertainty. Electr. Power Syst. Res. 2025, 239, 111200. [Google Scholar] [CrossRef]
- Guo, W.; Wang, Q.; Liu, H.; Atchike Desire, W. Multi-energy collaborative optimization of park integrated energy system considering carbon emission and demand response. Energy Rep. 2023, 9, 3683–3694. [Google Scholar] [CrossRef]
- Aguirre-Cipe, I.; López, R.; Mallea-Zepeda, E.; Vásquez, L. A study of interval optimization problems. Optim. Lett. 2019, 15, 859–877. [Google Scholar] [CrossRef]
- Mahdipour, S.M.; Maghouli, P. Merchant EV charging station expansion planning. Electr. Power Syst. Res. 2024, 231, 110309. [Google Scholar] [CrossRef]
- Shaheen, H.I.; Rashed, G.I.; Yang, B.; Yang, J. Optimal electric vehicle charging and discharging scheduling using metaheuristic algorithms: V2G approach for cost reduction and grid support. J. Energy Storage 2024, 90, 111816. [Google Scholar] [CrossRef]
- Mimi, S.; Ben Maissa, Y.; Tamtaoui, A. Optimization Approaches for Demand-Side Management in the Smart Grid: A Systematic Mapping Study. Smart Cities 2023, 6, 1630–1662. [Google Scholar] [CrossRef]
- Benavides, D.; Arévalo, P.; Villa-Ávila, E.; Aguado, J.A.; Jurado, F. Predictive power fluctuation mitigation in grid-connected PV systems with rapid response to EV charging stations. J. Energy Storage 2024, 86, 111230. [Google Scholar] [CrossRef]
- Harighi, T.; Borghetti, A.; Napolitano, F.; Tossani, F. Flexibility modeling for parking lots with multiple EV charging stations. Electr. Power Syst. Res. 2024, 234, 110732. [Google Scholar] [CrossRef]
- Hamdare, S.; Brown, D.J.; Cao, Y.; Aljaidi, M.; Kaiwartya, O.; Yadav, R.; Vyas, P.; Jugran, M. EV charging management and security for multi-charging stations environment. IEEE Open J. Veh. Technol. 2024, 5, 807–824. [Google Scholar] [CrossRef]
- Feng, J.; Ran, L.; Wang, Z.; Zhang, M. Optimal energy scheduling of virtual power plant integrating electric vehicles and energy storage systems under uncertainty. Energy 2024, 309, 132988. [Google Scholar] [CrossRef]
- Masood, M.Y.; Aurangzeb, S.; Aleem, M.; Chilwan, A.; Awais, M. Demand-side load forecasting in smart grids using machine learning techniques. PeerJ Comput. Sci. 2024, 10, 269475583. [Google Scholar] [CrossRef]
- Aguiar-Pérez, J.M.; Pérez-Juárez, M.Á. An insight of deep learning based demand forecasting in smart grids. Sensors 2023, 23, 1467. [Google Scholar] [CrossRef] [PubMed]
- Zhong, W.; Dai, Z.; Lin, X.; Pan, G. Study on time-of-use pricing method for steam heating system considering user response characteristics and thermal storage capacity. Energy 2024, 296, 131056. [Google Scholar] [CrossRef]
- Fiorotti, R.; Fardin, J.F.; Rocha, H.R.O.; Rua, D.; Lopes, J.A.P. Day-ahead optimal scheduling considering thermal and electrical energy management in smart homes with photovoltaic–thermal systems. Appl. Energy 2024, 374, 124070. [Google Scholar] [CrossRef]
- Singh, A.R.; Raju, D.K.; Raghav, L.P.; Kumar, R.S. State-of-the-art review on energy management and control of networked microgrids. Sustain. Energy Technol. Assess. 2023, 57, 103248. [Google Scholar] [CrossRef]
- Adam, R.; Qian, K.; Brehm, R. Electric vehicle user behavior prediction using Gaussian mixture models and soft information. In Proceedings of the 2021 IEEE PES Innovative Smart Grid Technologies—Asia (ISGT Asia), Brisbane, Australia, 5–8 December 2021; pp. 1–5. [Google Scholar]
- Yang, D.; Zhang, C.; Jiang, C.; Liu, X.; Shen, Y. Interval method based optimal scheduling of regional multi-microgrids with uncertainties of renewable energy. IEEE Access 2021, 9, 53292–53305. [Google Scholar] [CrossRef]
- Karunanithi, M.; Mouchrik, H.; Rizvi, A.A.; Khan, T.A.; Kouatly, R.; Ahmed, I. An Improved Particle Swarm Optimization Algorithm. In Proceedings of the 2023 IEEE 64th International Scientific Conference on Information Technology and Management Science of Riga Technical University (ITMS), Riga, Latvia, 5–6 October 2023; pp. 1–6. [Google Scholar]
- Singh, H.K.; Ray, T.; Rana, M.J.; Limmer, S.; Rodemann, T.; Olhofer, M. Investigating the use of linear programming and evolutionary algorithms for multi-objective electric vehicle charging problem. IEEE Access 2022, 10, 115322–115337. [Google Scholar] [CrossRef]
- Aoun, A.; Adda, M.; Ilinca, A.; Ghandour, M.; Ibrahim, H. Dynamic Charging Optimization Algorithm for Electric Vehicles to Mitigate Grid Power Peaks. World Electr. Veh. J. 2024, 15, 324–332. [Google Scholar] [CrossRef]
- Wu, Y.; Chrenko, D.; Ravey, A.; Miraoui, A. Coordinated Control of a Fast V2G Charging Station with PV Generation and Energy Storage Systems. In Proceedings of the IEEE Vehicle Power and Propulsion Conference (VPPC), Belfort, France, 11–14 December 2017; pp. 1–6. [Google Scholar]
- Tang, S.; Mu, Y.; Jin, S.; Dong, X.; Jia, H.; Yu, X. Modeling Electric Vehicle Charging Load Dynamics: A Spatial-Temporal Approach Integrating Trip Chains and Dynamic User Equilibrium. IEEE Trans. Smart Grid 2025, 16, 582–597. [Google Scholar] [CrossRef]
- Li, C.; Wang, Y.; Tang, H.; Luo, Y. Dynamic multi-objective optimized replica placement and migration strategies for SaaS applications in edge cloud. Future Gener. Comput. Syst. 2019, 100, 921–937. [Google Scholar] [CrossRef]
- Parikh, T. The Effectiveness of Outpatient Appointment Reminder Systems in Reducing No-Show Rates. Am. J. Med. 2010, 123, 542–548. [Google Scholar] [CrossRef]
- Zhi, B.; Liu, T.; Fang, J.; Sun, M.; Liu, W.; Ma, X. A Study on a Flight Seat Standby Method. Electron. Test. 2022, 36, 77–79. [Google Scholar]
- Zhu, J.; Huang, S.; Liu, Y.; Lei, H.; Sang, B. Optimal energy management for grid-connected microgrids via expected-scenario-oriented robust optimization. Energy 2021, 216, 119224. [Google Scholar] [CrossRef]
- Hu, J.; Shan, Y.; Xu, Y.; Guerrero, J.M. A coordinated control of hybrid ac/dc microgrids with PV-wind-battery under variable generation and load conditions. Int. J. Electr. Power Energy Syst. 2019, 104, 583–592. [Google Scholar] [CrossRef]
- Hemeida, A.M.; Omer, A.S.; Bahaa-Eldin, A.M.; Alkhalaf, S.; Ahmed, M.; Senjyu, T.; El-Saady, G. Multi-objective multi-verse optimization of renewable energy sources-based micro-grid system: Real case. Ain Shams Eng. J. 2022, 13, 101543. [Google Scholar] [CrossRef]
- Guo, Y.; Zhang, J.; He, Y.; Liu, Y.; Deng, K.; Long, B. Hybrid Energy Storage Configuration for Microgrids Considering EV Charging and Discharging Response. Power Syst. Clean Energy 2022, 38, 82–93. [Google Scholar]
- Yang, Y.; Liu, Y.; Huang, Y.; Liu, J.; Wang, X. Integrated Wind-PV-Storage Configuration Method for Comprehensive Parks Considering Demand Response under Electricity Substitution. Electr. Power Constr. 2021, 42, 9–18. [Google Scholar]
- Qiu, G.; Feng, Z.; Shen, F.; He, C.; He, H.; Liu, K. Dynamic Dual-Layer Energy Management Strategy for Park Grids Considering Vehicle-to-Grid Interaction. J. Shanghai Jiao Tong Univ. 2024, 58, 916–925. [Google Scholar]
- Chen, J.; Huang, X.; Cao, Y.; Li, L.; Yan, K. Electric vehicle charging schedule considering shared charging pile based on Generalized Nash Game. Int. J. Electr. Power Energy Syst. 2022, 136, 107579. [Google Scholar] [CrossRef]
Disclaimer/Publisher’s Note: The statements, opinions and data contained in all publications are solely those of the individual author(s) and contributor(s) and not of MDPI and/or the editor(s). MDPI and/or the editor(s) disclaim responsibility for any injury to people or property resulting from any ideas, methods, instructions or products referred to in the content. |
© 2025 by the authors. Licensee MDPI, Basel, Switzerland. This article is an open access article distributed under the terms and conditions of the Creative Commons Attribution (CC BY) license (https://creativecommons.org/licenses/by/4.0/).