Article

Intelligent Trademark Image Segmentation Through Multi-Stage Optimization

Department of Computer Science, China Jiliang University, Hangzhou 310018, China
*
Author to whom correspondence should be addressed.
Electronics 2025, 14(19), 3914; https://doi.org/10.3390/electronics14193914
Submission received: 8 September 2025 / Revised: 28 September 2025 / Accepted: 30 September 2025 / Published: 1 October 2025

Abstract

Traditional GrabCut algorithms are limited by their reliance on manual intervention, often resulting in segmentation errors and missed detections, particularly against complex backgrounds. This study addresses these limitations by introducing the Auto Trademark Cut (AT-Cut), an advanced automated trademark image-segmentation method built upon an enhanced GrabCut framework. The proposed approach achieves superior performance through three key innovations: Firstly, histogram equalization is applied to the entire input image to mitigate noise induced by illumination variations and other environmental factors. Secondly, state-of-the-art object detection techniques are utilized to precisely identify and extract the foreground target, with dynamic region definition based on detection outcomes to ensure heightened segmentation accuracy. Thirdly, morphological erosion and dilation operations are employed to refine the contours of the segmented target, leading to significantly improved edge segmentation quality. Experimental results indicate that AT-Cut enables efficient, fully automated trademark segmentation while minimizing the necessity for labor-intensive manual labeling. Evaluation on the public Real-world Logos dataset demonstrates that the proposed method surpasses conventional GrabCut algorithms in both boundary localization accuracy and overall segmentation quality, achieving a mean accuracy of 90.5%.

1. Introduction

Trademark segmentation technology, as an efficient auxiliary tool, can help alleviate these challenges by separating trademarks from complex backgrounds [1], reducing the impact of background elements on trademark infringement cases, and improving the efficiency of similarity determination. By doing so, this technology can significantly reduce human resource costs and lighten the workload of relevant departments. Trademark segmentation technology has vast application potential in areas such as determining trademark similarity [2], addressing trademark infringement [3], and conducting trademark searches [4]. Currently, image segmentation techniques are primarily categorized into supervised learning and unsupervised learning algorithms. Supervised learning algorithms focus on deep learning models. For instance, Du et al. [5] proposed an fully convolutional network (FCN) image segmentation model based on ResNet, which improved segmentation accuracy but remained complex and less effective in terms of results. Auvy et al. [6] introduced a U-Net-based segmentation algorithm integrated with attention mechanisms for segmenting lung tuberculosis in X-ray images, achieving notable accuracy. However, this model is predominantly applied to medical imaging. On the other hand, unsupervised learning algorithms rely on feature extraction from regions of interest (ROI) and classifier technologies to perform image segmentation. For example, Ju et al. [7] proposed a color product-label segmentation method combining region growth with SVM classifiers, where texture information is classified into positive and negative samples using SVM, followed by ROI segmentation via region growth. Prabu et al. [8] introduced a hybrid segmentation approach that sequentially applies K-means clustering and GrabCut-based graph theory methods to enhance image segmentation performance.
Traditional segmentation and deep learning-based segmentation each have their own strengths and limitations [9]. Traditional algorithms are structurally concise but require extensive human intervention, with room for improvement in both precision and efficiency. Deep learning technologies offer superior accuracy but demand higher computational resources and data annotation costs. Therefore, this paper combines the advantages of both approaches [10], proposing a two-stage automated trademark segmentation algorithm based on GrabCut called Auto Trademark Cut (AT-Cut).The main contributions of this research can be summarized as follows:
(1)
A novel image-equalization algorithm for trademarks, color three-channel adaptive histogram equalization (CTCAHE), is introduced. By representing and transforming trademark images in the YCrCb color space, this method applies contrast-limited histogram equalization to achieve adaptive image enhancement, thereby improving clarity and readability.
(2)
An automated trademark segmentation algorithm is proposed. The YOLOv8 algorithm replaces manual bounding boxes for automatic localization and pre-judgment of regions of interest (ROI). This step marks reasonable pixel distributions for foreground, background, probable foreground, and probable background before inputting the data into the AT-Cut algorithm for iteration to obtain the optimal segmentation result.
(3)
Experimental results on public datasets demonstrate that, compared to the original algorithm, the proposed method achieves significant improvements in segmentation accuracy, validating its effectiveness.

Preliminaries

Traditional object detection models have primarily focused on understanding logo recognition and recall through controlled laboratory experiments. While these models provide valuable insights into basic cognitive processes, they often lack ecological validity, as they do not account for real-world factors such as brand context and individual differences in consumer expertise. In contrast, mechanistic models aim to explain the specific cognitive mechanisms underlying logo recognition. For example, Yao et al. [11] proposed a model that differentiates between two distinct processes: perceptual fluency and conceptual fluency. Perceptual fluency refers to the ease with which a logo is visually processed, while conceptual fluency relates to the ease with which the logo’s meaning is understood. This model has been influential in understanding how different design features of logos influence consumer behavior. Cognitive models of logo recognition integrate both behavioral and mechanistic perspectives. Zhou et al. [12], for instance, developed a cognitive framework that emphasizes the role of prior knowledge and expectations in logo recognition. According to this model, consumers’ prior experiences with a brand influence their ability to recognize and interpret its logo. This model has been particularly useful in understanding cross-cultural differences in logo recognition, as cultural background significantly shapes prior knowledge and expectations.
In recent years, deep learning techniques have revolutionized the field of logo recognition by enabling the automatic extraction of complex features from images. These models are typically trained on large datasets of logos and can achieve high levels of accuracy in recognizing even degraded or occluded logos.The foundational model for many modern logo recognition systems is the CNN, which is particularly well-suited for image classification tasks due to its ability to automatically and adaptively learn spatial hierarchies of features. Early work by Kadirvel et al. [13] demonstrated the effectiveness of CNNs in logo recognition, achieving state-of-the-art performance on benchmark datasets. Building on the success of CNNs, R-CNNs introduced the concept of region proposals to focus on areas of the image that are most likely to contain objects. This approach has been particularly effective in logo recognition tasks where logos may be small or located in specific regions of an image. Bhatia and Sharma [14] showed that R-CNNs could significantly outperform traditional CNNs in scenarios with cluttered backgrounds.These extensions of the R-CNN model introduced significant improvements in both speed and accuracy. Fast R-CNN, proposed by Xu et al. [15], integrated region proposals directly into the neural network, enabling end-to-end training. Faster R-CNN, developed by Liu et al. [16], further improved performance by introducing a region proposal network (RPN), which efficiently generates high-quality region proposals.
The latest iteration in this line of models is Mask R-CNN, introduced by Fulka et al. [17]. This model extends Faster R-CNN by adding a branch for predicting segmentation masks, allowing it to not only detect logos but also precisely segment them from the background. Mask R-CNN has achieved state-of-the-art performance on logo recognition and segmentation tasks. More recently, transformers have emerged as a powerful alternative to CNNs for image recognition tasks. The Vision Transformer (ViT), proposed by Purushothaman et al. [18], processes images as sequences of patches and applies self-attention mechanisms to model long-range dependencies. This approach has shown promising results in logo recognition, particularly in cases where logos are highly stylized or contain complex patterns. Recognizing the complementary strengths of CNNs and transformers, some researchers have explored hybrid architectures that combine these two approaches.
Despite their many advantages, current deep learning models face several challenges. One major limitation is the need for large amounts of labeled training data, which can be costly and time-consuming to obtain. Another challenge is robustness to adversarial attacks, where small perturbations to an image can cause a model to misclassify it. Additionally, while modern models excel at recognizing logos in controlled environments, their performance can degrade significantly in real-world scenarios with varying lighting conditions, occlusions, and backgrounds. Addressing these challenges will likely be the focus of future research in logo recognition. One promising direction is unsupervised learning, where models learn without explicit labels, potentially reducing the dependency on large labeled datasets. Another area of exploration is adversarial robustness, with researchers developing techniques to make models more resilient to adversarial attacks. Finally, improving model generalization to real-world conditions will be crucial for deploying logo recognition systems in practical applications. In summary, while traditional behavioral and cognitive models provided foundational insights into logo recognition, modern deep learning approaches, particularly CNNs, R-CNNs, transformers, and hybrid architectures, have significantly advanced the field. As these models continue to evolve, they hold great potential to address current challenges and expand the range of practical applications in marketing, retail, security, and beyond.
The early trademark segmentation technologies can primarily be categorized into threshold-based, edge-based, region-based, clustering-based, and graph theory-based methods [19]. Wang et al. [20] proposed an adaptive thresholding segmentation algorithm that combines time-averaged edge detection with saliency detection for improved accuracy. Similarly, Li et al. [21] developed a region-based clustering method to handle complex background textures effectively.
In the domain of deep learning, significant advancements have been made in recent years. Zhang et al. [22] demonstrated the effectiveness of convolutional neural networks (CNNs) in large-scale trademark retrieval systems. Their work incorporated hard and soft attention mechanisms to enhance search accuracy. For medical imaging applications, Kumar et al. [23] introduced a fully convolutional network (FCN)-based algorithm for brain tumor detection and evaluation. The U-Net architecture, pioneered by Ronneberger et al. [24], has become a standard tool in biomedical image segmentation due to its U-shaped structure that enables efficient feature extraction and reconstruction. Building on this foundation, Badrinarayanan et al. [25] developed SegNet, which introduced an encoder–decoder framework optimized for semantic pixel-wise segmentation. More recently, Yang et al. [26] proposed the TSE DeepLab network, extending the DeepLabv3+ framework by integrating Transformer modules to refine segmentation outputs. The family of region-based CNNs (R-CNN) has also seen significant evolution. Starting with the original R-CNN [27], the framework was improved into Faster R-CNN by Ren et al. [28], which introduced region-of-interest (RoI) pooling to speed up detection tasks. He et al. [1] further advanced this concept by developing Mask R-CNN, which added a branch for pixel-wise mask prediction, enabling high-quality instance segmentation. This model was later adapted by Liu et al. [29] for segmenting pulmonary nodules in CT scans with remarkable success.

2. Related Work

The core technologies for intelligent processing of trademark actions include trademark detection, segmentation, and similarity recognition [30]. First, object detection and classification technologies are used to accurately locate the position of trademarks in complex images. Subsequently, fine segmentation is performed on the target to extract the target region. Finally, based on different trademark categories and using clear trademark samples, the similarity confidence between trademarks is assessed. This constitutes an important means of improving the efficiency of trademark retrieval; compared to direct trademark similarity search without preprocessing, this approach can significantly reduce the number of similarity comparisons, improve efficiency, and achieve precise prediction of trademark infringement behaviors. Therefore, research on trademark detection, segmentation, and other related technologies has been deeply explored by domestic and international researchers from multiple dimensions [31].
As research progresses, one of the primary challenges in using deep learning models for trademark detection, segmentation, or similarity recognition tasks is how to effectively collect trademark datasets. Romberg et al. proposed a trademark dataset called FlickrLogos, which collects image data of 32 classes of internationally well-known brands, primarily for identifying trademarks in real-world images [32]. Tursun et al. [33] compiled a large-scale METU trademark dataset to assist in trademark retrieval (TR) tasks, but the use of big data requires high configuration, limiting its widespread application. Su et al. [34] developed a new QMUL-OpenLogo dataset by merging and filtering seven publicly available logo datasets. Wang et al. [35] introduced the LogoDet-3K dataset, which is the most comprehensively annotated trademark detection dataset with a broader coverage of trademarks across more diverse domains. Subsequently, Hou et al. [36] proposed the FoodLogoDet-1500 dataset for the topic of intelligent protection of food brand trademarks, representing the first publicly available large-scale food trademark dataset. Nguyen et al. [37] introduced the U15-Logos dataset, which consists of 15 well-known Vietnamese trademarks collected and annotated using tools such as social media and search engines to address local challenges in trademark intellectual property protection. Thus, with the increasing richness of trademark-related datasets, academic and industrial interest in applying deep learning models for precise detection, accurate segmentation, and efficient similarity retrieval of trademarks continues to grow. More recently, Li and colleagues [38] introduced a DETR-based network for multi-scale detection of trademark elements. Their approach incorporated spatial attention mechanisms and global context processing into the backbone architecture, thereby enhancing the system’s capability to effectively capture the defining features of trademark images. In another development, Zhou and co-researchers [39] developed a recognition framework specifically designed to improve both the accuracy and reliability of text recognition in trademarks.

3. Methodology

The data-processing flowchart of the algorithm in this paper is shown in Figure 1. First, a color three-channel adaptive histogram equalization strategy is applied for image preprocessing to enhance the clarity of the target’s contour and improve the recognizability of edges. Next, the optimal bounding box containing the target is detected using YOLOv8, and the target is framed with rectangular lines. Then, the rectangular box is used as the ROI (Region of Interest) for segmentation, and foreground, background, potential foreground, and challenging background location information are preset for the algorithm. Finally, this location information is passed as parameters to the image segmentation algorithm for the target segmentation task. The background information is zero-normalized, while the detected foreground targets are preserved in their original form. Subsequently, the segmented target images undergo consecutive erosion and dilation processes to achieve the final target segmentation result.

3.1. CTCAHE-Based Image Enhancement Algorithm

The commonly used adaptive histogram equalization (AHE) is widely applied due to its simplicity and significant effects. However, this method lacks constraints on the height of local histograms, which can introduce noise during the equalization process. To address this issue, a threshold is introduced to limit the maximum height of local histograms, effectively overcoming the problem of excessive noise amplification in AHE. Additionally, since histogram equalization methods are more suitable for grayscale images and this paper uses color images, we compress the color image using the YCrCb color space to reduce the data volume and computational complexity caused by multi-channel processing. Therefore, this paper employs CTCAHE (Contrast-Limited Threshold-Based Color Adaptive Histogram Equalization) to perform contrast-limited histogram equalization on the detected trademark images, enhancing the clarity of image edges and contours.
The CTCAHE algorithm follows these steps:
(1)
Convert the original RGB image into the YCrCb color space and separate each pixel into its color components using the Equations  (1) to (3).
Y = 0.299 R + 0.587 G + 0.114 B
C r = ( R Y ) × 0.713 + 128
C b = ( B Y ) × 0.564 + 128
(2)
Divide the Y-channel image into N sub-blocks (tiles) of size M × M. The value of M determines the visibility of local details, and adjusting M can reduce detail loss.
(3)
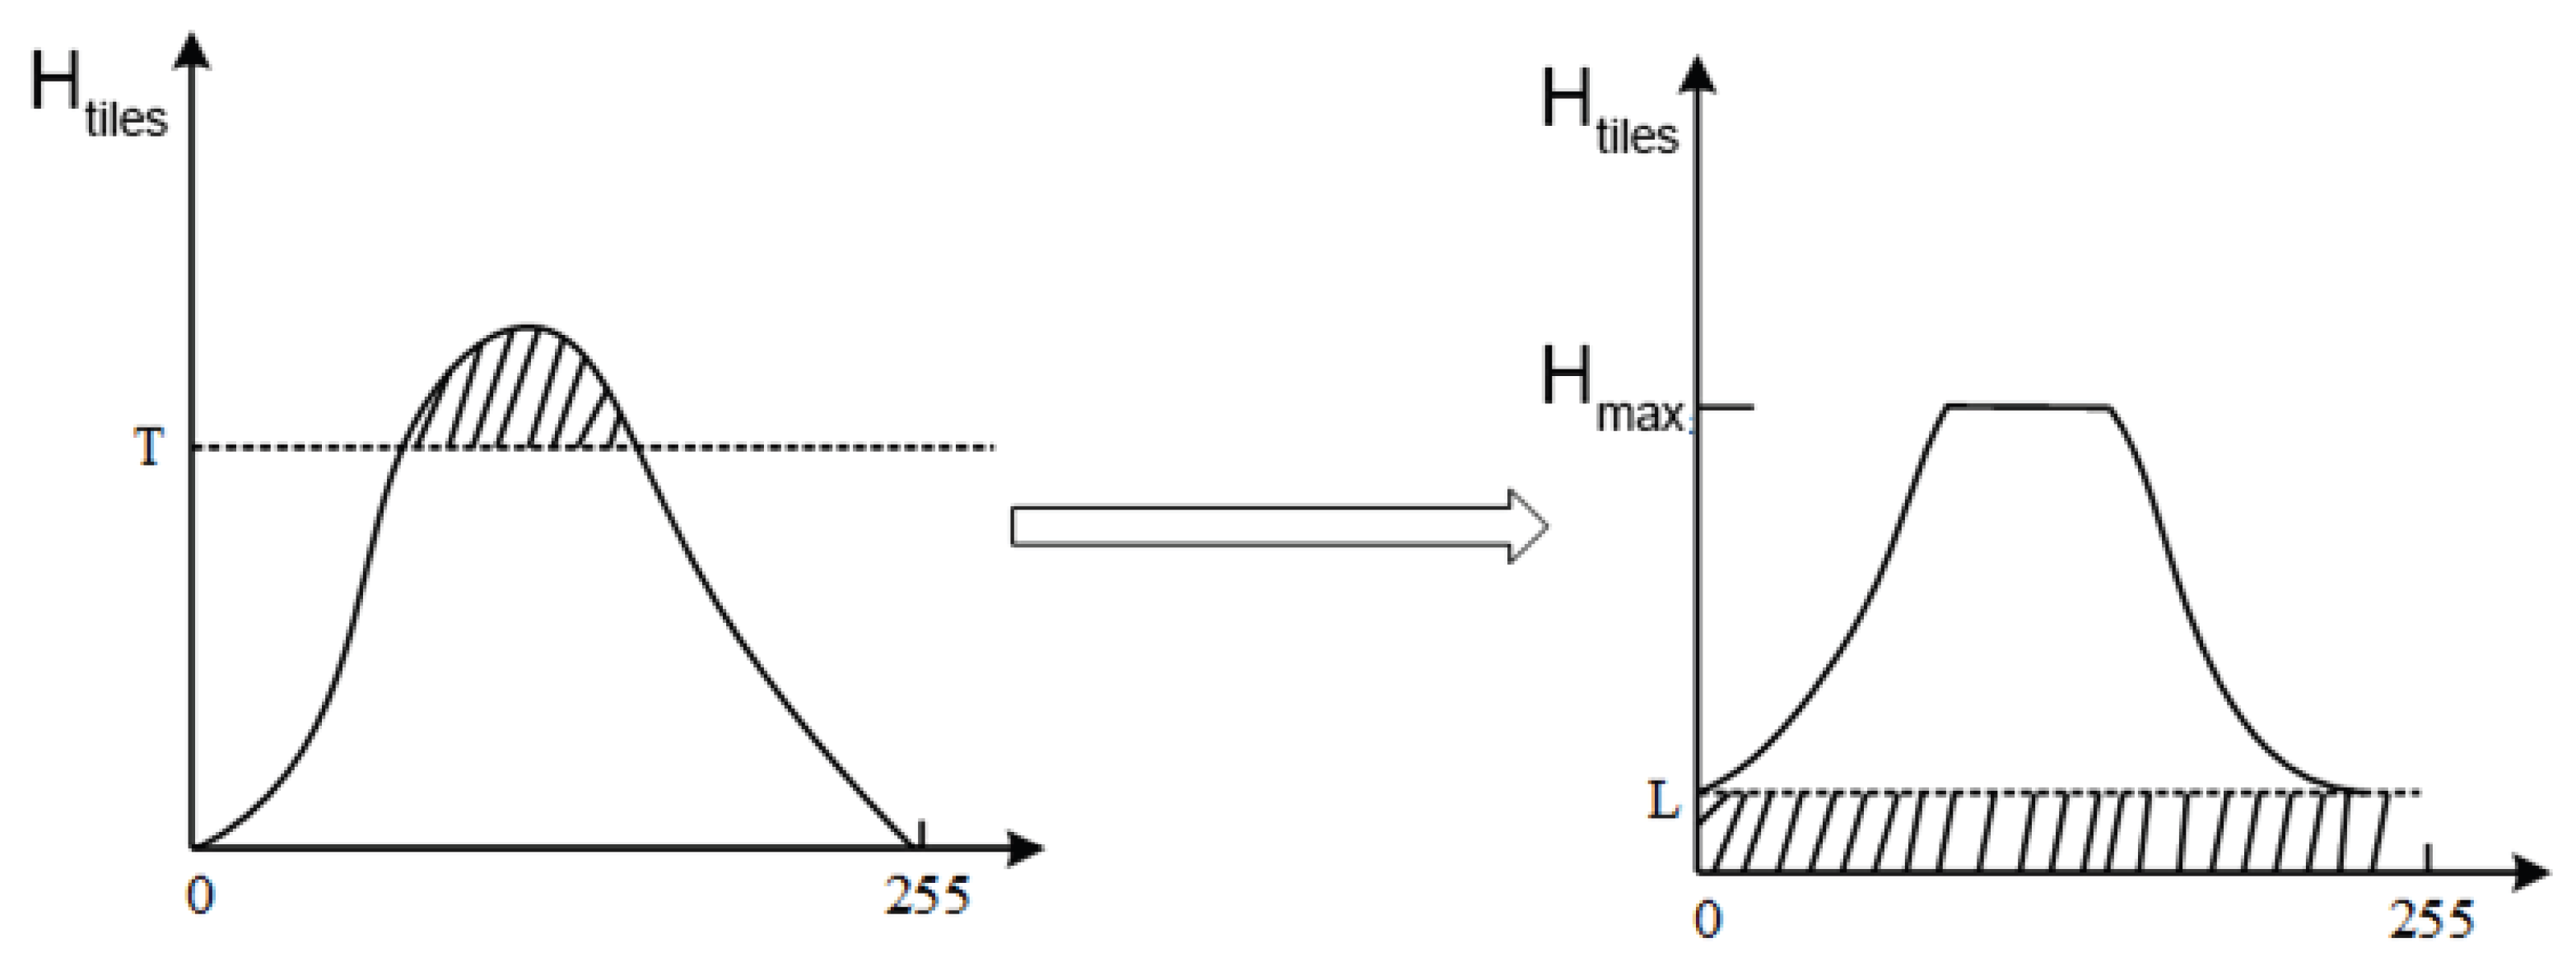
For each sub-block, calculate the single-channel histogram Htiles (i), set a threshold T, and redesign the histogram method to redistribute the pixel values within the tiles (see Equation (4) and Figure 2).
H t i l e s ( i ) = { H t i l e s ( i ) + L ,   H tiles ( i ) < T H max ,   H t i l e s T
(4)
Apply histogram equalization to all redistributed tiles.
(5)
For pixels outside the central region, use linear interpolation to reduce computation times and lower the algorithm’s time cost.
(6)
Merge the processed Y-channel back into the original YCrCb image and convert it back to the original color space to complete the image equalization.
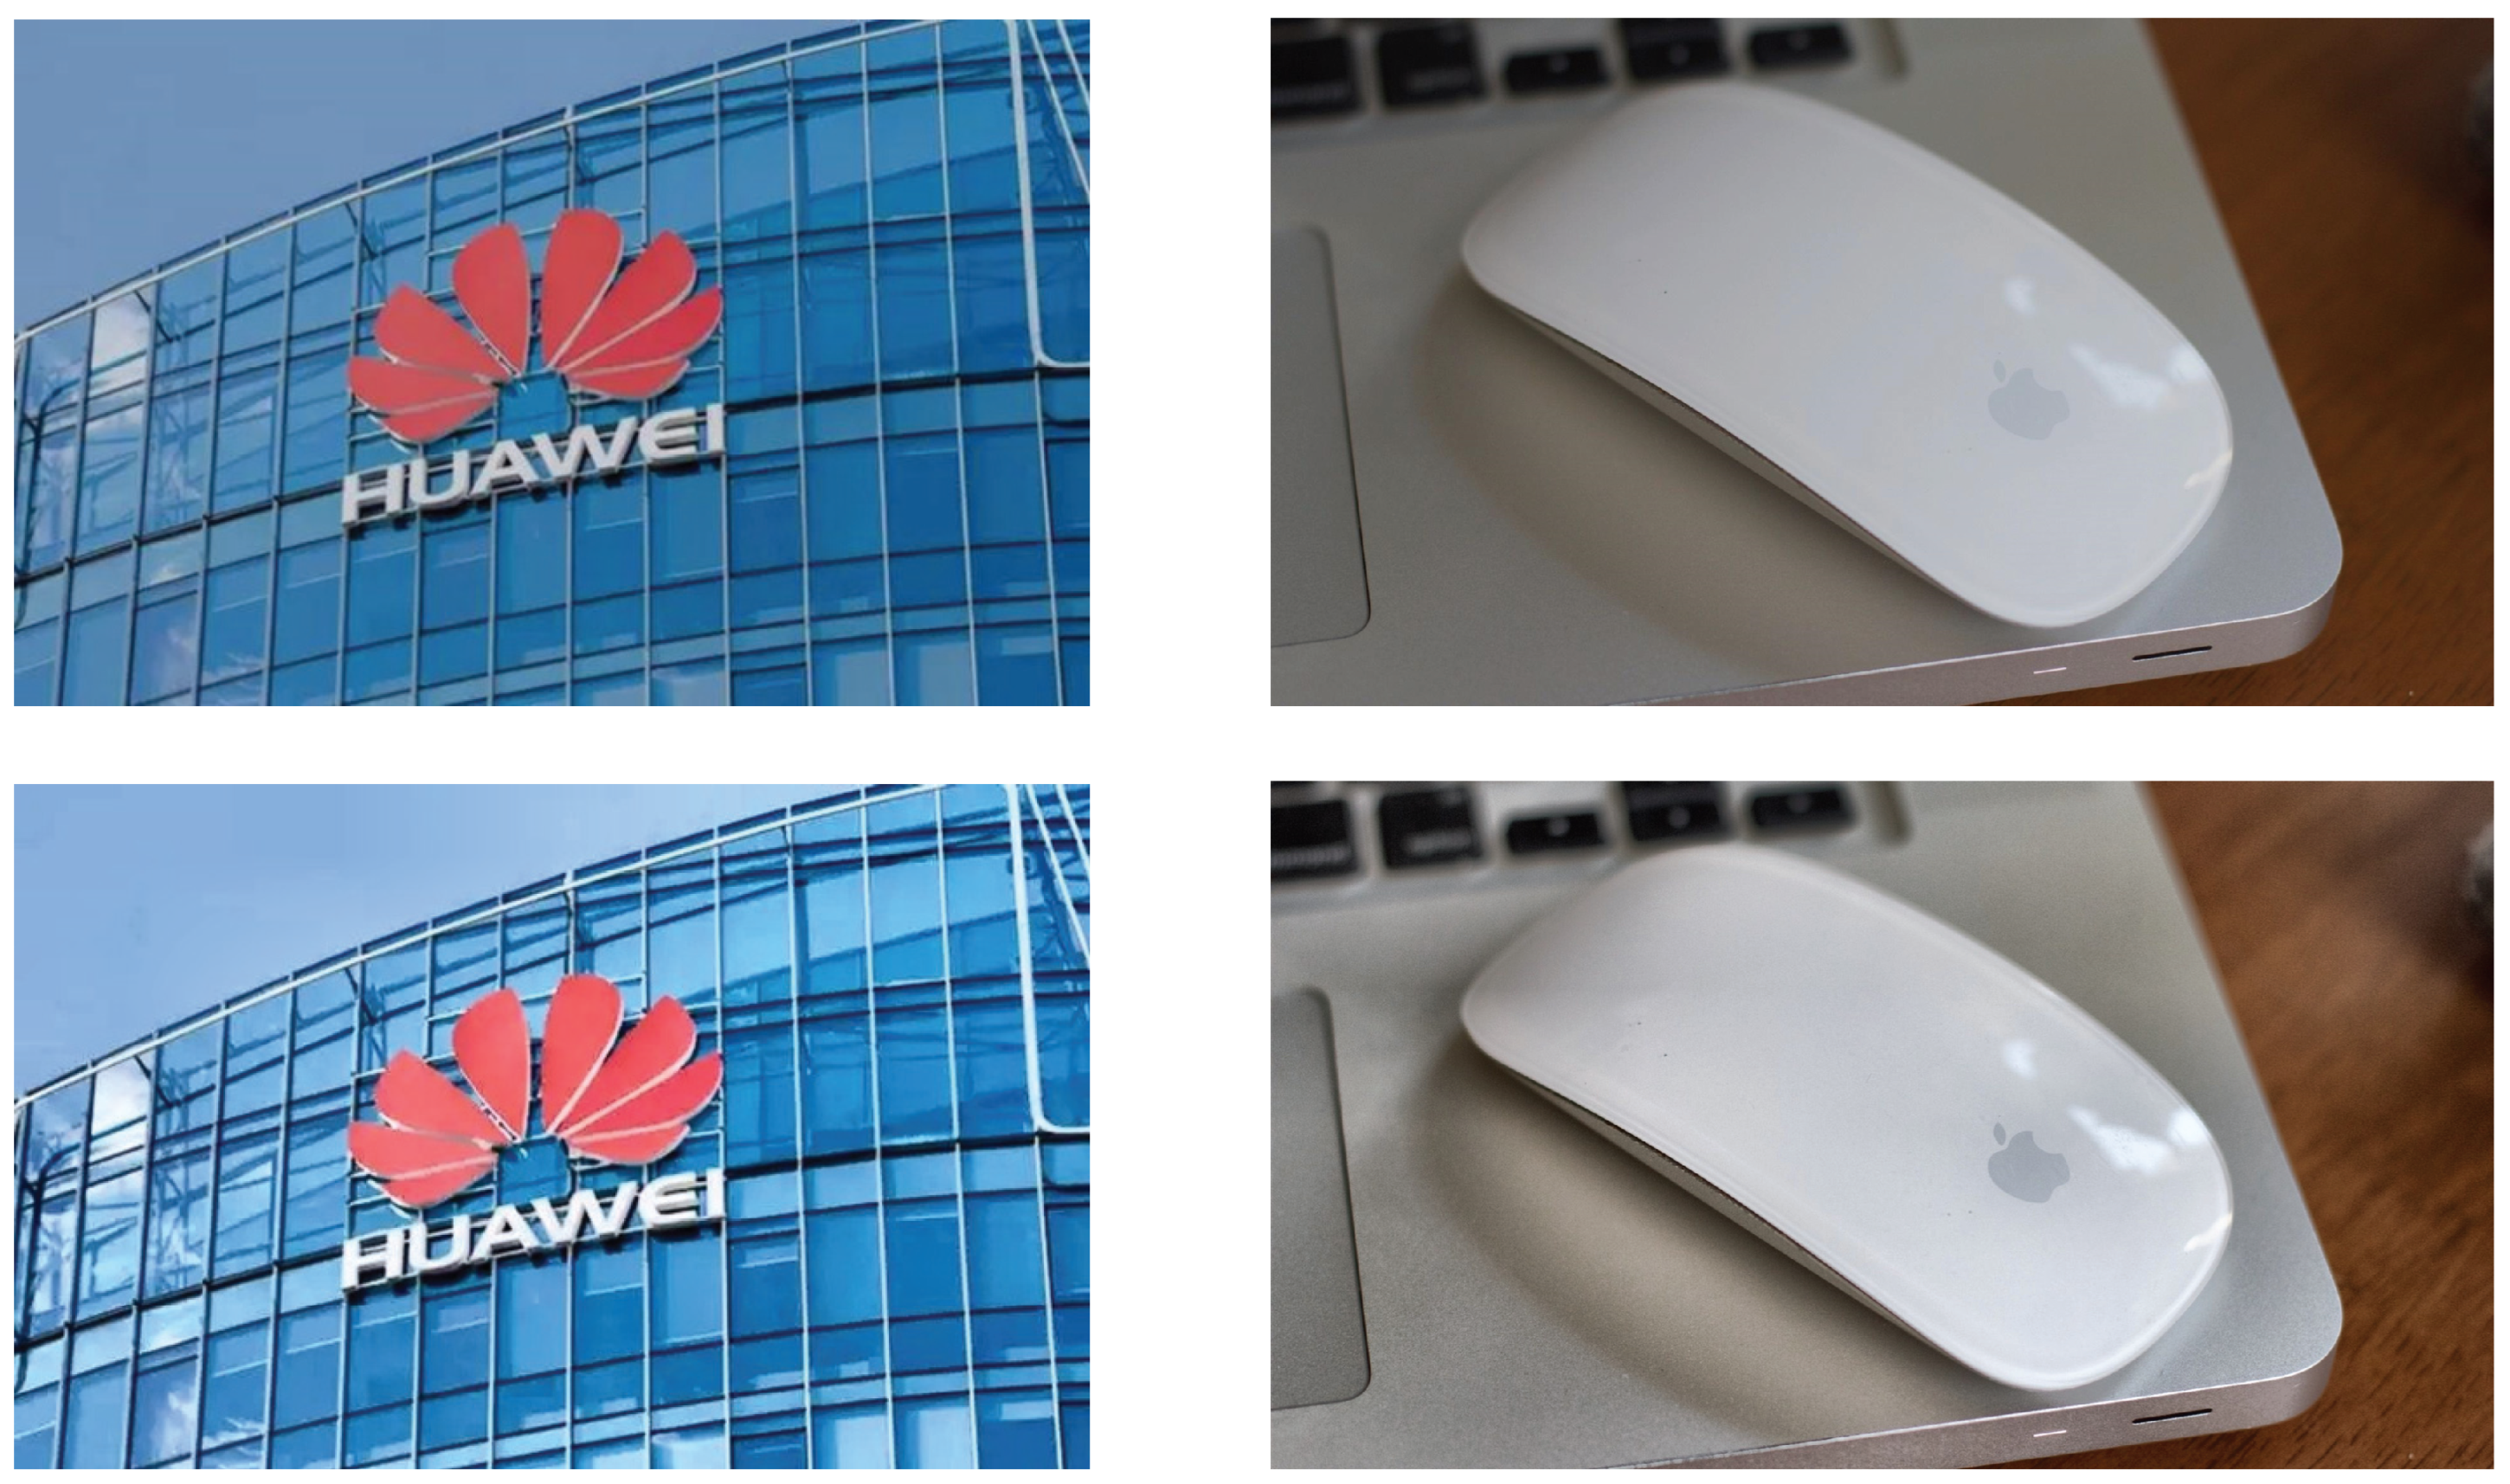
As shown in Figure 3, a comparison of trademark images before and after enhancement demonstrates the effectiveness of the CTCAHE method. The original image exhibits exposure issues, while the enhanced image reduces the impact of background exposure and sharpens the contours of the trademark, making it easier to segment the target.

3.2. Trademark Detection-Based Coordinate Localization

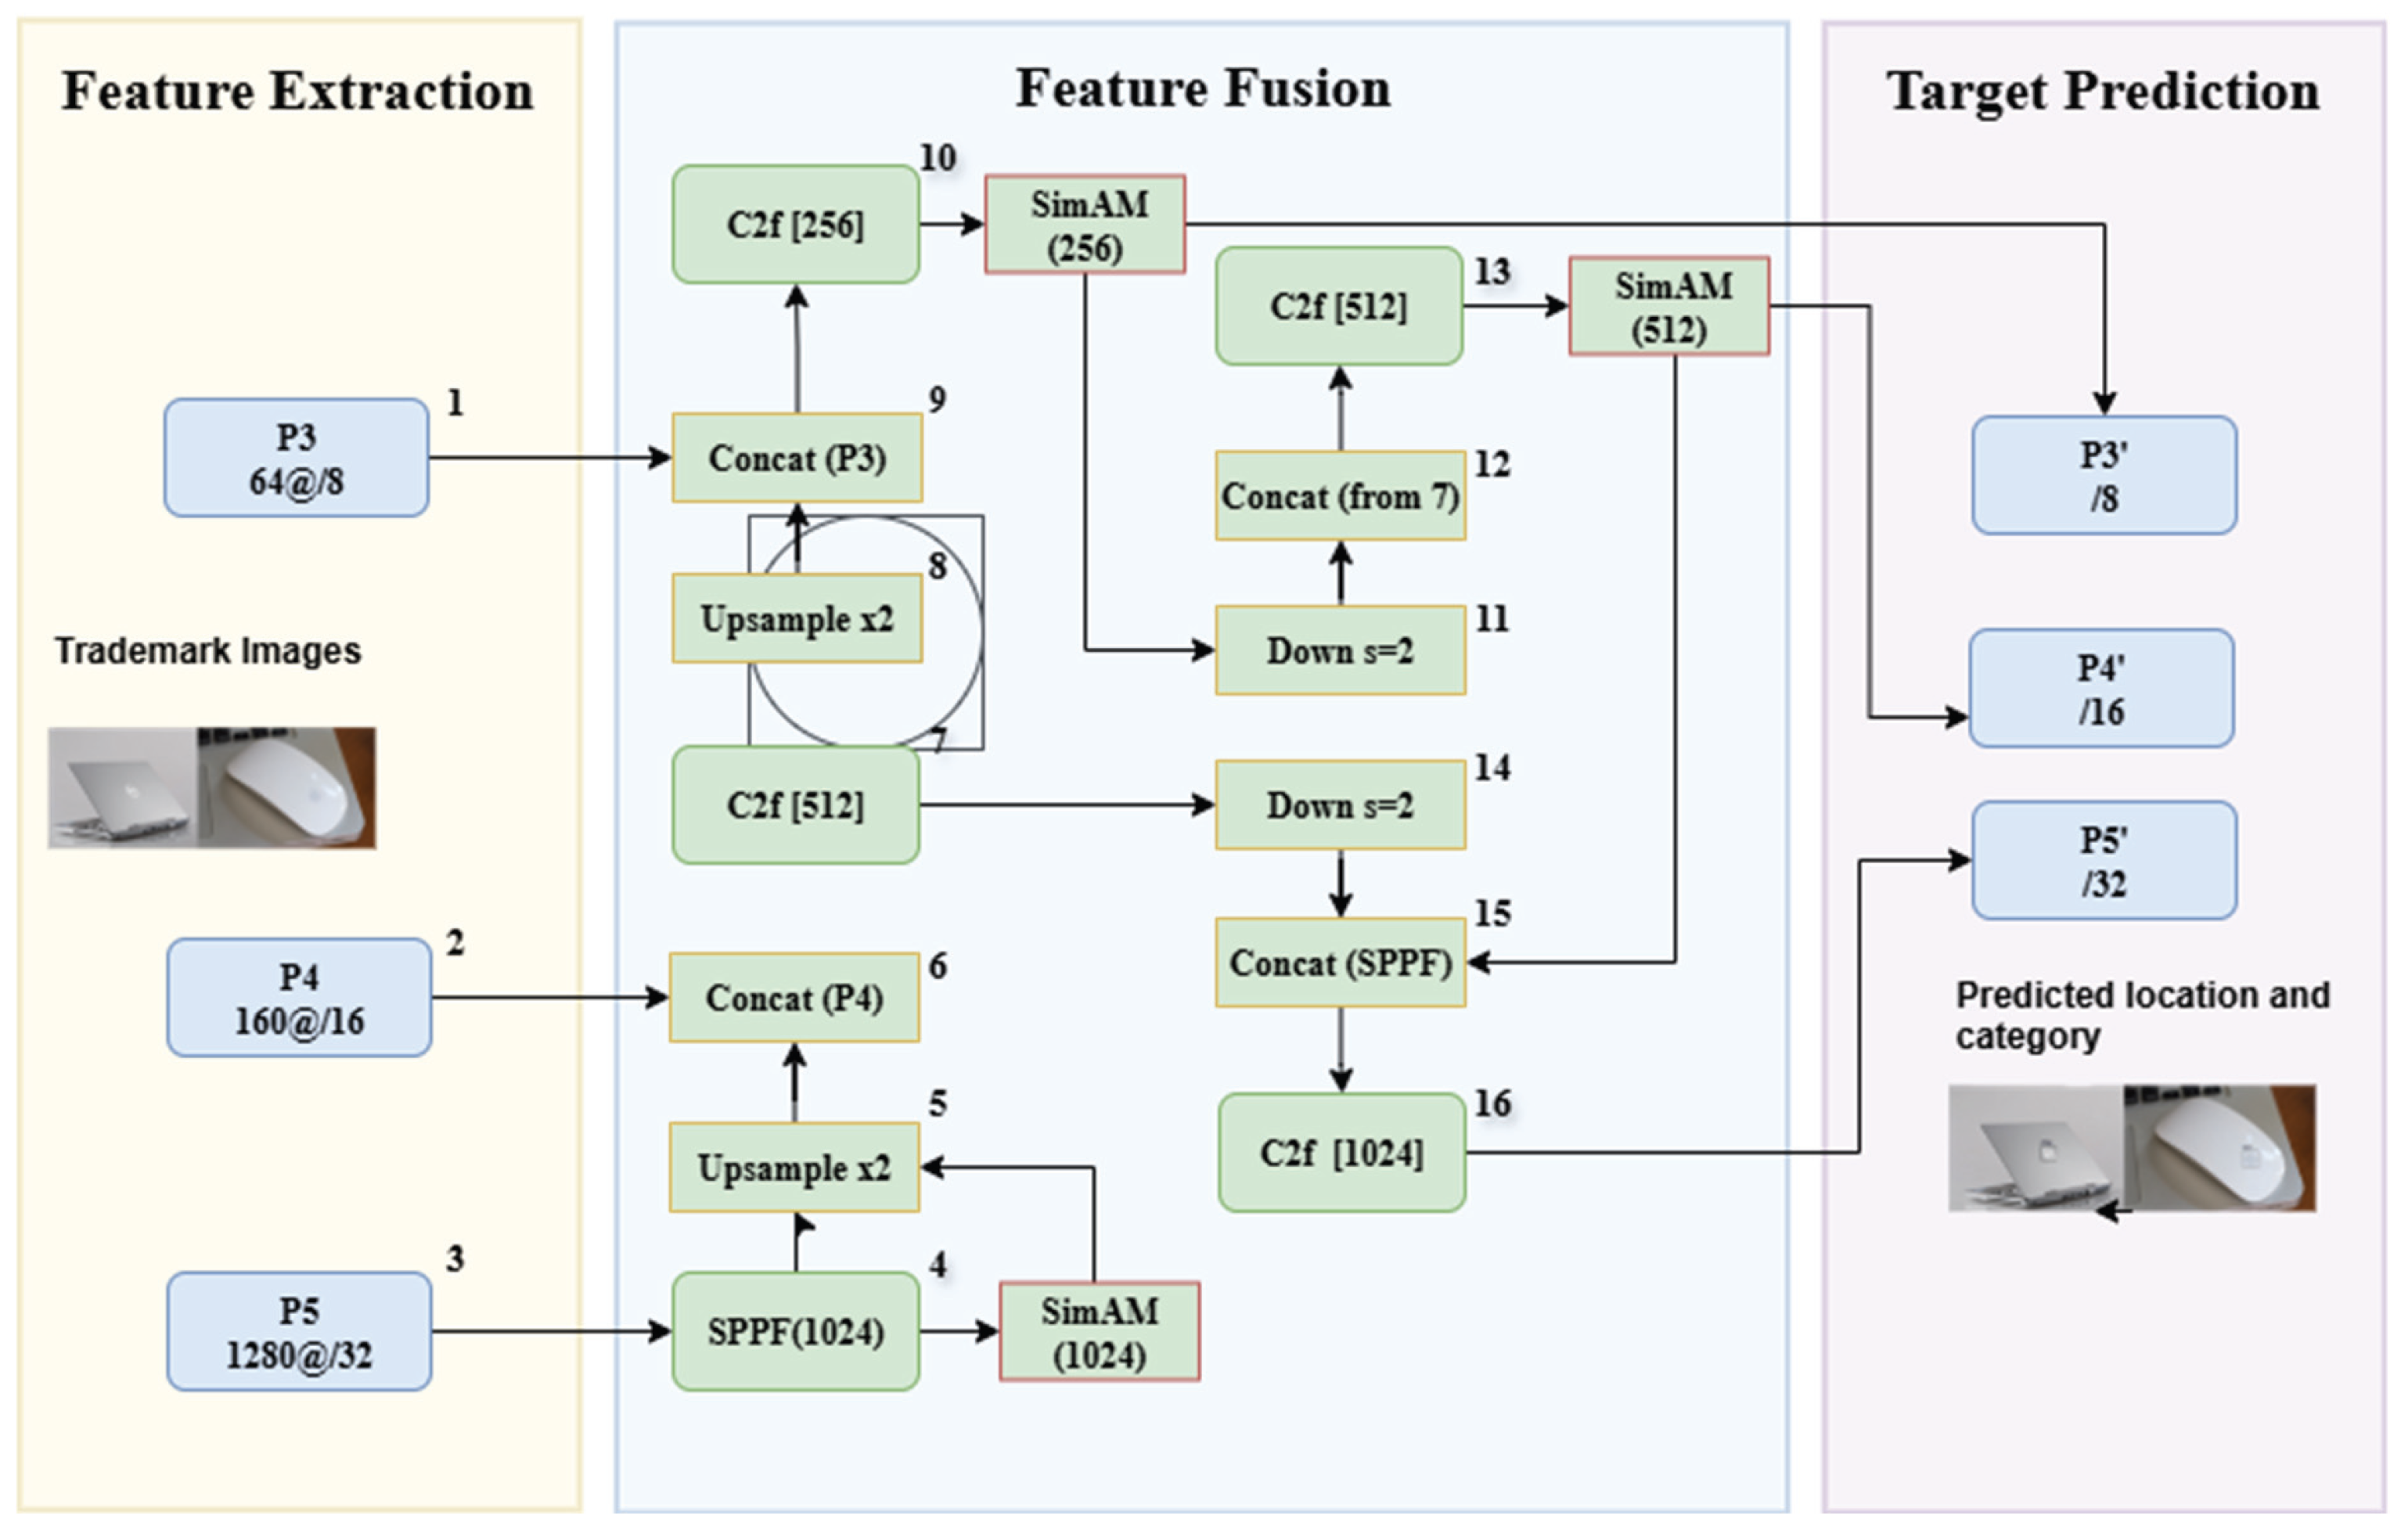
The process of using YOLOv8 [40] to process trademark images is illustrated in Figure 4. First, the collected trademark image data is input into the model for training, utilizing the LogoDet3k dataset as both the training and validation sets. This dataset contains images of 3000 different trademark brands, such as Apple, IBM, Mi, and SUPOR, among others. From this dataset, 224 classes of high-recognition trademarks were selected, and the dataset was divided into a 9:1 ratio for training and validation to validate the algorithm’s effectiveness and generalization capability. Next, after inputting the data into the model, feature extraction is performed. In this study, the DarkNet53 architecture is employed for feature extraction, with C2F modules alternately inserted to further refine and enhance features, allowing for the capture of more complex pattern rules. Additionally, an SPPF structure is introduced. Following this, different feature information is concatenated and combined. Subsequently, multi-scale feature fusion is applied to the extracted feature maps. This module is primarily composed of a Bi-directional Feature Pyramid Network (BiFPN) and a Path Aggregation Network (PANet), which enable better learning of spatial and semantic information across different levels of features while simultaneously considering both low-level and high-level information to satisfy subsequent detection tasks. Finally, bounding-box prediction and localization are performed. For the input trademark images to be detected, resizing and normalization are applied to ensure that the image dimensions match the model’s requirements. On the box branch, inference is conducted for objects of different sizes in the image, and the predicted positional information is stored in the XYWH format. To address redundant detection boxes, Non-Maximum Suppression (NMS) is applied to filter out low-confidence boxes, inaccurate location coordinates, and overlapping boxes within cell centers. The final prediction results are then mapped back to the original image dimensions.
Examples of rectangular predictions for trademark locations in images are shown in Figure 5, where three images were used to demonstrate the effects of object localization, category identification, and confidence evaluation. In these cases, the predicted bounding boxes represent the minimum bounding rectangle solutions, with accurate category recognition and confidence levels exceeding 75%. This network architecture is capable of accurately, efficiently, and comprehensively localizing targets, extracting location information, and thus laying a solid foundation for subsequent automated image segmentation tasks.

3.3. AT-Cut Algorithm

Grabcut [40] is an interactive image segmentation algorithm based on color images. During initialization, it requires manual interaction using a rectangle or lasso tool to mark the Region of Interest (ROI), thereby categorizing image pixels into background or foreground. However, under insufficient interaction conditions, this method may encounter inaccurate segmentation and is not suitable for fully automated segmentation tasks. The algorithm first maps the pixels of the image to be segmented into an undirected graph G. Each node in the graph corresponds to a pixel and is assigned either a source label s (denoting foreground) or a sink label t (denoting background). The connections between nodes include spatial edges (n-links) and temporal edges (t-links). To learn the color distributions of the foreground and background, a Gaussian Mixture Model (GMM) is employed to estimate the probability that each pixel belongs to either the background or foreground. Subsequently, an energy function E is constructed for the graph, which is iteratively optimized towards minimization. Finally, the image segmentation is achieved through the m a x f l o w / m i n c u t algorithm.
The energy function E is defined as the Equation (5).
E ( α , k , θ , z ) = U ( α , k , θ , z ) + V ( α , z )
Here, α , k, and are vectors. The vector α stores the opacity values corresponding to each node in set P, with background nodes assigned 0 and foreground nodes assigned 1. The vector k contains the Gaussian components corresponding to each pixel P. θ represents the parameters associated with these Gaussian components, including the weight, mean, and covariance matrix. U denotes the regional term, while V represents the boundary term.
The pseudocode of the AT-Cut algorithm is shown in Algorithm 1.
Algorithm 1: Image segmentation algorithm.
1. 
Read the input image and convert it to an array with format (width, height, channel).
2. 
Use YOLOv8 for object detection, localization, and classification to obtain bounding-box information in XYWH format.
3. 
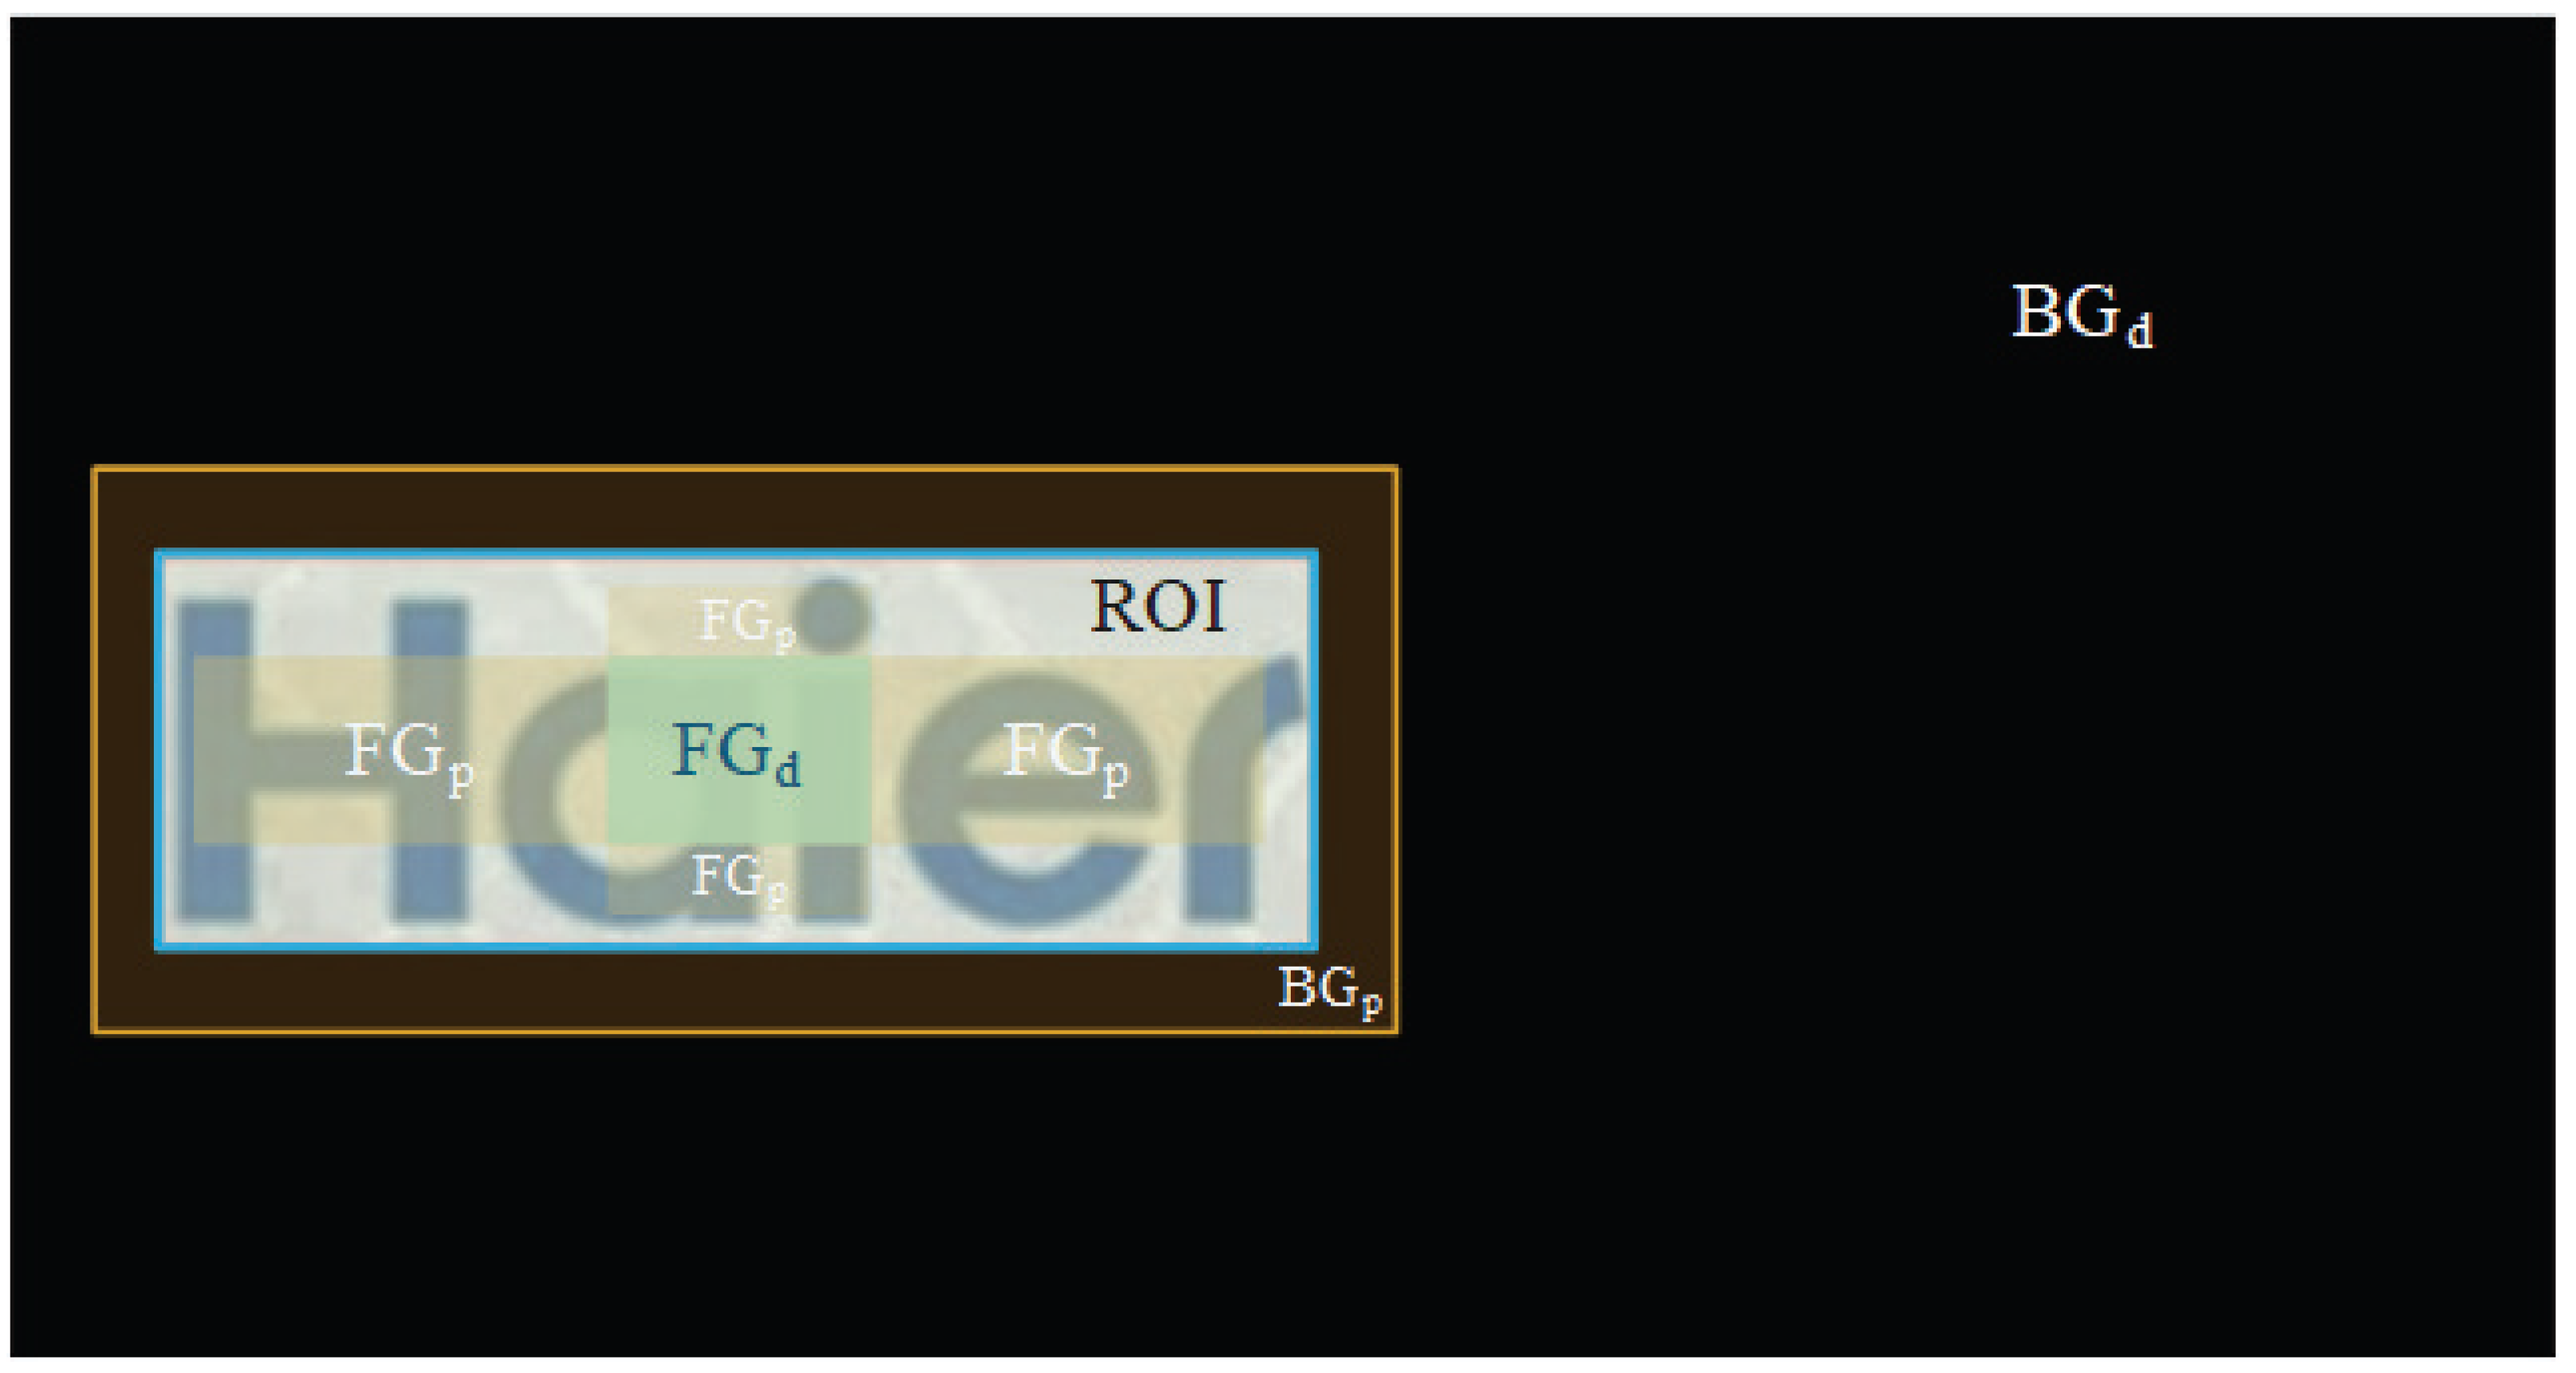
Initialize foreground (fg) and background (bg) Figure 6.
4. 
Define the BGp region. Pixels outside the BGp region are defined as the background (BGd).
5. 
Divide the FGp region within the ROI into two parts:
(a)
Compute the first part based on the corners ( x q / 2 , y h / 2 + p ) , ( x + q / 2 , y h / 2 + p ) , ( x q / 2 , y + h / 2 p ) , and  ( x + q / 2 , y + h / 2 p ) .
(b)
Compute the second part based on the corners ( x w / 2 + p , y q / 2 ) , ( x + w / 2 p , y q / 2 ) , ( x w / 2 + p , y + q / 2 ) , and  ( x + w / 2 p , y + q / 2 ) .
6. 
Designate the overlapping region between the two parts as definite foreground (FGd). The remaining FGp regions are designated as potential foreground.
7. 
Assign pixel labels:
  • Set BGd pixels to 0.
  • Set FGd pixels to 1.
  • Set BGp-ROI region pixels to 3.
  • Set ROI-FGd region pixels to 2.
8. 
Initialize Gaussian Mixture Model (GMM) parameters, including weights, means, and covariance matrices.
9. 
Input initial values and compute:
  • Spatial term V.
  • Color term U.
10. 
Construct graph G and apply the max-flow/min-cut algorithm to minimize the energy function E for segmentation.
11. 
Repeat steps 7 to 11 until convergence or desired accuracy is achieved:
  • Update labels: Keep BGd as 0 and FGd as 1; re-evaluate other regions.
  • Recompute spatial term V and color term U.
12. 
Output the final segmentation result.
Figure 6. Preset foreground and background images.
Electronics 14 03914 g006

3.4. Erosion and Dilation

After the segmentation is complete, erosion and dilation operations are employed to optimize the edge and contour segmentation of the target object. As shown in Figure 7, let A represent the input image, and B represent a 3 × 3 rectangular convolution kernel, where the five-pointed star symbolizes the central pixel of the region.
The erosion operation involves scanning image A with kernel B. Each time the kernel slides over the image, it covers a fixed pixel area. If all pixels within this area belong to the target foreground, the coordinates of the center point (represented by the five-pointed star) are recorded. However, if any non-target foreground pixels are present in the area, all pixels in that region are classified as background. This process is repeated until the entire image A has been scanned. Consequently, true target objects will be reduced in size by one layer of pixels (resulting in image A B ), making their contours more distinct; small objects or noise will be suppressed and eliminated.
Dilation is the inverse operation of erosion. It processes every pixel in the eroded image A B using kernel B. During this process, if any foreground pixels are found within the scanned region, the central pixel of that region is marked and assigned the target object’s value; otherwise, no action is taken. This results in an image A B B that matches the original size of image A. Since the sizes of the convolution kernels used for dilation and erosion are consistent, this second operation restores the image to its original dimensions while removing any background noise within or along the edges of the segmented target, leading to visually more coherent segmentation results.

4. Experiments

The experiments were conducted on an Ubuntu 18.04 Server Edition operating system from Canonical Corporation at London, UK, utilizing Xshell 7 from NetSarang Computer, Inc at Shanghai, China as the terminal client for remote access. The hardware configuration consisted of an AMD EPYC 7F52 processor from AMD Inc. at Santa Clara, CA, United States with a base clock speed of 3.5 GHz and 16 processing cores. For accelerated computations, we employed an NVIDIA GeForce RTX 3090 GPU from NVIDIA Inc. at Santa Clara, CA, United States, equipped with 24 GB of GDDR6X memory, 10,496 CUDA cores, and a memory clock speed of 14.5 GHz. The software environment was built using PyTorch v1.10.2, with CUDA v11.1 and cuDNN v8005 to optimize GPU performance and ensure compatibility with the deep learning framework.

4.1. Experimental Configuration

This study selected 1000 images from three categories: pure graphical figures, pure text, and mixed graphics–text—from the Real-world Logos trademark dataset, ensuring proportional representation to validate segmentation performance. The evaluation metrics employed include F-measure and pixel accuracy (PA), as defined in Equations (6) and (7).
F measure = ( 1 + β 2 ) × P r e c i s i o n × R e c a l l β 2 × P r e c i s i o n + R e c a l l ,
P A = T P T P + F P × 100 % ,
where TP represents the sum of foreground pixels correctly classified, precision is defined as the ratio of true positives (TP) to the sum of true positives and false positives (FP), and recall is the ratio of true positives (TP) to the sum of true positives and false negatives (FN), indicating the proportion of correctly identified foreground pixels.
For the F-measure evaluation metric, the parameter β is set to 1, corresponding to the standard F1-score. This assigns equal weight to both precision and recall, providing a balanced and objective performance comparison.

4.2. Qualitative Analysis

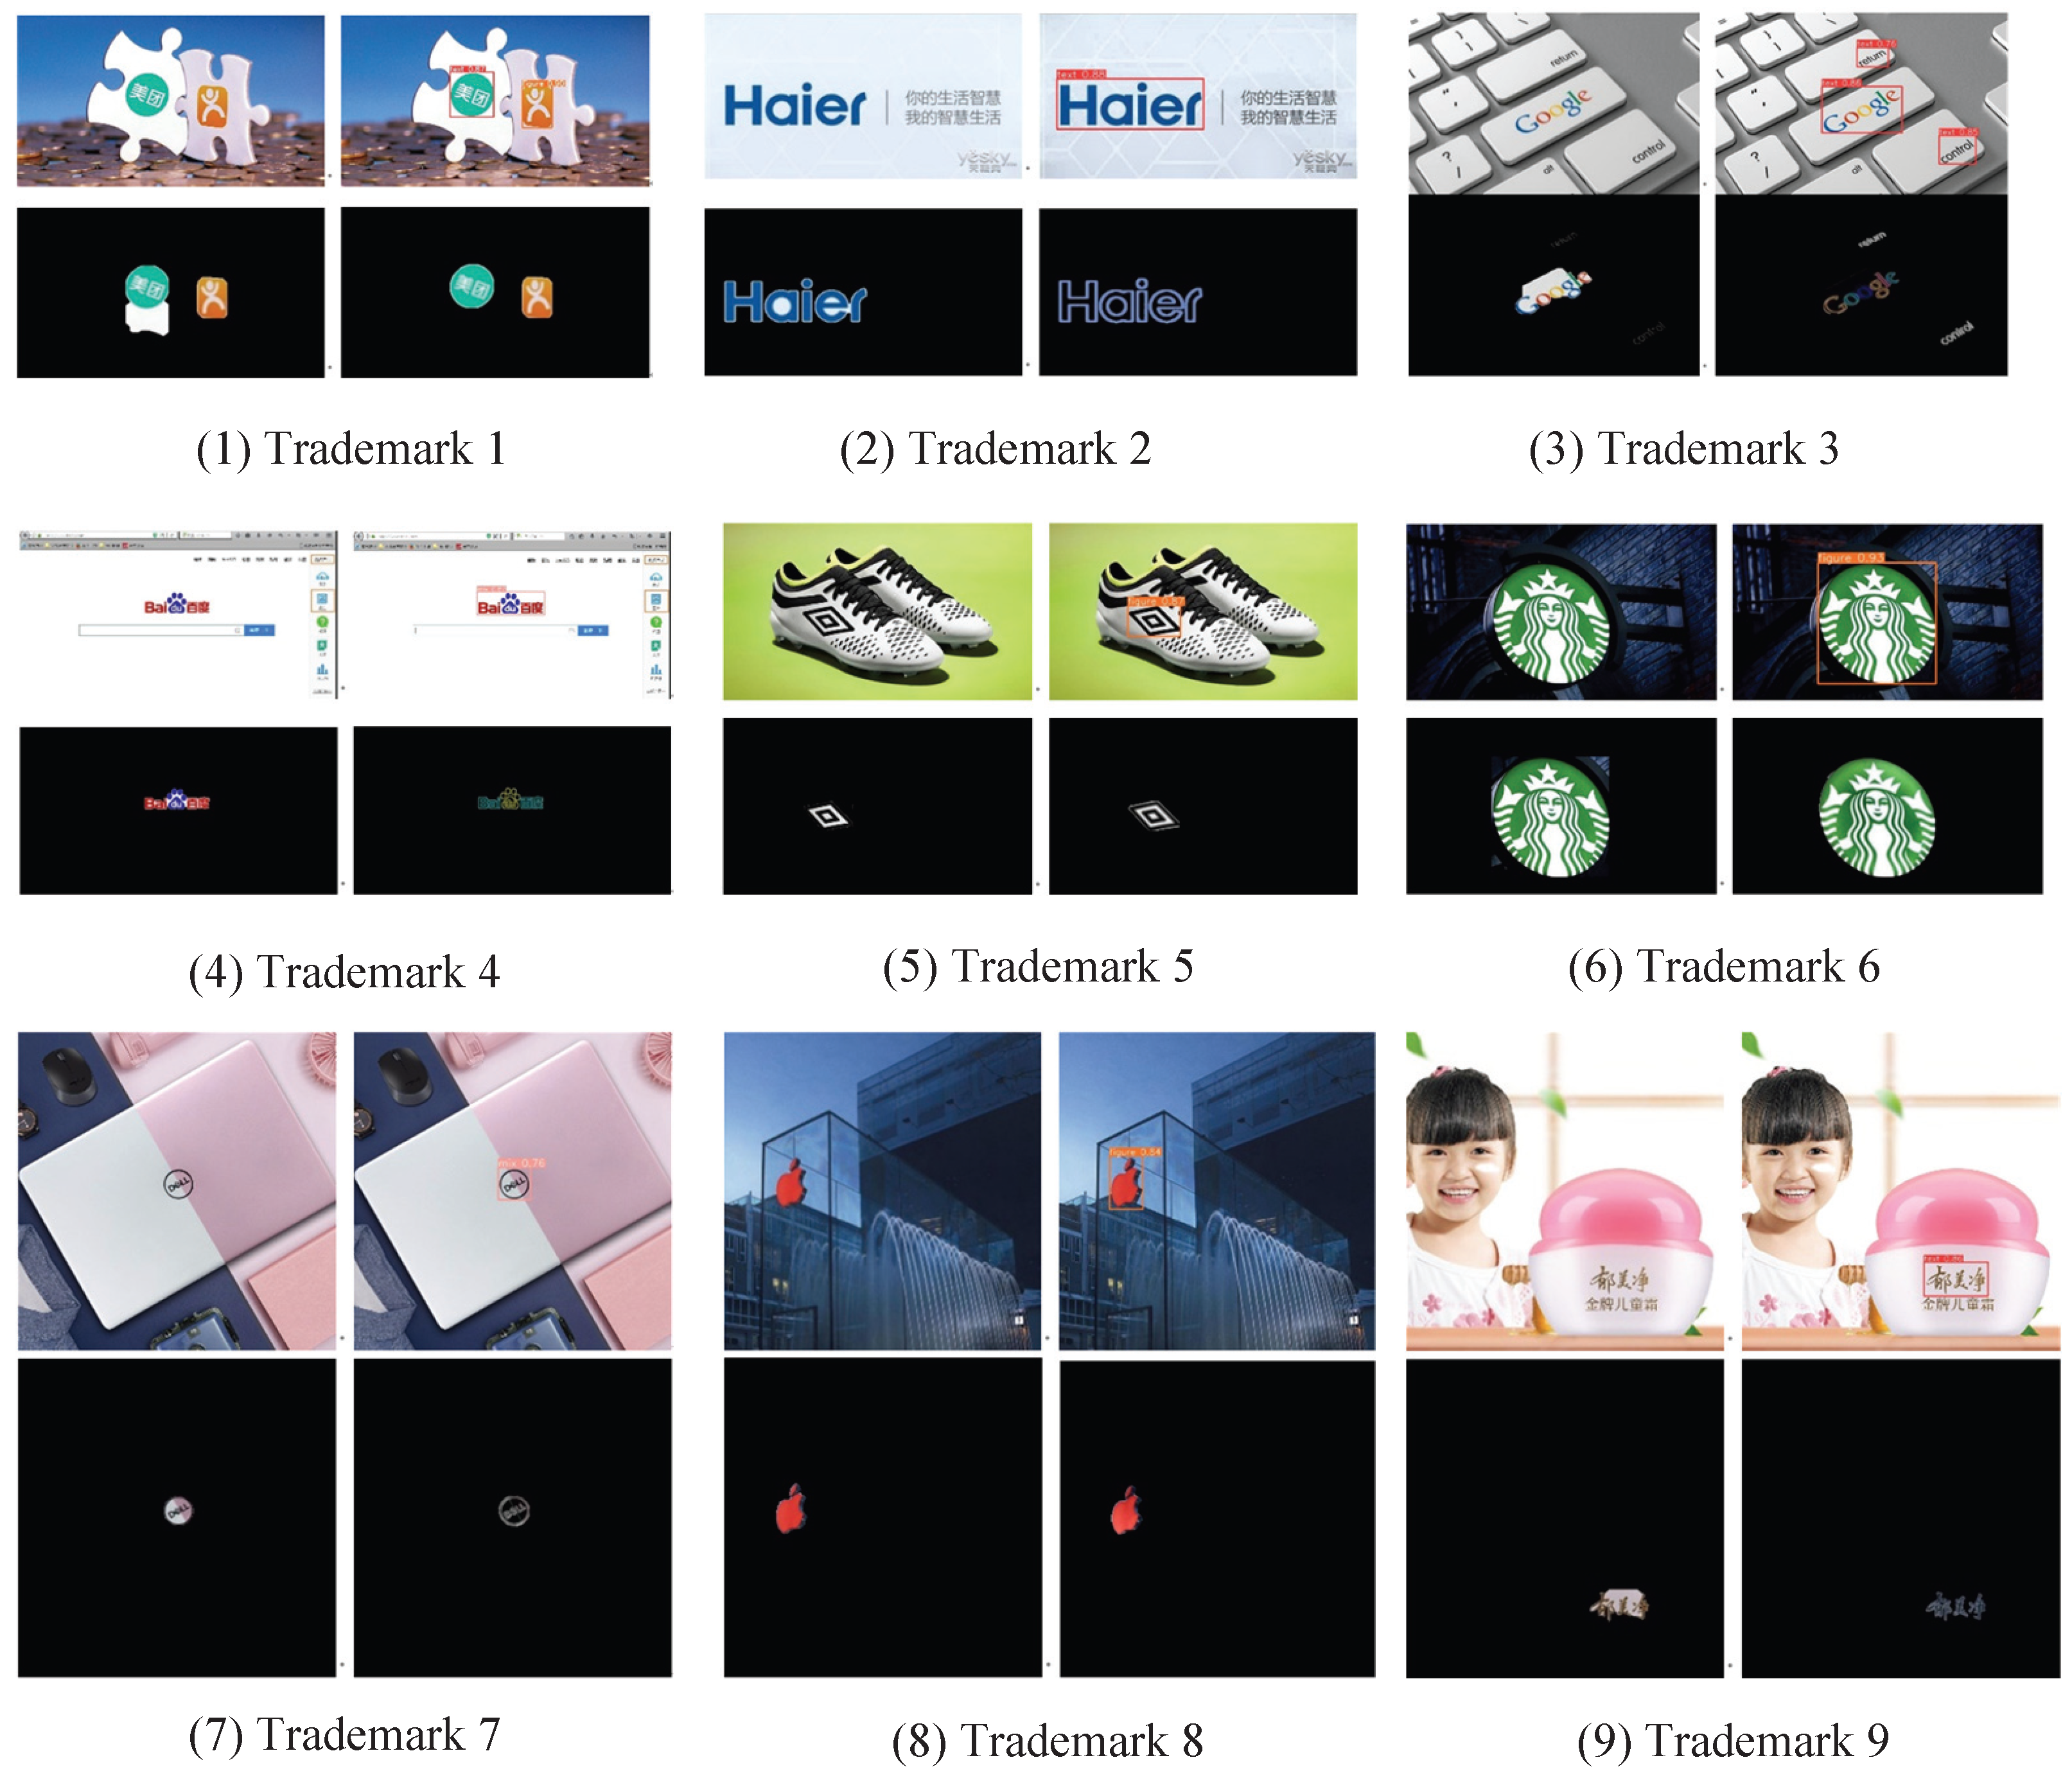
A visual analysis of the logo segmentation effects is presented. As shown in Figure 8, nine groups of data were used for comparison, with each group consisting of four images: the original image, rectangle detection, segmentation using the baseline algorithm, and segmentation using the proposed algorithm. From the results, several key observations can be made:
(1)
First Group (Figure and Mix Categories): The baseline method achieved incomplete segmentation, with excessive background extraction. In contrast, the proposed algorithm, benefiting from its image equalization process, effectively suppressed background interference and extracted highly complete foreground targets.
(2)
Second Group (Text-Based Logos): While the baseline method accurately located the rectangular regions of text-based logos, it introduced white noise around the letters “A” and “E,” which were inadvertently included in the segmentation. The proposed algorithm, leveraging mathematical morphology operations, successfully removed boundary noise through erosion and separated the intertwined “E” and “R” letters, resulting in cleaner and more precise target extraction.
(3)
Third Group (Text-Based Logos): The baseline method failed to detect two out of three text-based targets, misclassifying them as background. Additionally, it incorrectly included background elements above the “Google” logo. The proposed algorithm demonstrated superior performance, achieving both high accuracy and completeness in foreground segmentation.
(4)
Fourth Group: Similar challenges were observed in this group as in the second group, but the proposed algorithm successfully addressed these issues.
(5)
Fifth and Sixth Groups (Graphic-Based Logos): In the fifth group, the baseline method lost the outer black rectangle during target extraction. While the proposed algorithm retained some background information, it achieved a more complete segmentation of the logo shape. In the sixth group, although the baseline method preserved all foreground information, it also extracted bright background regions due to poor contrast. The proposed algorithm minimized these issues by reducing the impact of brightness variations, yielding an optimal segmentation result.
(6)
Seventh, Eighth, and Ninth Groups (Small Logo Segmentation): These groups focused on small logos from different categories: For the “DELL” logo, the proposed algorithm, utilizing morphological erosion and dilation, directly refined the main elements—the circle and text—producing a clearer result; the “Apple” logo, with its distinct color contrast, was accurately segmented by both methods, though the proposed algorithm showed slight improvements in boundary precision; the baseline method exhibited significant shortcomings in segmenting the “Yujing” logo, while the proposed algorithm achieved a more robust and accurate extraction.
The experimental results demonstrate that the proposed method significantly outperforms the baseline approach in terms of pixel accuracy for text-based logos. Although improvements for non-text logos were less pronounced, the enhanced algorithm showed marked advancements over the original method in key performance metrics such as completeness, cleanliness, and efficiency. These findings underscore the potential of carefully designed algorithmic optimizations to enhance image-processing capabilities across multiple dimensions.

4.3. Quantitative Analysis

To compute the true positives (TP), false negatives (FN), false positives (FP), and true negatives (TN), the segmentation algorithm employs a binary mask to count foreground and background pixels. Specifically, the foreground is labeled as 1 (or 255 for color masks) and the background as 0. Since direct comparison between two-dimensional (2D) and three-dimensional (3D) data is not feasible, TP, FN, FP, and TN are defined based on pixel-wise correspondence, as shown in Equations (8) to (11).
T P = n p . s u m ( ( p r e _ m a s k = = 1 ) & ( g t _ m a s k = = 255 ) )
F N = n p . s u m ( ( p r e _ m a s k = = 0 ) & ( g t _ m a s k = = 255 ) )
F P = n p . s u m ( ( p r e _ m a s k = = 1 ) & ( g t _ m a s k = = 0 ) )
T N = n p . s u m ( ( p r e _ m a s k = = 0 ) & ( g t _ m a s k = = 0 ) )
As shown in Table 1 and Table 2, the performance of three different types of logos—figure, text, and mix—was evaluated using the original algorithm, the literature-based algorithm, and the AT-Cut algorithm, under the metrics of F-measure and pixel accuracy (PA). The results reveal that compared to the original algorithm, the proposed method achieved the most significant improvement for figure logos, with increases of 18% and 14%, respectively. For text logos, which posed the highest difficulty in segmentation, the proposed algorithm demonstrated improvements of 7.3% and 3.3% under the F1 and PA metrics. This suggests that further development could focus on integrating text-extraction capabilities specifically for this category. Finally, for mix logos, the proposed algorithm achieved marginal but notable improvements of 1% and 1.7% over the original algorithm.
Additionally, when compared to the literature-based method, the proposed algorithm exhibited distinct advantages. While the literature method showed slight improvements in completeness for mix logos, its performance in terms of F-measure was compromised due to interference from complex backgrounds. The proposed algorithm mitigated this issue by incorporating morphological operations, which effectively reduced background noise. Furthermore, the proposed algorithm maintained a clear advantage over both the original and literature-based methods for the other two categories of logos.
Overall, the experimental results confirm that the proposed algorithm can automatically and effectively determine the initial bounding box for logo segmentation. It also demonstrates significant improvements in segmentation accuracy, leading to superior visual segmentation quality compared to the baseline algorithms.

5. Conclusions

To overcome the limitations of manual rectangle labeling, we present an automated trademark detection and localization framework that eliminates human intervention, creating an efficient system for generating initial bounding boxes. These bounding boxes serve as preliminary segmentation regions, which are subsequently optimized through adaptive constraints to precisely define regions of interest (ROI). To mitigate the effects of fine-grained image noise, we developed the YCLAHE algorithm—a specialized enhancement technique for color images that significantly improves trademark visibility while preserving essential structural details.
Additionally, by implementing category-specific erosion and dilation operations tailored to three major trademark types, our method achieves more accurate and visually coherent segmentations compared to conventional approaches. The average F-measure index reached 89.5%, which is 7.2% higher than the latest YOLO-Grabcut method; the average PA index reached 90.5%, which is 5.1% higher than the latest YOLO-Grabcut method. Comprehensive evaluation through extensive qualitative and quantitative experiments across diverse image datasets demonstrates the algorithm’s superior segmentation performance, while statistical analysis confirms the robustness and reliability of our AT-Cut framework.
However, due to the limited number of available sample data, the generalization ability of the method proposed in this study needs further validation. We will further improve and validate the method proposed in this paper on larger datasets, such as the METU 930k logo dataset, in the future.

Author Contributions

Conceptualization, X.W. and J.W.; methodology, X.W. and J.W.; software, J.W.; validation, J.W.; formal analysis, X.W. and J.W.; investigation, X.W. and J.W.; resources, X.W.; data curation, J.W.; writing—draft J.W.; writing—formal X.W.; visualization, J.W.; supervision, X.W.; project administration, X.W.; funding acquisition, X.W. All authors have read and agreed to the published version of the manuscript.

Funding

This study was supported by funding from the National Key Research and Development Program of China under grant number 2021YFC3340402.

Data Availability Statement

The original contributions presented in this study are included in the article. Further inquiries can be directed to the corresponding author.

Acknowledgments

Thank Zhiduoduo Technology Co., Ltd. for providing the experimental data in this paper.

Conflicts of Interest

The authors declare no conflicts of interest.

References

  1. Tursun, O.; Denman, S.; Sivapalan, S.; Sridharan, S.; Fookes, C.; Mau, S. Component-Based Attention for Large-Scale Trademark Retrieval. IEEE Trans. Inf. Forensics Secur. 2022, 17, 2350–2363. [Google Scholar] [CrossRef]
  2. Appana, V.; Guttikonda, T.M.; Shree, D.; Bano, S.; Kurra, H. Similarity Score of Two Images using Different Measures. In Proceedings of the 2021 6th International Conference on Inventive Computation Technologies (ICICT), Coimbatore, India, 20–22 January 2021; pp. 741–746. [Google Scholar] [CrossRef]
  3. Li, J. Image Infringement Judgement with CNN-based Face Recognition. In Proceedings of the 2022 International Conference on Big Data, Information and Computer Network (BDICN), Sanya, China, 20–22 January 2022; pp. 610–615. [Google Scholar] [CrossRef]
  4. Agarwal, A.; Agrawal, D.; Sharma, D.K. Trademark Image Retrieval using Color and Shape Features and Similarity Measurement. In Proceedings of the 2021 8th International Conference on Computing for Sustainable Global Development (INDIACom), New Delhi, India, 17–19 March 2021; pp. 486–490. [Google Scholar]
  5. Du, W.; Yang, H.; Toe, T.T. An improved image segmentation model of FCN based on residual network. In Proceedings of the 2023 4th International Conference on Computer Vision, Image and Deep Learning (CVIDL), Zhuhai, China, 12–14 May 2023; pp. 135–139. [Google Scholar] [CrossRef]
  6. Mahmud Auvy, A.A.; Zannah, R.; Mahbub-E-Elahi; Sharif, S.; Mahmud, W.A.; Noor, J. Semantic Segmentation with Attention Dense U-Net for Lung Extraction from X-Ray Images. In Proceedings of the 2024 6th International Conference on Electrical Engineering and Information & Communication Technology, Dhaka, Bangladesh, 2–4 May 2024; pp. 658–663. [Google Scholar] [CrossRef]
  7. Zhiyong Ju, C.Z.; Zhang, W. Color Commodity Label Image Segmentation Method Based on SVM and Region Growth. Electron. Sci. Technol. 2021, 34, 69–74. [Google Scholar] [CrossRef]
  8. S., P.; K., J.A.S. Object Segmentation Based on the Integration of Adaptive K-means and GrabCut Algorithm. In Proceedings of the 2022 International Conference on Wireless Communications Signal Processing and Networking (WiSPNET), Chennai, India, 24–26 March 2022; pp. 213–216. [Google Scholar] [CrossRef]
  9. Zhu, W.; Peng, B. Manifold-based aggregation clustering for unsupervised vehicle re-identification. Knowl.-Based Syst. 2022, 235, 107624. [Google Scholar] [CrossRef]
  10. He, J.; Li, A.; Li, H.; Liao, Y.; Gong, B.; Rao, Y.; Liang, W.; Wu, J.; Wen, Y. Visible Light Image Automatic Recognition and Segmentation Method for Overhead Power Line Insulators Based on Yolo v5 and Grabcut. South. Power Syst. Technol. 2023, 17, 128–135. [Google Scholar] [CrossRef]
  11. Yao, W.D.; Li, P.; Zhao, Y.; Wu, H. Review of research on face deepfake detection methods. J. Image Graph. 2025, 30, 2343–2363. [Google Scholar] [CrossRef]
  12. Minjie, Z.; Diqing, Z.; Yan, S.; Yilian, Z. Fingerprint Identification Technology of Power IOT Terminal based on Network Traffic Feature. In Proceedings of the 2023 IEEE 3rd International Conference on Information Technology, Big Data and Artificial Intelligence (ICIBA), Chongqing, China, 26–28 May 2023; Volume 3, pp. 1711–1715. [Google Scholar] [CrossRef]
  13. Manikandan, K.; Olayil, R.; Govindan, R.; Thangavelu, R. Artificial Intelligence Based Drone Control for Monitoring Military Environment and Its Security Applications. In Proceedings of the 2024 8th International Conference on I-SMAC (IoT in Social, Mobile, Analytics and Cloud) (I-SMAC), Kirtipur, Nepal, 3–5 October 2024; pp. 572–576. [Google Scholar] [CrossRef]
  14. Bhatia, S.; Sharma, M. Deep Learning Technique to Detect Fake Accounts on Social Media. In Proceedings of the 2024 11th International Conference on Reliability, Infocom Technologies and Optimization (Trends and Future Directions) (ICRITO), Noida, India, 14–15 March 2024; pp. 1–5. [Google Scholar] [CrossRef]
  15. Xu, J. The Boundaries of Copyright Protection for Deep Learning Technologies of Artificial Intelligence. In Proceedings of the 2023 4th International Conference on Big Data, Artificial Intelligence and Internet of Things Engineering (ICBAIE), Hangzhou, China, 25–27 August 2023; pp. 209–213. [Google Scholar] [CrossRef]
  16. Liu, L.; Wang, X.; Huang, X.; Bao, Q.; Li, X.; Wang, Y. Abnormal operation recognition based on a spatiotemporal residual network. Multim. Tools Appl. 2024, 83, 61929–61941. [Google Scholar] [CrossRef]
  17. Fulkar, B.; Patil, P.; Srivastav, G.; Mahale, P. Predicting Agricultural Crop Damage Caused by Unexpected Rainfall Using Deep Learning. In Proceedings of the 2024 International Conference on Intelligent Systems for Cybersecurity (ISCS), Gurugram, India, 3–4 May 2024; pp. 1–5. [Google Scholar] [CrossRef]
  18. Purushothaman, K.E.; Ragavendran, N.; Ramesh, S.P.; Karthikeyan, V.G.; Uma Maheswari, G.; Saravanakumar, R. Innovative Urban Planning for Harnessing Blockchain and Edge Artificial Intelligence for Smart City Solutions. In Proceedings of the 2024 Second International Conference on Intelligent Cyber Physical Systems and Internet of Things (ICoICI), Coimbatore, India, 20–30 August 2024; pp. 65–68. [Google Scholar] [CrossRef]
  19. Zhu, W.; Peng, B. Sparse and low-rank regularized deep subspace clustering. Knowl.-Based Syst. 2020, 204, 106199. [Google Scholar] [CrossRef]
  20. Wang, X.; Li, D.; Li, S.; Sun, Y.; Lan, S. TV Corner-Logo Adaptive Threshold Segmentation Algorithm Based on Saliency Detection. In Proceedings of the 2019 Fifth International Conference on Instrumentation and Measurement, Computer, Communication and Control (IMCCC), Qinhuangdao, China, 18–20 September 2019; pp. 1885–1888. [Google Scholar] [CrossRef]
  21. Wu, M.; Xiao, W.; Hong, Z. Similar image retrieval in large-scale trademark databases based on regional and boundary fusion feature. PLoS ONE 2018, 13, e0205002. [Google Scholar] [CrossRef]
  22. Jardim, S.V.B.; António, J.; Mora, C. Graphical Image Region Extraction with K-Means Clustering and Watershed. J. Imaging 2022, 8, 163. [Google Scholar] [CrossRef]
  23. Long, J.; Feng, X.; Zhu, X.; Zhang, J.; Gou, G. Efficient Superpixel-Guided Interactive Image Segmentation Based on Graph Theory. Symmetry 2018, 10, 169. [Google Scholar] [CrossRef]
  24. Yingjie Yue, P.L.; Xu, R. A High Precision Segmentation Algorithm of Sports Trademark. Comput. Appl. Softw. 2022, 39, 246–251. [Google Scholar]
  25. Alshowaish, H.; Al-Ohali, Y.; Al-Nafjan, A. Trademark Image Similarity Detection Using Convolutional Neural Network. Appl. Sci. 2022, 12, 1752. [Google Scholar] [CrossRef]
  26. H, S.; H, L. Research on image recognition based on different depths of VGGNet. Image Process. Theory Appl 2024, 7, 84–90. [Google Scholar]
  27. He, K.; Zhang, X.; Ren, S.; Sun, J. Deep Residual Learning for Image Recognition. In Proceedings of the 2016 IEEE Conference on Computer Vision and Pattern Recognition, CVPR 2016, Las Vegas, NV, USA, 27–30 June 2016; IEEE Computer Society: Los Alamitos, CA, USA, 2016; pp. 770–778. [Google Scholar] [CrossRef]
  28. Guan, B.; Ye, H.; Liu, H.; Sethares, W.A. Video Logo Retrieval Based on Local Features. In Proceedings of the 2020 IEEE International Conference on Image Processing (ICIP), Abu Dhabi, United Arab Emirates, 25–28 October 2020; pp. 1396–1400. [Google Scholar] [CrossRef]
  29. Kumar, S.; Negi, A.; Singh, J.; Verma, H. A Deep Learning for Brain Tumor MRI Images Semantic Segmentation Using FCN. In Proceedings of the 2018 4th International Conference on Computing Communication and Automation (ICCCA), Greater Noida, India, 14–15 December 2018; pp. 1–4. [Google Scholar] [CrossRef]
  30. Pan, C.; Yan, W. Object detection based on saturation of visual perception. Multim. Tools Appl. 2020, 79, 19925–19944. [Google Scholar] [CrossRef]
  31. Zhu, W.; Peng, Y. Elastic net regularized kernel non-negative matrix factorization algorithm for clustering guided image representation. Appl. Soft Comput. 2020, 97, 106774. [Google Scholar] [CrossRef]
  32. Shulgin, M.; Makarov, I. Scalable Zero-Shot Logo Recognition. IEEE Access 2023, 11, 142702–142710. [Google Scholar] [CrossRef]
  33. Tursun, O.; Aker, C.; Kalkan, S. A Large-scale Dataset and Benchmark for Similar Trademark Retrieval. arXiv 2017, arXiv:1701.05766. [Google Scholar] [CrossRef]
  34. Su, H.; Zhu, X.; Gong, S. Open Logo Detection Challenge. In Proceedings of the British Machine Vision Conference 2018, BMVC 2018, Newcastle, UK, 3–6 September 2018; Springer Press: Heidelberg, Germany, 2018; p. 16. [Google Scholar]
  35. Wang, J.; Min, W.; Hou, S.; Ma, S.; Zheng, Y.; Jiang, S. LogoDet-3K: A Large-Scale Image Dataset for Logo Detection. ACM Trans. Multim. Comput. Commun. Appl. 2022, 18, 21:1–21:19. [Google Scholar] [CrossRef]
  36. Hou, Q.; Min, W.; Wang, J.; Hou, S.; Zheng, Y.; Jiang, S. FoodLogoDet-1500: A Dataset for Large-Scale Food Logo Detection via Multi-Scale Feature Decoupling Network. In Proceedings of the MM ’21: ACM Multimedia Conference, Virtual Event, China, 20–24 October 2021; Shen, H.T., Zhuang, Y., Smith, J.R., Yang, Y., César, P., Metze, F., Prabhakaran, B., Eds.; ACM: New York, NY, USA, 2021; pp. 4670–4679. [Google Scholar] [CrossRef]
  37. Nguyen, D.; Nguyen, T.; Do, T.; Ngo, T.D.; Le, D. U15-Logos: Unconstrained Logo Dataset with Evaluation by Deep learning Methods. In Proceedings of the International Conference on Multimedia Analysis and Pattern Recognition, MAPR 2020, Hanoi, Vietnam, 8–9 October 2020; IEEE: Piscataway, NJ, USA, 2020; pp. 1–6. [Google Scholar] [CrossRef]
  38. Li, L.; Wang, X.; Yan, W.Q. Enhanced multi-scale trademark element detection using the improved DETR. Sci. Rep. 2024, 14, 29174. [Google Scholar] [CrossRef]
  39. Zhou, B.; Wang, X.; Zhou, W.; Li, L. Trademark Text Recognition Combining SwinTransformer and Feature-Query Mechanisms. Electronics 2024, 13, 2814. [Google Scholar] [CrossRef]
  40. Rother, C.; Kolmogorov, V.; Blake, A. “GrabCut”: Interactive foreground extraction using iterated graph cuts. ACM Trans. Graph. 2004, 23, 309–314. [Google Scholar] [CrossRef]
  41. Liu, F.; Liu, Z.; Liu, W.; Zhao, H. Combining the YOLOv5 and Grabcut Algorithms for Fashion Color Analysis of Clothing. In Proceedings of the 2022 5th World Conference on Mechanical Engineering and Intelligent Manufacturing (WCMEIM), Ma’anshan, China, 18–20 November 2022; pp. 1126–1129. [Google Scholar]
Figure 1. Data processing flowchart.
Electronics 14 03914 g001
Figure 2. Histogram of Y channel regions.
Electronics 14 03914 g002
Figure 3. Image-equalization effect.
Electronics 14 03914 g003
Figure 4. The process of using YOLOv8 to process trademark images.
Electronics 14 03914 g004
Figure 5. Examples of rectangular predictions for trademark locations.
Electronics 14 03914 g005
Figure 7. Corrosion and expansion variation diagram.
Electronics 14 03914 g007
Figure 8. Comparison of segmentation effects.
Electronics 14 03914 g008
Table 1. Comparison of segmentation accuracy of different methods in terms of F-measure.
TextFigureMixAverage
Original algorithm8376.38380.8
YOLO-Grabcut [41]90758282.3
MSTED-Net [38]89.879.186.385.1
SwinCornerTR [39]90.683.185.586.4
AT-Cut90.394.38489.5
Table 2. Comparison of segmentation accuracy of different methods in terms of P A .
TextFigureMixAverage
Original algorithm7984.389.384.2
YOLO-Grabcut [41]81.2819485.4
MSTED-Net [38]80.984.688.584.3
SwinCornerTR [39]82.589.787.186.4
AT-Cut82.398.39190.5
Disclaimer/Publisher’s Note: The statements, opinions and data contained in all publications are solely those of the individual author(s) and contributor(s) and not of MDPI and/or the editor(s). MDPI and/or the editor(s) disclaim responsibility for any injury to people or property resulting from any ideas, methods, instructions or products referred to in the content.