Article

A Practical Guide to ECG Device Performance Testing According to International Standards

by
Elzbieta Raus-Jarzabek
1,
Marek Czerw
2,
Andrzej Skowronek
2,
Agnieszka Dąbrowska-Boruch
3,
Ernest Jamro
3 and
Elzbieta Olejarczyk
1,4,*
1
Faculty of Electrical Engineering, Automatics, Computer Science, and Biomedical Engineering, AGH University of Krakow, 30-059 Krakow, Poland
2
Lukasiewicz Research Network-Krakow Institute of Technology, Zakopiańska 73, 30-418 Kraków, Poland
3
Institute of Electronics, Faculty of Computer Science, Electronics and Telecommunications, AGH University of Krakow, 30-059 Krakow, Poland
4
Nalecz Institute of Biocybernetics and Biomedical Engineering, Polish Academy of Sciences, 02-109 Warsaw, Poland
*
Author to whom correspondence should be addressed.
Electronics 2025, 14(19), 3878; https://doi.org/10.3390/electronics14193878
Submission received: 18 July 2025 / Revised: 19 September 2025 / Accepted: 22 September 2025 / Published: 29 September 2025
(This article belongs to the Section Bioelectronics)

Abstract

The primary objective of this paper was to present a complete procedure, including a tester schematic, to test the compliance of any electrocardiographic (ECG) device or its elements, such as the analog front-end (AFE), with the International Electrotechnical Commission (IEC) standards. The paper highlights the importance of designing ECG devices in compliance with the standards, an issue often overlooked in academic research at a lower technology readiness level, and provides detailed guidance on the testing procedure. A measurement system designed to evaluate the performance of ECG devices in accordance with three IEC standards (60601-2-25, 60601-2-27, and 60601-2-47) is presented. A review of standard measurement procedures was conducted using a device equipped with the ADS1298 AFE. The measurements demonstrating the ADS1298’s compliance with the IEC 60601-2-25 ECG standard were performed using the ECG Tester TEST, manufactured by the Łukasiewicz Research Network–Krakow Institute of Technology, Biomedical Engineering Center.

1. Introduction

Electrocardiography (ECG) remains the cornerstone of non-invasive cardiac diagnostics, playing a crucial role in the detection and monitoring of heart conditions, including arrhythmias, ischemia, and myocardial infarction. With the continuous evolution of healthcare technologies, the focus has shifted towards developing compact, accurate, and standard-compliant ECG acquisition systems, especially those suitable for portable and wearable applications. A major challenge in this development lies in ensuring the consistency and comparability of ECG signals across different devices, which requires rigorous compliance with international standards, most notably IEC 60601-2-25 [1], IEC 60601-2-47 [2], and IEC 60601-2-27 [3].
In 2009, Silva et al. [4] proposed a system for ECG conformity assessment according to the International Electrotechnical Commission (IEC) 60601-2-51 [5] and the International Organization of Legal Metrology (in French: Organisation Internationale de Métrologie Légale: OIML) R90 standards [6]. This system was composed of two subsystems, one for testing electrical safety and the other for testing device performance. The first subsystem, based on commercial equipment, was used to test grounding, leakage current, and insulation. The second subsystem, consisting of a digital-to-analog converter, three signal conditioners, and LabVIEW software, was used to test ECG parameters.
In 2011, the IEC 60601-2-51 standard was replaced by IEC 60601-2-25, which combined and updated both the first edition of IEC 60601-2-25 and IEC 60601-2-51. In recent years, several authors have drawn attention to the problem of ECG device compliance with currently applicable standards [7,8,9,10]. Gordillo-Roblero et al. [7] proposed the Kenshin device based on another AFE (ADAS1000, Analog Devices, Inc., Wilmington, MA, USA) to test such parameters as system noise level and skew between channels in compliance with the standard IEC 60601-2-25. The authors emphasize that a diagnostic ECG device must have ≤30 μV system noise, ≥5 μV resolution, a ≥500 sps sampling frequency, and tight inter-channel synchronization (skew < 100 μs), while Campillo et al. [8] built an ECG device based on ADS1298 and proved its compliance with IEC 60601-2-25 with regard to some other parameters. They reported a passband of 0.05–150 Hz, a CMRR ≈ 93.7 dB (well above the 89 dB minimum), intrinsic channel noise ≈ 9 μVpp (<30 μV allowed), crosstalk < 2%, and amplitude quantization of ∼3.1 μV (also within the 5 μV limit).
In our study, we have expanded the range of tested parameters, providing a comprehensive and complete testing procedure accompanied by a detailed diagram of a tester designed for this purpose, i.e., the ECG Tester TEST, manufactured by the Łukasiewicz Research Network–Krakow Institute of Technology, Biomedical Engineering Center. The proposed testing procedure considers key diagnostic parameters such as input impedance, crosstalk, noise level, sensitivity, linearity, and frequency response. The performance of diagnostic ECG devices is tightly constrained by the IEC 60601-2-25 standard, which specifies essential safety and signal-quality requirements. In particular, the input impedance of an instrumentation amplifier integrated with an analog–digital converter must be very high (≥2.5 MΩ, typically verified with a 620 kΩ‖4.7 nF network) [11], the passband must be effectively 0.05–150 Hz, and the system noise must be very low (IEC allows < 30 μVpp) with a fine resolution (≤5 μV per least-significant bit) [12]. High common-mode rejection (~90 dB at 50/60 Hz) and minimal channel-to-channel crosstalk (<2%) are also mandated [11]. Modern multichannel ECG AFEs are built with these targets in mind. For example, Texas Instruments’ ADS1298 (an eight-channel, 24-bit ΔΣ ADC) provides very low noise and high input impedance suitable for full 12-lead ECG. With careful analog design (e.g., driven-right-leg feedback and anti-alias filtering), such ADC front ends can in principle meet the IEC benchmarks for bandwidth, noise, and common-mode rejection (CMRR).
The testing procedure was performed using the ADS1298, an eight-channel, 24-bit analog front-end (AFE) developed by Texas Instruments Incorporated (Dallas, TX, USA) [13]. Its high resolution, low noise performance, and integrated features—including programmable gain amplifiers and right-leg drive—make it a popular choice in both commercial and research-grade ECG devices.
The ADS1298 is suitable for clinical-grade wearable systems, where multiple leads, accuracy, and standards compliance are critical. Other competing AFEs, such as the ADAS1000 and MAX30003 biopotential AFE (Analog Devices, Inc., Wilmington, MA, USA) originally introduced by Maxim Integrated), are also used in ECG devices [7,14]. However, the ADAS1000 is a better choice for designing a device that simultaneously records multi-physiological data (ECG, respiration, and pace) and when multi-lead scaling is desired, whereas the MAX30003 is ideal for designing ultra-low-voltage, single-lead wearable devices, providing a power-efficient, smart sensor design. Nevertheless, the selection and testing of the best AFE was not the primary goal of this paper.
The main objective of our study was to present an exhaustive, clause-based procedure for device validation in accordance with IEC 60601-2-25/-27/-47 standards, using the ADS1298 AFE as an example. Moreover, a purpose-built ECG TEST circuit diagram with complete documentation is provided to support the validation. This practical guide, which includes a set of circuit diagrams, switch tables, and operating guidelines, aims to enable other teams to test the compliance of their own ECG devices with the standards and maintain consistency of results across different research centers.
This approach is particularly useful given the growing interest in developing wearable ECG devices, from single-lead patches and wrist devices to textile multi-lead systems, satisfying clinical-grade ECG quality even under motion and daily-life conditions [14,15,16,17]. Hardware capabilities and validation methodologies are key factors in meeting clinical requirements. Our approach addresses these needs.

2. Materials and Methods

2.1. International ECG Standards: 60601-2-25, 60601-2-27, and 60601-2-47

Portable and wearable ECG devices are subject to specific safety and heating tests under IEC and ISO guidelines [1,2,3]. The following three standards for ECG equipment are currently in force: 60601-2-25 (diagnostic electrocardiographs) [1], 60601-2-47 (ambulatory ECG) [2], and 60601-2-27 (ECG patient monitors) [3].

2.2. Experimental Setup

The experimental setup was composed of the ECG Tester TEST (manufactured by the Łukasiewicz Research Network–Krakow Institute of Technology, Biomedical Engineering Center), an ADS1298 analog front-end [13], a function generator, high-quality shielded cables (ASPEL KEKG-30R v.202), and BNC connectors.

2.2.1. ECG Tester TEST

The ECG Tester TEST was designed to test the performance of ECG devices, in particular devices equipped with the ADS1298, in accordance with the standards provided by various IEC norms.
This tester facilitates the measurement of key parameters such as input impedance, gain, overload tolerance, channel crosstalk, noises, frequency response, signal fidelity, dynamic range, and signal quality.
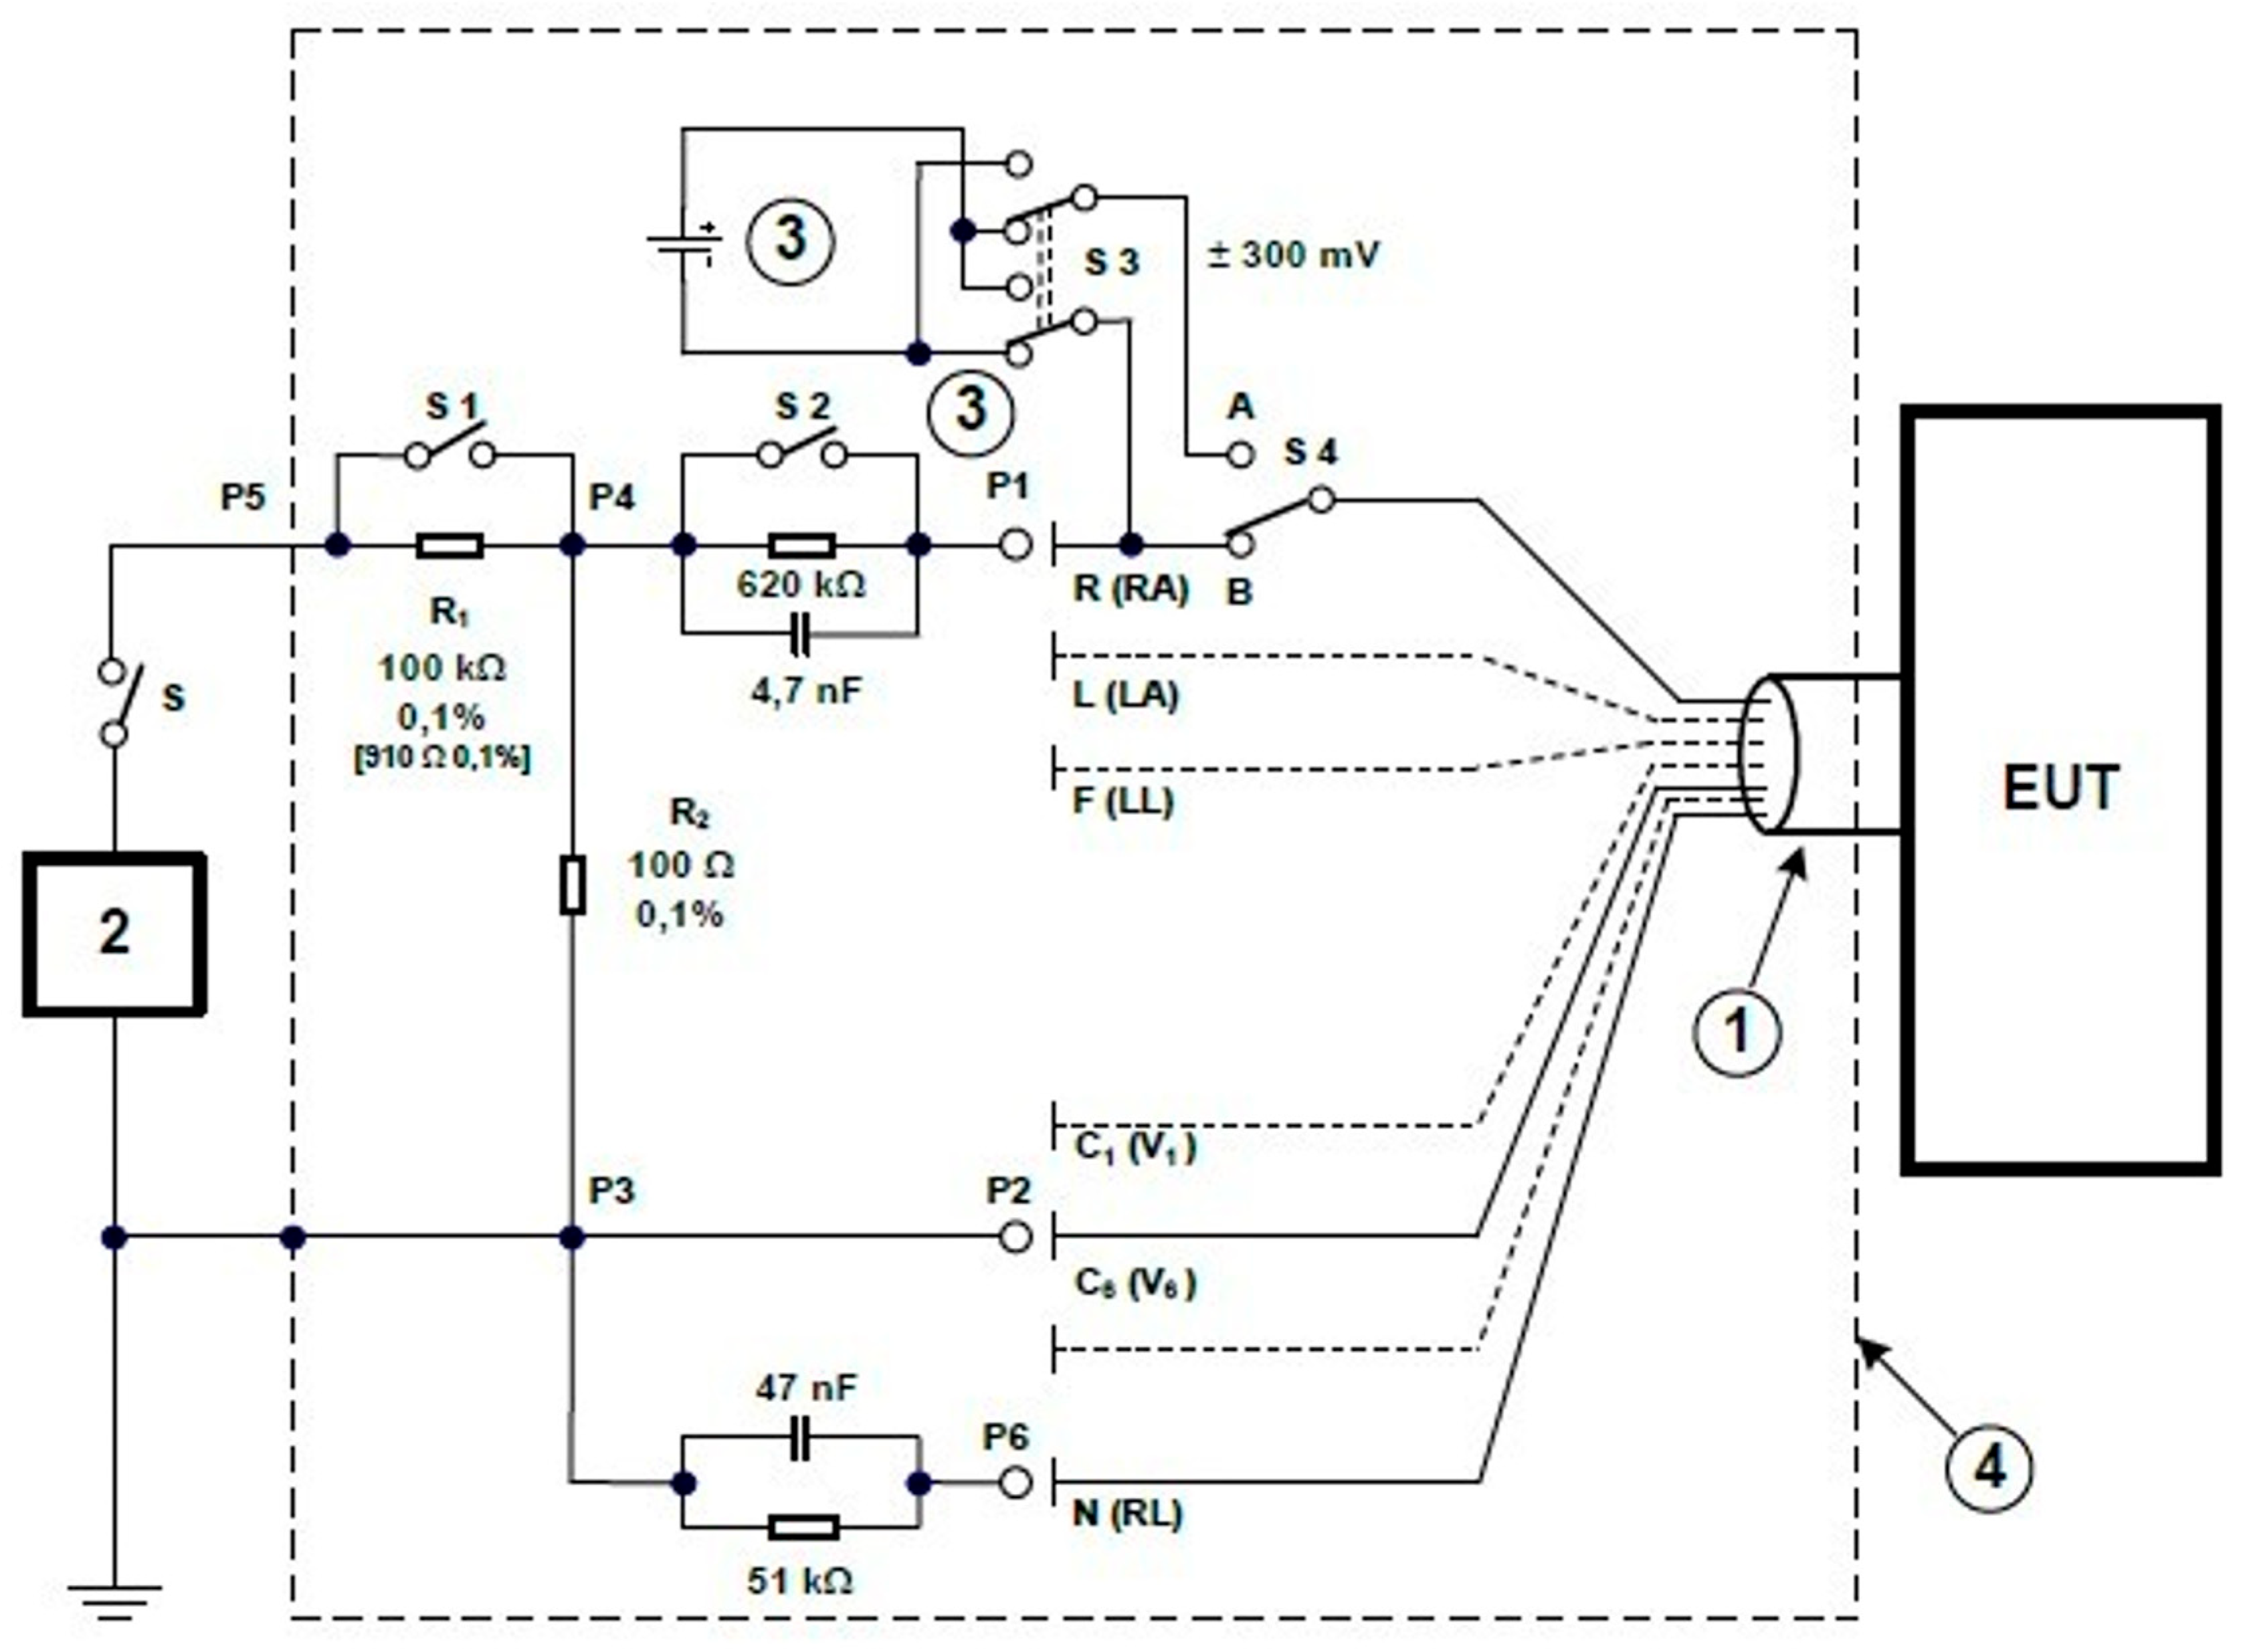
The testing of the input paths of electrocardiographs and ambulatory electrocardiographic systems was performed using test systems compliant with Figure 201.110 of the IEC 60601-2-25:2016-01 standard [1] (see Figure 1), Figure 104 of the IEC 60601-2-47:2015-09 standard [2] (see Figure 2), and Figure 111 of the IEC 60601-2-27: 2014-11 standard [3] (see Figure 3).
With reference to IEC 60601-2-27:2014-11, the following clauses are distinguished:
  • 201.12.1.101.1—Signal reproduction accuracy;
  • 201.12.1.101.2—Dynamic range and differential offset voltage;
  • 201.12.1.101.3—Input impedance;
  • 201.12.1.101.5—Inter-channel crosstalk;
  • 201.12.1.101.6—Gain adjustment and stability;
  • 201.12.1.101.7—Slew rate;
  • 201.12.1.101.8—Frequency and impulse response;
  • 201.12.1.101.9—Gain indicator—characteristic;
  • 201.12.1.101.11—Isoline reset;
  • 201.12.1.101.14—Cardioversion pulse synchronization;
  • 201.12.1.101.15—HR range and accuracy, QRS detection range.
The Tester ECG TEST housing designed at the Lukasiewicz–KIT Biomedical Engineering Center is shown in Figure 4, while the schematic diagram of this tester is shown in Figure 5. The sockets and switches are described below.
  • P1 Group of parallel connected sockets (yellow) for connecting selected ECG track inputs;
  • P2 Group of parallel connected sockets (red) for connecting the remaining ECG track inputs;
  • P3 Group of parallel connected sockets (black) for the reference signal, e.g., ECG track N input;
  • G1 Socket for connecting a pulse signal generator (signal fed to P1);
  • G2 Socket for connecting a pulse signal generator connected directly to P2;
  • G+ Socket for connecting a sinusoidal signal generator (signal fed to P1);
  • G− Socket for connecting a sinusoidal signal generator connected directly to P2.
Functional grounding socket:
  • SW1 RC two-terminal bypass switch for measuring the input impedance of the ECG input;
  • SW2 Offset voltage polarity change switch;
  • SW3 Offset switch differentially between P1 and P2 or jointly with respect to P3;
  • SW4 Switch shorting the upper resistor of the signal divider fed from the generator between G+ and GSW5.
Switch cutting off the signal from the generators from P1:
  • SW6 Switch shunting the RC two-terminal in the P3 reference electrode path;
  • SW7 Switch changing the method of supplying the offset signal;
  • SW8 Switch enabling and disabling the offset supplied in series with the input signal;
  • SW9 Switch shorting groups P2 and P3;
  • SW10 Switch selecting the offset voltage source (it requires the presence of two batteries to obtain 14.4 V);
  • SW11 Offset generation system power switch;
  • RV1 Potentiometer for offset voltage correction for SW10 in position 1;
  • RV2 Potentiometer for offset voltage correction for SW10 in position 3.
In order to obtain a measuring system in accordance with Figure 1, the switches should be set to the positions given in Table 1, whereas, in order to obtain a measuring system compliant with Figure 2, the switches must be set to the positions given in Table 2 before starting the test. In the arrangement shown in Figure 3, before performing the dedicated test, the switches must be adjusted to the positions given in Table 3. Table 4, Table 5 and Table 6 describe the appropriate mappings among switches in the figures.
Figure 5 depicts the ECG TEST tester schematic used in the examinations performed according to the ECG norms.

2.2.2. ADS1298 Analog Front-End

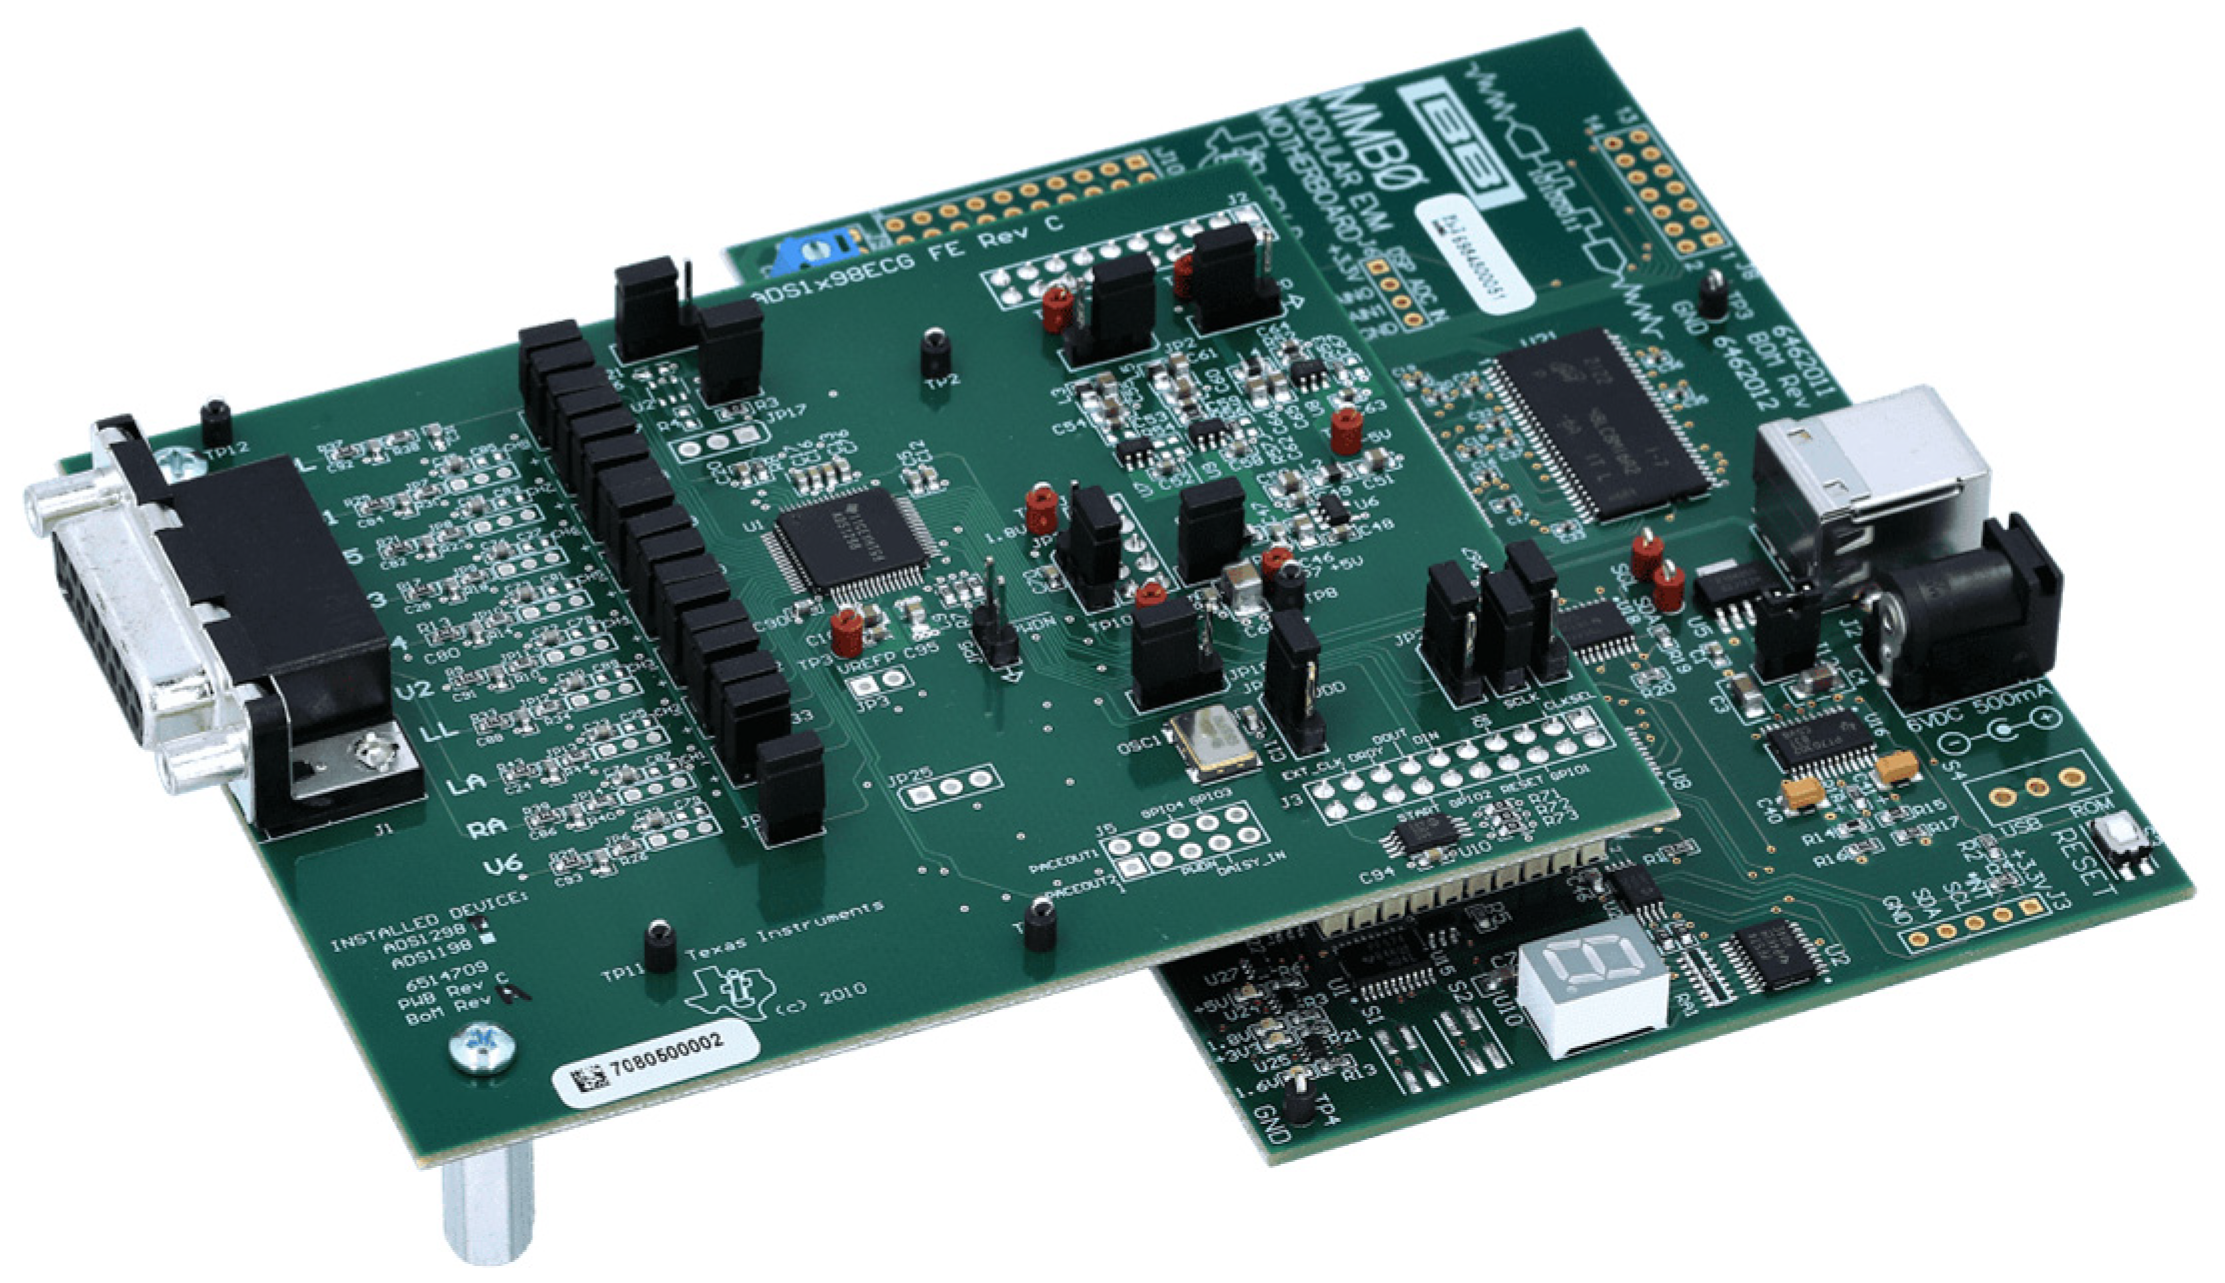
The ADS1298 is a high-performance, 8-channel, 24-bit analog-to-digital converter designed for ECG signal acquisition (cf. Figure 6). To ensure that the ADS1298 accurately captures and converts ECG signals, it must undergo thorough testing under various signal conditions. In this experimental setup, impulse, triangle, and sine wave signals were used to evaluate the device’s performance across a range of real-world scenarios.
An impulse signal is a short-duration, high-amplitude pulse used to test a system’s response to sudden, transient changes in voltage. This type of signal is particularly useful for assessing the ADS1298’s ability to handle rapid voltage spikes and transient responses that might occur in certain heart conditions, such as arrhythmias or premature ventricular contractions.
The triangle wave is a periodic waveform that rises and falls linearly, making it ideal for testing the linearity and frequency response of the ADS1298. This waveform allows testers to assess the device’s ability to capture smooth, gradual changes in voltage, which are common in slow, regular heartbeats. It is also useful for verifying the dynamic range and checking for distortion or aliasing issues when the signal is sampled.
The sine wave is perhaps the most natural representation of a pure periodic signal and is used to simulate normal sinus rhythm in ECG testing. It is essential for evaluating the ADS1298’s frequency response, signal-to-noise ratio, and distortion. The sine wave’s continuous and smooth nature makes it ideal for testing the device’s ability to capture steady heartbeats generated under normal conditions in healthy persons.
The ADS1298 is an advanced AFE designed for high-precision ECG signal acquisition. As a critical component in medical diagnostic devices, the ADS1298 offers several advantages that make it particularly suitable for applications requiring high accuracy, low power consumption, and versatile functionality.
One of the most significant advantages of the ADS1298 is its 24-bit-resolution ADC, which allows for extremely precise measurement of biosignals. This high resolution ensures that even the smallest variations in ECG signals are captured with clarity, which is essential for accurate heart activity monitoring. The device also maintains a low noise level, providing an excellent signal-to-noise ratio (SNR), ensuring that the acquired signals are clean and reliable.
Another standout feature of the ADS1298 is its low power consumption, which makes it ideal for portable or battery-powered medical devices. This power efficiency allows devices to operate for extended periods without draining the battery, which is particularly valuable in wearable ECG monitors. Despite its power efficiency, the ADS1298 does not compromise on performance, ensuring high-quality signal acquisition throughout long monitoring sessions.
The ADS1298 also excels in its versatility, offering eight differential input channels, making it suitable for multi-lead ECG systems and providing the capability to capture signals from multiple electrodes simultaneously. This is a key advantage in both diagnostic and ambulatory monitoring systems, where capturing a full range of ECG signals is critical. The device’s integrated programmable gain amplifier (PGA) enables it to handle a wide range of signal strengths, ensuring that weak biosignals are amplified sufficiently without introducing distortion, which is crucial for accurate signal conversion.
Further enhancing its utility, the ADS1298 includes a built-in reference buffer, which improves the device’s stability and reduces the need for external reference components. This integration simplifies the overall system design, reduces the component count, and minimizes potential sources of error, making the device easier to implement in medical systems.
Moreover, the ADS1298 offers a high common-mode rejection ratio (CMRR), ensuring that it effectively rejects unwanted noise and interference from external sources, such as power-line hum. This feature is particularly important in medical settings, where clean and undistorted biosignals are essential for accurate diagnostics. The device also provides high input impedance, which is essential for accurately capturing voltage differences from the body, such as those found in ECG measurements.
To address configuration transparency and its impact on the IEC frequency response test, the ADS1298ECGFE-PDK was chosen. Each channel was sampled at 1000 samples/s, which intentionally oversampled the diagnostic band to preserve fast transients (e.g., pacemaker spikes) and to enable zero-phase offline processing via forward–backward filtering. The programmable gain amplifier was set to ×6 across all leads so that 1 mV ECG features resided comfortably within the ADC’s dynamic range while retaining headroom for overdrive events. Upstream, the analog network provided an ~0.05 Hz high-pass corner for baseline stability and anti-alias protection above 500 Hz. In diagnostic mode, the digital chain comprised a 3rd-order Butterworth 0.05–150 Hz band-pass applied with filtfilt, chosen for its flat magnitude in-band and benign group delay. A separate 8th-order 45 Hz low-pass (also zero-phase) was reserved for non-diagnostic monitoring/HRV analysis only and was not used for IEC amplitude-mask verification. The right-leg drive was enabled and the Wilson central terminal was buffered. These subsystems were tuned during bring-up to balance common-mode rejection with loop stability. Power-line interference was mitigated, when explicitly tested, by a 50 Hz notch implemented as a complex pole-zero IIR section (the provided code sets a pole radius of 0.855 via notch width = 0.145). Characterizing this filter at fs = 1000 Hz shows that −3 dB edges near 29.47 Hz and 69.68 Hz, i.e., a −3 dB bandwidth ≈ 40.2 Hz and a quality factor Q ≈ 1.24. In practical terms, these broad skirts depress nearby frequencies substantially: at 40 Hz the magnitude is ≈0.419 (≈−7.56 dB), corresponding to ~58% attenuation even before any additional low-pass shaping. This alone explains an out-of-tolerance point at 40 Hz for IEC 60601-2-25, clause 201.12.4.107, which allows only ±10% amplitude error in the diagnostic band.
The device’s high-speed data output via SPI (Serial Peripheral Interface), allows for real-time data transmission, which is critical in monitoring applications where immediate feedback or analysis is required. With sampling rates of up to 32 kSPS, the ADS1298 can capture high-frequency signals, ensuring that it can handle dynamic and fast-changing biosignals, such as those found in ECGs.
Additionally, the ADS1298 is a highly integrated solution, combining key components such as the PGA, ADC, and reference buffer into a single chip. This compactness reduces the complexity of the overall system and minimizes the need for external components, simplifying the design and reducing costs. Its flexible configuration options, including integrated low-pass filters, allow for customization based on the specific needs of the application, whether for ECG or other biosignal measurements.
In conclusion, the ADS1298 offers a comprehensive solution for biosignal acquisition, combining high resolution, low power consumption, multiple input channels, and integrated components in a single, compact package. These advantages make it an ideal choice for modern medical devices, particularly in wearable ECG monitoring systems. Its versatility and high performance ensure that it meets the demanding requirements of healthcare applications, providing reliable and accurate data for diagnostics and monitoring.

2.2.3. Cables

High-quality shielded ECG cables designed and manufactured by the ASPEL company (ASPEL KEKG-30R v.202; ASPEL S.A., Zabierzow, Poland) were used to connect the signal generators to the input channels of the ADS1298 and the Łukasiewicz Research Network–Krakow Institute of Technology Biomedical Engineering Center’s ECG Norm Tester (cf. Figure 7). These cables ensured that the generated signals were transmitted without distortion or external interference, which could have skewed the test results.

2.2.4. BNC Connectors

The Łukasiewicz Research Network–Krakow Institute of Technology Biomedical Engineering Center’s ECG Norm Tester uses BNC connectors for connection to the signal generators, providing secure and reliable signal transmission. The BNC connectors for the impulse signal are connected to G1 and G2, while the sine wave signal is routed through G+ and G−. The ECG Norm Tester is powered by two 9 V batteries, which provide the necessary voltage for its internal systems. The tester uses specific battery types (either alkaline or lithium batteries) to ensure reliable operation for extended periods. For example, alkaline batteries provide over 60 h of operation for the offset generation circuits.

2.3. Performance Metrics

The performance was evaluated using simple metrics such as the relative error, the root mean square (RMS), the maximum displacement, and the maximum slope.
The relative error is calculated as an absolute value of the ratio of the difference between the measured and expected amplitude to the expected amplitude.
The root mean square is defined as the square root of the mean square of signal amplitude values.
The maximum displacement (expressed in µV) is defined as the greatest absolute deviation of the filtered output signal from its pre-pulse baseline.
The maximum slope (expressed in µV/s) is the greatest rate of change of the output signal relative to the input signal.

3. Results

To establish the conformity of the ADS1298ECGFE-PDK device with the ECG standard PN-EN 60601-2-25 p. 201, the following measurements were carried out:
  • Input impedance (12.4.103) (should be greater than 2.5 MΩ);
  • ECG path sensitivity (12.4.104) (should be changed stepwise with an accuracy of 5% in the presence of differential and common voltages of ±300 mV);
  • Resistance to overdrive (12.4.105.2) (differential voltage of 1 V for 10 s);
  • Noise level (12.4.106.1) (with only the mains filter switched on, should not exceed 30 µV);
  • Channel crosstalk (12.4.106.2) (should not exceed an amplitude of 0.5 mm at normal sensitivity, i.e., 2% of the amplitude of the given signal multiplied by the set sensitivity);
  • Frequency response (12.4.107.1) (in the frequency range up to 150 Hz);
  • Linearity and range of transfer (12.4.107.2) (should be ensured in each lead for 20 mV with an accuracy of 5% over the entire width of the recording field, also in the presence of a common or differential voltage of 300 mV of any polarity).
All tests were performed using the configuration of switch positions specified in Table 7.

3.1. Input Impedance

The input impedance of the ECG device was evaluated in accordance with IEC 60601-2-25. A test circuit consisting of a 620 kΩ resistor and a 4.7 nF capacitor was used. In the first phase of the test, a switch across the RC network was closed, effectively shorting the network so that it did not load the input. This allowed for a baseline measurement of the signal amplitude. In the second phase, the switch was opened, thereby introducing the impedance of the network into the input circuit. This caused a portion of the input signal to drop across the RC network. The difference in signal amplitude between the two configurations was analyzed to determine the ECG device’s input impedance. According to the standard, the input signal amplitude must not decrease by more than 20% when the network is connected. Compliance with this criterion indicates that the device meets the required minimum differential input impedance of ≥2.5 MΩ.
The peak-to-peak values, i.e., the difference between the maximal and the minimal values, of sine signals of amplitude 5 mV recorded without offset are reported in Table 8.
The input signal amplitude after opening the RC network met the requirements of the standard as it did not decrease by more than 20% in any of the wires.

3.2. ECG Gain Accuracy

The accurate representation of signal amplitude is fundamental to the clinical utility and safety of ECG devices. Both IEC 60601-2-25 (for diagnostic ECGs) and IEC 60601-2-47 (for ambulatory ECGs) define specific performance standards to ensure the integrity of signal reproduction. One of the key performance metrics covered in these standards is the gain accuracy, detailed in section 201.12.4.104. This requirement ensures that a device accurately reflects the magnitude of cardiac electrical signals, which is essential for reliable diagnosis and treatment planning.
According to section 201.12.4.104 of both standards, the error of the displayed or recorded amplitude of a known input signal (typically a QRS complex or calibration pulse) must not exceed ±10% of the expected value. This threshold applies universally to all selectable gain settings of the ECG system (e.g., 5 mm/mV, 10 mm/mV, and 20 mm/mV), as well as across all leads or channels, including standard limb leads, augmented limb leads, and precordial (chest) leads.
This requirement ensures that the gain—whether implemented through analog amplification or digital scaling—behaves consistently and within a clinically acceptable range. A gain error beyond ±10% may result in underestimation or overestimation of cardiac signal amplitudes, potentially leading to missed diagnoses or misinterpretation of cardiac conditions such as hypertrophy, ischemia, or arrhythmias. To verify compliance with the gain accuracy requirement, manufacturers and testing bodies must follow a standardized procedure involving the application of calibrated input signals and the measurement of the corresponding output for the device under test.
The first step involves applying a known and stable test signal, typically a 2 mV square wave or sinusoidal signal, as the ECG input. This signal should be within the standard diagnostic frequency range, usually 0.05–150 Hz, to simulate a typical QRS complex. A medical-grade signal generator that complies with IEC 60601-2-51 or a similar calibration standard should be used to ensure traceability and signal fidelity.
Next, the output amplitude of the ECG system is measured. This can be performed either by analyzing a digital output (in mV) or by physically measuring the printed or displayed waveform (in millimeters, using standard ECG paper or the on-screen scale). Each gain setting available on the device must be tested individually, and the process must be repeated for every ECG lead to confirm uniformity of gain performance.
In this test scenario, a 2 mV sine wave at 0.67 Hz was applied across all leads. The use of 0.67 Hz was particularly appropriate, as it is recommended by the standards for assessing the low-frequency performance and gain stability of ECG systems. This frequency was chosen because it lies near the lower boundary of the diagnostic ECG bandwidth (typically 0.05–150 Hz) and allows the system’s response to slow signal variations to be evaluated.
The device passes the requirement if the absolute gain relative error is within ±10% of the expected output for each lead and gain setting.
Table 9 shows the values of the peak-to-peak amplitudes of output signals at each lead responding to a 2 mV peak-to-peak amplitude square wave at 0.67 Hz. The absolute gain error was within ±10% of the expected output for each lead.

3.3. Overload Tolerance

The objective is to verify that an ECG device can withstand and recover from a high-level differential voltage (overload) without malfunction or signal distortion.
According to the test method at the normal gain (and with any switchable filter off), a differential input voltage of 1 V peak-to-valley is applied to the lead electrodes. The signal is maintained for 10 s. The response of the ECG system is observed during and after application to ensure that the system is not damaged. The test is performed three times within a 5 min period. After the test, the acceptance criteria are checked, namely, that the ECG system is not damaged, that there is no permanent distortion or drift in the ECG baseline after the overload is removed, and that normal signal operation resumes within a few seconds after the removal of the overload. The post-overload signal amplitude for each lead was compared against the expected 5 mV reference. All measured amplitudes fell within the ±10% relative error margin specified in the test acceptance criteria. This confirms that the ECG device maintained signal integrity across all channels, with no permanent distortion or drift in the baseline observed after the overload was removed (see Figure 8).
The ECG results (Table 10) show that the device successfully tolerated a 1 V differential overload for 10 s and resumed normal function without signal degradation (cf. Figure 8).
The results demonstrate that the ECG system withstood the high-level input without malfunction or lasting deviation in output performance. The rapid recovery and consistent signal quality affirm that the device meets the overload tolerance requirements outlined in IEC 60601-2-25.

3.4. Noise Level

The IEC 60601-2-25 standard outlines specific requirements for the safety and essential performance of electrocardiographs used in medical diagnostics. A critical component of these requirements is the control and limitation of internal electrical noise, as excessive noise can compromise the accuracy of ECG waveform interpretation and ultimately affect clinical decision-making. This standard defines rigorous test assumptions, setup conditions, and acceptance criteria to ensure that electrocardiographs can faithfully reproduce cardiac signals without distortion from internal or environmental noise sources.
The standard focuses on baseline wander, a low-frequency noise commonly caused by patient respiration or movement. This type of interference can cause the ECG baseline to drift, obscuring critical waveform details such as ST segments. According to IEC 60601-2-25, the ECG system must demonstrate that this baseline shift does not exceed ±0.15 µV when subjected to simulated physiological movement. This requirement ensures that diagnostic fidelity is maintained even in the presence of natural patient motion.
Another critical noise-related parameter is internal system noise, which refers to the electrical noise generated within the ECG device itself. The standard stipulates that the internal noise level must not exceed 30 μV peak-to-peak, measured with all inputs short-circuited and appropriate filters enabled (typically within the 0.05–150 Hz diagnostic bandwidth). This specification ensures that the inherent electronic noise of the device does not obscure the low-amplitude features of the ECG signal.
The standard assumes that an ECG device must operate reliably in clinical environments where a variety of interference sources exist, such as electromagnetic emissions from other medical equipment, patient movement, and power-line interference. Despite these conditions, the device must be capable of isolating and accurately reproducing the low-amplitude biopotential signals generated by cardiac activity. To that end, the standard requires a robust system design with high input impedance, effective common-mode rejection, and optimized signal conditioning. These limits are designed to ensure that the device introduces minimal distortion to the ECG signal and that low-amplitude features of the waveform, such as P-waves or ST-segment changes, are not obscured by background noise. The test is repeated nine more times to verify that the 30-microvolt limit is not exceeded for at least 9 of the 10 trials. The trials should occur within 30 min or less.
It is also assumed that diagnostic-quality ECG signals fall within specific frequency bands. For the purposes of noise evaluation, the frequency bandwidth is limited to 0.67 Hz to 150 Hz, which is representative of the diagnostic frequency range typically used in clinical ECG analysis. Noise outside of this band is considered to be filtered out by the device’s internal signal processing. The standard sets strict quantitative thresholds for acceptable internal noise:
  • The peak-to-peak noise amplitude measured over the 10 s window must not exceed 30 microvolts (µV).
  • The root mean square (RMS) noise over the same interval must be no greater than 15 µV.
Table 11 shows the system behavior regarding noise measurements.

3.5. Channel Crosstalk

The objective of the examination is to verify that electrical signals applied to one ECG lead do not unintentionally appear via coupling or interference in other leads, ensuring isolation between channels. According to IEC 60601-2-25:2011 and its amendments, the crosstalk between leads should not exceed 2% of the amplitude of the source signal when measured under specified test conditions. The test method assumes that a 1 mV peak-to-peak sinusoidal or triangular signal is applied to one ECG input channel (e.g., lead I: RA–LA). All other channels are monitored for any presence of that signal (crosstalk). The amplitudes of the unintended signal in other channels are measured. The ECG device must be in diagnostic mode with standard filters active (e.g., 0.67–150 Hz). A signal is applied to one channel (e.g., lead I). Other channels (e.g., lead II, V1, etc.) are monitored to check how much of this signal “leaks” into them. Crosstalk amplitude in any non-driven lead must not exceed 0.5 mm at standard sensitivity (10 mm/mV), which equals 0.05 mV or 30 µV peak-to-peak. It is equivalent to 2% of the test signal amplitude.
The test confirmed that no leakage (crosstalk) exceeded 2% of the input signal amplitude value (see Table 12).

3.6. Frequency Response

The frequency response test is performed to verify that an ECG device reproduces the amplitude of input signals with an accuracy of ±10% over a range of clinically relevant frequencies. The ECG device should be able to accurately measure both low- and high-frequency components of ECG signals, such as baseline wander or high-frequency muscle noise. The test is performed separately for each lead. A standard test signal in the form of a 1 mV peak amplitude sine wave or a 1.5 mV peak amplitude triangular wave is applied to the input of the device over a frequency range from 0.05 to 150 Hz, and the output amplitude of the signal is recorded.

3.6.1. High-Frequency Response

To evaluate the high-frequency response of a diagnostic ECG device in accordance with the IEC 60601-2-25 standard, a series of specific signal tests must be performed. These tests assess whether the ECG system preserves signal integrity across a range of input conditions, particularly in terms of frequency response and transient behavior. The methodology involves injecting controlled test signals and analyzing the amplitude behavior of the ECG system’s output in response to these inputs.
One of the primary test signals used is a sine wave with a peak-to-peak amplitude of 1 millivolt. This signal is applied at three distinct frequencies: 0.67 Hz, 10 Hz, and 40 Hz. Among these, the 10 Hz signal serves as the reference frequency. According to the IEC 60601-2-25 standard, the amplitude of the output for the 0.67 Hz and 40 Hz signals must not deviate by more than 10% from the amplitude observed at 10 Hz. This requirement ensures that the ECG device accurately reproduces signals across a clinically relevant frequency spectrum and does not excessively attenuate either low-frequency components (such as baseline drift) or higher-frequency components (which may include critical parts of the QRS complex).
In addition to sinusoidal testing, the standard prescribes the use of triangle waveform signals to evaluate the system’s transient response. Triangle pulses are applied at a repetition rate of 0.67 Hz, with two pulse durations: 20 milliseconds and 200 milliseconds. For the 20 ms pulse, the standard permits no drop in amplitude (0% deviation), reflecting the requirement that the device handles very rapid signal changes without distortion. These correspond to fast physiological events, such as a sharp rise in the QRS complex. Conversely, the 200 ms triangle pulse, which represents slower changes such as T-wave slopes, is allowed a maximum amplitude drop of 10%. These limits are critical in confirming the ECG system’s ability to faithfully reproduce both abrupt and gradual transitions in cardiac signals.
Collectively, these tests validate the frequency- and time-domain fidelity of the ECG device. Compliance with the amplitude constraints outlined in the standard ensures that the device can capture both high- and low-frequency components of a cardiac signal without distortion or significant attenuation. This is essential for accurate clinical interpretation and diagnostic reliability.
IEC 60601-2-25 Test A—High-Frequency Impulse Response (Sine Waveform): Test A of the IEC 60601-2-25 standard assesses the frequency response of ECG devices to ensure accurate reproduction of cardiac signals. It involves applying a 1 mV peak-to-peak sine wave at 0.67 Hz, 10 Hz, and 40 Hz. The 10 Hz signal serves as a reference, and the output amplitude at 0.67 Hz and 40 Hz must not deviate by more than 10% from this reference. This confirms that the device maintains consistent gain across critical frequency ranges.
IEC 60601-2-25 Test E—High-Frequency Impulse Response (Triangle Waveform): A 1.5 mV peak-to-peak triangular waveform with a 20 ms base width is applied to each ECG lead input. The output signal from each lead is recorded and analyzed to measure the peak-to-peak amplitude.
According to IEC 60601-2-25, the device under test must not attenuate this impulse response by more than 10%. Therefore, the output amplitude must be ≥1.35 mVpp to pass the test (see Table 13).
The objective of this evaluation is to verify the high-frequency response performance of an electrocardiograph system in accordance with the requirements outlined in the IEC 60601-2-25 standard. Specifically, clause 201.12.1.101.2 of the standard mandates that the system must accurately reproduce rapid signal transitions, such as those found in pacemaker pulses or sharp QRS complexes. This is assessed by comparing the output amplitudes of two test signals: a triangle waveform of 1.5 mV at 0.67 Hz with a base width of 200 ms (used as a reference) and an identical waveform with a reduced base width of 20 ms (used as a test stimulus to probe high-frequency response) (see Figure 9).
According to the IEC standard, the output amplitude of the 20 ms triangle wave must remain within +0% to −10% of the amplitude measured from the 200 ms waveform. This range ensures that the system neither artificially amplifies nor excessively attenuates high-frequency components. In this test, measurements are conducted across nine ECG channels: F, L, R, V1, V2, V3, V4, V5, and V6. Table 14 shows the ECG signal response to triangular excitations during high-frequency examination.

3.6.2. Low-Frequency (Impulse) Response

In the assessment of electrocardiographic systems, the accurate reproduction of low-frequency components is vital for reliable diagnosis, particularly in relation to ST-segment analysis and baseline stability. To address this, the IEC 60601-2-25 standard—specific to the essential performance and safety of electrocardiographs—includes stringent requirements for a system’s low-frequency impulse response.
To evaluate this characteristic, the standard defines a specific test signal: a monophasic rectangular pulse with an amplitude of 3 mV and a duration of 100 ms, with an allowable tolerance of ±5%. This artificial impulse is applied to the ECG input to simulate a sudden low-frequency event. The test challenges the ECG system to process a sharp but brief baseline deflection and return to baseline in a manner that preserves diagnostic integrity.
The response to this input is analyzed in terms of two critical performance metrics:
  • The maximum allowable baseline offset must not exceed ±100 µV when measured 350 ms after the end of the pulse. This limit ensures that the system does not introduce spurious baseline shifts which could distort the clinical interpretation—especially in the evaluation of ST-segment deviations that are typically in the range of hundreds of microvolts.
  • The maximum slope of the baseline recovery must not exceed 300 µV per second. This criterion controls the rate at which the baseline returns to its steady state following the impulse. A slope steeper than this limit may produce artefacts that resemble dynamic cardiac events, while an overly gradual return may obscure real low-frequency components such as ischemic ST shifts or T-wave abnormalities.
These specifications were primarily designed to ensure that the ECG system can accurately reproduce signals with a frequency content as low as 0.05 Hz, which is crucial for the detection of slow but clinically significant changes in ECG waveforms. A compliant system will maintain a stable baseline and present true low-frequency components without introducing artefacts due to excessive filtering or inadequate recovery dynamics.
In conclusion, the low-frequency impulse response test using a 100 ms pulse with a 3 mV amplitude provides a standardized and meaningful way to verify that an ECG device meets the diagnostic demands of modern clinical cardiology. By adhering to the defined limits on offset and slope, manufacturers and testers can ensure a system’s fidelity in capturing the subtleties of cardiac electrophysiology, particularly in challenging diagnostic scenarios (see Figure 10).
Table 15 shows the ECG signals recorded during the low-frequency response examination.

3.7. Linearity and Dynamic Range

A common method for testing the linearity of an ECG device in accordance with IEC 60601-2-25 involves applying a composite test signal that challenges the system’s ability to accurately process both large and small voltage components simultaneously. In this test the input signal consists of a low-frequency square wave with a frequency of 2 Hz and an amplitude that is gradually increased from 1 mV up to 10 mV. Superimposed on this square wave is a high-frequency sinusoidal signal with a fixed amplitude of 1 mV and a frequency of 40 Hz. The sinusoid represents a small fast-changing component—similar to muscle noise or certain ECG features—while the square wave introduces large sudden voltage steps simulating broader cardiac deflections.
The test begins with a low square wave amplitude and progressively increases its level. Throughout this process the integrity of the superimposed 40 Hz sine wave is monitored. As the square wave amplitude increases, the ECG system is pushed closer to its linearity and dynamic range limits. The key observation is the point at which the 40 Hz sine wave becomes visibly distorted, exhibiting flattened peaks, an altered shape, or nonlinearity in amplitude. This distortion indicates that the ECG device is no longer processing the signal linearly due to overload or saturation.
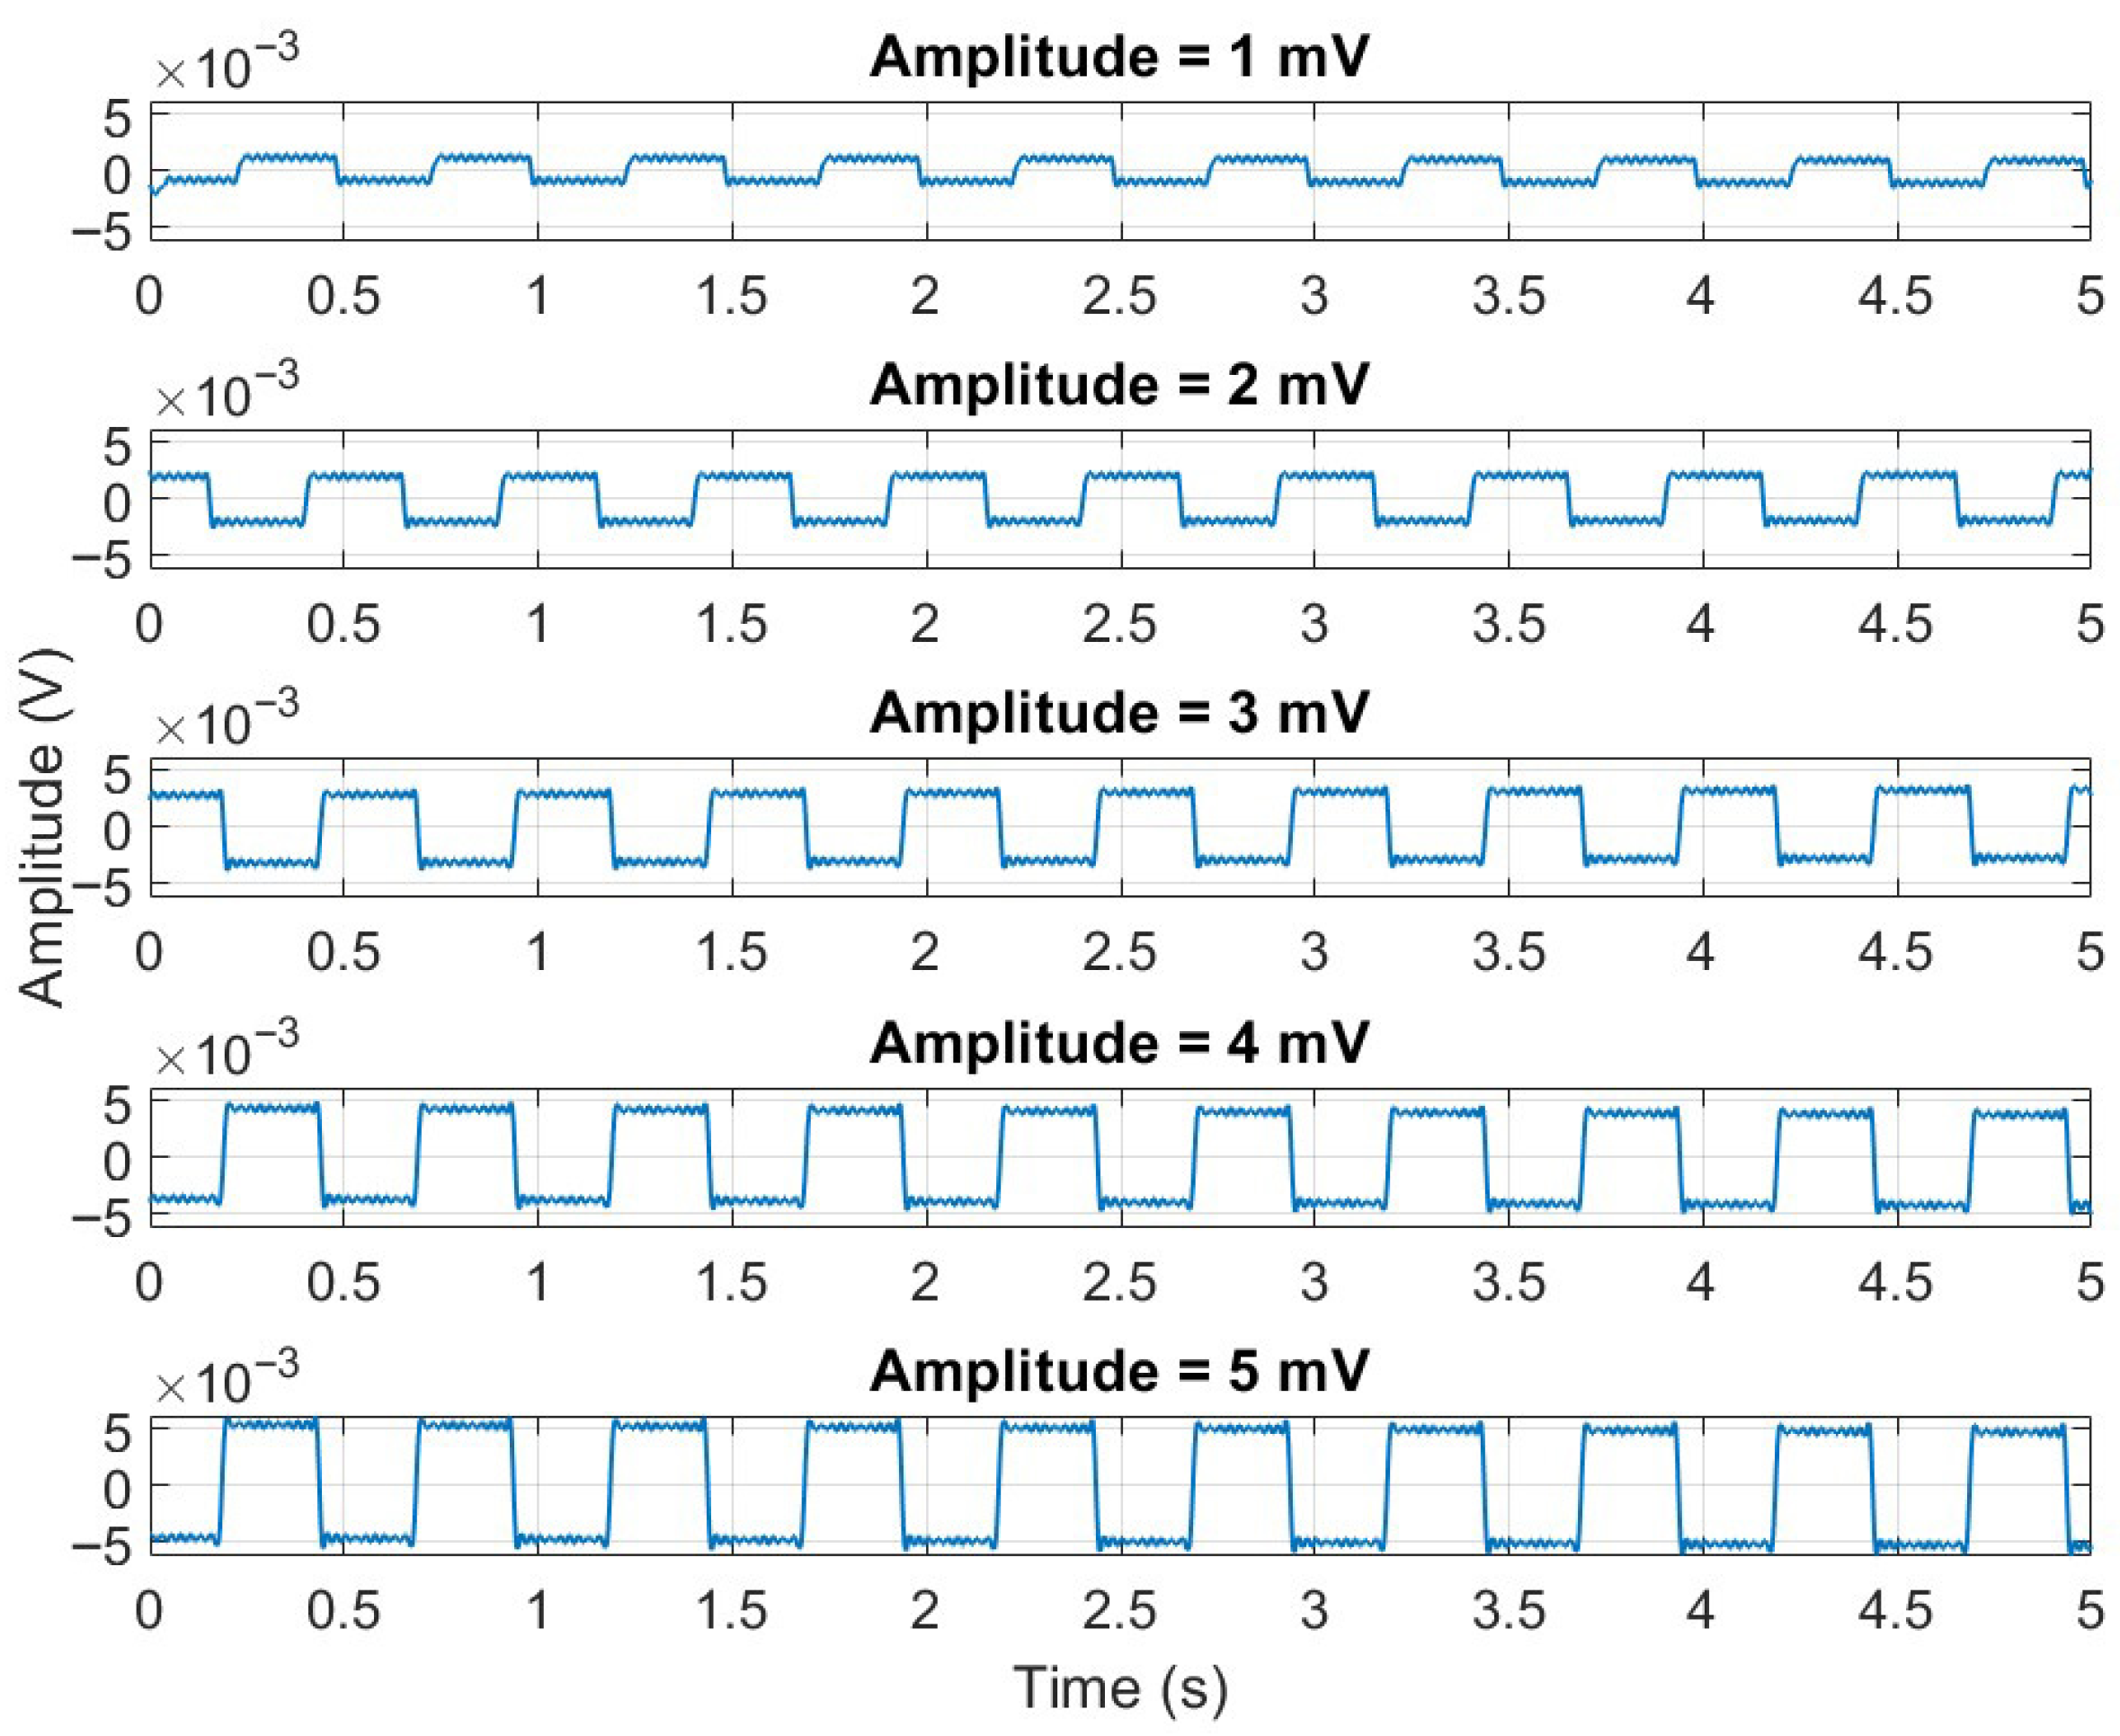
The maximum square wave amplitude at which the 40 Hz sine wave remains undistorted represents the device’s linearity threshold. If the ECG system can maintain accurate reproduction of the sinusoid up to high square-wave amplitudes without distortion, a wide linear operating range is confirmed. This test effectively assesses the ECG’s ability to handle real-world scenarios where small electrical signals must be resolved accurately even in the presence of large signal variations. The IEC 60601-2-25 standard outlines the specific safety and performance requirements for electrocardiographs used in medical settings. Among its key technical specifications are the criteria for linearity and dynamic range, both of which are essential for ensuring accurate ECG signal acquisition. According to the standard, the linearity of an ECG system must be maintained within a maximum error of ±5% or ±25 microvolts, whichever value is greater. This ensures that the device can proportionally respond to varying signal amplitudes without introducing significant distortion. To meet this requirement devices are typically tested using calibrated signals of known amplitudes to verify consistent output accuracy across a range. In addition to linearity, the standard specifies that ECG systems must possess a minimum dynamic range of ±5 millivolts. This means the system must be capable of accurately capturing cardiac signals ranging from −5 mV to +5 mV without signal clipping, distortion, or performance degradation (see Figure 11). This wide dynamic range is critical for detecting both low-amplitude signals and more pronounced electrical activity, ensuring comprehensive cardiac monitoring. Compliance with these requirements is verified using standardized testing procedures that simulate ECG signals and evaluate each channel’s response to confirm adherence to the standard’s limits.

4. Discussion

This study presents a comprehensive validation of an ADS1298-based ECG acquisition system, framed against the rigorous performance requirements of the IEC 60601-2-25 standard using the ECG Tester TEST manufactured by the Łukasiewicz Research Network–Krakow Institute of Technology, Biomedical Engineering Center. The system demonstrated robust compliance across multiple core diagnostic criteria, including input impedance, gain accuracy, overload tolerance, noise levels, channel crosstalk, and low-frequency impulse response. These successful results affirm the system’s fundamental reliability for standard ECG signal acquisition—ensuring stable baseline performance, accurate amplitude representation, and effective suppression of electronic noise.
Some parameters such as input impedance, gain accuracy, overload tolerance, and frequency response have not been tested by other researchers so far (see Table 16).
The experimental findings demonstrate that the ADS1298 AFE exhibits strong compliance across multiple critical performance domains. Firstly, the input impedance of the system exceeded the mandated threshold of 2.5 MΩ in all tested leads, confirming its capability to interface effectively with biological sources without introducing significant loading effects.
In terms of gain accuracy, each lead displayed output signal amplitudes well within the ±10% error margin prescribed by the standard, thereby ensuring the clinical reliability of recorded ECG waveforms. Similar accuracy targets have been reported for ADS1298-based 12-lead systems and in survey papers on low-cost medical-grade ECG, which note that instrumentation-grade AFEs can meet clinical amplitude tolerances with appropriate calibration and filtering [8].
The system’s robustness under extreme signal conditions was confirmed through overload tolerance tests, where a differential voltage of 1 V applied for 10 s resulted in no observable degradation or distortion of signal output. Recovery to baseline occurred swiftly and without drift, satisfying the safety criteria required for medical-grade devices. Similar overload/recovery results are reported in [4].
Noise performance is another crucial metric in ECG signal acquisition. The ADS1298-based system demonstrated peak-to-peak and RMS noise levels far below the maximum allowable limits of 30 µV and 15 µV, respectively. Such low noise is essential for preserving subtle features of ECG waveforms, including P-waves and ST-segment variations, and this result highlights the system’s suitability for diagnostic applications. Our results are in line with those reported by Gordillo-Roblero et al. [7]. The noise level did not exceed 5.17 μV for a square wave with a frequency of 1 Hz and an amplitude of 1 mV.
Channel isolation, as measured by inter-lead crosstalk, was also within acceptable bounds. No channel exhibited crosstalk exceeding 2% of the source signal amplitude, confirming that signals from adjacent electrodes are accurately differentiated and processed independently. This result confirms that obtained by Campillo et al. [8]. Additionally, linearity and dynamic range testing verified that the system retained fidelity in response to a combination of small and large signal components, reflecting its ability to capture both low- and high-amplitude features without distortion.
The high-frequency response of the electrocardiograph was evaluated in accordance with IEC 60601-2-25, using a 1 mV peak-to-peak sine wave at 0.67 Hz, 10 Hz, and 40 Hz. The 10 Hz signal serves as the reference, and the output amplitude at the other frequencies must not deviate by more than ±10%. The ADS 1298 AFE does not have built-in high-frequency filters. To maintain the 40 Hz signal amplitude within a tolerance of ±10%, appropriate external filters, such as FIR or IIR filters, must be used (see Appendix A). Our results show that selecting appropriate external digital filters is as important as AFE performance to ensure compliance with international standards.
Low-pass filters are necessary to remove high-frequency motion or muscle noise (typically in the 30–500 Hz range) and powerline interference in ECG signals. For diagnostic purpose, filters should be designed by taking into account such requirements as the cutoff frequency of 150 Hz, a 50/60 Hz notch filter, and a linear phase response to preserve the waveform shape of the ST segment. The typical filters used in ECG devices are an FIR filter of an order equal to 100–200 or an IIR filter [18,19,20]. The FIR filter has a linear phase but a high computational load, while the IIR filter is more efficient, with a sharp cutoff, but the disadvantage is its nonlinear phase. FIR filters are used in ECG systems based on a digital signal processor (DSP) to acquire and process ECG signals in real time. Nonlinear phase filters, like IIR filters, cause ST-segment distortion, which leads to misdiagnosis of ischemia or myocardial infarction (MI). An excessive low-pass cutoff has an impact on R-wave detection, leading to QRS smearing, whereas the disadvantage of high-order FIR filters is their latency, which is the reason for false alarms due to delayed event recognition. Summing up, the best practice is to use FIR filters where waveform shape is critical (e.g., ST-segment analysis) and IIR filters for real-time monitoring with limited processing power.
The ADS1298 analog front-end represents a highly promising solution for clinical-grade ECG acquisition systems, particularly in the context of portable or wearable medical devices, where compactness, energy efficiency, and signal integrity are paramount. The system successfully met nearly all IEC 60601-2-25 standard requirements, affirming its viability for clinical use. The exception lies in the high-frequency impulse response, which should be addressed to ensure full diagnostic reliability in practice by the implementation of appropriate digital filters.

5. Conclusions

In our work, we presented a practical guide on testing the compliance of ECG devices with regulatory standards, providing a scheme for a dedicated tester and a detailed testing procedure. The ADS1298 was selected for testing. However, the proposed tester can be used to test any ECG device or any AFE.
The findings of this study confirm that the ADS1298 analog front-end is a strong platform for ECG signal acquisition, particularly in applications requiring high resolution, low noise, and multichannel flexibility. The system achieved compliance across most key parameters of the IEC 60601-2-25 standard, affirming its utility for clinical-grade ECG systems. Supported by an appropriate high-frequency filter, it meets rigorous standards for clinical diagnostics and patient safety, making it a solid candidate for portable and wearable solutions ready for regulatory approval.
The limitation of this study was the use of only one standard, i.e., the standard dedicated to testing the basic safety and essential performance of electrocardiographs (IEC 60601-2-25), and the use of only one AFE (ADS1298). Nevertheless, the same procedure can be applied in future studies to develop new wearable devices based on ADS1298. The testing of the ECG device on real data would be an interesting direction for future work.

Author Contributions

Conceptualization, M.C. and E.O.; testing methodology, M.C.; tester development, A.S.; testing execution, E.R.-J. and A.S.; writing—original draft preparation, E.R.-J.; writing—review and editing, E.O., A.S. and A.D.-B.; visualization, E.R.-J.; supervision, E.O. and E.J.; project administration, E.O.; funding acquisition, E.O. All authors have read and agreed to the published version of the manuscript.

Funding

This research was partially funded by the European Health and Digital Executive Agency (HADEA), grant number 101128983, the PROVIDE project (“Prediction and prevention of cardiovascular diseases in pre- and type 2 diabetes”), call topic EU4H-2022-PJ-1, and by the AGH University of Krakow. The views and opinions expressed are, however, those of the author(s) only and do not necessarily reflect those of the European Union or the European Health and Digital Executive Agency (HADEA). Neither the European Union nor the granting authority can be held responsible for them.

Data Availability Statement

Data recorded in this study are available in the RePOD repository (DOI: 10.18150/AF0RP; URL: https://doi.org/10.18150/AF0RPK).

Acknowledgments

The authors would like to express their special thanks to Marcin Białas for his technical support of the project.

Conflicts of Interest

The authors declare no conflicts of interest. The funders had no role in the design of the study; in the collection, analysis, or interpretation of data; in the writing of the manuscript; or in the decision to publish the results.

Abbreviations

The following abbreviations are used in this manuscript:
AFEAnalog front-end
ADCAnalog-to-digital converter
CMRRCommon-mode rejection ratio
CTCentral terminal
DSPDigital signal processor
ECGElectrocardiography
FIRFinite impulse response
IECInternational Electrotechnical Commission
IIRInfinite impulse response
ISOInternational Organization for Standardization
LALeft arm
LPFLow-pass filter
OIMLInternational Organization of Legal Metrology (in French: Organisation Internationale de Métrologie Légale)
PGAProgrammable gain amplifier
PLIProduction-linked incentive
ppPeak-to-peak
QMSQuality management system
RARight arm
RCResistor capacitor
RLDRight-leg drive
RMSRoot mean square
SNRSignal-to-noise ratio
SPISerial peripheral interface

Appendix A

High-Frequency Filtering

In compliant designs, an AFE establishes a band-pass and tackles mains pickup, while a digital stage completes spec-aligned shaping [13,14]. Practically, the high-pass corner is set at ≈0.05 Hz to retain ST trends, the anti-alias low-pass is placed above 150 Hz (≈200–250 Hz) to keep 0–150 Hz flat, and higher-order Butterworth sections are favored for amplitude fidelity [1,14]. Recent AFE results confirm that tightly tuned low-pass sections combined with a high-Q 50 Hz twin-T notch can deliver deep rejection (≈−56 dB at 50.1 Hz) without encroaching on the 40 Hz compliance checkpoint [21]. Robust input impedance and a high CMRR (≈90 dB) remain essential; a driven right-leg loop further suppresses common-mode mains and stabilizes the measurement [22]. In ADS129x-based systems, correct corner/order choices pair the IC’s low intrinsic noise with a compliant bandwidth [8,13].
Downstream, selective 50/60 Hz removal and final band-limiting should use linear-phase or zero-phase responses to preserve morphology. High-Q IIR notches (Q ≈ 30–60) efficiently reject mains without widening stopbands, while high-order FIR designs guarantee a linear phase at the expense of more taps [22]. When resources allow, wavelet or model-based Wiener/Kalman denoising can further reduce artefacts [14,22]. With ΔΣ AFEs, such as ADS129x, built-in decimation already provides a linear-phase low-pass near the diagnostic bandwidth; as per the IEC, verification runs with switchable filters off (except the mains notch) are used to confirm the base 0.05–150 Hz response and the 40/10 Hz amplitude ratio [1]. If marginal attenuation appears around 30–50 Hz—often from notch “skirts” or an over-tight low-pass—slightly widening the analog LPF (≈175–200 Hz) or sharpening the transition band (higher order) typically restores compliance without elevating noise [7,8]. These results underscore the crucial importance of filter design in meeting diagnostic performance standards. Removing mains interference requires highly selective filters that confine attenuation strictly to the noise frequencies. Broader or less precise filter designs—for example, filters with wider stopbands or gentler roll-offs—risk attenuating parts of the ECG signal in the adjacent 30–50 Hz range. Any undue attenuation in this range can distort or reduce important clinical information (such as the amplitude of the QRS complex or high-frequency muscle noise), potentially causing the device to fail the compliance tests. In contrast, the two successful strategies demonstrated that it is possible to eliminate the 50/100 Hz interference while preserving essential signal content at both low and high frequencies. By using narrowly targeted notch filters (high-Q IIR or high-order FIR) and applying them in a zero-phase manner, the device maintained accurate amplitude response across the required frequency spectrum. This highlights that careful filter design and implementation are pivotal for achieving compliance with standards and ensuring reliable, high-fidelity ECG recordings for accurate clinical analysis.
The successful validation of an ECG device requires not only the removal of artifacts like power-line interference but also the faithful preservation of the underlying diagnostic waveform. The high-frequency response test, which mandates that a 40 Hz signal’s amplitude remains within ±10% of a 10 Hz reference, serves as a critical benchmark for this capability.
The first approach utilized a cascaded IIR notch filter. By designing the filter with a very high Q-factor of approximately 60, its effect was precisely confined to the 50 Hz and 100 Hz interference frequencies. This high degree of selectivity resulted in an extremely narrow stopband, preventing the filter’s “skirts” from attenuating the nearby 40 Hz diagnostic tone. Consequently, this method passed with a minimal average error of just −0.88%, demonstrating that a well-tuned IIR filter can effectively eliminate noise without compromising signal integrity. To ensure that waveform morphology was preserved, any potential phase distortion was nullified by applying the filter in a zero-phase, forward–backward manner.
The second strategy employed a linear-phase FIR notch filter. This method achieved its selectivity through a high-order (240) design coupled with a Kaiser window, which created deep and localized stopbands at the target interference frequencies. A key advantage of this approach is the FIR filter’s inherent linear-phase property, which guarantees that the timing and shape of the ECG waveform are not distorted. The performance was exceptional, yielding an even lower average error of −0.51% at 40 Hz and passing the compliance test on all leads.
Both the high-Q IIR and the high-order FIR methods underscore a unified principle: the necessity of a meticulous and deliberate design philosophy. They confirm that regulatory compliance and diagnostic reliability are not mutually exclusive. By prioritizing selectivity, engineers can successfully suppress power-line interference while ensuring that the clinically relevant content of the ECG signal remains untouched, thereby satisfying the rigorous demands of modern medical device standards.

References

  1. IEC 60601-2-25:2016-01; Medical Electrical Equipment—Part 2-25: Particular Requirements for the Basic Safety and Essential Performance of Electrocardiographs. IEC: Geneva, Switzerland, 2016.
  2. IEC 60601-2-47:2015; Medical Electrical Equipment—Part 2-47: Particular Requirements for the Basic Safety and Essential Performance of Ambulatory Electrocardiographic Systems. IEC: Geneva, Switzerland, 2015.
  3. IEC 60601-2-27:2014; Medical Electrical Equipment—Part 2-27: Particular Requirements for the Basic Safety and Essential Performance of Electrocardiographic Monitoring Equipment. Comitato Elettrotecnico Italiano: Milan, Italy, 2014.
  4. Silva, M.C.; Gusmao, L.A.P.; Hall Barbosa, C.R.; Costa Monteiro, E. System for Conformity Assessment of Electrocardiographs. In Proceedings of the 13th International Conference on Biomedical Engineering, Singapore, 3–6 December 2008; Lim, C.T., Goh, J.C.H., Eds.; Springer: Berlin/Heidelberg, Germany, 2009; Volume 23, pp. 1124–1127. [Google Scholar]
  5. IEC 60601-2-51:2005; Medical Electrical Equipment—Part 2-51: Particular Requirements for the Basic Safety and Essential Performance of Medical Electrocardiographic (ECG) Equipment. IEC: Geneva, Switzerland, 2005.
  6. OIML R90:2013; Metrological Regulation for Load Cells (1st ed.). OIML: Paris, France, 2013.
  7. Gordillo-Roblero, L.A.; Soto-Cajiga, J.A.; Romo-Fuentes, C.; Martinez-Soto, L.F.; Rodriguez-Olivares, N.A. A Methodology for the Design of a Compliant Electrocardiograph: A Case Study. Electronics 2024, 13, 4238. [Google Scholar] [CrossRef]
  8. Campillo, D.; Guardarrama, R.; Gonzalez, R.; Rodriguez, J.; Jimenez, D. A real time ECG preprocessing system based on ADS1298. Comput. Cardiol. 2013, 2013, 947–950. [Google Scholar]
  9. Badnjevi, A.; Deumic, A.; Softic, A.; Pokvic, L.G. A novel method for conformity assessment testing of patient monitors for post-market surveillance purposes. Technol. Health Care 2023, 31, 327–337. [Google Scholar] [CrossRef] [PubMed]
  10. Badnjevi, A.; Magjarevic, R.; Mrdjanovic, E.; Pokvic, L.G. A novel method for conformity assessment testing of electrocardiographs for post-market surveillance purposes. Technol. Health Care 2023, 31, 307–315. [Google Scholar] [CrossRef] [PubMed]
  11. Young, B. New standards for ECG equipment. J. Electrocardiol. 2019, 57S, S1–S4. [Google Scholar] [CrossRef] [PubMed]
  12. Zepeda-Echavarria, A.; van de Leur, R.R.; van Sleuwen, M.; Hassink, R.J.; Wildbergh, T.X.; Doevendans, P.A.; Jaspers, J.; van Es, R. Electrocardiogram Devices for Home Use: Technological and Clinical Scoping Review. JMIR Cardio 2023, 7, e44003. [Google Scholar] [CrossRef] [PubMed]
  13. Texas Instruments. ADS129x Low-Power, 8-channel, 24-bit Analog Front-End for Biopotential Measurements Datasheet (Rev. K); Texas Instruments: Dallas, TX, USA, 2020; Available online: https://www.ti.com/lit/ds/symlink/ads1299.pdf (accessed on 1 September 2025).
  14. Cosoli, G.; Spinsante, S.; Scardulla, F.; D’Acquisto, L.; Scalise, L. Wireless ECG and cardiac monitoring systems: State of the art, available commercial devices and useful electronic components. Measurement 2021, 177, 109243. [Google Scholar] [CrossRef]
  15. Rahman, M.; Morshed, B.I. Resource-Constrained On-Chip AI Classifier for Beat-by-Beat Real-Time Arrhythmia Detection with an ECG Wearable System. Electronics 2025, 14, 2654. [Google Scholar] [CrossRef]
  16. Wang, Y. Emerging epidermal electrodes towards digital health and on-skin digitalization. Soft Sci. 2024, 4, 5. [Google Scholar] [CrossRef]
  17. Zhu, P.; Niu, M.; Liang, S.; Yang, W.; Zhang, Y.; Chen, K.; Pan, Z.; Mao, Y. Non-hand-worn, load-free VR hand rehabilitation system assisted by deep learning based on ionic hydrogel. Nano Res. 2025, 18, 94907301. [Google Scholar] [CrossRef]
  18. Webster, J.G. Medical Instrumentation: Application and Design, 4th ed.; Wiley: New York, NY, USA, 2009; ISBN 978-0471676003. [Google Scholar]
  19. Clifford, G.D.; Azuaje, F.; McSharry, P. Advanced Methods and Tools for ECG Data Analysis; Artech House: Norwood, MA, USA, 2006; ISBN 978-1580539661. [Google Scholar]
  20. Sornmo, L.; Laguna, P. Bioelectrical Signal Processing in Cardiac and Neurological Applications; Elsevier: Amsterdam, The Netherlands; Academic Press: Cambridge, MA, USA, 2005. [Google Scholar]
  21. Emon, M.H.; Ashikuzzaman, M.; Babu, M.U.; Ahmed, S.; Islam, M.T. Design and Analysis of a High-Gain, Low-Noise, and Low-Power Analog Front End for Electrocardiogram Acquisition in 45 nm Technology Using gm_mm/ID_DD Method. Electronics 2024, 13, 2190. [Google Scholar] [CrossRef]
  22. Faruk, N.; Abdulkarim, A.; Emmanuel, I.; Folawiyo, Y.Y.; Adewole, K.S.; Mojeed, H.A.; Oloyede, A.A.; Olawoyin, L.A.; Sikiru, I.A.; Nehemiah, M.; et al. A comprehensive survey on low-cost ECG acquisition systems: Advances on design specifications, challenges and future direction. Biocybern. Biomed. Eng. 2021, 41, 474–502. [Google Scholar] [CrossRef]
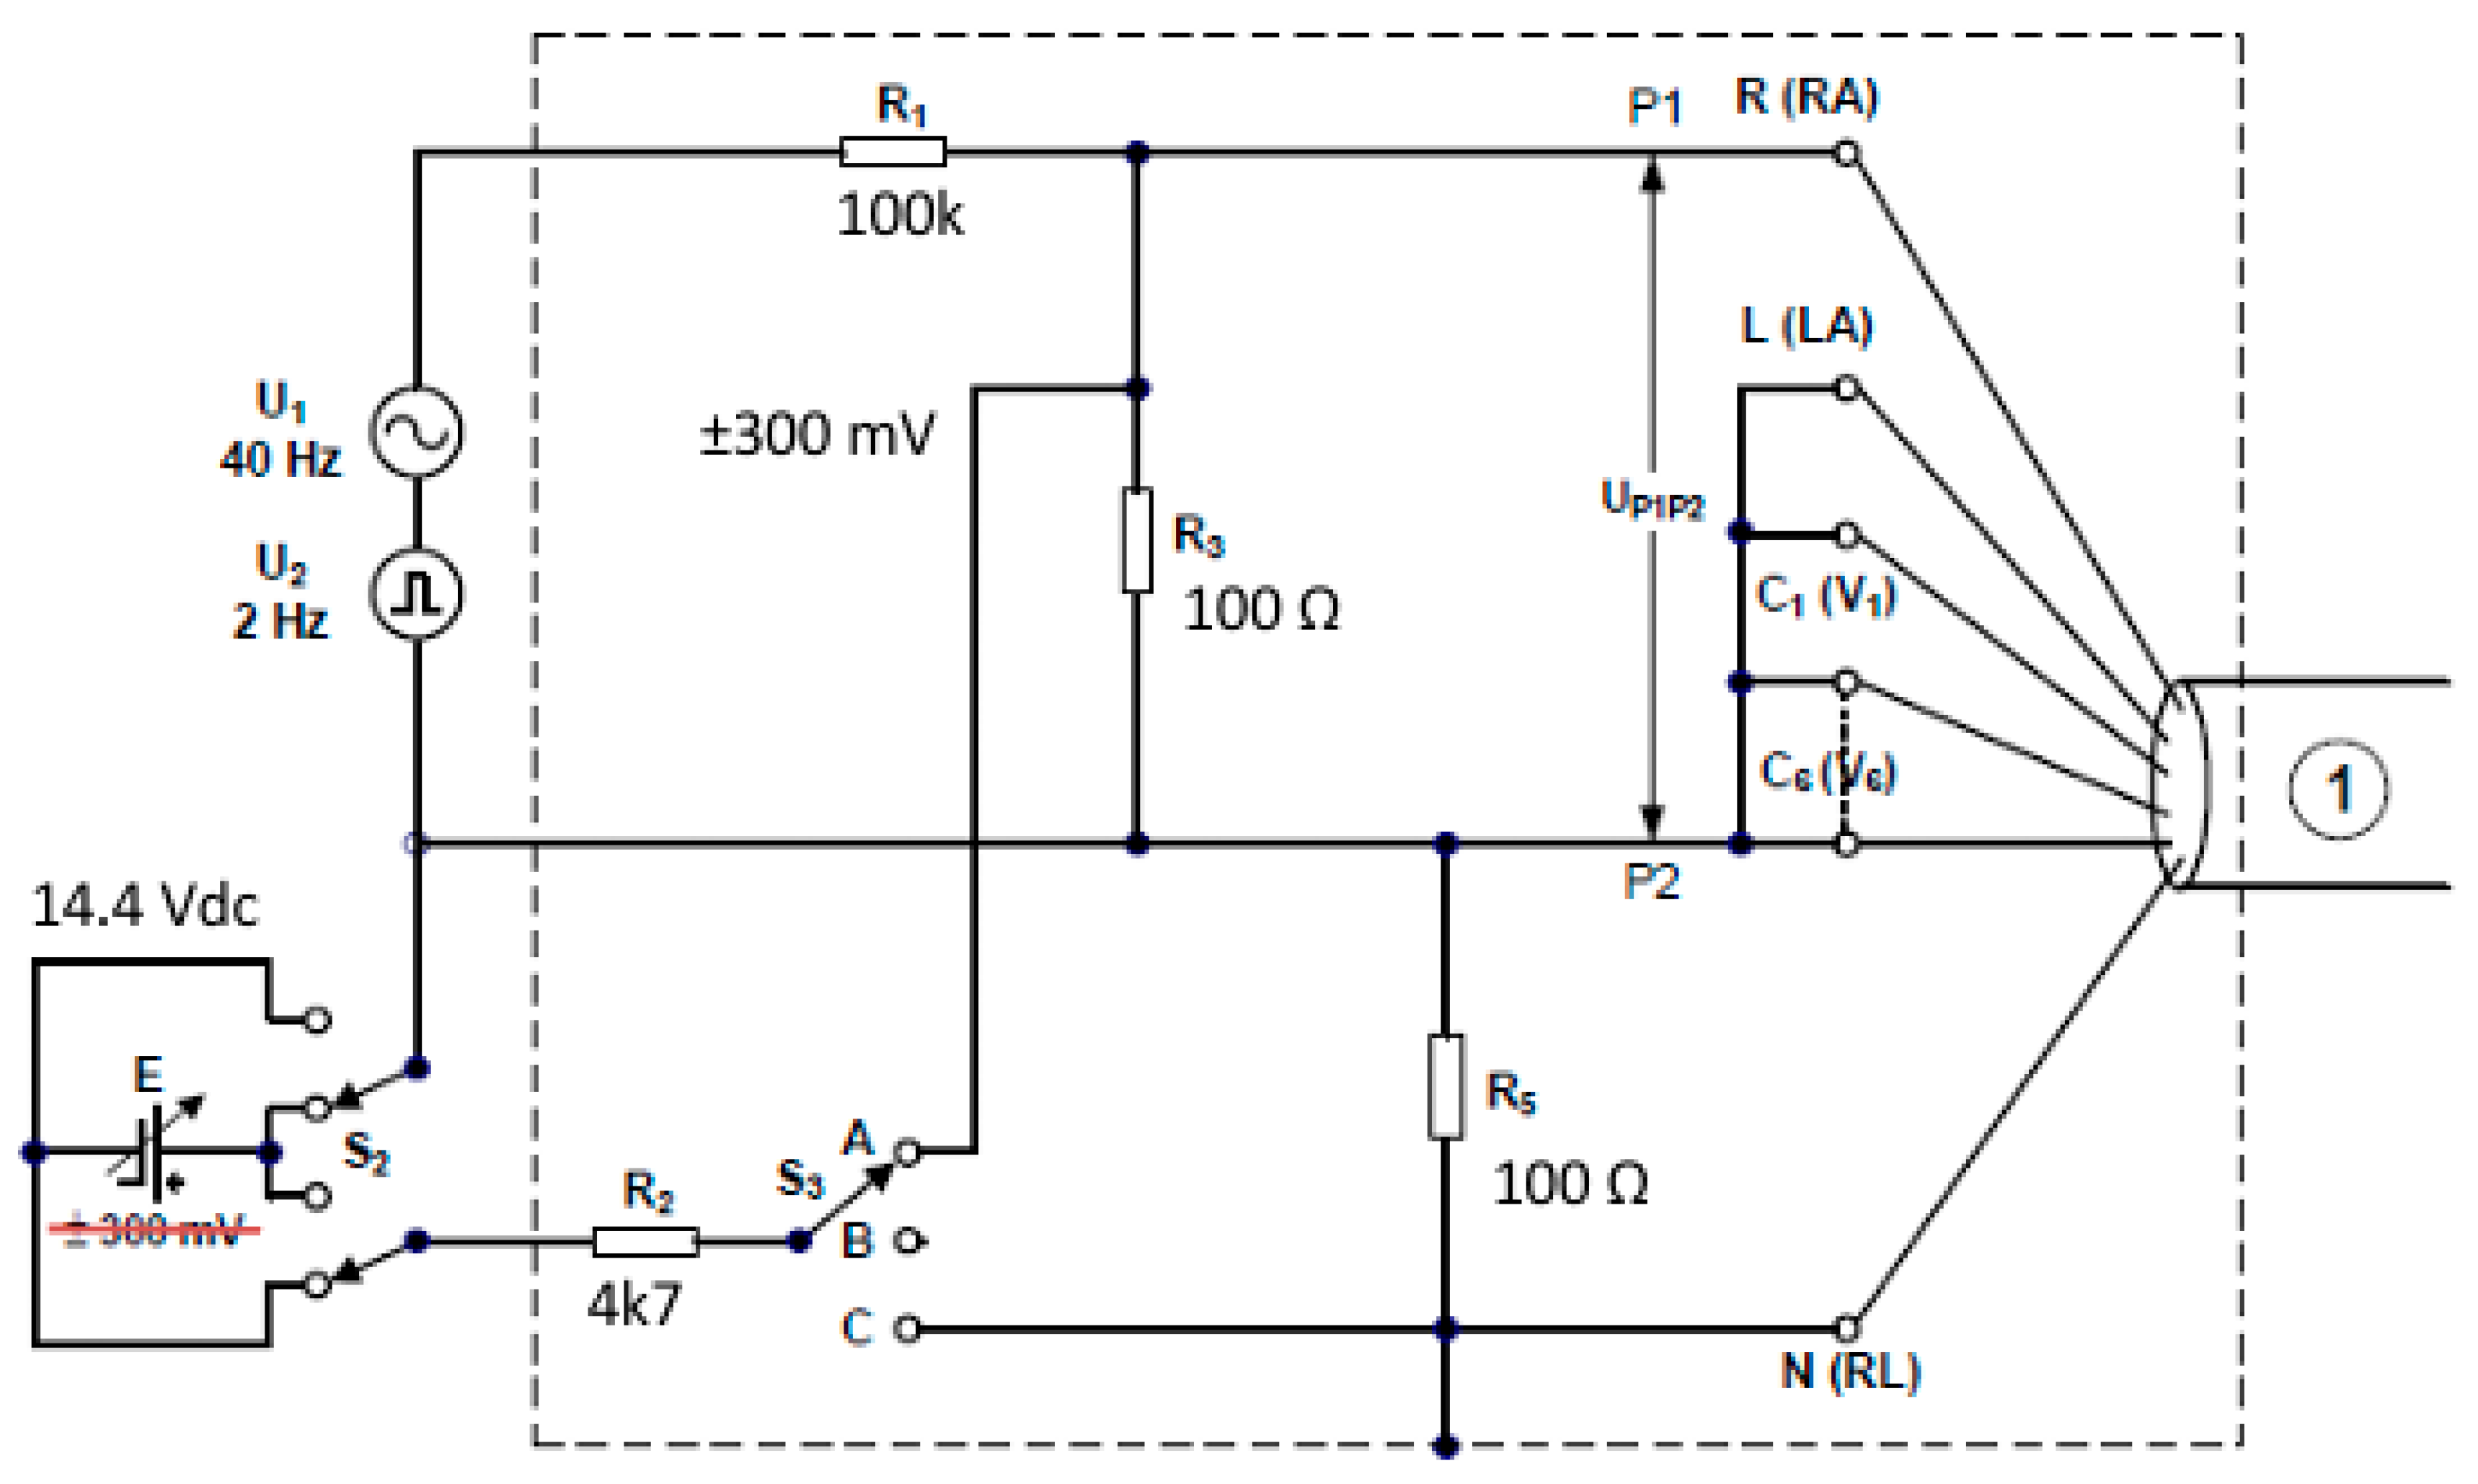
Figure 1. Figure 201.109 from IEC 60601-2-25:2016-01 for tests in accordance with clause 201.110. The U1 and U2 generator should have an isolated output. When testing a BF- or CF-type applied part, the tester housing, which is the shield, should be grounded. The tests should be carried out in accordance with point 201.12.4.107.2 on linearity and dynamic range.
Electronics 14 03878 g001
Figure 2. 201.106 from the standard IEC 60601-2-25:2016-01 and 201.101 from IEC 60601-2-47:2015-09.
Electronics 14 03878 g002
Figure 3. 201.105 from the standard IEC 60601-2-27:2014-11.
Electronics 14 03878 g003
Figure 4. Tester ECG TEST.
Electronics 14 03878 g004
Figure 5. Schematic diagram of the ECG TEST tester.
Electronics 14 03878 g005
Figure 6. ADS1298 analog front-end.
Electronics 14 03878 g006
Figure 7. High-quality shielded ECG cables (ASPEL KEKG-30R v.202).
Electronics 14 03878 g007
Figure 8. ECG signals recorded for overload (1 V) and post-overload (5 mV) voltages.
Electronics 14 03878 g008
Figure 9. High-frequency impulse response (triangle waveform): the peak-to-peak amplitudes of output signals of each channel corresponding to a 1.5 mV peak-to-peak amplitude triangular wave with a 20 ms base width and 200 ms constituting the reference signal.
Electronics 14 03878 g009
Figure 10. Low-frequency impulse response: the peak-to-peak amplitudes of output signals at each channel corresponding to a 3 mV peak-to-peak amplitude impulse signal detected by the device.
Electronics 14 03878 g010
Figure 11. Linearity and dynamic range examination: the peak-to-peak amplitudes of output signals at each channel corresponding to known amplitudes from 1 to 5 mV.
Electronics 14 03878 g011
Table 1. Switch positions required to obtain a measuring system in accordance with Figure 1, referring to clause 201.109 from the standard 60601-2-25:2016-01.
Switch Marking on the Tester HousingSwitch Position
SW34 (top)
SW4 Open (top)
SW5 Closed (bottom)
SW6 Closed (bottom)
SW7 1A-B (bottom)
SW8 No offs (bottom)
SW9 Open (top)
SW10 3 (top)
SW11 OFF (top)
ON (bottom) in the case of using offset
Table 2. Switch positions required to obtain a measuring system in accordance with Figure 2, referring to clause 201.106 from the standard 60601-2-25:2016:01 and 201.101 from the standard 60601-2-47:2015-09.
Switch Marking on the Tester HousingSwitch Position
SW32 (middle)
SW4Open (bottom)
SW5Closed (bottom)
SW6 Open (top)
SW7 2A-B (top)
SW8 Offs (2B) (bottom)
SW9 Closed (bottom)
SW10 1 (bottom)
SW11 OFF (top)
ON (bottom) in the case of using offset
Table 3. Switch positions related to obtaining measuring circuit in accordance with Figure 3, referring to clause 201.105 from the standard IEC 60601-2-27:2014-11.
Switch Marking on the Tester HousingSwitch Position
SW32 (middle)
SW4Open (bottom)
SW5Closed (bottom)
SW6 Open (top)
SW7 2A-B (top)
SW8 Offs (2B) (bottom)
SW9 Closed (bottom)
SW10 1 (bottom)
SW11 OFF (top)
ON (bottom) in the case of using offset
Table 4. Switch positions related to obtaining measuring circuit in accordance with Figure 1, referring to clause 201.109 from the standard IEC 60601-2-25:2016-01.
Switch Marking on the Tester HousingSwitch Position
S2 SW2
S3SW3
Table 5. Switch positions required to obtain a measuring system in accordance with Figure 2, referring to clause 201.106 from IEC 60601-2-25:2016-01 and 201.101 from IEC 60601-2-47:2015-09.
Switch Marking on the Tester HousingSwitch Position
SSW1
S2 SW5
S3SW2
S4SW8
S5SW4
Table 6. Switch positions required to obtain a measuring system in accordance with Figure 3, referring to clause 201.105 from the standard IEC 60601-2-27:2014-11.
Switch Marking on the Tester HousingSwitch Position
SSW5
S2 SW1
S3SW2
S4SW8
S5SW4
Table 7. Switch positions applied during the tests.
Switch Switch Position
SW1 TOP
SW2TOP
SW3->
SW4TOP
SW5BOTTOM
SW6TOP
SW7TOP
SW8BOTTOM
SW9TOP
SW10BOTTOM
SW11TOP
Table 8. The peak-to-peak amplitude response to the 5 mV peak-to-peak amplitude sine wave recorded in the absence of offset and without the RC 620k 4n7 circuit included in the ECG signal path.
ECG Lead Amplitude (mV pp)
Without Offset
Relative
Error [%]
F4.9850.30
L4.9820.36
R5.0190.38
V14.9830.34
V24.9810.38
V34.9860.28
V44.9860.28
V55.1422.84
V65.3076.14
Table 9. The peak-to-peak amplitudes of output signals at each lead responding to a 2 mV peak-to-peak amplitude square wave at 0.67 Hz.
ECG Channel Amplitude (mV pp)Relative
Error [%]
F1.9890.55
L1.9890.55
R1.9880.60
V12.0000.00
V21.9990.05
V32.0040.20
V42.0010.05
V52.0030.15
V62.0010.05
Table 10. ECG signals recorded for overload (1 V) and post-overload (5 mV) sine test signal of 10 Hz.
ECG
Channel
Amplitude [mV pp] (Overload)Amplitude [mV pp]
(Post-Overload)
Relative
Error [%]
F602.194.980.36
L597.224.754.94
V1604.224.882.40
V2604.224.882.40
V3576.164.862.75
V4596.005.254.91
V5601.825.489.63
V6595.654.970.63
Table 11. Peak-to-peak noise amplitude and the associated RMS values successfully indicate meeting of the norm criteria.
ECG Channel pp Amplitude(μV)RMS (μV)
F17.962.69
L25.813.34
V123.972.43
V217.602.67
V317.892.77
V422.612.92
V516.902.77
V614.442.22
Table 12. The percentage of crosstalk for all leads relative to the lead receiving the signal.
Source
ECG Lead
Observed ECG Lead
Lead ILead IIV1V2V3V4V5V6
I 100%0.8%0.3%0.2%0.2%0.2%0.2%0.3%
II 0.8%100%0.2%0.3%0.2%0.2%0.1%0.1%
V1 0.1%0.1%100%0.4%0.2%0.1%0.1%0.1%
V2 0.1%0.1%0.4%100%0.4%0.2%0.1%0.1%
V3 0.1%0.1%0.2%0.4%100%0.3%0.2%0.1%
V4 0.1%0.1%0.1%0.2%0.3%100%0.3%0.2%
V5 0.1%0.1%0.1%0.1%0.2%0.3%100%0.4%
V6 0.1%0.1%0.1%0.1%0.1%0.2%0.4%100%
Table 13. High-frequency impulse response (sine waveform): the peak-to-peak amplitudes of output signals of each lead responding to a 1 mV peak-to-peak amplitude sine wave at 0.67 Hz, 10 Hz, and 40 Hz. The response to a given sine signal is filtered with a notch filter with a cutoff frequency of 50 Hz.
ECG
Lead
Sine Wave
of 1 mV
at 0.67 Hz
Sine Wave
of 1 mV
at 10 Hz
Sine Wave
of 1 mV
at 40 Hz
Relative
Error [%]
(0.67 Hz)
Relative
Error [%]
(0.10 Hz)
Relative
Error [%]
(40 Hz)
F0.99930.99910.99030.070.090.97
L0.99920.99870.98980.080.131.02
R0.99900.9986 0.98960.100.141.04
V110.99900.99000.000.101.00
V20.99900.99800.98940.110.201.06
V30.99920.99910.99000.080.091.00
V40.99940.99950.99130.060.050.87
V50.99980.99880.99040.020.120.96
V60.99880.99900.98990.120.101.01
Table 14. High-frequency impulse response (triangle waveform): the peak-to-peak amplitudes of output signals of each lead responding to a 1.5 mV peak-to-peak amplitude triangular wave with a 20 ms base width and 200 ms constituting the reference signal. The response to a given triangular signal is filtered with a notch filter with a cutoff frequency of 50 Hz.
ECG
Lead
Triangle Wave of 1.5 mV at 0.67 Hz for 20 ms Base Width Triangle Wave of 1.5 mV at 0.67 Hz for 200 ms Base Width—Reference Signal Relative Error [%]
F1.4871.5393.43
L1.4701.5696.32
R1.4791.5896.92
V11.6051.7307.23
V21.6201.7346.62
V31.5981.7086.46
V41.5811.6836.07
V51.6031.7287.26
V61.6061.6995.51
Table 15. Low-frequency impulse response: the peak-to-peak amplitudes of output signals at each channel responding to 3 mV peak-to-peak amplitude impulse signal.
ECG
Channels
pp Amplitude
[mV]
Mean Max Displacement [µV/s]Mean
Max Slope [µV]
F3.11021.085265.13
L3.10921.336223.40
R3.10919.795245.79
V13.11020.116241.56
V23.10919.840251.51
V33.11020.865257.15
V43.11220.141225.68
V53.10920.338251.36
V63.10820.202267.82
Table 16. Comparison of our testing results with the results reported by Gordillo-Roblero et al. [7] and Campillo et al. [8].
Performance ParameterIEC 60601-2-25 RequirementThe Current Study (ADS1298)Gordillo-Roblero et al. [7] (ADAS1000)Campillo et al. [8] (ADS1298)
System Noise≤30 μV14.44 µV on V65.17 µV≈9 μV
Amplitude Quantization≤5 μV/LSB≤5 μV/LSB0.1009 µV/LSB≈3.1 μV/LSB
Input Impedance≥2.5 MΩ>2.5 MΩ--
Inter-Channel Crosstalk≤2%0.1–0.8%-<2%
Common-Mode Rejection≥89 dB--≈93.7 dB
Sampling Frequency≥500 Hz1 kHz2 kHz (up to 16 kHz)500 Hz
Inter-Channel Skew<100 μs-0.0 µs -
Frequency Response (Passband)0.05–150 Hz (diagnostic)0.05–150 Hz0.05–150 Hz0.05–150 Hz
Frequency Response (Amplitude Error at 40 Hz)±10% of 10 Hz 0.88% (with external filter)--
Disclaimer/Publisher’s Note: The statements, opinions and data contained in all publications are solely those of the individual author(s) and contributor(s) and not of MDPI and/or the editor(s). MDPI and/or the editor(s) disclaim responsibility for any injury to people or property resulting from any ideas, methods, instructions or products referred to in the content.