1. Introduction
Inverters, with their advantages such as high efficiency, low harmonic distortion, and improved output waveform, are often used in renewable energy systems, motor drives, electric vehicles, and industrial applications where power quality plays an important role [
1,
2]. The performance and reliability of inverters depend on the precise specification and control of output voltage levels [
3]. Multilevel inverter structures are used due to the switching losses of semiconductor elements at high power levels [
4]. In multilevel inverters, the output voltage vector can be represented in a reference frame divided into sectors and regions. Accurate identification of the operating sector and region is essential for applying appropriate pulse width modulation (PWM) techniques and ensuring correct switching of power electronic components. Incorrect sector or region detection can lead to overloads, increased harmonic distortion, and voltage imbalances [
5,
6]. One of the most important steps for inverters to generate signals with the desired amplitude and frequency is to determine the sector and region in which the system operates relative to the reference vector [
7,
8].
The detection of sectors and regions in inverters is usually performed using mathematical models and threshold-based approaches. Although these methods work for certain system parameters, increasing data density and complexity degrade the performance of traditional methods [
9]. Increasing switching states and large data set requirements for multilevel inverters limit the effectiveness of conventional methods and increase the need for deep learning-based solutions [
10]. Deep learning methods are used to reduce the computational effort for complex mathematical models and to predict the behavior of systems [
11]. Deep learning methods in the development of inverters offer effective solutions for optimizing important parameters such as output current and voltage values and harmonic distortion.
Multilevel inverters are increasingly favored to increase the efficiency of systems and improve power quality. There are various studies in the literature that aim to obtain the desired signal at the output by reducing the switching losses in inverters with three or more levels. These studies include both classical methods and modern approaches based on deep learning. Yupeng Si et al. [
12] used the attention collaborative stacked long short-term memory (ASLSTM) method, one of the deep learning methods, to increase the efficiency of neutral point clamped (NPC) type inverters and build models for fault diagnosis. With this successful study, they performed fault diagnosis in the inverter under different conditions. Matias Aguirre et al. [
13] proposed a new strategy based on deep learning as an alternative to operating a 3-level NPC-type inverter with classical algorithms. With this new algorithm, the frequency of the inverter is controlled, and the values of the current output and DC capacitance voltage are brought to the desired level. Hussan et al. [
14] proposed a hybrid ANN–backstepping framework for MPPT in photovoltaic systems, optimized using a combination of Particle Swarm Optimization (PSO) and a Genetic Algorithm (GA). This approach achieved high tracking accuracy (99.8%), low RMS error (0.103%), and reduced power loss (0.2%) while ensuring system stability and robustness under dynamic conditions. Fabiola P. et al. [
15] used machine learning algorithms to monitor and manage inverters in photovoltaic solar power plants and to classify, improve, predict, and forecast inverter failures based on historical data. The main objective of these studies is to demonstrate the importance of using advanced techniques in multilevel inverters. However, expanding research in this area will make it possible to make energy conversion systems more efficient, particularly through the further application of harmonic reduction and optimization techniques.
Accurate identification of sectors and regions in NPC inverters is essential for applying PWM techniques and ensuring correct switching of power electronic components [
16]. This process uses parameters such as DC input voltage, modulation index, switching frequency, and phase angle to determine the operating sector and region. Traditional calculation methods based on mathematical models and decision tables can be complex, time-consuming, and less accurate for multilevel inverters. Deep learning classifiers provide a robust alternative, enabling real-time recognition, high accuracy with large datasets, and improved generalization, reducing the need for complex modeling [
17,
18,
19].
The aim of this study is to model and analyze a three-level Neutral Point Clamped (NPC) type inverter using Space Vector Pulse Width Modulation (SVPWM). The inverter model involves applying the output signals obtained by varying parameters such as input voltage, switching frequency, and modulation index to an induction motor load. Deep learning techniques are used in this modeling process to reduce the computational load of the system and improve computational efficiency. Thus, sector and region predictions based on the input parameters of the system are realized with high accuracy. The motivation and contributions of this work can be summarized as follows:
An innovative and efficient model is proposed based on the lightweight, low-depth, and high-accuracy DL architecture developed for sector and region detection in three-level NPC inverters.
The proposed GRU-based model offers computational efficiency with a low number of parameters, high classification performance, and a more optimized solution compared to many heavy-structured DL models in the literature.
The comprehensive performance comparisons and statistical validation results reveal that the proposed sector and region detection models have the potential to be easily integrated into hardware-based systems due to their low computational complexity.
The rest of this article is structured as follows:
Section 2 describes in detail the general working principle of a three-level inverter, dataset preparation, deep learning techniques, and performance evaluation metrics.
Section 3 presents the comprehensive results and findings.
Section 4 discusses the implications and potential of the study. Finally,
Section 5 concludes the paper.
2. Materials and Methods
In this paper, we propose a deep learning-based prediction system that performs sector and region prediction to analyze the operating states of multiphase power electronic systems.
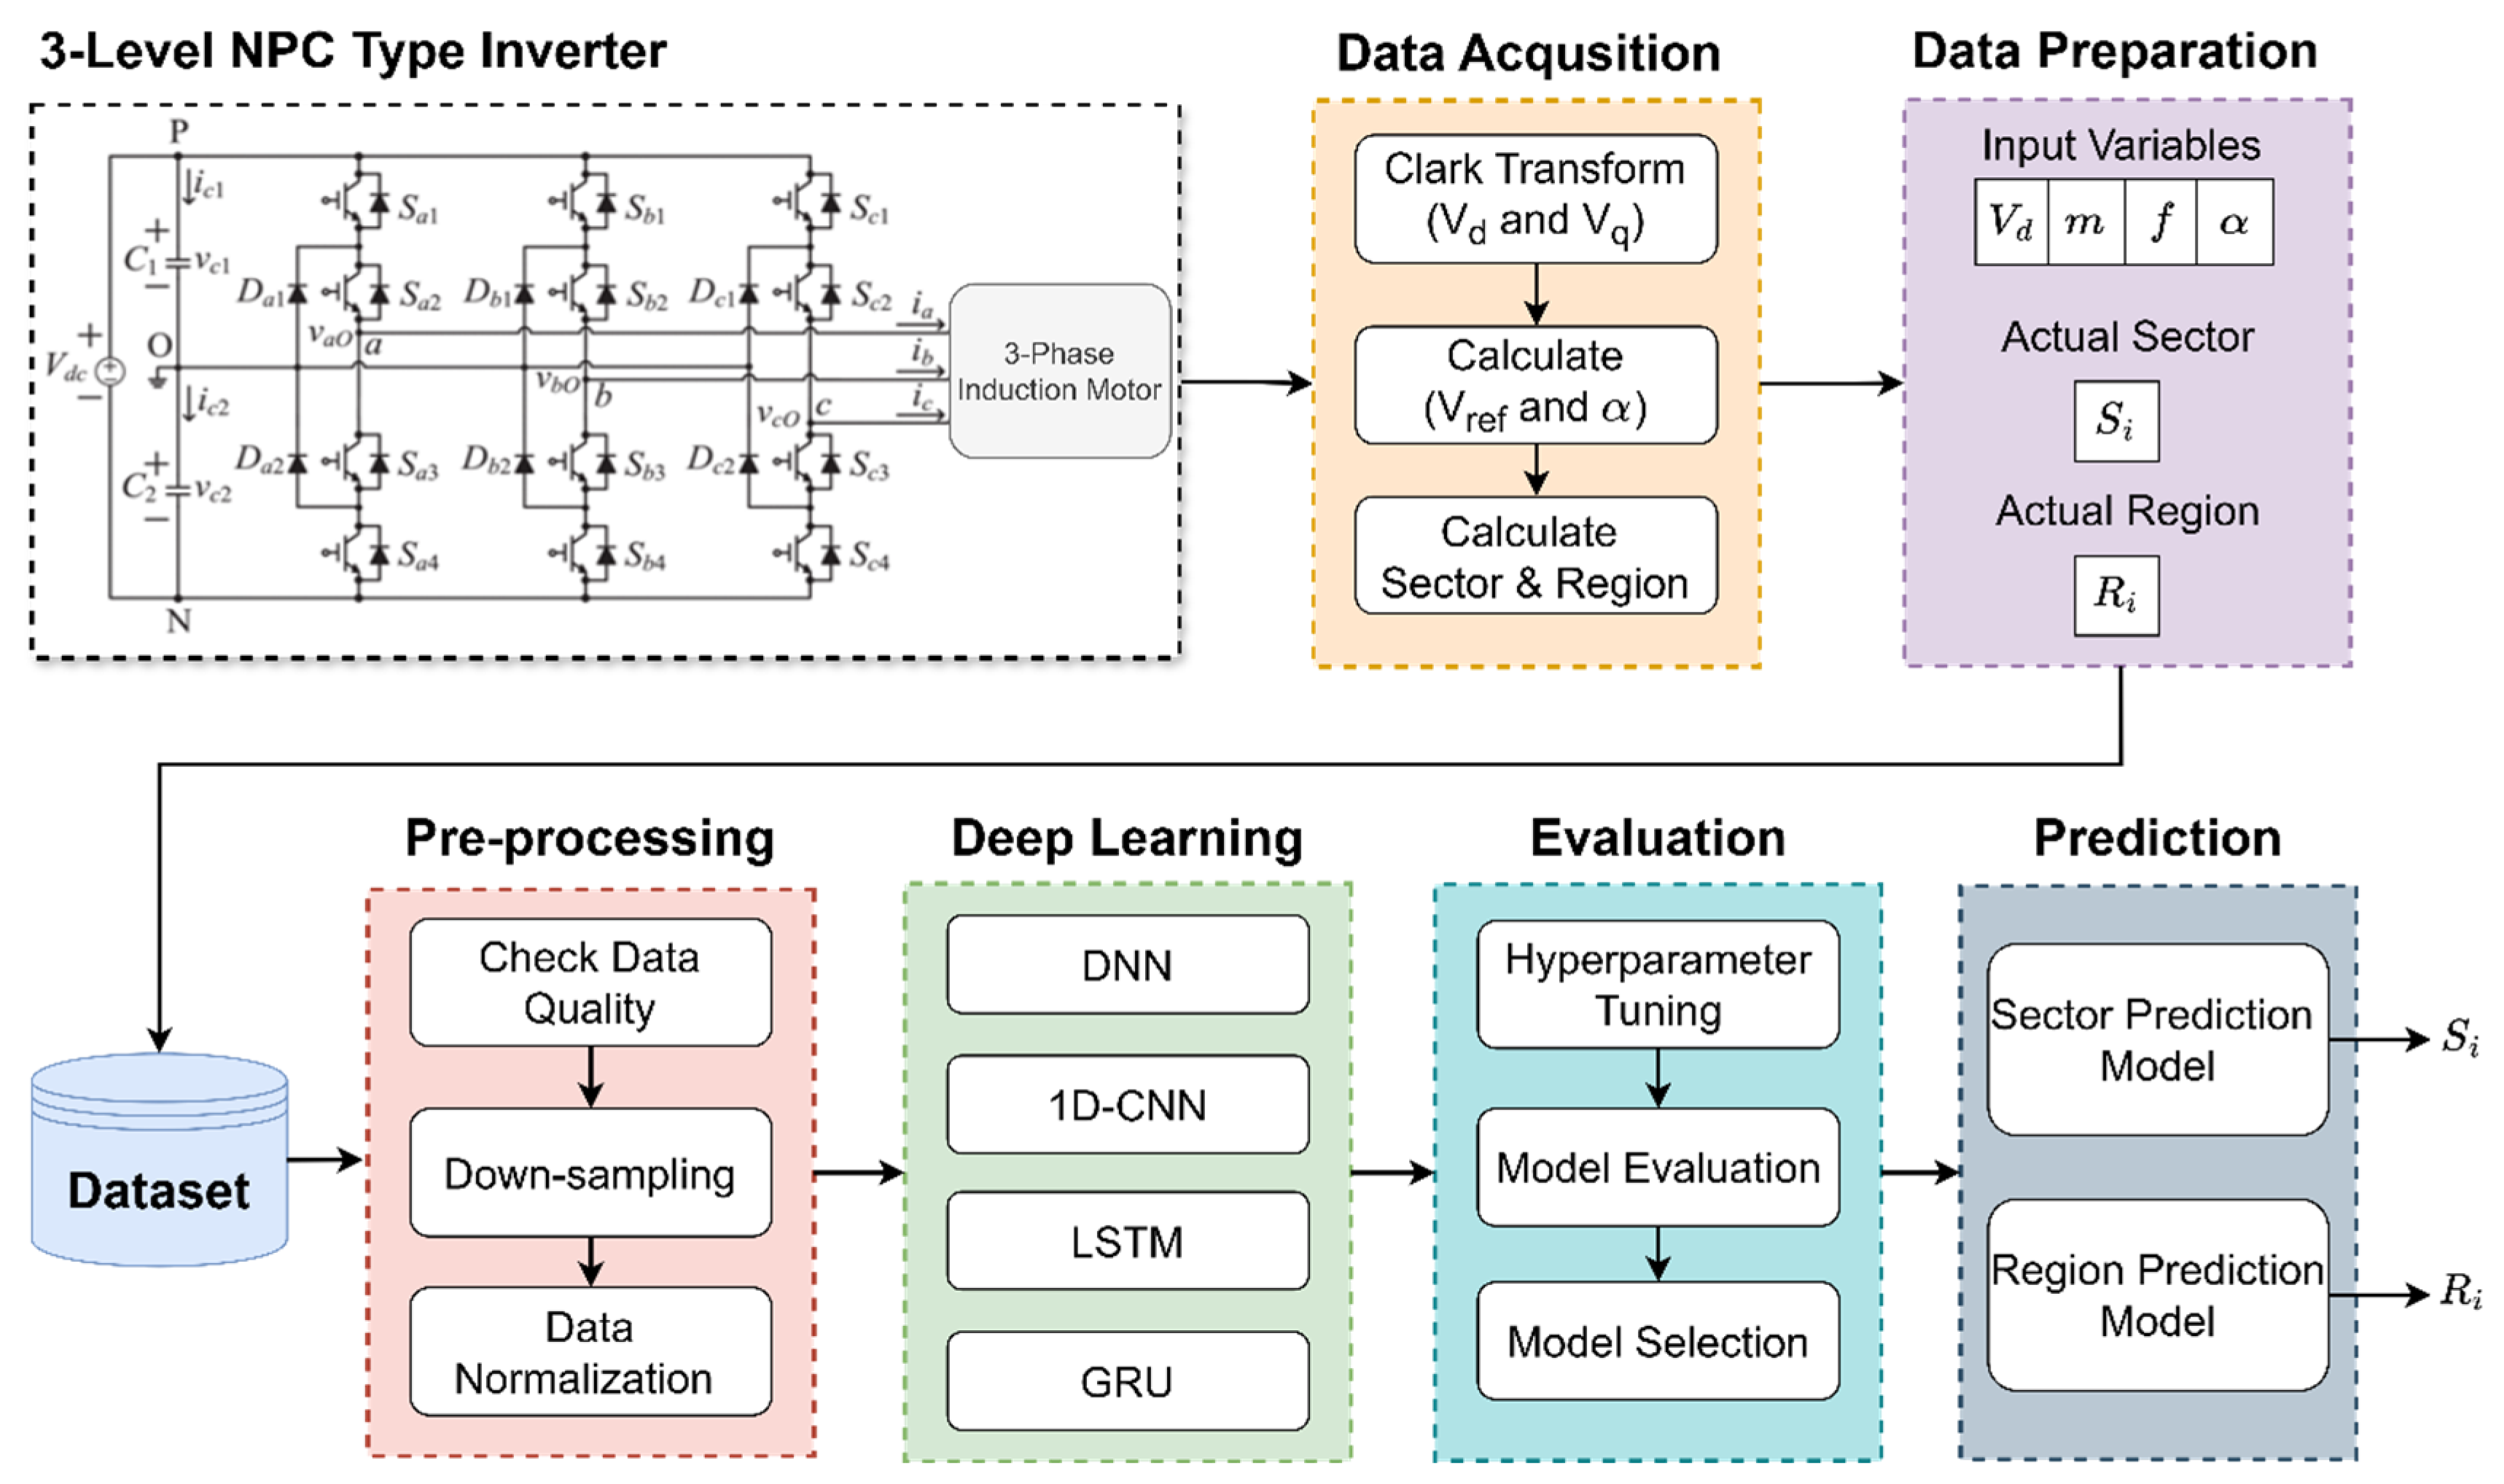
Figure 1 illustrates the overall pipeline of the proposed system. The system consists of five main components: Data acquisition and processing, calculation of characteristic quantities, modeling with deep learning architectures, hyperparameter optimization, and final model prediction.
2.1. 3-Level NPC Inverter
Three-level Neutral Point Clamped (NPC) type inverters are preferred due to their high efficiency and low harmonic values [
20]. Three different voltage levels,
, 0 ve
are generated at the output of the inverter [
21]. Space vector pulse width modulation (SVPWM) is a switching technique used to achieve the desired waveform and high efficiency.
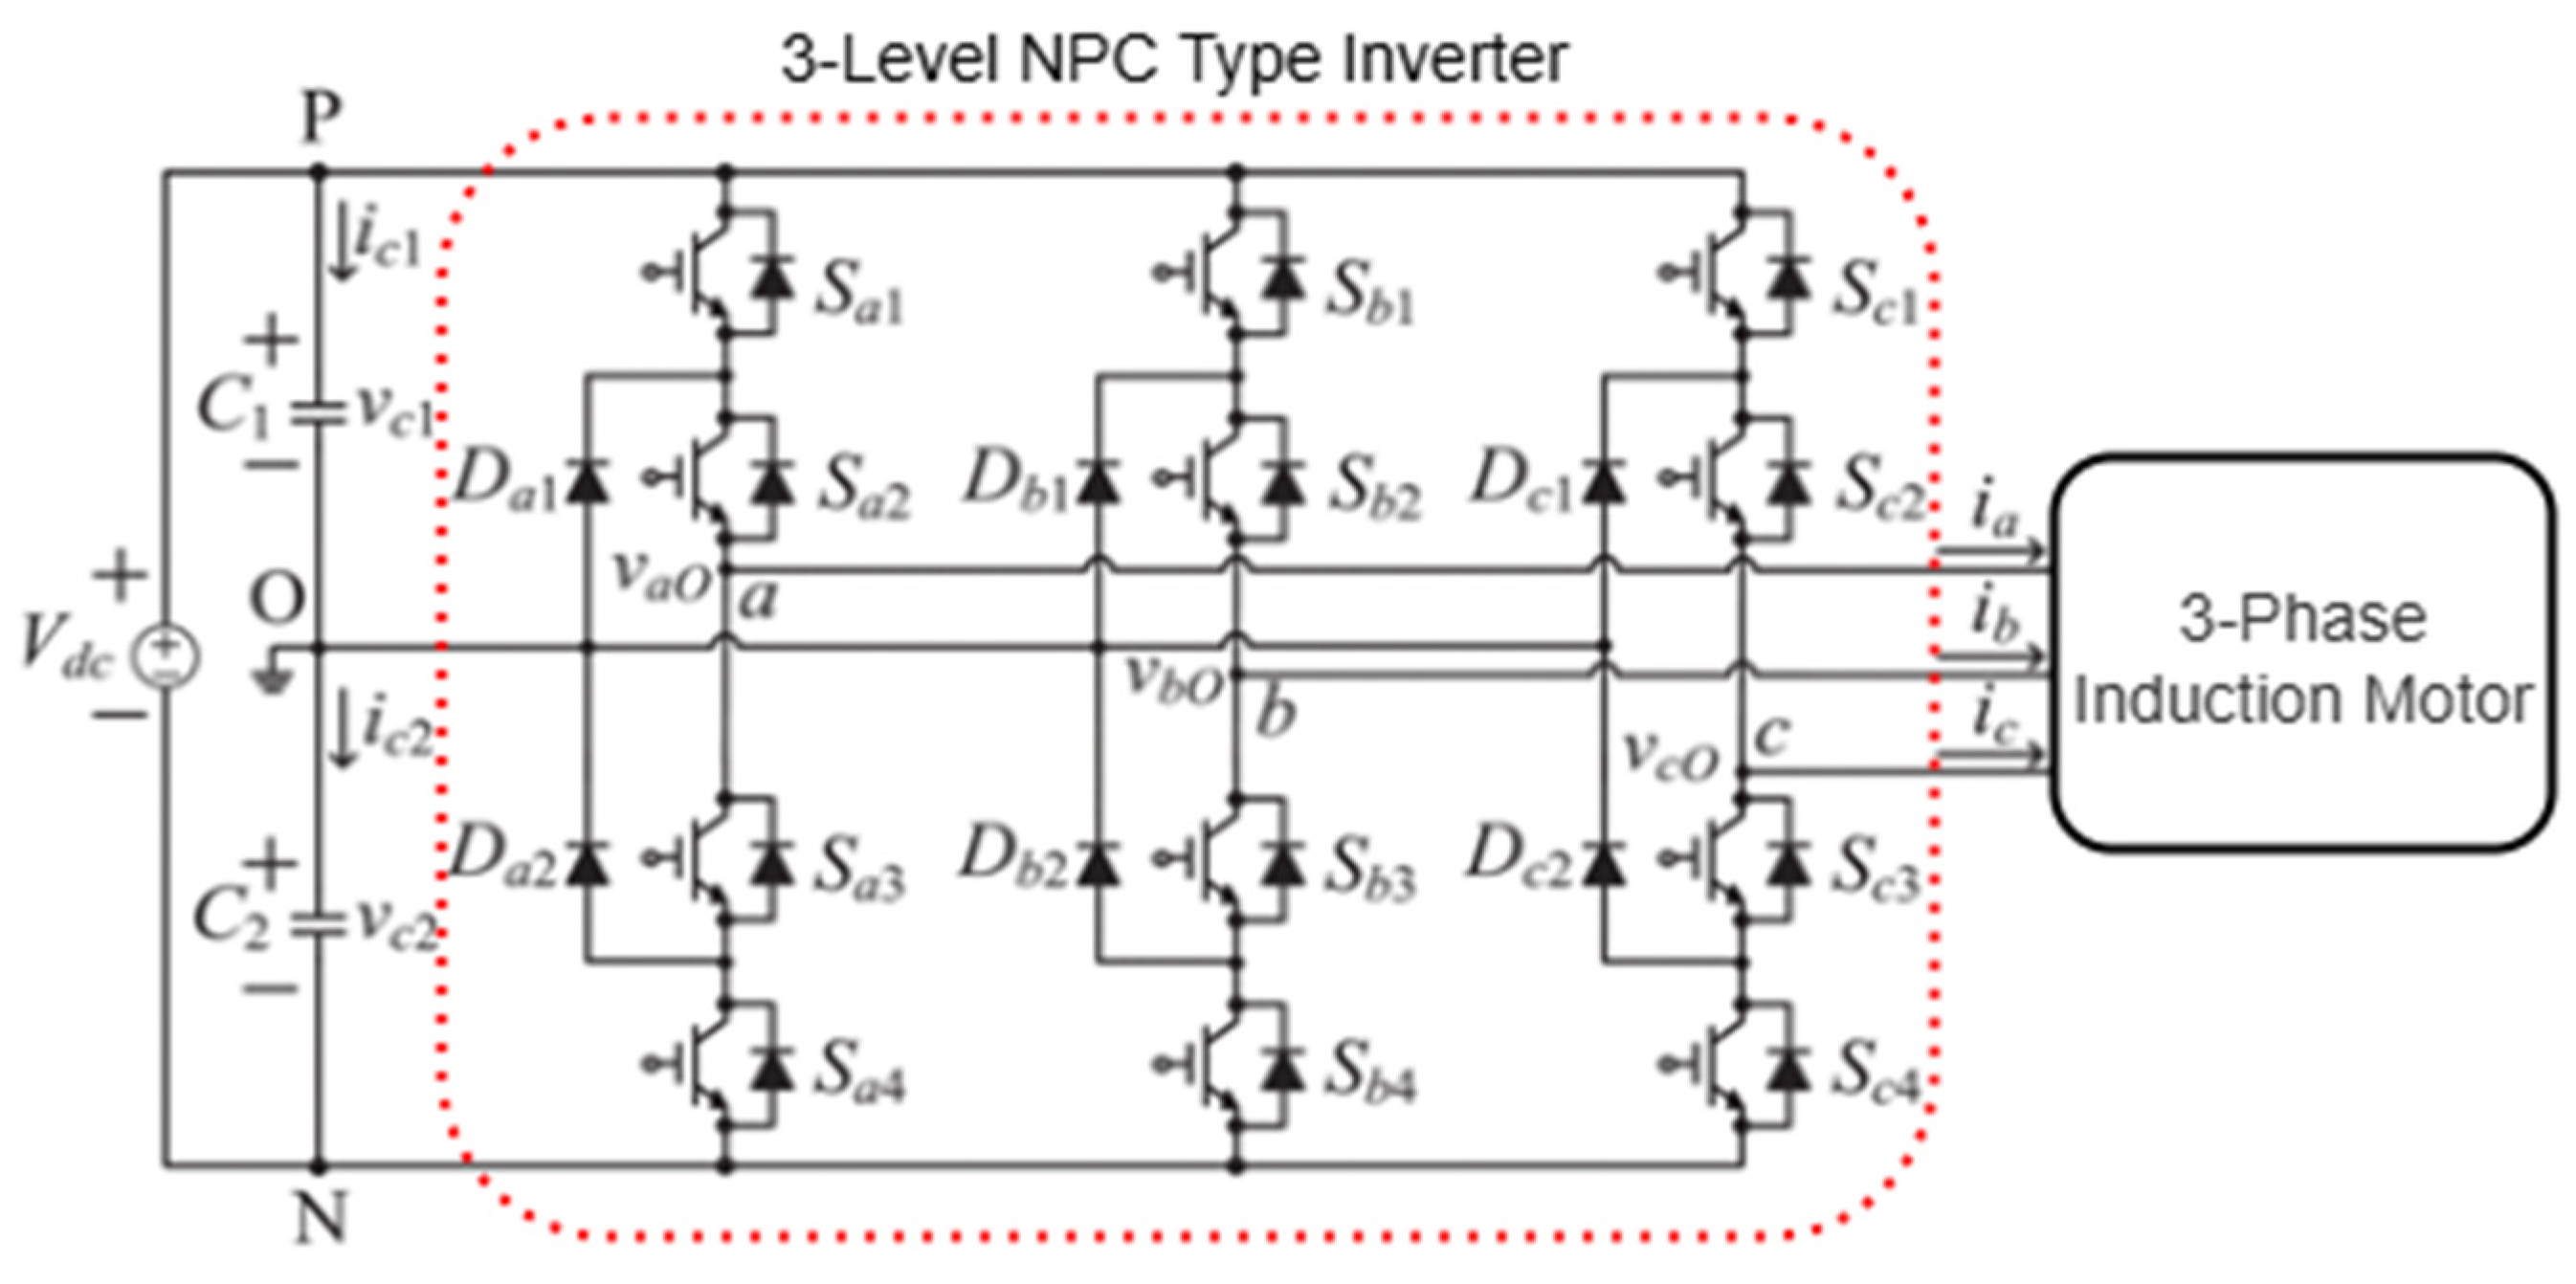
Figure 2 shows a 3-phase 3-level diode-coupled inverter feeding an induction motor [
22]. The SVPWM technique is used to control the output voltage and frequency of the inverter.
2.2. Data Acquisition and Preparation
Since it is easier to recognize sectors and regions in a two-phase coordinate system, the Clarke transformation is used first. The Clarke transformation converts the three-phase voltage or current components at the output of the inverter into two-phase axes [
23]. For the sector and region identification model, which is one of the focal points of this study, the data is obtained from the inverter based on the SVPWM technique.
In a three-phase system, the phase voltages or currents are expressed as
,
. These are converted into a two-axis (α, β) coordinate system using the Clarke transformation.
After the Clark transformation, the values for
and the angle (
) are determined, which are to be used as parameters for the detection of sectors and regions. These values are expressed as follows:
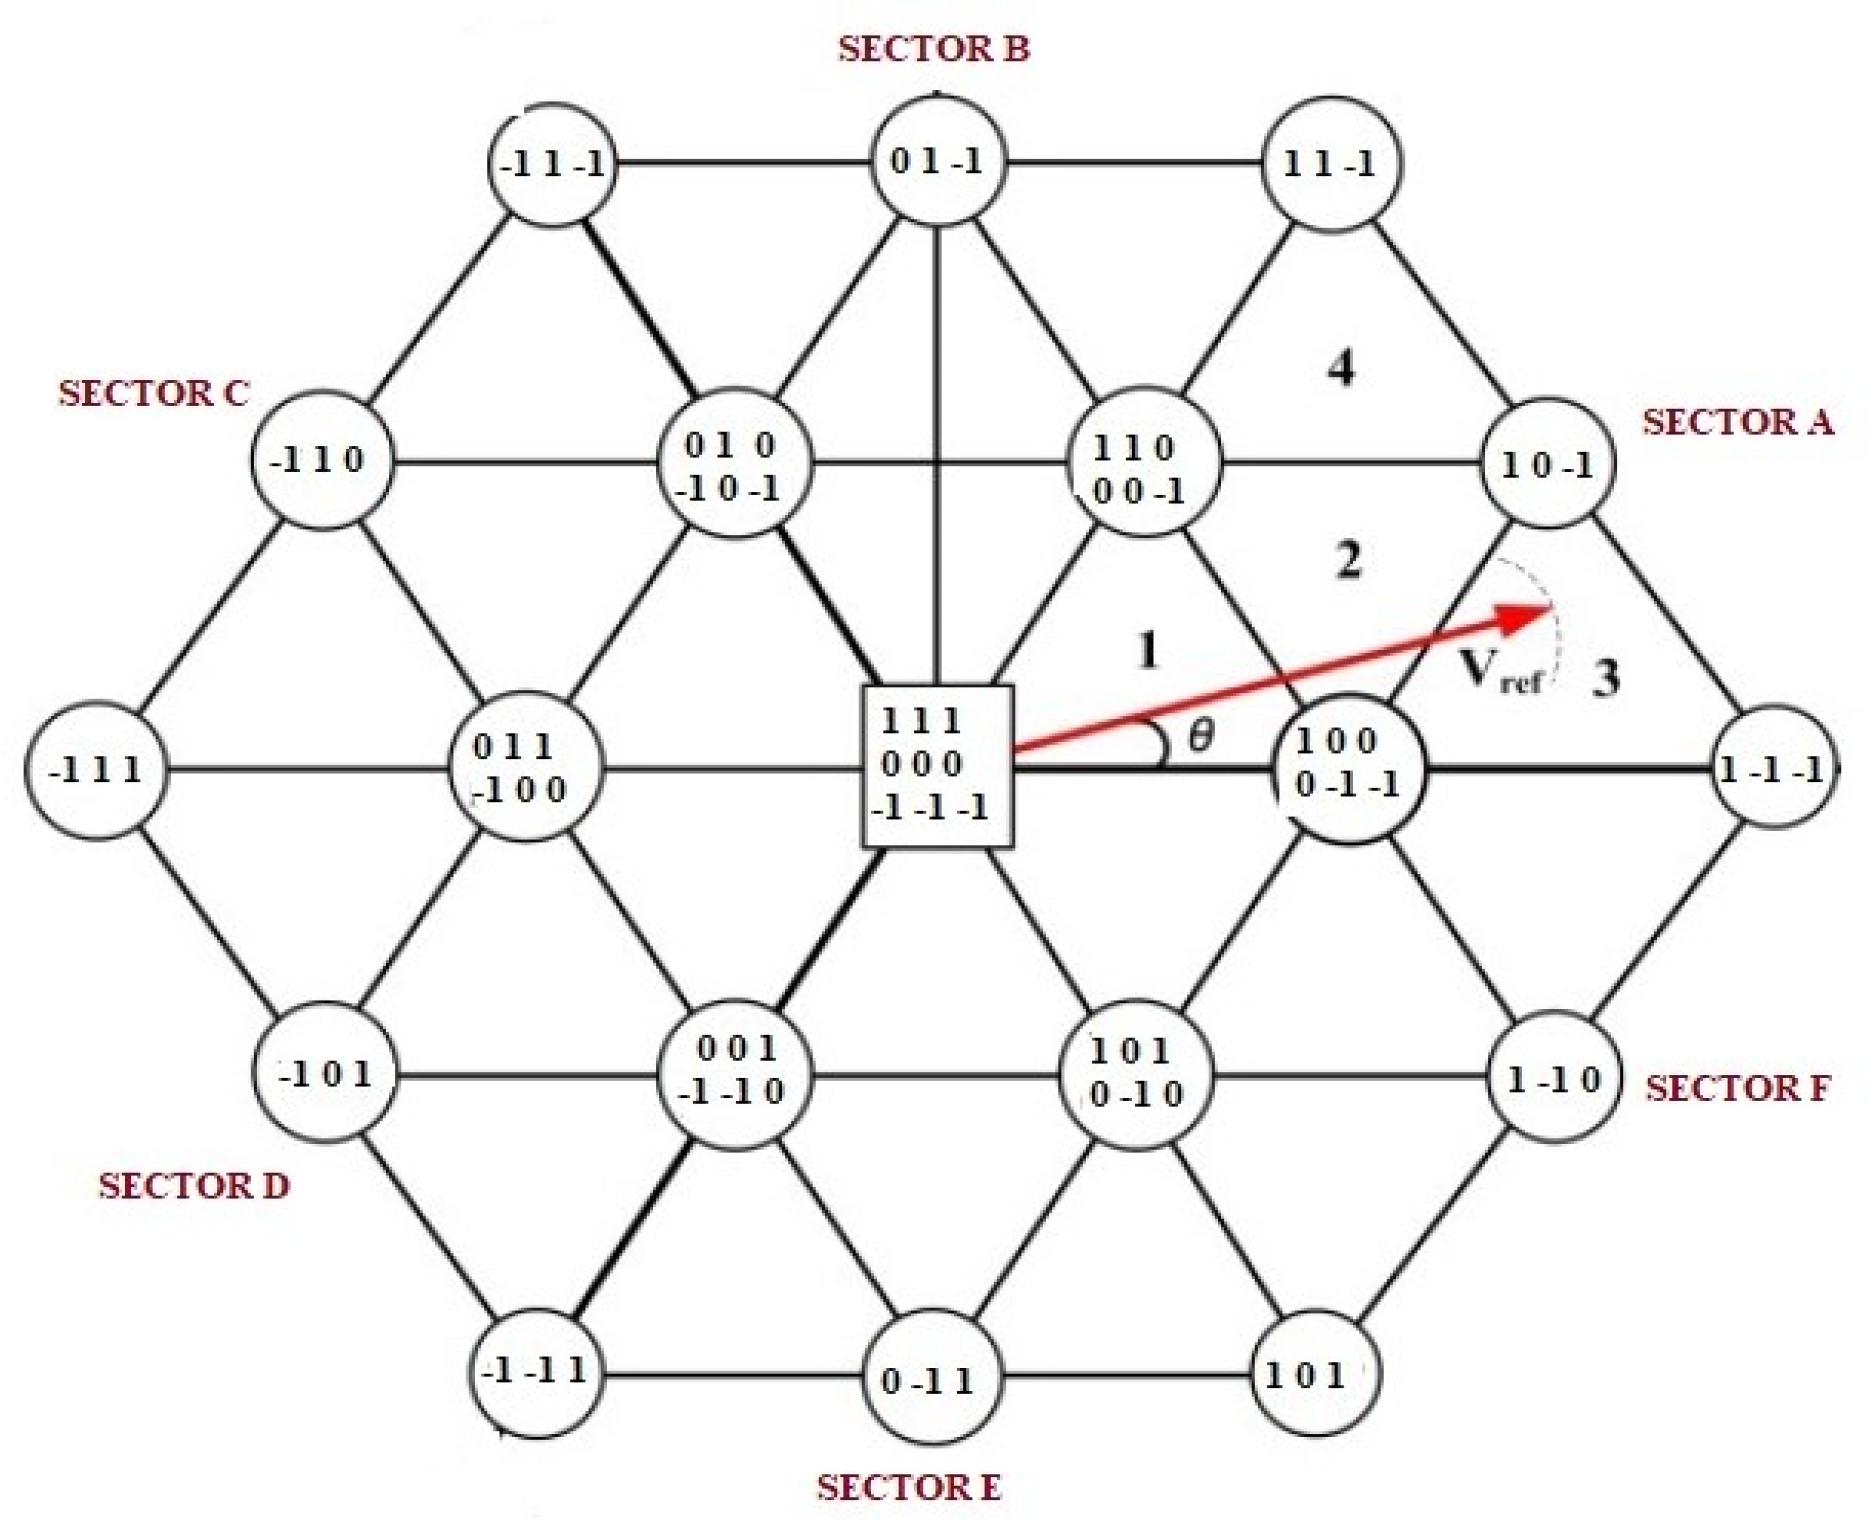
The space vector diagram of a three-level inverter of type NPC is shown in
Figure 3. The space vector has a hexagonal structure with six sectors and four regions within each sector.
Since each phase has three states, there are 27 switching states. There are a total of 24 active voltage vectors; 12 voltage vectors are small and have the value
, 6 voltage vectors are medium and have the value
and 6 voltage vectors are large and have the value
[
24]. In this way, the output signal is almost sinusoidal, and the efficiency of the inverter is higher. In the space vector diagram, each sector is divided into 60° angles. The relationship between sector and angle (
) is shown in
Table 1.
In the space vector diagram, there are 4 triangular regions in each sector. The x and y components are used to determine the region where the voltage vector
is located. The relationship between the detection of the region depends on the components
and
is given in
Table 2.
In a three-level NPC inverter, the technique of space vector pulse width modulation (SVPWM) is used to determine the switching sequences of the power electronic components. The switching sequences and times of the power electronic elements are optimized according to the position of the reference voltage vector in the space vector diagram [
25,
26]. The times are given as
,
and
according to the position of the reference vector in the subregion.
is the sum of the execution times of the individual vectors.
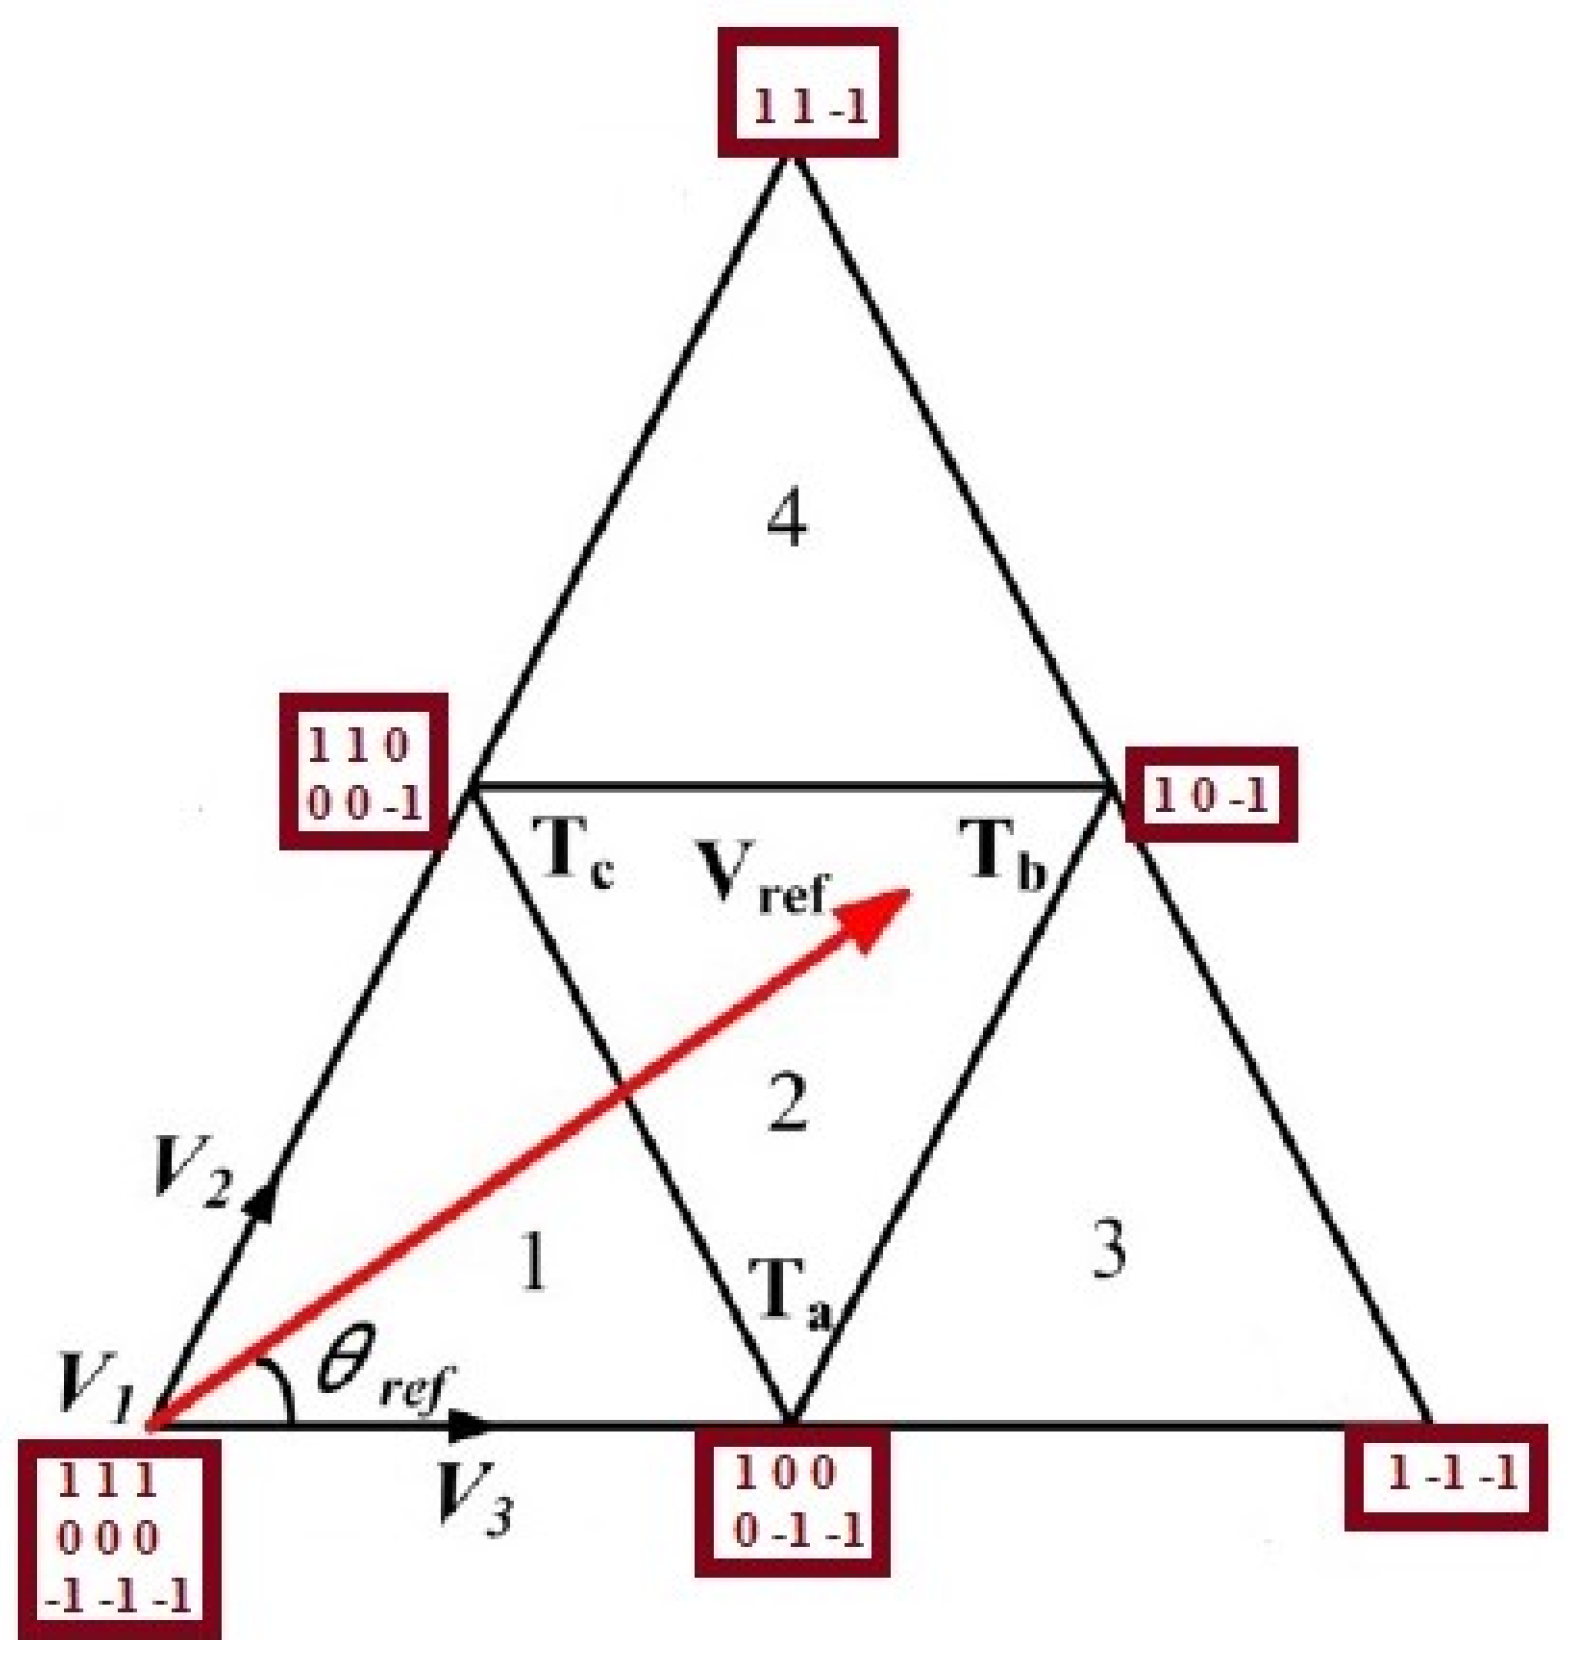
As can be seen in
Figure 4, the reference voltage vector is represented by three voltage vectors in the lower area.
for the switching states [1 0 0/0 −1 −1],
for the switching state [1 0 −1] and
for the switching state [1 1 0 0/0 0 0 −1]. Accordingly,
2.3. Pre-Processing
The dataset consists of the phase voltages , , and and the phase currents , , and collected from a three-phase voltage source inverter system. Prior to model training, these raw time-series signals were subjected to several pre-processing steps to ensure reliability and suitability for deep learning applications. The applied steps are summarized as data quality check, down-sampling, and data normalization. The data quality check is used to ensure that data sets with corrupted, missing, or physically meaningless values are removed. Next, downsampling optimizes processing time by reducing data density without losing information. Finally, all input values (DC input voltage, modulation index, switching frequency, and angle) were normalized into the range [0, 1] using min–max normalization so that the model can learn more robustly.
Although the inverter system initially provides the three-phase voltages (, , and ) and currents (, , and ), these signals are not directly used as model inputs. Instead, they are processed to extract the fundamental operating variables of the system. From the measured phase voltages and currents, the DC voltage (), modulation index (), switching frequency (), and reference angle () are derived. The modulation index is defined as the ratio between the reference voltage () amplitude and the DC voltage. The reference voltage and angle are obtained using the Clarke transformation to convert phase voltages into the stationary α-β component. These four quantities serve as compact and physically meaningful descriptors of the inverter state, and are therefore selected as the final input variables for sector and region classification.
The success of deep learning models depends directly on the structure and distribution of the data. Therefore, the statistical analysis of the dataset is one of the most important steps that must be performed before setting up the model. The dataset contains a total of 360,000 samples for six class sectors (A–F) and four class regions (1–4). The main statistical measures for each characteristic of the dataset are listed in
Table 3. This statistical data shows the numerical distribution of each characteristic and forms the basis for all pre-processing before the data is fed into the model.
2.4. Deep Learning Classifiers
Recognizing sectors and regions in the NPC inverters is crucial for the correct operation of the system. While traditional methods can be computationally intensive and slow, deep learning-based classifiers can make predictions in real time with high accuracy. DNN, 1D-CNN, LSTM, and GRU-based deep learning models can be used for the classification of sectors and regions in NPC inverters. These models are described in detail below, with the most suitable model being selected based on the system requirements and optimized for real-time use.
2.4.1. Deep Neural Network
DNN is a deeper version of the traditional Multi-Layer Perceptron (MLP) model [
27]. DNN is a flexible and powerful model that can be used independently of the data type. It consists of fully linked layers, and each neuron is connected to all neurons of the previous layer [
28]. A DNN layer performs the following operation:
where
is the activation input in the layer,
is the weight matrix of the layer and
is the bias vector. Using activation functions such as ReLU, Sigmoid, and Softmax, the output of the stratum can be expressed as follows:
where
and
denote the activation function and the output of the function, respectively.
In DNN classifiers that use the softmax activation function, probability estimation is performed as follows.
2.4.2. 1D Convolutional Neural Network
Convolutional neural networks (CNNs) are popular and powerful models, especially in image processing and time series analysis [
29,
30]. The 1D-CNN models that work with one-dimensional data are widely used, especially in areas such as signal processing, speech recognition, EEG analysis, and classification of time series data [
31,
32]. This model creates feature maps by applying displacement filters to the input data. The convolution process is mathematically defined as follows:
where
stands for the input data,
for the weights of the convolution kernel, and
for the filtered output (feature map). In addition,
and
stand for the filter size and the bias term, respectively, while
stands for the activation function.
1D-CNN models usually apply maximum pooling or average pooling after convolution and activation [
33]. Pooling is used to reduce the size of the feature map and to condense important information. In the last layer of the model, classification is performed using Global Average Pooling (GAP) or Fully Connected layers [
34].
2.4.3. Long-Short Term Memory
LSTM is an improved version of recurrent neural networks (RNN) and is effective in learning long-term dependencies [
35,
36]. The LSTM cell consists of three basic components: the cell state (
), which stores the long-term memory, the hidden state (
) which contains information from the previous time and the input (
), forgetting (
) and output gates (
), which control the flow of information. In the LSTM model, the input gate, which determines the new information to be stored, the forget gate, which determines the information to be forgotten, and the output gate, which determines the information to be output, can be expressed mathematically as follows [
37,
38]:
The state of the cell and the hidden state calculated by the update are expressed as follows:
where
stands for the learned weight matrices and
for the distortion terms. In addition,
and
stand for the sigmoid and tangential hyperbolic activation function, respectively.
2.4.4. Gated Recurrent Unit
GRU is a simplified version of LSTM and requires less computation as it combines forget and enter gates into a single update gate [
39]. GRU is therefore faster because it reduces computing costs by using fewer parameters [
40]. In contrast to LSTM, GRU has no cell state and only uses the hidden state [
41]. The basic components of a GRU cell are the update gate (
), which determines how much prior knowledge should be applied, and the reset gate (
), which controls the forgetting of prior knowledge and the hidden state (
). These basic components can be expressed mathematically as follows:
where
and
stand for the learned weight matrices or bias terms and
and
for the sigmoid or tangential hyperbolic activation functions.
2.5. Proposed Deep Learning Architectures
Sector and region estimation is a complex problem, especially with input parameters such as Vdc (DC input voltage), m (modulation index), f (switching frequency), and (phase angle) requires deep learning models that can accurately learn the multidimensional relationships between these parameters. DNN (Deep Neural Network), 1D-CNN (One-Dimensional Convolutional Neural Network), LSTM (Long-Short Term Memory), and GRU (Gated Recurrent Unit) based models are used in this study.
The DNN model is a traditional deep learning model consisting of fully connected layers. This model has been used to learn complex and multidimensional relationships and improve accuracy on tasks such as sector and region prediction. The 1D-CNN model is particularly effective in analyzing time series and is capable of extracting features through convolutional filters. The architecture of the proposed 1D-CNN model for sector and region prediction is shown in
Figure 5.
The LSTM model is used to capture long-term dependencies in time series data. It is optimized to make the best prediction while preserving the temporal patterns of the input data. The GRU model works similarly to the LSTM but has an optimized structure that requires less computational effort. This model is preferred for learning time series patterns with fewer parameters.
Figure 6 shows the proposed LSTM/GRU-based model architecture for predicting sectors and regions.
Each of these models was chosen because it offers different advantages and can work with time series and signal data. Each model is optimized with the grid search algorithm to select the best hyperparameters, and several architectural designs are proposed. Adam was chosen as the optimization method for all proposed models. The number of epochs and the stack size were set to 100 and 64, respectively. The optimal number of layers, the number of units in each layer, the dropout rate, and the learning rate selected by the grid search algorithm for the prediction models for sectors and regions are shown in
Table 4.
2.6. Model Evaluation
In this study, metrics such as accuracy (Acc), recall (Rec), precision (Pre), F1 score, and Matthews Correlation Coefficient (MCC) [
42,
43] are used to evaluate the performance of each DL model in identifying sectors and regions in NPC inverters. The confusion matrix is used to calculate these performance measures. The confusion matrix
for
classes are given by the following:
For multi-class classification, the performance metrics accuracy, precision, recall, F1-score, and MCC are mathematically defined as follows, where
represents the true class:
where
and
represent the number of samples of the actual class
and the number of predicted samples, respectively.
stands for the total number of samples.
In order to assess the generalizability of the DL models for the prediction of sectors and regions more precisely, a cross-validation (CV) is carried out. In this way, overfitting of the models can be avoided, and a more robust performance measure can be obtained. The results of the model comparison obtained with CV are evaluated with the Friedman test and the subsequent Nemenyi post-hoc test.
The Friedman test is a non-parametric statistical test [
44]. If you test several models (e.g., DNN, 1D-CNN, LSTM, GRU) with the same data (folding), the ranking of their performance is used to measure whether there is a significant difference. The test statistics for the Friedman test are calculated as follows:
where
and
denote the number of models and convolutions, respectively.
indicates the average rank of the
-th model in the foldings. If the
value is greater than the critical value, it is concluded that there is a significant difference (
p < 0.05) between the models.
If there is a significant difference because of the Friedman test, the Nemenyi post hoc test is applied to determine the different models [
45]. If the difference between the average rankings of the models is greater than the critical difference (CD), the performance of these two models is considered statistically different [
46]. The critical difference (CD) can be expressed mathematically as follows:
where
denotes the critical value, which, taken from the Studentized Range Distribution table, is typically
for
. Therefore, if the difference is greater than CD, the performance of the models is significantly different.
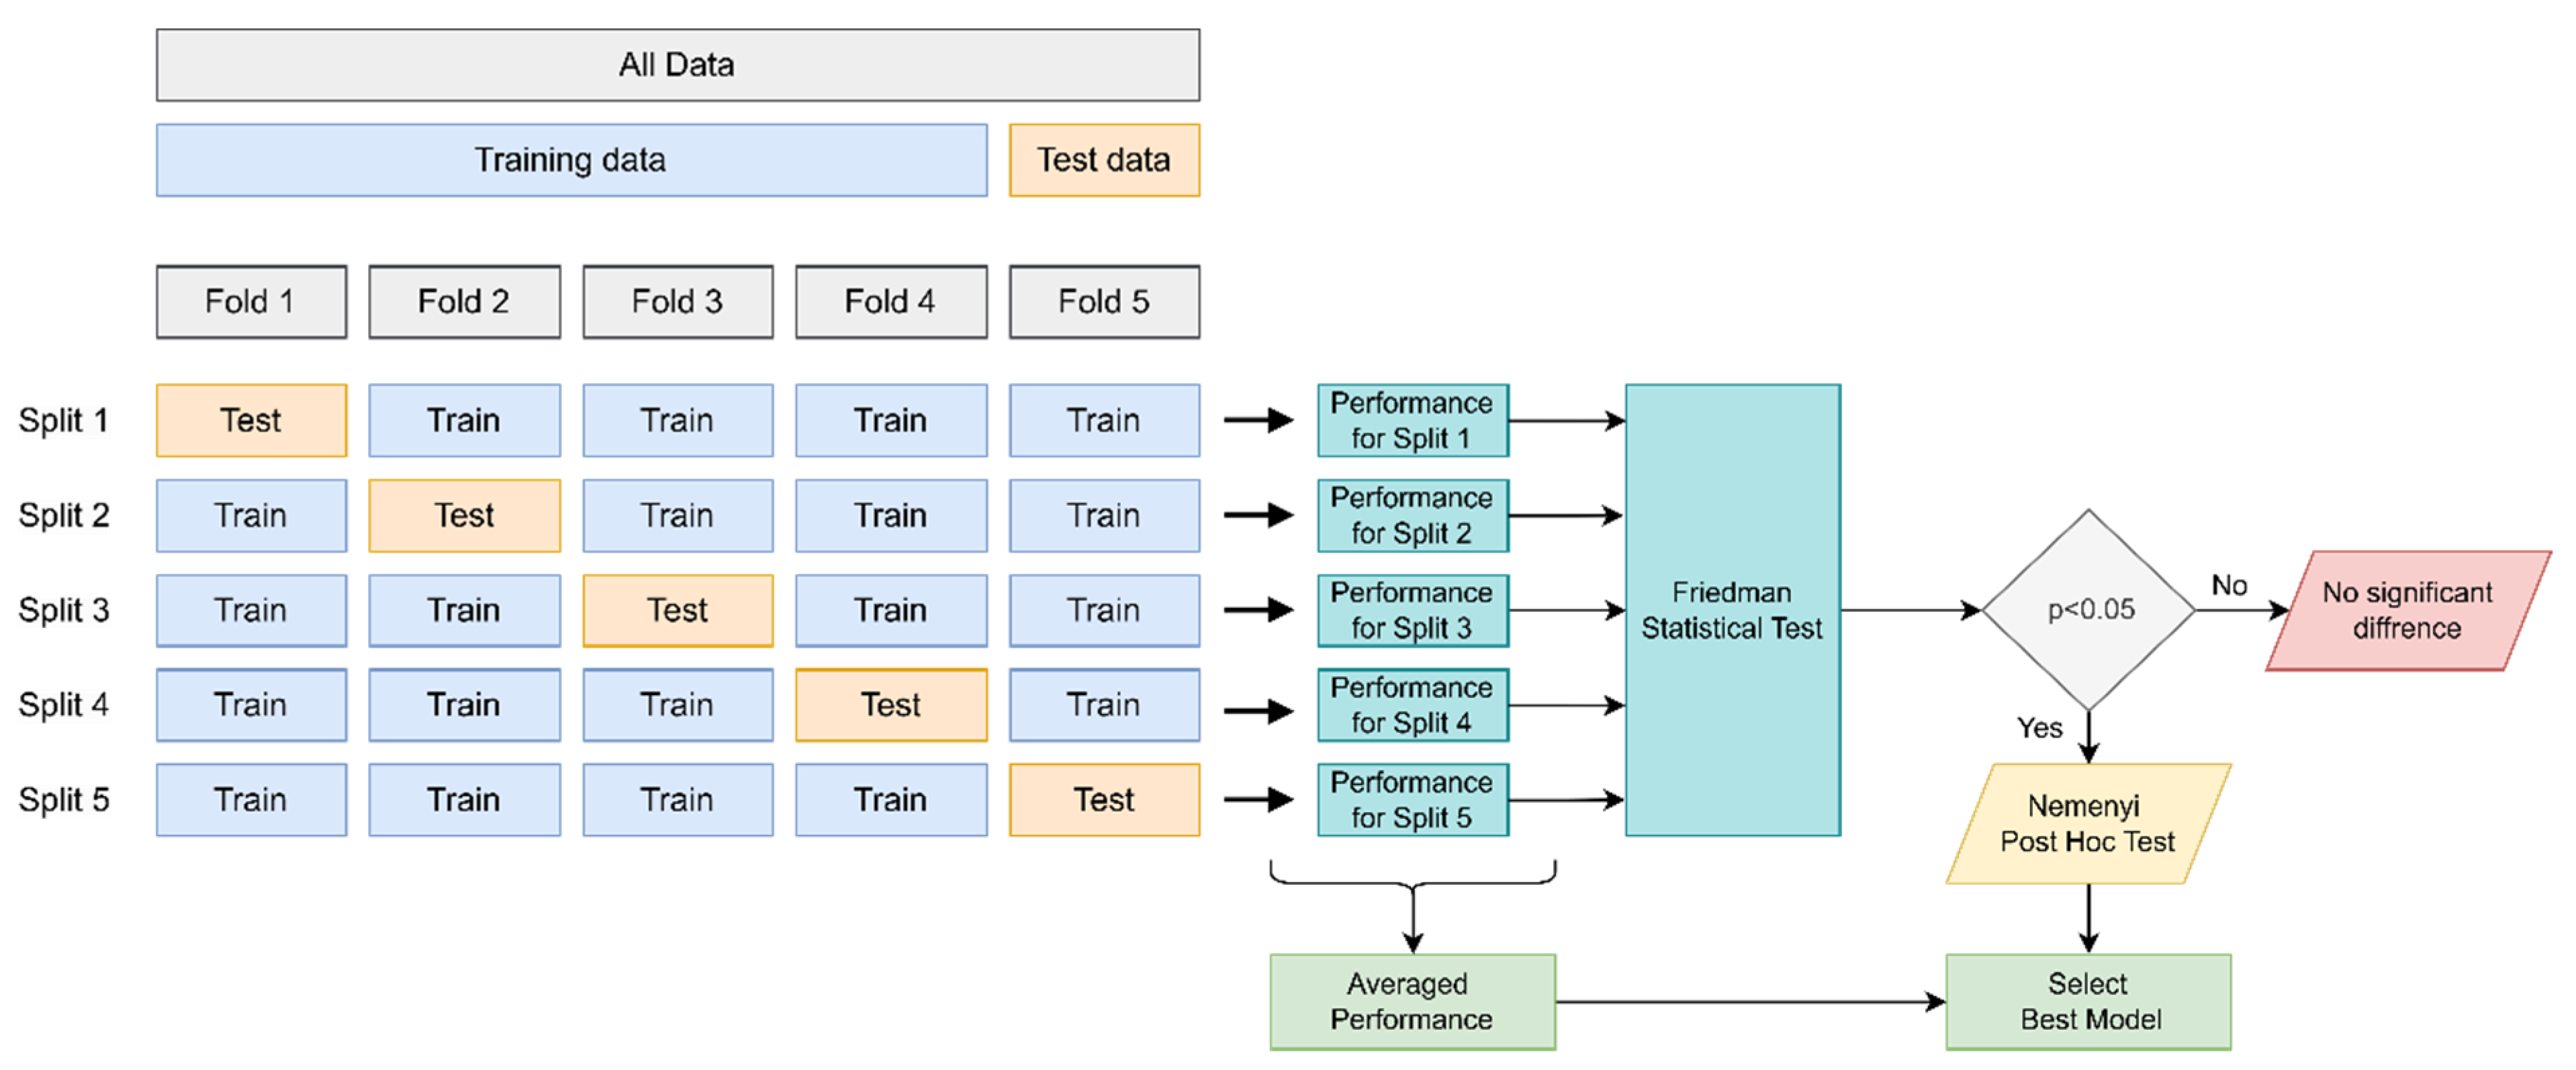
The CV technique and statistical testing procedure used in the performance measurement of the DL models for predicting sectors and regions are shown in
Figure 7. The 5-fold CV technique was used to measure the performance of the models, and the model results were evaluated using the Friedman test followed by the Nemenyi post-hoc test. If the Friedman test showed a significant difference (
p < 0.05), the Nemenyi post-hoc test was used to select the best model with a significant difference.
2.7. Experimental Setup
In this study, DNN, 1D-CNN, LSTM, and GRU-based DL models are evaluated for the prediction of sectors and regions for a three-level NPC inverter. The input DC voltage (Vdc), modulation index (m), switching frequency (fs), and angle are used as input variables. The data used in this study were obtained through simulation of a three-level NPC inverter model in MATLAB/Simulink, where input voltage, modulation index, switching frequency, and angle were systematically varied to generate a comprehensive dataset. The experiments were conducted considering six sectors (S1–S6) and four subregions (R1–R4). However, the reference voltage vector obtained according to the input parameters contains three regions (R2–R4) in the space vector diagram. Therefore, only three regions were used in the training and testing of the prediction models. This allowed the classification of six sectors and three regions for the inverter. In this study, the input variables are processed differently depending on the network architecture. For the DNN model, the variables are provided as static feature vectors, allowing the model to learn relationships directly from individual data points. In contrast, CNN, LSTM, and GRU architectures are trained on sequentially structured inputs, where the same features are arranged as time-series windows. This enables CNN to capture local spatial patterns, while LSTM and GRU are capable of modeling long-term temporal dependencies. Such a distinction ensures that each architecture is utilized in line with its strengths in feature extraction and sequence modeling.
In developing the classification models for predicting sectors and regions, a data set of approximately 360,000 rows of data was created. Subsequently, 1 out of 12 of the data is used by sub-sampling, and the processing time is optimized by reducing the data density. A normalization process is applied to the final dataset, and all input variables are normalized to be within a certain range to ensure a more stable learning of the models. The 5-fold CV technique is used to train and test the models, and the performance of the models is evaluated with the metrics of accuracy, pre-precision, recall, F1-score, and MCC. The Friedman statistical test, followed by a Nemenyi post hoc test, was applied using the fold accuracy ratio to select the best model with a significant difference. Finally, all DL classification models were implemented in Python 3.11 using the sklearn and TensorFlow libraries.
3. Results
In this section, the results obtained by using DNN, 1D-CNN, LSTM, and GRU deep learning models to solve the sector prediction problem are evaluated. The performance of the prediction models is analyzed using metrics such as accuracy, precision, recall, F1-score, and MCC in the experiments conducted using the 5-fold cross-validation method.
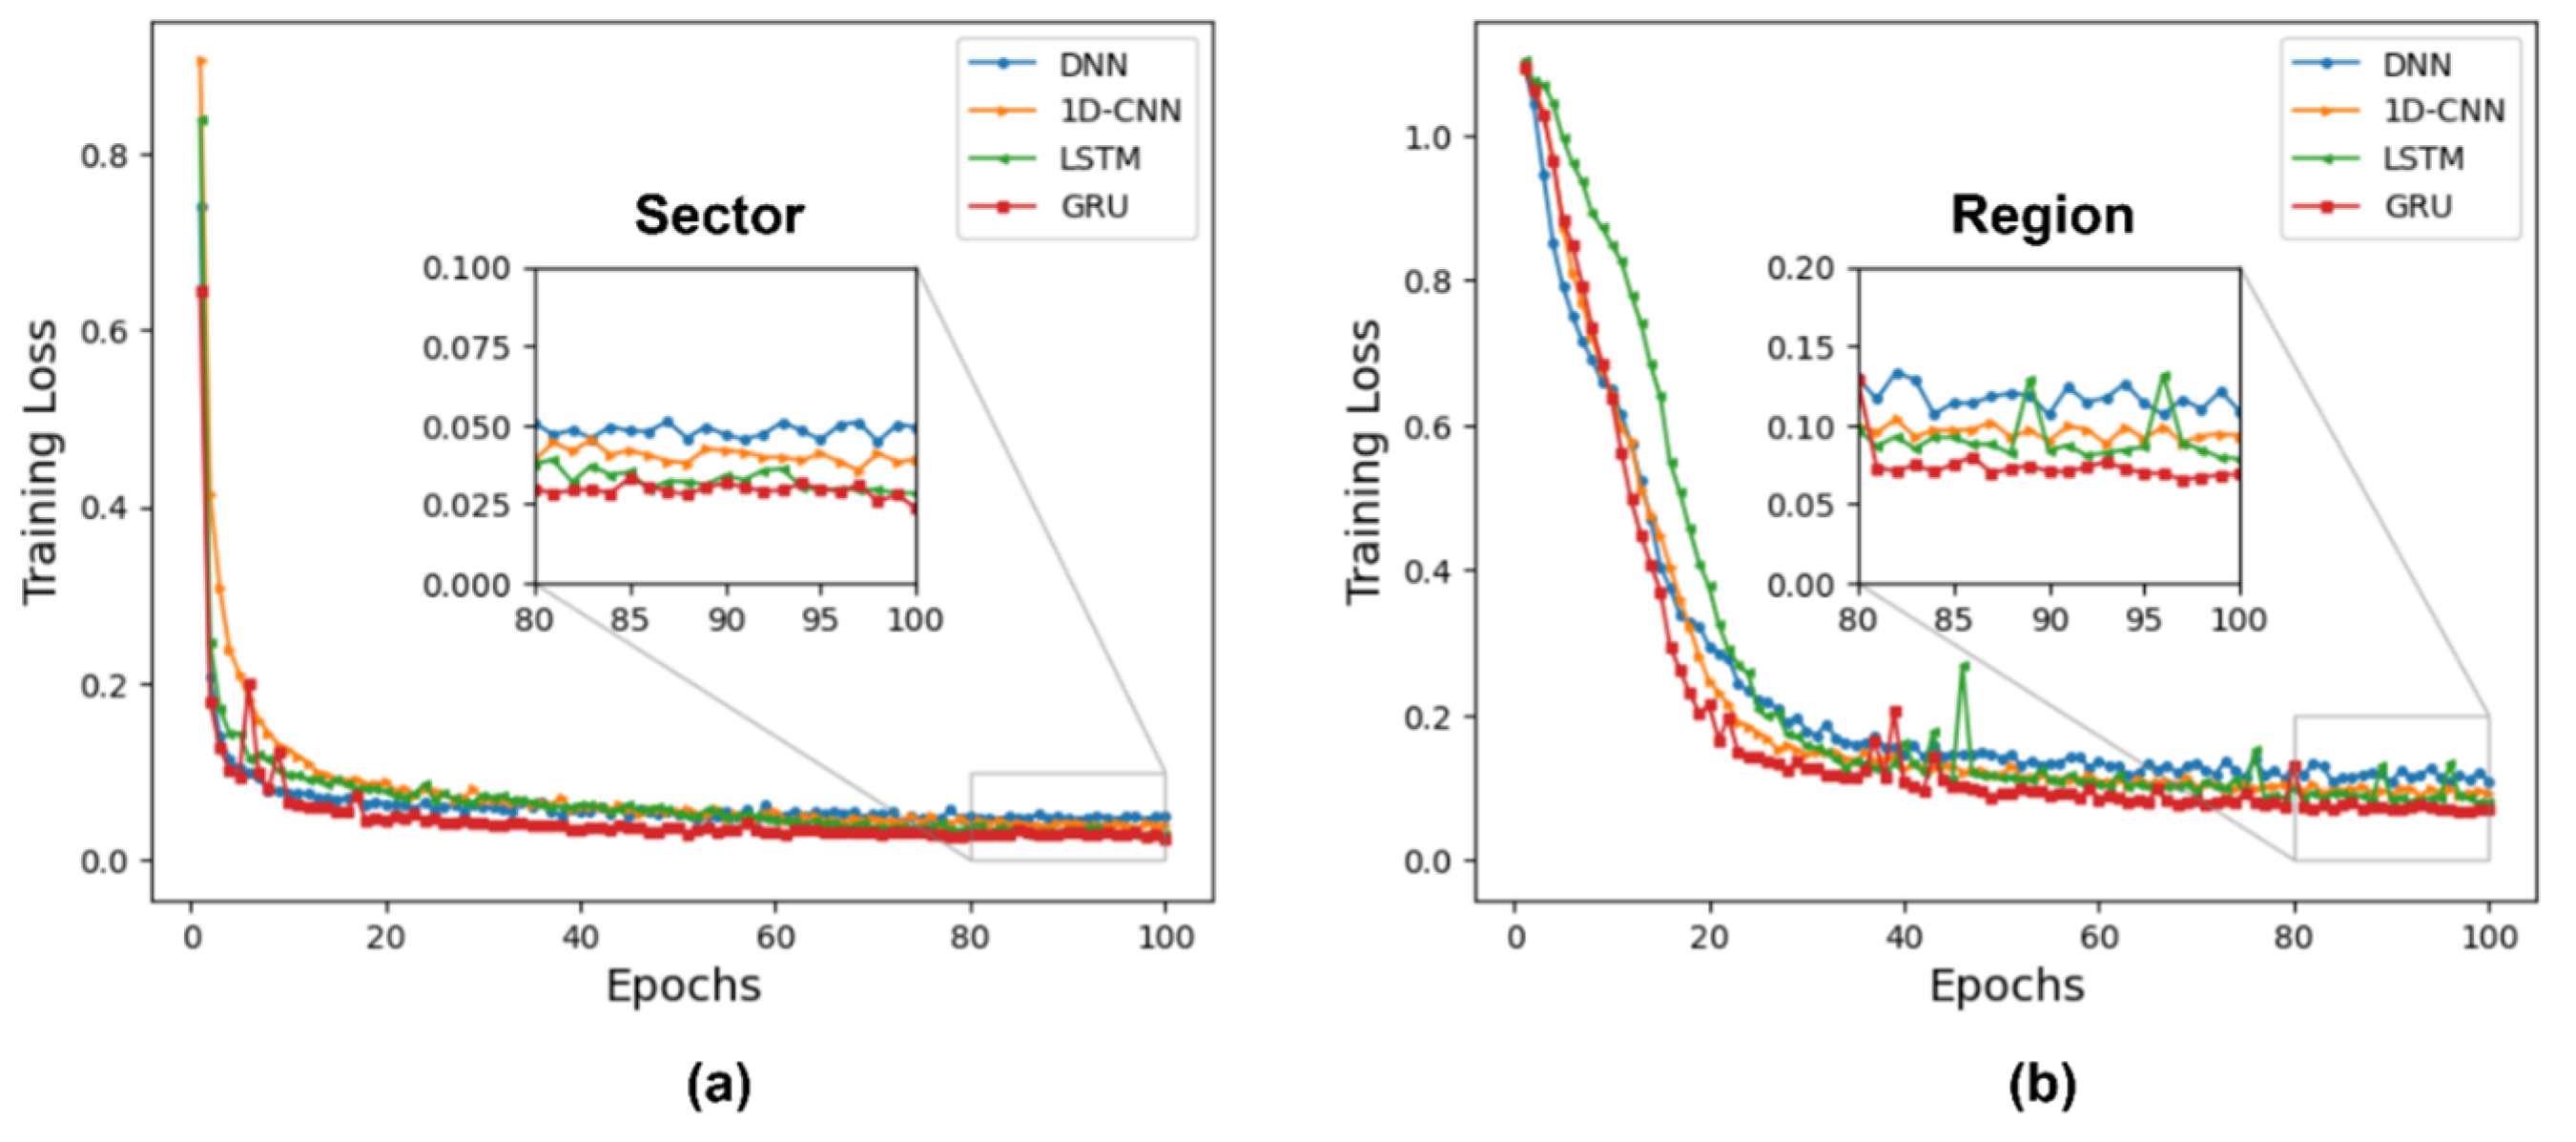
The training loss plots of the models against the epochs for the sector and region predictions are shown in
Figure 8a,b. From these plots, it can be seen that the training loss for the deep GRU and LSTM models reaches a stable level for both the sector and region predictions, especially between epochs 80 and 100. Thus, the LSTM and GRU models achieve the lowest training loss for tasks with time series or sequential data. The training loss for the region prediction is generally higher than for the sector prediction. This indicates that the regional data may be more complex or that the model is more difficult to learn with regional data.
The classification results obtained with 5-fold cross-validation for sector prediction are shown in
Table 5. The performance evaluation of the DL models was performed comprehensively by considering each convolution and the average of all convolutions.
According to the results shown in
Table 5, all models have a very high accuracy, but the GRU model performs best overall. The average accuracy of the GRU model is 99.27%, which is higher than that of the LSTM model (98.94%), which achieves the second-highest accuracy compared to the other models. The GRU model also achieves the best result in the MCC metric with an average MCC value of 0.991, which means that this model has the lowest error rate.
The LSTM model performed similarly well to the GRU model with an average accuracy of 98.94%, but slight variations in accuracy and MCC values were observed in some folds. In particular, the slightly lower performance in Fold 4 compared to the other folds (Accuracy: 98.43%) indicates that the model may be inconsistent in certain situations.
When analyzing the DNN and 1D-CNN models, although the DNN model achieved a successful result with an average accuracy of 98.33%, it performed relatively worse than the LSTM and GRU models, apart from the differences in the MCC metric. The 1D-CNN model outperformed the DNN model with an average accuracy of 98.61%, but with larger changes in some layers. The lowest accuracy of this model was 97.96% in Fold 3, and these variations indicate that the model performs unevenly on certain datasets.
The results of the 5-fold cross-validation of the deep learning models used for region prediction are shown in
Table 6. The results show that the GRU model achieves the highest performance with 97.62% accuracy. The LSTM model has a similar performance with 97.57% accuracy and is particularly strong in learning time-dependent information. The DNN model performed relatively well with an accuracy of 96.21%, but with a lower performance than LSTM and GRU. The 1D-CNN model showed the lowest performance with 94.97% accuracy and a significant drop in accuracy, especially in Fold 3.
The MCC results show that the GRU (0.964) and LSTM (0.962) models have the highest correlation, indicating that these models have high predictive power overall. The metrics for precision, recall, and F1 score show a similar trend, with the GRU and LSTM models having the highest values. As a result, the GRU model provides the best performance in the prediction of regions, while the LSTM model can be considered a strong alternative.
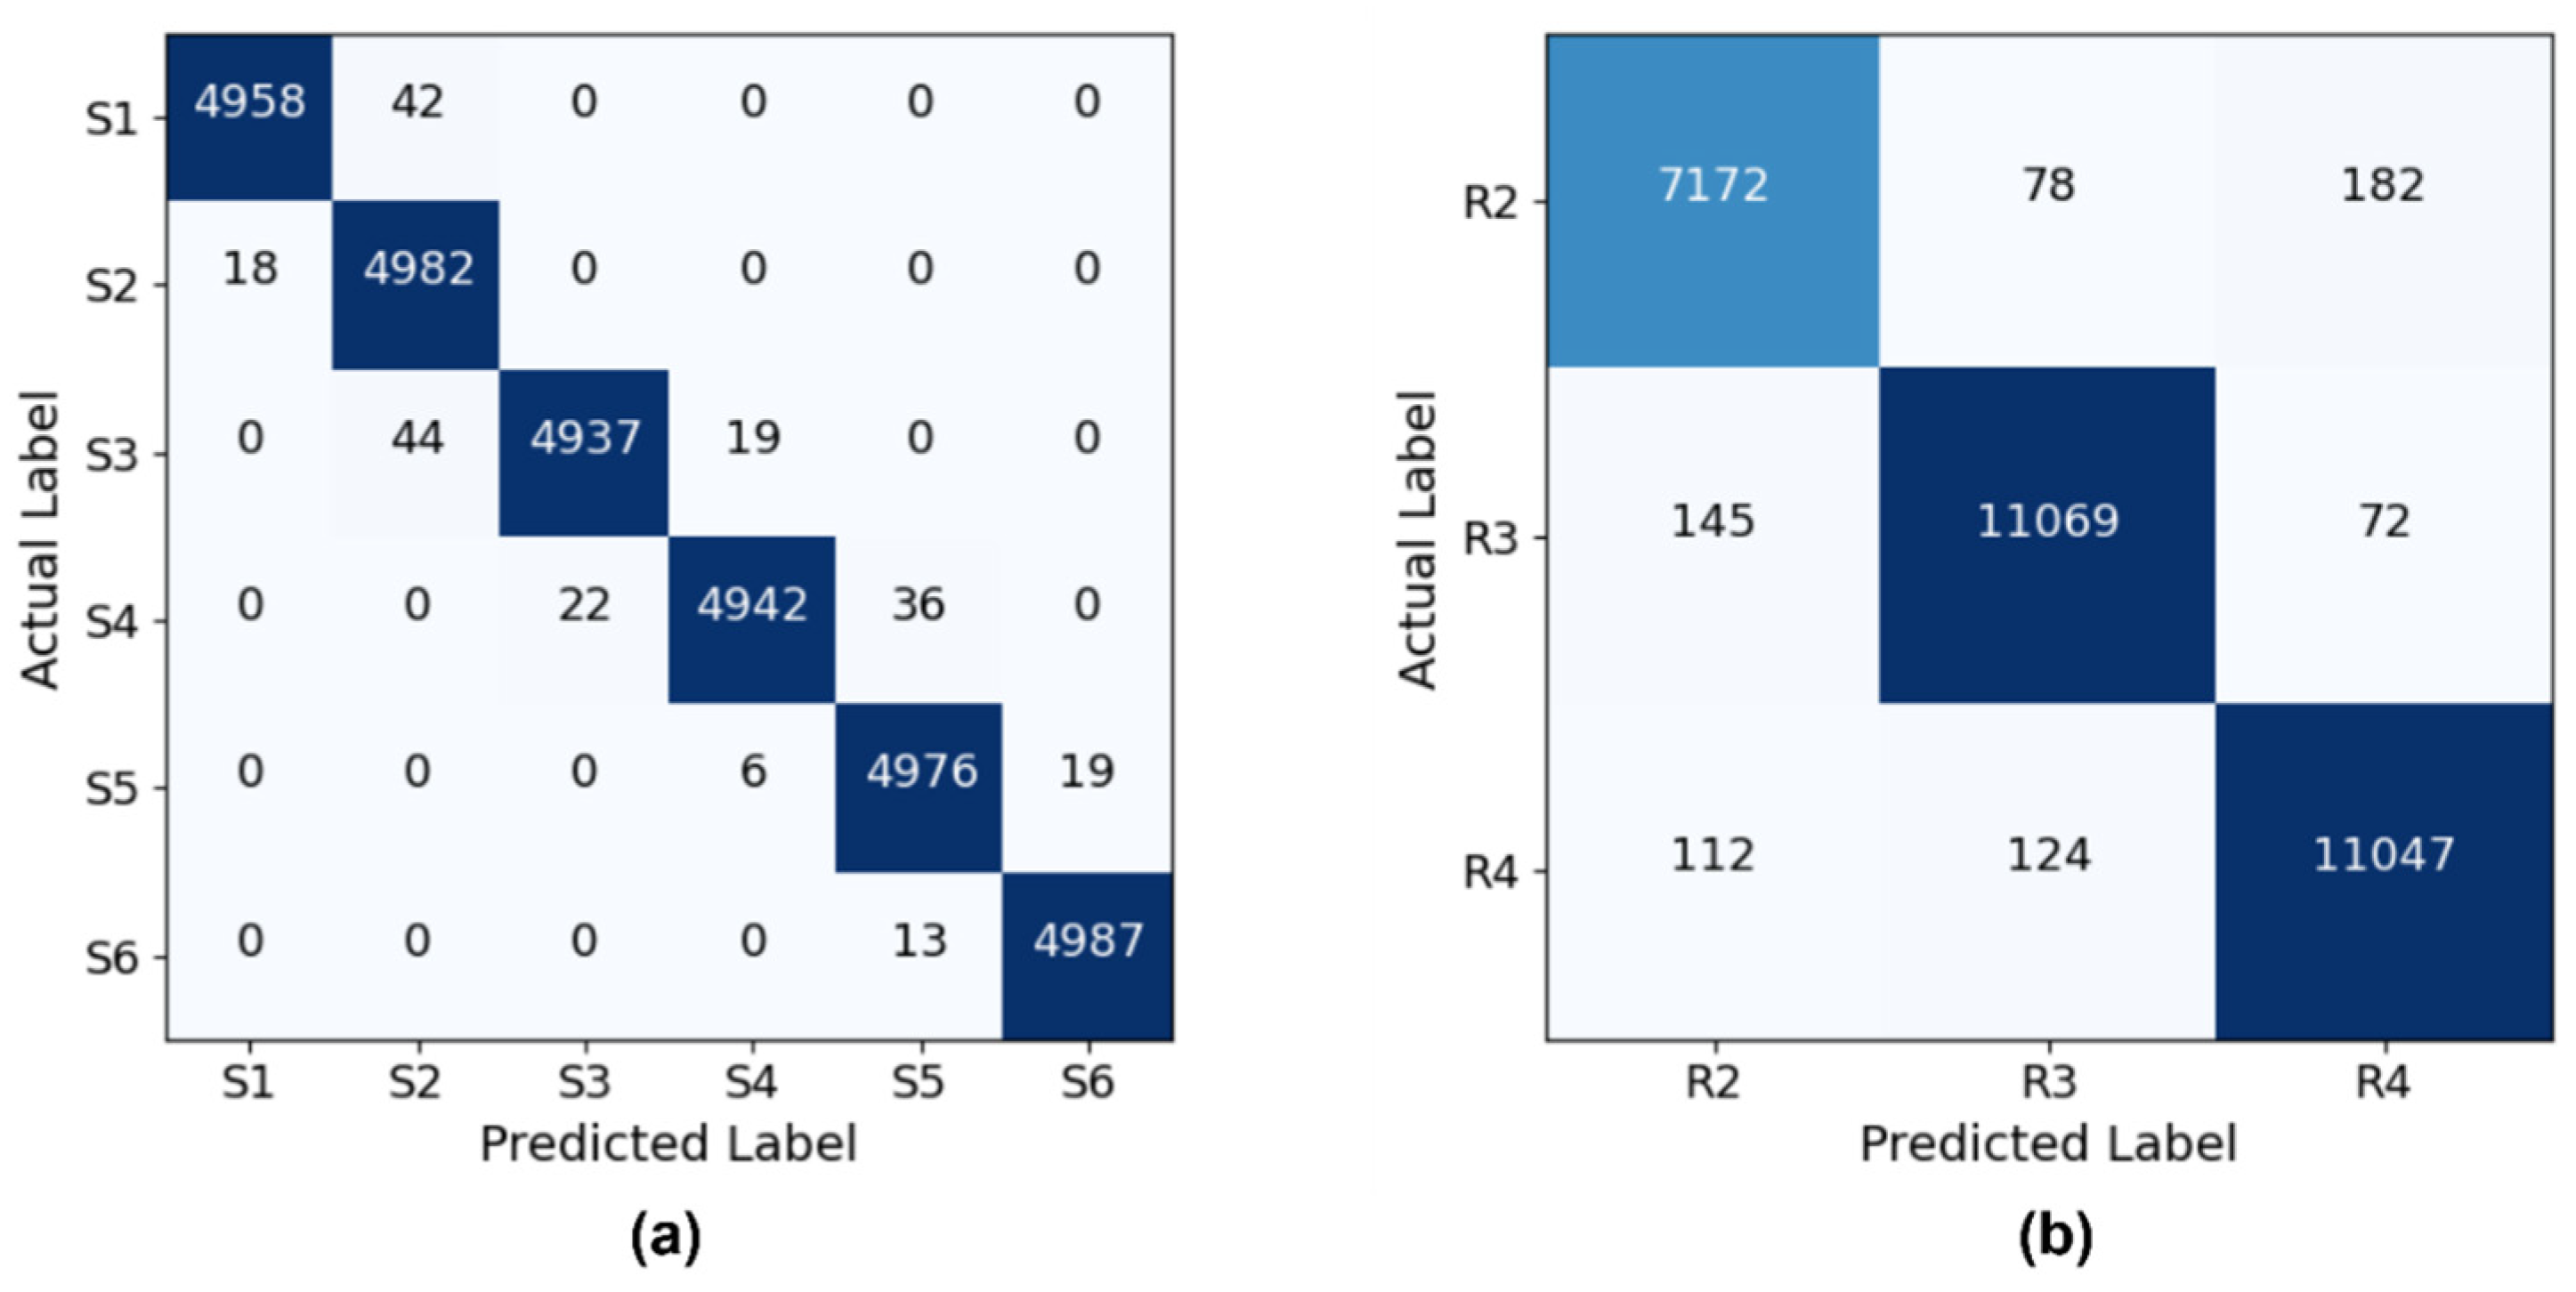
The confusion matrix of the GRU-based models with the highest performance for predicting sectors and regions is shown in
Figure 9. As can be seen in
Figure 9a, the classification performance of the model is quite high for the six sectoral classes (S1–S6). It can be seen that the model is able to correctly distinguish the sectoral samples, and there is minimal confusion between the classes. The most successful classes are S1, S2, and S6 with precision and recognition values of over 99%. For class S4, the confusion with S5 is particularly noteworthy. The fact that some instances of S4 were incorrectly predicted as S5 suggests that these two classes may have semantically similar properties.
Figure 9b shows the confusion matrix for the three regional classes (R2–R4). While the accuracy in this classification task is high, more confusion between the classes can be observed. In particular, it is noticeable that classes R2 and R4 are confused with each other. In both tasks, the GRU model successfully learned the sequential structure of the time series data and discriminated between the classes with high performance. While the F1 score for the sectoral classification was 99, it was 97% for the regional classification. This difference provides important evidence of the similarities between the classes and the overall generalizability of the model.
The Friedman test was applied to compare the performance of four different models (DNN, 1D-CNN, LSTM, GRU) for predicting sectors and regions and to determine whether there is a significant difference between them. The Friedman test statistic for the sector detection models is 8.28, and the p-value is 0.0406. Since this p-value (0.0406) is less than 0.05, it is concluded that there is a statistically significant difference between the models. Thus, there is a significant difference between the performance of the four models in recognizing sectors. Similarly, the Friedman test statistic for the region detection models is 12.60 with a p-value of 0.0056. Since this p-value (0.0056) is less than 0.05, it can be said that there is a statistically significant difference between the performance of the models.
After the Friedman test, the Nemenyi post hoc test was used to determine which models differ. This test checks whether there is a significant difference between pairs of models. If there is a significant difference between the pairs with
p < 0.05, the best model is determined. The results of the Nemenyi post-hoc test for the models determined for the detection of sectors and regions can be found in
Table 7.
The Nemenyi post hoc test, based on mean ranks and critical difference (CD) values, was applied to evaluate the statistical significance of performance differences among the models. For sector recognition, GRU achieved the best mean rank (1.4), followed by LSTM (2.2), and DNN and 1D-CNN (3.0). However, the differences between models did not exceed the CD (2.096), indicating no statistically significant differences. Specifically, the comparison between DNN and GRU showed a partially significant difference (p = 0.068), while no significant differences were observed between LSTM and GRU (p = 0.88) or between 1D-CNN and the other models (p > 0.05). For region recognition, LSTM obtained the lowest mean rank (1.2), followed by GRU (1.8), DNN (2.8), and 1D-CNN (3.6). In this case, LSTM and GRU demonstrated statistically significant improvements over 1D-CNN (p = 0.017 and p = 0.036, respectively), while differences with DNN were not significant (p > 0.05). Overall, the statistical analysis indicates that GRU generally performs best for sector recognition and LSTM for region recognition.
4. Discussion
The present study investigated the use of deep learning (DL) architectures, including DNN, 1D-CNN, LSTM, and GRU, for predicting sectors and regions of a three-level NPC inverter. The experimental results demonstrate that all models achieved high classification performance, with recurrent models generally providing superior accuracy and robustness compared to feedforward and convolutional networks. This indicates that the temporal dependencies inherent in inverter signals are better captured by architectures specifically designed for sequence learning.
An important consideration is the origin of the ground truth labels. In this study, the sector and region labels were generated automatically from the SVPWM logic using the analytical thresholds. While these labels can be computed directly through deterministic rules, the application of DL is motivated by several practical advantages. Rule-based thresholding methods are inherently sensitive to measurement noise, sensor inaccuracies, and parameter variations that commonly arise in inverter operation. In contrast, DL models are capable of learning discriminative patterns from data, which enables more robust classification under noisy or uncertain conditions.
Moreover, once trained, DL models provide very fast inference, making them suitable for real-time applications. Unlike rule-based approaches that may require recalibration of thresholds when operating conditions change, DL models can generalize to unseen scenarios without additional tuning. This adaptability is particularly valuable in applications such as fault detection, predictive maintenance, and adaptive modulation, where inverter operating conditions deviate from ideal assumptions. The use of DL in sector and region classification, therefore, not only validates its feasibility for fundamental inverter state estimation but also lays the groundwork for extending these models to more advanced power electronic applications.
All models demonstrated high classification performance, with recurrent architectures generally outperforming feedforward and convolutional networks. In particular, the GRU model achieved a balance of accuracy, robustness, and computational efficiency.
Table 8 summarizes the approximate parameter counts, test accuracy, and indicative inference latency for all models. GRU, with approximately 150,000 parameters, achieved the highest test accuracy and F1-score, while maintaining a lower parameter count and moderate latency compared to LSTM. Its simplified gating mechanism allows efficient learning of temporal dependencies, making it particularly suitable for real-time embedded applications. In comparison, DNN and 1D-CNN, with fewer or more parameters, respectively, performed slightly worse in accuracy and were less capable of capturing temporal dependencies.
