Article

Dynamic and Lightweight Detection of Strawberry Diseases Using Enhanced YOLOv10

1
School of Vocational Technology, Hebei Normal University, Shijiazhuang 050024, China
2
Hebei Provincial Innovation Center for Wireless Sensor Network Data Application Technology, Shijiazhuang 050024, China
3
Hebei Provincial Key Laboratory of Information Fusion and Intelligent Control, Shijiazhuang 050024, China
*
Author to whom correspondence should be addressed.
Electronics 2025, 14(19), 3768; https://doi.org/10.3390/electronics14193768
Submission received: 10 August 2025 / Revised: 11 September 2025 / Accepted: 21 September 2025 / Published: 24 September 2025

Abstract

Strawberry cultivation faces significant challenges from pests and diseases, which are difficult to detect due to complex natural backgrounds and the high visual similarity between targets and their surroundings. This study proposes an advanced and lightweight detection algorithm, YOLO10-SC, based on the YOLOv10 model, to address these challenges. The algorithm integrates the convolutional block attention module (CBAM) to enhance feature representation by focusing on critical disease-related information while suppressing irrelevant data. Additionally, the Spatial and Channel Reconstruction Convolution (SCConv) module is incorporated into the C2f module to improve the model’s ability to distinguish subtle differences among various pest and disease types. The introduction of DySample, an ultra-lightweight dynamic upsampler, further enhances feature boundary smoothness and detail preservation, ensuring efficient upsampling with minimal computational resources. Experimental results demonstrate that YOLO10-SC outperforms the original YOLOv10 and other mainstream algorithms in precision, recall, mAP50, F1 score, and FPS while reducing model parameters, GFLOPs, and size. These improvements significantly enhance detection accuracy and efficiency, making the model well-suited for real-time applications in natural agricultural environments. The proposed algorithm offers a robust solution for strawberry pest and disease detection, contributing to the advancement of smart agriculture.

1. Introduction

Strawberries are not only renowned for their delightful taste but also for their advantageous characteristics, including early yields, short cultivation cycles, and high productivity. These attributes render strawberries a low-investment, high-yield fruit, establishing them as a significant economic crop cultivated extensively across the globe [1]. The global strawberry industry is witnessing a notable upward trend, particularly in regions such as Asia, North and Central America, and North Africa, with production levels expected to continue rising. This increasing demand necessitates the implementation of innovative production systems and technologies, the development of new cultivars, and the adoption of advanced management practices to sustain the growth of this vital sector.
However, strawberries are particularly delicate and vulnerable to various infections in their natural environment [2]. They are susceptible to a wide array of pests and diseases, which can severely impact both yield and quality. Common threats include Angular Leafspot, Anthracnose Fruit Rot, Blossom Blight, Gray Mold, Leaf Spot, Powdery Mildew Fruit, and Powdery Mildew Leaf. The prevalence of these pests and diseases leads to significant losses in the strawberry industry, manifesting as reduced yields, diminished quality, and lower income for farmers. Therefore, timely and accurate detection of these threats during the growth phase of strawberries is crucial to minimizing losses and enhancing economic returns for producers.
In recent years, pest and disease detection methods can be mainly categorized into traditional image recognition and machine learning methods and deep learning-based detection methods.
Recent advancements in pest and disease detection methodologies can be broadly classified into traditional image recognition techniques and those based on machine learning and deep learning frameworks. Traditional machine learning approaches have facilitated the automated identification of crop pests and diseases by extracting features such as texture [3], color [4], and shape [5] from images, subsequently constructing classification models based on these features. While these methods have proven operationally efficient, they often struggle to adequately capture the spatial intricacies of images, leading to a reliance on features that may overlook pixel-level information. This limitation results in detection outcomes that are sensitive to local variations and less robust, rendering them less effective in the complex real-world agricultural environment [6].
In contrast, the rapid evolution of deep learning technologies has introduced a new paradigm in image recognition, characterized by swift recognition speeds and high accuracy [7]. Deep learning methodologies are capable of learning advanced semantic feature representations from images, which exhibit greater resilience to local changes, making them more suitable for practical applications in the automatic detection of crop leaf pests and diseases.
Target detection is an important branch of computer vision, which is mainly used to identify and analyze targets in images, and is widely used in the fields of crop pest detection and yield estimation. It is mainly divided into two-stage target detection and single-stage target detection. Among these, single-stage detection algorithms can successfully output the boundaries of the detection classification and prediction boxes through simple, one-time network processing, so this class of detection algorithms has good detection speed, is suitable for mobile use, and at the same time retains enough structural space for the addition of algorithmic modules to realize the various needs of detection applications. Single-stage target detection algorithms are represented by the YOLO algorithm.
Deep learning-based pest and disease recognition methods not only facilitate the rapid identification of pest and disease categories but also enable precise localization of disease spots and pests within images, thereby advancing the field of smart agriculture. The algorithms employed for deep learning pest and disease detection primarily revolve around single-stage models, such as those in the You Only Look Once (YOLO) [8] algorithm family, and two-stage models, such as those based on RCNNs [9].
Several studies have demonstrated the efficacy of deep learning in pest and disease detection. For instance, Chodey et al. [10] developed a field pest detection model utilizing ResNet-50, achieving an average accuracy of 89.54%. Gehlot et al. [11] employed the model “EffiNet-TS” for plant disease detection, with an accuracy of 99%. Zhang et al. [12] introduced a multi-feature fusion fast regional convolutional neural network model that effectively addressed soybean leaf disease detection in complex environments. Hu et al. [13] proposed an enhanced deep convolutional neural network (DCNN) method for detecting tea leaf diseases, showcasing the superior accuracy and generalization capabilities of deep learning techniques compared with traditional machine learning methods, such as back propagation (BP) neural networks and K-nearest-neighbor (KNN) algorithms. Jiang et al. [14] introduced LC3Net for detecting tea blight, achieving an accuracy of 92.29%. Zhao et al. [15] improved the Alex-Net model by creating a new SE_AlexNet_MiniConv (SAMC) model, which achieved an accuracy of 96.92% in classifying healthy invisible seeds and defective invisible seeds. Zhao et al. [16] introduced a new multi-scale feature fusion method into a region-based fast convolutional neural network (Faster-RCNN) model for the natural environment to detect seven strawberry diseases in natural environments with an average mean accuracy value of 92.18%. Liu et al. [17] used the improved YOLOv3 model to detect tomato leaf blight in four environments with a maximum detection accuracy of 92.53%. Xue et al. [18] improved the YOLOv5 model for the detection of tea diseases in natural environments, which demonstrated the great potential of the YOLO model in plant disease detection applications. Li et al. [19] improved YOLOv8, and the improved model was applied to maize leaf disease detection with an accuracy of 91.40%, while the model size was only 11.20 MB, which indicates that the YOLO series of models can take into account both accuracy and real-time performance when applied to plant disease detection.
Despite the progress made in agricultural pest and disease detection methodologies, challenges remain, particularly in complex field environments. Issues such as distinguishing between similar pests and diseases, the similarity between actual backgrounds and detection targets, and the difficulty in detecting small targets persist. Additionally, there is a pressing need to enhance real-time processing and computational efficiency to meet the demands of practical agricultural production.
The YOLO model exemplifies single-stage target detection algorithms, with YOLOv10 [20], introduced in May 2024 as an enhancement of YOLOv8 [21], being noted for its high detection accuracy and rapid inference capabilities. Strawberry pest and disease images captured in natural environments often present complex backgrounds, numerous pest and disease species, and subtle differences, which can lead to misdetection and omissions. To address these challenges and improve the recognition accuracy of strawberry pests and diseases, this paper proposes the YOLO10SC algorithm, an enhancement of YOLOv10, which serves as the foundational model for this research study.
This study introduces several innovative components: (1) To tackle the issue of complex backgrounds and high similarity between disease targets and their surroundings, the convolutional block attention module (CBAM) is integrated. This module enhances the network’s representation capabilities by emphasizing critical features while suppressing irrelevant ones. By applying both channel and spatial attention mechanisms, the CBAM enables the network to focus on essential disease information, thereby improving feature representation and reducing misdetection rates.
(2) To address the challenge of subtle inter-class variations in strawberry diseases, we propose the SCConv module with dual reconstruction units. Traditional convolutions apply uniform weights across all channels and use fixed sliding windows, which often introduce interference from redundant features and fail to adapt to diverse lesion morphologies. In contrast, SCConv dynamically decouples spatial–channel dependencies through the SRU and the CRU, adaptively suppressing irrelevant backgrounds while amplifying discriminative patterns—such as distinguishing the sunken margins of Anthracnose from the fuzzy edges of Gray Mold under field occlusion. Integrated into the C2f_SCConv structure, this mechanism achieves essential improvements in fine-grained classification while preserving computational efficiency.
(3) Finally, we introduce DySample, an ultra-lightweight and effective dynamic upsampler that enhances feature boundary smoothness and detail preservation for strawberry disease detection. Unlike the conventional static nearest-neighbor interpolation in the original YOLOv10, which mechanically duplicates pixels without semantic adaptation, our method dynamically adjusts receptive fields through contextual feature integration, effectively reducing edge artifacts while maintaining computational efficiency suitable for agricultural edge devices.

2. Proposed Method

In this paper, the following three improvements were made to the YOLOv10-n algorithm, and the overall strawberry pest detection network structure is shown in Figure 1 with the following measures.

2.1. Introduction of the CBAM Attention Mechanism

In target detection, the YOLOv10-n network faces challenges from high similarity between targets like strawberry leaves and fruits and non-targets like weeds and branches, which leads to inadequate capture of small target features in the implicit layers of the backbone network. To address this issue, we integrate the CBAM into the backbone network [22]. As a lightweight module with low complexity that relies on pooling and feature fusion instead of extensive convolution operations, the CBAM adjusts weight parameters based on the relevance of target information through its channel attention mechanism and spatial attention mechanism—this enhances significant feature information while disregarding extraneous data and ultimately improves the model’s performance markedly. This lightweight attention module comprises two fundamental components: the channel attention mechanism and the spatial attention mechanism.
The introduction of the channel attention mechanism facilitates the efficient detection of contour features associated with the target, thereby enriching the information available for target detection. This mechanism enables the network to prioritize critical feature channels pertinent to specific tasks, ultimately enhancing both the performance and efficiency of the network. The structure of the channel attention module is shown in Figure 2a. The mathematical representation of the computation for the channel attention mechanism is expressed as follows:
M C ( F ) = σ ( M L P ( A v g P o o l ( F ) ) + M L P ( M a x P o o l ( F ) ) ) = σ ( W 1 ( W 0 ( F a v g c ) ) + W 1 ( W 0 ( F max c ) ) )
where
  • M C ( F ) —channel attention weights;
  • σ —activation function sigmoid;
  • F a v g c —the feature mapping in space after tie pooling;
  • F max c —the feature mapping in space after maximum pooling;
  • W 0 —the weight matrix of the 1st fully connected layer;
  • W 1 —the weight matrix of the 2nd fully connected layer.
Figure 2. Structure of the CBAM attention mechanism. (a) Structure of the CA attention mechanism. (b) Structure of the SA attention mechanism. (c) Integration of the CA attention mechanism and the SA attention mechanism.
Electronics 14 03768 g002
The spatial attention mechanism operates by compressing the channel dimension and performing mean and maximum pooling along this axis. By integrating the spatial attention module, the model can effectively localize the detection target, thereby enhancing the detection rate. The structure of the spatial attention module is shown in Figure 2b. The mathematical representation of the spatial attention mechanism is articulated as follows:
M s ( F ) = σ ( f 7 × 7 ( [ A v g P o o l ( F ) ; M a x P o o l ( F ) ] ) ) = σ ( f 7 × 7 ( [ F a v g S ; F max S ] ) )
where
  • M s ( F ) —spatial attention weights;
  • σ —activation function sigmoid;
  • f 7 × 7 —convolutional operational filters of size;
  • F a v g S —the feature mapping after tie pooling on the channel;
  • F max S —the feature mapping after maximum pooling on the channel.
As shown in Figure 2c, the execution of the CBAM involves first applying the channel attention module to the input feature map on an element-wise basis, followed by the application of the spatial attention mechanism. The final attention-enhanced feature is then utilized as input for subsequent layers of the network, effectively reducing noise and irrelevant information while preserving essential data. The computational relationship is expressed as follows:
F 0 = F 1 × M C F × M S F
where
  • F 1 —input feature map;
  • F 0 —the final feature map obtained after CBAM processing.
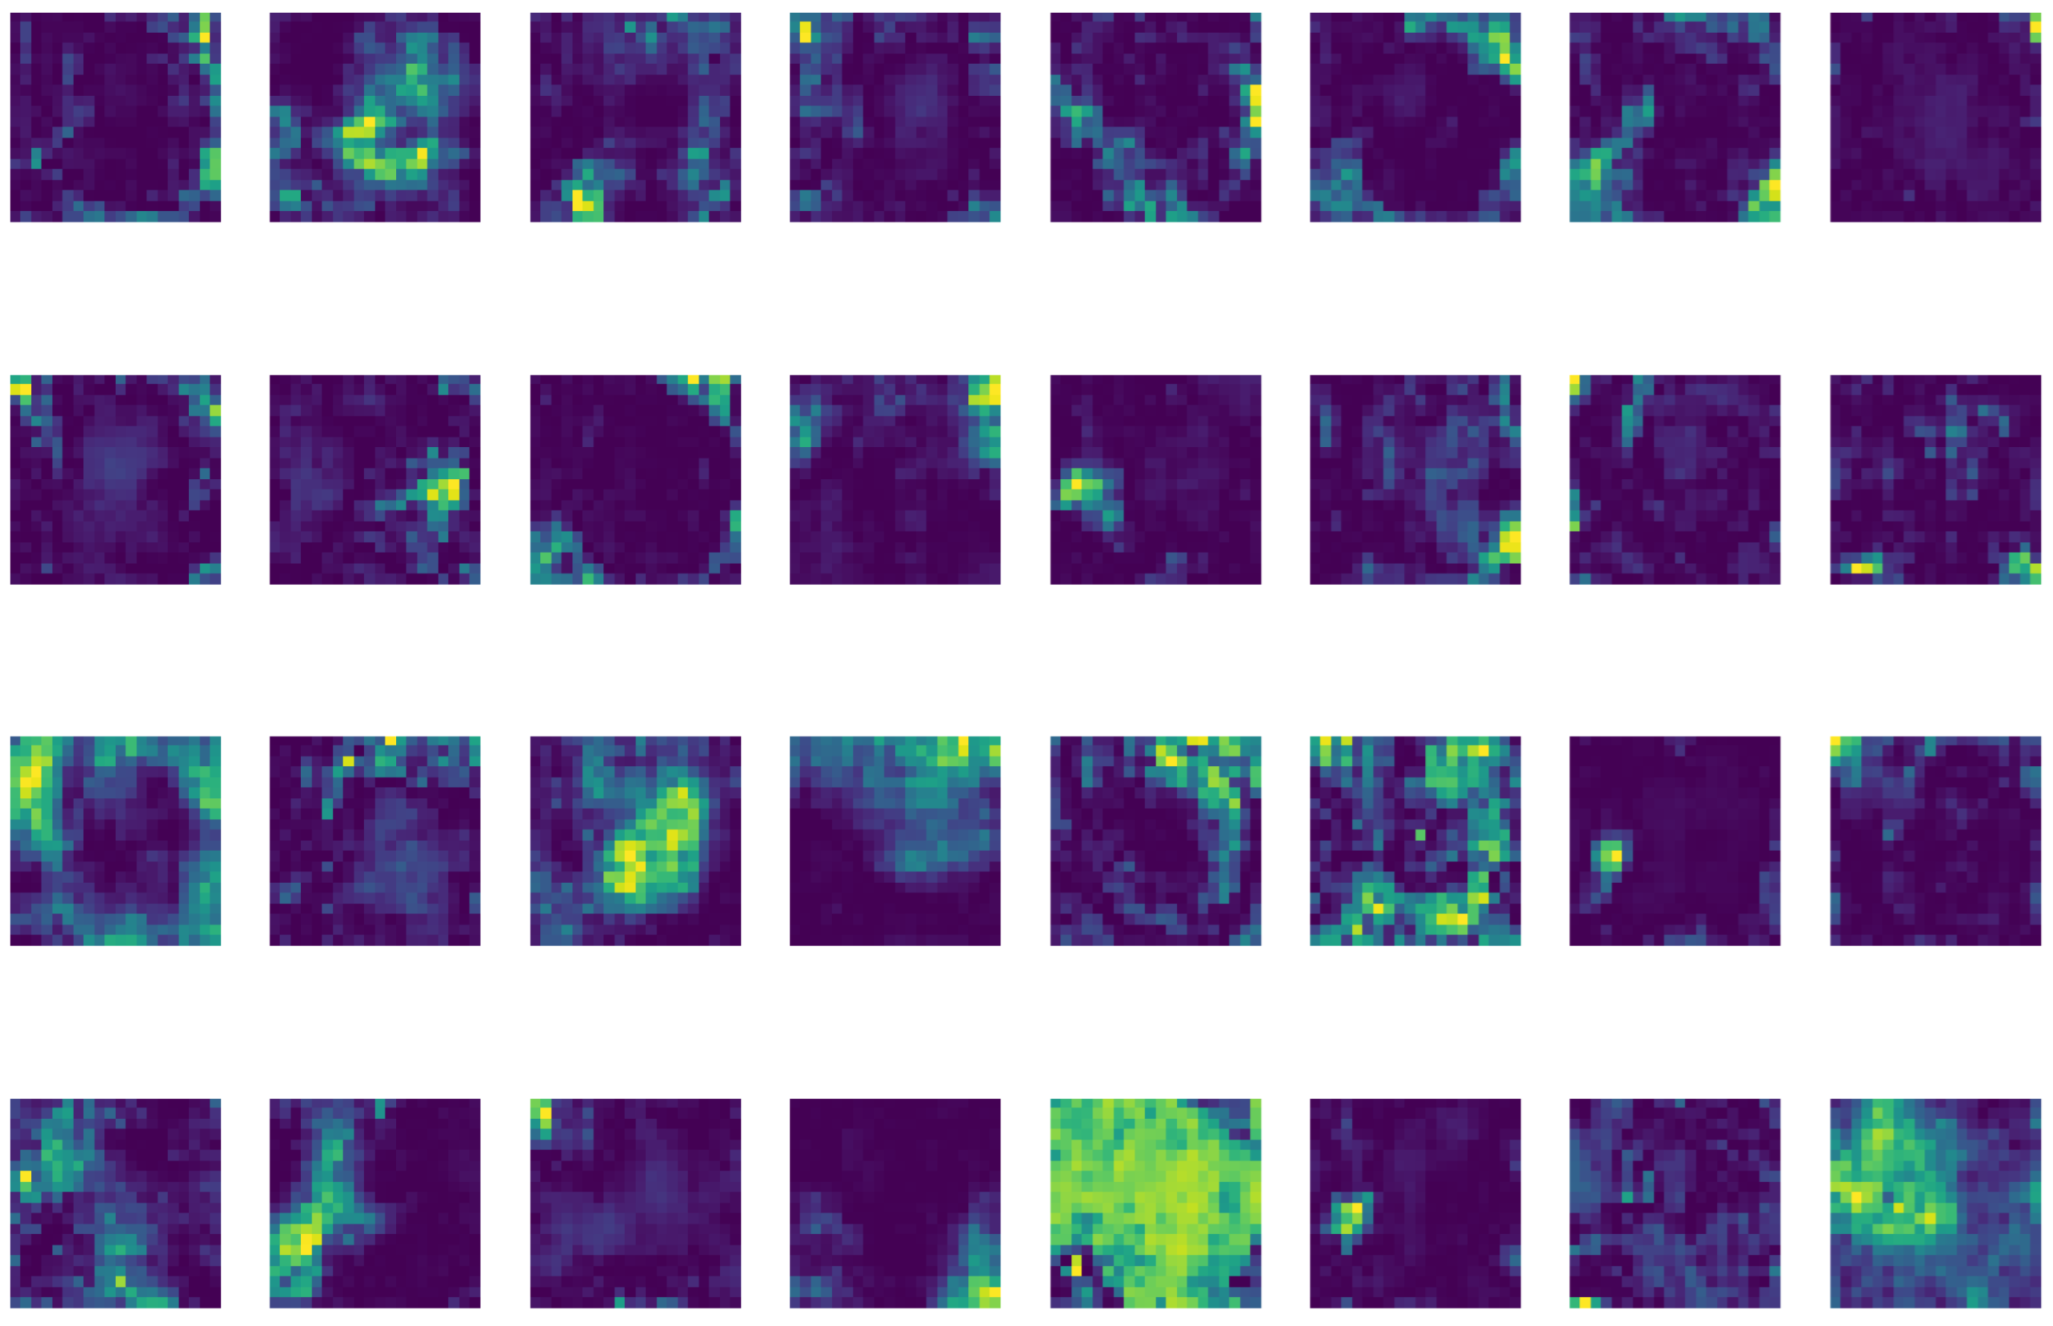
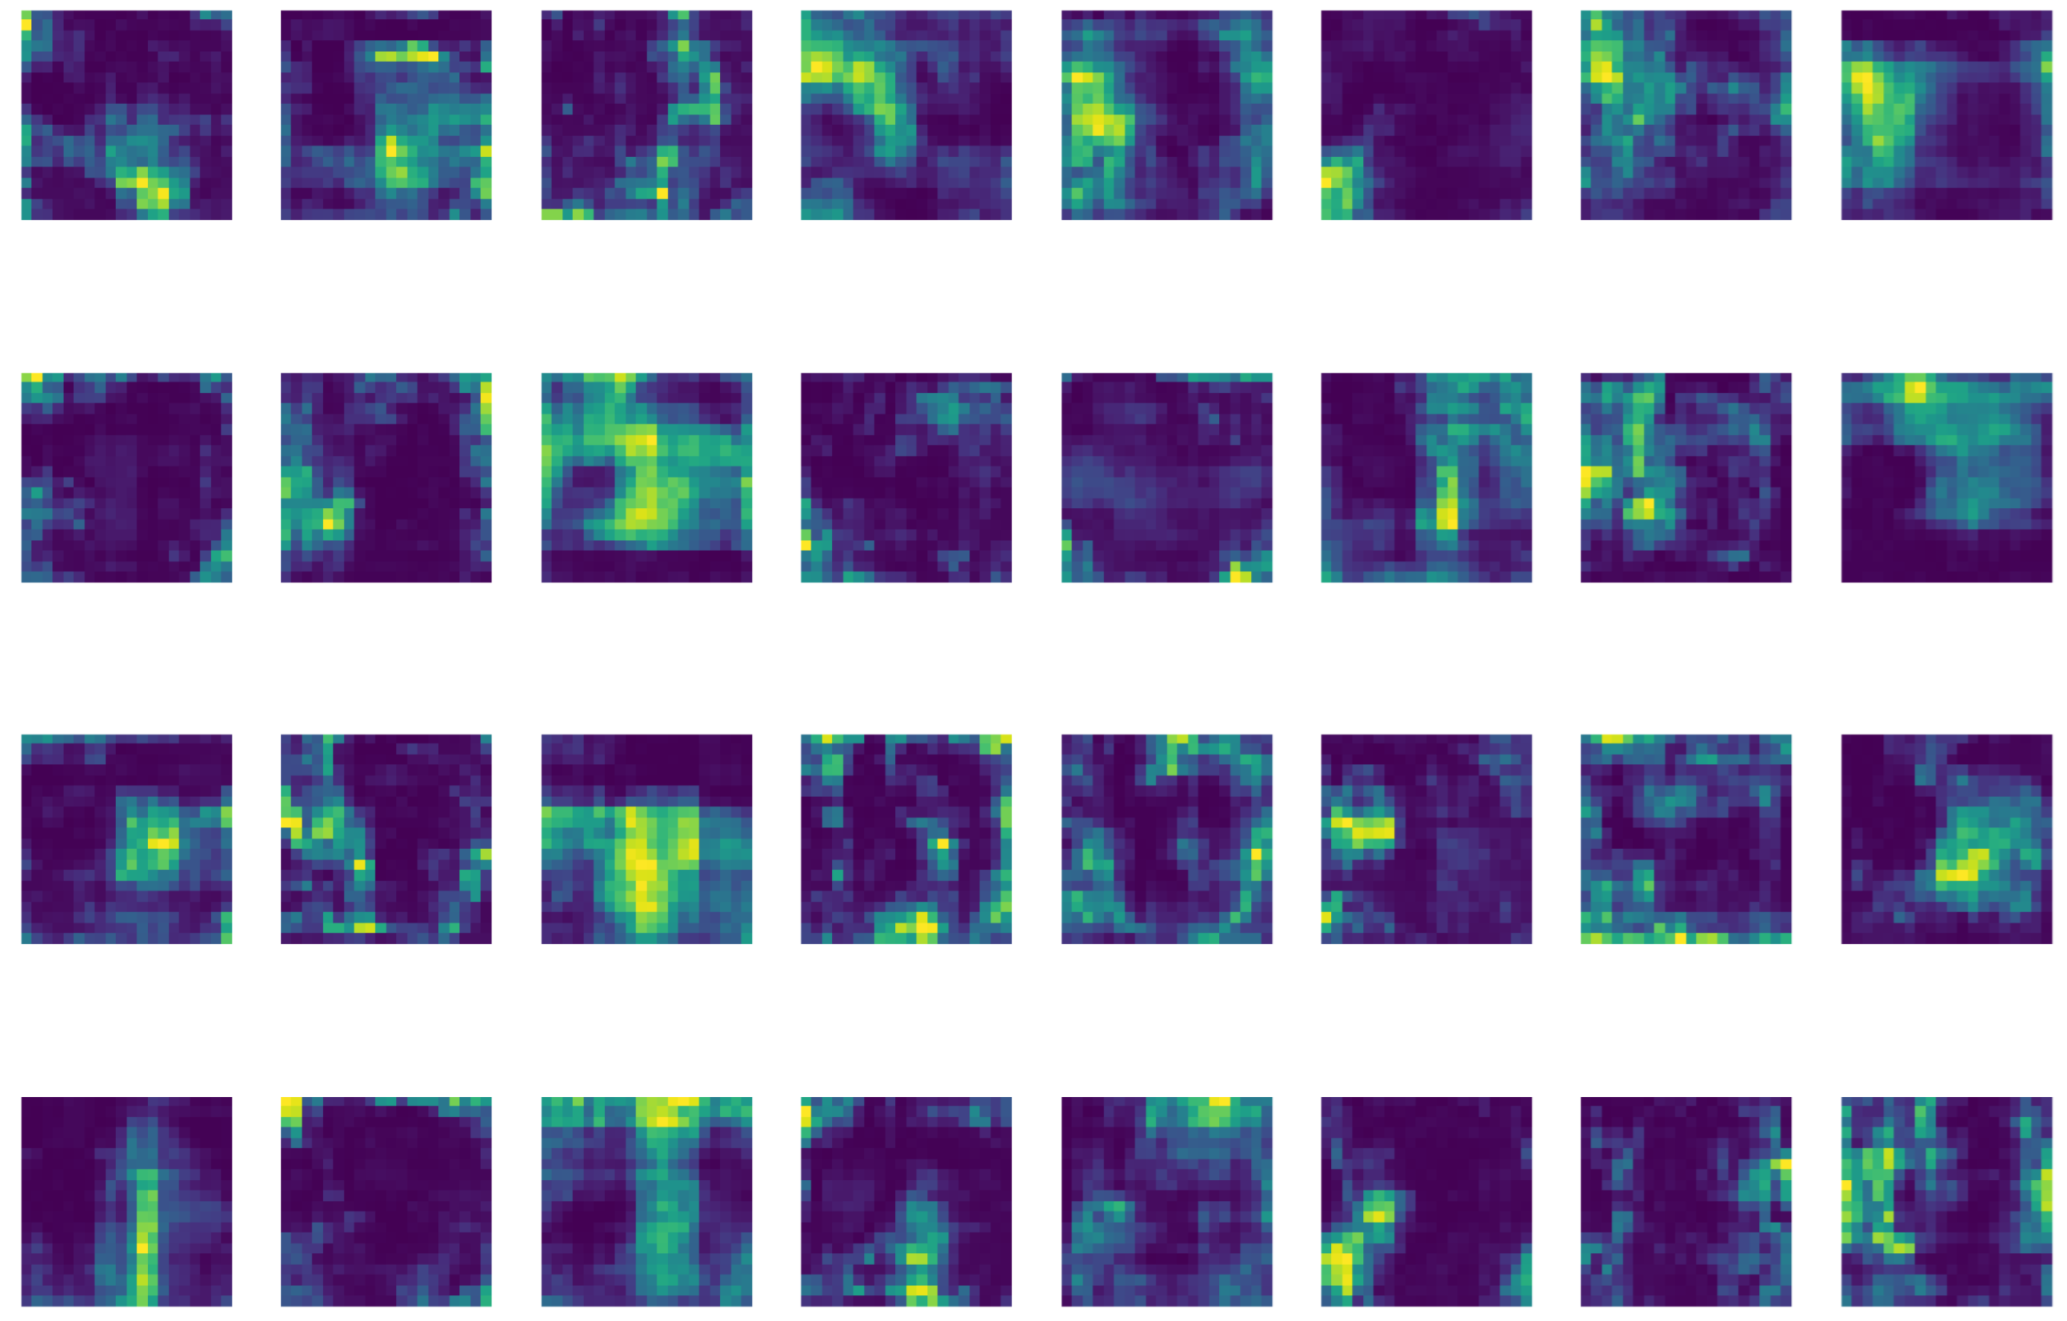
To visually demonstrate the optimizing effect of the CBAM attention mechanism on feature representation, Figure 3 and Figure 4 compare feature map visualization before and after incorporating the CBAM. The visualization reveals that without the CBAM, highly activated regions appear relatively dispersed, demonstrating insufficient focus on critical semantic information. Conversely, with the CBAM applied, high-response areas in the feature maps concentrate more precisely on regions containing significant objects or structures, markedly enhancing the specificity and discriminative power of activation distribution. This comparison validates the CBAM’s ability to effectively guide the network towards more representative features, thereby improving the efficacy of feature representation.
By integrating the CBAM attention mechanism into the YOLOv10-n network, the model is better equipped to focus on critical disease-related information within the images. This enhancement improves the representation strength of the features, facilitates the differentiation of disease characteristics from background elements, and ultimately reduces both misdetection and leakage rates, thereby aligning more effectively with the requirements for strawberry pest and disease detection.

2.2. Integration of the SCConv Module with the C2f Module to Establish the C2f_SCConv Module

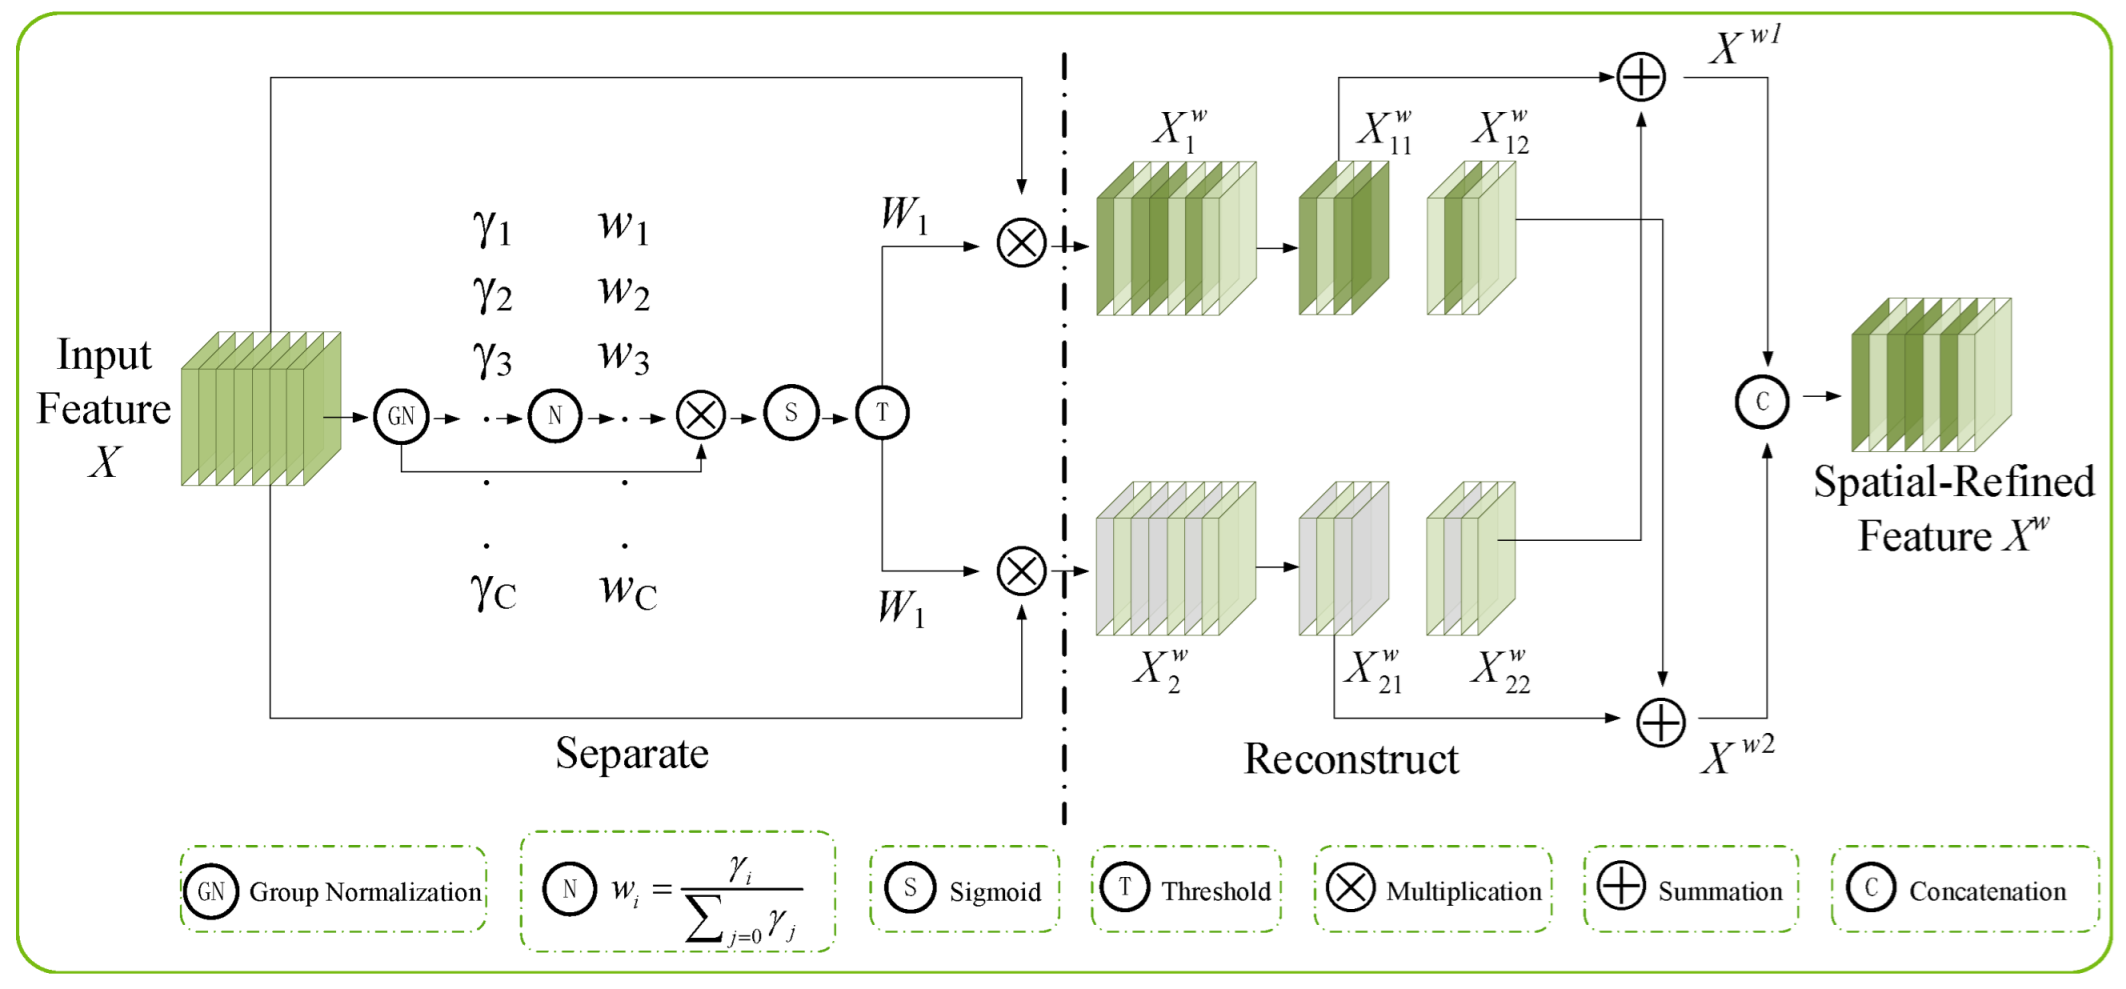
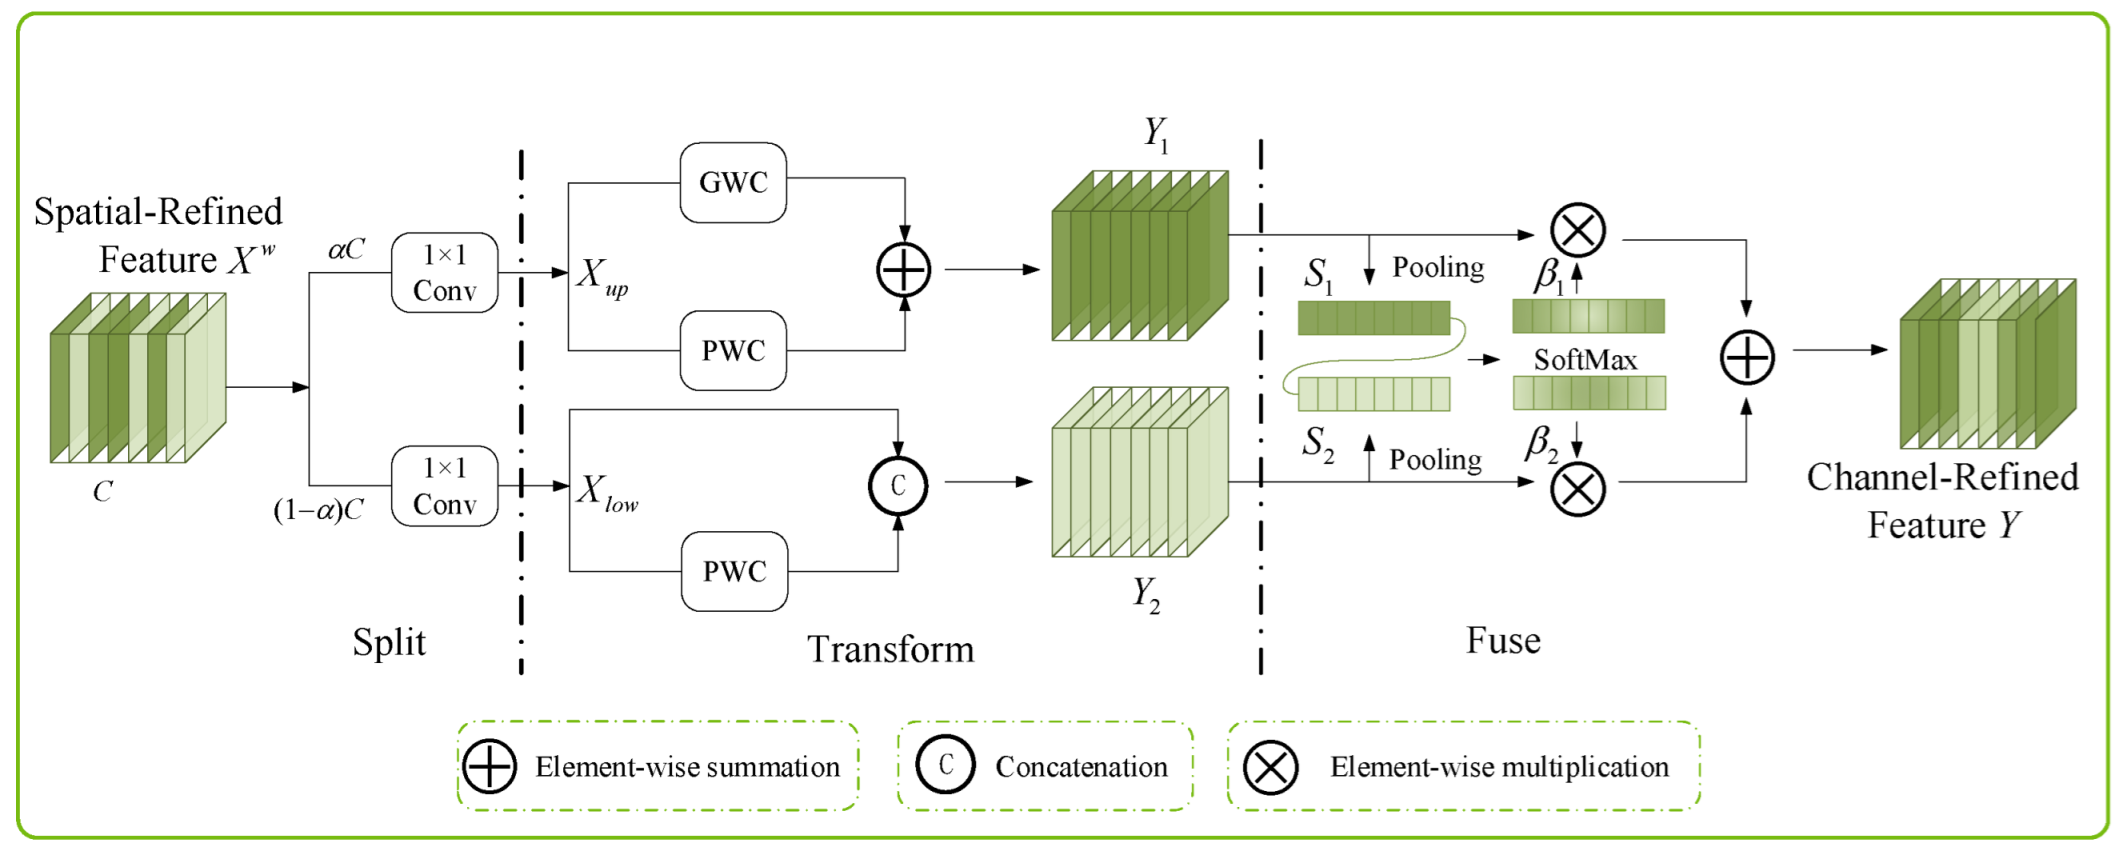
As shown in Figure 5, the SCConv [23] module comprises two fundamental components: the spatial reconstruction unit (SRU) and the channel reconstruction unit (CRU). The SRU employs a separation–reconstruction methodology aimed at reducing spatial redundancy, while the CRU utilizes a separation–transformation–fusion strategy to mitigate channel redundancy. Empirical evidence indicates that the incorporation of the SCConv module into the model significantly facilitates the learning process, enabling the differentiation of critical features across various targets. This capability is particularly advantageous in addressing the challenges posed by strawberry pests and diseases, which often encompass numerous species with minimal distinguishing characteristics. Consequently, the integration of the SCConv module substantially diminishes both complexity and computational costs.
The SRU uses a separation–reconstruction approach: separation distinguishes high- and low-information feature maps via Group Normalization-derived scaling factors to address spatial content, while reconstruction merges these features for more informative outputs and optimized spatial utilization, with its structure being shown in Figure 6.
The CRU is a channel reconstruction unit that utilizes a segmentation–transformation–fusion strategy to reduce the redundancy of channel dimensions, as well as computational cost and storage. The structure of the CRU is shown in Figure 7.
In image feature extraction, traditional convolution relies on fixed sliding windows and equal-weight full-channel connections. In strawberry pest and disease detection against complex backgrounds, this approach has obvious defects: on one hand, equal-weight computation of redundant channels introduces interference from irrelevant features, drowning subtle differences of similar diseases like Anthracnose Fruit Rot and Gray Mold; on the other hand, the fixed-size convolution kernel cannot adaptively adjust its receptive field, failing to focus on tiny spots or complex lesion morphologies.
SCConv breaks through traditional convolution’s bottlenecks via the SRU and the CRU—alle-viating channel redundancy and spatial stiffness while stably capturing distinguishing details of similar pests/diseases in complex field scenes, thus boosting fine-grained classification. In this paper, we insert SCConv into the C2f module to build C2f_SCConv, enabling more efficient image feature learning to address strawberry pests/diseases with many types and tiny inter-class differences. The module structure is shown in Figure 8.
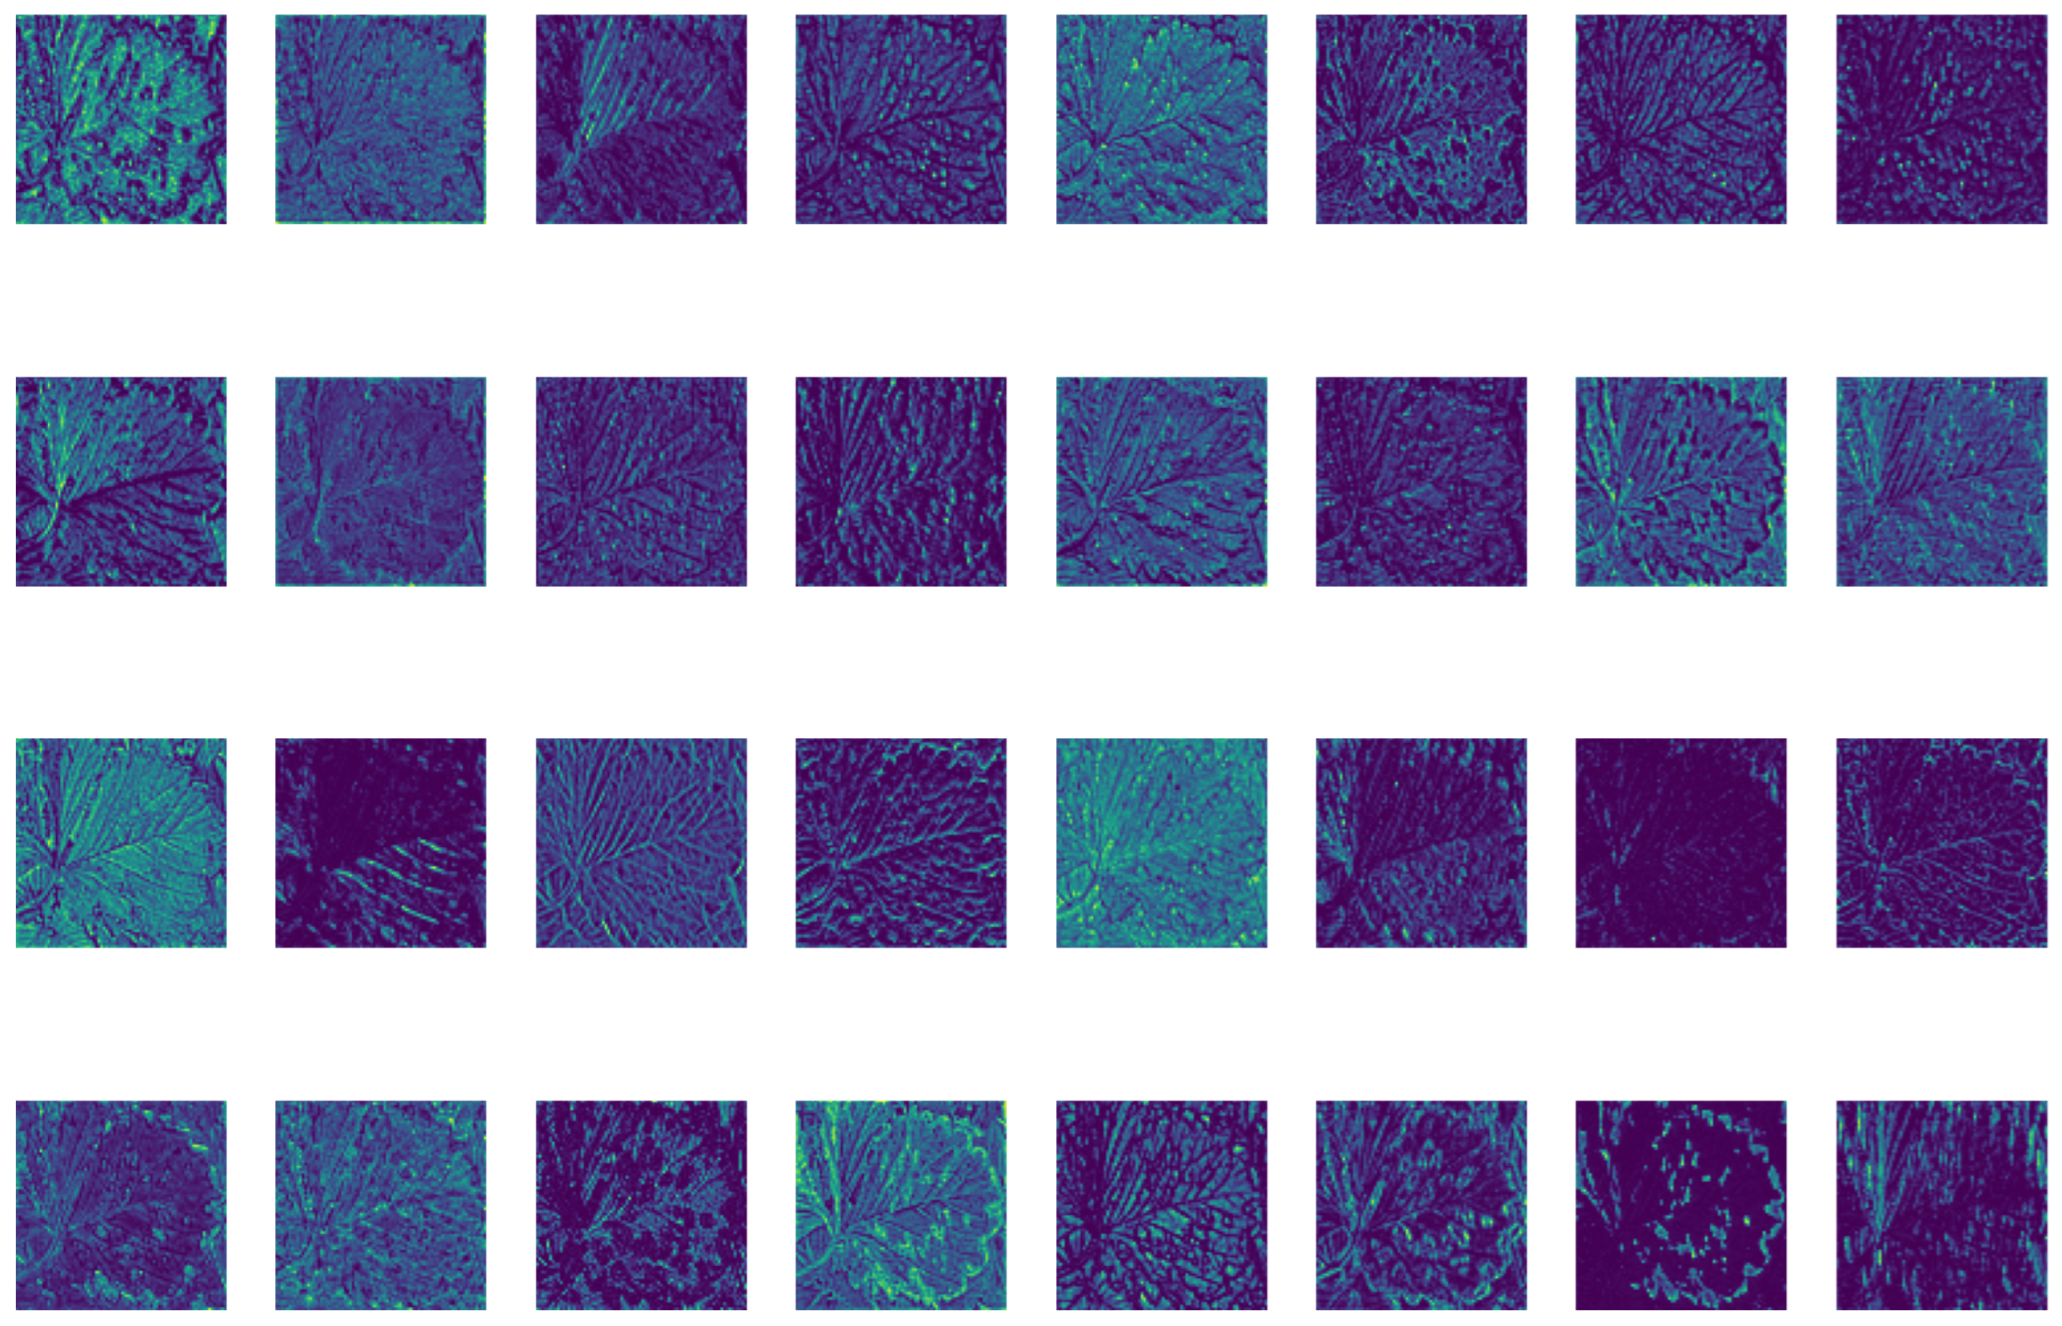
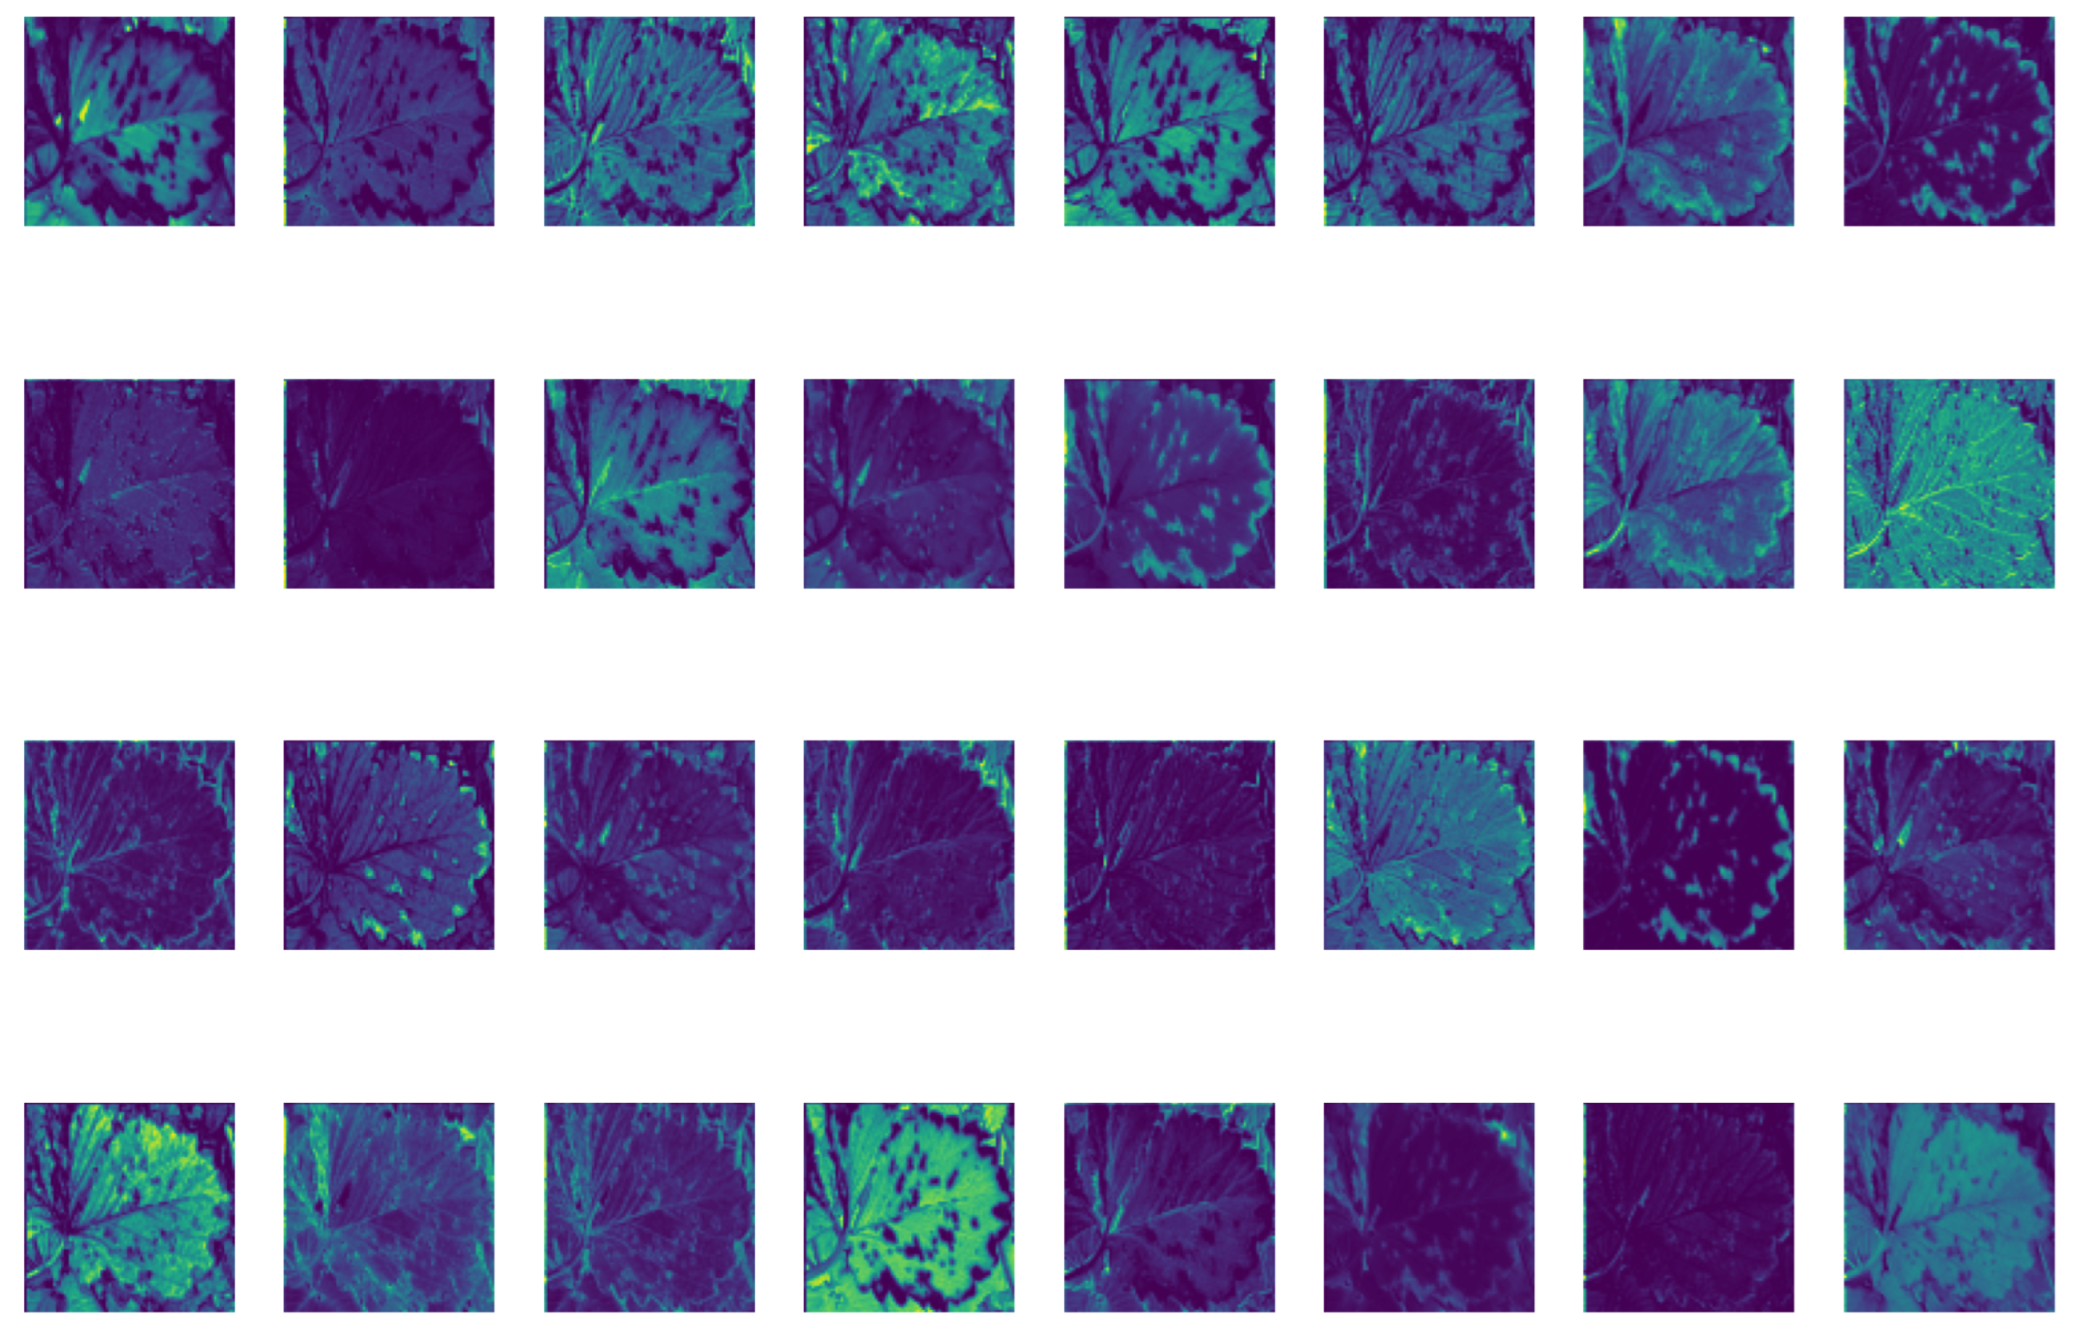
As shown in Figure 9 and Figure 10, the enhanced feature map demonstrates greater focus on the activation of key blade structures, reduced background interference, and clearer depiction of blade texture details. This effectively strengthens the expression of target features, validating the effectiveness of the improvement.

2.3. Introducing DySample, an Ultra-Lightweight and Effective Dynamic Upsampler

Feature upsampling is crucial to target detection, as it restores feature resolution to boost classification and localization accuracy. However, YOLOv10’s original nearest-neighbor interpolation for upsampling only depends on pixel spatial positions (ignoring feature map semantic info and surrounding points, resulting in low-quality outputs). Although dynamic upsamplers like CARAFE [24], FADE [25], and SAPA [26] improve performance via content-aware kernels, they add extra complexity—with FADE and SAPA even requiring high-resolution feature inputs.
DySample [27] is an ultra-lightweight and effective dynamic upsampler. To address the problems of other dynamic upsamplers, DySample bypasses dynamic convolution and formulates its upsampling method from a point sampling perspective, which is more resource-efficient and can be easily implemented using standard built-in functions in PyTorch. Compared with other dynamic upsamplers, DySample does not require high-resolution bootstrap features as inputs or any additional CUDA packages other than PyTorch, and in particular, the inference latency, memory footprint, FLOPs, and the number of parameters are all much lower. Compared with nearest-neighbor interpolation, DySample is smoother in the processing of feature boundaries, which can effectively reduce the boundary blurring phenomenon. At the same time, its dynamic adjustment characteristics can enhance the model’s ability to capture detailed features, which is especially suitable for tasks such as strawberry pest detection that require attention to details. So DySample is chosen as the dynamic upsampler in this paper, and it can be realized without increasing computational resources to increase strawberry pest and disease detection accuracy.
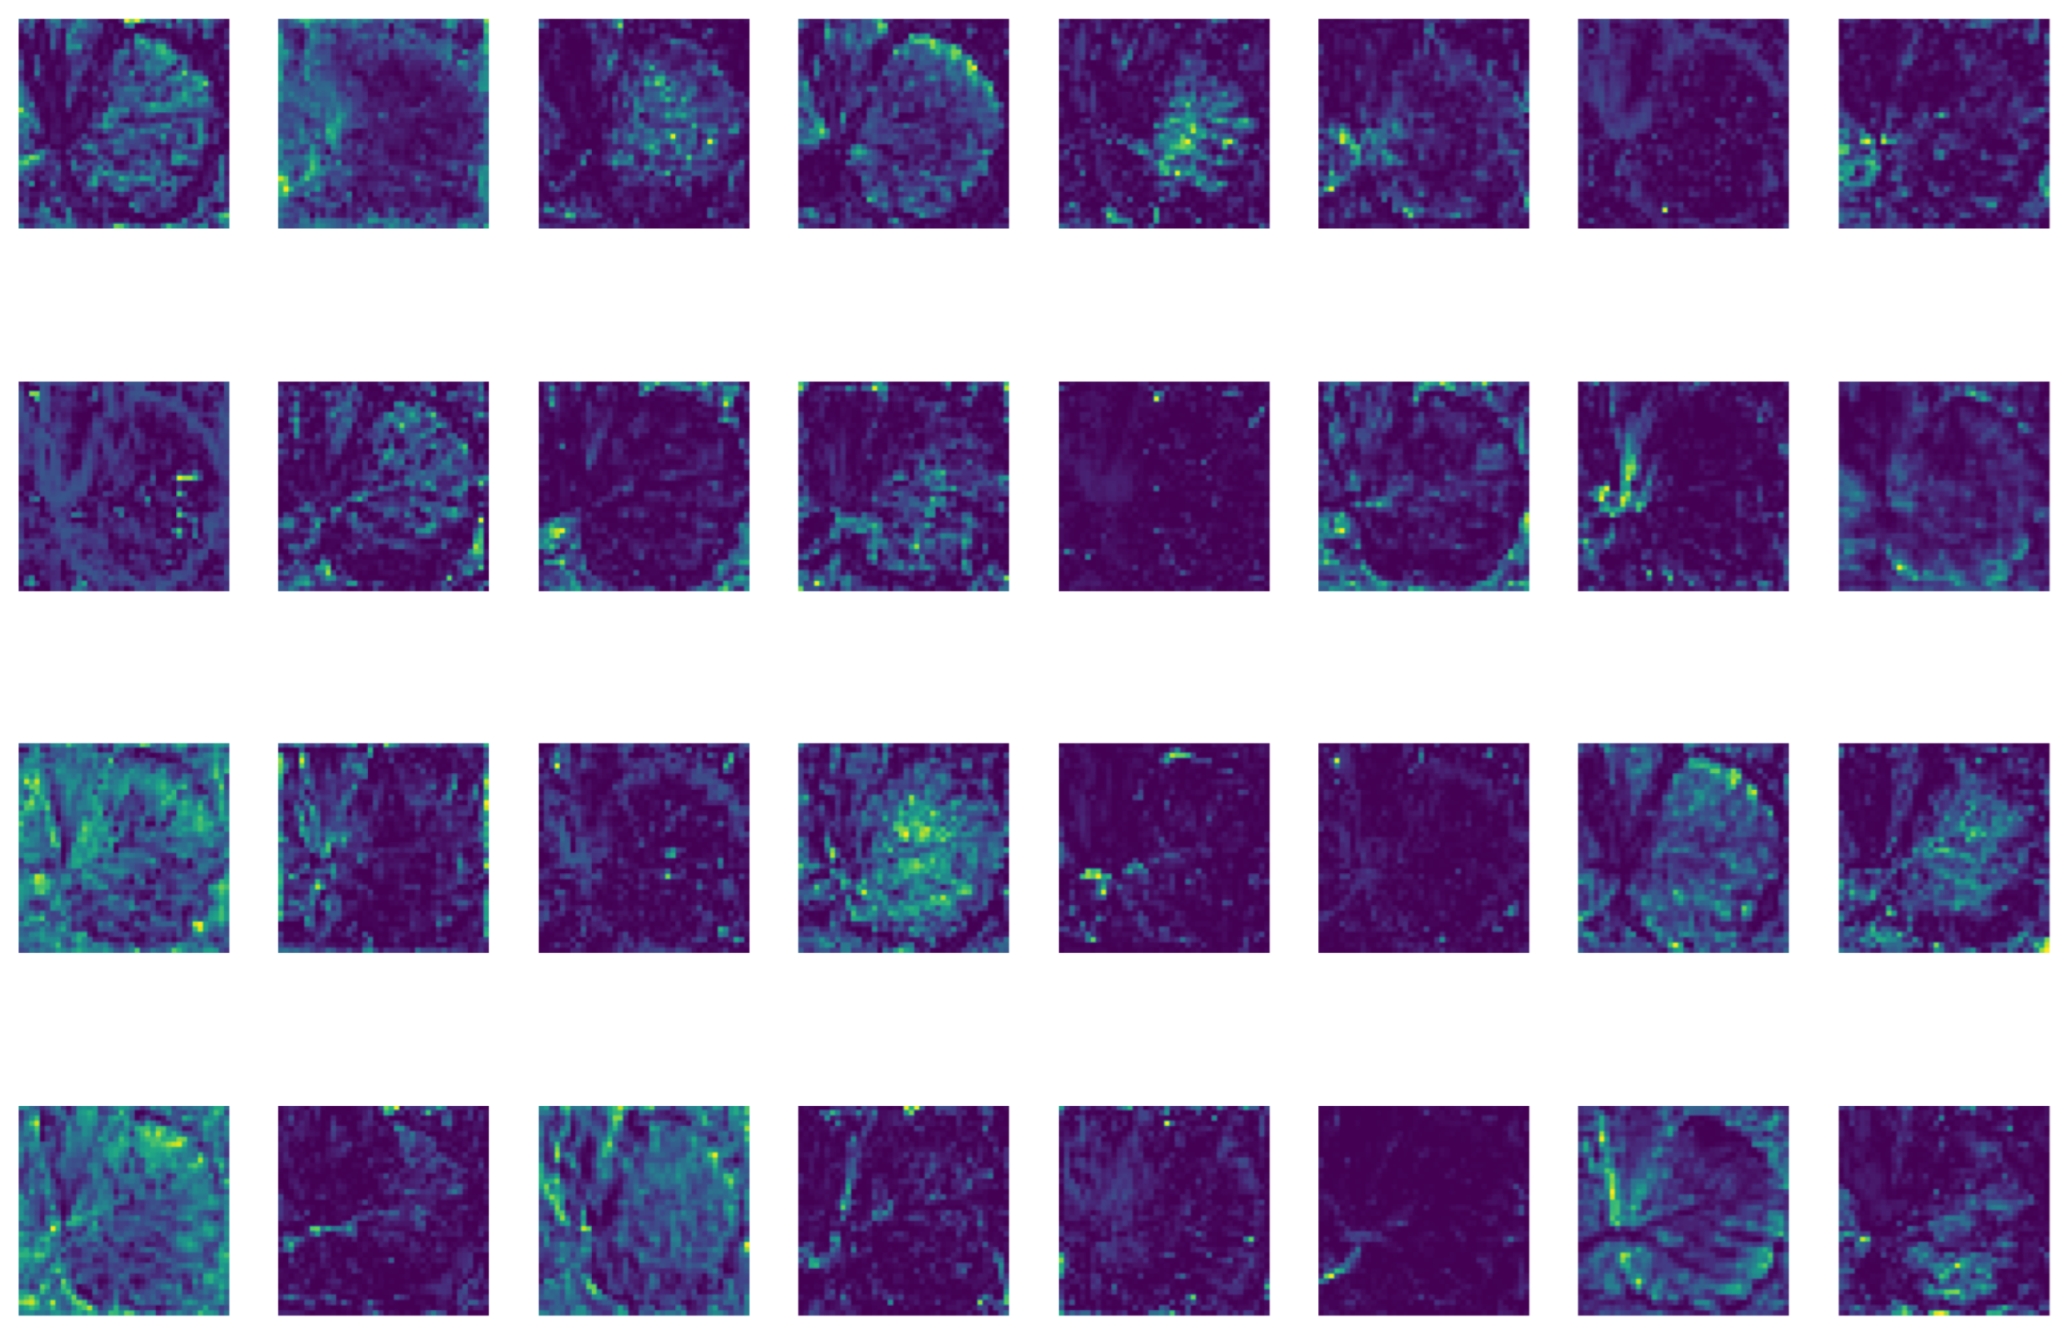
As shown in Figure 11 and Figure 12, after introducing Dysample, the highlighted key regions in the feature maps become more focused and exhibit sharper details. Compared with the original upscaling method, this approach effectively enhances the resolution and specificity of the features.

3. Experiments

3.1. Dataset

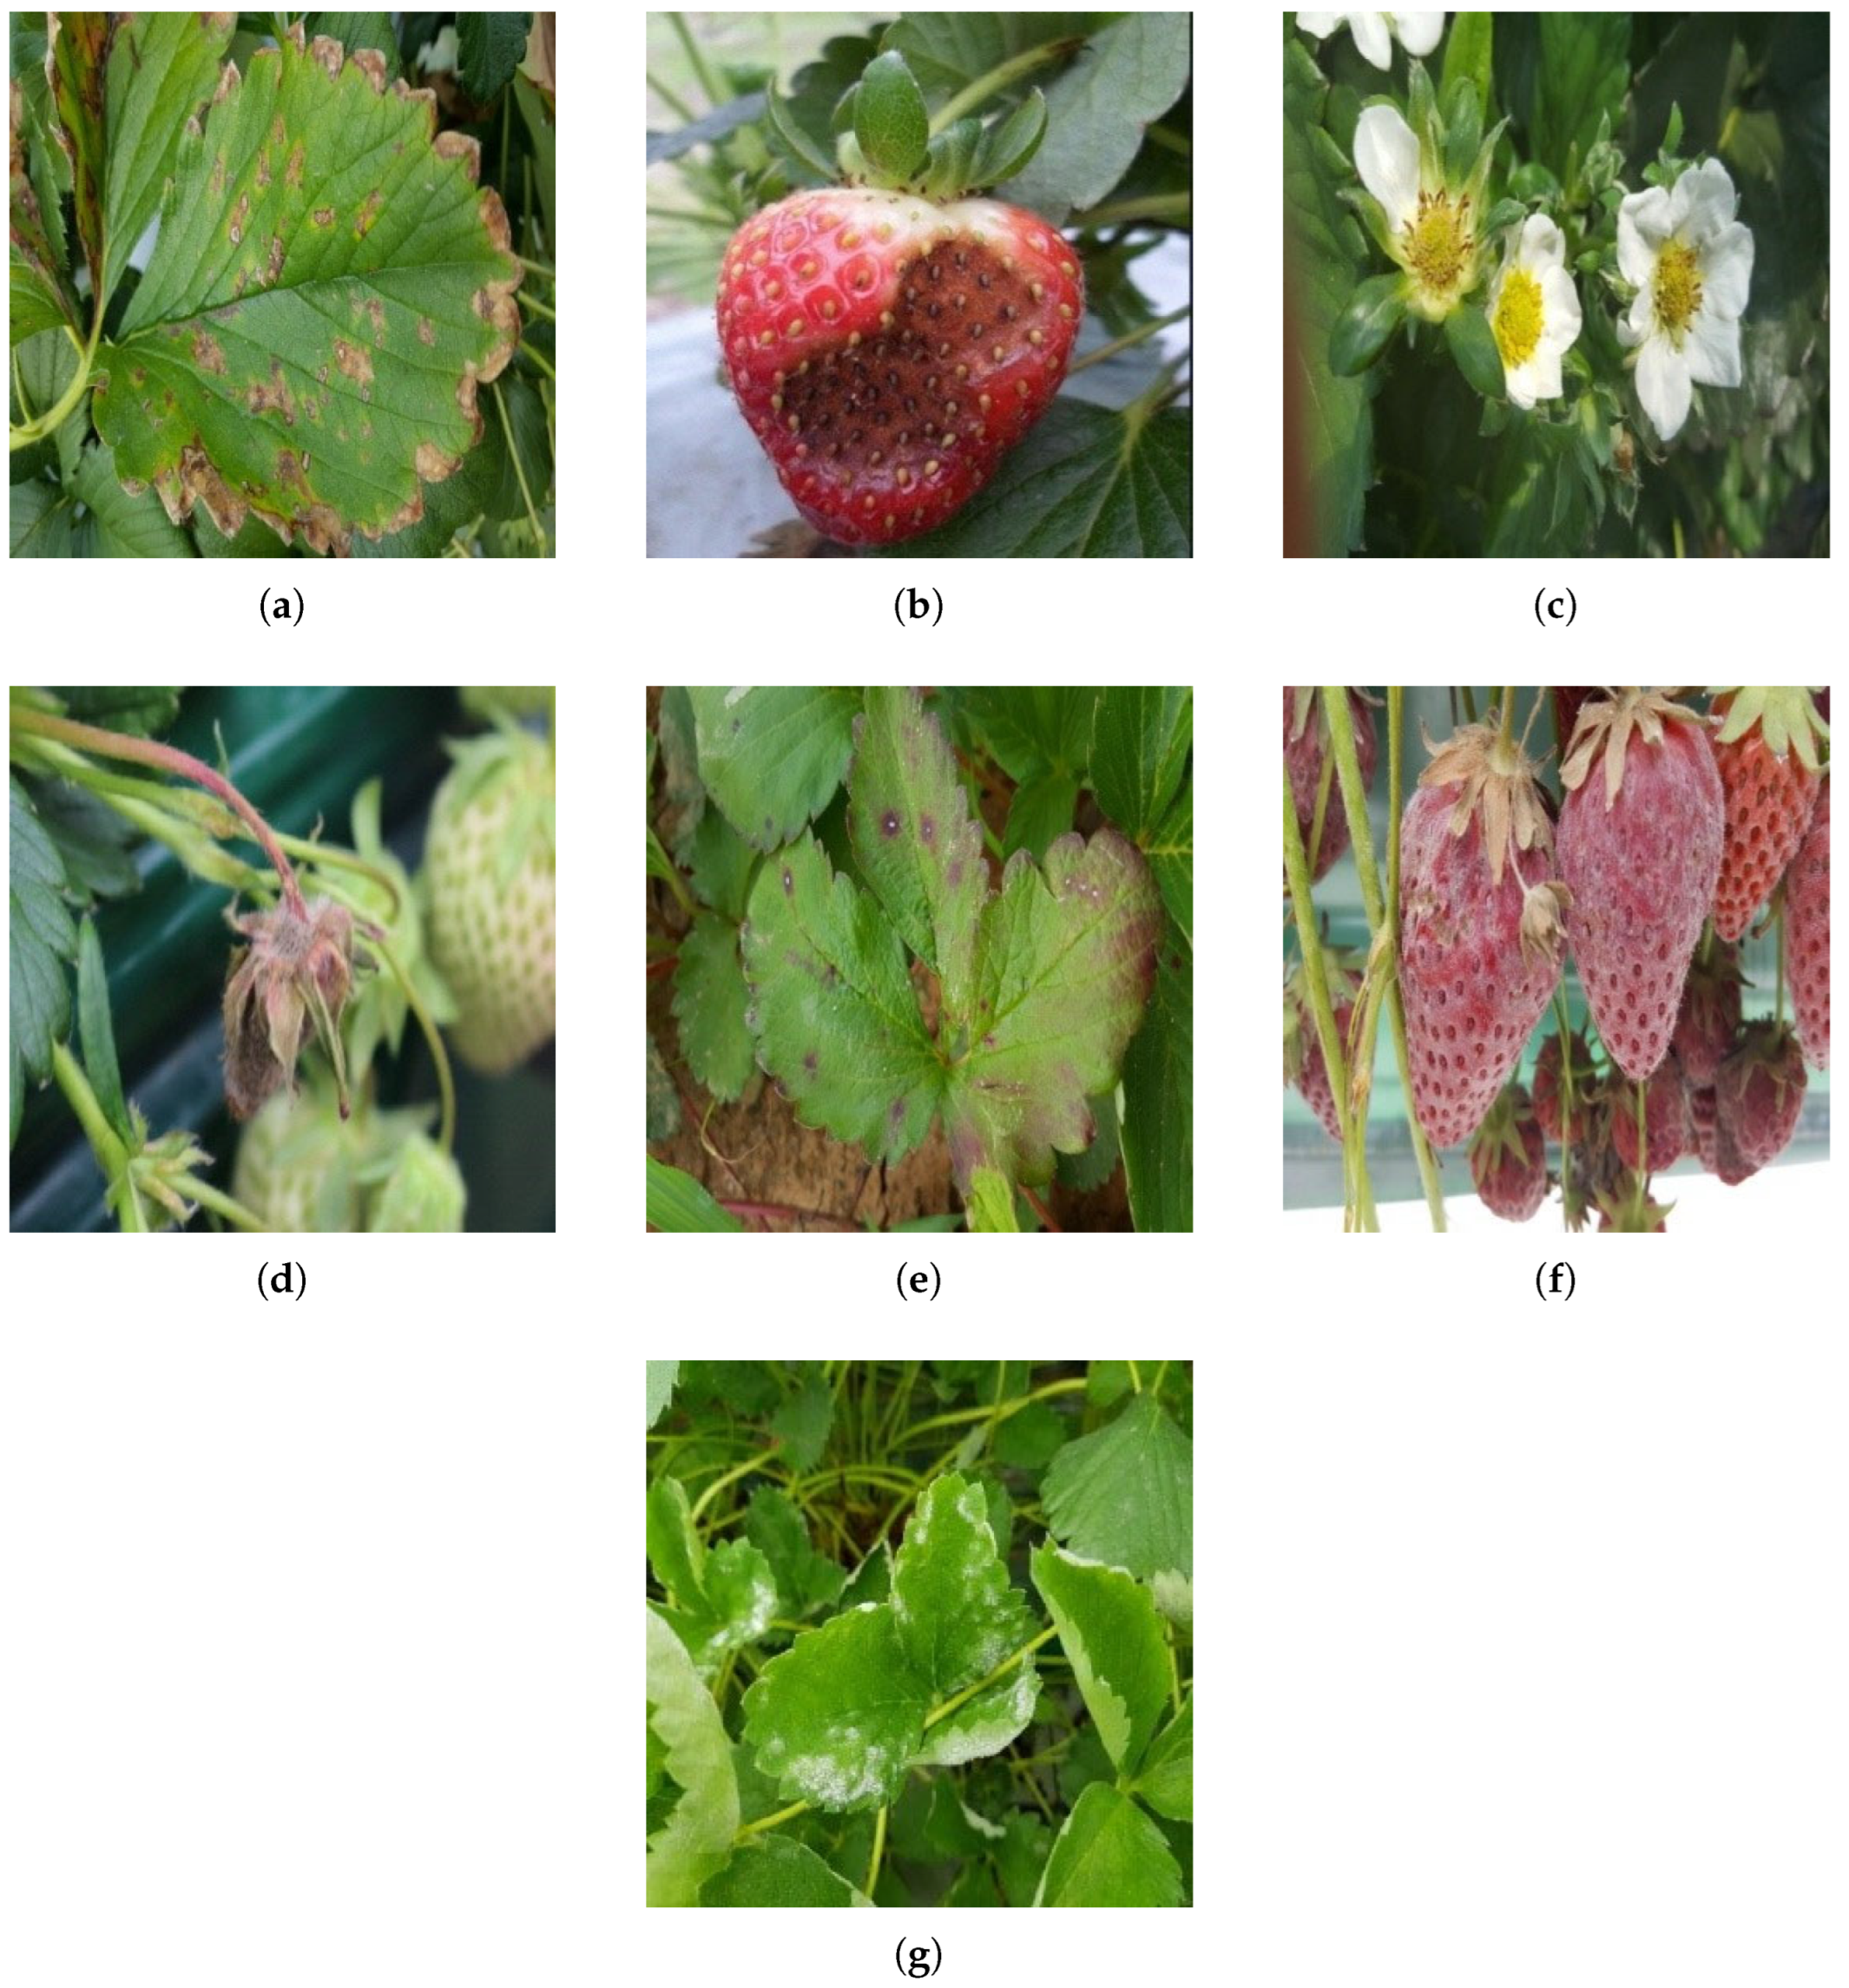
The dataset for strawberry disease and pest detection in this paper was collected in 2021 by members of the AI lab at the Division of Computer Science and Engineering, Jeonbuk National University, South Korea [28]. The dataset contains 2500 images of strawberry diseases, seven different types of pests and diseases. As shown in Figure 13, the disease and pest categories included Angular Leafspot, Anthracnose Fruit Rot, Blossom Blight, Gray Mold, Leaf Spot, Powdery Mildew Fruit, and Powdery Mildew Leaf.
Data were collected from greenhouses under different natural-light conditions to ensure environmental diversity. Since the images of various diseases and pests in the dataset lacked the interference found in real-world environments, such as the target object under real conditions being covered, the light possibly being dim, the presence of random interference, etc., in order to ensure that the various diseases and pests were closer to the conditions in real detection scenarios, we implemented a range of image augmentation techniques. As shown in Figure 14, these techniques encompassed adding noise, adjusting the luminance, randomly overlaying the original image, rotating, panning, and mirroring. One data enhancement method was randomly selected for each image.
The dataset after preprocessing was carried out totaled 5000 sheets, which meets the network training requirements, and the specific classification is shown in Table 1. In order to ensure the independence of the dataset, the dataset was cut into a training set, a validation set, and a test set according to the ratio of 8:1:1; the training set had 4000 sheets, validation set had 500 sheets, and test set had 500 sheets.

3.2. Experimental Platform and Parameters

The experiments were performed with a Windows operating system, based on the GPU, Pytorch, and CUDA frameworks, with parameters specified in Table 2. All algorithms in this paper were trained with identical hyperparameters to ensure fairness.

3.3. Evaluation Indicators

The evaluation metrics used in this paper are precision (P), recall (R), mean average precision (mAP50), F1 score, frames per second (FPS), number of parameters (Params), computation volume (GFLOPs), and model size. Among them, precision and recall are used as the basic metrics, and F1 score and mAP50, calculated based on precision and recall, are used as the final evaluation metrics to measure the accuracy of the model; GFLOPs are used to measure the complexity of the model or algorithm, and Params denotes the size of the model. Typically, the smaller the Params and GFLOPs, the less computational power the model requires, the lower the performance requirements of the hardware, and the easier it is to build the model in low-end devices. FPS is the number of image frames per second that a model can process and is used to evaluate the processing speed of a model on a given hardware.
Precision (P) is the rate of correct predictions among all results predicted for positive samples. The formula is as follows:
P r e c i s i o n = T P T P + F P
Recall (R) is calculated based on the proportion of all targets correctly predicted. The formula for calculation is given below:
R e c a l l = T P T P + F N
where TP denotes the number of correct targets in the detection results, FP denotes the number of incorrect targets in the detection results, and FN denotes the number of missing targets in the correct targets.
The average accuracy of the n categories is calculated as follows:
m A P = 1 n i = 1 n 0 1 P r e c i s i o n ( R e c a l l ) d ( R e c a l l )
The F1 score takes precision and recall into account, which reflects the overall performance of the network in a more comprehensive way. It is calculated by taking the harmonic mean of the two indexes, and the formula is as follows:
F 1 = 2 P r e c i s i o n × R e c a l l P r e c i s i o n + R e c a l l

3.4. Comparison Experiment Before and After Improvement

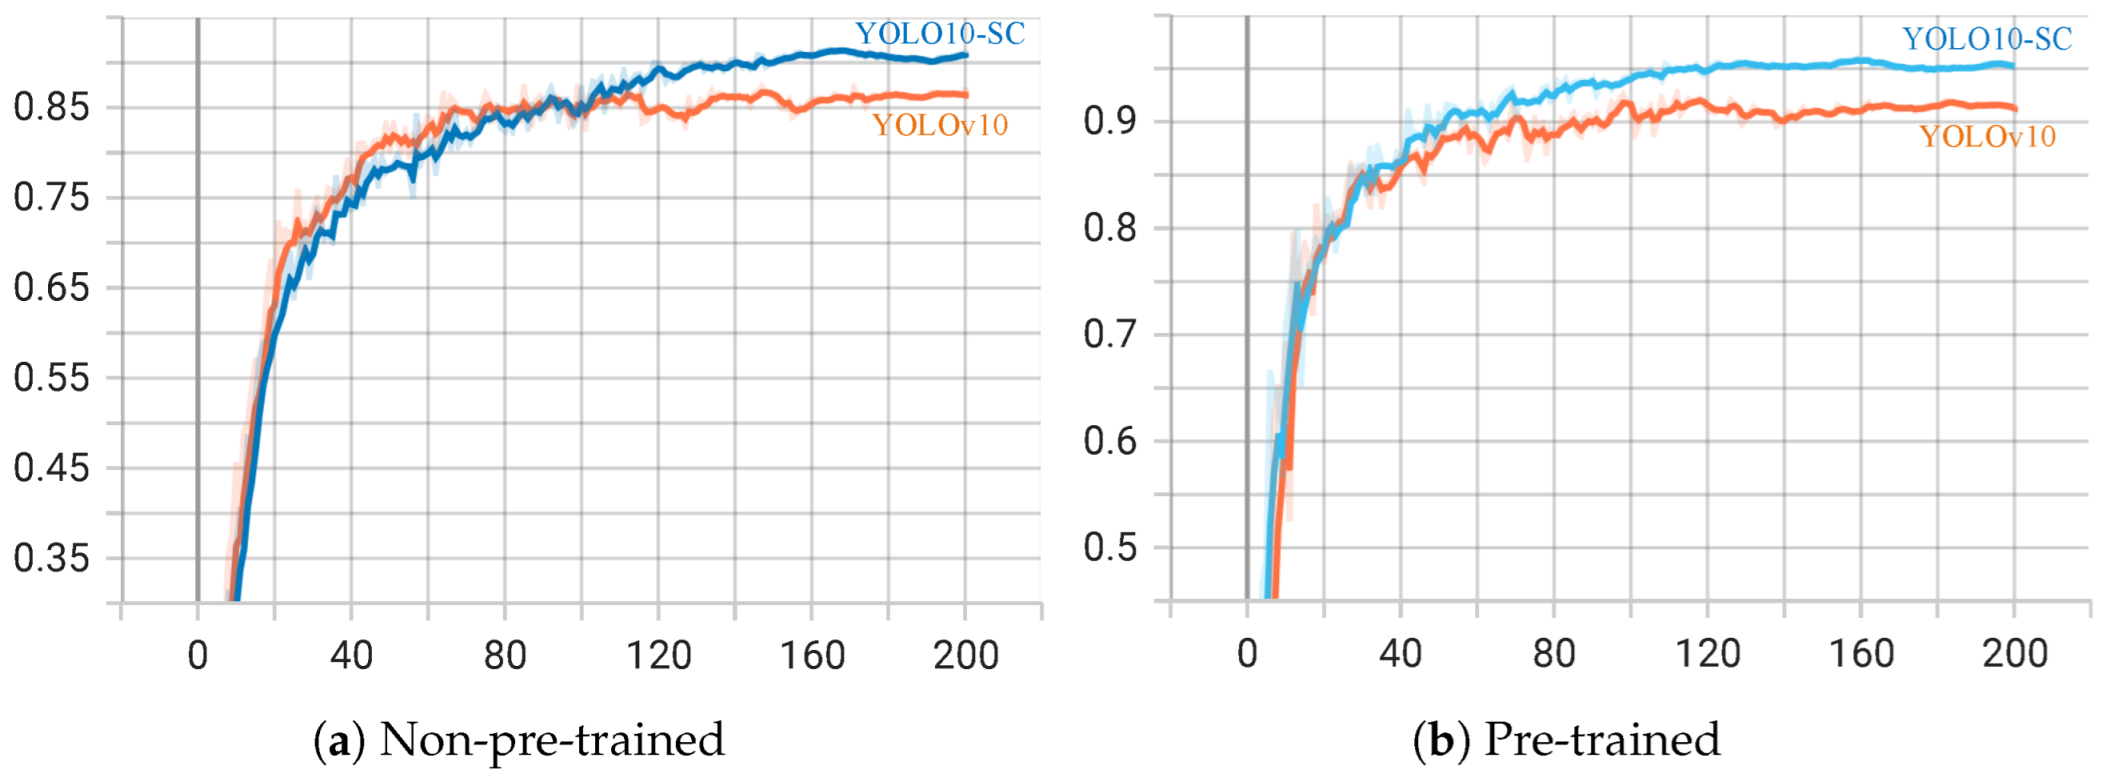
Without and with pre-training, the improved algorithm is compared with the original YOLOv10-n algorithm in terms of precision, recall, mAP50, F1 score, Parameters, GFLOPs, model size, and FPS. As shown in Table 3 and Table 4, after the improvement, the p-value increases by 0.3%/1.6%, the R-value increases by 5.3%/5.2%, the mAP50 value increases by 4.1%/4.1%, the F1 score improves by 2.9%/3.5%, the number of parameters decreases by 72,942, GFLOPs decreases by 0.3, the model size decreases by 0.1 MB, and FPS increases by 6.2%/5.4%. In general, the algorithm becomes more accurate, and the model complexity decreases. The comparison of mAP50 is shown in Figure 15.
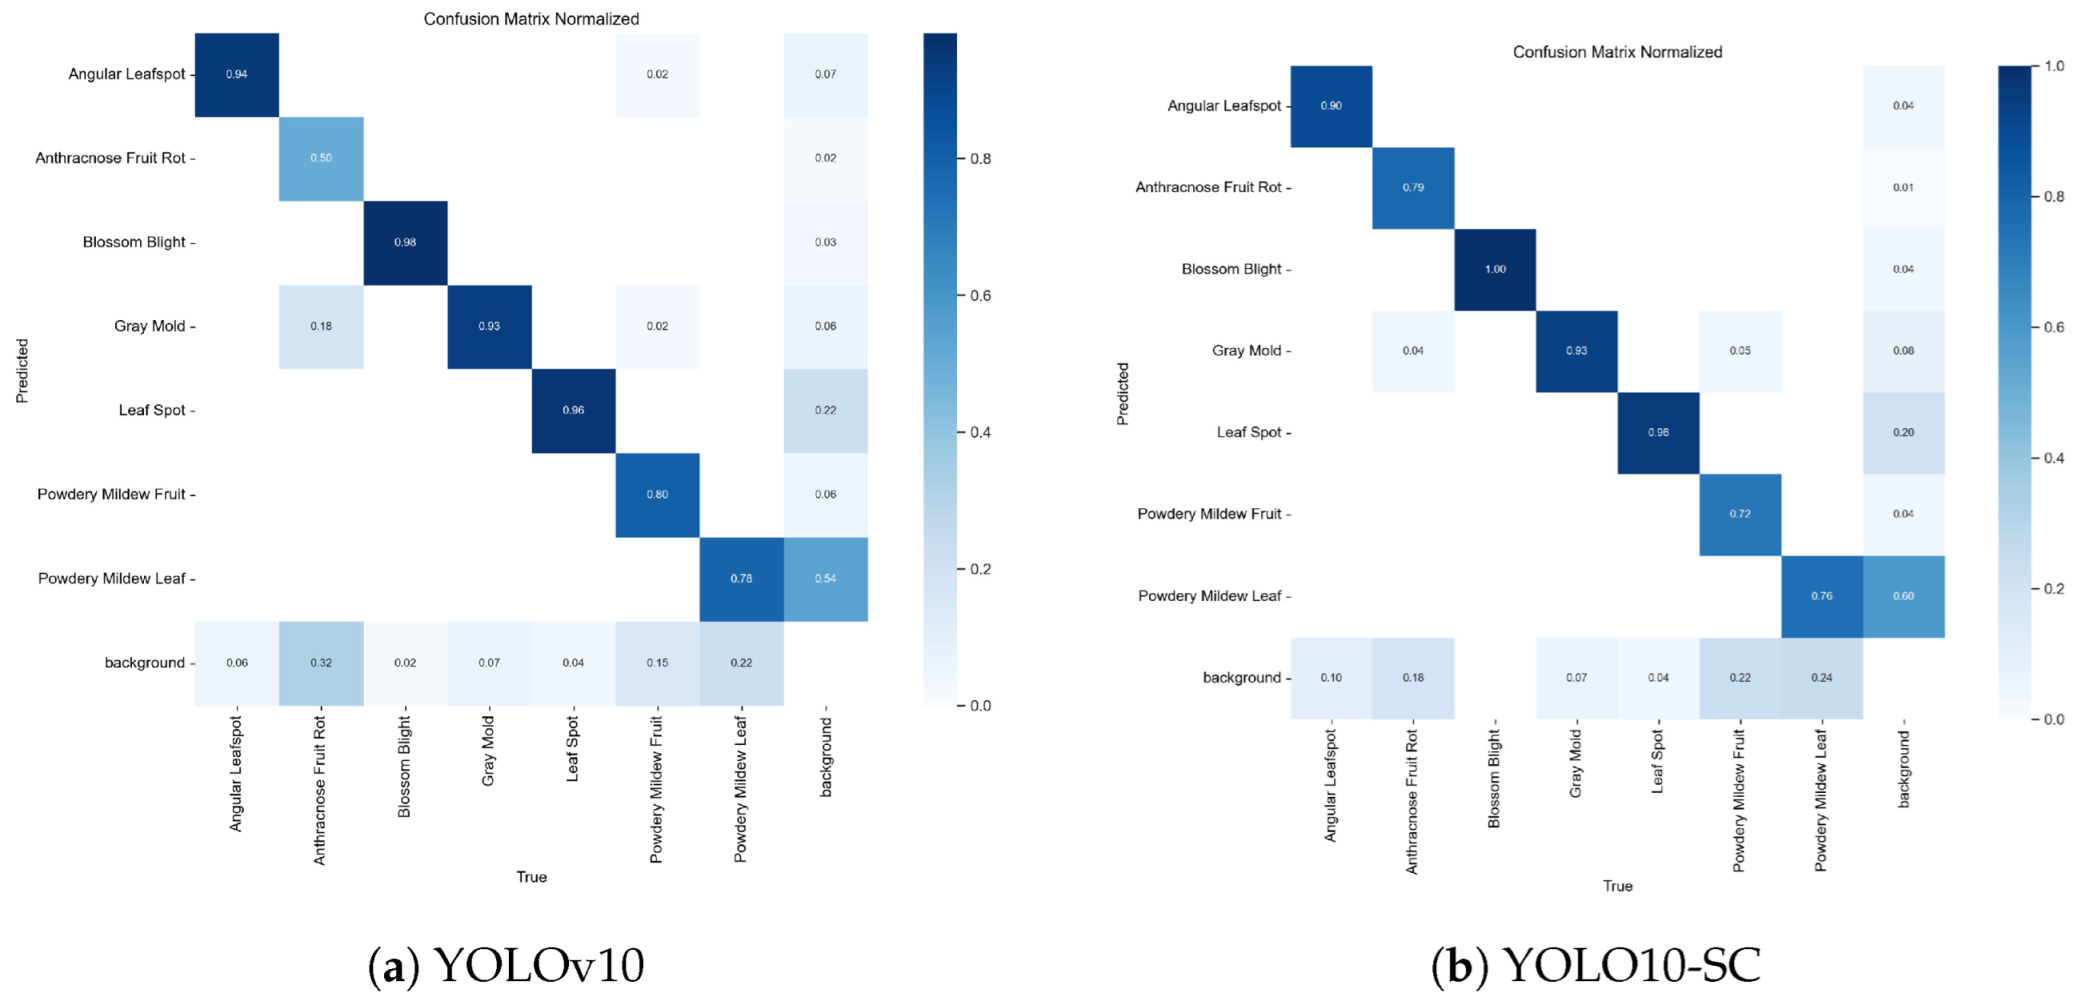
Figure 16 shows the normalized confusion matrices for the baseline model and YOLO10-SC. Comparisons reveal that the improved model significantly outperforms the baseline model in classification accuracy for most disease categories, such as Anthracnose Fruit Rot (correct classification rate increased from 0.50 to 0.79) and Blossom Blight (increased from 0.98 to 1.00). Furthermore, the confusion between background and Anthracnose Fruit Rot decreased from 0.32 to 0.18. However, the baseline model achieved slightly higher classification accuracy (0.94) for Angular Leafspot than the improved model (0.90). While still maintaining high accuracy, the reasons for the reduced classification performance in this category warrant further investigation. Meanwhile, categories such as Gray Mold and Leaf Spot demonstrated consistently high and stable classification accuracy across both models, reflecting the model’s strong robustness in identifying these diseases.
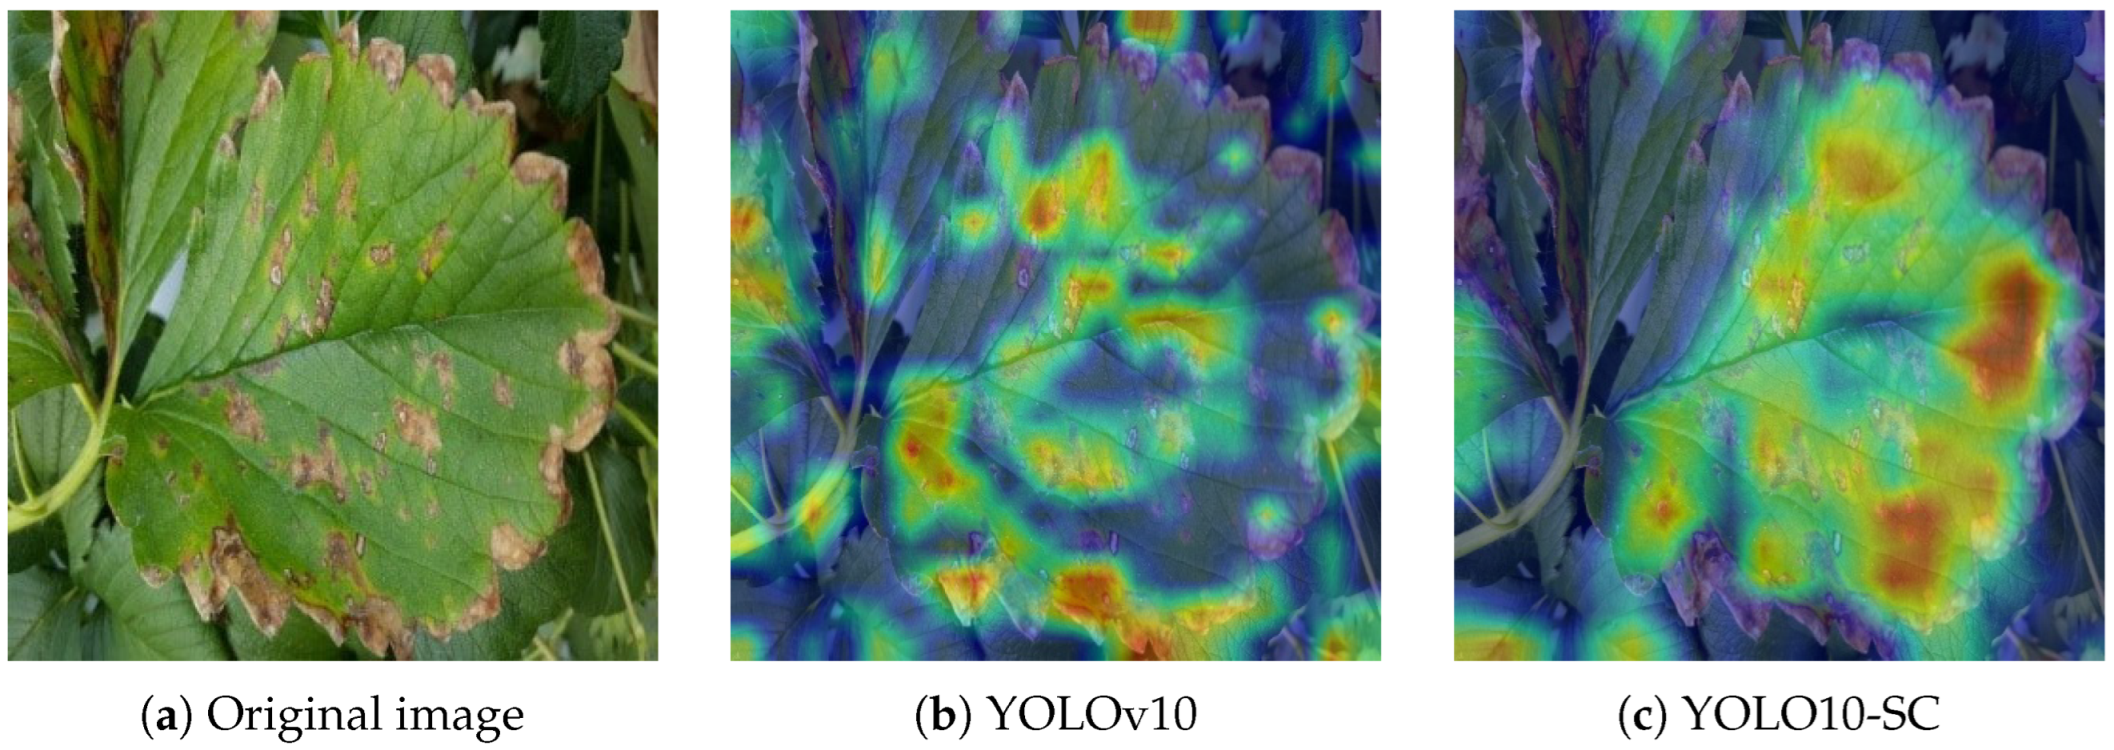
Figure 17 displays the heatmap visualizations of the improved YOLO10-SC model compared with the baseline YOLOv10 model. The comparison reveals that the improved YOLO10-SC heatmap exhibits superior visual coherence and target focus: its high-activation regions (warm tones) precisely cover the core lesion areas, forming a distinct gradient difference with the thermal boundaries of healthy tissue and background regions, demonstrating enhanced lesion–background discrimination capability. In contrast, the baseline YOLOv10 exhibits relatively diffuse heat distribution, with redundant activation persisting in healthy areas surrounding lesions. This reduces the visual distinctiveness of target contours, validating YOLO10-SC’s enhanced capability to capture key visual patterns of disease during feature extraction while improving robustness in disease identification.
Further, the results of the improved algorithm on the COCO dataset are compared with the original YOLOv10-n algorithm, as shown in Table 5. After improvement, the R-value increases by 1.8%, the mAP50 value increases by 1.3%, and the F1 score improves by 0.8%, which shows that the algorithm proposed in this paper has good generalization in different contexts.

3.5. Ablation Experiment

In order to better understand the impact of each improvement made to this paper’s algorithm on the detection effect, a series of ablation experiments were conducted in this study. Under the same conditions of training parameters, YOLOv10-n is used as the baseline comparison network, and the results of the ablation experiments are shown in Table 6.
Experiment A in Table 6 is the baseline YOLOv10-n network structure applied to the dataset of this paper; Experiments B, C, and D denote when one improvement strategy alone is added; and Experiments E, F, and G denote when the three improvement strategies are combined two by two, respectively. The experimental results show that each improvement strategy can improve the performance of the algorithm, and the three improvement strategies have the best effect when they are fused together. The algorithm in this paper improves mAP50 by 4.1%, precision by 0.3%, recall by 5.3%, and F1 score by 2.9% compared with the original YOLOv10-n network. Through ablation experiments, it is demonstrated that each improvement strategy improves the performance of the network model, and the algorithm in this paper is able to achieve the highest accuracy.

3.6. Comparison Experiment

In order to further prove the effectiveness and superiority of this paper’s algorithm, under the condition of unchanged experimental environment and model parameter settings, algorithms in the field of target detection developed in recent years, i.e., YOLOv5 [29], Rt-DETR [30], YOLOv7 [31], YOLOv8 [21], YOLOv8-AM [32], FCE-YOLOv8 [33], YOLO9tr [34], HIC-YOLOv5 [35], RCS-YOLO [36], Mask-RCNN [28], Improved Faster R_CNN [16], YOLO-GIC-C [37], YOLOv11 [38], and YOLOv12 [39], are selected for comparison with this paper’s method, and the precision rate (P), recall rate (R), mAP50, and F1 scores are used as the evaluation indexes; the results are shown in Table 7.
As can be seen from the data in Table 7, the recall, mAP, and F1 score of this paper’s algorithm are the highest among all the tested algorithms in the table.
The algorithm in this paper improved the p-value by 0.183, the R-value by 0.05, the mAP50 value by 0.09, and the F1 score by 0.121 compared with Mask-RCNN, developed in 2021, when the dataset used in this paper was proposed. The performance of the algorithm in this paper is better. Regarding the dataset, the original dataset images contained relatively few challenging detection conditions. This study implemented data augmentation techniques: noise addition to simulate blurred images and weather conditions like fog or dust storms; brightness adjustment to mimic nighttime and midday scenarios; the random masking of original images to simulate occlusions; and rotation, cropping, translation, and mirroring to replicate images captured from various angles. Models trained on the augmented dataset demonstrate stronger generalization capabilities and better adaptability for detecting strawberry diseases under diverse conditions. In summary, the proposed method demonstrates superior performance compared with approaches used when establishing the dataset.
The algorithm in this paper shows a large advantage over the new algorithms YOLOv8-AM, FCE-YOLOv8, YOLO9tr, HIC-YOLOv5, and RCS-YOLO proposed in 2023–2024, all of which show a large advantage in the training results on this paper’s dataset.
The algorithms in this paper also show a large advantage in the detection results on this paper’s dataset compared with the classical algorithms in the field of target detection YOLOv5, Rt-DETR, YOLOv7, YOLOv8, and YOLOv9.
When compared with the latest single-stage object detection algorithms YOLOv11 and YOLOv12 over the past two years, the proposed algorithm also achieves optimal performance in strawberry disease detection, making it more suitable for application in smart agriculture.
Pre-training leads to improved performance of this paper’s algorithm, and in the case of pre-training, the recall, mAP, and F1 scores of this paper’s algorithm are the highest among all tested algorithms in the table compared with Improved Faster R-CNN and YOLO-GIC-C, which are also used for strawberry pest and disease detection.
In summary, the algorithm proposed in this paper has higher accuracy and better overall performance.
The challenges associated with detecting strawberry pests and diseases in natural environments are compounded by complex image backgrounds, the small size of disease spots, and the subtle differences among various diseases, which can lead to misdetection and omissions. Nevertheless, the proposed algorithm achieves significant optimization in recall, mAP50, and F1 score. Experimental results indicate that the network model developed in this study not only attains higher accuracy but also maintains lower complexity, thereby providing enhanced overall performance and suitability for the task of recognizing strawberry pests and diseases in natural environments.

3.7. Strawberry Disease Detection System

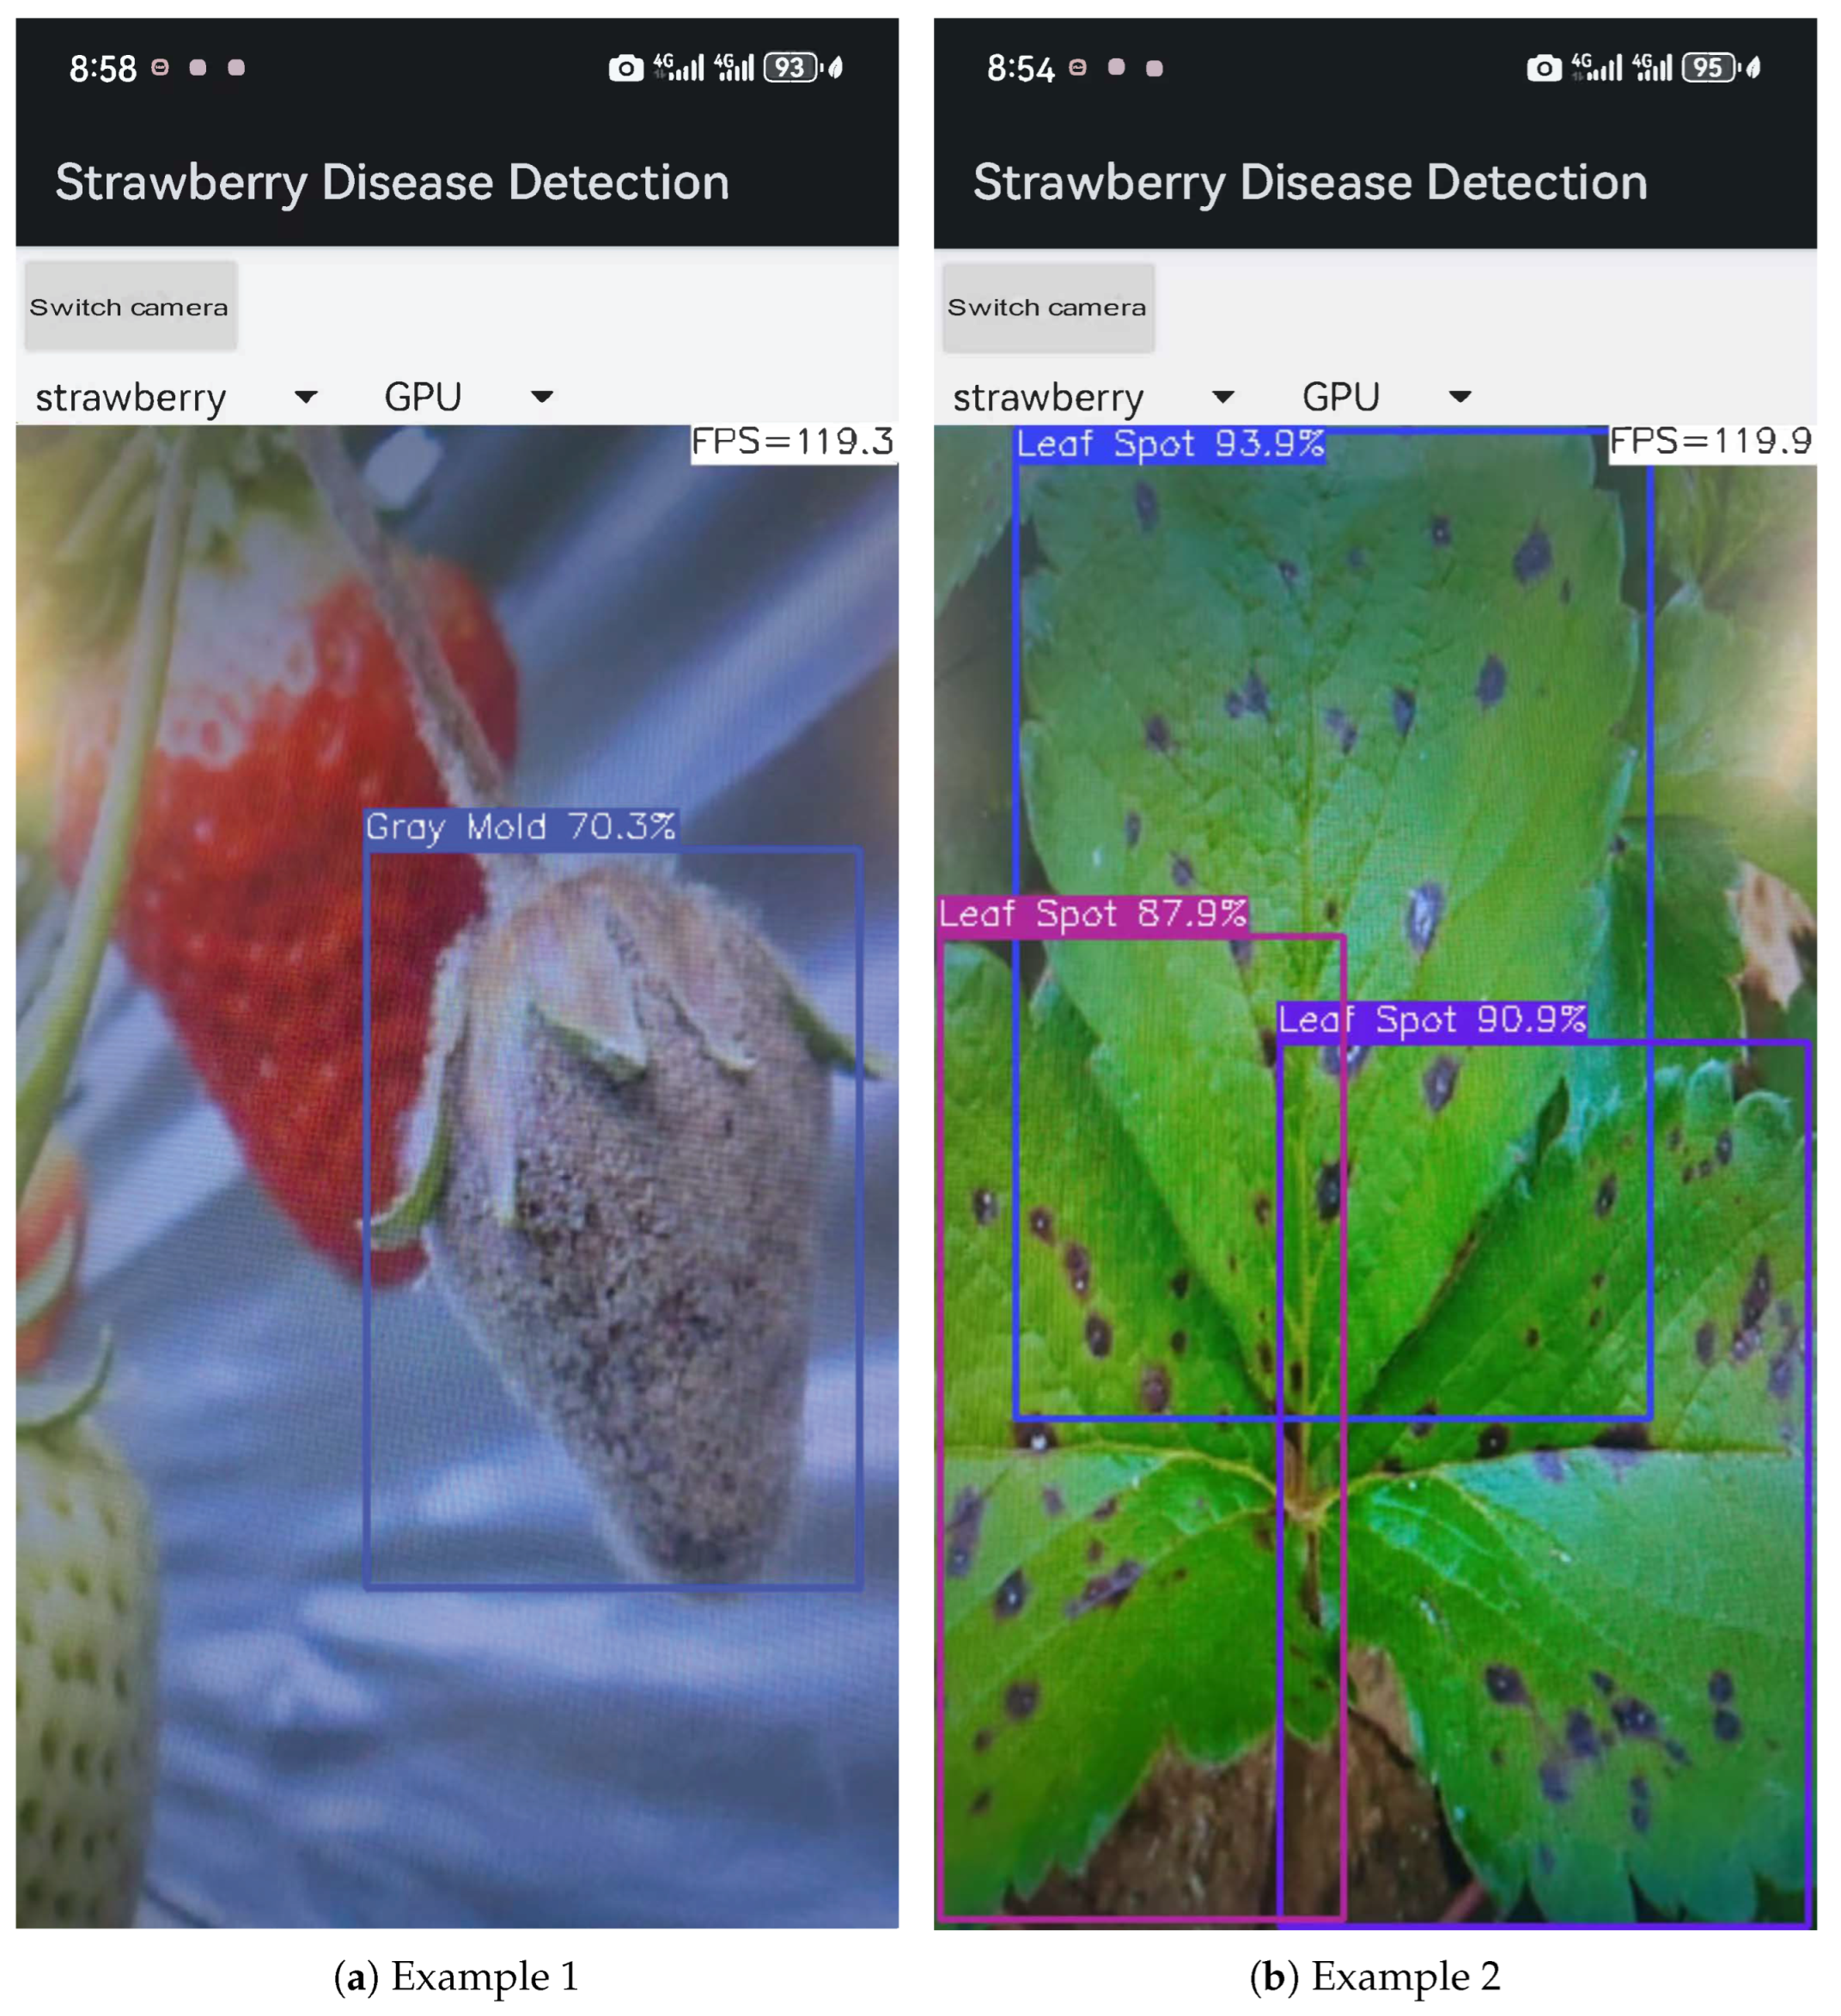
To facilitate the application of strawberry pest and disease detection algorithms in real growing environments, YOLO-SC was deployed on a mobile app, and the final developed app interface is shown in Figure 18.
To simulate the hardware usage scenarios of agricultural users in the field, deployment performance was validated on a mid-range mobile device: the HUAWEI nova9 (manufactured by Huawei Technologies Co., Ltd., Shenzhen, Guangdong Province, China), equipped with a Snapdragon 778G processor (manufactured by Qualcomm Technologies, Inc., San Diego, CA, USA) and 8 GB of RAM. During operation, the frame rate remained within the 50–100 range, achieving over 100 frames per second under favorable conditions. This system operates offline, eliminating concerns regarding signal delays in remote environments.
The system was tested and verified to be able to effectively perform the strawberry pest and disease detection tasks in production agriculture planting, greatly improving detection efficiency and accuracy.

4. Discussion

The proposed YOLO10-SC is a scenario-specific collaborative solution designed to address the unique challenges of strawberry pest and disease detection—filling technical gaps that individual modules or generic combinations cannot cover. This integrated design targets three critical pain points in strawberry disease detection: complex backgrounds, subtle morphological differences among disease categories, and computational constraints on edge devices. The closed-loop synergistic optimization chain formed by the three modules amplifies the model’s performance advantages: the CBAM reduces background interference, thereby alleviating the computational load of SCConv’s fine-grained discrimination; the highly recognizable feature maps output by SCConv enhance the precision of DySample’s detail reconstruction; DySample’s efficient upsampling ensures that optimized features fully serve detection tasks. This synergy enables YOLO10-SC to achieve a perfect balance of detection accuracy, speed, and device adaptability in strawberry disease detection, providing an efficient solution for real-time field monitoring.
The proposed YOLO10-SC model demonstrates excellent performance in detecting strawberry pests and diseases in natural environments, but more research and improvements are still needed in the following aspects.
First, although this paper expanded the size of the dataset through data augmentation, several limitations remain. These include data sourced from a single origin, inclusion of only strawberries as the target crop, and the absence of analysis on disease severity or occlusion levels. These constraints may limit the model’s generalization capabilities and robustness across diverse real-world scenarios. Moving forward, our work will focus on collecting data from multiple countries and regions, with plans to expand research to pest and disease detection across multiple crops. This will enhance model performance and contribute more effectively to smart agriculture.
Secondly, although this study achieved promising results in detecting diseases on strawberry images, it remains confined to a single modality—visual information. With advancements in multimodal fusion and sensor technologies, our future work will focus on integrating visual data with sensor-derived information such as temperature and humidity, alongside textual and audio data, to provide farmers with enhanced decision support.
Finally, although this paper deploys YOLO-SC within a mobile application, testing has verified that the system effectively performs strawberry pest and disease detection tasks in productive agricultural cultivation. Its inference speed meets practical requirements in real-world environments, and the system operates offline without network constraints. However, due to limitations of the experimental site, it was not possible to test inference speed and battery endurance under field conditions. Future work will involve selecting suitable locations and seasons to conduct more comprehensive testing and refinement of the mobile application.

5. Conclusions

This study demonstrates the efficacy of deep learning in enhancing strawberry pest and disease detection, with the improved YOLOv10 algorithm significantly advancing the field. By integrating the CBAM attention mechanism, the C2f_SCConv module, and DySample, the model achieves superior accuracy and reduced complexity, as evidenced by the metrics in Table 3, Table 4, Table 6, and Table 7. These advancements not only refine pest detection but also pave the way for broader applications in agricultural technology, potentially extending to other crops and environmental conditions. Future research will focus on deeply integrating intelligent recognition algorithms for strawberry pests and diseases with natural language processing (NLP) techniques, aiming to construct a multimodal intelligent model system in the agricultural field. This research study underscores the transformative potential of integrating advanced algorithms into agricultural practices.

Author Contributions

Conceptualization, H.J.; Methodology, X.J.; Software, W.L.; Validation, W.L.; Formal analysis, H.J., X.J. and W.L.; Investigation, X.J.; Resources, H.J.; Data curation, X.J.; Writing—original draft, X.J.; Writing—review & editing, H.J. and W.L. All authors have read and agreed to the published version of the manuscript.

Funding

This work was supported by the Agricultural Scientific and Technological Achievements transformation Funds of Hebei Province (2025JNZ-S24), and by the Project of the Technology Innovation Center of Hebei Normal University (L2022T09).

Data Availability Statement

Data are contained within the article.

Conflicts of Interest

The authors declare no conflicts of interest.

References

  1. Hernández-Martínez, N.R.; Blanchard, C.; Wells, D.; Salazar-Gutiérrez, M.R. Current state and future perspectives of commercial strawberry production: A review. Sci. Hortic. 2023, 312, 111893. [Google Scholar] [CrossRef]
  2. Yang, J.-W.; Kim, H.-I. An overview of recent advances in greenhouse strawberry cultivation using deep learning techniques: A review for strawberry practitioners. Agronomy 2024, 14, 34. [Google Scholar] [CrossRef]
  3. Hazgui, M.; Ghazouani, H.; Barhoumi, W. Genetic programming-based fusion of hog and lbp features for fully automated texture classification. Vis. Comput. 2022, 38, 457–476. [Google Scholar] [CrossRef]
  4. Djimeli-Tsajio, A.B.; Thierry, N.; Jean-Pierre, L.T.; Kapche, T.; Nagabhushan, P. Improved detection and identification approach in tomato leaf disease using transformation and combination of transfer learning features. J. Plant Dis. Prot. 2022, 129, 665–674. [Google Scholar] [CrossRef]
  5. Yang, N.; Qian, Y.; EL-Mesery, H.S.; Zhang, R.; Wang, A.; Tang, J. Rapid detection of rice disease using microscopy image identification based on the synergistic judgment of texture and shape features and decision tree–confusion matrix method. J. Sci. Food Agric. 2019, 99, 6589–6600. [Google Scholar] [CrossRef] [PubMed]
  6. Li, Z.; Guo, R.; Li, M.; Chen, Y.; Li, G. A review of computer vision technologies for plant phenotyping. Comput. Electron. Agric. 2020, 176, 105672. [Google Scholar] [CrossRef]
  7. Jia, S.; Gao, H.; Hang, X. Research progress on image recognition technology of crop pests and diseases based on deep learning. Trans. Chin. Soc. Agric. Mach. 2019, 50, 313–317. [Google Scholar]
  8. Redmon, J. You only look once: Uunified, real-time object detection. In Proceedings of the IEEE Conference on Computer Vision and Pattern Recognition, Las Vegas, NV, USA, 27–30 June 2016. [Google Scholar]
  9. Ren, S.; He, K.; Girshick, R.; Sun, J. Faster r-cnn: Towards real-time object detection with region proposal networks. IEEE Trans. Pattern Anal. Mach. Intell. 2017, 39, 1137–1149. [Google Scholar] [CrossRef]
  10. Chodey, M.D.; Shariff, C.N. Hybrid deep learning model for in-field pest detection on real-time field monitoring. J. Plant Dis. Prot. 2022, 129, 635–650. [Google Scholar] [CrossRef]
  11. Gehlot, M.; Gandhi, G.C. “effinet-ts”: A deep interpretable architecture using efficientnet for plant disease detection and visualization. J. Plant Dis. Prot. 2023, 130, 413–430. [Google Scholar] [CrossRef]
  12. Zhang, K.; Wu, Q.; Chen, Y. Detecting soybean leaf disease from synthetic image using multi-feature fusion faster r-cnn. Comput. Electron. Agric. 2021, 183, 106064. [Google Scholar] [CrossRef]
  13. Hu, G.; Yang, X.; Zhang, Y.; Wan, M. Identification of tea leaf diseases by using an improved deep convolutional neural network. Sustain. Comput. Inform. Syst. 2019, 24, 100353. [Google Scholar] [CrossRef]
  14. Jiang, Y.; Lu, L.; Wan, M.; Hu, G.; Zhang, Y. Detection method for tea leaf blight in natural scene images based on lightweight and efficient lc3net model. J. Plant Dis. Prot. 2024, 131, 209–225. [Google Scholar] [CrossRef]
  15. Zhao, S.; Zhao, M.; Qi, L.; Li, D.; Wang, X.; Li, Z.; Hu, M.; Fan, K. Detection of ginkgo biloba seed defects based on feature adaptive learning and nuclear magnetic resonance technology. J. Plant Dis. Prot. 2024, 131, 2111–2124. [Google Scholar] [CrossRef]
  16. Zhao, S.; Liu, J.; Wu, S. Multiple disease detection method for greenhouse-cultivated strawberry based on multiscale feature fusion faster r_cnn. Comput. Electron. Agric. 2022, 199, 107176. [Google Scholar] [CrossRef]
  17. Liu, J.; Wang, X. Early recognition of tomato gray leaf spot disease based on mobilenetv2-yolov3 model. Plant Methods 2020, 16, 83. [Google Scholar] [CrossRef]
  18. Xue, Z.; Xu, R.; Bai, D.; Lin, H. Yolo-tea: A tea disease detection model improved by yolov5. Forests 2023, 14, 415. [Google Scholar] [CrossRef]
  19. Li, R.; Li, Y.; Qin, W.; Abbas, A.; Li, S.; Ji, R.; Wu, Y.; He, Y.; Yang, J. Lightweight network for corn leaf disease identification based on improved yolo v8s. Agriculture 2024, 14, 220. [Google Scholar] [CrossRef]
  20. Wang, A.; Chen, H.; Liu, L.; Chen, K.; Lin, Z.; Han, J.; Ding, G. Yolov10: Real-time end-to-end object detection. arXiv 2024, arXiv:2405.14458. [Google Scholar]
  21. Jocher, G.; Qiu, J.; Chaurasia, A. Ultralytics YOLO. 2023. Available online: https://github.com/ultralytics/ultralytics (accessed on 15 September 2024).
  22. Woo, S.; Park, J.; Lee, J.-Y.; Kweon, I.S. Cbam: Convolutional block attention module. arXiv 2018, arXiv:1807.06521. [Google Scholar] [CrossRef]
  23. Li, J.; Wen, Y.; He, L. Scconv: Spatial and channel reconstruction convolution for feature redundancy. In Proceedings of the IEEE/CVF Conference on Computer Vision and Pattern Recognition, Vancouver, BC, Canada, 17–24 June 2023; pp. 6153–6162. [Google Scholar]
  24. Loy, C.C.; Lin, D.; Wang, J.; Chen, K.; Xu, R.; Liu, Z. Carafe: Content-aware reassembly of features. arXiv 2019, arXiv:1905.02188. [Google Scholar]
  25. Lu, H.; Liu, W.; Fu, H.; Cao, Z. Fade: Fusing the assets of decoder and encoder for task-agnostic upsampling. In Proceedings of the European Conference on Computer Vision, Milan, Italy, 23–27 October 2022. [Google Scholar]
  26. Lu, H.; Liu, W.; Ye, Z.; Fu, H.; Liu, Y.; Cao, Z. Sapa: Similarity-aware point affiliation for feature upsampling. Adv. Neural Inf. Process. Syst. 2022, 35, 20889–20901. [Google Scholar]
  27. Liu, W.; Lu, H.; Fu, H.; Cao, Z. Learning to upsample by learning to sample. In Proceedings of the IEEE/CVF International Conference on Computer Vision, Paris, France, 1–6 October 2023; pp. 6027–6037. [Google Scholar]
  28. Afzaal, U.; Bhattarai, B.; Pandeya, Y.R.; Lee, J. An instance segmentation model for strawberry diseases based on mask r-cnn. Sensors 2021, 21, 6565. [Google Scholar] [CrossRef]
  29. Wang, P.; Huang, H.; Wang, M. Complex road target detection algorithm based on improved yolov5. Comput. Eng. Appl. 2022, 58, 81–92. [Google Scholar]
  30. Zhao, Y.; Lv, W.; Xu, S.; Wei, J.; Wang, G.; Dang, Q.; Liu, Y.; Chen, J. Detrs beat yolos on real-time object detection. In Proceedings of the IEEE/CVF Conference on Computer Vision and Pattern Recognition, Seattle, WA, USA, 16–22 June 2024; pp. 16965–16974. [Google Scholar]
  31. Wang, C.Y.; Bochkovskiy, A.; Liao, H.Y.M. Yolov7: Trainable bag-of-freebies sets new state-of-the-art for real-time object detectors. arXiv 2022, arXiv:2207.02696. [Google Scholar]
  32. Chien, C.-T.; Ju, R.-Y.; Chou, K.-Y.; Chiang, J.-S. Yolov8-am: YOLOv8 Based on Effective attention mechanisms for pediatric wrist fracture detection. arXiv 2024, arXiv:2402.09329. [Google Scholar] [CrossRef]
  33. Ju, R.-Y.; Chien, C.-T.; Xieerke, E.; Chiang, J.-S. Pediatric wrist fracture detection using feature context excitation modules in x-ray images. arXiv 2024, arXiv:2410.01031. [Google Scholar]
  34. Youwai, S.; Chaiyaphat, A.; Chaipetch, P. Yolo9tr: A lightweight model for pavement damage detection utilizing a generalized efficient layer aggregation network and attention mechanism. J. Real-Time Image Process. 2024, 21, 163. [Google Scholar] [CrossRef]
  35. Tang, S.; Zhang, S.; Fang, Y. Hic-yolov5: Improved yolov5 for small object detection. In Proceedings of the 2024 IEEE International Conference on Robotics and Automation (ICRA), Yokohama, Japan, 13–17 May 2024; pp. 6614–6619. [Google Scholar]
  36. Kang, M.; Ting, C.-M.; Ting, F.F.; Phan, R.C.-W. Rcs-yolo: A fast and high-accuracy object detector for brain tumor detection. In International Conference on Medical Image Computing and Computer-Assisted Intervention, Vancouver, BC, Canada, 8–12 October 2023; Springer: Berlin/Heidelberg, Germany, 2023; pp. 600–610. [Google Scholar]
  37. Chen, S.; Liao, Y.; Lin, F.; Huang, B. An improved lightweight yolov5 algorithm for detecting strawberry diseases. IEEE Access 2023, 11, 54080–54092. [Google Scholar] [CrossRef]
  38. Khanam, R.; Hussain, M. Yolov11: An overview of the key architectural enhancements. arXiv 2024, arXiv:2410.17725. [Google Scholar] [CrossRef]
  39. Tian, Y.; Ye, Q.; Doermann, D. Yolov12: Attention-centric real-time object detectors. arXiv 2025, arXiv:2502.12524. [Google Scholar]
Figure 1. Network structure of the algorithm in this paper.
Electronics 14 03768 g001
Figure 3. Feature maps prior to incorporating the CBAM attention mechanism.
Electronics 14 03768 g003
Figure 4. Feature maps after incorporating the CBAM attention mechanism.
Electronics 14 03768 g004
Figure 5. Spatial and channel reconstruction convolution.
Electronics 14 03768 g005
Figure 6. Spatial reconstruction unit.
Electronics 14 03768 g006
Figure 7. Channel reconstruction unit.
Electronics 14 03768 g007
Figure 8. C2f_SCConv module.
Electronics 14 03768 g008
Figure 9. Feature maps output by the C2f module.
Electronics 14 03768 g009
Figure 10. Feature maps output by the C2f_SCConv module.
Electronics 14 03768 g010
Figure 11. The feature maps generated by Dysample were not introduced.
Electronics 14 03768 g011
Figure 12. The feature maps generated by Dysample were introduced.
Electronics 14 03768 g012
Figure 13. The seven types of strawberry diseases that our model is trained to detect. (a) Angular Leafspot. (b) Anthracnose Fruit Rot. (c) Blossom Blight. (d) Gray Mold. (e) Leaf Spot. (f) Powdery Mildew Fruit. (g) Powdery Mildew Leaf.
Electronics 14 03768 g013
Figure 14. Some of the augmented images. (a) Original. (b) Adding noise. (c) Adjusting the luminance. (d) Randomly overlaying the original image. (e) Rotating. (f) Panning. (g) Mirroring.
Electronics 14 03768 g014
Figure 15. Comparison of mAP50 visualization before and after improvement.
Electronics 14 03768 g015
Figure 16. Comparison of normalized confusion matrix before and after improvement.
Electronics 14 03768 g016
Figure 17. Comparison of heatmap before and after improvement.
Electronics 14 03768 g017
Figure 18. Strawberry disease detection system example diagram.
Electronics 14 03768 g018
Table 1. Classification of datasets.
Category of DiseaseAngular
Leafspot
Anthracnose
Fruit Rot
Blossom
Blight
Gray
Mold
Leaf
Spot
Powdery
Mildew Fruit
Powdery
Mildew Leaf
Quantities87019441695412302701066
Table 2. Configuration of the experimental training environment and hyperparameters.
Software and Hardware PlatformModel Parameters
Operating systemWindows 11
Processing unit11th Gen Intel(R) Core(TM) i9-11900 @ 2.50 GHz
Display card (computer)NVIDIA GeForce RTX 3080
Organizing planPytorch 2.3.1
Programming EnvironmentPython 3.9
Video Memory, GB36 GB
Memory, GB32 GB
Image Size640 × 640
OptimizerAdamW
Learning Rate0.01
Epochs200
Batch Size32
Table 3. Performance comparison before and after improvement in the dataset of this paper (non-pre-trained).
ArithmeticP (%)R (%)mAP50 (%)F1ParametersGFLOPsModel SizeFPS
Pre-improvement0.8820.8120.8730.8462,697,1468.25.8142.8
Improved0.8850.8650.9140.8752,624,2047.95.7149
Table 4. Performance comparison before and after improvement in the dataset of this paper (pre-trained).
ArithmeticP (%)R (%)mAP50 (%)F1ParametersGFLOPsModel SizeFPS
Pre-improvement0.9350.8510.9170.8912,697,1468.25.8141.1
Improved0.9510.9030.9580.9262,624,2047.95.7146.5
Table 5. Performance comparison before and after improvement on COCO dataset.
ArithmeticP (%)R (%)mAP50 (%)F1
Pre-improvement0.5870.4020.4360.477
Improved0.5740.4200.4490.485
Table 6. Results of ablation experiments.
Serial NumberCBAMC2f_SCConvDysamplePRmAP50F1
A 0.8820.8120.8730.846
B 0.8830.8430.8960.863
C 0.9280.8060.8990.863
D 0.9150.8380.8920.875
(0.87480)
E 0.9010.8450.9010.872
F 0.9180.8220.9040.867
G 0.9150.820.8920.865
YOLO10-SC (non-pre-trained)0.8850.8650.9140.875
(0.87488)
YOLO10-SC (pre-trained)0.9510.9030.9580.926
Note: A tick indicates that the method was used.
Table 7. Results of comparison experiments.
MethodPRmAPF1
YOLOv5 (2020)0.8920.8290.8880.859
Rt-DETR (2023)0.8620.8560.8740.859
YOLOv7 (2022)0.8710.8020.8540.835
YOLOv8 (2023)0.8780.8430.8880.860
YOLOv9 (2024)0.8850.8240.8960.853
YOLOv8-AM (2024)0.8420.8080.8690.825
FCE-YOLOv8 (2024)0.8430.8230.8730.833
YOLO9tr (2024)0.8690.8250.8910.846
HIC-YOLOv5 (2023)0.7980.7910.8030.794
RCS-YOLO (2024)0.9330.8020.8550.863
Mask R-CNN (2021)0.7020.8150.8240.754
YOLOv11 (2024)0.8890.8240.8850.855
YOLOv12 (2025)0.8800.8230.8920.851
YOLO10-SC0.8850.8650.9140.875
Improved Faster R_CNN (pre-trained) (2022)--0.922-
YOLO-GIC-C (pre-trained) (2023)0.9330.9030.9470.918
YOLO10-SC (pre-trained)0.9510.9030.9580.926
Disclaimer/Publisher’s Note: The statements, opinions and data contained in all publications are solely those of the individual author(s) and contributor(s) and not of MDPI and/or the editor(s). MDPI and/or the editor(s) disclaim responsibility for any injury to people or property resulting from any ideas, methods, instructions or products referred to in the content.