Abstract
Earthquakes threaten the security and stability of urban integrated energy systems. Enhancing system resilience improves the ability to withstand seismic hazards. This paper proposes a coordinated post-disaster restoration strategy for integrated electricity and natural gas systems (IENGSs) that exploits natural gas line pack under seismic conditions. First, a line pack model is developed to quantify its impact on IENGS resilience. Subsequently, leveraging the load-supporting capability of line pack, we investigate how distribution network reconfiguration influences IENGS load recovery. Accounting for cross-system fault propagation during earthquakes, we formulate a post-disaster repair strategy incorporating line pack flexibility. Case studies using the IEEE 33-bus power system and a 7-node natural gas system validate the proposed strategy’s effectiveness and feasibility in enhancing seismic resilience.
1. Introduction
In recent years, extreme natural disasters have threatened the operational security of IENGSs. High-impact, low-probability events—including typhoons, earthquakes, and floods—frequently trigger medium-to-large-scale energy supply interruptions in IENGSs, incurring substantial economic losses and significantly disrupting residents’ daily livelihoods [1]. Notable examples include the 2011 Great East Japan Earthquake, which left over 4 million households without power for 7–9 days [2], and an August 2019 M6.4 earthquake off Yilan, Taiwan, which damaged two transmission towers, severed one transmission line, ruptured three gas pipelines, and caused power outages affecting more than 700 households [3].
Therefore, enhancing IENGS resilience in response to extreme natural disasters is crucial for mitigating disaster impacts. This involves improving the ability of IENGSs to prevent and adapt to environmental changes, withstand disturbances, and recover quickly [4,5,6,7,8].
To enhance the resilience of IENGSs against extreme natural disasters such as earthquakes, researchers conducted extensive studies on urban integrated energy systems. Reference [9] presents a new resilience-driven framework for hardening power distribution systems against earthquakes. The concept of fragility curve is applied to characterize an earthquake hazard, assess its impact on power distribution systems, and estimate the unavailability of the network elements when exposed to extreme earthquakes. A new metric is defined to quantify the network resilience, taking into account the uncertain nature of such HILP events. Reference [10] developed a dynamic rolling optimization method for post-disaster emergency repairs in distribution networks, enabling real-time adjustment of repair crew schedules. The network topology reconfiguration method in [11] facilitated post-disaster recovery of electricity–gas integrated systems. References [12,13] established a coordinated optimization model for multi-fault repair and power restoration in distribution networks with distributed generators (DGs), explicitly addressing the interdependence between fault remediation and supply recovery. Subsequently, Reference [14] proposed a comprehensive optimization framework coordinating (distributed generator) DG dispatch, network reconfiguration, and repair crew scheduling. Complementing these approaches, Reference [15] constructed a maintenance scheduling optimization model for electricity–gas systems to synchronize subsystem operations and improve load recovery efficiency. Reference [16] proposed an optimization approach to determine optimal portfolios of resilient network investments, considering endogenous probabilities that change with hardening investment options. This decision-dependent probability model finds the optimal network enhancements in a cost-benefit fashion, minimizing investment plus operational costs, including demand curtailments. Nevertheless, existing studies exhibit two significant limitations: insufficient consideration of cross-subsystem fault propagation impacts on system resilience, and inadequate exploration of cross-energy-chain mutual support effects.
As a dynamic storage characteristic of gas systems, natural gas line pack has been widely employed to enhance operational flexibility and economic efficiency in integrated energy systems. As demonstrated in [17], a dynamic scheduling model for electricity–gas interconnected systems incorporated the transient behavior of line pack alongside coordinated operation of Power-to-Gas (P2G) units and gas turbines. By simulating congestion by reducing the primary natural gas pipeline’s capacity, Reference [18] reveals significant patterns in production costs and load flows within the electrical network. This approach improved spatio-temporal flexibility while effectively mitigating supply–demand imbalances caused by wind power’s anti-peak regulation characteristics. Complementing this, References [19,20] established a multi-period optimal operation model for coupled energy systems, further validating how line pack effects in gas networks enhanced flexibility and economic performance. Nevertheless, existing research predominantly focused on the line pack’s contributions to operational flexibility and economic efficiency, without addressing its potential for short-term load support in post-earthquake scenarios.
This paper proposes a post-disaster joint restoration strategy for IENGSs leveraging natural gas line pack during seismic events to address these research gaps. The plan integrates natural gas line pack storage capabilities with optimizing distribution network topology reconfiguration and repair scheduling. Targeting minimal IENGS load curtailment, the proposed approach establishes a resilience enhancement framework to achieve rapid post-earthquake load recovery while elevating overall system resilience levels.
2. The Impact of Natural Gas Line Pack on IENGS Resilience
In IENGSs, distribution and natural gas networks are interconnected through coupling components such as gas turbine (GT). Faults originating in either subsystem can propagate across systems via these interfaces, potentially triggering large-scale load interruptions.
As shown in Figure 1, natural gas networks exhibit slower disturbance propagation compared to power systems, typically requiring minutes to hours for transients to stabilize. Pipeline boundary pressures, frictional losses, and ambient temperature variations constrain gas transmission dynamics. Consequently, natural gas supply–demand imbalances cannot be instantaneously resolved, enabling temporary storage through system dynamics, termed line pack [21]. The arrow pointing from the natural gas system to the power system indicates that the power system is supplied with electricity via gas turbines, the arrow pointing from the power system to the compressors of the natural gas system signifies that the power system provides power to the compressors of the natural gas system. After an earthquake occurs, pipe sections in the natural gas system become damaged, and the red arrows lead to the valve switching control scheme for the natural gas pipelines within the red-circled area in the Figure 1: the valves at both ends of the damaged pipeline will automatically close to isolate downstream loads, and by adjusting the valves on the intact pipelines, the stored gas in the pipes can be released to meet the short-term demand of gas loads and gas turbines (as indicated by the blue arrow in the upper right corner). The blue arrow in the lower right corner leads to the graphical representation of the pipeline storage model constraints. These coupled components maintain critical electrical loads through coordinated operation, reducing load losses in the integrated energy network system during the recovery period.
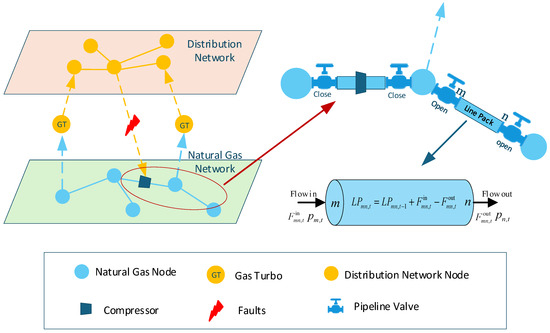
Figure 1.
IENGS topology and line pack.
Model of Natural Gas Line Pack
This paper’s natural gas line pack model refers to Reference [17]. It calculates the average pressure Pmn,t at both ends of the pipeline through Constraint (1), clarifying that pressure changes alter the storage state of line pack, thus reflecting the physical property of line pack adjusting with pressure fluctuations. Based on the principles related to the gas state equation, structural parameters such as pipeline length Lmn and diameter Dmn are introduced, and combined with gas constant R, temperature T, compressibility factor Z, and gas density ρ, the relationship between line pack and the average pressure Pmn,t at both ends of the pipeline is established through Constraint (2). This relationship reflects the constraints of pipeline spatial structure and gas thermodynamic state on natural gas storage capacity. Constraint (3) considers the changes in natural gas line pack during adjacent periods, with the difference between the natural gas inflow and outflow of the pipeline as the core, and combined with the binary variable kmn,t (characterizing the pipeline fault state, where line pack changes are inhibited in case of faults), the time-varying charging and discharging rules of line pack are depicted: when the inflow is greater than the outflow, line pack increases; otherwise, it decreases.
where is the line pack of pipeline mn at time t; kmn,t is a binary variable indicating whether pipeline mn is faulty at time t, where 0 denotes a faulty pipeline; and and are the natural gas inflow to pipeline mn and natural gas outflow from pipeline mn, respectively.
3. Coordinated Restoration Incorporating a Line Pack and Distribution Network Reconfiguration Model for IENGSs
To address the challenge of rapid post-disaster recovery in IENGSs, this paper proposes a novel joint restoration strategy for urban electricity–gas integrated energy systems that leverages natural gas line pack during seismic events. Following an earthquake, we implement a resilience enhancement strategy incorporating natural gas line pack utilization and distribution network topology reconfiguration. Building upon this foundation, a coordinated joint restoration strategy accelerates system recovery. Figure 2 presents a process diagram of the restoration strategy.
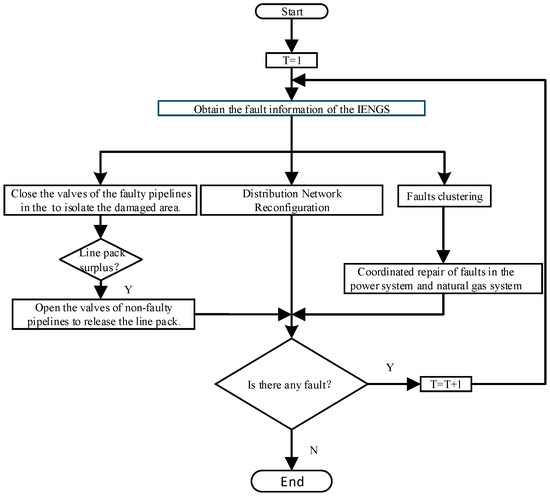
Figure 2.
Process diagram of the restoration strategy.
Regarding the process of the Resilience-Oriented Repair Strategy for Integrated Electricity and Natural Gas Systems with Line Pack Consideration, first, take the time step as T = 1. Then, execute the step “Obtain the fault information of the IENGS” to collect fault data of the integrated energy network (covering power, natural gas). After obtaining faulty information, three core operations are carried out simultaneously, as follows:
- Natural Gas Pipeline Fault Isolation and Line Pack Management: Close the valves of faulty pipelines (“Close the valves of the faulty pipelines to isolate the damaged area”) to isolate the damaged region. Then determine whether there is “Line pack surplus”—“Line pack” refers to the amount of gas storable in natural gas pipelines. If there is surplus (judgment result is “Y”), open the valves of non-faulty pipelines to release the line pack (“Open the valves of non-faulty pipelines to release the line pack”) to balance pipeline pressure and gas volume.
- Distribution Network Reconfiguration: Perform “Distribution network reconfiguration”, which optimizes power supply reliability or operational efficiency by adjusting the topology of the distribution network.
- Fault Clustering and Cross-System Coordinated Repair: First, conduct “Faults clustering” (classifying and aggregating faults by characteristics such as type and region), and then carry out “Coordinated repair of faults in the power system and natural gas system” to realize coordinated repair of faults in the power system and natural gas system (utilizing cross-system resources to improve overall repair efficiency).
Lastly, Cyclic Fault Detection and Termination: After completing the above operations, determine whether there are still unhandled faults via “Is there any fault?” If faults exist (judgment result is “Y”), increment the time step T (T = T + 1) and return to the “Fault information acquisition” step to enter the next fault handling cycle. If no faults exist (judgment result is “N”), the process proceeds to “End”, and the fault handling is completed.
3.1. Objective Function
The proposed resilience enhancement strategy for IENGSs coordinates natural gas line pack dynamics with distribution network topology reconfiguration to maximize load restoration, subject to power and gas system operational constraints. By addressing electricity–gas subsystem coupling in IENGSs, the strategy prioritizes the repair of fault-propagation nodes while accounting for repair time costs. The optimization framework minimizes IENGS load curtailment and damaged component repair duration to achieve rapid post-earthquake recovery.
where B and N denote the sets of distribution network nodes and natural gas network nodes, respectively, T represents the optimization timeframe, and , are the load weight coefficients for electrical and natural gas nodes. Higher coefficient values indicate higher restoration priority. To prioritize repair of critical fault nodes triggering cross-subsystem propagation in the IENGS, corresponding weight coefficients are proportionally increased. Variables and quantify electrical and natural gas load curtailments at each node. Crucially, since DGs can restore some faults through network reconfiguration—eliminating the need for repair crews—the objective function incorporates a maintenance time minimization term weighted by coefficient α. Parameters , represent repair bases for fault type σ, while denotes the completion time for repairing fault d of type σ.
3.2. Power System Operational Constraints
This study adopts the DistFlow power flow model to calculate the power flow of distribution networks in scenarios triggered by faults.
3.2.1. Distribution Network Operation Constraints
In the power flow constraints, Constraint (9) is a nonlinear equality, which is obtained by performing second-order cone relaxation on this equation [22]:
Constraint (10) applies exclusively during pipeline operation and can be reformulated using the big-M method:
where αij,t is the on-off state value of line ij at time t; the on-off state is a 0–1 variable, where zero denotes open and one denotes closed; and M is a large constant, used to relax Constraints (12) and (13).
3.2.2. Node Voltage and Branch Current Constraints
Following distribution network reconfiguration, all node voltages must remain within allowable bounds while branch currents cannot exceed thermal limits. These operational constraints are mathematically expressed as:
where and are, respectively, the lower limit value and upper limit value of voltage at node i at time t; and is the maximum allowable current value of line ij at time t. Constraints (14) and (15) represent the branch voltage drop constraints and branch currents, respectively.
3.2.3. Power Transmission Constraints of the Line
Constraints (16) and (17) indicate that the power transmitted by each line must be within the range of the line’s allowable transmission capacity.
where and are, respectively, the minimum active power and maximum active power of line ij at time t; and are, respectively, the minimum reactive power and maximum reactive power of line ij at time t; and φline is the set of distribution network lines.
3.2.4. Topology Reconfiguration Constraints
Distribution network reconfiguration must satisfy connectivity and radiality constraints, formally expressed as:
where Cb is the set of chord branches; n is the number of branches in the distribution network; Nfg is the number of regions after network partitioning; βij,t is the node parent–child matrix, which takes 1 when node i is the parent node of node j, and zero otherwise.
Constraint (18) ensures that after the topological reconfiguration of the distribution network, the number of activated branches can meet the basic requirement of constructing an effective power supply network from non-faulty nodes, enabling the network to provide power transmission paths for normal nodes. Constraint (19) ensures the uniqueness of the power flow direction in the branch. Constraint (20) guarantees that each node has a clear outgoing direction for power transmission after topological reconfiguration, avoiding network topology confusion, difficulty in analysis, and control caused by a node shunting power to multiple nodes simultaneously. Constraint (21) specifies that power flows from Node 1 to Node 2.
3.3. Natural Gas System Operational Constraints
The Weymouth model [23] is adopted for the natural gas network model to conduct steady-state calculations on natural gas flow rates and nodal pressures.
3.3.1. Pipeline Flow Constraints
3.3.2. Nodal Gas Flow Balance Constraints
Nodes in natural gas networks obey flow conservation, requiring the net gas inflow to equal net outflow. This fundamental principle is mathematically expressed as:
where is the gas production of gas source m at time t; is the load at node m at time t; is the gas flow consumed by natural gas turbine units at node m at time t; is the gas consumption of the gas compressor connected to node m at time t; and ΩGF is the set of pipelines flowing into node m.
3.3.3. Gas Well Capacity Constraint
3.3.4. Gas Turbine Constraints
3.3.5. Pipeline Flow Constraints
3.3.6. Natural Gas Node Pressure Constraints
3.3.7. Line Pack Margin Constraint
3.4. Constraints of Coupling Components
Gas turbines are natural gas-fueled power generation equipment functioning as loads within natural gas systems. The electrical output to natural gas consumption conversion is governed by:
where denotes the power generated by gas turbine i at time t; and μGT denotes the conversion efficiency coefficient of the gas turbine.
This paper models electrically driven compressors powered by the distribution network, which function as power system loads. Their pipeline pressure constraints are governed by:
where πm,t and πn,t denote, respectively, the pressure values at node m and node n at time t; and Γc denotes the compression coefficient of the compressor pipeline.
Constraint (32) describes the energy conversion relationship of the gas compressor.
where Pcomp,t denotes the compressor’s power consumption at time t; and φmn denotes the consumption coefficient of the compressor.
Pipeline faults in natural gas systems may interrupt gas supply to gas turbines, reducing power generation capacity in urban distribution networks. Conversely, seismic damage to distribution lines can trigger power outages that shut down electrically driven compressors, ultimately diminishing gas load capacity in natural gas systems.
3.5. Repair Crew Dispatch Constraints
Given the complex topology and large scale of IENGSs, maintenance teams are assigned to distinct geographical zones. As shown in Figure 3, Before developing fault repair strategies, fault points must be clustered according to their proximity to maintenance depots. This approach partitions the system into manageable clusters, reducing the subsequent repair planning problem to cluster-specific route optimization for individual maintenance teams. In the figure, arrows of different colors point to different rectangles, which indicates that different maintenance stations repair the corresponding faults based on the assigned maintenance tasks. The methodology thus achieves significant dimensionality reduction in fault management.
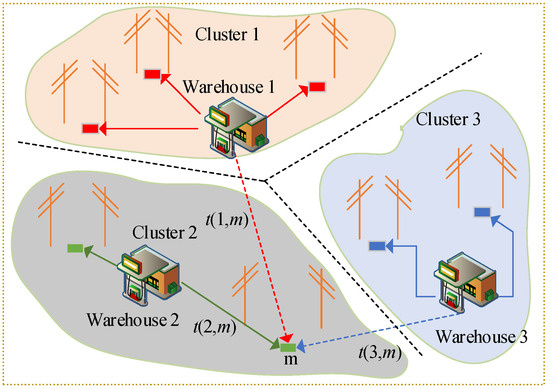
Figure 3.
Diagram of clustering method.
Building upon Reference [21], this paper categorizes fault components into X types. The number of clusters corresponds to available maintenance warehouses, indexed as σ = 1, 2, …, X. This pre-clustering transforms maintenance team dispatch into multiple vehicle routing problems (VRPs).
Constraint (33) specifies that each damaged component may be repaired by no more than one maintenance team; Constraint (34) suggests that after repairing damaged component d, the maintenance team immediately proceeds to the next damaged component; and Constraint (36) indicates that the maintenance team should depart from the warehouse.
where Cσ denotes the maintenance team responsible for repairing faults of type σ; denotes whether maintenance team c (for repairing faults of type σ) is repairing damaged component point d; denotes whether maintenance team c (for repairing faults of type σ) travels from repair point d to repair point s; and p represents a warehouse, so denotes whether maintenance team c (for repairing faults of type σ) travels from warehouse p to d.
Assuming maintenance teams travel between fault locations d and s, the sequential processing constraints—governing arrival times, repair durations, and travel intervals—are governed by:
In Constraint (37), and , respectively, represent the arrival time of maintenance team c at damaged component d and s; rd,c is the repair time taken by maintenance team c to fix damaged component d; and is the travel time of maintenance team c from d to s. Constraint (38) indicates that when the maintenance team has not passed through d, its arrival time at d is 0.
Constraint (39) ensures that each faulty component has only one repair completion time, avoiding repeated repairs. Constraints (40) and (41) jointly restrict the completion time of the repair. Constraint (41) is an auxiliary variable for the repair time.
where is a binary variable, indicating the repair status of damaged component d of type σ at time t. Specifically, = 1 means that damaged component d has been repaired at time t; and = 0 means that damaged component d has not been repaired at time t or the repair has been completed. This is the maintenance step, and represents when the damaged component d of type σ is repaired. Constraints (40) and (41) represent the calculation method of .
The working status of faulty components changes according to the completion of maintenance. The working status Constraint (43) for the components under repair are as follows:
where qd,t is a 0–1 variable indicating whether faulty component d has been repaired at time t; it takes a value of 1 if the repair is completed at this time, and 0 otherwise.
Constraints (44) and (45) indicate that the specific relationships between the working status and repair status of network components in each subsystem are as follows:
where and represent the power grid fault set and the gas grid fault set, respectively.
4. Case Study
In this paper, an improved IEEE 33-node distribution network and a 7-node natural gas network are adopted to verify the correctness and effectiveness of the proposed strategy. The models are solved using the Gurobi 11.0 solver with the YALMIP toolbox in MATLAB R2021a on a PC with an Intel Core i5 12500H CPU and 16 GB RAM.
4.1. A 33-Node Power System with a 7-Node Gas System
The power system includes two tie switches, namely c1 (12–22) and c2 (18–33). There are four DGs. DG1, DG2, DG3, and DG4 are installed in the distribution network at Nodes 1, 24, 33, and 22, respectively. The capacities of DG1 and DG2 are both 1.5 MW, while those of DG3 and DG4 are 1 MW each. The peak value of the total power load of the power system is 3.53 MW + 2.4 MVAR.
The natural gas system comprises two gas wells located at Nodes 6 and 7, respectively, with a peak total gas supply of 1400 Sm3/h. One power-consuming compressor connects natural gas system Nodes 2–4, which are powered by power system Node 25. Two gas turbines, GT1 and GT2, are installed at natural gas network Nodes 2 and 3, respectively, both with a capacity of 0.6 MW. The total gas load of the natural gas system is 850 Sm3/h [24].
4.2. Fault Analysis
It is assumed that nine faults occur in the system due to the earthquake disaster, as shown in Figure 4. Among them, F1–F6 are line break faults, F7 is a gas turbine operation fault, and F8 and F9 are natural gas pipeline faults. During the maintenance process, this section considers two distribution network maintenance stations and one natural gas network maintenance station, with one maintenance team in each station. The travel time is proportional to the distance between repair points, and the repair duration depends on the type of component to be repaired. For example, the repair duration for power grid lines is 1 h, the emergency repair duration for natural gas pipeline faults and the repair duration for gas turbines are 1 h and 2 h, respectively. The operation time of the tie switches is ignored, and it is assumed that the repaired components are put into use immediately and no further faults occur under normal circumstances.
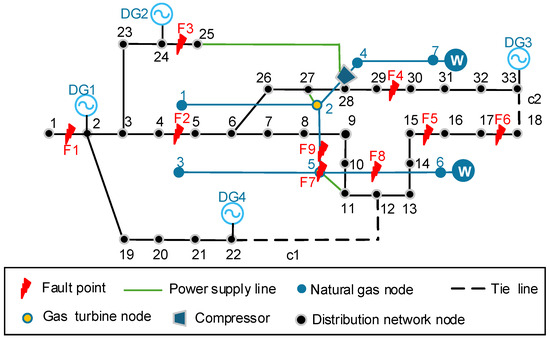
Figure 4.
Diagram of the IENGS disaster situation.
Fault F3 causes the compressor in the natural gas system to lose power supply and shut down, causing its downstream natural gas nodes to typically fail to supply gas. Meanwhile, due to faults F2, F4, F5, and F6, load interruption occurs at distribution network Nodes 5–17 and 26–29. Fault F1 causes a load interruption at distribution network Node 1. Faults F8 and F9 cause natural gas Nodes 3 and 5 to lose natural gas supply. Fault F7 causes gas turbine GT2 to fail to operate. After the earthquake, the distribution network load drops to 27% during regular operation, and the natural gas load drops to 38% during regular operation.
4.3. Resilience Enhancement Strategy of Only Post-Disaster Joint Maintenance
Exclusive implementation of the joint maintenance strategy for post-earthquake resilience enhancement yielded the repair sequencing and load restoration outcomes documented in Table 1 and Table 2. During Hours 0–2, unrepaired faults maintained minimal system loading. At Hour 3, the distribution network fault F3 repair restored the compressor power supply while the concurrent remediation of the natural gas fault F9 fully restored the gas system load; the distribution fault F4 repair additionally enabled partial restoration downstream of DG3. Subsequent repairs occurred as follows: faults F2 and F5 at Hour 5, gas turbine fault F7 at Hour 6, restoring generation capacity, distribution faults F1 and F6 at Hour 7, and finally, natural gas pipeline fault F8 at Hour 8, which established gas source connectivity at Node 6 to resume load supply. The fault recovery result is shown in Figure 5.

Table 1.
Maintenance sequence for resilience enhancement strategy (Only post-disaster joint maintenance).
Table 2.
Maintenance results for resilience enhancement strategy (Only post-disaster joint maintenance).
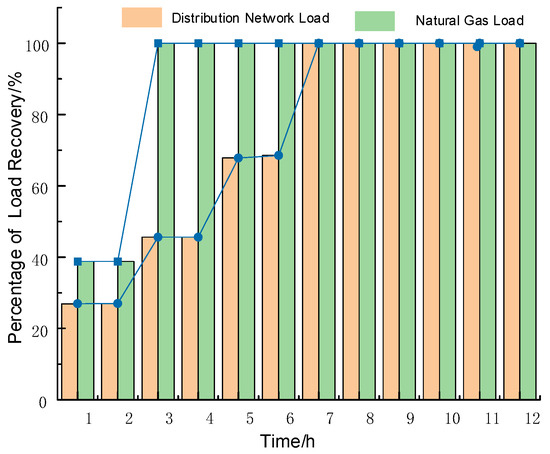
Figure 5.
Diagram of fault restoration results.
In Figure 5, blue blocks denote the load recovery amount of the power system, and solid circles denote that of the natural gas system. The lines connecting blue blocks constitute a line chart for visualizing the changes in power system load recovery, while the lines connecting solid circles serve the same purpose for the natural gas system—both are intended to help readers more clearly grasp the temporal variation characteristics of load recovery in the two systems.
4.4. Post-Disaster Maintenance Strategy for IENGSs Considering Natural Gas Line Pack
4.4.1. Fault Clustering Under Earthquake Disaster
Based on the aforementioned fault conditions, the results of the clustering analysis on the faults are shown in Figure 6.
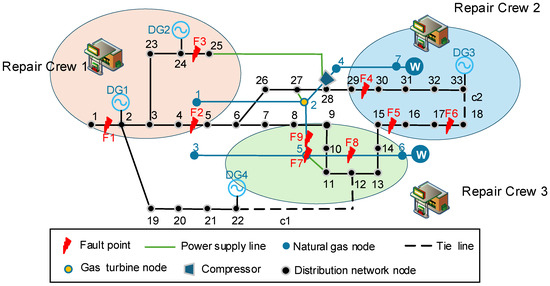
Figure 6.
Diagram of the fault clustering result.
It can be seen from Figure 6 that the faults are divided into three categories. Maintenance Team 1 and Maintenance Team 2 are responsible for the emergency repair of faulty lines in the distribution network. In contrast, Maintenance Team 3 is accountable for the emergency repair of the natural gas pipeline and gas turbine faults. The equivalent distance between faults of the same type is small. Through clustering analysis, the problem of collaborative maintenance of multiple fault points can be transformed into the problem of path optimization for a single maintenance team within a specific area, which reduces the situation’s complexity and improves the efficiency of emergency repairs.
4.4.2. Maintenance Strategy
Implementation of the proposed restoration strategy on the classified faults generates two key outcomes, where the repair sequence is detailed in Table 3 and the maintenance results are summarized in Table 4.
Table 3.
Maintenance sequence for IENGSs’ post-disaster strategy (Considering gas line pack).
Table 4.
Maintenance results for IENGSs’ post-disaster strategy (Considering gas line pack).
4.4.3. Analysis
After an earthquake disaster occurs, the strategy first activates the immediate emergency support of the natural gas line pack: by opening the valves of non-faulty pipelines to release the line pack, it provides a short-term gas supply for Nodes 1, 2, 3, and 5 in the natural gas system. Meanwhile, it relies on the gas turbine at Node 2 to convert the line pack into electrical energy, ensuring the critical load of Node 27 in the distribution network and preliminarily avoiding a complete interruption of both electrical and gas loads. At the maintenance scheduling level, the strategy formulates priorities based on the fault-propagation characteristics between the subsystems of the IENGS—Maintenance Team 1 prioritizes the repair of distribution network fault F3, as this fault directly causes power outage of the electrically driven compressor, which in turn leads to gas supply interruption in the downstream gas network; once repaired, the driving capacity of the compressor can be quickly restored to restart energy supply for the downstream gas network. Maintenance Team 2 prioritizes handling distribution network fault F4 to promptly resume power supply for the downstream load of the distributed generator (DG3), reducing reliance on the main power grid by leveraging local power sources. Maintenance Team 3 prioritizes the repair of natural gas pipeline fault F9 to reconnect the gas source at Node 6, thereby providing long-term and stable energy supply support for the gas network.
In the early post-disaster stage (first 2 h), as yet, no maintenance has been carried out, so the line pack surplus of Natural Gas Pipelines 1–2 is gradually depleted due to continuous energy supply. Meanwhile, Pipelines 3–5, with insufficient line pack storage to sustain long-term load demand, exhaust their line pack by the 2nd hour, leading to temporary gas supply interruption at Nodes 3 and 5 of the natural gas network. By the 3rd hour, faults F3, F4, and F9 are repaired simultaneously: the compressor regains power supply, the downstream load of DG3 is restarted, and Pipelines 3–5 resume normal gas transmission. Consequently, the natural gas network load achieves full recovery, and the distribution network load recovers to 66.8%. Temporal variations in residual line pack are quantified in Figure 7. In the figure, the bluer rectangles and solid circulars respectively represent the residual line pack values of different line pack at fixed time nodes; the lines connecting the squares and those connecting the circular boxes form two sets of intuitive variation trajectories respectively.
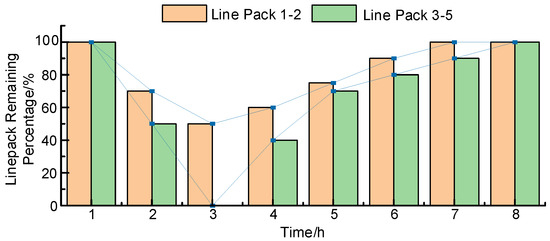
Figure 7.
Diagram of the line pack surplus variation.
As shown in Figure 8, the distribution network completes topology reconfiguration by immediately closing tie switches c1 (12–22) and c2 (18–33), quickly supplying power to the power-off areas near Node 12 and at Node 18. The arrows in the figure indicate the repair sequence of the maintenance teams. Coupled with the power supply from gas turbines that utilize line pack, the distribution network load is maintained at a baseline level of 44.9% after the disaster, preventing a significant drop in load. In the subsequent 5th hour, faults F2 and F6 (in the distribution network), as well as F8 (in the natural gas pipeline), are repaired: the distribution network further expands its power supply coverage, with the load recovery rate reaching 68%, while the gas network achieves a more stable energy supply via the gas source at Node 6.
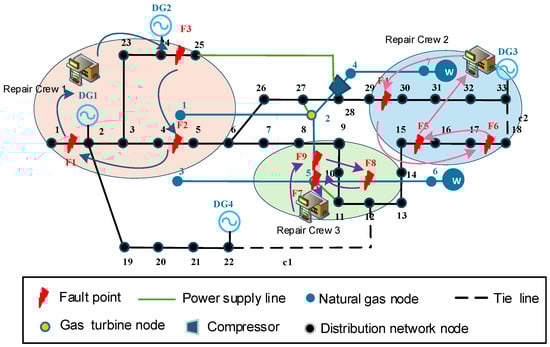
Figure 8.
Diagram of the faults repair and topological reconstruction.
By the 7th hour, following the repair of faults F1 and F5, the distribution network load achieves 100% full recovery; by the 8th hour, the repair of fault F7 (gas turbine) marks the completion of handling all critical faults in the IENGS, with the system fully resuming normal operation. As shown in Figure 9, the lines connecting the blue rectangles and solid circles reflect the variation trend during the load recovery process. Throughout the process, the short-term bridging role of natural gas line pack, the rapid energy supplementary role of topology reconfiguration, and the bottleneck-breaking role of priority-based maintenance achieve in-depth synergy. This not only resolves the “energy supply gap” in the early post-disaster stage but also accelerates the system’s recovery process through targeted maintenance, fully verifying the effectiveness and rationality of the proposed strategy in enhancing the IENGS’s post-earthquake resilience.
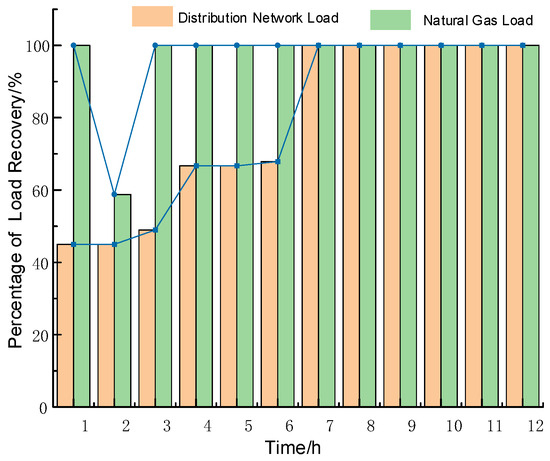
Figure 9.
Diagram of load restoration.
4.5. Study Comparison
To validate the feasibility and superiority of the proposed strategy, three distinct recovery cases are evaluated for urban integrated energy systems under seismic events. Comparative analysis of load restoration performance is conducted under identical earthquake-induced fault scenarios, with cases defined as:
- Case 1: No resilience enhancement strategy has been adopted.
- Case 2: Only the resilience enhancement strategy of joint maintenance is considered.
- Case 3: The resilience enhancement strategy proposed in this paper.
As evidenced in Figure 10 and Figure 11, Case 2 prioritized remediation of fault F3 by Maintenance Team 1 at Hour 3—a critical propagation point between electrical and gas subsystems. This intervention restored GT1 gas turbine operation and natural gas Nodes 1–5, increasing distribution network load recovery by 7.3% and natural gas system recovery by 51.2% versus Case 1, culminating in complete IENGS restoration.
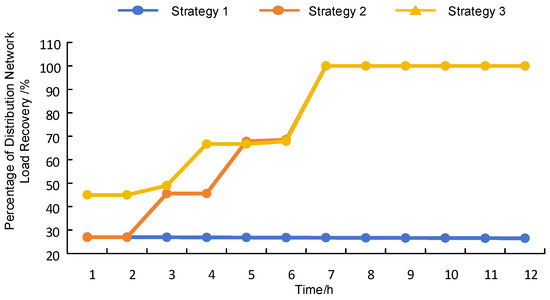
Figure 10.
Diagram of the comparison of load recovery for distribution networks.
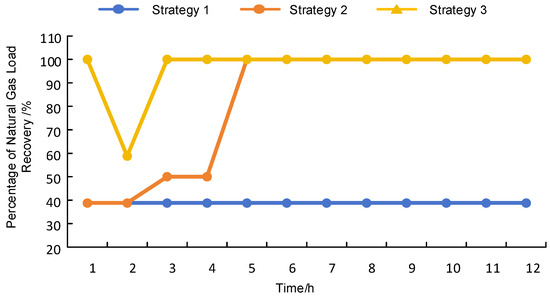
Figure 11.
Diagram of the comparison of load recovery for natural gas networks.
Case 3 leveraged the natural gas line pack to support partial gas system loads during Hours 0–2 post-earthquake. Concurrently, gas turbine generation combined with topology reconfiguration powered critical electrical loads. Maintenance teams systematically prioritized faults triggering cross-system cascading failures, achieving accelerated integrated energy system recovery.
In summary, post-earthquake natural gas line pack deployment provides critical short-term energy bridging for urban integrated energy systems. Concurrent topology reconfiguration via tie switches rapidly restores power to critical loads. The proposed cross-subsystem joint maintenance strategy minimizes load losses while coordinating switch operations to accelerate system-wide recovery. Case studies validate this line pack-integrated strategy’s efficacy in reducing seismic-induced load curtailment by 32.7%, compared to conventional approaches.
4.6. Verification of the Strategy for Systems of Different Scales
In this study, a modified IEEE 69-bus distribution network and a 20-node natural gas network are adopted to verify the correctness and effectiveness of the strategy proposed in this paper. For the power system, it includes three tie switches (namely C1 (46–66), C2 (27–65), and C3 (54–35)) and five distributed generators (DGs): DG1, DG2, DG3, DG4, and DG5 are installed at buses 1, 40, 10, 20, and 54 of the distribution network, respectively, with DG1 and DG2 each having a capacity of 2.5 MW, and DG3, DG4, and DG5, each 2 MW, and its peak total load is 8.53 MW + 4.4 MVAR. For the natural gas system, it comprises three gas wells (located at Nodes 1, 9, and 16 of the natural gas network, with a peak total gas supply of 2400 Sm3/h), three electricity-driven compressors (connecting Nodes 10–7, 9–10, and 17–18 of the natural gas system and powered by buses 46, 67, and 65 of the power system, respectively), and four gas turbines (GTs)—GT1, GT2, GT3, and GT4—are installed at Nodes 2, 7, 15, and 13 of the natural gas network, respectively, each with a capacity of 1 MW, and its total load is 1650 Sm3/h.
During the maintenance process, two distribution network maintenance stations and one natural gas network maintenance station are considered, with one maintenance team assigned to each station. The travel time is proportional to the distance between maintenance points, and the maintenance duration depends on the type of component being repaired—consistent with the previous test case. The operation time of tie switches is ignored, and it is assumed that the repaired components are put into use immediately after maintenance and no further faults occur under normal circumstances. The maintenance sequence is shown in Table 5.
Table 5.
Maintenance sequence for modified IEEE 69-bus & 20-node gas networks.
After an earthquake occurs, faults occur in the urban integrated energy system, as shown in Figure 12. Immediate actions are taken as follows: the natural gas pipeline storage is used to supply energy to Nodes 17–20 of the natural gas system; gas turbines GT1, GT2, and GT4 are utilized to supply power to Nodes 48, 18, and 57 of the distribution network; and tie lines C1 and C3 are closed to provide power to Nodes 66 and 35 of the distribution network. Considering the fault propagation among the subsystems of the urban integrated energy system, Maintenance Team 1 gives priority to repairing fault F1 of the distribution network to ensure that the power supply to Node 67 of compressor CP2 resumes load supply as soon as possible, thereby restoring gas supply to the downstream load of the compressor. Maintenance Team 2 prioritizes the repair of fault F5 of the distribution network to ensure the rapid recovery of the downstream load of DG4; meanwhile, tie line C2 is closed to restore the power supply of compressor CP3 as soon as possible. Maintenance Team 3 gives priority to repairing fault F8 of the natural gas system to ensure that the natural gas source connected downstream of Node 17 resumes energy supply as quickly as possible.
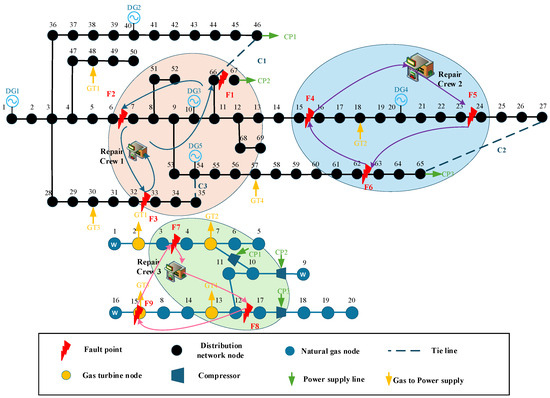
Figure 12.
Diagram of the Faults Repair.
The load recovery process is shown in the Figure 13. Through the lines formed by the blue rectangles and solid circles, it can be intuitively observed that the load recovery strategy proposed in this study has effectively improved the system’s load recovery efficiency in a short period of time, and enhanced the resilience of the urban integrated system under earthquake disasters.
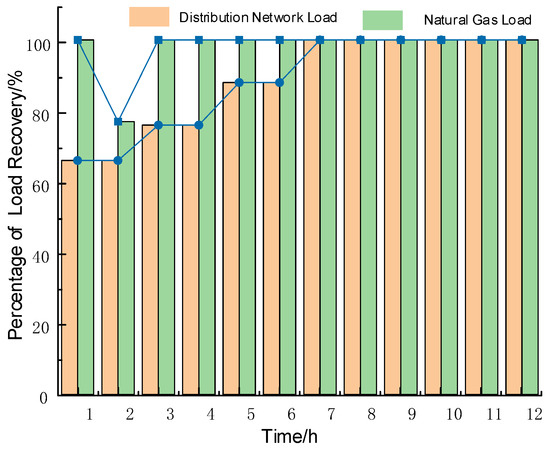
Figure 13.
Diagram of load restoration for the modified IEEE 69-bus and 20-node gas networks.
5. Conclusions
This study addresses the challenge of significant load loss in IENGSs caused by earthquakes, with the primary goal of enhancing the post-disaster resilience of urban integrated energy systems. To this end, a joint post-disaster restoration strategy integrating natural gas line pack utilization, distribution network topology reconfiguration, and cross-subsystem coordinated maintenance is proposed, and its effectiveness and strong applicability are verified via case studies.
First, regarding natural gas line pack, this study establishes a model quantifying the relationships between pipeline pressure, structural parameters, and gas storage capacity. In the early post-earthquake phase (before maintenance begins), the strategy activates emergency line pack release in non-faulty pipelines to supply short-term gas to key nodes in the gas system, while supporting gas turbine power generation to sustain critical electrical loads in the distribution network. This “short-term energy bridging” function effectively prevents total IENGS load collapse, laying a foundation for subsequent restoration.
Second, in system operation optimization, the strategy leverages distribution network topology reconfiguration—via immediate closure of tie switches—to rapidly reconnect power-outage areas, expand the supply range of distributed generators (DGs), and reduce reliance on the main grid. In maintenance scheduling, it prioritizes repairing faults triggering cross-subsystem cascading propagation (e.g., restoring power to electrically driven compressors or reconnecting gas sources). This priority mechanism breaks fault-propagation chains, significantly accelerating overall system recovery.
Case studies on modified IEEE distribution networks and natural gas systems demonstrate that the proposed strategy outperforms “no resilience enhancement” and “joint maintenance-only” strategies in load recovery: it maintains stable baseline load in the early post-disaster phase, achieves full system restoration, and avoids prolonged gas supply interruptions. Further validation in larger-scale systems confirms the strategy’s effectiveness across different scales, verifying its scalability.
Despite these contributions, this study has limitations: the used natural gas pipeline model is relatively simplified, potentially introducing minor errors in line pack calculations; additionally, key economic factors—including maintenance crew deployment costs, equipment investment for distribution network topology reconfiguration, and economic losses reduced by faster load recovery—remain unquantified. This hinders a full assessment of the strategy’s cost-effectiveness for real-world application.
In future research, a more detailed transient natural gas pipeline model will be integrated to refine line pack dynamic simulations, boosting the strategy’s calculation accuracy and practicality. A cost–benefit framework will also be built, incorporating indicators such as maintenance costs, supporting facility investment, and reduced disaster-induced losses, to verify the strategy’s economic feasibility while preserving its resilience benefits. Furthermore, real-world constraints (e.g., maintenance-related traffic delays, dynamic load priority adjustments) will be added to better align the strategy with practical engineering scenarios.
Author Contributions
Conceptualization, W.L. and X.W.; methodology, Y.W. (Yuwei Wang); software, Y.C.; validation, Y.C. and Y.W. (Yong Wang); formal analysis, J.G.; investigation, B.L.; resources, X.W.; data curation, W.L.; writing—original draft preparation, X.W.; writing—review and editing, Y.W. (Yuwei Wang); visualization, W.L.; supervision, Y.C.; project administration, Y.W. (Yong Wang); funding acquisition, X.W. All authors have read and agreed to the published version of the manuscript.
Funding
This research was funded by the State Grid Jilin Province Electric Power Co., Ltd. “Research on Strategies for Undertaking the Primary Responsibility of Central Enterprises in Energy Supply Guarantee and Enhancing the Disaster Prevention and Resistance Emergency Capability of Jilin Power Grid”. Project number SGJLJY00ZLWT2500045.
Data Availability Statement
The original contributions presented in this study are included in this article. Further inquiries can be directed to the corresponding author.
Conflicts of Interest
Authors Yuwei Wang, Boqiang Li, Yong Wan, Yunfei Chu were employed by the company Economic and Technological Research Institute of State Grid Jilin Electric Power Co., Ltd., Author Jian Gao was employed by the company Songyuan Power Supply Company of State Grid Jilin Electric Power Co., Ltd. The remaining authors declare that the research was conducted in the absence of any commercial or financial relationships that could be construed as a potential conflict of interest.
Abbreviations
The following abbreviations are used in this manuscript:
| IENGS | Integrated electricity and natural gas systems |
| DGs | Distributed generators |
| P2G | Power-to-Gas |
| GT | Gas turbine |
References
- Bie, Z.; Lin, Y.; Li, G. Battling the extreme: A study on the power system resilience. Proc. IEEE 2017, 105, 1253–1266. [Google Scholar] [CrossRef]
- IEC. Microgrids for Disaster Preparedness and Recovery. 2014. Available online: https://www.iec.ch/basecamp/microgrids-disaster-preparedness-and-recovery-electricity-continuity-plans-and-systems (accessed on 5 July 2025).
- CGTV. Tremor Felt as a 6.4-Magnitude Quake Hits Taiwan. 2019. Available online: https://news.cgtn.com/news/2019-08-08/Taiwan-hit-by-6-4-magnitude-quake-IYRy1GJxe0/index.html (accessed on 6 August 2025).
- Zou, Q.; Yan, L. The Coupling Mechanism of the Electricity–Gas System and Assessment of Attack Resistance Based on Interdependent Networks. Eng 2025, 6, 193. [Google Scholar] [CrossRef]
- Williams, B.L.M.; Croft, H.; Hunt, J.; Viloria, J.; Sherman, N.; Oliver, J.; Green, B.; Turchin, A.; Martínez, J.B.G.; Pearce, J.M. Wood Gasification in Catastrophes: Electricity Production from Light-Duty Vehicles. Energy Eng. 2025, 122, 1265–1285. [Google Scholar] [CrossRef]
- Peng, L.; Zhou, A.; Qiao, J.; Sun, Q.; Qian, Z.; Xu, M.; Pan, S. A Two-Stage Restoration Method for Distribution Networks Considering Generator Start-Up and Load Recovery Under an Earthquake Disaster. Electronics 2025, 14, 3049. [Google Scholar] [CrossRef]
- Khodaei, A. Resiliency-oriented microgrid optimal scheduling. IEEE Trans. Smart Grid 2014, 5, 1584–1591. [Google Scholar] [CrossRef]
- Wu, B.; Tan, Z.; Che, A.; Cui, L. A Novel Resilience Assessment Framework for Multi-component Critical Infrastructure. IEEE Trans. Eng. Manag. 2024, 71, 14011–14031. [Google Scholar] [CrossRef]
- Nazemi, M.; Moeini-Aghtaie, M.; Fotuhi-Firuzabad, M.; Dehghanian, P. Energy Storage Planning for Enhanced Resilience of Power Distribution Networks Against Earthquakes. IEEE Trans. Sustain. Energy 2020, 11, 795–806. [Google Scholar] [CrossRef]
- Fang, J.; Wang, H.B.; Liu, Y.Q.; He, J.; Tian, Y.; Zhang, H. Rolling optimization decision strategy of dynamic repairing in power distribution network after disasters. South. Power Syst. Technol. 2021, 15, 122–128. [Google Scholar] [CrossRef]
- Zhu, X.Y.; Liu, X.R.; Hou, M.; Wang, R.; Sun, Q.Y. Multi-timescale Resilience Enhancement Method for Integrated Energy System Under Earthquake Disaster. Autom. Electr. Power Syst. 2025, 49, 89–98. [Google Scholar] [CrossRef]
- Arif, A.; Wang, Z.Y.; Wang, J.H.; Chen, C. Power distribution system outage management with co-optimization of repairs, reconfiguration, and DG dispatch. IEEE Trans. Smart Grid 2018, 9, 4109–4118. [Google Scholar] [CrossRef]
- Yang, L.J.; Lyu, X.J.; Li, D.; Wang, M.; Lu, Z.G.; Yu, Q. Coordinated optimization strategy of multi-fault repair and recovery for distribution network with distributed generators. Autom. Electr. Power Syst. 2016, 40, 13–19. [Google Scholar] [CrossRef]
- Chen, B.; Ye, Z.G.; Chen, C.; Wang, J.H.; Tao, D.; Bie, Z.H. Toward a synthetic model for distribution system restoration and crew dispatch. IEEE Trans. Power Syst. 2019, 34, 2228–2239. [Google Scholar] [CrossRef]
- Lin, Y.L.; Chen, B.; Wang, J.H.; Bie, Z.H. A combined repair crew dispatch problem for resilient electric and natural gas system considering reconfiguration and DG islanding. IEEE Trans. Power Syst. 2019, 34, 2755–2767. [Google Scholar] [CrossRef]
- Alvarado, D.; Moreno, R.; Street, A.; Panteli, M.; Mancarella, P.; Strbac, G. Co-Optimizing Substation Hardening and Transmission Expansion Against Earthquakes: A Decision-Dependent Probability Approach. IEEE Trans. Power Syst. 2023, 38, 2058–2070. [Google Scholar] [CrossRef]
- Liu, C.; Shahidehpour, M.; Wang, J. Coordinated scheduling of electricity and natural gas infrastructures with a transient model for natural gas flow. Chaos Interdiscip. J. Nonlinear Sci. 2011, 21, 025102. [Google Scholar] [CrossRef]
- Navarro, R.; Rojas, H.; Luyo, J.E.; Silva, J.L.; Molina, Y.P. Impacts of Natural Gas Pipeline Congestion on the Integrated Gas–Electricity Market in Peru. Energies 2024, 17, 4586. [Google Scholar] [CrossRef]
- Chen, Y.; Zhu, J.; Ji, H.; Zhou, X. Day-ahead Optimal Scheduling for Integrated Energy System Considering the Line Pack of Gas Network. In Proceedings of the 2021 IEEE Sustainable Power and Energy Conference (iSPEC), Nanjing, China, 23–25 December 2021; pp. 965–969. [Google Scholar] [CrossRef]
- Zhang, X.P.; Che, L.; Shahidehpour, M.; Alabdulwahab, A.; Abusorrah, A. Electricity-natural gas operation planning with hourly demand response for deployment of flexible ramp. IEEE Trans. Sustain. Energy 2016, 7, 996–1004. [Google Scholar] [CrossRef]
- Clegg, S.; Mancarella, P. Integrated electrical and gas network flexibility assessment in low-carbon multi-energy systems. IEEE Trans. Sustain. Energy 2016, 7, 718–731. [Google Scholar] [CrossRef]
- Li, Y.; Xiao, J.X.; Chen, C.; Tan, Y.; Cao, Y.J. Service restoration model with mixed-integer second-order cone programming for distribution network with distributed generations. IEEE Trans. Smart Grid 2018, 10, 4138–4150. [Google Scholar] [CrossRef]
- Wang, K.Q.; Zhao, P.Y.; Wang, C.J.; Zhang, Z.M.; Zhang, Y.; Lu, J.; Yang, Z.D. Resilience-Oriented Load Restoration Method and Repair Strategies for Regional Integrated Electricity-Natural Gas System. Energy Eng. 2024, 121, 1091–1108. [Google Scholar] [CrossRef]
- Li, G.Q.; Yan, K.F.; Zhang, R.F.; Jiang, T.; Li, X.; Chen, H.H. Resilience-oriented distributed load restoration method for integrated power distribution and natural gas systems. IEEE Trans. Sustain. Energy 2021, 13, 341–352. [Google Scholar] [CrossRef]


Disclaimer/Publisher’s Note: The statements, opinions and data contained in all publications are solely those of the individual author(s) and contributor(s) and not of MDPI and/or the editor(s). MDPI and/or the editor(s) disclaim responsibility for any injury to people or property resulting from any ideas, methods, instructions or products referred to in the content. |
© 2025 by the authors. Licensee MDPI, Basel, Switzerland. This article is an open access article distributed under the terms and conditions of the Creative Commons Attribution (CC BY) license (https://creativecommons.org/licenses/by/4.0/).