Article

A Blockchain-Based System for Monitoring Sobriety and Tracking Location of Traffic Drivers

by
Mihaela Gavrilă
1,*,
Mădălina-Giorgiana Murariu
1,
Delia-Elena Bărbuță
2,
Marin Fotache
3,
Lucian Trifina
1 and
Daniela Tărniceriu
1,*
1
Department of Telecommunication and Information Technologies, “Gheorghe Asachi” Technical University, 700050 Iași, Romania
2
Department of Computer Science and Engineering, “Gheorghe Asachi” Technical University, 700050 Iași, Romania
3
Department of Accounting, Business Information Systems and Statistics, Alexandru Ioan Cuza University, 700506 Iași, Romania
*
Authors to whom correspondence should be addressed.
Electronics 2025, 14(18), 3728; https://doi.org/10.3390/electronics14183728
Submission received: 4 August 2025 / Revised: 8 September 2025 / Accepted: 18 September 2025 / Published: 20 September 2025

Abstract

This paper presents the design and implementation of a blockchain-secured system for monitoring driver sobriety and real-time geolocation. The proposed platform integrates a Modular Sensor Battery (MSB) for detecting alcohol concentration in exhaled air, a centralized Data Collection Platform (DC Platform) for real-time data visualization and storage, and a complementary physiological monitoring device—the IoT Fit-Bit Smart Band (IFSB)—which captures heart rate and blood oxygen saturation as alternative indicators when breath-based sensing may be compromised. The MSB, the DC Platform, integration with the IoT FitBit Smart Band, and the blockchain-based data management architecture represent the authors’ direct contribution to both the conceptual design and technical implementation. These elements are introduced as part of a unified, fully integrated system designed to enable non-invasive sobriety monitoring and secure data integrity in vehicular contexts. To ensure data authenticity, a custom Ethereum smart contract stores cryptographic hashes of sensor readings, enabling decentralized, tamper-evident verification without exposing sensitive medical information. The system was validated in a controlled experimental environment, confirming its operational robustness and demonstrating its potential to improve road safety through secure, real-time sobriety detection and geolocation tracking.

1. Introduction

Impaired driving, particularly due to alcohol consumption, remains one of the most pressing issues in road safety and public health worldwide. Conventional methods for detecting alcohol impairment—such as breathalyzers and blood tests—have notable limitations, including invasiveness, delays in result processing, and dependence on coincidental law enforcement interventions. Additionally, these methods lack continuous, real-time monitoring and geolocation, which are essential for effectively identifying and addressing incidents of impaired driving. Consequently, there exists an urgent need for innovative systems that provide immediate and accurate detection of alcohol levels in dynamic environments like moving vehicles, while integrating seamlessly with existing safety infrastructures.
Alcohol-impaired driving remains a critical public health and road safety concern, with conventional detection methods—such as breathalyzers and blood tests—limited by their invasiveness, response latency, and lack of real-time geolocation capabilities [1,2]. These limitations hinder timely intervention and reduce overall effectiveness, particularly in dynamic environments such as traffic scenarios or mass gatherings [3]. As alcohol-related incidents continue to pose substantial risks even at low blood alcohol levels, the World Health Organization and national authorities have emphasized the need for proactive monitoring and prevention strategies [4].
Recent advancements in sensor technologies, IoT, and blockchain technology have catalyzed the development of integrated, real-time detection systems that overcome many of the limitations of traditional tools [5,6]. These non-invasive platforms enable the continuous monitoring of physiological parameters and environmental conditions, allowing for automated interventions—such as vehicle lockout—when alcohol levels exceed safety thresholds [7,8]. In this context, initiatives like the Driver Alcohol Detection System for Safety (DADSS), initiated in the U.S., aim to integrate breath- and touch-based alcohol sensors directly into vehicle systems to prevent impaired driving [9,10].
Blockchain technology ensures the integrity and confidentiality of sensitive data through a decentralized, tamper-resistant architecture—an essential feature in legal, insurance, and privacy-sensitive contexts [11,12,13,14].
A range of novel sensing methods has been explored, from metal oxide gas sensors and MXene-based platforms to infrared spectroscopy and transdermal alcohol detection, all aiming to deliver real-time or near-real-time monitoring with minimal user intrusion [15,16,17,18]. These systems are increasingly being embedded into various parts of the vehicle, such as steering columns or door panels, and benefit from energy-efficient solutions like NFC-powered sensors that eliminate the need for onboard batteries [19,20,21]. Some applications have even extended to smart facemasks or smartphones, demonstrating the scalability and flexibility of these technologies beyond automotive contexts [8,22].
Despite rapid technological progress, implementation challenges remain. These include integration with vehicle systems, regulatory compliance, privacy protection, and the development of robust software applications capable of handling secure and accurate data aggregation [23]. Nevertheless, the convergence of IoT, AI, and blockchain technologies provides a promising foundation for scalable, secure, and adaptive alcohol detection systems.
In response to current limitations, recent studies have proposed systems capable of collecting multimodal data—including alcohol concentration, environmental conditions, vehicle telemetry, and video recordings—through onboard instrumentation [24]. This data can be transmitted and stored in cloud platforms for subsequent analysis and validation against breath alcohol reference sensors in real driving conditions [5]. Such experimental frameworks are essential for evaluating the accuracy, precision, and real-world applicability of emerging sensor technologies [25]. Additionally, gas sensors are being assessed not only for their functional stability under repeated use and vehicle mileage, but also for their capacity to monitor driver behavior and user satisfaction [26]. However, the main challenge remains the development of unobtrusive systems that do not require driver interaction, despite the mechanical and technological complexity involved [27].
The integration of these systems into vehicles is still an emerging field, but is progressing rapidly through the use of existing Internet of Things (IoT) architectures. IoT provides essential advantages, such as modularity, low-power consumption, and cost-effectiveness, which are critical for scalable deployment [28]. To ensure data integrity and prevent tampering, blockchain technologies have been introduced as a secure data layer, enhancing the reliability of sensor outputs, especially in sensitive or legal contexts [29].
In this context, the present research introduces a comprehensive solution that integrates a Modular Sensor Battery (MSB), an IoT FitBit Smart Band Bracelet (IFSB) and a Data Collection Platform (DC Platform). This system combines advanced gas sensing technologies, real-time geolocation, and blockchain-based data management with machine learning-driven analysis to deliver non-invasive, high-fidelity alcohol detection and physiological monitoring. The approach addresses key gaps in current solutions by providing timely, secure, and reliable data in mobile environments, with implications for road safety, public health, and occupational security.
This paper aims to present the development of an integrated, non-invasive system capable of the real-time detection of alcohol concentration in exhaled air, the monitoring of vital signs, and the precise geolocation of the evaluated individual. Central to this system are two key components: a Data Collection Platform (DC Platform) and a Modular Sensor Battery (MSB). The structure of the paper is organized as follows: Section 2 describes the overall system architecture through a block diagram, emphasizing the integration of sensor technology with blockchain mechanisms to ensure the confidentiality and integrity of data. This section also outlines the hardware and software configurations, focusing on the sensor’s accuracy and reliability for effective real-time monitoring. Section 3 details the experimental setup used to evaluate system performance, including methodologies for alcohol concentration measurement, physiological data acquisition, and geolocation. Section 4 presents the results of system validation in a controlled environment. The final section synthesizes the key findings, highlighting the system’s effectiveness in alcohol detection and user localization, as well as the role of blockchain in ensuring data trustworthiness. The novelty of our system lies in several integrative features:
(i)
A dual-channel monitoring strategy that combines breath-based alcohol sensing with physiological indicators (heart rate and SpO2), thereby increasing robustness against environmental interference and sensor limitations;
(ii)
Real-time blockchain integration at the microcontroller level, with hashes computed before transmission, ensuring tamper-proof integrity;
(iii)
A modular, scalable design enabling interoperability with existing vehicular and IoT infrastructures.

2. System Description

The System Description section consists of subsections focusing on block diagram, sensors, and the confidentiality of information and blockchain technology.
In the Block Diagram subsection, the structure of the proposed system is described through a block diagram, illustrating the integration of sensors and a control unit (CU), and the implementation of blockchain technology to safeguard confidentiality.
The sensors subsection elaborates on the types and functionalities of sensors integrated into the system. It discusses their roles in data acquisition, the specific parameters they monitor, and how they contribute to the system’s overall accuracy and efficiency. The discussion includes an overview of the sensor technology, highlighting the precision and reliability of the sensors used, and how to ensure optimal performance in real-time monitoring and data collection processes.
The Confidentiality of Information and Blockchain Technology subsection presents the strategies adopted to ensure data confidentiality, emphasizing the use of blockchain technology. It describes the role of blockchain in enhancing security through its decentralized nature, transparency, and immutable record-keeping.

2.1. Block Diagram

The block diagram for the proposed system is presented in Figure 1.
The Modular Sensor Battery (MSB) is equipped with three sensors—an MQ-3 alcohol sensor—manufactured by Hanwei Electronics Group Corporation, Zhengzhou, China, an HC-SR04 distance sensor—manufactured by Microchip Technology Inc., Chandler, AZ, USA, and a NEO-6—GPS sensor—manufactured by U-blox AG, Thalwil, Switzerland—which communicate with a Raspberry Pi 4 Model B microcontroller, manufactured by Raspberry Pi Ltd., Pencoed, UK. In our previous work [30], this module drew power from the vehicle’s battery, connected automatically to open internet sources, and was activated when the vehicle ignition reached position 2/3. In this work, the module is connected to the power grid and positioned above the driver’s head in a fixed location and connects to available internet sources. The GPS sensor provides precise location data, while the distance sensor measures proximity between the driver and the MSB. The Raspberry Pi microcontroller aggregates this data and sends it to the PostgreSQL Database, and then the hashes of that data are computed, packed into a transaction, and sent to the blockchain.
To explicitly ensure confidentiality, the block diagram incorporates a security layer in which sensor readings are hashed directly on the microcontroller before transmission. These hashes are then stored on the blockchain, guaranteeing that all subsequent data displayed by the DC Platform is cryptographically verifiable and tamper-proof. This mechanism eliminates the risk of local manipulation and ensures that confidentiality is enforced at the architectural level.
The positioning of the MSB was carefully calibrated to avoid obstruction of the driver’s visual field. Preliminary user feedback confirmed that the placement above the head does not interfere with visibility. Moreover, the HC-SR04 distance sensor compensates for natural head movements, reducing detection bias and ensuring consistent measurements.
Simultaneously, the IoT FitBit Smart Band Bracelet (IFSB) adds another layer of monitoring by continuously tracking vital health indicators, specifically heart rate ( B P M ) and blood oxygen levels ( S p O 2 ). The IFSB data is also sent to the database. This health data is transmitted in real-time.

2.2. Hardware and Software Setup

2.2.1. Modular Sensor Battery

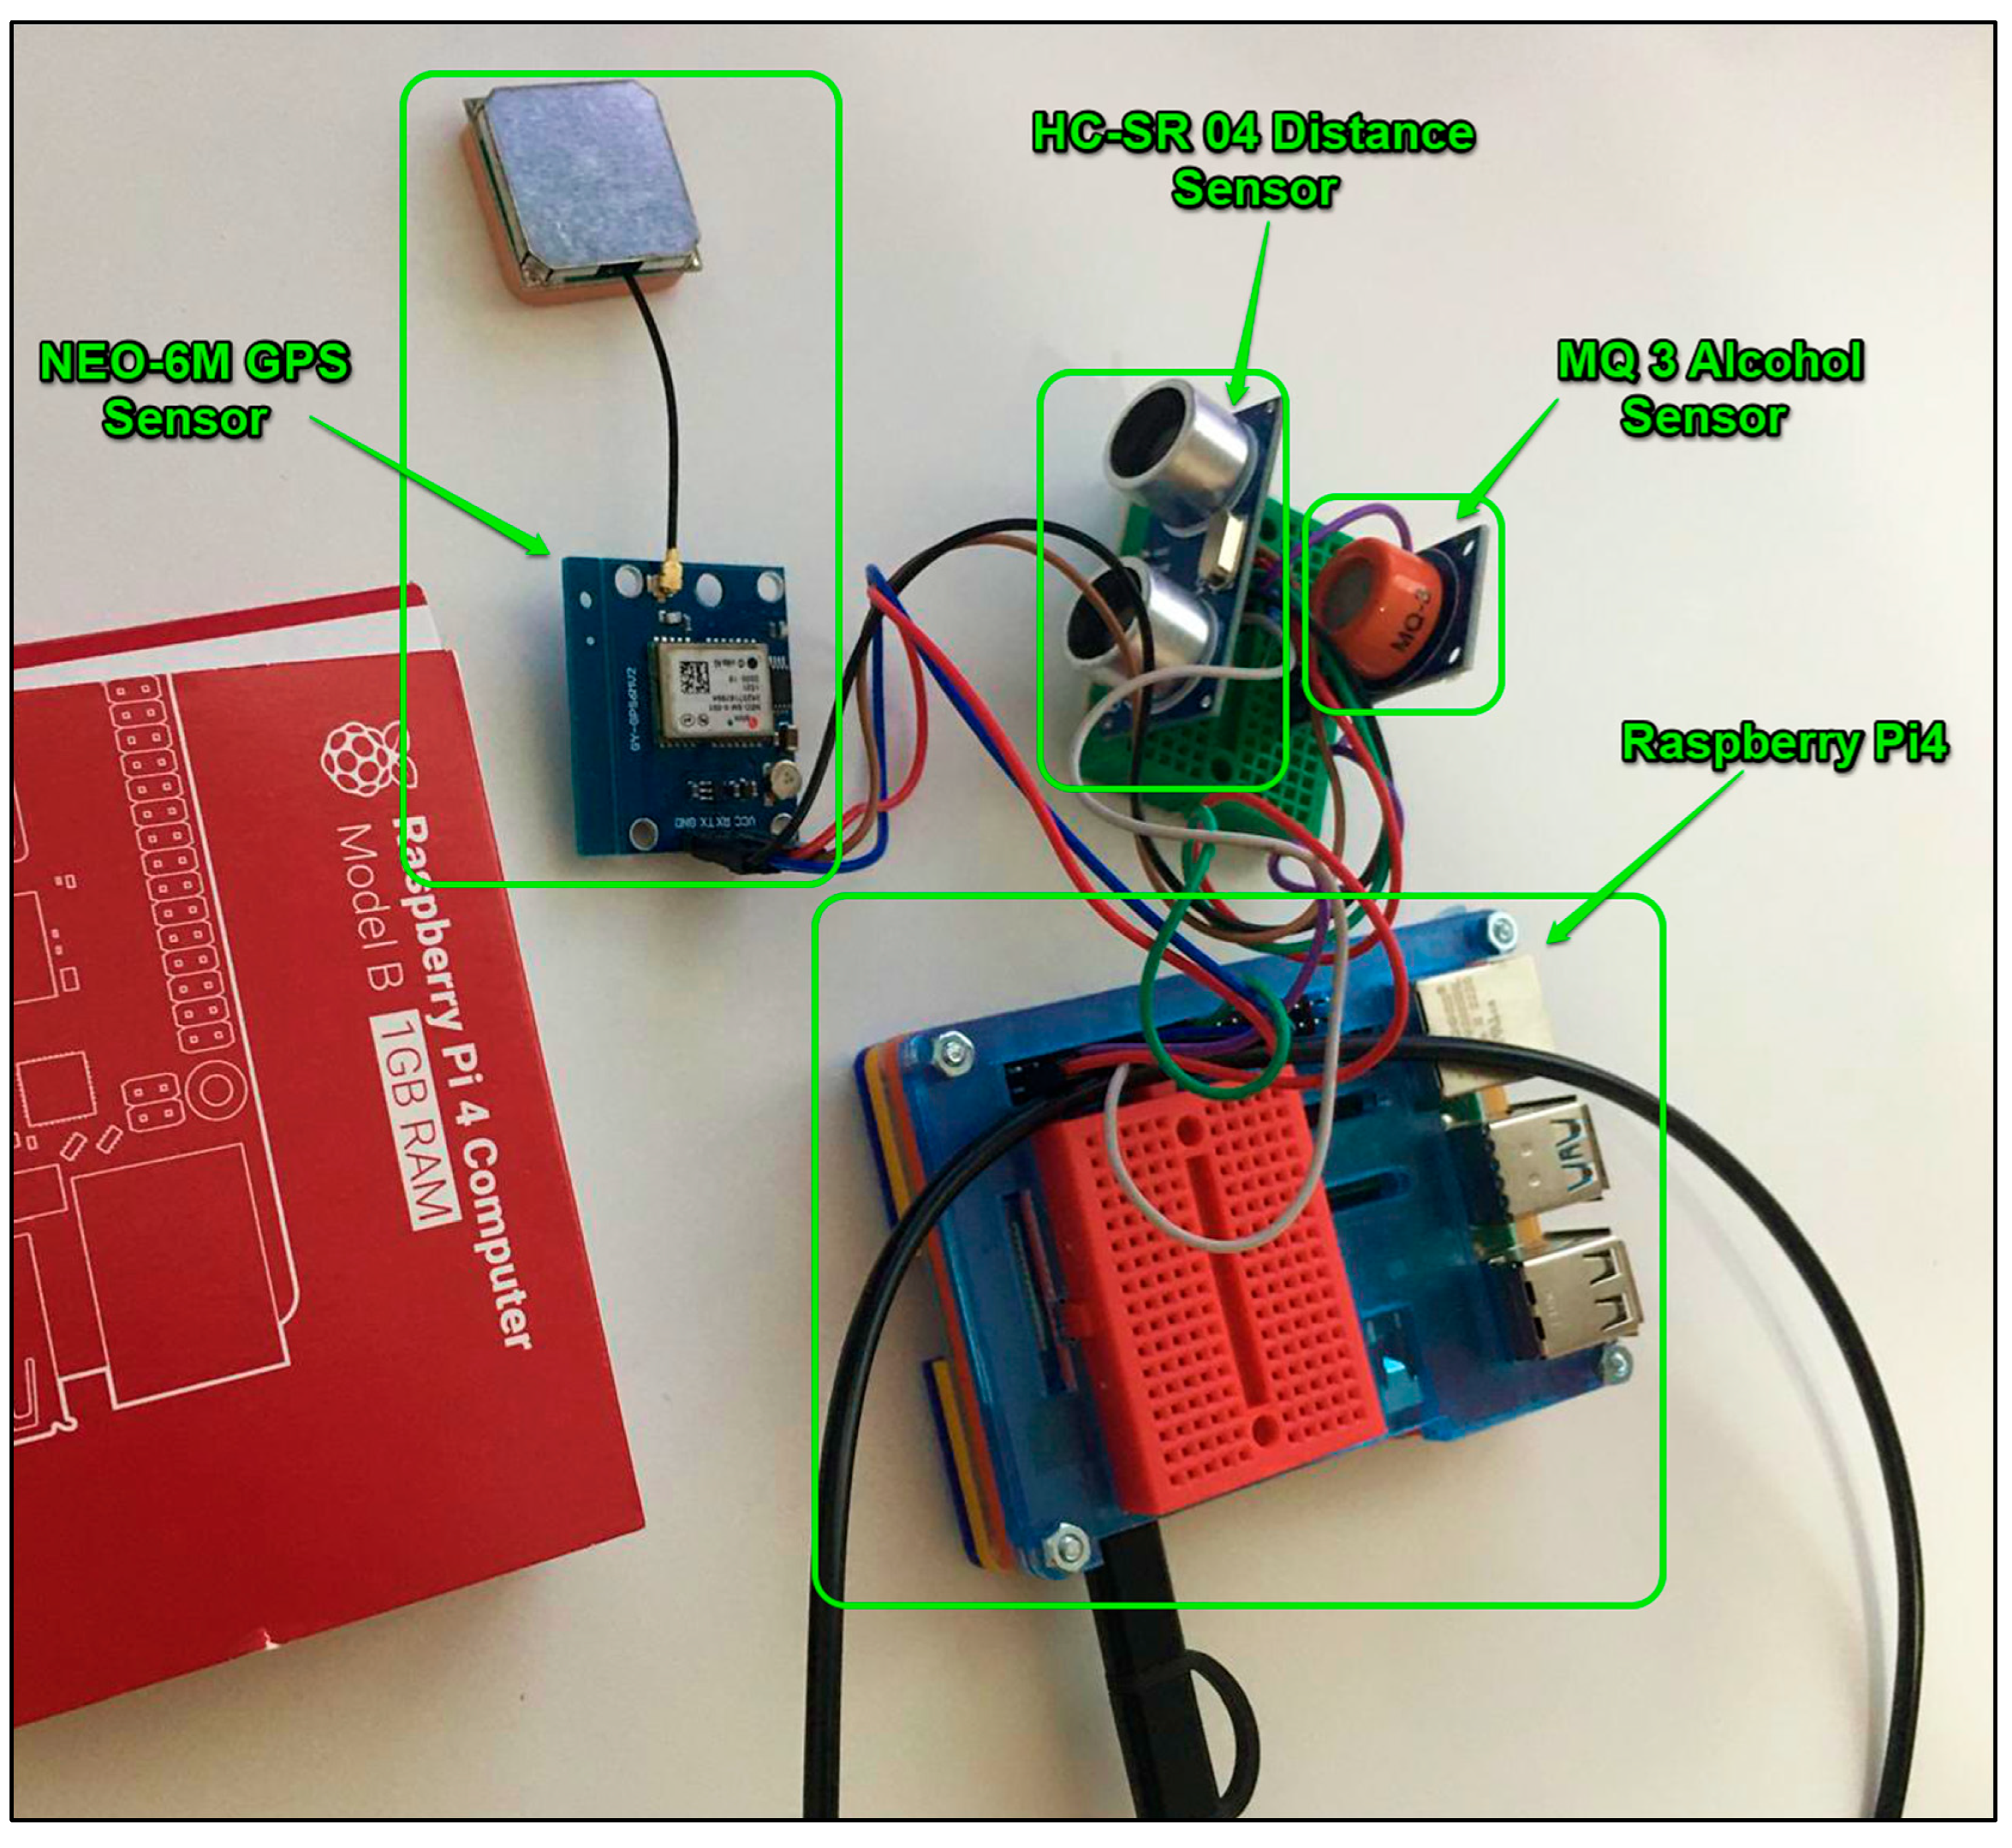
The Modular Sensor Battery (MSB) integrates several components essential for the real-time monitoring of alcohol concentration and driver location, as presented in Figure 2 [31].
This setup includes the MQ-3 Alcohol Sensor, the HC-SR04 Distance Sensor, the U-blox NEO-6 GPS Sensor, and a Raspberry Pi 4 Model B microcomputer, featuring a 1.5 GHz quad-core processor and 1 GB LPDDR4 RAM.
The MQ-3 Alcohol Sensor, chosen for its effectiveness as a breathalyzer, is particularly sensitive to alcohol while maintaining low sensitivity to other substances, like benzene. The sensor utilizes tin oxide ( S n O 2 ) as its primary detection material, which exhibits low conductivity in clean air. However, when alcohol vapors are present, the conductivity of S n O 2 increases proportionally to the alcohol concentration. This change in conductivity is measured by a resistive circuit, converting it into an output signal that reflects the detected alcohol levels [32].
The MQ-3 sensor demonstrated an average response time of 10–30 s, a measurement precision of approximately ±0.05 mg/L BrAC, and error margins below 5% under laboratory conditions. These specifications, validated through calibration trials, strengthen confidence in the stability and reliability of the detection module.
The U-blox NEO-6M GPS module is a compact, high-precision geolocation sensor designed for real-time positioning applications. It features a 50-channel GPS engine and operates at a 5 Hz update rate, providing raw data outputs suitable for accurate tracking even in suboptimal signal conditions. The module supports high-resolution measurements, including carrier phase and Doppler data, and employs Precise Point Positioning (PPP) algorithms for enhanced accuracy. The module includes integrated support for satellite-based augmentation systems such as the Wide Area Augmentation System (WAAS) and the European Geostationary Navigation Overlay Service (EGNOS), which enhance the accuracy of geolocation data. Communication is facilitated through a configurable Universal Asynchronous Receiver–Transmitter (UART) interface, utilizing standard protocols defined by the National Marine Electronics Association (NMEA) [33].
The HC-SR04 Distance Sensor is an ultrasonic sensor designed to measure distances from 2 cm up to 400 cm without making physical contact with the object. It operates based on the principle of ultrasonic echo, utilizing two key components: an ultrasonic transmitter and a receiver. The transmitter emits ultrasonic waves, which travel through the air and reflect back to the receiver upon striking an object. By measuring the time interval between emission and echo reception, the sensor calculates the distance, given that the speed of sound in air is approximately 343 m per second [34].
The Raspberry Pi 4 Model B was selected based on its hardware specifications, which make it suitable for a broad spectrum of applications ranging from multimedia processing to computationally demanding tasks. It features a 64-bit quad-core processor that delivers a comparable performance to entry-level desktop systems. The board includes 4 GB of RAM, dual micro-HDMI ports supporting dual-display output at resolutions up to 4K, and hardware video decoding capabilities up to 4Kp60. Additionally, it offers dual-band wireless connectivity (2.4/5.0 GHz), Bluetooth 5.0, Gigabit Ethernet, USB 3.0 interfaces, and Power over Ethernet (PoE) support via an optional PoE HAT. This component was chosen due to its balanced combination of processing power, connectivity, and multimedia capabilities, which are critical to the successful implementation of the proposed system [35,36].
In the present prototype, the MSB was powered from the laboratory grid. However, the system is designed for in-vehicle integration, where it can operate from the car’s battery with an average power consumption below 2 W, ensuring sustainable and long-term deployment without significantly affecting the vehicle’s energy resources.

2.2.2. The IoT FitBit Smart Band Bracelet

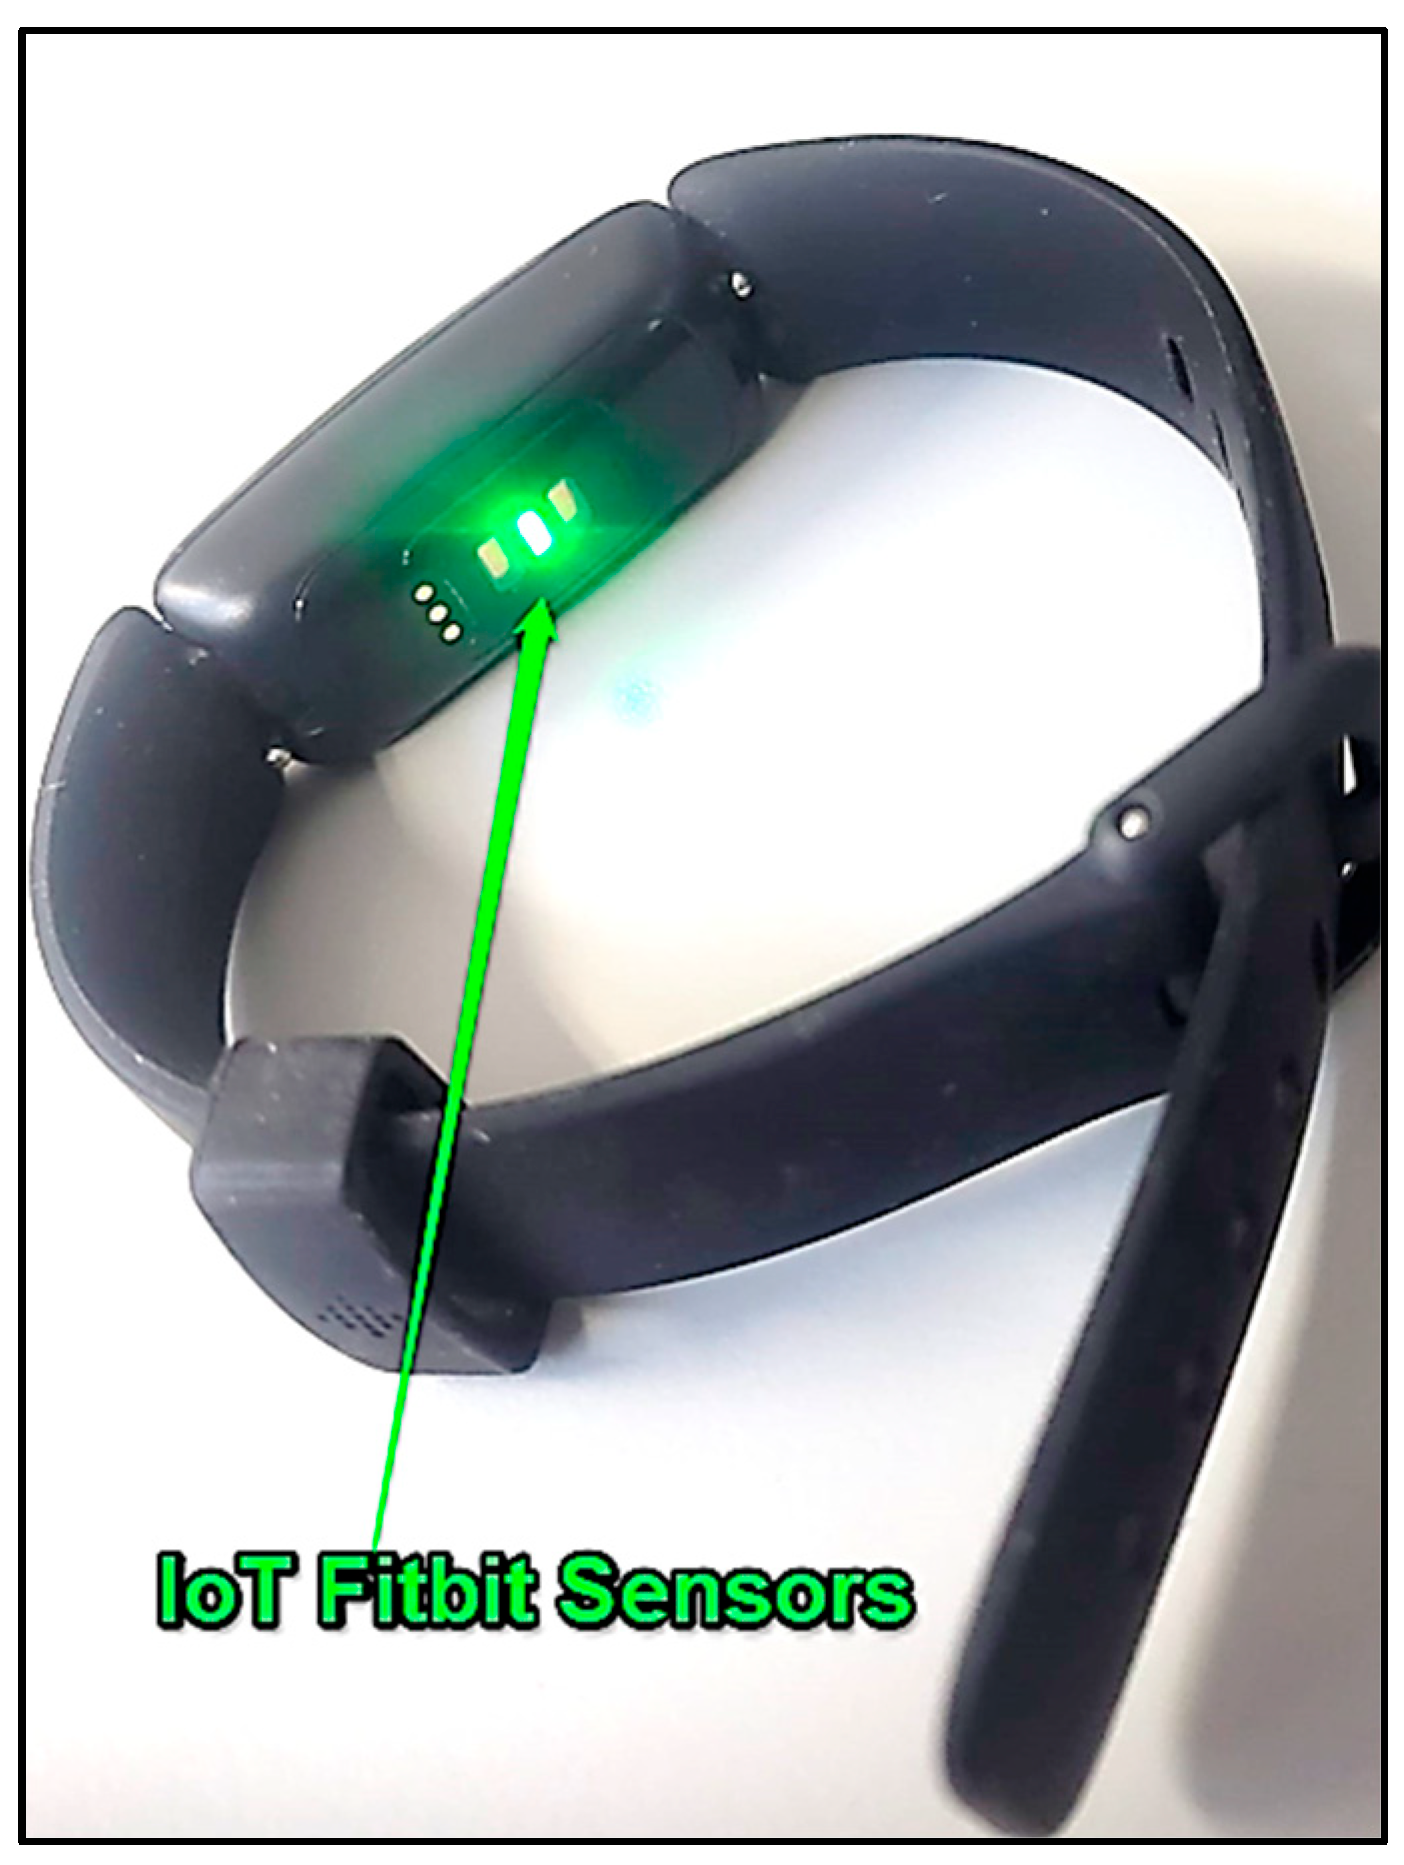
The IFSB is an advanced IoT smart band, used for real-time health monitoring and specifically designed to track and support cardiovascular health for drivers.
Its core components include sensors that monitor critical health indicators such as heart rate ( B P M ) and blood oxygen saturation levels ( S p O 2 ), which are crucial for evaluating respiratory and cardiovascular health [37]. The device’s optical heart rate sensor enables continuous heart rate monitoring, and it also tracks S p O 2 levels, providing insights into respiratory health, as presented in Figure 3. For movement tracking, the IFSB includes a three-axis accelerometer, which captures patterns related to physical activity [38]. In addition to these health and activity monitoring capabilities, the IFSB is designed for non-intrusive, continuous tracking, providing alerts when critical health thresholds are reached.
This enables timely intervention for users at risk while supporting enhanced road safety through constant health oversight [39].

2.2.3. The DC Platform

In [40], a data collection platform named the DC Platform was developed to support driver safety enhancements through the integration and management of sensor-based detection data. The platform is designed to interface with external detection systems and aggregate relevant parameters, including the geospatial information associated with monitored drivers. Its primary purpose is to facilitate the efficient acquisition, synchronization, and visualization of sensor data in real-time, thereby enabling risk analysis and decision support regarding impaired driving behaviors. The platform was developed using the Java17 programming language, leveraging frameworks and libraries suitable for data integration, backend processing, and web-based interaction. The display of results on the DC Platform is conducted in the ‘Entities’ module, specifically in the sub-module designated as GPS Data View, which provides structured access to location-based monitoring outputs and supports the assessment of driver behavior in the spatial context.
The DC Platform’s user interface is intuitively designed, aesthetically appealing, and user-friendly. Its architectural layout in user interaction features a contemporary design. Access is granted upon entering valid ‘user’ credentials and ‘password’, which are acquired subsequent to platform enrolment. The platform offers an option to store login credentials in the browser, activated by selecting the ‘Remember me’ checkbox.
After authentication, the DC Platform opens the ‘Home’ page, with a menu bar—‘Home’, ‘Map’, ‘Entities’, ‘Administration’, ‘Language’, and ‘Account’—as presented in Figure 4.
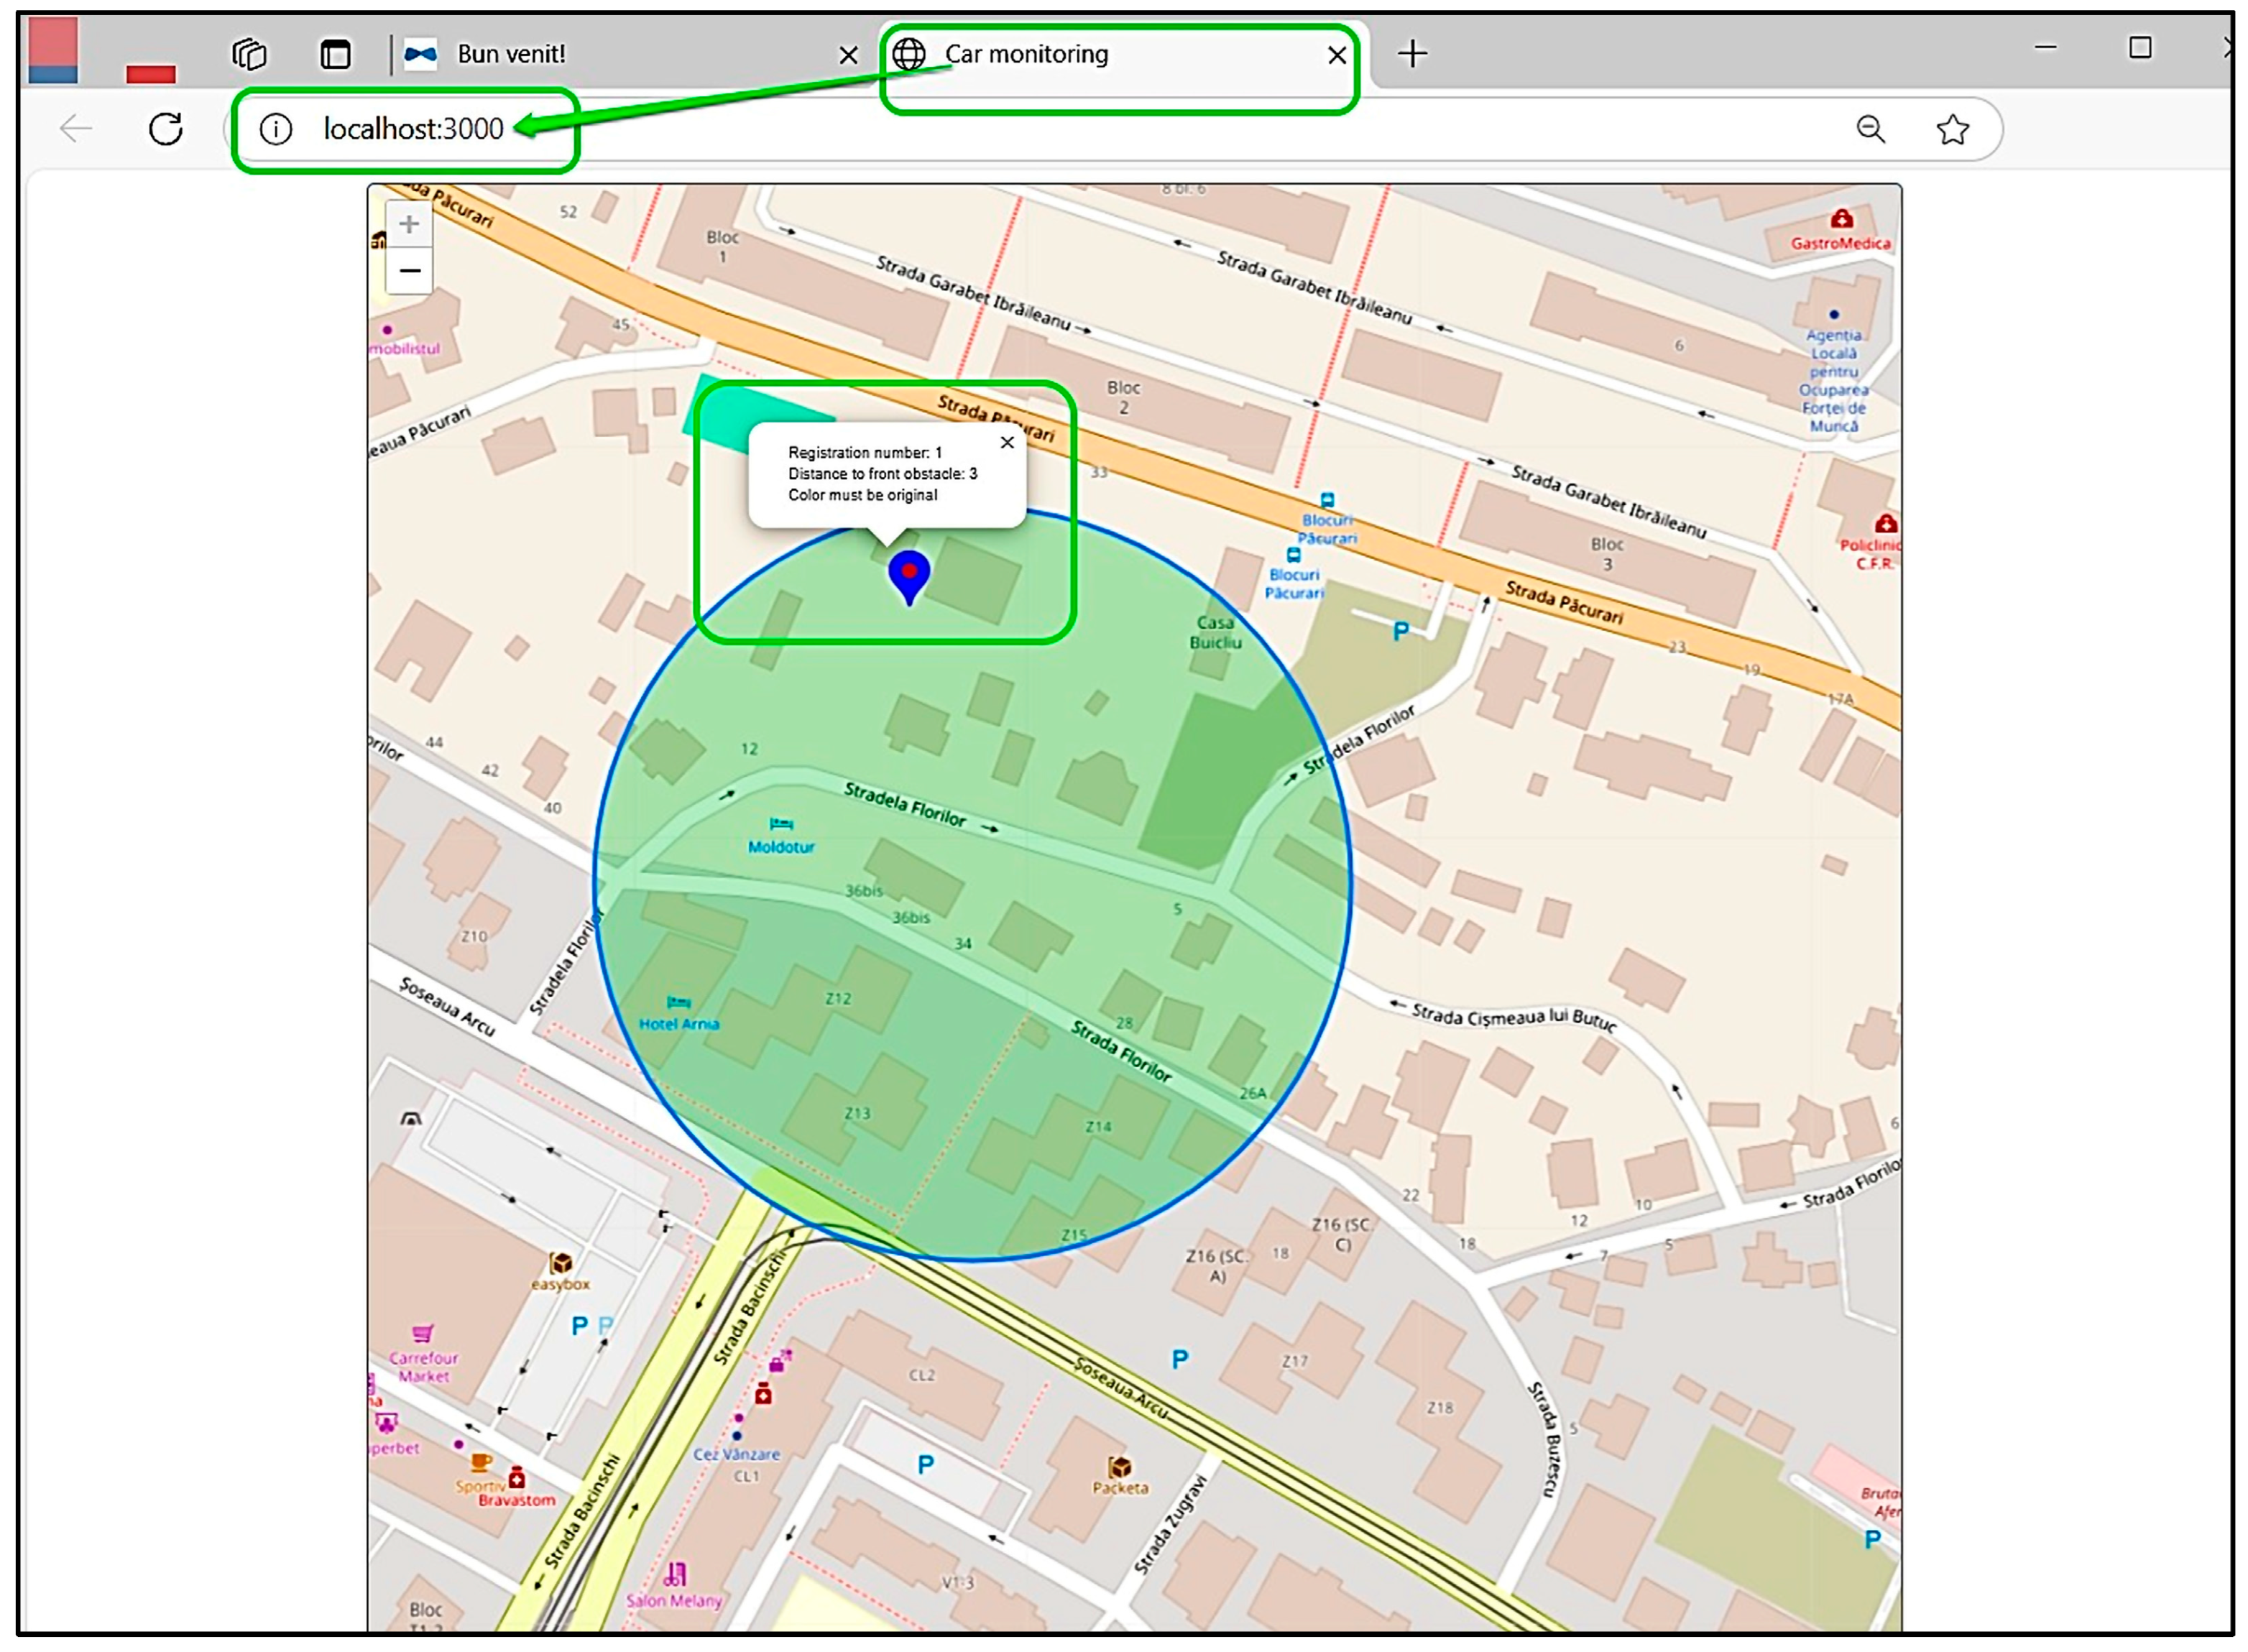
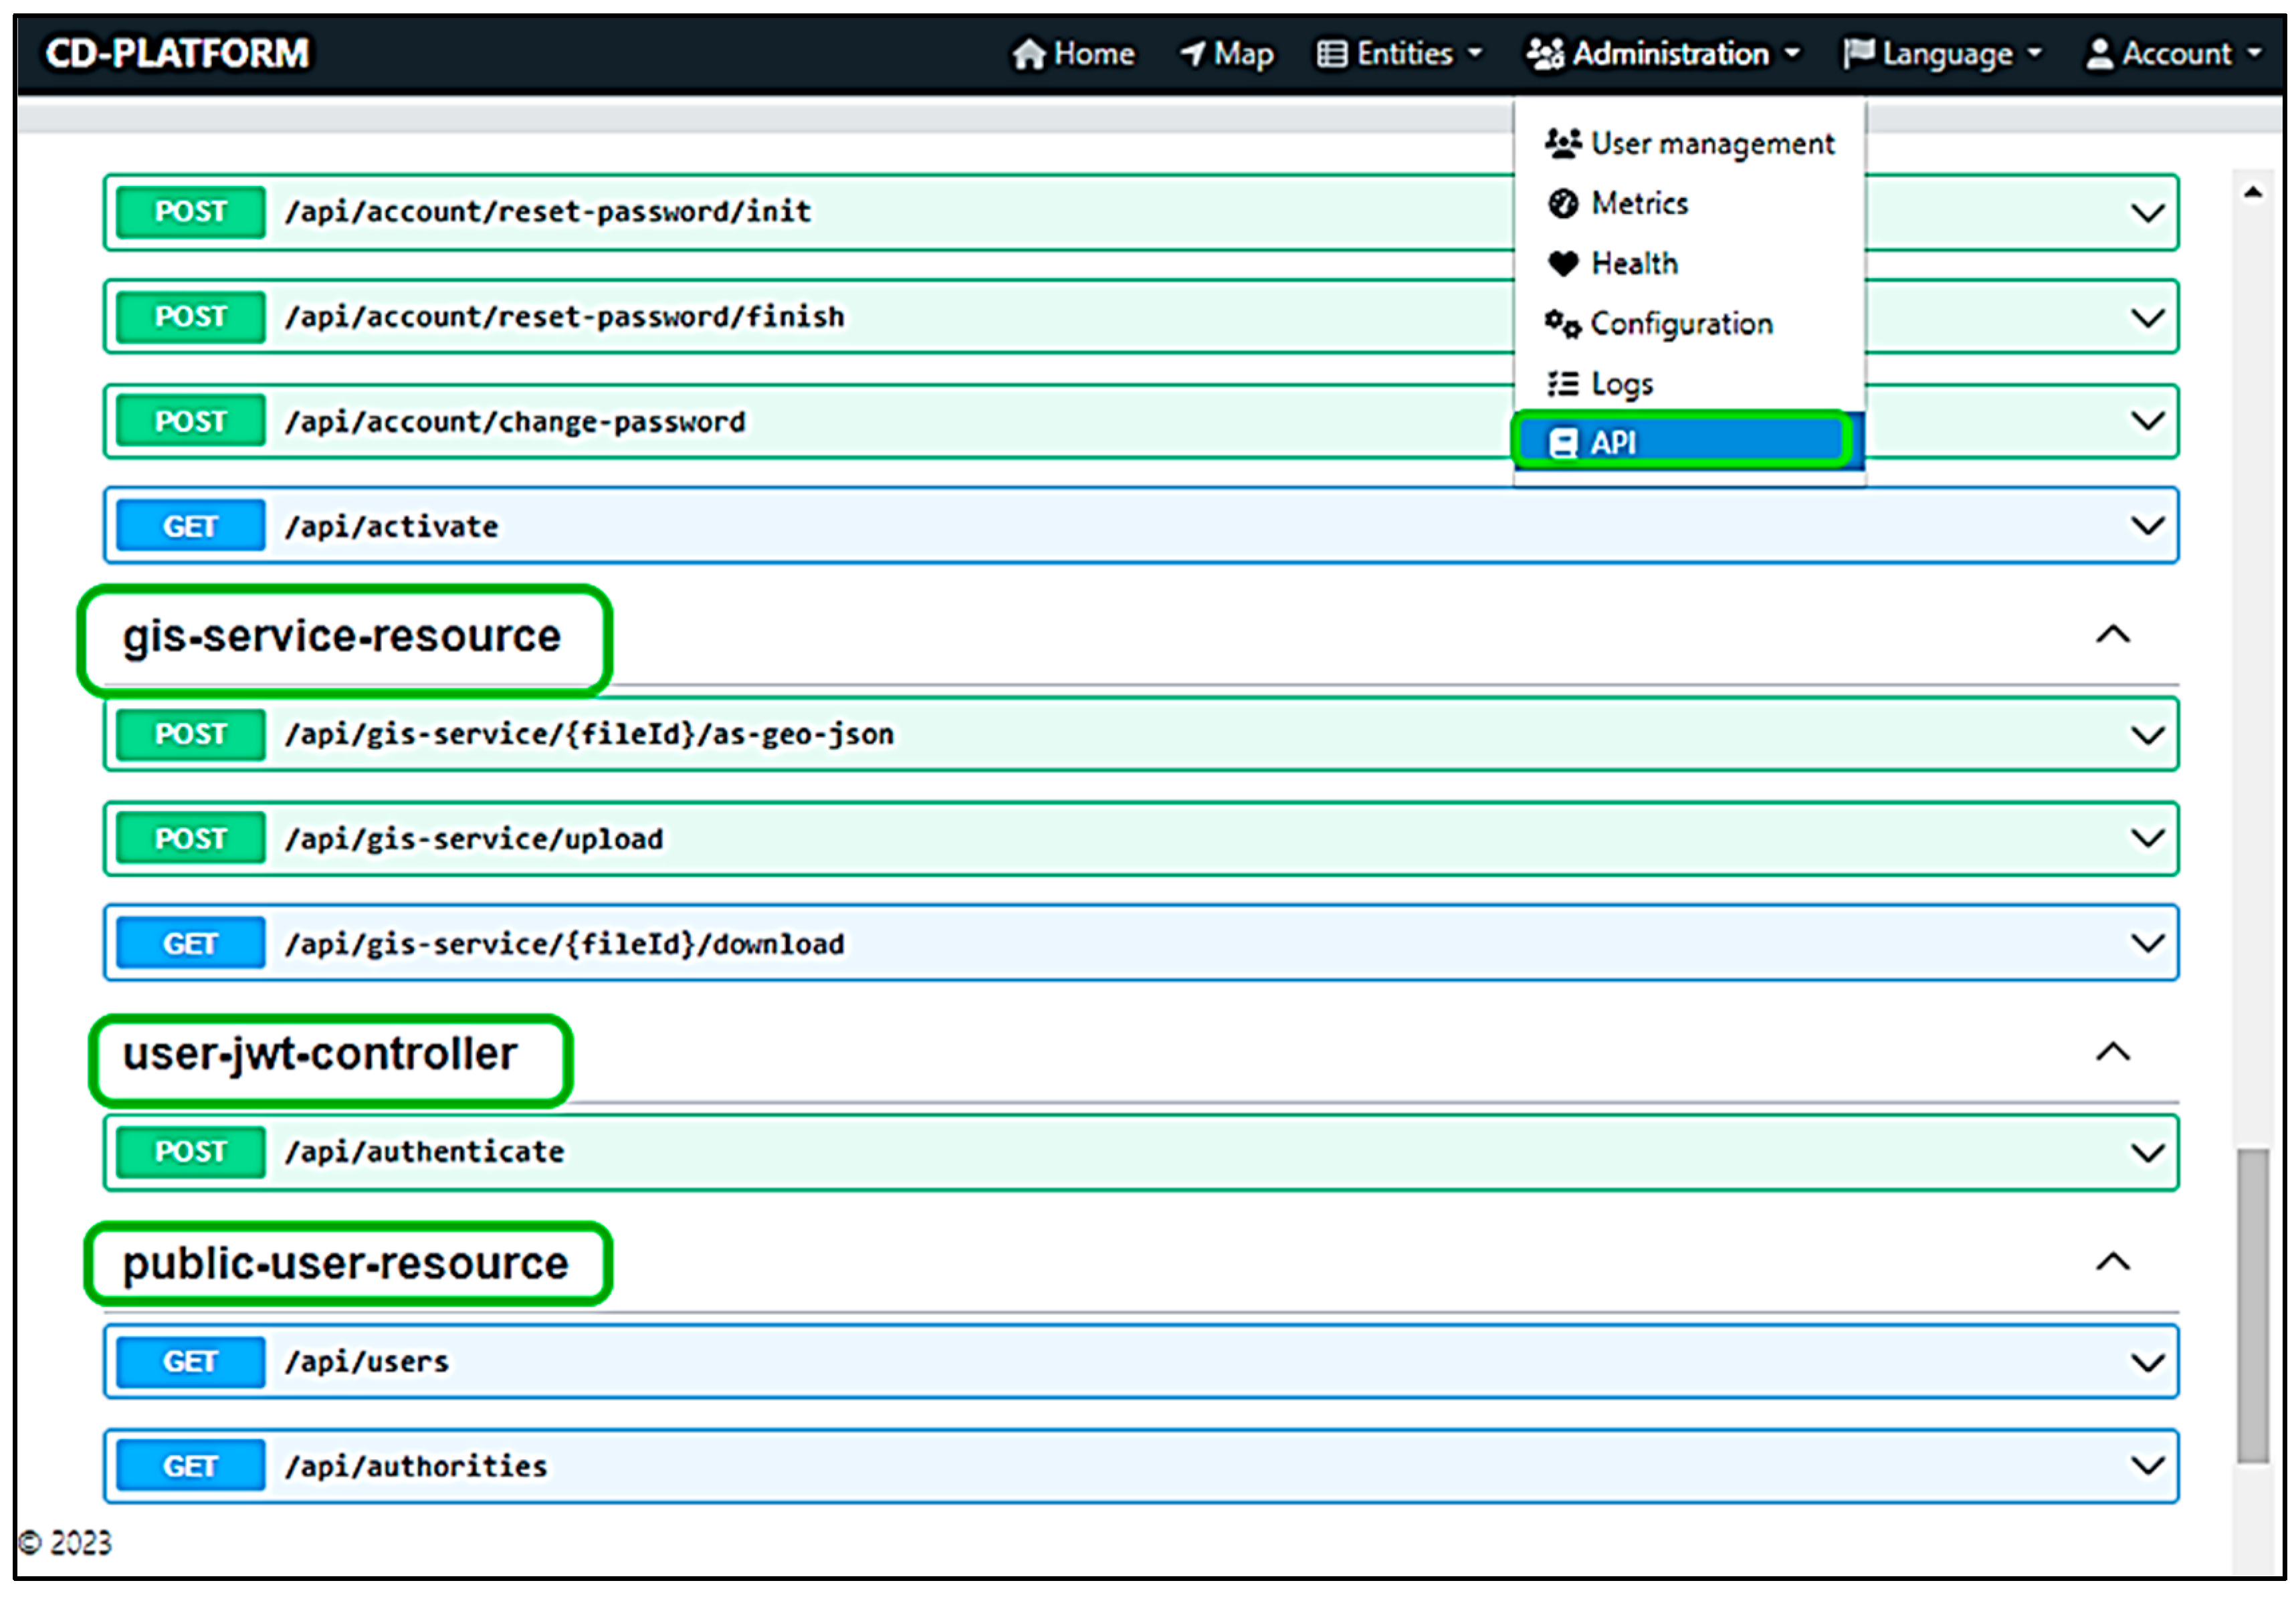
The ‘Maps’ Module represents the subsequent component of the DC Platform. Upon selection, it initiates the opening of a new tab within the browser. When this tab is accessed, a map is displayed showing the real-time locations of the monitored entities. Upon selecting an entity, a ‘Pop-up’ message appears displaying information gathered from the Modular Sensor Battery at that location. The ‘Entities’ Module represents the subsequent component of the DC Platform. It comprises several submodules, including ‘GPS Data’, ‘GPS Data View’, and ‘System Configuration’. The ‘Administration’ Module is the next module of the DC Platform. This module comprises several submodules: ‘User Management’, ‘Metrics’, ‘Health’, ‘Configuration’, ‘Logs’, and the ‘Application Programming Interfaces (API)’. The ‘User Management’ Submodule allows for the the tabular visualization of users enrolled in the platform.
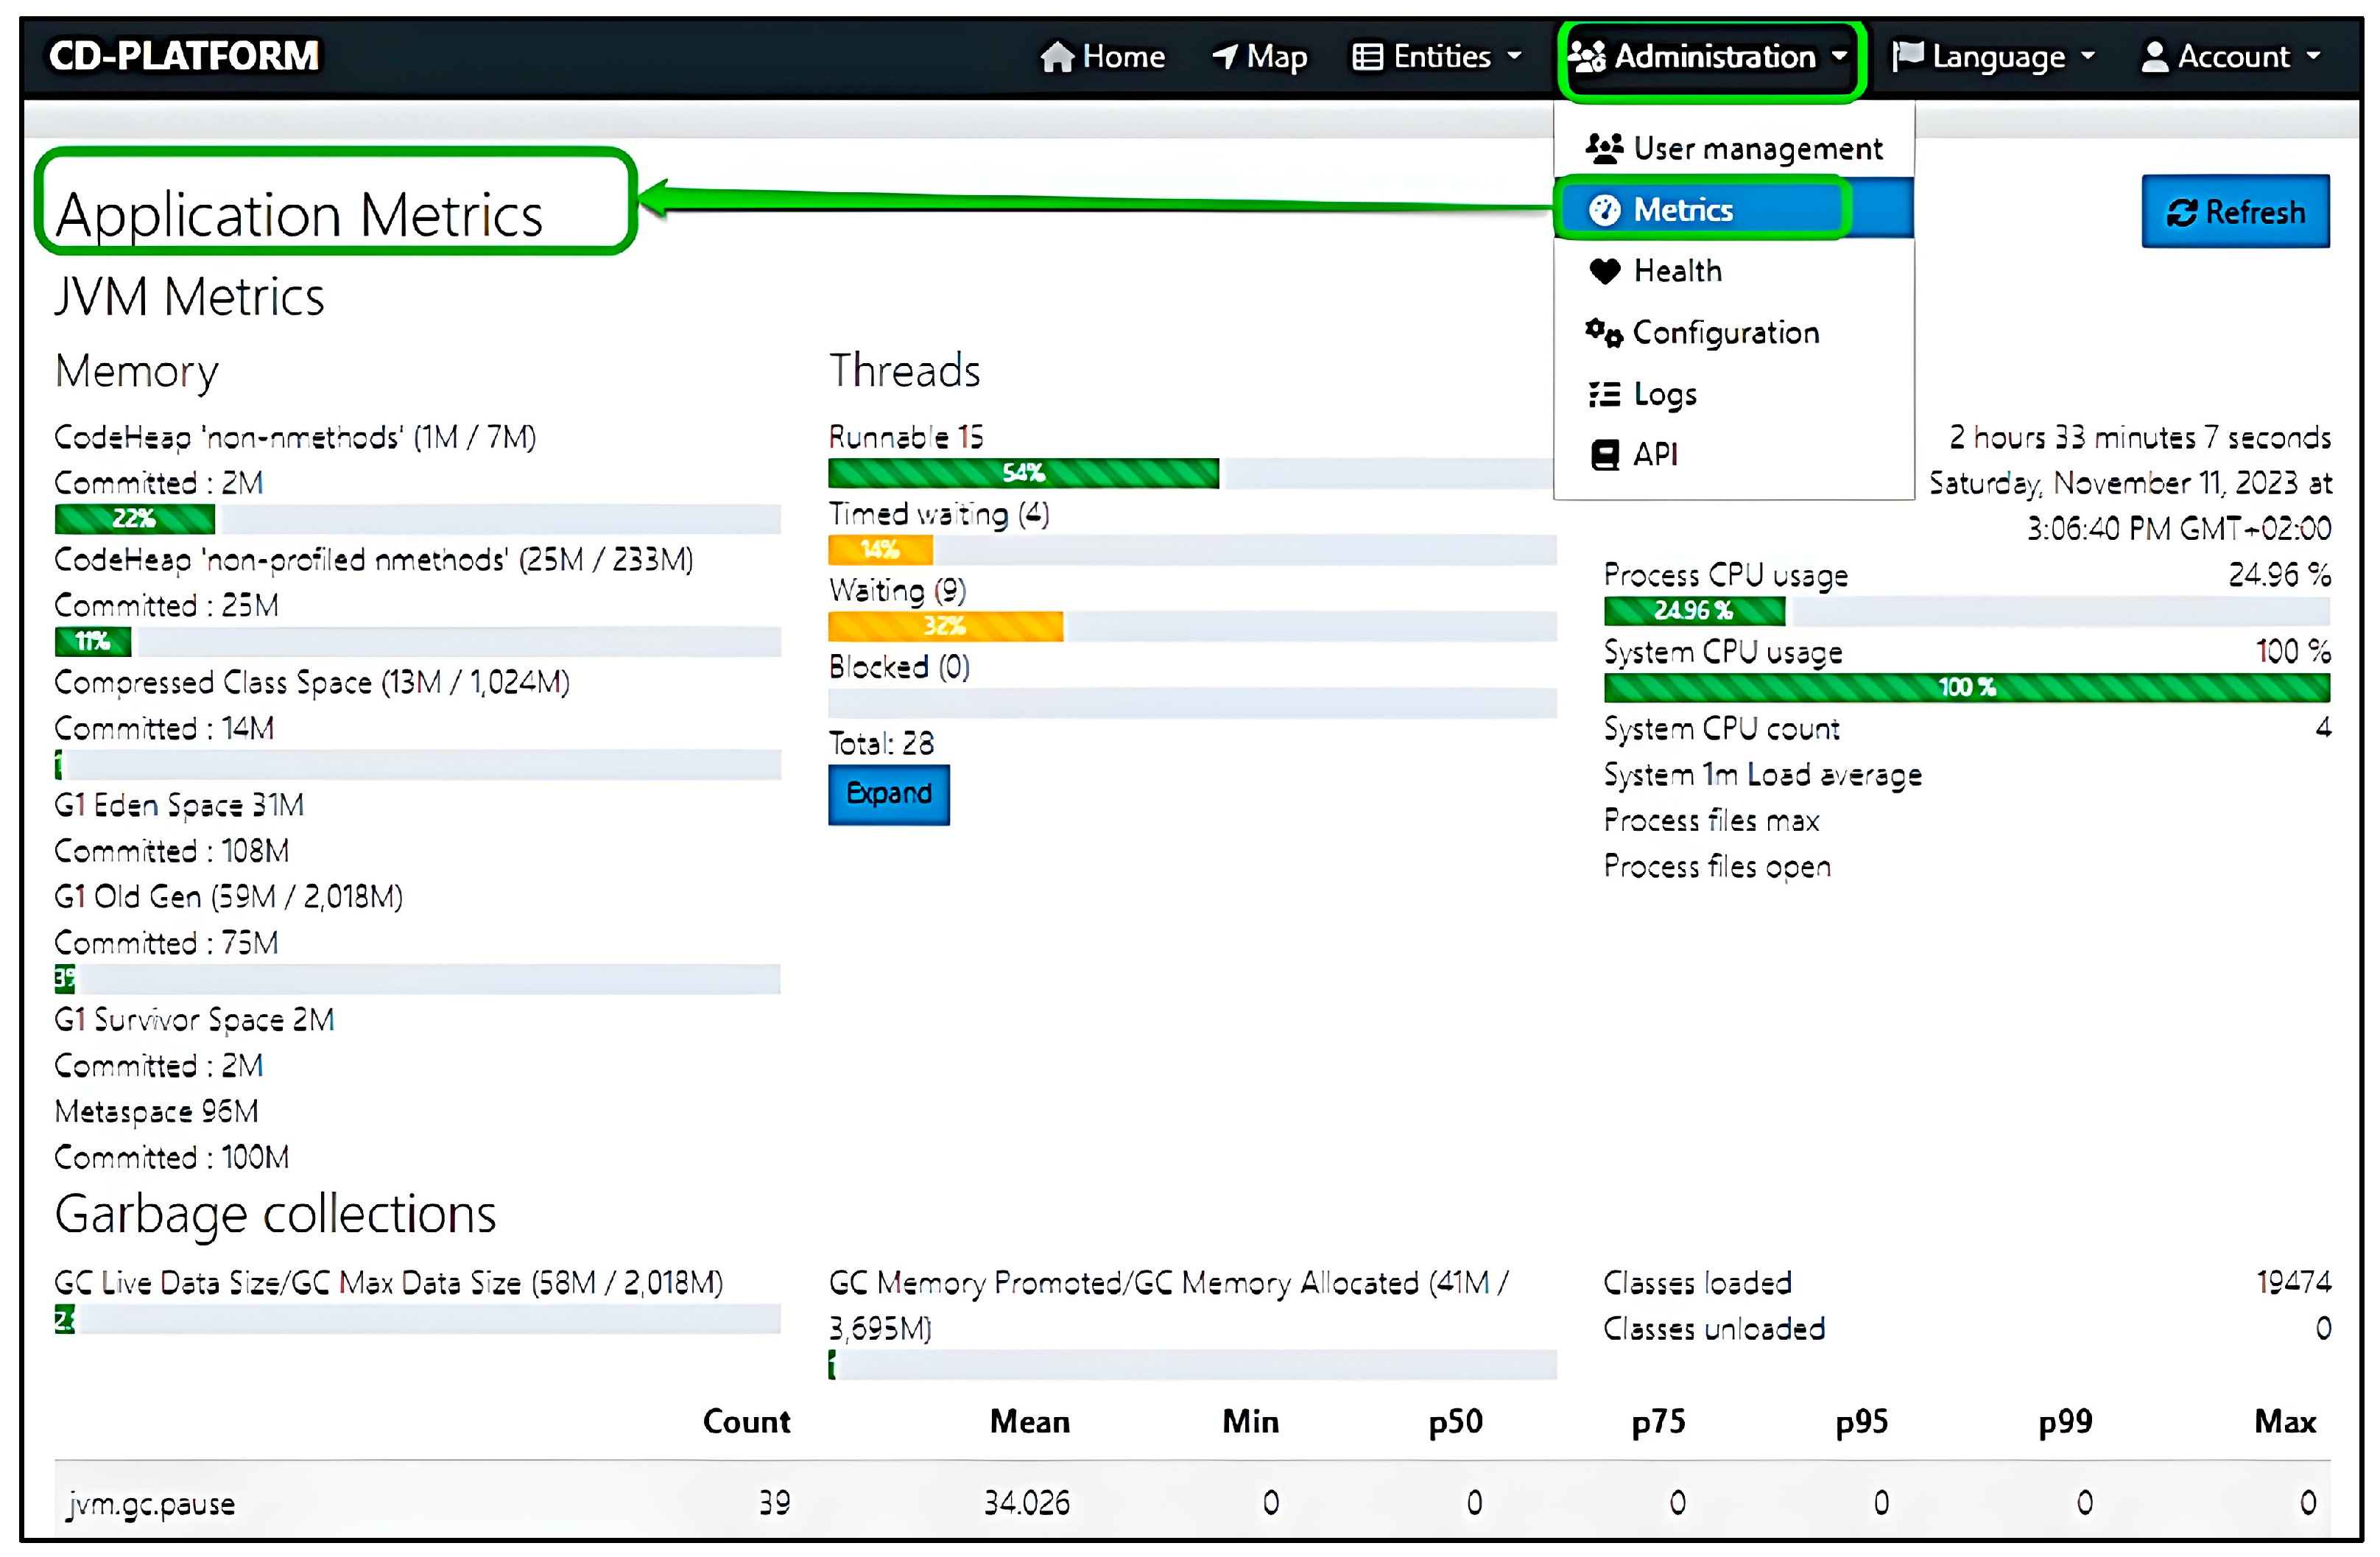
Upon enrolment, a specific form is filled out, in which the user’s name and contact email are entered. For each registered user, several functionalities can be applied, as indicated by three buttons: ‘View’, ‘Edit’, and ‘Delete’. The ‘Metrics’ Submodule delineates a comprehensive suite of metrics pertaining to the operational efficacy and behavioral dynamics of a ‘Java Virtual Machine (JVM)’. The ‘Health’ Submodule provides an overview of the operational state and performance of the Java Virtual Machine and the DC Platform running on it. The ‘Configuration’ Submodule displays the settings and configuration options that impact the behavior and performance of the JVM. The ‘Logs’ Submodule showcases event records and information generated by the JVM and the DC Platform during operation. The ‘API’ Submodule (GpsAPI) delineates the Application Programming Interfaces (APIs) in the Java Virtual Machine (JVM) context. The ‘Language’ Module affords a bilingual user interface experience, facilitating platform interaction through the English and Romanian language options. The ‘Account’ Module is segmented into various submodules, including ‘Settings’, ‘Password’, and ‘Sign Out’. The ‘Settings’ Submodule permits users to amend previously submitted account registration data. Implementing these modifications in the database infrastructure necessitates the activation of the ‘Save’ button. The ‘Password Submodule’ is specifically dedicated to allowing users to modify their account passwords. The ‘Sign Out’ Submodule provides a mechanism for users to terminate their session on the platform.
Furthermore, for the real-time visualization of the locations of the MSB, one may access the ‘Map’ module. This action will open a new tab in the browser, designated ‘Car Monitoring’, as illustrated in Figure 5. This feature provides an additional layer of data representation, allowing for the spatial tracking of the MSB. The integration of this mapping functionality into the DC Platform enhances the system’s comprehensive monitoring and data analysis capabilities. It serves as a valuable tool for situational awareness, particularly in applications that require real-time location tracking.
The ‘GPS Data’ Submodule Upon access, displays all data collected from the MSB and IFSB Bracelet in a tabular format, as it is received in the database. Each row in the table represents a new record associated with an entity on the Platform. This table includes several columns: ‘ID’ denotes the call number from the Database; ‘Station’ represents the MSB number; ‘Lat and Long’ represent the coordinates from the GPS Sensor; ‘Distance’ represents the distance recorded by the HC-SR04 sensor (this distance refers to the space between the driver’s head and the MSB).
M Q 3 denotes the breath alcohol levels, based on the value transmitted by the alcohol sensor; ‘Pulse’ and S p O 2 denote heart rate and blood oxygen levels, based on values transmitted by the IFSB Bracelet (providing valuable insights into respiratory and cardiovascular health); ‘Date and Time’ denotes the date, hour, minute, and second the information reached the database. The last three columns in the table have buttons with functions that apply to each entity. The ‘View’ button allows for the individual visualization of the record. The ‘Edit’ button allows information to be edited, and the ‘Delete’ button enables record removal from the database. The ‘Refresh’ button above the records allows the user to manually refresh the displayed data to bring the latest entries from the database onto the interface. The ‘Create new GPS Data’ button enables the manual entry of data into the platform, as shown in Figure 6.
The ‘GPS Data View’ Submodule allows for the tabular visualization of the information that will be displayed on the map for a particular tracked vehicle; the location and the breath alcohol levels value are visible.
For each entity, the user can view, edit, or delete data using the ‘View’, ‘Edit’, and ‘Delete’ buttons, respectively.
The ‘System Configuration’ submodule provides a tabular interface for defining and visualizing alert parameters within the platform. Threshold values can be configured for specific physiological indicators, such as breath alcohol concentration. When the MSB device transmits a value that exceeds the predefined threshold stored in the system database, the platform initiates a visual alert. This alert is represented by a color change in the corresponding map pin, offering an immediate graphical signal of the detected exceedance.
The ‘Administration’ Module is the next module of the DC Platform. This module comprises several submodules: ‘User Management’, ‘Metrics’, ‘Health’, ‘Configuration’, ‘Logs’, and ‘API’. The ‘User Management’ Submodule allows for the tabular visualization of users enrolled in the platform, as shown in Figure 7. Upon enrolment, a specific form is filled out, in which the user’s name and contact email are entered.
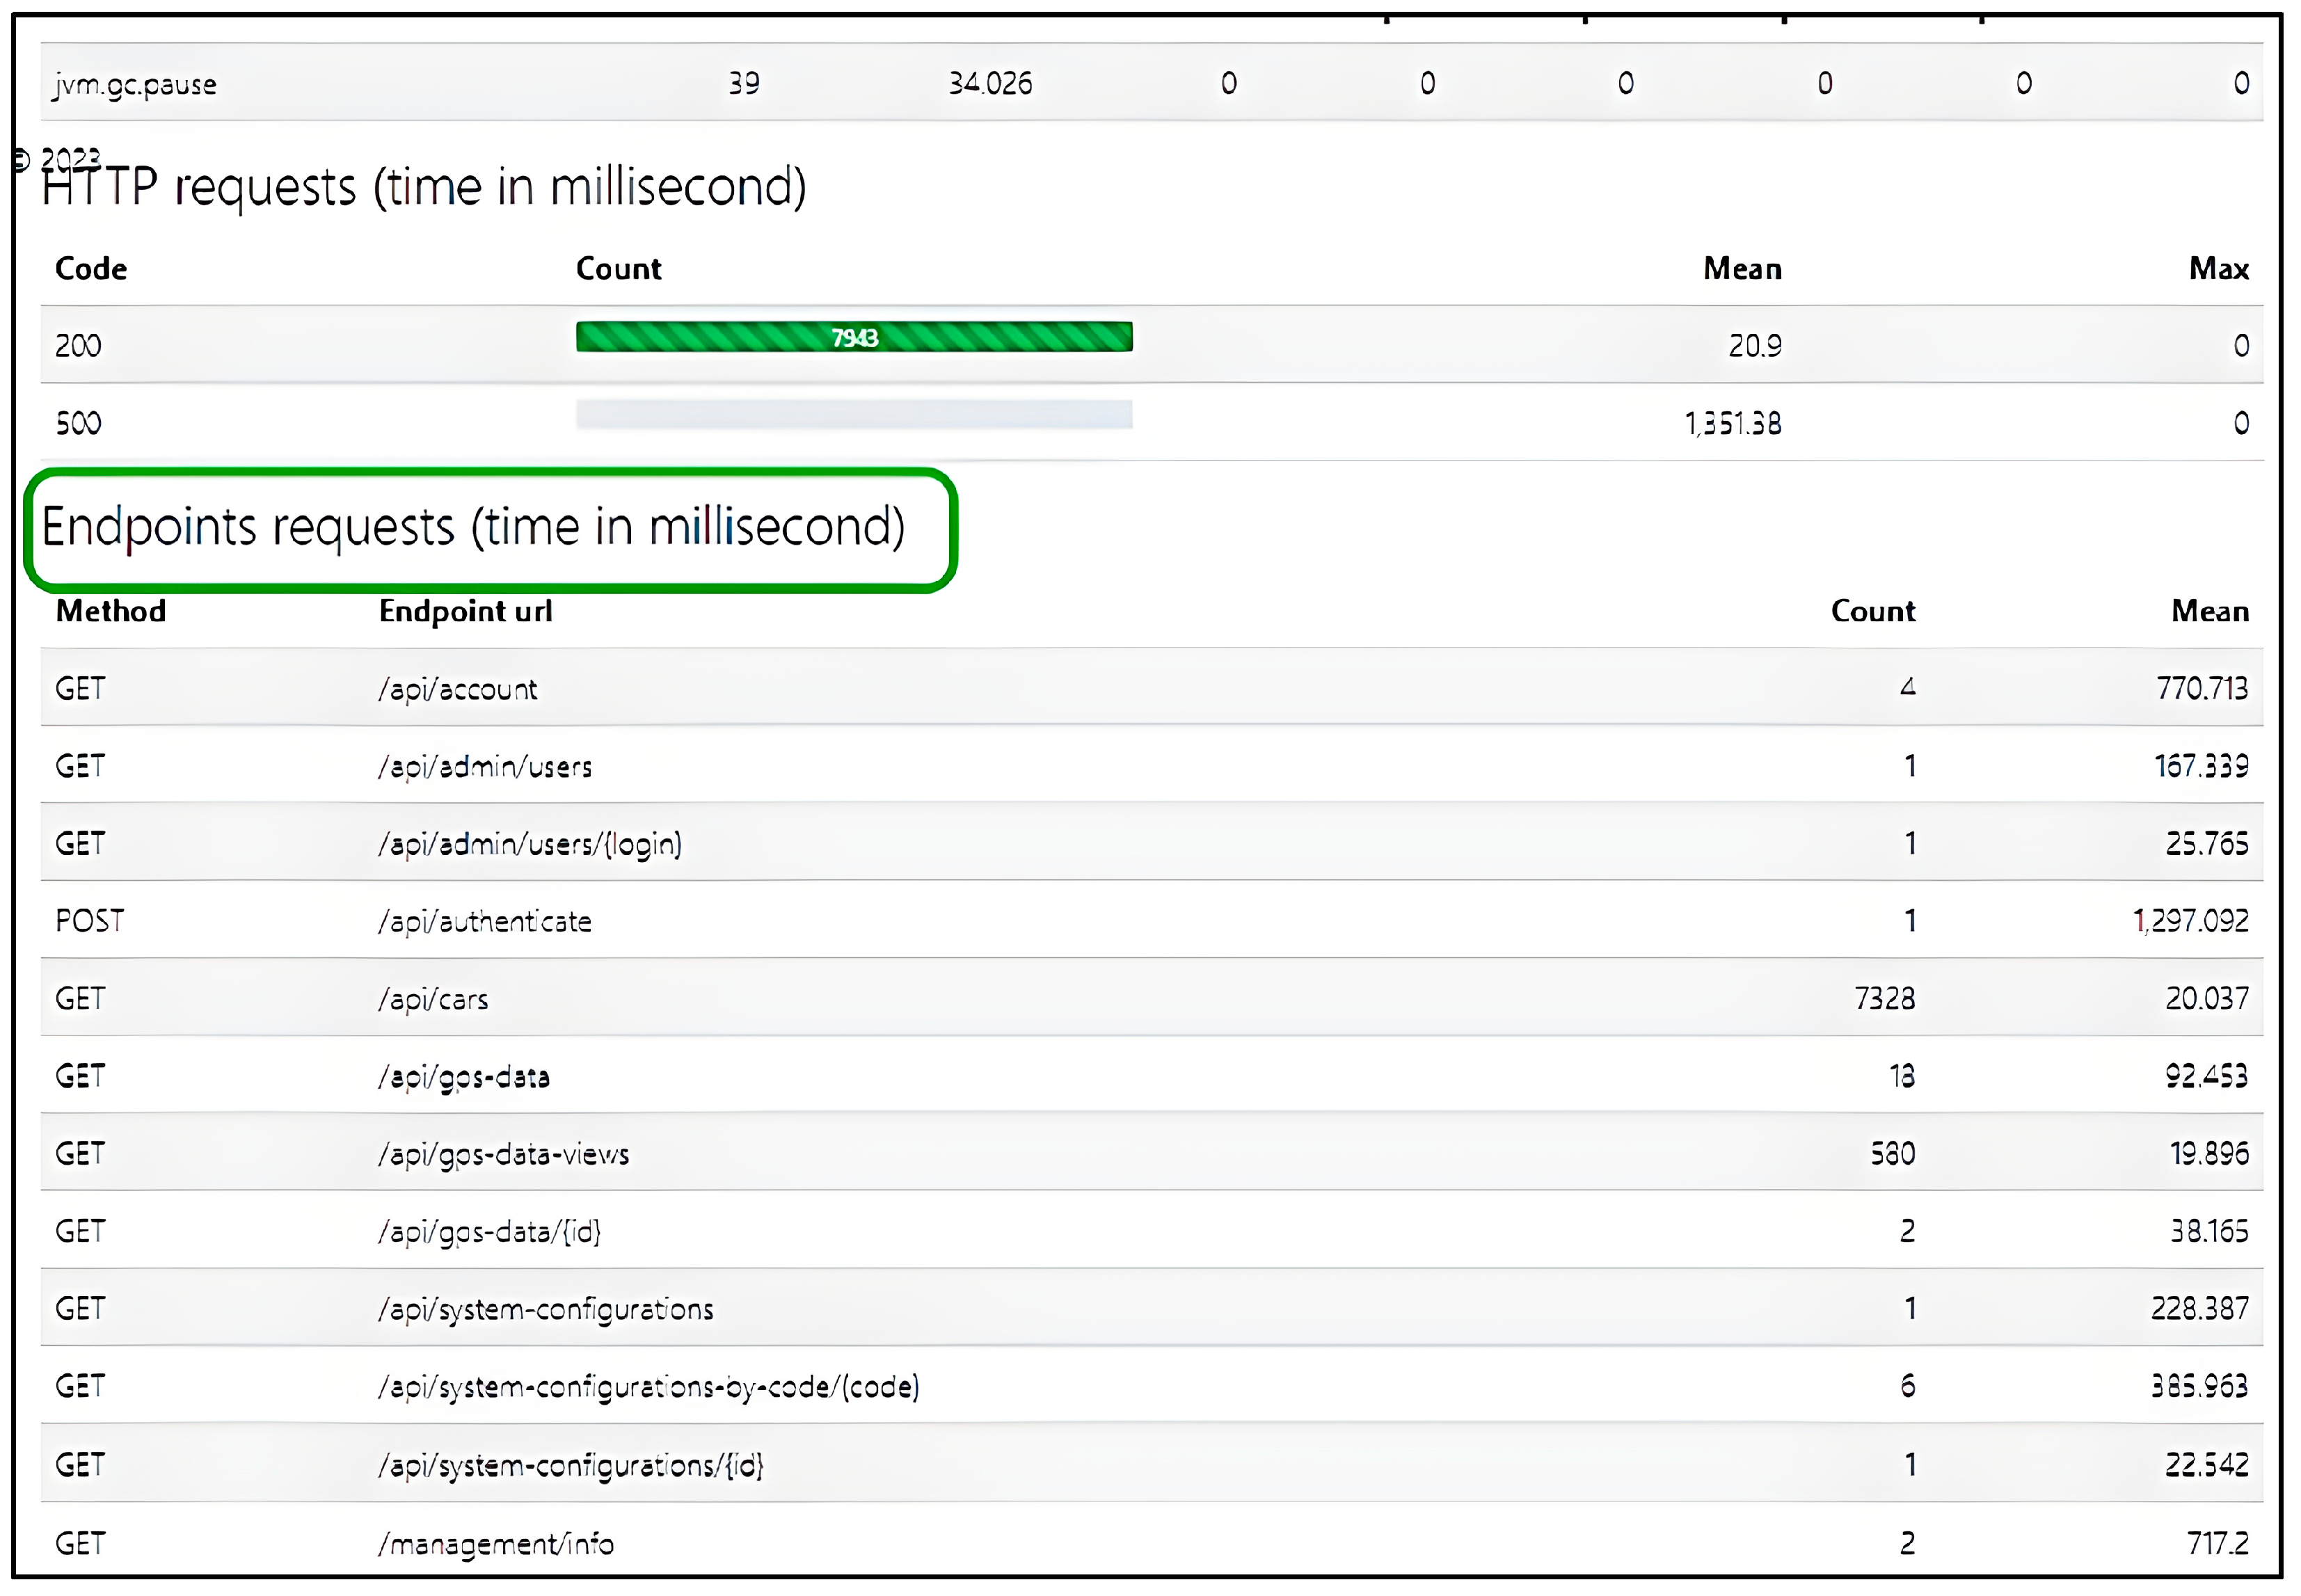
The ‘Metrics’ Submodule delineates a comprehensive suite of metrics pertaining to the operational efficacy and behavioral dynamics of a Java Virtual Machine (JVM). These quantifiable indicators provide an in-depth analytical framework for evaluating how the JVM allocates and manages computational resources, processes data storage, and executes programmatic code. The integral nature of these metrics in the context of the systematic monitoring and enhancement of the DC Platform’s performance encompasses several key dimensions.
To facilitate the examination of a user’s specific details within the system, the operator can engage the ‘View’ function, as established in the preceding procedural context, which is depicted in Figure 8.
Memory Utilization Parameters are characterized by Heap Memory metrics, which quantify the volume of memory allocated for object storage within the Java Heap, and Non-Heap Memory metrics, which detail the memory allocation for ancillary data storage, including methods and thread operations.
Thread Activity Insights are covered by aspects such as the Total Active Thread Count, which is enumerated by the active threads within the JVM, and Thread State Analytics, in which insights into the operational status of threads are provided, categorizing them as active, inactive, or obstructed.
The strategic deployment of these metrics is pivotal in diagnosing performance-related anomalies, preempting potential memory leaks, and facilitating the holistic optimization of the DC Platform. The perpetual surveillance and analysis of these metrics are instrumental for development and operational teams aiming to sustain and enhance the DC Platform’s operational efficiency, as elucidated in the subsequent diagrammatic representation. Figure 9 and Figure 10 present the cache memory and data sources.

2.3. Confidentiality of Information and Blockchain Technology

To add the blockchain-based security layer to the sensitive data of the proposed system, the experimental setup uses a specially devised Ethereum contract which provides a programmable and extensible framework for interaction between the outer ecosystem and the blockchain infrastructure [41]. Smart contracts are digital programs designed to automatically carry out actions when certain pre-set conditions are satisfied and, through the use of automated processes without human intervention, have redefined the concept of trust in digital transactions [42]. These contracts, executed in a specific virtual environment, the Ethereum Virtual Machine (EVM), add an additional layer of autonomy and applicability to the network. The open-source nature of the smart contracts fostered by the community is also noteworthy, which creates a collaborative environment for continuous improvement and innovation [43].
A common approach to ensuring data authenticity is to store cryptographic hashes on a blockchain. This method is widely used in applications requiring verifiable integrity [44,45]. The fundamental principle behind this approach is that instead of storing raw data directly on the blockchain, which can be costly and inefficient due to storage limitations, only the cryptographic hash of the data is recorded. This allows any party to independently verify the authenticity of the data without exposing the original information.
In our system, blockchain does not simply duplicate conventional cryptographic techniques but extends them by introducing a decentralized trust model. The participants in this model include the following:
(i)
The Modular Sensor Battery (MSB) and IoT FitBit Smart Band (IFSB), which generate and submit hashed sensor readings;
(ii)
The Data Collection Platform (DC Platform), which queries and cross-validates data integrity;
(iii)
Potential third-party verifiers such as law enforcement agencies, insurance providers, or road safety organizations, which can independently validate sensor authenticity without accessing sensitive raw data.
Conventional cryptographic methods (hashing, digital signatures) secure the data locally but cannot ensure immutability, transparency, and auditability once the information leaves the device. By contrast, blockchain eliminates the single point of failure of centralized platforms, provides tamper-proof storage, and allows for long-term traceability and independent verification by authorized external stakeholders.
An essential dimension of ensuring data authenticity in the proposed system is the elimination of discrepancies between the actual sensor measurement and the value subsequently reported on the platform. This is achieved by executing the hash computation directly on the microcontroller at the moment of data acquisition. By generating the cryptographic hash before any further processing or transmission occurs, the system guarantees that the original, unmodified sensor reading is the exact value represented on the blockchain. This approach precludes the possibility of local data manipulation or intermediate tampering, ensuring that what is displayed in the user interface has a cryptographically verifiable link to the measurement captured at the source. As such, the authenticity of the reported data is inherently enforced, strengthening trust in the monitoring process and eliminating potential dissonance between the physical reality and the platform’s digital representation.
The implementation was carried out in an experimental environment using Raspberry Pi 4 Model B microcontrollers operating under a Linux-based OS (Raspberry Pi OS). Smart contracts were written in Solidity and deployed on the Ethereum test network Rinkeby, while the interaction with the blockchain was managed through Web3.py and Infura. This setup provided a controlled, reproducible environment to test the end-to-end data integrity pipeline from sensor to blockchain.
The VehicleDataStorage smart contract, as presented in Figure 11, is built around a core structure called DataEntry, which contains two elements: dataHash, a cryptographic hash representing the aggregated sensor data, and timestamp, a unit256 field storing the timestamp when the data was recorded. The contract uses a mapping, vehicleData, that links a vehicle’s unique identifier (vehicleId) to an array of DataEntry records. This design enables storage and retrieval of historical data for each vehicle. Additionally, authorizedDevices, mapping tracks devices, identified by their Ethereum addresses, that are authorized to submit data. The admin address, set during contract deployment, holds exclusive control over device authorizations.
To manage access control, the contract defines two modifiers: onlyAdmin and onlyAuthorizedDevice. The onlyAdmin modifier restricts specific administrative operations to the contract administrator, ensuring that only the admin can authorize or revoke devices. The onlyAuthorizedDevice modifier enforces restrictions on data storage, allowing only pre-approved devices to submit new data entries.
The contract includes functions to handle device management, data storage, and data retrieval. The constructor function initializes the contract by setting the deployer as the admin. The authorizeDevice function allows the admin to add a new authorized device, updating the authorizedDevices mapping and emitting a DeviceAuthorized event. Similarly, the revokeDevice function enables the admin to revoke a device’s access, preventing future data submissions and triggering a DeviceRevoked event. For data storage, the storeDataHash function allows authorized devices to store a new data entry, which records the hash along with a timestamp and emits a HashStored event for transparency. The getVehicleData function allows users to retrieve the complete list of stored data entries for a given vehicle, providing public verification capabilities.
This retrieval process operates on the principle of data verification: users can independently compute the hash of the data displayed on the interface and compare it with the hash stored on the blockchain. A match between the independently computed hash and the blockchain-stored hash confirms that the data remains unaltered, ensuring its integrity. Conversely, any discrepancy between the hashes indicates potential data tampering or unauthorized modifications.
The decision to store a single aggregated hash, rather than separate hashes for each parameter, is driven by the need to optimize storage efficiency and streamline the verification process. By consolidating all parameters into one hash, the system reduces the number of transactions required on the blockchain, thereby minimizing gas fees and enhancing overall performance. Additionally, this approach simplifies the data verification process, as users can verify the integrity of the entire dataset with a single hash comparison, rather than needing to perform multiple individual verifications.
In the current implementation, each aggregated hash corresponds to a fixed-size data segment consisting of 25 consecutive entries collected by the Modular Sensor Battery (MSB). This design choice aligns with the pagination structure of the Platform’s CD user interface, where sensor data is displayed in groups of 25 records per page. By hashing each full page of data as a single unit, the system effectively reduces the number of required blockchain interactions by a factor of 25. This results in a substantial reduction in operational costs, as each blockchain transaction—incurring a gas fee—is amortized across a complete data page, rather than being incurred for every individual entry. The use of page-level aggregation thus achieves a balance between cost-efficiency and data granularity, while maintaining the ability to perform precise and transparent integrity verification.
Each microcontroller within the system is assigned a unique wallet address, which it uses to interact with the storage methods of the smart contract. These wallet addresses are cryptographic identities specific to the microcontrollers installed within each monitoring unit (e.g., the Raspberry Pi running the MSB module). The administrator is responsible for explicitly authorizing these addresses, thereby granting permission for their data to be permanently recorded on the blockchain. This ensures a robust device authentication model.
The system ensures data integrity by executing the hashing process directly on the microcontroller. Using this approach, the microcontroller generates the hash value locally before transmitting it to the Ethereum blockchain. This direct computation at the device level significantly reduces the risk of data-tampering, as it bypasses any intermediary processing stages where the data might be vulnerable to unauthorized modification. By transmitting the hash directly from the microcontroller to the blockchain, the system ensures that the data remains secure and unchanged from the point of its creation to its permanent recording.
For the hashing algorithm, the system employs Keccak-256 [46], a widely adopted cryptographic algorithm designed to produce fixed-length hash values that are computationally infeasible to reverse or tamper with. Keccak-256 was chosen for its compatibility with Ethereum’s architecture, where it serves as the foundation for many cryptographic operations, including address generation and transaction verification. The algorithm’s resistance to collision attacks ensures that no two distinct data inputs can generate the same hash value, while its high-performance design allows for efficient computation even on resource-constrained devices such as microcontrollers.
The blockchain integration within this system ensures the following:
  • The authenticity of all recorded measurements (alcohol levels, heart rate, SpO2, GPS location);
  • The secure origin of data transmissions—validated through authorized wallet addresses;
  • Long-term traceability and auditability without compromising user privacy.
This approach enables safe, scalable, and trustworthy data management in sensitive vehicular monitoring applications.

3. Experimental Setup

The experimental setup was based on the previously outline system architecture. While the EMP-23 driving simulator—manufactured by R&D parks in Shenzhen, Shanghai, and certain hardware components were adapted from our previous prototypes [31], the present study introduces several methodological advancements: blockchain-based integrity verification, a dual-channel sensing strategy combining breath and physiological data, and page-level aggregation of measurements for efficient blockchain storage. An EMP 23 driving simulator [47] was used in the study to enable continuous monitoring of the driver’s physiological and environmental parameters throughout the simulation. The study aimed to explore the physiological effects of alcohol consumption and assess the potential for predicting alcohol concentration based on heart rate and blood oxygen saturation. Although no statistical model validation was conducted due to the dataset being limited to a single subject, the results suggest the possibility of developing an accurate prediction model in future studies involving a broader and more diverse sample population.

3.1. Data Acquisition and Parameters

Data was collected from multiple sensors, recording the following parameters:
Heart Rate—Pulse ( B P M ): Heart rate was measured using a FitBit wristband worn on the driver’s left wrist.
Blood oxygen ( S p O 2 ) : Blood oxygen saturation was monitored by the FitBit device–manufactured by Google LLC, Mountain View, CA, USA.
Distance (mm): The distance between the driver’s head and the sensor was measured using the HC-SR04 proximity sensor, integrated into the MSB.
Alcohol Concentration—MQ3 (ppm): Alcohol concentration in exhaled air was detected by the MQ-3 sensor embedded in the MSB and positioned above the driver’s head.
Geolocation (Latitude and Longitude): Real-time coordinates were provided by the NEO-6M GPS sensor, also integrated within the MSB, to enable continuous tracking of the simulator’s location.
Station ID: This was a unique identifier for the MSB unit.
The experiment was conducted in a controlled environment equipped with specialized medical supervision. All measurements were acquired within a closed circuit using the driving simulator EMP 23, the MSB, and an IoT-based physiological monitoring system (IFSB). This setting ensured the safety of the participant while maintaining consistency and reliability in data acquisition. A total of 24,506 measurements were recorded in the database over 1634 min. During the first 24 h, the driver did not consume alcohol, serving as a baseline measurement. The focus of the analysis was the 197 min interval when the M Q 3 sensor began detecting alcohol concentration in the exhaled air.

3.2. Experimental Conditions

The driving simulator provided a controlled environment where external influences were minimized, allowing for the isolation of physiological responses strictly related to alcohol consumption. The driver was continuously monitored while remaining seated in the EMP 23 simulator for the entire duration of the experiment, ensuring consistency in posture and effort. The Modular Sensor Battery (MSB) was mounted above the driver’s head at a fixed distance to optimize the detection of alcohol vapors in the exhaled air, minimizing the risk of contamination or diffusion from surrounding air. Simultaneously, the IFSB wristband worn on the left wrist recorded heart rate and blood oxygen saturation in real time, providing a non-invasive and continuous physiological monitoring channel.
To ensure the participant’s safety and the integrity of the collected data, the entire session was conducted under continuous medical supervision, with scheduled physiological assessments and immediate support available in the event of any adverse effects. Prior to participation, the subject was fully informed about the purpose, methodology, and potential risks of the study and signed a written informed consent agreement. The participant voluntarily ingested a measured quantity of alcohol in accordance with the experimental protocol, solely for the purpose of generating physiological data relevant to the research objectives. All procedures were carried out in a controlled laboratory environment, with constant temperature and humidity, and in the absence of external auditory or visual stimuli that might interfere with sensor readings or behavioral responses.
This study was conducted in accordance with the ethical principles of the Declaration of Helsinki (1975, revised 2013). Written informed consent was obtained from the volunteer participant prior to the experiment. As this was a preliminary, single-subject proof-of-concept, the protocol was designed under medical supervision and adhered to national ethical guidelines.
This study was conducted in full accordance with ethical standards governing research involving human subjects. Informed consent was obtained in writing from the participant prior to the beginning of the experiment. The research adhered to the principles outlined in the Declaration of Helsinki, ensuring respect for the participant’s autonomy, safety, and confidentiality throughout the study.
This experimental design allows for a comprehensive and reproducible analysis of the driver’s physiological responses to alcohol intake during a simulated driving scenario. The use of timestamped data and continuous geolocation tracking further enhances the reliability of the dataset by ensuring the temporal and spatial traceability of each measurement.
Among all variables collected during the sessions, three played a central role in the present analysis:
(i)
Alcohol concentration in the exhaled air, recorded in parts per million (ppm) using the MQ-3 alcohol sensor, and coded as M Q 3 ( p p m ) .
(ii)
Heart rate, recorded in beats per minute and labeled B P M .
(iii)
Blood oxygen saturation, expressed as a percentage and labeled S p O 2 .
The latter two variables were obtained via the IFSB wristband and served as primary physiological indicators under investigation in relation to alcohol exposure, as well as other potential influencing factors relevant to driver monitoring, such as fatigue, stress, or metabolic imbalances.

4. Results and Analysis

The results presented in this section reflect the behavior and operational performance of the proposed system during the controlled driving simulation. The monitoring period included both a baseline phase—during which no alcohol was consumed—and a test phase, during which the MQ-3 sensor detected measurable concentrations of alcohol in the exhaled air. The system’s ability to capture and correlate physiological and environmental changes during these phases demonstrates its effectiveness in real-time alcohol exposure detection.
A total of 24,506 valid sensor entries were recorded over 1634 min of simulation. For the first 24 h, the subject remained sober, and the MQ-3 sensor reported zero or negligible alcohol concentrations. This initial phase served as a calibration period for all sensors, confirming the stability and reproducibility of readings under normal, alcohol-free conditions. During this interval, heart rate ( B P M ) remained within the subject’s resting physiological range, and blood oxygen saturation ( S p O 2 ) showed normal, stable values above 97%.
Subsequently, during the 197 min test phase, conducted between 09:00 and 12:00 AM, the MQ-3 sensor registered a progressive increase in alcohol concentration within the exhaled air, quantified in parts per million (ppm) and recorded under the M Q 3 p p m parameter. In parallel, physiological indicators monitored via the FitBit device exhibited deviations from baseline values. Specifically, a gradual elevation in heart rate was accompanied by a modest but consistent decline in peripheral blood oxygen saturation S p O 2 . These variations align with established physiological effects of alcohol intake, such as heightened cardiovascular activity and mild hypoxemia resulting from compromised oxygen delivery or altered metabolic processing [48].
Figure 12a–c illustrate one of the measurement sessions conducted in the laboratory, separately showing the temporal progression of alcohol concentration (Figure 12a), heart rate (Figure 12b), and peripheral blood oxygen saturation ( S p O 2 ) (Figure 12c) throughout the monitoring interval. The temporal alignment of these physiological and environmental variables reveals that the most pronounced deviations in heart rate and S p O 2 levels coincided with periods of elevated alcohol vapor concentrations, as recorded by the MSB module. These observations support the hypothesis that physiological responses to alcohol can be quantitatively captured and temporally correlated with sensor-based ethanol detection.
Although the dataset was limited to a single subject, the observed physiological patterns (increase in BPM, decrease in SpO2) were consistent with known effects of alcohol intake. To address sensor interference, we propose preliminary supplementary detection logic: deviations of more than 10 BPM from the baseline heart rate, combined with a drop of over 2% in SpO2 within a 10 min window, are flagged as potential indicators of alcohol influence. These criteria, while provisional, provide an operational framework for future multi-participant validation studies.
An important observation during this phase was the system’s response under environmental variability. In specific intervals when the cabin window was deliberately opened to test the robustness of the MQ-3 sensor, the alcohol reading temporarily dropped or fluctuated. Despite this, the physiological data collected via the FitBit Smart Band remained consistent and continuous. This confirms the value of the FitBit as a complementary sensing channel—particularly in situations where environmental interference may compromise breath-based measurements. The dual-sensor strategy effectively mitigates false negatives and improves the overall resilience of the system.
To strengthen interpretive depth, the results are discussed in relation to existing studies. The MQ-3 sensor performance aligns with values reported in [5,8], confirming the validity of our detection approach. Unlike prior systems, however, our architecture introduces dual-channel monitoring, which mitigates environmental interference. Additionally, the blockchain mechanism adopted here—page-level hashing performed at the microcontroller—differs from earlier work such as DrunkChain [5], providing a more cost-efficient and tamper-resistant integrity model. The observed physiological effects of alcohol intake (elevated BPM, reduced SpO2) are consistent with established biomedical evidence, further supporting the system’s reliability.
From a functional perspective, the Raspberry Pi successfully captured, hashed, and transmitted all data entries in real-time. Hashes generated locally on the microcontroller were immediately dispatched to the Ethereum smart contract, ensuring immutability and traceability of each batch of data. Manual integrity checks performed during the analysis phase confirmed that the hashes stored on-chain matched the values recomputed from the raw sensor data stored in the PostgreSQL database. This validates the proper functioning of the blockchain verification mechanism and confirms that no unauthorized modifications occurred throughout the pipeline.
The use of timestamped and geolocated measurements further enhanced the interpretability of the dataset. GPS data recorded by the NEO-6M module confirmed spatial continuity, and allowed for the time-based correlation of alcohol events with the driver’s simulated position. Although spatial variation in a simulator is artificial, the experiment demonstrated the platform’s capacity to log and synchronize spatio-temporal information in real-world scenarios.
The results validate the system’s core capabilities:
  • Real-time detection of alcohol exposure via the MQ-3 sensor.
  • Continuous, non-invasive physiological monitoring using FitBit 3.
  • Automatic fallback to physiological data when breath-based readings become unreliable.
  • Seamless integration with a blockchain verification layer ensuring tamper-proof storage and public auditability.
These findings demonstrate the feasibility of using the proposed hybrid system in both experimental and real-life vehicular contexts. Future field deployments could further validate the system under broader environmental and behavioral conditions.

5. Conclusions

This work presented a fully integrated, non-invasive system for the real-time detection of driver alcohol exposure and geolocation tracking, enhanced by blockchain-based data integrity. The architecture combines three main components: a Modular Sensor Battery (MSB) for breath-based alcohol measurement and GPS tracking; a FitBit IoT smart band for continuous physiological monitoring; and a centralized data collection platform secured by an Ethereum smart contract.
The system was validated in a controlled laboratory setting using a driving simulator, where a total of 24,506 sensor entries were recorded over 1634 min. During the alcohol exposure phase, the MQ-3 sensor successfully detected increasing concentrations of alcohol in the exhaled air, while the FitBit device recorded corresponding physiological changes—namely, elevated heart rate and a subtle drop in blood oxygen saturation.
The FitBit device proved valuable in situations where environmental interference (e.g., open windows, air ventilation) compromised the accuracy of the MQ-3 sensor. In such cases, the physiological data served as a reliable complementary indicator, enabling a multi-sensor strategy that increases system robustness and reduces false negatives.
The blockchain integration further reinforced system reliability by ensuring the authenticity and immutability of all recorded data. Sensor readings were hashed at the microcontroller level and stored securely via a smart contract, enabling transparent verification and tamper resistance without disclosing sensitive health data.
Overall, the results demonstrate that the proposed system is both technically viable and functionally reliable in monitoring sobriety conditions under realistic constraints. Its modular design and open architecture make it suitable for real-world deployment in vehicular environments where driver monitoring and data security are critical.
The strength of this study does not come from the individual hardware components, but from the way they are brought together into a coherent system. We introduced a dual-channel monitoring approach that combines breath-based alcohol detection with physiological indicators, increasing robustness against sensor interference. Then, we ensured data integrity through real-time blockchain verification performed directly at the microcontroller level, eliminating vulnerabilities in intermediate stages. Finally, we designed a modular and scalable architecture that can be readily adapted to vehicular and broader IoT safety infrastructures. Taken together, these innovations clearly differentiate our system from previous work and demonstrate its potential for practical use in enhancing driver safety.
The practical applicability implications include potential extension to field-testing under real traffic conditions, integration with alerting mechanisms or vehicle immobilization subsystems, and an evaluation of scalability in fleet management and public transportation. Positioned within the broader literature on sobriety detection and blockchain-enabled IoT systems, the present work provides a proof-of-concept that advances both technical feasibility and conceptual innovation in vehicular safety monitoring. This proof-of-concept involved a single voluntary participant, which limits its generalizability. Future studies will include larger and more diverse samples.

Author Contributions

Conceptualization, M.G. and D.T.; methodology, M.G., M.F. and M.-G.M.; investigation, D.-E.B. and L.T.; validation, D.T. and M.F. All authors have read and agreed to the published version of the manuscript.

Funding

This research received no external funding.

Data Availability Statement

Data are contained within the article.

Conflicts of Interest

The authors declare no conflict of interest.

References

  1. Drunk Driver Detection Using Multiple Non-Invasive Biosignals. Available online: https://www.mdpi.com/1424-8220/25/5/1281 (accessed on 8 April 2025).
  2. Hoaken, P.N.S.; Giancola, P.R.; Pihl, R.O. Executive cognitive functions as mediators of alcohol-related aggression. Alcohol Alcohol. 1998, 33, 47–54. [Google Scholar] [CrossRef]
  3. Ansari, H.R.; Kordrostami, Z.; Mirzaei, A. In-vehicle wireless driver breath alcohol detection system using a microheater integrated gas sensor based on Sn-doped CuO nanostructures. Sci. Rep. 2023, 13, 7136. [Google Scholar] [CrossRef]
  4. Drunk Driving | Statistics and Resources | NHTSA. Available online: https://www.nhtsa.gov/risky-driving/drunk-driving (accessed on 28 March 2025).
  5. Farooq, H.; Altaf, A.; Iqbal, F.; Galán, J.C.; Aray, D.G.; Ashraf, I. DrunkChain: Blockchain-Based IoT System for Preventing Drunk Driving-Related Traffic Accidents. Sensors 2023, 23, 5388. [Google Scholar] [CrossRef]
  6. Soner, S.; Litoriya, R.; Pandey, P. Integrating Blockchain Technology with IoT and ML to Avoid Road Accidents Caused by Drunk Driving. Wirel. Pers. Commun. 2022, 125, 3001–3018. Available online: https://link.springer.com/article/10.1007/s11277-022-09695-x (accessed on 8 April 2025). [CrossRef]
  7. Jones, A.W. The Relationship between Blood Alcohol Concentration (BAC) and Breath Alcohol Concentration (BrAC): A Review of the Evidence. Road Saf. Web Publ. 2010, 15, 1–43. [Google Scholar]
  8. Abu Al-Haija, Q.; Krichen, M. A Lightweight In-Vehicle Alcohol Detection Using Smart Sensing and Supervised Learning. Computers 2022, 11, 121. [Google Scholar] [CrossRef]
  9. Ferguson, S.; Zaouk, A.; Strohl, C. Driver Alcohol Detection System for Safety (DADSS). Background and Rationale for Technology Approaches; SAE Technical Paper 2010-01-1580; SAE International: Washington, DC, USA, 2010. [Google Scholar] [CrossRef]
  10. Radeisen, E.; Shao, H.; Hesser, J.; Pitz, M.; Wang, W.; Kolditz, O. A heterogeneous material model for dilatancy-controlled gas flow in saturated bentonite. In Proceedings of the 8th International Clay Conference, Nancy, France, 13–16 June 2022. [Google Scholar] [CrossRef]
  11. Reina, J.D.M.; Sanguino, T.J.M. Decentralized and Secure Blockchain Solution for Tamper-Proof Logging Events. Futur. Internet 2025, 17, 108. [Google Scholar] [CrossRef]
  12. Aleisa, M.A. Blockchain-Enabled Zero Trust Architecture for Privacy-Preserving Cybersecurity in IoT Environments. IEEE Access 2025, 13, 18660–18676. [Google Scholar] [CrossRef]
  13. Karpinski, M.; Kuznetsov, O.; Oliynykov, R. Security, Privacy, Confidentiality, and Trust in the Blockchain: From Theory to Applications. Electronics 2025, 14, 581. [Google Scholar] [CrossRef]
  14. Venkatesh, B.; Kapri, P. Usage of Blockchain Technology for Tamper-Proof Audit and Managing Insurance Process. ResearchGate. Available online: https://www.researchgate.net/publication/375058853_Usage_of_Blockchain_Technology_for_Tamper-Proof_Audit_and_Managing_Insurance_Process (accessed on 6 June 2025).
  15. Ferguson, S.A.; Draisin, N.A. Strategies for accelerating the implementation of non-intrusive alcohol detection systems in the vehicle fleet. Traffic Inj. Prev. 2021, 22, 13–19. [Google Scholar] [CrossRef] [PubMed]
  16. Tavallaie, R.; De Almeida, S.R.M.; Gooding, J.J. Toward biosensors for the detection of circulating microRNA as a cancer biomarker: An overview of the challenges and successes. Wiley Interdiscip. Rev. Nanomed. Nanobiotechnology 2015, 7, 580–592. [Google Scholar] [CrossRef]
  17. O’loughlin, D.; Oliveira, B.L.; Elahi, M.A.; Glavin, M.; Jones, E.; Popović, M.; O’halloran, M. Parameter Search Algorithms for Microwave Radar-Based Breast Imaging: Focal Quality Metrics as Fitness Functions. Sensors 2017, 17, 2823. [Google Scholar] [CrossRef]
  18. De Donno, M.; Tange, K.; Dragoni, N. Foundations and Evolution of Modern Computing Paradigms: Cloud, IoT, Edge, and Fog. IEEE Access 2019, 7, 150936–150948. [Google Scholar] [CrossRef]
  19. Scuotto, V.; Ferraris, A.; Bresciani, S.; Del Giudice, M. Internet of Things: Applications and challenges in smart cities: A case study of IBM smart city projects. Bus. Process. Manag. J. 2016, 22, 357–367. [Google Scholar] [CrossRef]
  20. Bettella, G.; Zamboni, R.; Pozza, G.; Zaltron, A.; Montevecchi, C.; Pierno, M.; Mistura, G.; Sada, C.; Gauthier-Manuel, L.; Chauvet, M. LiNbO3 integrated system for opto-microfluidic sensing. Sensors Actuators B Chem. 2019, 282, 391–398. [Google Scholar] [CrossRef]
  21. Ouaddah, A.; Elkalam, A.A.; Ouahman, A.A. FairAccess: A new Blockchain-based access control framework for the Internet of Things. Secur. Commun. Networks 2016, 9, 5943–5964. [Google Scholar] [CrossRef]
  22. Karunarathne, S.M.; Saxena, N.; Khan, M.K. Security and Privacy in IoT Smart Healthcare. IEEE Internet Comput. 2021, 25, 37–48. [Google Scholar] [CrossRef]
  23. Haseeb, S.; Ansari, U.; Ali, H. 500.22 Using Machine Learning Extreme Gradient Boosting Model to Predict Major Adverse Cardiovascular Events: A Systematic Review. JACC: Cardiovasc. Interv. 2024, 17, S55. [Google Scholar] [CrossRef]
  24. Esposito, M.; Palma, L.; Belli, A.; Sabbatini, L.; Pierleoni, P. Recent Advances in Internet of Things Solutions for Early Warning Systems: A Review. Sensors 2022, 22, 2124. [Google Scholar] [CrossRef]
  25. Davoli, L.; Martalò, M.; Cilfone, A.; Belli, L.; Ferrari, G.; Presta, R.; Montanari, R.; Mengoni, M.; Giraldi, L.; Amparore, E.G.; et al. On Driver Behavior Recognition for Increased Safety: A Roadmap. Safety 2020, 6, 55. [Google Scholar] [CrossRef]
  26. Yang, Y.; Jiang, J.; Zeng, J.; Chen, Z.; Zhu, X.; Shi, Y. CH4, C2H6, and CO2 Multi-Gas Sensing Based on Portable Mid-Infrared Spectroscopy and PCA-BP Algorithm. Sensors 2023, 23, 1413. [Google Scholar] [CrossRef]
  27. Llobet, E.; Brezmes, J.; Vilanova, X.; Sueiras, J.E.; Correig, X. Qualitative and quantitative analysis of volatile organic compounds using transient and steady-state responses of a thick-film tin oxide gas sensor array. Sensors Actuators B Chem. 1997, 41, 13–21. [Google Scholar] [CrossRef]
  28. Wei, H.; Xue, Q.; Li, A.; Wan, T.; Huang, Y.; Cui, D.; Pan, D.; Dong, B.; Wei, R.; Naik, N.; et al. Dendritic core-shell copper-nickel alloy@metal oxide for efficient non-enzymatic glucose detection. Sensors Actuators B Chem. 2021, 337, 129687. [Google Scholar] [CrossRef]
  29. Chukleang, T.; Jandaeng, C. Security Enhancement in Smart Logistics with Blockchain Technology: A Home Delivery Use Case. Informatics 2022, 9, 70. [Google Scholar] [CrossRef]
  30. 50 of the most important Raspberry Pi Sensors and Components. Tutorials for Raspberry Pi. Available online: https://tutorials-raspberrypi.com/raspberry-pi-sensors-overview-50-important-components/ (accessed on 28 March 2025).
  31. Gavrilă, M.; Murariu, M.G.; Bărbuță, D.E.; Tărniceriu, D. Development of a Modular Sensor Battery Integrated with a Data Collection Platform for Alcohol Level Detection and Driver Geolocation. In Proceedings of the 15th International Conference on Communications (COMM), Bucharest, Romania, 3–4 October 2024; p. 6. [Google Scholar] [CrossRef]
  32. Anthony, M.; Varia, R.; Kapadia, A.; Mukherjee, M. Alcohol Detection System to Reduce Drunk Driving. Int. J. Eng. Res. Technol. 2021, 9, 360–365. [Google Scholar] [CrossRef]
  33. Guan, Q.; Fan, C.; Chen, G.; Chen, C. Performance Evaluation of BDS/GPS Combined Single Point Positioning with Low-cost Single-Frequency Receiver. J. Indian Soc. Remote Sens. 2021, 49, 2847–2861. [Google Scholar] [CrossRef]
  34. Paterson, A.S.; Raja, B.; Mandadi, V.; Townsend, B.; Lee, M.; Buell, A.; Vu, B.; Brgoch, J.; Willson, R.C. A low-cost smartphone-based platform for highly sensitive point-of-care testing with persistent luminescent phosphors. Lab a Chip 2017, 17, 1051–1059. [Google Scholar] [CrossRef] [PubMed]
  35. Mekki, K.; Bajic, E.; Chaxel, F.; Meyer, F. A comparative study of LPWAN technologies for large-scale IoT deployment. ICT Express 2019, 5, 1–7. [Google Scholar] [CrossRef]
  36. Upton, E.; Halfacree, G. Getting Started with the Raspberry Pi. In Raspberry Pi® User Guide; John Wiley & Sons: Hoboken, NJ, USA, 2016; pp. 23–42. [Google Scholar] [CrossRef]
  37. Gavrilă, M.; Murariu, M.-G.; Ambrozie, R.-E.; Tărniceriu, D. Monitoring Health Traffic Participants Using a IoT Smart Band Integrated with a Data Collection Platform Secured with Blockchain. In Proceedings of the E-Health and Bioengineering Conference (EHB), Iași, Romania, 14–15 November 2024; p. 4. [Google Scholar] [CrossRef]
  38. Wisana, I.D.G.H.W.; Nugraha, P.C.; Amrinsani, F.; Sani, F.F.; Anwar, Y.I.; Palanisamy, S. Smartband for Heartbeat and Oxygen Saturation Monitoring with Critical Warning to Paramedic via IoT. J. Teknokes 2022, 15, 161–166. [Google Scholar] [CrossRef]
  39. Nugroho, E.A.; Herlambang, R.; Juhaeriyah, J.; Wulandari, R. Design and Development of Smart Bracelet System for Heart Health Monitoring Based on Internet of Things (IoT). Malays. J. Sci. Adv. Technol. 2024, 4, 217–221. [Google Scholar] [CrossRef]
  40. Gavrilă, M.; Murariu, M.G.; Bărbuță, D.E.; Mihăilescu, E.; Tărniceriu, D. Enhancing Driver Safety through A Data Collection Platform. In Proceedings of the 16th International Conference on Electronics, Computers and Artificial Intelligence (ECAI), Iași, Romania, 27–28 June 2024; p. 8. [Google Scholar] [CrossRef]
  41. Gavrilă, M.; Fotache, M.; Bărbuţă, D.-E.; Alexandrescu, A.; Murariu, M.-G.; Ambrozie, R.-E.; Tărniceriu, D. Sensor Data Analysis in a Real-Time IoT and Blockchain-Based System for Monitoring Driver Alcohol Levels. In Proceedings of the 2024 International Symposium on Electronics and Telecommunications (ISETC), Timișoara, Romania, 7–8 November 2024; p. 6. [Google Scholar] [CrossRef]
  42. Eenmaa-Dimitrieva, H.; Schmidt-Kessen, M.J. Creating markets in no-trust environments: The law and economics of smart contracts. Comput. Law Secur. Rev. 2019, 35, 69–88. [Google Scholar] [CrossRef]
  43. Bărbuţă, D.-E.; Alexandrescu, A.; Tărniceriu, D.; Gavrilă, M. Leveraging Blockchain to Enhance the Efficiency and Data Integrity of Systems Monitoring Drivers’ Sobriety. In Proceedings of the 23rd RoEduNet Conference: Networking in Education and Research (RoEduNet), Bucharest, Romania, 19–20 September 2024; p. 6. [Google Scholar] [CrossRef]
  44. Alexandrescu, A.; Butincu, C.N. Decentralized News-Retrieval Architecture Using Blockchain Technology. Mathematics 2023, 11, 4542. [Google Scholar] [CrossRef]
  45. Bărbuţă, D.-E.; Alexandrescu, A. A Decentralized Paper Dissemination System Employing Blockchain Technology, Peer Review and Expert Badges. In Proceedings of the 27th International Conference on System Theory, Control and Computing (ICSTCC), Timișoara, Romania, 11–13 October 2023; pp. 321–326. [Google Scholar] [CrossRef]
  46. Bertoni, G.; Daemen, J.; Peeters, M.; Van Assche, G. Keccak. In Advances in Cryptology—EUROCRYPT 2013, Proceedings of the 32nd Annual International Conference on the Theory and Applications of Cryptographic Techniques, Athens, Greece, 26–30 May 2013; Johansson, T., Nguyen, P.Q., Eds.; Springer: Berlin/Heidelberg, Germany, 2013; pp. 313–314. [Google Scholar] [CrossRef]
  47. Simulator auto EMP-23. Atlantis Online Trading. Available online: http://www.atlantisonline.com.ro/ge836yd1/eshop/2-1-AUTO/16-3-SIMULATOARE-AUTO/5/12890-Simulator-auto-EMP-23 (accessed on 30 January 2025).
  48. Li, Y.; Wang, M.; Liu, X.; Rong, J.; Miller, P.E.; Joehanes, R.; Huan, T.; Guo, X.; Rotter, J.I.; Smith, J.A.; et al. Circulating metabolites may illustrate relationship of alcohol consumption with cardiovascular disease. BMC Med. 2023, 21, 443. [Google Scholar] [CrossRef] [PubMed]
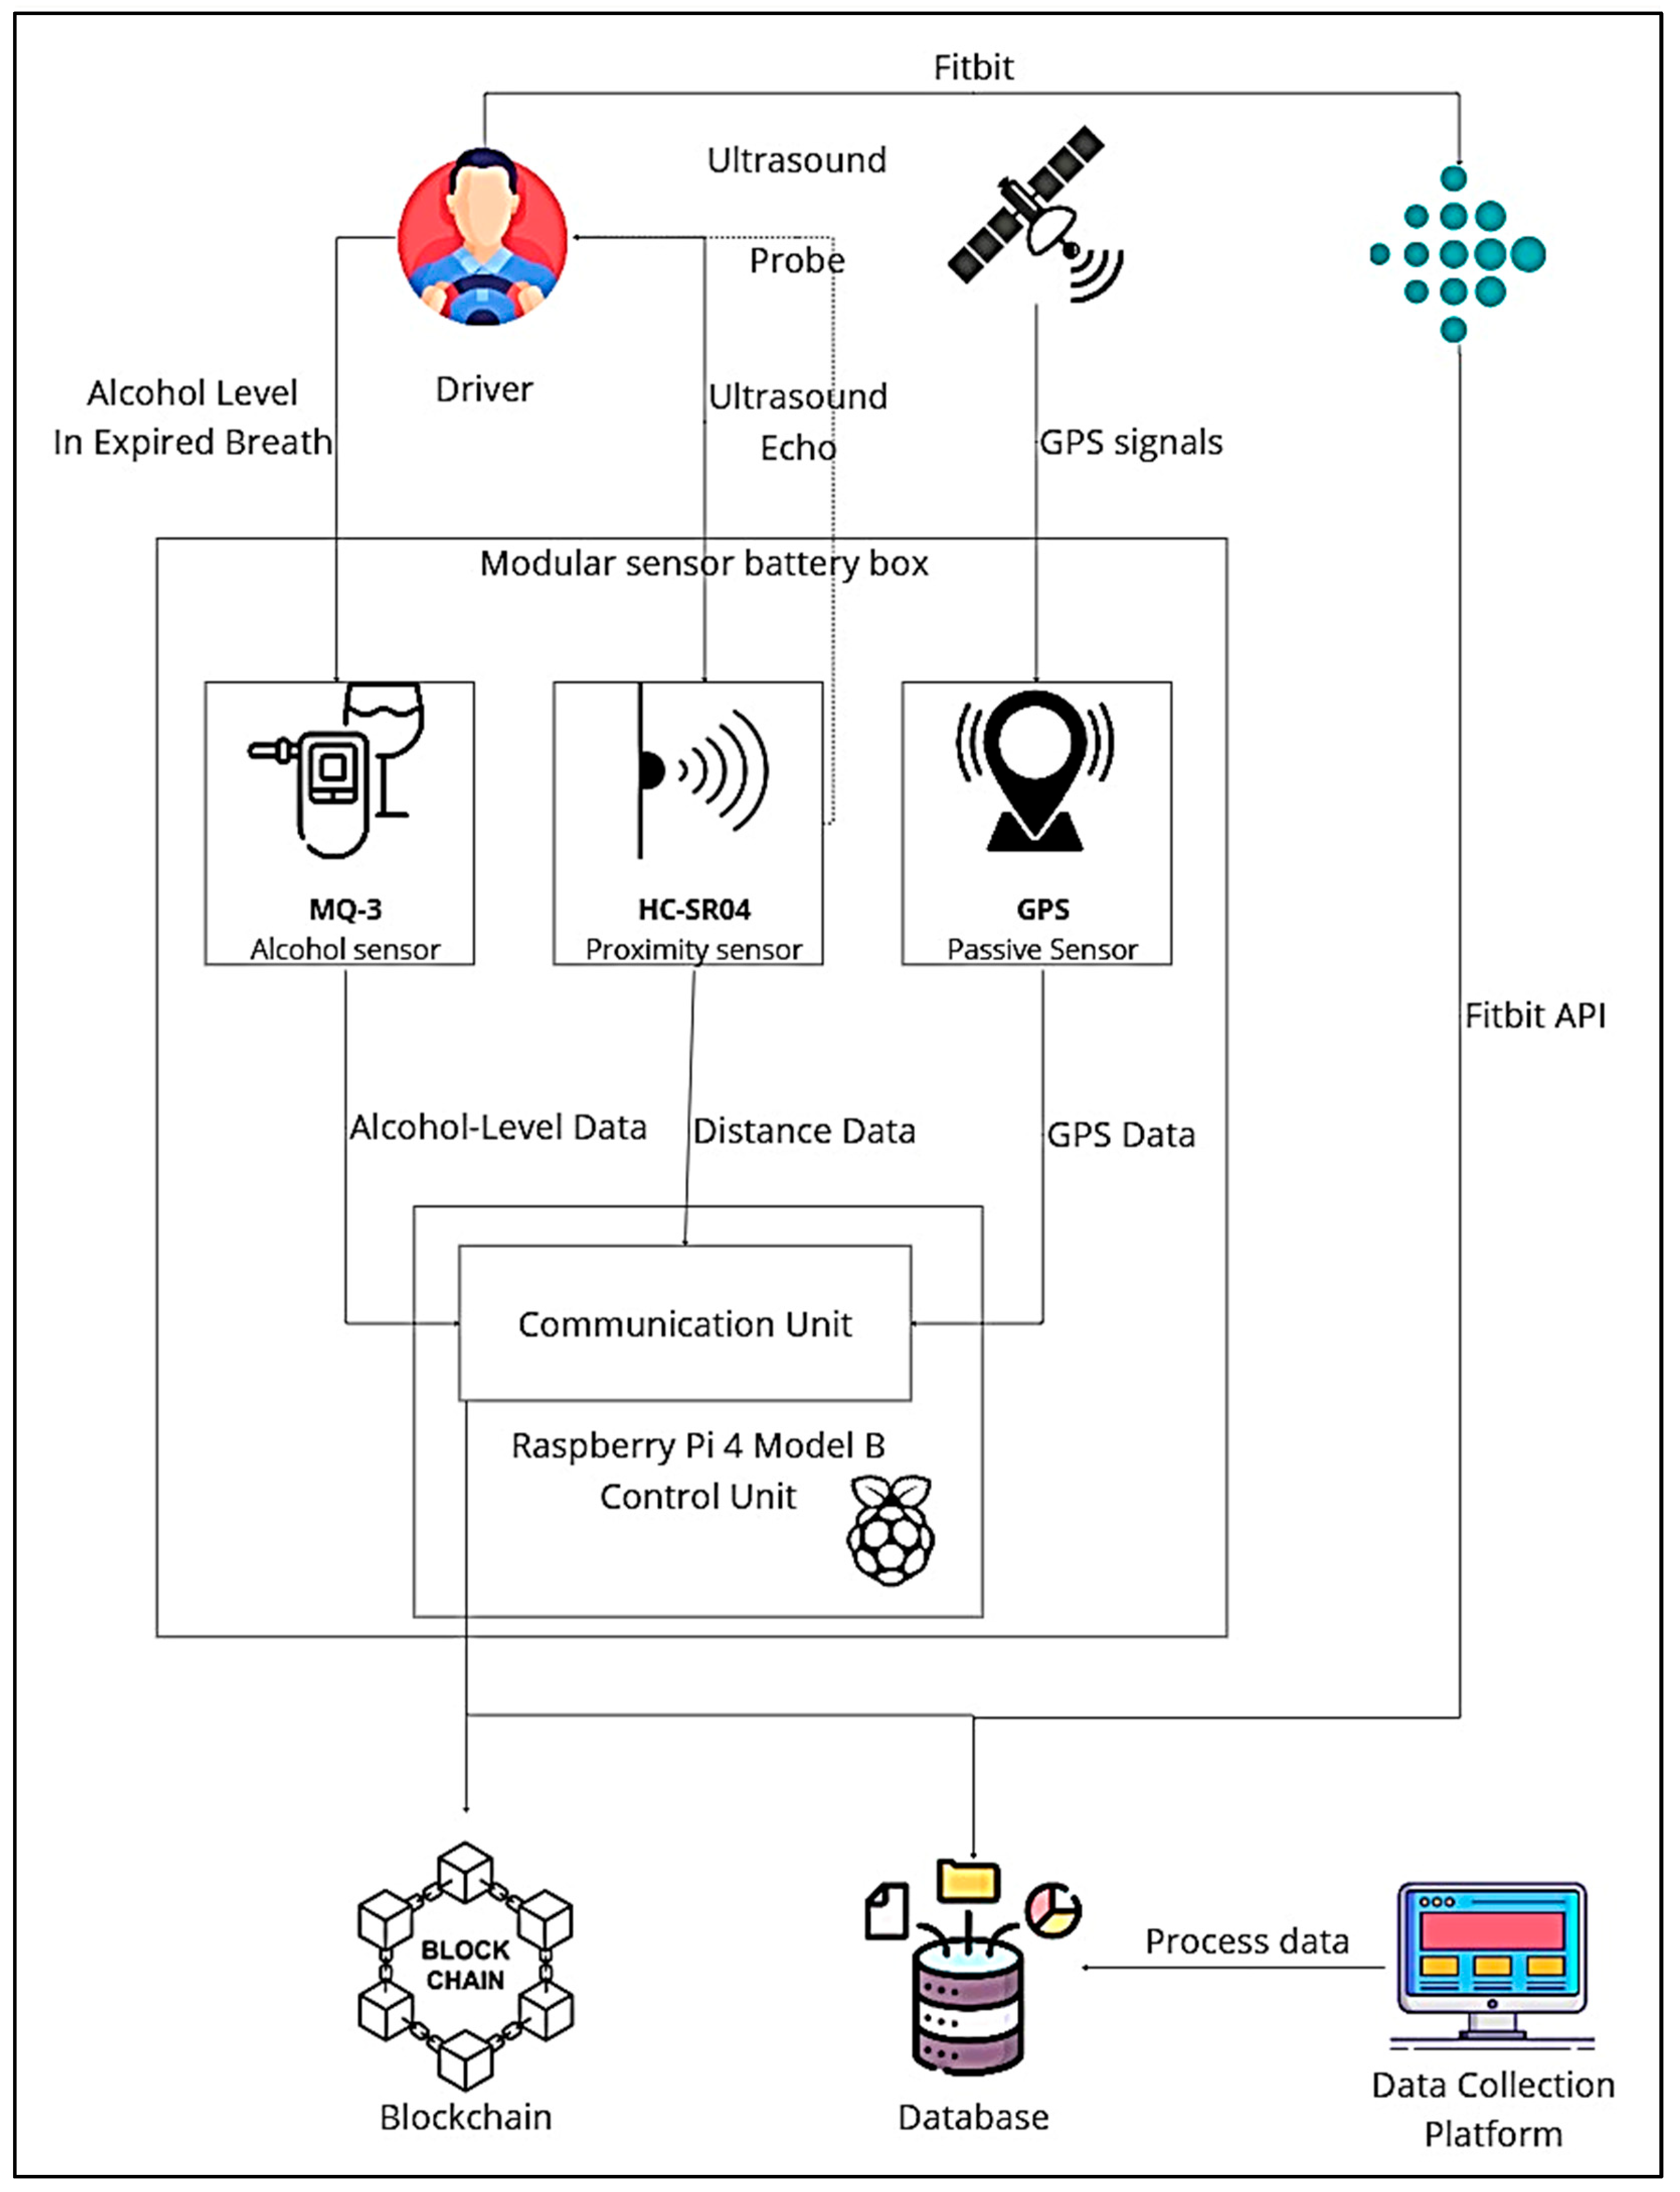
Figure 1. Block diagram of proposed system.
Electronics 14 03728 g001
Figure 2. The Modular Sensor Battery (MSB).
Electronics 14 03728 g002
Figure 3. The sensors in an IoT FitBit smart band bracelet.
Electronics 14 03728 g003
Figure 4. The DC platform home page.
Electronics 14 03728 g004
Figure 5. The ‘Map’ Submodule.
Electronics 14 03728 g005
Figure 6. The ‘GPS Data’ Submodule.
Electronics 14 03728 g006
Figure 7. The ‘Administration’ Module.
Electronics 14 03728 g007
Figure 8. The ‘Metrics’ Submodule.
Electronics 14 03728 g008
Figure 9. Statistics regarding the cache memory.
Electronics 14 03728 g009
Figure 10. Statistics regarding the data sources.
Electronics 14 03728 g010
Figure 11. The VehicleDataStorage smart contract design.
Electronics 14 03728 g011
Figure 12. (a). Temporal progression of alcohol concentration—units are explicitly indicated on the vertical axis. The increasing values recorded by the MQ-3 sensor confirm the gradual accumulation of alcohol vapors throughout the experiment. (b). Temporal progression of heart rate—units are explicitly indicated on the vertical axis. A steady elevation in BPM is observed, particularly during intervals corresponding to higher alcohol concentrations. (c). Temporal progression of blood oxygen saturation ( S p O 2 , %) during the monitoring session. Units are explicitly indicated on the vertical axis. A subtle but consistent decline in S p O 2 levels is evident, with the lowest values coinciding with periods of elevated alcohol concentration.
Electronics 14 03728 g012
Disclaimer/Publisher’s Note: The statements, opinions and data contained in all publications are solely those of the individual author(s) and contributor(s) and not of MDPI and/or the editor(s). MDPI and/or the editor(s) disclaim responsibility for any injury to people or property resulting from any ideas, methods, instructions or products referred to in the content.