Abstract
Electric drive systems (EDSs) are vital for automotive and industrial applications but remain highly vulnerable to cyber and physical anomalies (CPAs), such as inverter open-circuit faults, sensor failures, and malicious cyberattacks. Ensuring reliable EDS operation requires the controller to receive accurate and uncompromised feedback and reference signals continuously. However, many existing data-driven detection and mitigation strategies rely on large training datasets, impose significant computational overhead, and often lose effectiveness under various abnormal operating conditions. To overcome these limitations, this paper introduces a trust evaluation framework that continuously assesses the reliability of all incoming signals to the EDS controller by combining behavioral analysis with historical reliability records. The proposed scheme offers a lightweight and model-independent approach, enabling reliable, adaptive decision-making by leveraging both current and historical signal behavior. To this end, this paper further integrates the resulting trust values into a torque-split optimization algorithm, enabling adaptive load optimization by dynamically reducing the torque contribution of motors operating under abnormal or low-trust conditions, thereby demonstrating clear applicability for automotive drive systems. The framework is validated in a real-time OPAL-RT environment across multiple CPA scenarios, demonstrating accurate anomaly detection and adaptive torque redistribution. Owing to its simplicity and versatility, the proposed method can be readily extended to other safety-critical drive applications.
1. Introduction
In recent years, the application of power electronic systems (PESs) has become central to a wide range of industries, including the automotive sector, industrial automation, utility grid power management, and marine power systems. Advanced control schemes associated with these PESs have enhanced their efficiency and enabled higher power density. However, these advancements in control, communication, and power levels have also made them increasingly susceptible to a range of cyber anomalies and physical faults [1,2]. Therefore, various model-based [3,4,5,6,7,8,9] and data-driven schemes [10,11,12,13,14,15,16,17] are proposed in the existing literature for the detection of these cyber and physical anomalies. Model-based schemes are favored over data-driven approaches due to their faster diagnostic speed and lower computational requirements. However, their performance is often limited under uncertain operating conditions due to system nonlinearities and high reliance on the accuracy of the system’s mathematical model. In contrast, data-driven approaches do not depend on an explicit system model and are capable of handling complex system dynamics through advanced machine learning techniques. Nevertheless, data-driven schemes face challenges related to the scarcity of real-world training data associated with CPAs and the high computational cost involved.
Compared to existing methods for the detection of CPAs, trust evaluation schemes offer a more effective approach to assessing the behavioral reliability of key entities, particularly feedback and reference signals, which are integral to any closed-loop control framework. Moreover, trust evaluation approaches integrate the advantages of both data-driven and model-based schemes. They operate independently of system models, impose a low computational burden, and eliminate the need for large offline training datasets. Moreover, trust evaluation leverages both current and historical operational data, allowing it to assess cumulative behavior over time, leading to more reliable and adaptive decision-making. However, the effectiveness of these frameworks heavily depends on the quality of the reliability assessment metrics and the accurate identification of relevant system parameters.
In this context, ref. [18] introduced a metrics-based trustworthiness scheme for routing protocols in low-power and lossy networks. This approach strengthens security mechanisms against selfish behaviors and internal attackers while achieving lower energy consumption and a higher packet delivery ratio. Moreover, a lightweight and reliable trust mechanism based on multi-source feedback information fusion is proposed in [19] to enhance the adoption of IoT edge devices. This approach effectively mitigates the impact of bad-mouthing attacks caused by malicious feedback providers. Additionally, a multi-dimensional attack-resistant trust model designed for acoustic sensor networks is proposed in [20], utilizing packet error loss, packet loss rate, and link capacity. Given the unreliable communication channels in underwater environments, trust models originally designed for terrestrial wireless sensor networks cannot be effectively adapted for acoustic applications. Similarly, ref. [21] introduces a distributed trust mechanism for wireless sensor network applications, integrating communication trust, energy trust, data trust, recommended reliability, recommended similarity, and indirect trust. Moreover, ref. [22] proposes a context-aware trust evaluation approach that employs a multi-source reputation and trust-based mechanism to assess user trustworthiness in fog-based IoT. In [23], a trust-based mechanism for detecting distributed denial-of-service attacks in vehicular ad hoc networks is presented. The trust evaluation incorporates factors such as residual energy, frequency value statistics, trust policy, trust hypothesis statistics, and data factors. Moreover, a trust assessment scheme [24] is proposed for online social networks, integrating context-specific information, locally generated social trust relationships, and network topological structure data. This approach enhances social trust prediction by up to 5.5% compared to existing methods. Additionally, ref. [25] introduces a mobility trust evaluation model based on communication success rate and sensor node energy consumption to estimate trust values in heterogeneous vehicle networks. In this framework, a mobility strategy is developed for electric vehicles to minimize the total number of transmission hops in trust evaluation. Ref. [26] presents a simplified blockchain-based consensus algorithm for trust evaluation in massive machine-type communication, addressing the lack of an inherent security framework in the Internet of Energy Things and Industrial Internet of Things. Moreover, as federated learning is preferred for its distributed nature, low latency, and high privacy benefits, ref. [27] proposes a trust evaluation framework for federated learning in digital twins for mobile networks based on individual and coordinated trust values for participating users. This framework addresses the limitations of the simplex evaluation factor in conventional coarse-grained trust calculation methods.
To the best of our knowledge, most existing trust evaluation schemes are designed primarily for communication networks or sensor data in distributed systems, where interactions between nodes are governed by trust values. In these systems, the failure of a node does not necessarily compromise overall functionality. However, this is not applicable when centralized control is integrated with various input signals processed over a fixed sampling period for continuous decision-making. In this case, halting the interaction of these incoming signals would disrupt the entire operation. As such, existing schemes lack a methodology specifically tailored to centralized control systems, particularly for applications like EDS. To address this gap, the proposed work introduces a trust evaluation framework for an EV-based EDS, where a decline in trust values triggers a response that reduces the torque demand for the associated EDS under abnormal conditions. Moreover, much like communication networks, these operational technology systems are also vulnerable to various types of CPAs. Therefore, adapting trust-based frameworks from communication networks to cyber-physical systems offers a valuable enhancement to the paradigm of trust evaluation, expanding its application in automotive systems. Moreover, Table 1 illustrates a concise summary that synthesizes the contributions of the proposed scheme and contrasts them with the key limitations of prior studies. The contributions of this work can be summarized as follows:
- 1.
- A generalized trust computing method is proposed, applicable to any system with centralized control and incoming feedback and input signals. Since this framework involves several tunable factors, it can be adjusted to meet the specific requirements of different systems.
- 2.
- The robustness of the proposed trust method is validated across a diverse range of CPAs. To achieve this, this scheme is integrated with a real-time EDS model simulated on OPAL-RT, effectively simulating various CPA scenarios, including power switch open-circuit faults, current sensor faults, and cyberattacks.
- 3.
- This work presents a trust-aware torque-split optimization algorithm that incorporates the trust values of each EDS to further optimize torque distribution across each traction motor, following the principles of adaptive load optimization (ALO).

Table 1.
Characteristics and limitations of past studies and the proposed approach.
Table 1.
Characteristics and limitations of past studies and the proposed approach.
| Method | Investigated System | Anomaly Modes | Contributions | Key Limitations |
|---|---|---|---|---|
| [28] | Electric drive system | False data injection (FDI) attacks | Cyberattack detection and impact analysis on 3-phase current |
|
| [29] | FDI and relay attacks | Cyberattack detection and impact analysis on 3-phase current | ||
| [30] | FDI attacks | Cyberattack detection and impact analysis on 3-phase current | ||
| [31] | OCFs in single power switch | Impact analysis on stator current, detection and distinguish OCFs | ||
| [32] | Single and Double switch OCFs in power converter | Impact analysis on stator current, detection and distinguish OCFs | ||
| [17] | Single and double switch OCFs in power converter and FDI attacks | Impact analysis, detection and differentiation | ||
| [18] | Low-power and lossy networks | Selfish behaviors and internal attackers | Strengthens security mechanism; lower energy consumption and higher packet delivery ratio |
|
| [19] | IoT edge devices | Bad mouthing attacks | Lightweight and reliable trust mechanism | |
| [20] | Acoustic sensor networks | Cyberattacks | Multi-dimensional attack-resistant trust | |
| [21] | Wireless sensor network | None | Distributed trust mechanism | |
| [23] | Vehicular ad hoc networks | Denial-of-service (DoS) attacks | Trust-based mechanism for detecting distributed DoS attacks | |
| [25] | Heterog- eneous vehicle networks | None | Trust evaluation for mobility strategy to minimize the total number of transmission hops | |
| This work | Electric drive system | Cyberattacks, OCFs, and sensor faults |
| |
In this article, Section 2 presents the formulation of the trust evaluation framework for EDS and trust-aware torque-split optimization. Section 3 outlines the trust dynamics for various CPAs to validate the proposed approach’s applicability and evaluates the performance of trust-aware torque-split optimization under different EDS trust values. Finally, Section 4 provides the conclusion.
2. Trust-Aware Control Framework for Electric Drive System
Modern EVs can generally be classified into single-motor or multi-motor drive systems. Traditional EDSs typically lack a continuous authentication mechanism for feedback and reference input signals sent to the motor controller. This absence of the authentication process makes the EDSs vulnerable to disruptions caused by non-routine operating conditions, such as cyberattacks or physical faults, which can further compromise gate drive signals, thereby jeopardizing the system’s security and operational reliability. To address this, a trust evaluation framework is integrated at the controller’s input as a security checkpoint, as shown in Figure 1. This framework continuously monitors the integrity of input signals from sensors and the CAN bus, serving as a monitoring mechanism for the EDS. The details of this trust evaluation framework are explained below.

Figure 1.
Schematic diagram of an electric motor drive based on trust-aware control.
2.1. Trust Behavior Model
To assess the trust level of incoming signals involved in the EDS controller’s decision-making process, the controller must comprehensively record the behavior of these signals. The frameworks supporting the trust evaluation () of the incoming signals within the time window () can be formalized as shown in Equation (1). Here, represents the recorded behavior of the signals, where i represents the segment number corresponding to data within the sliding window. Since these signals are not validated at every sampling instant, the trust evaluation is performed after collecting data over a specified window size. This approach implicitly assumes that the entities contributing to each window remain trustworthy and continue transmitting data to the EDS controller. Once the window is completed, the trustworthiness of the previously accepted entities is reassessed through re-evaluation. This procedure distinguishes the proposed mechanism from a zero-trust approach, where no entity is ever implicitly trusted and every incoming signal must be validated before entering the controller. In contrast, zero-trust is not practical for EDS applications because reliable behavioral validation cannot be achieved from a single sampling instant; instead, a dataset spanning a defined window size is required for meaningful trust assessment. Additionally, even if a trust mechanism were applied at each sampling instance of EDS, it could introduce computational delays that would compromise the performance of the subsequent controller by increasing the total harmonic distortion. Therefore, this proposed trust mechanism is referred to as a trust mechanism rather than a zero-trust mechanism. This recorded data from each window serves as the input for exploratory data analysis (EDA) techniques. Additionally, denotes the reliability score of the incoming signals, while captures their historical reliability record, derived by applying exponential normalization to the values obtained from EDA. Together, these parameters are used to quantify the proposed trust evaluation framework.
The recorded behavior is expressed in Equation (2), where the size of each behavioral segment () is determined by the length of the extracted features or the window size, denoted as (), with (f) representing the number of different features. The features of the EDS (), utilized to compute , are outlined in Equation (3). Here, and represent the measured current and speed values, respectively, while and denote their corresponding reference values. These values, corresponding to the stator current and speed of the permanent magnet synchronous machine (PMSM), can be obtained via model predictive current control, as presented in [33]. Furthermore, the formulation of in Equation (4) incorporates the degree of abnormality () observed between measured and reference values during the interaction of incoming signals with the EDS controller. This is achieved by employing EDA techniques, including mean, interquartile range, and Pearson correlation, for each set of values shown in Equation (3). Consequently, the proposed trust evaluation scheme leverages EDA methods to accurately quantify the operational discrepancies in the EDS.
Here, and are the measured and reference values of EDS features, respectively. The estimated values of operational abnormalities, derived through EDA techniques, are utilized to assess the operational reliability of the EDS, with their records systematically maintained as part of the EDS historical reliability database. Moreover, residual values obtained by taking the mean square error between the measured and reference values of are analyzed through EDA to ensure stationarity. The mean and interquartile range of these residuals are then used to compute , which is subsequently applied in Equation (5) to evaluate the reliability of the traction inverter’s feedback signals (). Conversely, for the speed values, the Pearson correlation coefficient is employed to calculate , which is subsequently used in Equation (5) to evaluate the reliability values of the EDS input signals (). As the reliability is evaluated for all incoming signals of the EDS controller, both input and feedback signals are taken into account. Furthermore, the reliability formulation for the input signal is separated from that of the feedback signals, because this can also help to localize the reliability degradation between feedback and inputs for future work. Different data normalization methods are utilized for and because of the nature of the input data. Furthermore, since utilizes an EDA approach with values already scaled between 0 and 1, the negative exponent-based scaling is not applied for computing . The parameter in Equation (5) denotes the total number of values considered in the numerator, which can vary based on the number of EDA techniques utilized. The value of while computing will be 1. The reliability values are bounded within the range [0, 1] due to the applied normalization scheme. This method for estimating operational reliability is highly versatile and can be scaled to apply to other systems. Moreover, the overall signal-based reliability of EDS is formalized in Equation (6).
Hence, the recorded behavior of the EDS is used to represent its operational trustworthiness. To evaluate the overall EDS reliability value while considering both hardware-based feedback signals and user-provided input signals, the calculation is formalized in Equation (7). In this formulation, where multiple values are aggregated, normalization plays a crucial role in ensuring balanced evaluation, as shown in Equation (7). This equation also incorporates historical reliability values, which serve as a weighting factor to determine the current reliability. The weighting factor is expressed as , where denotes the historical negative interactions. Additionally, the term () represents the time-forgetting factor, which gradually diminishes the influence of historical negative interactions on current reliability values over time. This indicates that the historical reliability values based on the far past will not have much value. Moreover, since the historical reliability values account only for negative interactions, a higher value leads to a smaller outcome from the negative exponent-based weighting factor in (5), thereby reducing the overall system reliability, and vice versa.
The variable c represents the number of negative iterations in the past 10 interactions. Additionally, corresponds to the variance () of the behavioral stability of the EDS with segment length , denoted as , which is calculated using Equation (9). The stability value is determined based on the consecutive interaction of for each sampling period. The variance of the captured data is higher in cases of abnormal operational behavior compared to normal conditions. These dynamics are then employed to estimate , which influences the changes in reliability values over time under varying operational conditions.
2.2. Trust Evaluation Model
This section explains the proposed trust evaluation criteria for EDSs. The primary objective of this approach is to assess the operational trustworthiness of an EDS, based on its operational reliability values. The resulting trust values will be incorporated into the torque-split optimization algorithm, as illustrated in Figure 2. In this way, the distribution of the required total torque can be further optimized, taking into account the trustworthiness of each EDS and reducing the torque demand from an EDS already operating under abnormal conditions. The trust value, , is calculated using Equation (10), where a higher trust factor () results in a higher trust value. The mathematical formulation in Equation (10) is designed to regulate the rate of change in trust values. It is assumed that trust can neither start at zero nor one; instead, it always begins at 0.5. Furthermore, Equation (10) ensures that trust does not increase abruptly but rather grows gradually over time toward a maximum value of 1, without ever exceeding it. This behavior is also illustrated in the graphical results presented in the Results section. These dynamics primarily depend on the trust factor (), which in turn is governed by the variations in the previously obtained reliability values.
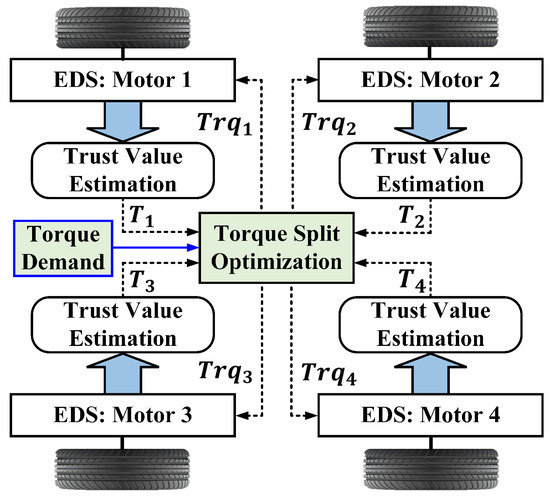
Figure 2.
Application of trust-based evaluation on torque-split optimization.
Moreover, the value of , which enforces an acceptable reliability threshold for computing trust, is estimated via Equation (12). Through , one can distinguish between normal conditions, mild abnormalities, and severe abnormalities based on the current reliability values. Additionally, the function in Equation (13) modifies the reliability values to regulate the rate at which trust changes over time, ensuring that trust increases gradually. The terms () and describe how trust changes over time, showing a quick drop at first and then a slow recovery, as can be seen for various case study scenarios in the Results section. Furthermore, the weighting factors ( and ) can be adjusted to regulate the rate of trust variation across behavioral segments, depending on the specific application.
Hence, the main purpose of these formulations is to express reliability values in terms of trust while controlling their dynamics under both normal and abnormal conditions, ensuring that trust decreases sharply when needed but recovers gradually.
2.3. Trust-Aware Torque-Split Optimization
The primary function of the EDS is to deliver the required torque necessary to generate the yaw moment commanded by the vehicle’s lateral stability control system. In Figure 2, Motors 1 and 2 represent the motor drives on the front-right and rear-right wheels, respectively, while Motors 3 and 4 correspond to the front-left and rear-left motor drives. The total torque demand () and speed demand are initially distributed between the right and left motors. These distributed torque and speed values are then used to determine the torque-split ratio () between the front and rear wheels, separately for the right and left sides. In this context, Equation (14) illustrates how the torque is calculated for the right-side wheels.
is the demanded torque for the right-sided wheels of the vehicle. The torque for the two right wheels as a function of associated trust values [ and ] is defined by Equations (15) and (16), where and represent the additional torque required to achieve yaw moment (), as expressed in Equation (17). Here, and represent the distances from the vehicle’s center of mass to the front and rear axles, respectively, denotes the distance between the front and rear axles, and is the dynamic tire radius.
Based on the physical constraints, each xth motor has associated maximum () and minimum () torque limits, as shown in Equation (18). Similarly, the torque for the left-side motors can be estimated in the same manner.
Furthermore, interior permanent magnet synchronous motors (IPMSMs) are commonly chosen as traction motors in electric vehicles (EVs) due to their high power density and smooth torque production. In this context, Figure 1 illustrates the IPMSM-based configuration of a single EDS. Moreover, the dynamic mathematical model in [33] is utilized to model the model-predictive current control-based IPMSM controller for EDS.
3. Real-Time Experimental Validation
The effectiveness of the proposed trust evaluation approach is validated using a real-time simulation model of the EDS shown in Figure 1. This experimental setup aims to illustrate the viability of the presented framework for real-time applications. The EDS with ATM-based MPC is implemented in a MATLAB/Simulink environment integrated with a real-time digital simulator, i.e., Opal-RT OP4510. The model is executed in RT-LAB with real-time hardware synchronization. Moreover, the detailed implementation of EDS in OPAL-RT is shown in Figure 3, where the power converter and IPMSM are simulated in the FPGA solver with a sampling time of up to 210 ns, and the controller is implemented in the CPU of OPAL-RT with a sampling rate of 25 s.
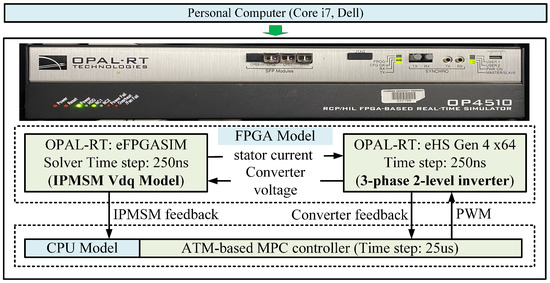
Figure 3.
Motor drive system with MPC-based control implementation on OPAL-RT testbed.
3.1. Trust Value Estimation
This study evaluates the effectiveness of the proposed trust estimation scheme for an EDS under non-routine operating conditions, including open-circuit faults (OCFs) in traction inverter power switches, current sensor faults, and cyberattacks, as detailed in Table 2. These cyber and physical anomalies, discussed in [17,34], are selected due to their prominence in existing research. The real-time effects of these anomalies on the electrical, mechanical, and thermal parameters of the EDS are not reiterated here, as they have already been thoroughly analyzed in [17]. The following subsections validate the proposed trust evaluation framework in relation to these cyber and physical anomalies.

Table 2.
CPAs considered for the proposed trust evaluation strategy.
Table 2.
CPAs considered for the proposed trust evaluation strategy.
| Cases | Category | Description |
|---|---|---|
| I | SS-OCF [17] | OCF instigated in S4. |
| II | SDS-OCF [17] | OCF instigated in S3, S4. |
| III | CDS-OCF [17] | OCF instigated in S3, S6. |
| IV | PDS-OCF [17] | OCF instigated in S3, S5. |
| V | Stuck fault [17] | Stuck fault in phase-B current sensor. |
| VI | Sensor OCF [17] | OCF fault in phase-A current sensor. |
| VII | Cyberattack [34] | Targeting reference speed of EDS. |
| VIII | Cyberattack [17] | Targeting Phase B current. [] |
| IX | Cyberattack [17] | Targeting Phases B, C currents. [] |
| X | Cyberattack [17] | Targeting Phases A, B, C currents. [] |
| XI | Cyberattack [17] | Targeting Phases A, B currents. [] |
| XII | Cyberattack [17] | Targeting Phase A current. [] |
3.1.1. Dynamics of Trust Value During Power Switch Faults
The OCF-based physical faults in the traction inverter of an EDS are classified into four categories: single-switch (SS) OCF, series-double-switch (SDS) OCF, cross-double-switch (CDS) OCF, and parallel-double-switch (PDS) OCF [17]. These faults are simulated by permanently setting the gating signal of a specific power switch in the inverter to zero, replicating the conditions of an OCF. In this section, one fault from each category—single and double-switch—is introduced to observe the dynamics associated with reliability and trust value computations using the proposed scheme.
In this context, the reliability is estimated using Equation (6), the weighted reliability via Equation (7), and the trust values using Equation (10) for each OCF case study, as shown in Figure 4. All values are normalized between 0 and 1. The reliability calculated using Equation (6) remains above 0.8 unless an OCF occurs in the EDS. At the moment an OCF occurs, the reliability drops sharply due to the event-driven assessment approach embedded in Equation (6). However, this reliability measure does not consider the cumulative impact of past negative interactions caused by CPAs. As a result, the reliability value returns to its original level once the fault is removed. To address this, the weighted reliability is computed using Equation (7), which incorporates a time-forgetting factor. This factor prevents the reliability from immediately returning to 1 after the fault is cleared. Instead, the reliability gradually recovers, reflecting the lingering impact of past negative events. As a result, the time-forgetting factor ensures a more realistic and gradual restoration of the reliability values over time. Furthermore, the trust values are estimated for each OCF case, with the initial trust value set at 0.5, representing a baseline level of intermediate trust in the EDS at the start. As the EDS operates under normal conditions, the trust value gradually increases over time, reflecting the natural progression of trust in any system. In the event of an OCF, the trust value decreases but subsequently recovers, gradually rising back, based on the dynamics driven by the corresponding reliability values. Moreover, the recovery time associated with each fault category after the fault is cleared varies in each case, as shown in Figure 4, because it is influenced by the variance values highlighted in Equation (9). Moreover, it is assumed that no negative historical interactions exist in this case. As a result, the rates of change in reliability and trust are similar.
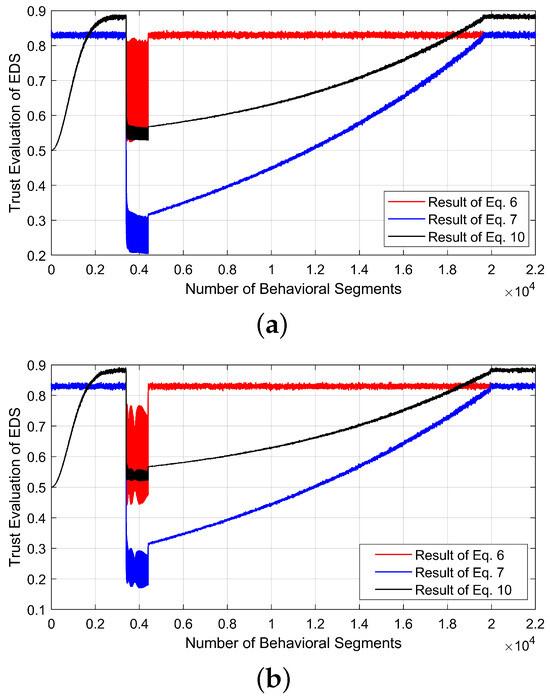
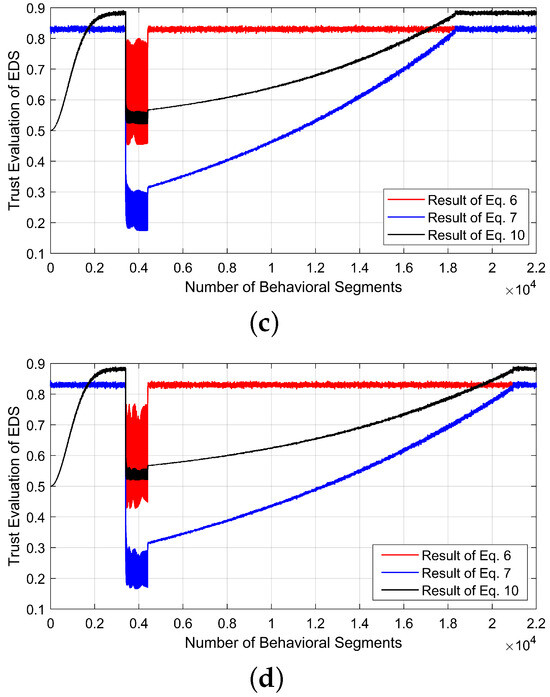
Figure 4.
Trust evaluation dynamics during OCF-based physical faults: (a) SS-OCF [Case I], (b) SDS-OCF [Case II], (c) CDS-OCF [Case III], (d) PDS-OCF [Case IV].
3.1.2. Dynamics of Trust Value During Sensor Faults
Two types of physical faults in the EDS current sensor are considered: stuck fault and OCF. In the case of a stuck fault, where the phase-B current remains fixed at a constant value, the corresponding impact on reliability and trust quantification is illustrated in Figure 5a. Similarly, when the current sensor associated with phase-A fails and provides zero current feedback to the EDS controller (OCF), the resulting variations in reliability and trust are depicted in Figure 5b. It is evident that the recovery time is longer in the case of an OCF fault due to the increased fluctuation in the stability values, and this behavior is formulated using Equation (9).
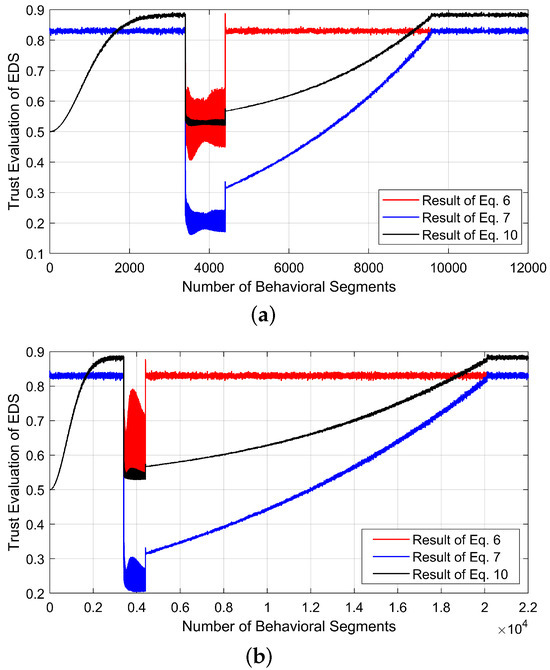
Figure 5.
Trust evaluation dynamics during sensor-based physical faults: (a) stuck fault [Case V], (b) OCF [Case VI].
3.1.3. Dynamics of Trust Value During Cyberattacks
This section analyzes the dynamics of trust values in the EDS under various cyberattacks affecting the reference input speed signal and feedback signals. Specifically, for a cyberattack targeting the reference speed, the Pearson correlation coefficient (PCC) between the message sequence patterns of the input and feedback speed in the CAN bus, as reported in [34], is shown in Figure 6a. The corresponding variations in the trust value of the EDS, computed using Equation (10) and derived from the PCC values, are depicted in Figure 6b. Notably, unlike other cases, attacks that manipulate the reference speed do not increase the total harmonic distortion of the feedback three-phase current. As a result, the impact of a gradual increase in trust is negligible, leading to a trust value that closely follows the observed PCC variations, as shown in Figure 6b. Moreover, cases VIII to XII examine cyberattacks that manipulate the 3-phase feedback current values from the current sensor, thereby affecting the EDS controller. These attacks are formulated as described in [17] and are further classified into positive and negative multiplier-based attacks. Additionally, the reliability and trust values associated with these positive and negative multiplier-based false data injection attacks on three-phase feedback current are illustrated in Figure 7 and Figure 8. Among these cases, case VIII exhibits the shortest trust recovery time, as it involves tampering with only a single phase, whereas cases X and XII have the longest trust recovery times, evaluated based on the number of behavioral segments.
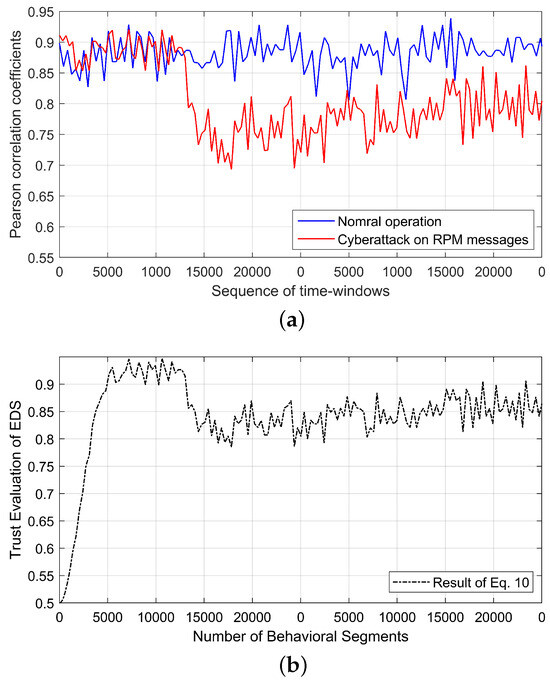
Figure 6.
Case VII: Trust evaluation dynamics during a cyberattack on reference speed. (a) Pearson correlation coefficient [34], (b) trust value dynamics.
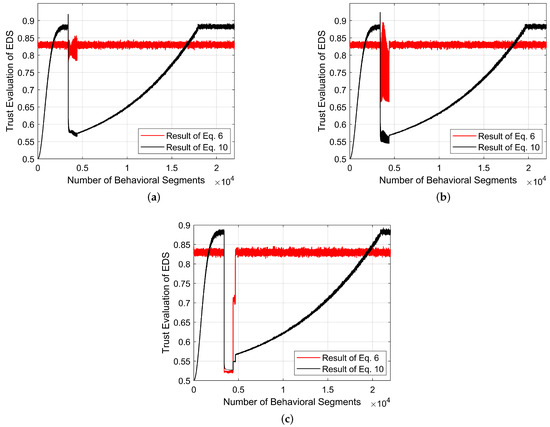
Figure 7.
Trust evaluation dynamics under positive multiplier-based cyberattacks: (a) Case VIII, (b) Case IX, (c) Case X.
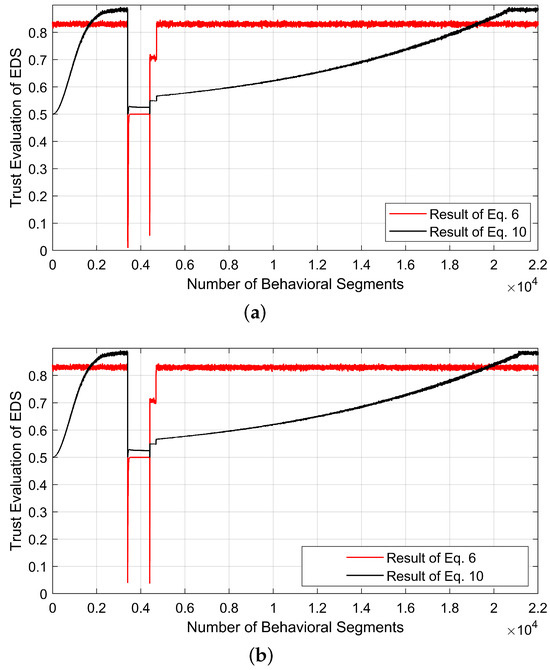
Figure 8.
Trust evaluation dynamics under negative multiplier-based cyberattacks: (a) Case XI, (b) Case XII.
Hence, estimating the trust values using the proposed model-based scheme validates its effectiveness, demonstrating its applicability to various types of CPAs. Consequently, it can be utilized to monitor the operational status of the EDS, enabling its integration into the torque-split optimization algorithm for real-time updates of the required torque values. Additionally, the proposed scheme can serve as an anomaly detection mechanism. However, implementing this functionality may require a dynamic threshold estimation scheme, which will be the focus of future work. Moreover, the comparison of contributions between proposed and prior studies is highlighted in Table 3.

Table 3.
Comparison of the proposed contributions with prior anomaly-detection studies.
Table 3.
Comparison of the proposed contributions with prior anomaly-detection studies.
| Research Methodology | CA Detection | OCF Detection | SF Detection | Detection Time (ms) | Accuracy (%) |
|---|---|---|---|---|---|
| [35] | T | NT | NT | – | 92.10 |
| [30] | T | NT | NT | 50.0 | 99.50 |
| [36] | NT | T | NT | 40.0 | 88.53 |
| [11] | NT | T | T | 20.0 | 98.83 |
| [28] | T | NT | NT | 12.5 | 99.90 |
| [37] | T | NT | NT | 10.0 | 90.00 |
| [29] | T | NT | NT | 2.5 | 98.44 |
| This work | T | T | T | 2.5 | 100 |
CA: Cyberattack. OCF: Open-Circuit Fault. SF: Sensor Fault. NT: Not Tested. T: Tested.
3.2. Impact of Trust Values on Torque-Split Optimization
To evaluate the impact of individual EDS trust values on torque-split optimization, a vehicle model, as described in [38], is utilized. The drive cycle used for this vehicle model is shown in Figure 9. Additionally, the optimized torque demands for each motor in a four-motor drive system are presented in Figure 10. Under normal operation, when the trust values exceed 0.8, each EDS is considered fully trustworthy based on its operational performance. As a result, during this phase, the torque-split optimization algorithm operates normally. The torque values associated with each motor (M1, M2, M3, and M4) during this normal operation are shown as original torque values in Figure 10, corresponding to the drive cycle illustrated in Figure 9. To investigate the impact of the previously calculated trust values, it is assumed that EDS-1 and EDS-4 experience CPAs, which are detected by the proposed trust evaluation framework. As a result, these trust values are input into the torque-split optimization algorithm to reduce the torque demand from the affected EDSs, as they are under stress due to the CPA event. Specifically, the trust values for EDS-1 and EDS-4 are reduced to 0.6 and 0.7, respectively. Consequently, the torque values for M1 and M4 are also reduced, as shown by the updated torque in Figure 10. The average percentage difference between the original and updated torque for M1 and M4 is 40% and 30%, respectively. Moreover, Figure 11 illustrates the residual values obtained using the reference () and measured () current values. The results demonstrate that reducing the demanded torque during a CPA event effectively minimizes system-level fluctuations, thereby mitigating the impact of CPA. In this context, anomalies associated with physical faults, sensor faults, and cyberattacks are considered in Figure 11 to validate this mitigation approach.
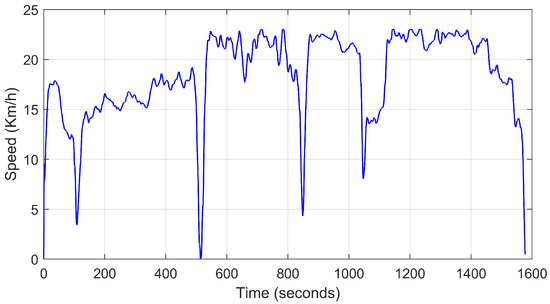
Figure 9.
Drive cycle utilized for the vehicle model.
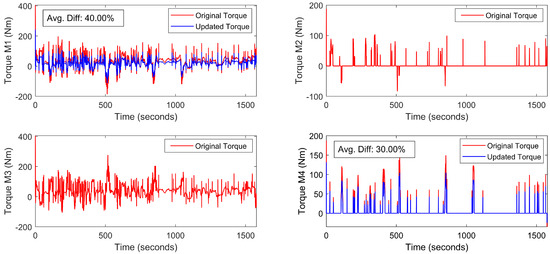
Figure 10.
Torque values corresponding to each electric motor in an EV.
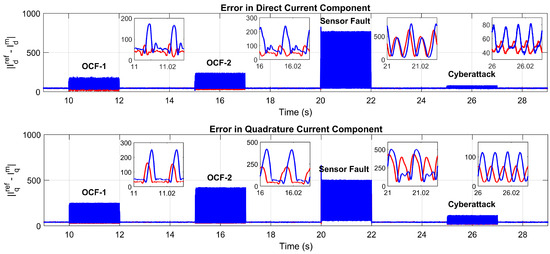
Figure 11.
Impact of ALO on system fluctuations during various CPAs: with ALO [red], without ALO [blue].
Hence, this approach to reducing torque demand can mitigate the impact of CPAs on system performance. By lowering the torque demand, the EDS reduces the current drawn from the battery. As a result, the impact of the associated CPA on system performance is lessened. This reduction in current not only minimizes the effect on the battery’s state of charge (SoC) but also decreases the likelihood of further failures that may stem from the initial CPA event.
4. Conclusions
The proposed trust evaluation framework for EDS monitors the reliability of the controller’s input signals using EDA schemes, which are subsequently utilized to formulate trust values. This scheme facilitates the detection of various CPAs and enhances the resilience of EDS by continuously assessing and monitoring reliability. Furthermore, integrating trust values with torque-split optimization serves as a mitigation strategy, reducing the impact of anomalies on system-level fluctuations through ALO.
Various case studies involving open-circuit faults, sensor malfunctions, and cyber threats validate the effectiveness of the proposed framework in identifying and mitigating these anomalies while demonstrating its applicability and versatility across different scenarios. This approach can be further refined to distinguish between different types of anomalies, thereby enabling precise localization. Moreover, the scale of disruption can be characterized based on its impact on the trust values. Moreover, since an electric vehicle can be equipped with multiple EDSs, performing trust evaluation for each system enables researchers to develop health monitoring applications and implement responsive control strategies in the event of reliability degradation in any individual EDS.
Additionally, the integration of the proposed scheme with torque split optimization can be further enhanced for different realistic driving conditions while further incorporating vehicle dynamics, which will be the focus of our future work.
Author Contributions
Methodology, A.A.; Validation, A.A. and G.O.; Investigation, A.A., B.P., G.K.M., A.A.K. and C.S.E. All authors have read and agreed to the published version of the manuscript.
Funding
This study was supported by the Simulation-Based Reliability and Safety Program for modeling and simulation of military ground vehicle systems, under the technical services contract No. W56HZV-17-C-0095 with the U.S. Army DEVCOM Ground Vehicle Systems Center (GVSC). DISTRIBUTION STATEMENT A. Approved for public release; distribution is unlimited. OPSEC9429.
Data Availability Statement
The original contributions presented in this study are included in the article. Further inquiries can be directed to the corresponding author(s).
Acknowledgments
The authors would like to express their gratitude for the valuable resources and facilities provided by the Secure Energy and Automation Laboratory (SEAL) and Real Time Controls and Optimization Laboratory (RTCOOL). The authors would like to acknowledge the Warren H. Owen Distinguished Professorship Endowment for its support of the research effort.
Conflicts of Interest
The authors declare no conflicts of interest.
References
- Global Automotive Cybersecurity Report 2023. Available online: https://upstream.auto/reports/global-automotive-cybersecurity-report/ (accessed on 17 August 2024).
- Zhou, X.; Sun, J.; Li, H.; Lu, M.; Zeng, F. PMSM open-phase fault-tolerant control strategy based on four-leg inverter. IEEE Trans. Power Electron. 2019, 35, 2799–2808. [Google Scholar] [CrossRef]
- Zhou, D.; Qiu, H.; Yang, S.; Tang, Y. Submodule voltage similarity-based open-circuit fault diagnosis for modular multilevel converters. IEEE Trans. Power Electron. 2018, 34, 8008–8016. [Google Scholar] [CrossRef]
- Zhou, D.; Yang, S.; Tang, Y. A voltage-based open-circuit fault detection and isolation approach for modular multilevel converters with model-predictive control. IEEE Trans. Power Electron. 2018, 33, 9866–9874. [Google Scholar] [CrossRef]
- Zhao, H.; Cheng, L. Open-switch fault-diagnostic method for back-to-back converters of a doubly fed wind power generation system. IEEE Trans. Power Electron. 2017, 33, 3452–3461. [Google Scholar] [CrossRef]
- Gou, B.; Ge, X.L.; Liu, Y.C.; Feng, X.Y. Load-current-based current sensor fault diagnosis and tolerant control scheme for traction inverters. Electron. Lett. 2016, 52, 1717–1719. [Google Scholar] [CrossRef]
- Giraldo, J.; Urbina, D.; Cardenas, A.; Valente, J.; Faisal, M.; Ruths, J.; Tippenhauer, N.O.; Sandberg, H.; Candell, R. A survey of physics-based attack detection in cyber-physical systems. ACM Comput. Surv. 2018, 51, 1–36. [Google Scholar] [CrossRef]
- Mishra, S.; Shoukry, Y.; Karamchandani, N.; Diggavi, S.N.; Tabuada, P. Secure state estimation against sensor attacks in the presence of noise. IEEE Trans. Control Netw. Syst. 2016, 4, 49–59. [Google Scholar] [CrossRef]
- Mo, Y.; Sinopoli, B. Secure control against replay attacks. In Proceedings of the 2009 47th Annual Allerton Conference on Communication, Control, AND Computing (Allerton), Monticello, IL, USA, 30 September–2 October 2009; IEEE: New York, NY, USA, 2009; pp. 911–918. [Google Scholar]
- Gao, Z.; Cecati, C.; Ding, S.X. A survey of fault diagnosis and fault-tolerant techniques—Part II: Fault diagnosis with knowledge-based and hybrid/active approaches. IEEE Trans. Ind. Electron. 2015, 62, 3768–3774. [Google Scholar] [CrossRef]
- Gou, B.; Xu, Y.; Xia, Y.; Deng, Q.; Ge, X. An online data-driven method for simultaneous diagnosis of IGBT and current sensor fault of three-phase PWM inverter in induction motor drives. IEEE Trans. Power Electron. 2020, 35, 13281–13294. [Google Scholar] [CrossRef]
- Cai, B.; Zhao, Y.; Liu, H.; Xie, M. A data-driven fault diagnosis methodology in three-phase inverters for PMSM drive systems. IEEE Trans. Power Electron. 2016, 32, 5590–5600. [Google Scholar] [CrossRef]
- Wang, T.; Xu, H.; Han, J.; Elbouchikhi, E.; Benbouzid, M.E.H. Cascaded H-bridge multilevel inverter system fault diagnosis using a PCA and multiclass relevance vector machine approach. IEEE Trans. Power Electron. 2015, 30, 7006–7018. [Google Scholar] [CrossRef]
- Ye, S.; Jiang, J.; Li, J.; Liu, Y.; Zhou, Z.; Liu, C. Fault diagnosis and tolerance control of five-level nested NPP converter using wavelet packet and LSTM. IEEE Trans. Power Electron. 2019, 35, 1907–1921. [Google Scholar] [CrossRef]
- Jan, S.U.; Lee, Y.D.; Shin, J.; Koo, I. Sensor fault classification based on support vector machine and statistical time-domain features. IEEE Access 2017, 5, 8682–8690. [Google Scholar] [CrossRef]
- Arsalan, A.; Timilsina, L.; Papari, B.; Muriithi, G.; Ozkan, G.; Kumar, P.; Edrington, C.S. Cyber Attack Detection and Classification for Integrated On-board Electric Vehicle Chargers subject to Stochastic Charging Coordination. Transp. Res. Procedia 2023, 70, 44–51. [Google Scholar] [CrossRef]
- Arsalan, A.; Papari, B.; Timilsina, L.; Muriithi, G.; Moghassemi, A.; Rahman, S.M.I.; Buraimoh, E.; Ozkan, G.; Edrington, C.S. Enhanced Real-Time ATM-Based MPC for Electric Vehicles With Cyber–Physical Security Aspect. IEEE Trans. Transp. Electrif. 2025, 11, 4698–4716. [Google Scholar] [CrossRef]
- Djedjig, N.; Tandjaoui, D.; Medjek, F.; Romdhani, I. Trust-aware and cooperative routing protocol for IoT security. J. Inf. Secur. Appl. 2020, 52, 102467. [Google Scholar] [CrossRef]
- Yuan, J.; Li, X. A reliable and lightweight trust computing mechanism for IoT edge devices based on multi-source feedback information fusion. IEEE Access 2018, 6, 23626–23638. [Google Scholar] [CrossRef]
- Han, G.; Jiang, J.; Shu, L.; Guizani, M. An attack-resistant trust model based on multidimensional trust metrics in underwater acoustic sensor network. IEEE Trans. Mob. Comput. 2015, 14, 2447–2459. [Google Scholar] [CrossRef]
- Jiang, J.; Han, G.; Wang, F.; Shu, L.; Guizani, M. An efficient distributed trust model for wireless sensor networks. IEEE Trans. Parallel Distrib. Syst. 2014, 26, 1228–1237. [Google Scholar] [CrossRef]
- Hussain, Y.; Zhiqiu, H.; Akbar, M.A.; Alsanad, A.; Alsanad, A.A.A.; Nawaz, A.; Khan, I.A.; Khan, Z.U. Context-aware trust and reputation model for fog-based IoT. IEEE Access 2020, 8, 31622–31632. [Google Scholar] [CrossRef]
- Poongodi, M.; Hamdi, M.; Sharma, A.; Ma, M.; Singh, P.K. DDoS detection mechanism using trust-based evaluation system in VANET. IEEE Access 2019, 7, 183532–183544. [Google Scholar] [CrossRef]
- Jiang, N.; Wen, J.; Li, J.; Liu, X.; Jin, D. Gatrust: A multi-aspect graph attention network model for trust assessment in osns. IEEE Trans. Knowl. Data Eng. 2022, 35, 5865–5878. [Google Scholar] [CrossRef]
- Wang, T.; Luo, H.; Zeng, X.; Yu, Z.; Liu, A.; Sangaiah, A.K. Mobility based trust evaluation for heterogeneous electric vehicles network in smart cities. IEEE Trans. Intell. Transp. Syst. 2020, 22, 1797–1806. [Google Scholar] [CrossRef]
- Garcia, N.; Hammad, E.; Farraj, A. Soft-Trust Based Architecture for NextG IIoT/IoET Security, Authentication and Authorization. In Proceedings of the 2023 IEEE Texas Power and Energy Conference (TPEC), College Station, TX, USA, 13–14 February 2023; IEEE: New York, NY, USA, 2023; pp. 1–6. [Google Scholar]
- Guo, J.; Liu, Z.; Tian, S.; Huang, F.; Li, J.; Li, X.; Igorevich, K.K.; Ma, J. TFL-DT: A trust evaluation scheme for federated learning in digital twin for mobile networks. IEEE J. Sel. Areas Commun. 2023, 41, 3548–3560. [Google Scholar] [CrossRef]
- Yang, B.; Ye, J.; Guo, L. Fast detection for cyber threats in electric vehicle traction motor drives. IEEE Trans. Transp. Electrif. 2021, 8, 767–777. [Google Scholar] [CrossRef]
- Guo, L.; Ye, J.; Yang, B. Cyberattack detection for electric vehicles using physics-guided machine learning. IEEE Trans. Transp. Electrif. 2020, 7, 2010–2022. [Google Scholar] [CrossRef]
- Yang, B.; Wu, S.; Hu, K.; Ye, J.; Song, W.; Ma, P.; Shi, J.; Liu, P. Enhanced Cyber-Attack Detection in Intelligent Motor Drives: A Transfer Learning Approach With Convolutional Neural Networks. IEEE J. Emerg. Sel. Top. Ind. Electron. 2024, 5, 710–719. [Google Scholar] [CrossRef]
- Guo, L.; Wang, K.; Wang, T. Open-Circuit Fault Diagnosis of Three-Phase Permanent Magnet Machine Utilizing Normalized Flux-Producing Current. IEEE Trans. Ind. Electron. 2024, 71, 3351–3360. [Google Scholar] [CrossRef]
- Hang, J.; Shu, X.; Ding, S.; Huang, Y. Robust Open-Circuit Fault Diagnosis for PMSM Drives Using Wavelet Convolutional Neural Network With Small Samples of Normalized Current Vector Trajectory Graph. IEEE Trans. Ind. Electron. 2023, 70, 7653–7663. [Google Scholar] [CrossRef]
- Zhang, X.; Zhang, L.; Zhang, Y. Model predictive current control for PMSM drives with parameter robustness improvement. IEEE Trans. Power Electron. 2018, 34, 1645–1657. [Google Scholar] [CrossRef]
- Jedh, M.; Ben Othmane, L.; Ahmed, N.; Bhargava, B. Detection of Message Injection Attacks Onto the CAN Bus Using Similarities of Successive Messages-Sequence Graphs. IEEE Trans. Inf. Forensics Secur. 2021, 16, 4133–4146. [Google Scholar] [CrossRef]
- Jawdeh, S.A.; Choi, S.; Liu, C.H. Model-Based Deep Learning for Cyber-Attack Detection in Electric Drive Systems. In Proceedings of the 2022 IEEE Applied Power Electronics Conference and Exposition (APEC), Houston, TX, USA, 20–24 March 2022; pp. 567–573. [Google Scholar] [CrossRef]
- Xia, Y.; Xu, Y. A Transferrable Data-Driven Method for IGBT Open-Circuit Fault Diagnosis in Three-Phase Inverters. IEEE Trans. Power Electron. 2021, 36, 13478–13488. [Google Scholar] [CrossRef]
- Yang, B.; Ye, J. Data-driven detection of physical faults and cyber attacks in dual-motor ev powertrains. In Proceedings of the 2022 IEEE Transportation Electrification Conference & Expo (ITEC), Anaheim, CA, USA, 15–17 June 2022; IEEE: New York, NY, USA, 2022; pp. 991–996. [Google Scholar]
- Muriithi, G.; Papari, B.; Moghassemi, A.; Sundar, A.; Arsalan, A.; Buraimoh, E.; Timilsina, L.; Ozkan, G.; Edrington, C. Vulnerability Assessment and Detection of Stealthy Sequential Cyberattacks in Hybrid Tracked Vehicles. IEEE Trans. Transp. Electrif. 2024, 11, 6472–6489. [Google Scholar] [CrossRef]
Disclaimer/Publisher’s Note: The statements, opinions and data contained in all publications are solely those of the individual author(s) and contributor(s) and not of MDPI and/or the editor(s). MDPI and/or the editor(s) disclaim responsibility for any injury to people or property resulting from any ideas, methods, instructions or products referred to in the content. |
© 2025 by the authors. Licensee MDPI, Basel, Switzerland. This article is an open access article distributed under the terms and conditions of the Creative Commons Attribution (CC BY) license (https://creativecommons.org/licenses/by/4.0/).