Abstract
A newly developed hybrid maximum power point tracker (MPPT) utilizes a modified simulated annealing (SA) algorithm in conjunction with an adaptive hill climbing (HC) technique to optimize the extraction of the maximum power point (MPP) from photovoltaic (PV) systems. This innovative MPPT improves the ability to harvest maximum power from the PV system, particularly under rapidly fluctuating weather conditions and in situations of partial shading. The controller combines the rapid local search abilities of HC with the global optimization advantages of SA, which has been modified to retain and retrieve the maximum power achieved, thus ensuring the extraction of the global maximum. Furthermore, an adaptive HC algorithm is implemented with a variable step size adjustment, which accelerates convergence and reduces steady-state oscillations. Additionally, an offline SA algorithm is utilized to fine-tune the essential parameters of the proposed controller, including the maximum and minimum step sizes for duty cycle adjustments, initial temperature, and cooling rate. Simulations performed in Matlab/Simulink, along with experimental validation using Imperix-Opal-RT, confirm the effectiveness and robustness of the proposed controller. In the scenarios that were tested, the suggested HC–SA reached the global maximum power point (GMPP) of approximately 600 W in about 0.05 s, whereas the traditional HC stabilized at a local maximum close to 450 W, and the fuzzy-logic MPPT attained the GMPP at a slower rate, taking about 0.2 s, with a pronounced transient dip before settling with a small steady-state ripple. These findings emphasize that, under the operating conditions examined, the proposed method reliably demonstrates quicker convergence, enhanced tracking accuracy, and greater robustness compared with the other MPPT techniques.
1. Introduction
The advancement of renewable resource technologies has garnered significant interest from the research and scientific community, particularly in light of the energy crises and environmental consequences. Recently, various forms of renewable energy technologies have been employed, including photovoltaic (PV) systems, wind turbines, hydropower, biomass, and geothermal [1,2,3]. The performance of each technology depends on natural resource availability, efficiency, infrastructure, economic considerations, and environmental conditions [4,5,6,7]. Nevertheless, PV systems rank among the most commonly utilized renewable energy sources. The International Energy Agency (IEA) projected that the total installed capacity of PV solar systems worldwide would reach 1.6 terawatts (TW) by the conclusion of 2023, establishing it as the most favored renewable energy source. Furthermore, solar PV is anticipated to represent 80% of the global growth in renewable energy capacity from 2024 to 2030 [8]. Moreover, PV systems are widely used as stand-alone systems for various types of applications including solar home systems, rural electrification, solar water pumping, telecommunications, solar lighting, and remote monitoring systems [9,10].
Regrettably, PV systems exhibit nonlinear voltage–current characteristics, necessitating the tracking of the maximum power point (MPP), which is influenced by factors including solar irradiance and operating temperature [11,12]. Consequently, a maximum power point tracker (MPPT) is essential for extracting the MPP under varying weather conditions. To enhance tracking efficiency, several MPPT algorithms have been introduced in the literature; these algorithms differ in their efficiency, tracking speed, steady-state oscillation, implementation cost, and complexity [13,14].
Traditional MPPT techniques, including Perturb and Observe (P&O), Hill Climbing (HC), Incremental Conductance (IncCond), Fractional Open Circuit Voltage (FOCV), and Fractional Short Circuit Current (FSCC), are frequently employed in PV systems because of their straightforwardness and affordability. Nevertheless, these techniques face challenges in effectively capturing the MPP during swiftly changing weather conditions and instances of partial shading. Additionally, they often induce oscillations around the MPP due to ongoing perturbations, resulting in power losses and diminished efficiency [15]. In partial shading conditions, conventional MPPT methods may fail to identify the global MPP, getting stuck at a local MPP and significantly reducing energy harvest [16,17]. To avoid these drawbacks, modified conventional MPPT methods are proposed. In [18], the P&O method is modified by dynamically changing the perturbation size and implementing a dynamic boundary condition to prevent the algorithm from deviating from its tracking path. The algorithm necessitates the open-circuit voltage value of each module as specified in the manufacturer’s datasheet. Consequently, any inaccuracies in these measurements can impact the tracking performance. Furthermore, the sizes of dynamic perturbations and the boundary conditions contribute to the algorithm’s complexity. To enhance the performance of the P&O algorithm in rapidly changing weather conditions, in [19], the P&O algorithm is enhanced by incorporating an extra parameter, the change in current (ΔI), which helps differentiate the change in power due to perturbation and insolation. This improvement in tracking performance results in better efficiency and reduced drift; however, it also introduces greater complexity along with increased computational and implementation expenses. Overall, the adjustments made to traditional MPPT algorithms focus on accelerating the tracing speed, reducing steady-state oscillations, and preventing drift under fluctuating weather conditions [20]. Nevertheless, this algorithm suffers from the complicity of tuning the step size and the limitation of tracking the global maximum during partial shading conditions [21].
Novel MPPT using heuristic algorithms such as the firefly algorithm [22], whale optimization [23], team game optimization [24], and the WODE technique [25] are proposed to provide accurate tracking of the global maximum power point (GMPP). Although these algorithms have achieved successful results in finding the GMPP, they still suffer from slow tracking times, leading to large fluctuations and weak dynamic performance during the tracking of the GMPP [26]. In [27], the author introduced an enhanced Particle Swarm Optimization (PSO) algorithm aimed at reducing the tracking time to GMPP in scenarios of partial shading. This algorithm necessitates the estimation of the convex region of the power-voltage (P-V) curve and the implementation of voltage limits, thereby elevating the computational load.
To overcome the above-mentioned problems with MPPT using heuristic algorithms, hybrid techniques combining optimization algorithms with conventional algorithms have been proposed in the literature [28]. These hybrid techniques show improved performance in terms of tracking speed, steady-state oscillation, and extracting the GMPP. However, implementing hybrid techniques can lead to an increase in complexity and computational requirements [29]. In [30], the author enhances the tracking performance of the PV systems under partial shading conditions by combining Simulated Annealing (SA) with the P&O algorithm. The hybrid SA-P&O MPPT method improves tracking performance and reliability under partial shading conditions. Nevertheless, this method suffers from high complexity, especially when tuning the parameters which need to be optimized.
In this paper, a hybrid technique combining modified SA with an adaptive HC algorithm is proposed. SA is utilized to conduct a comprehensive search for the GMPP region, while the adaptive HC method continuously tracks the MPP locally, with improved tracking speed and reduced steady-state oscillation. To minimize the complexity of the proposed controller, the SA algorithm is employed offline under different weather conditions to fine-tune key parameters, including the maximum and minimum step sizes, cooling rate factor, and initial temperature. The proposed method’s effectiveness and robustness are illustrated by both simulation and experimental results.
2. Performance and Modeling of PV Characteristics
Figure 1 shows the basic representation of a solar cell’s equivalent circuit using a single-diode model. This model includes an ideal current source paired with a real diode in parallel, along with series resistance (Rs) and shunt resistance (Rsh). The ideal current source is affected by the solar irradiance it receives. A PV module consists of multiple individual cells connected in series to achieve higher voltage and power ratings. Generally, a PV array is formed by connecting individual modules in a series-parallel arrangement. The operation of the PV system is free from pollution, noise, and radiation. It functions silently without any moving parts and does not require maintenance or fuel. Figure 2 shows a PV system.
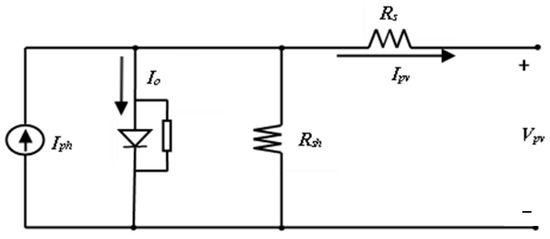
Figure 1.
Circuit diagram representing a single diode PV cell.
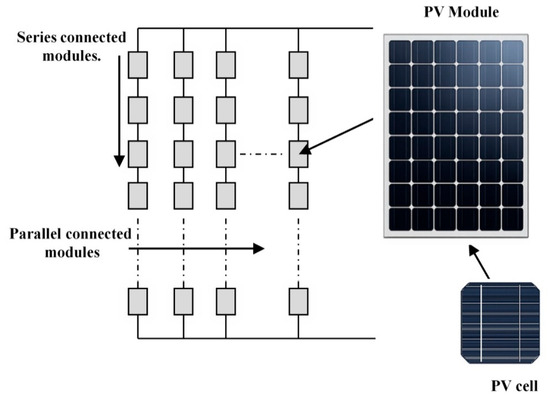
Figure 2.
PV array system.
The current-voltage characteristic of a typical PV array is nonlinear, and the relationship between current and voltage is expressed as follows [31]:
The PV solar array’s output voltage and current are represented as Vpv and Ipv, respectively. The series resistance and shunt resistance of the cell are represented by Rs and Rsh. The electron charge is denoted by q (1.6 × 10⁻¹⁹ C). The current generated by light is referred to as Isc, and the diode reverse saturation current is denoted as I0. A is a dimensionless factor related to the junction material. The Boltzmann constant is denoted as k (1.38 × 10⁻²³ J/°K). T represents the temperature (K). Ns and Np represent the number of cells connected in series and parallel, respectively.
The PV system’s electrical properties are typically illustrated by power–voltage and current–voltage graphs. The solar cell’s characteristic curves are nonlinear due to operational physical phenomena [32,33]. The characteristic curves of the PV array system are affected by the radiation and temperature conditions of the PV system. Under standard conditions, where radiation is uniformly distributed across the PV modules, the power–voltage (P−V) and current–voltage (I−V) characteristics for various weather conditions are illustrated in Figure 3 for a specific system.
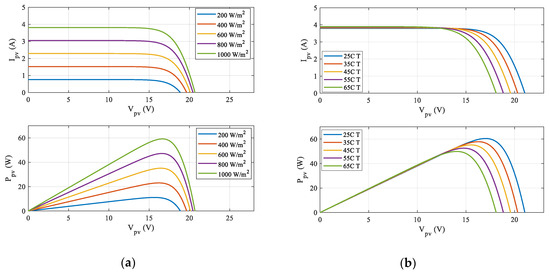
Figure 3.
The impact on I–V characteristics and P–V characteristics is affected by (a) solar radiation (G) at 25 °C and (b) temperature (T) at 1000 W/m2.
The PV panel is engineered to function at peak power levels under Standard Test Conditions (STC). Nevertheless, as illustrated in Figure 3, the output power of the PV system is greatly affected by both irradiance and temperature.
The variation in irradiance primarily affects the current. As the irradiance level increases, the short-circuit current (Isc) rises, with a noticeable change at each irradiance level. However, the voltage remains relatively stable. Therefore, The Isc is proportional to the solar radiation intensity (G), and it is expressed as:
where Isc,STC is the short circuit current at STC, G is the actual irradiance (W/m2), and GSTC is the irradiance at STC (1000 W/m2).
Conversely, temperature exerts a more significant influence on the open-circuit voltage (Voc). When the temperature rises above 25 °C, Voc diminishes, resulting in a decrease in output power. This inverse correlation between temperature and voltage underscores the necessity of effective thermal management in PV systems to sustain efficiency. The temperature dependence of Voc can be approximated as:
where Voc is the open circuit voltage at STC, β is the temperature coefficient of Voc (V/°C), and T is the actual temperature (°C).
Similarly, the PV panel maximum output power is affected by temperature and is estimated by the following equation:
where γ is the temperature coefficient of power (1/°C).
The non-uniform distribution of radiation, caused by factors such as partial shading, dust, and dirt, has a significant effect on the output power generated by creating both local and global maxima in the characteristic curves [31,32,33]. To gain a deeper understanding of these effects, an analysis is conducted on a PV array composed of 9 modules that are interconnected in both series and parallel configurations, as illustrated in Figure 4a. The distribution of radiation across the PV modules can fluctuate; therefore, three scenarios are examined randomly. In Case 1, Modules 1, 4, and 7 in each column are entirely shaded. In Case 2, Modules 3, 6, and 9 in each column experience varying levels of radiation. In Case 3, all modules are subjected to shading with differing radiation levels.
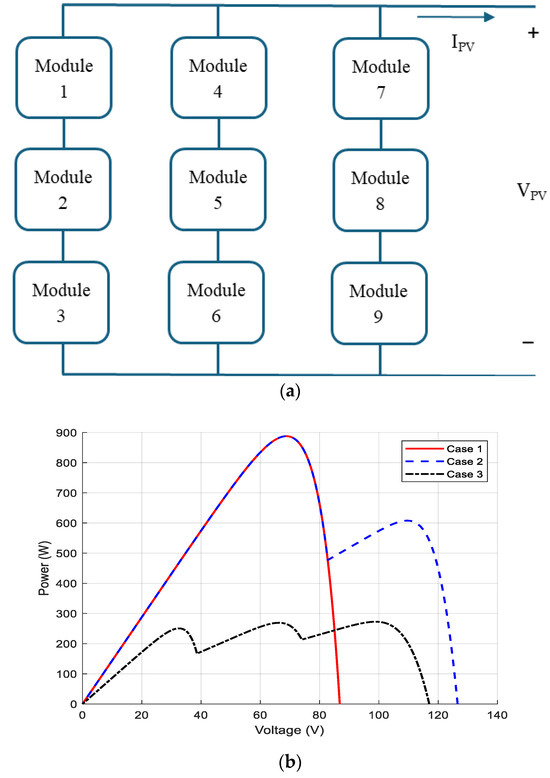
Figure 4.
(a) The PV array system under study and (b) The power output characteristics of the PV system under the three scenarios.
The results of the simulation for the three scenarios, illustrated in Figure 4b, demonstrate that a fully shaded module results in a reduction in PV output power without producing any local maximum points. Conversely, modules that are partially shaded result in a decrease in PV output power while also generating both local and global maxima points. The quantity of local maximum points rises as the radiation levels fluctuate across each module. It is clear that Equation (1), which describes the PV I−V characteristic, is ineffective under conditions of partial shading. Consequently, a new mathematical equation is suggested to address these phenomena.
In a typical PV array made up of several modules arranged in both series and parallel configurations, the I−V characteristics are greatly affected by conditions of partial shading. When exposed to uniform irradiance, all modules function at their peak power point. Conversely, when different modules are subjected to varying degrees of irradiance, the I-V characteristics exhibit multiple current steps and voltage fluctuations as a result of bypass diode activation and mismatch losses. The performance of a PV array under partial shading conditions can be analyzed by examining key operating points:
- Short-Circuit Current: The maximum short-circuits current, which occurs when the unshaded modules are exposed to full irradiance.
- Step Currents: Unique short-circuits currents of shaded modules that receive varying levels of irradiance.
- Step Voltages: The cumulative open-circuit voltages of modules that continue to conduct at each step.
- Open-Circuit Voltage: The overall open-circuit voltage of the complete array, combining both shaded and unshaded modules.
The relationship between voltage and current of the PV array in conditions of partial shading can be articulated as:
Voltage of the series string: For a PV array consisting of Ns modules connected in series for each string, the overall voltage of the series string is determined by:
where is the total voltage of i series string, is the thermal voltage, is the diode reverse saturation current, is the photo-generated current of module j in string i, and is the series string current. The “max” operation in Equation (5) ensures that bypass diode is activated when a module is significantly shaded.
Total PV array voltage: As parallel connection branches maintain the same voltage, the overall voltage of the PV array is:
where represents the count of parallel strings within the array.
Total PV array current: given that the current in parallel branches accumulates, the total PV array current is derived from:
Each string current follows:
Therefore, the series connected modules operate at the same current within each string, and the parallel string contribute independent current to the total PV current.
Thus, the overall mathematical equations of PV system under unequally distributed solar radiation are expressed as follows:
Equations (9) and (10) present a comprehensive mathematical framework for examining the characteristic curve of a PV array under different partial shading scenarios, taking into consideration the effects of bypass diodes, mismatch losses, and series-parallel configurations.
3. Maximum Power Point Tracking
MPPT controllers play a crucial role in optimizing the advantages of solar PV systems. Within the industry, producers of DC/DC converters and DC/AC inverters strive to improve the efficiency of their offerings. Given that the MPPT algorithm has a substantial effect on efficiency, these firms frequently maintain the confidentiality of their particular algorithms. This paper presents an MPPT strategy that emphasizes the integration of HC and SA among the different MPPT algorithms.
3.1. Hill Climbing Algorithm
HC algorithm is a heuristic optimization technique that continuously perturbs the system until the maximum solution of the objective function is found. This method moves step by step to extract the maximum value of the objective function. HC is suitable for dimensional problems; however, it can get stuck in the local maximum. The HC optimization technique is explained in the following manner: Assume the objective function is given as follows
The HC optimization process is divided into four steps, initialization, iteration, termination, and output.
Initialization: the initial solution (xo) is selected.
Iteration: the following process is repeated until a predefined number of iterations is reached or no further improvement in power is observed:
- -
- Solution Perturbation: perturb the current solution (x) with a neighboring solution (x’).
- -
- Objective Function Evaluation: the change in the objective function is calculated:
- -
- Acceptance Criterion: the change in the objective function is evaluated to decide whether to accept :
- if , accept as the new solution.
- if , reject and keep the old solution .
Termination: The algorithm concludes when the stopping criterion is satisfied. This may occur when the system attains a stable state.
Output: The optimal solution throughout the process is provided.
3.2. Simulating Annealing
Simulated Annealing (SA) is a probabilistic optimization method that draws inspiration from the annealing process utilized in metallurgy. During this process, a metal is heated to an elevated temperature and subsequently cooled gradually to remove defects and establish a stable structure. In a similar fashion, the SA optimization technique employs this methodology to enhance an objective function. SA possesses the capability to transcend local maxima by implementing probabilistic conditions that permit the acceptance of suboptimal movements. A temperature parameter is introduced to regulate the likelihood of accepting inferior solutions. The SA optimization technique can be delineated as follows: Assume the objective function is represented by Equation (11). The SA optimization procedure is segmented into four distinct phases: initialization, iteration, termination, and output.
Initialization: the initial solution (xo), initial temperature (To), and cooling schedule () are selected.
Iteration: the following process is repeated until a predefined number of iterations is met or a sufficiently low temperature is reached:
- -
- Solution Perturbation: perturb the current solution (x) with a new candidate solution (x′).
- -
- Objective Function Evaluation: the change in the objective function is calculated
- -
- Acceptance Criterion: the change in the objective function is evaluated to decide whether to accept :
- if , accept as the new solution.
- if , apply the Metropolis criterion by accepting with a probability P
- -
- Temperature Update: the temperature is updated by the cooling factor (α):
Termination: The algorithm concludes when the stopping criterion is satisfied. This may occur when the temperature has decreased to an adequate level, the designated number of iterations has been completed, or the system attains a stable state.
Output: The optimal solution is provided during the process.
4. Proposed Hybrid MPPT Method
The suggested MPPT technique integrates adaptive HC and modified SA into a unified approach to enhance tracking efficiency, robustness, and stability in PV systems under varying weather conditions. It exploits the rapid local search capability of HC and the global optimization strength of SA, ensuring that the system reliably finds the GMPP, even during partial shading situations.
This hybrid MPPT method operates by combining the strengths of SA and HC in a single tracking process. The modified SA algorithm introduces a storing mechanism that records the highest power level reached at each weather condition, ensuring that the system is returned to the most recent optimal point if an inefficient duty cycle is selected. Simultaneously, an adaptive HC mechanism dynamically adjusts the duty cycle step size based on power variations to refine local tracking. The key elements of the hybrid SA-HC method are:
- -
- Exploration using a probabilistic acceptance function: Candidate solutions (duty cycles) are generated randomly within a predefined range, and worse solutions may still be accepted with a probability proportional to a cooling schedule.
- -
- Temperaturebased adaptation: The cooling rate controls the likelihood of escaping local maxima, preventing premature convergence.
- -
- Power storing mechanism: The algorithm keeps track of the highest power recorded at each environmental condition and recalls it when needed, ensuring stability and faster convergence when conditions fluctuate.
- -
- Adaptive step size in HC: If the change in power (ΔP) is significant, SA is applied with a dynamically determined perturbation size:
If a small change is observed in PV output power, HC perturbs the system as follows:
where and is the previous PV output power.
- -
- Objective Function Evaluation: The change in the objective function is calculated as:
- -
- Acceptance Criterion: The duty cycle D′ is accepted based on:
- If ΔE > 0, accept D′ as the new solution.
- If ΔE < 0, apply the Metropolis criterion with acceptance probability (P).
- -
- Temperature Update: The temperature is updated using:T = αT
The temperature is reinitialized when weather conditions change.
The implementation process of the hybrid MPPT method follows these steps:
- -
- Initialization: Define initial duty cycle D0, initial temperature T0, cooling schedule α, and perturbation ranges and .
- -
- Exploration using SA: Generate new duty cycle candidates probabilistically and evaluate power changes.
- -
- Power storage mechanism: If a new power peak is found, it is stored as a reference for future tracking.
- -
- Local refinement using adaptive HC: If the change in power is small, HC dynamically adjusts the duty cycle step size to reduce oscillations.
- -
- Temperature reinitialization: If weather conditions change significantly, the SA temperature is reset to allow further exploration.
- -
- Convergence check: The process continues until a stable MPP is reached.
This hybrid approach ensures fast convergence to the global MPP, minimizes steady-state oscillations, and enhances robustness during quickly varying irradiance and temperature conditions. The offline tuning of key parameters, such as maximum and minimum step sizes, initial temperature, and cooling rate, further optimizes performance, reducing computational complexity without sacrificing accuracy.
By integrating modified SA with a storing mechanism and adaptive HC with variable step size, the proposed MPPT achieves high tracking efficiency, reduces power losses, and improved resilience to environmental fluctuations, as confirmed by simulation and experimental results.
5. Parameters Tuning
To reduce the proposed MPPT complexity and improve tracking efficiency, the initial parameters such as the maximum step size, minimum step size, cooling rate factor, and initial temperature need to be optimized. SA optimization technique is utilized offline during different weather conditions to fine-tune parameters. The process of optimizing the critical parameters of the proposed MPPT includes the following stages and is shown in Figure 5:
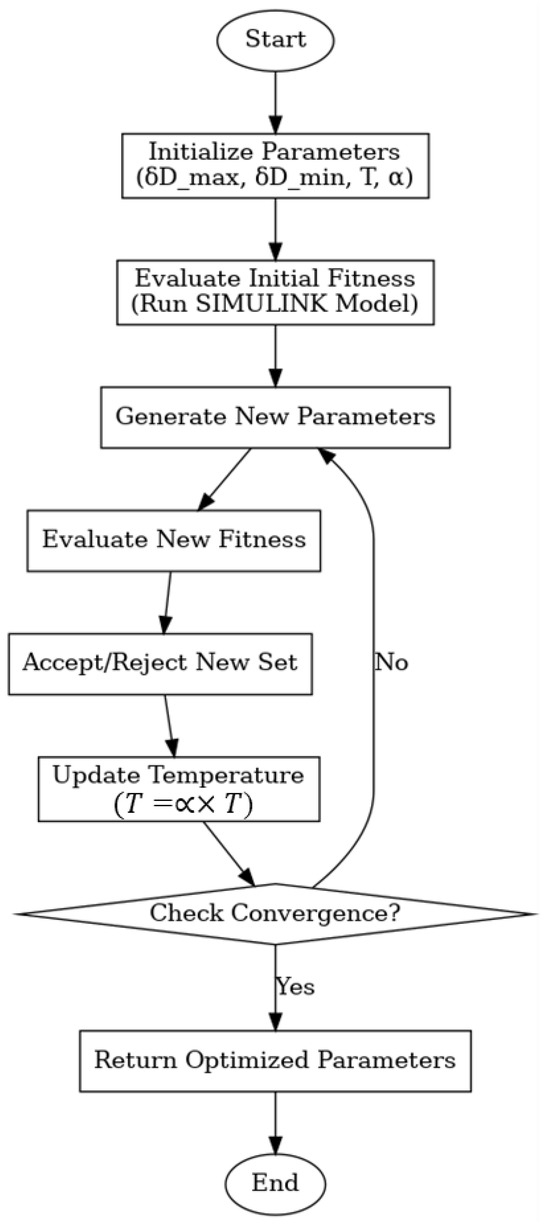
Figure 5.
Flowchart Illustrating the Suggested Algorithm for Optimizing MPPT Parameters.
Initialization:
- -
- Define search mode with parameters lower and upper limit for each parameter: the maximum step size, minimum step size, cooling rate factor, and initial temperature
- -
- Randomly initialize the parameters within the search space.
- -
- Set the initial values to balance exploration (large step sizes) and convergence (small step sizes) and define the initial temperature and cooling rate for the SA algorithm.
Initial Fitness Evaluation:
- -
- The PV system evaluates the fitness function using MATLAB R2024a with Simulink (MathWorks, Natick, MA, USA) with the given set of parameters.
- -
- Computing the fitness according to the steadystate PV output power.
- -
- The fitness function is characterized as the negative of the average steadystate power, with the objective being to maximize power.
Iterative Optimization:
- -
- In each iteration, a new set of parameters is generated by making a small random change in the current parameters.
- -
- The fitness function is evaluated using the PV system MATLAB/SIMULINK file.
- -
- The new parameters are accepted if the fitness function improves. On the other hand, the worse solution is probabilistically accepted to avoid being trapped in local maxima.
- -
- According to the cooling rate, the temperature is updated.
Convergence Check: The optimum parameters found during the optimization process are tested in the proposed MPPT to ensure the effectiveness and efficiency of tracking the MPP during varying weather conditions.
6. Outcomes of the Simulation and Analysis of Results
A total of ten PV modules, each rated at 850 W, are employed in the evaluated PV array. The design specifications and circuit parameters are detailed in Table 1. Figure 6 depicts the block diagram of the PV system, along with the proposed controller. To evaluate the performance of the recommended MPPT, simulation results have been produced using MATLAB/SIMULINK. Furthermore, the key parameters of the proposed MPPT are computed off-line using the simulated annealing algorithm.

Table 1.
Specifications for Design and Circuit.
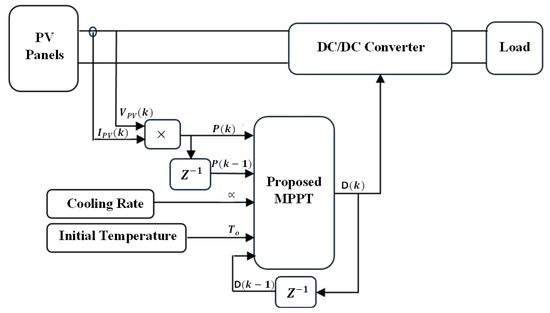
Figure 6.
Schematic representation of the PV array system along with the suggested MPPT.
6.1. Non-Partial Shading Conditions
The suggested MPPT system is evaluated under consistent solar radiation distribution across the PV panels. Two scenarios have been analyzed; the first involves testing the PV system with a uniform radiation level of 1000 W/m2, while the second scenario examines the PV system’s response to a sudden shift in radiation level from 500 W/m2 to 1000 W/m2.
In Figure 7a, the PV output power at 1000 W/m2 is depicted. The proposed MPPT method successfully identified the MPP in a brief duration with minimal oscillation around the MPP. Additionally, the same PV system was evaluated under different weather conditions, where the solar radiation level fluctuated from 500 W/m2 to 1000 W/m2. Figure 7b demonstrates that the proposed MPPT can effectively track the MPP during rapidly changing weather conditions, exhibiting a short tracking time, slight oscillation around the MPP, and no drift from the new MPP during these varying conditions.
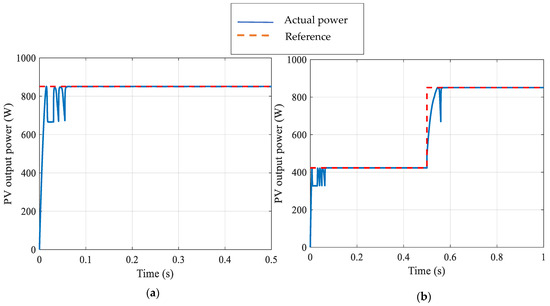
Figure 7.
(a) The PV out power under uniform radiation level. (b) The PV output power under sudden change in radiation levels.
6.2. Partial Shading Conditions
The suggested MPPT has been validated under conditions of partial shading. The solar radiation is distributed across the PV system as follows: six unshaded PV modules receive 1000 W/m2, whereas the other four modules are partially shaded, receiving radiation levels of 900, 600, 400, and 200 W/m2. Figure 8 illustrates both the output power of the PV system and the power locus of the overall system.
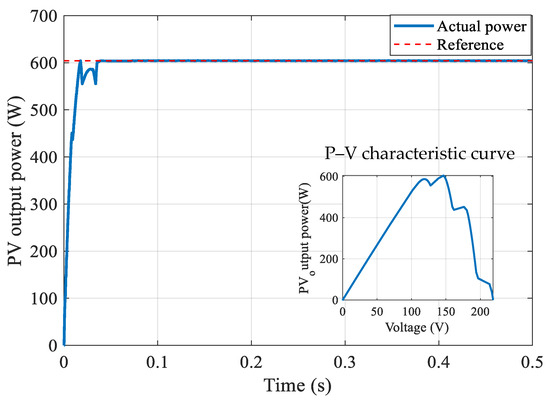
Figure 8.
The simulation outcomes of the suggested MPPT system under conditions of partial shading are presented. The primary graph displays the PV output power in comparison to the reference power, whereas the inset depicts the related P–V characteristic curve, which signifies the GMPP.
The local maximum does not hinder the suggested MPPT to effectively track the GMPP. Additionally, the global maximum is obtained within a brief timeframe with minimal oscillations during steady state conditions.
To further validate the proposed MPPT in more intricate weather scenarios, identical shading conditions are utilized, with solar radiation on the unshaded panels fluctuating from 500 W/m2 to 1000 W/m2 and subsequently returning to 500 W/m2. The PV output power under these weather conditions is depicted in Figure 9.
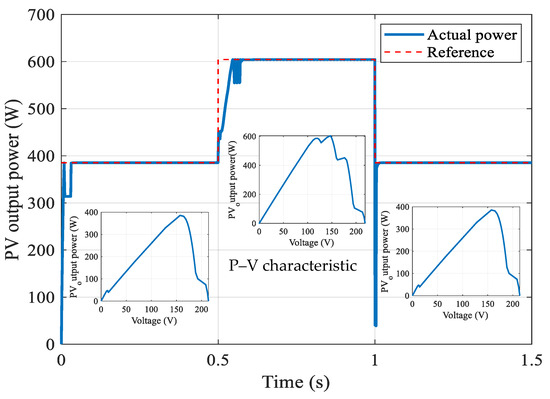
Figure 9.
PV output power response of the proposed HC–SA MPPT during multiple irradiances change scenarios, compared with the reference power. The inset plots show the P–V characteristic curves at different irradiance levels, highlighting the relocation of the MPP with changing conditions.
Figure 9 demonstrates that the proposed MPPT effectively extracts the GMPP under rapidly varying weather conditions. During periods of 500 W/m2 solar radiation, the controller avoids the local MPP and successfully extracts the GMPP. Similarly, during periods of 1000 W/m2 solar radiation, the controller accurately locates the GMPP. The robustness of the proposed controller is further validated when the solar power is reduced from 1000 W/m2 to 500 W/m2, as the global MPP is extracted in a comparatively small time with minimal oscillations.
In order to assess the efficacy of the suggested approach, comparative outcomes with the traditional HC method and the fuzzy-logic method are illustrated in Figure 10. These comparative simulations were performed under the same conditions. The PV array experienced a partial shading scenario, where six unshaded PV modules were exposed to 1000 W/m2, while the other four modules were partially shaded, receiving irradiance levels of 900, 600, 400, and 200 W/m2.
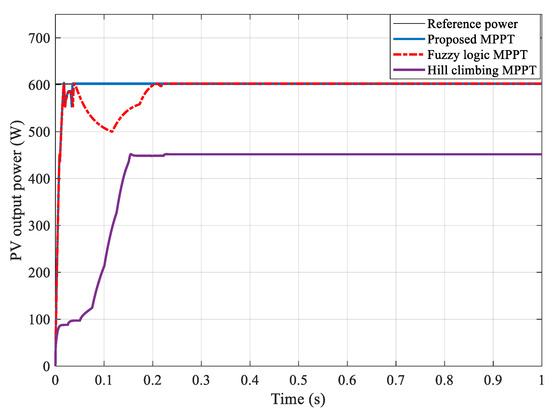
Figure 10.
Simulation outcomes of the suggested HC–SA MPPT in comparison to the HC MPPT and fuzzy-logic MPPT under conditions of partial shading, along with the power locus of the PV system.
Figure 10 demonstrates the comparative effectiveness of the proposed HC–SA, fuzzy-logic MPPT, and traditional HC algorithms. The suggested approach quickly converges to the GMPP in about 0.05 s and maintains stability with minimal oscillations. In comparison, the fuzzy-logic MPPT attains the GMPP at a slower rate, taking about 0.2 s, displaying a clear transient dip before reaching a steady state with a small ripple. The traditional HC algorithm is considerably slower, stabilizing at a local maximum and failing to achieve the GMPP. These findings clearly highlight the benefits of the proposed method regarding convergence speed, tracking precision, and robustness.
7. Practical Results
The system is examined through real-time simulation (RTS) and hardware-in-the-loop (HIL). The findings from experiments conducted with Imperix-Opal-RT are presented to confirm the precision of the proposed MPPT tracking response in real-time scenarios. The aim of these experiments is to assess the performance of the standalone PV power system, which comprises a simulated solar module, a DC-DC boost converter, the proposed MPPT controller, and an isolated load. The efficacy of the proposed MPPT controller is validated by monitoring the output power and the duty cycle of the PV system via HIL simulation on Imperix-Opal-RT, as illustrated in Figure 11, thus negating the necessity for intricate and expensive hardware configurations. Moreover, although the proposed HC–SA hybrid structure integrates two techniques, its computational requirements remain minimal. Each iteration involves only simple arithmetic operations (addition, subtraction, multiplication, and comparison) and requires storing a few power values. As a result, the additional burden compared to standard HC is negligible. These characteristics make the algorithm compatible with low-cost DSPs or microcontrollers typically used in commercial PV inverters, without requiring additional sensors or hardware modifications.
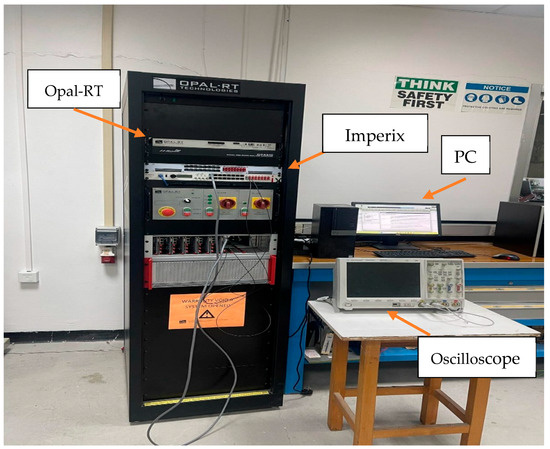
Figure 11.
Test rig photograph.
Real-time output responses are obtained by connecting the output signals to the Imperix-Opal-RT via an Op5142Ex1 Analog Out block (OPAL-RT Technologies Inc., Montreal, QC, Canada). The Imperix-Opal-RT control unit, operating on an FPGA platform, generates real-time responses which are then transmitted to a digital storage oscilloscope (DSO). Figure 12 illustrates the experimental results obtained utilizing Imperix-Opal-RT under variations in solar radiation from 500 W/m2 to 1000 W/m2.
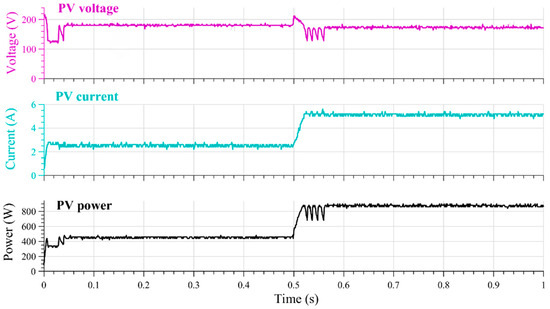
Figure 12.
Experimental PV voltage, current, and power under two irradiance levels (time base: 100 ms/div; CH3—Voltage: 100 V/div; CH2—Current: 5 A/div; CH1—Power: 5 V/div (=500 W/div; 1 V = 100 W)).
Figure 13 illustrates the performance of the PV system under shading conditions, with solar radiation varying from 500 W/m2 to 1000 W/m2, demonstrating the system’s response to these fluctuations.
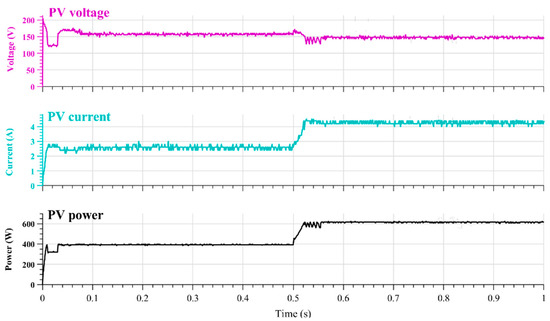
Figure 13.
Experimental PV voltage, current, and power under partial shading (time base: 100 ms/div; CH3—Voltage: 100 V/div; CH2—Current: 5 A/div; CH1—Power: 5 V/div (=500 W/div; 1 V = 100 W)).
As shown in Figure 12 and Figure 13, the proposed MPPT exhibits excellent performance under different weather conditions. Figure 12 illustrates the controller’s effectiveness under varying weather conditions without shading, while Figure 13 illustrates its capability and effectiveness under shaded conditions. In both scenarios, the MPPT consistently tracks the MPP, ensuring optimal power extraction from the PV system despite fluctuations in solar radiation.
8. Conclusions
In this paper, a modified hybrid MPPT using adaptive HC and modified SA successfully addresses the challenges of tracking the MPP in PV systems, particularly under rapidly changing weather and partial shading conditions. The proposed controller effectively combines the quick local search capability of HC with the global optimization strength of SA, ensuring robust performance across different environmental conditions. Additionally, an offline optimization of key parameters, including duty cycle step sizes, initial temperature, and cooling rate, enhances the adaptability and precision of the controller. The effectiveness and reliability of the proposed MPPT approach are authenticated through MATLAB/SIMULINK simulations and experimental implementation using Imperix-Opal-RT. In the tested scenarios, the proposed HC–SA converged to an GMPP of about 600 W within approximately 0.05 s, while the conventional HC stabilized at a local maximum near 450 W. The fuzzy-logic MPPT reached the GMPP more slowly, exhibiting a clear transient dip before settling into a steady state. These results demonstrate that the proposed method achieves faster convergence, higher tracking accuracy, and improved robustness with reduced oscillations, confirming its potential as a promising solution for maximizing power output in dynamic PV applications.
Author Contributions
Conceptualization, B.N.A.; Methodology, B.N.A.; Software, B.N.A.; Validation, I.A. and M.I.M.; Investigation, N.A.A.; Writing—original draft, B.N.A.; Writing—review & editing, N.A.A., I.A. and M.I.M. All authors have read and agreed to the published version of the manuscript.
Funding
This research received no external funding.
Data Availability Statement
The original contributions presented in this study are included in the article. Further inquiries can be directed to the corresponding author.
Conflicts of Interest
The authors declare no conflict of interest.
References
- Zhu, H.; Li, H.; Liu, G.; Ge, Y.; Shi, J.; Li, H.; Zhang, N. Energy Storage in High Variable Renewable Energy Penetration Power Systems: Technologies and Applications. CSEE J. Power Energy Syst. 2023, 9, 2099–2108. [Google Scholar]
- Saranyaa, J.S.; Fathima, A.P. A Comprehensive Survey on the Current Trends in Improvising the Renewable Energy Incorporated Global Power System Market. IEEE Access 2023, 11, 24016–24038. [Google Scholar] [CrossRef]
- Zhou, W.; Chen, Q.; Luo, D.; Jiang, R.; Chen, J. Global Energy Consumption Analysis Based on the Three-Dimensional Network Model. IEEE Access 2020, 8, 76313–76332. [Google Scholar] [CrossRef]
- Čeryová, D.; Bullová, T.; Turčeková, N.; Adamičková, I.; Moravčíková, D.; Bielik, P. Assessment of the Renewable Energy Sector Performance Using Selected Indicators in European Union Countries. Resources 2020, 9, 102. [Google Scholar] [CrossRef]
- Ghiasi, M.; Esmaeilnamazi, S.; Ghiasi, R.; Fathi, M. Role of Renewable Energy Sources in Evaluating Technical and Economic Efficiency of Power Quality. Technol. Econ. Smart Grids Sustain. Energy 2019, 5, 1. [Google Scholar] [CrossRef]
- Mathew, M.S.; Kolhe, M.L. Performance Modelling of Renewable Energy Systems Using kNN Algorithm for Smart Grid Applications. In Proceedings of the 2022 7th International Conference on Smart and Sustainable Technologies (SpliTech), Bol and Split, Croatia, 5–8 July 2022; pp. 1–4. [Google Scholar]
- Colucci, R.; Mahgoub, I.; Yousefizadeh, H.; Al-Najada, H. Survey of Strategies to Optimize Battery Operation to Minimize the Electricity Cost in a Microgrid With Renewable Energy Sources and Electric Vehicles. IEEE Access 2024, 12, 8246–8261. [Google Scholar] [CrossRef]
- Agency, I.E. Renewables 2023; IEA: Paris, France, 2023. [Google Scholar]
- Araoye, T.O.; Ashigwuike, E.C.; Mbunwe, M.J.; Bakinson, O.I.; Ozue, T.I. Techno-Economic Modeling and Optimal Sizing of Autonomous Hybrid Microgrid Renewable Energy System for Rural Electrification Sustainability using HOMER and Grasshopper Optimization Algorithm. Renew. Energy 2024, 229, 120712. [Google Scholar] [CrossRef]
- Shrivastava, A.; Sharma, R.; Saxena, M.K.; Shanmugasundaram, V.; Rinawa, M.L. Ankit Solar energy capacity assessment and performance evaluation of a standalone PV system using PVSYST. Mater. Today Proc. 2023, 80, 3385–3392. [Google Scholar] [CrossRef]
- Zhang, W.; Yang, J.; He, Q.; Liu, Z.; Wang, J.; Rao, Z.; Li, M.; Yu, X.; Zhang, W. A Dual-Feedback Adaptive Clone Selection Algorithm With Golden Sine Search for Parameter Identification of Photovoltaic Models. IEEE Access 2024, 12, 20341–20357. [Google Scholar] [CrossRef]
- Bordihn, S.; Fladung, A.; Schlipf, J.; Köntges, M. Machine Learning Based Identification and Classification of Field-Operation Caused Solar Panel Failures Observed in Electroluminescence Images. IEEE J. Photovolt. 2022, 12, 827–832. [Google Scholar] [CrossRef]
- Hanzaei, S.H.; Gorji, S.A.; Ektesabi, M. A Scheme-Based Review of MPPT Techniques With Respect to Input Variables Including Solar Irradiance and PV Arrays’ Temperature. IEEE Access 2020, 8, 182229–182239. [Google Scholar] [CrossRef]
- Lappalainen, K.; Valkealahti, S. Number of maximum power points in photovoltaic arrays during partial shading events by clouds. Renew. Energy 2020, 152, 812–822. [Google Scholar] [CrossRef]
- Kumar, M.; Panda, K.P.; Rosas-Caro, J.C.; Valderrabano-Gonzalez, A.; Panda, G. Comprehensive Review of Conventional and Emerging Maximum Power Point Tracking Algorithms for Uniformly and Partially Shaded Solar Photovoltaic Systems. IEEE Access 2023, 11, 31778–31812. [Google Scholar] [CrossRef]
- Abdullah, A.A.; Atallah, F.S.; Ahmed, O.K.; Alguburi, S. Effect of dusty weather on the performance of the PV/Trombe wall: Experimental assessment. Case Stud. Therm. Eng. 2022, 39, 102419. [Google Scholar] [CrossRef]
- Ahmed, N.A.; Alajmi, B.N.; Abdelsalam, I.; Marei, M.I.; AlHajri, M. Advanced Maximum Power Point Tracker for PV Systems Under Dusty Weather Environments. IEEJ Trans. Electr. Electron. Eng. 2022, 17, 61–71. [Google Scholar] [CrossRef]
- Ahmed, J.; Salam, Z. A Modified P&O Maximum Power Point Tracking Method With Reduced Steady-State Oscillation and Improved Tracking Efficiency. IEEE Trans. Sustain. Energy 2016, 7, 1506–1515. [Google Scholar]
- Killi, M.; Samanta, S. Modified Perturb and Observe MPPT Algorithm for Drift Avoidance in Photovoltaic Systems. IEEE Trans. Ind. Electron. 2015, 62, 5549–5559. [Google Scholar] [CrossRef]
- Jately, V.; Azzopardi, B.; Joshi, J.; Venkateswaran, V.B.; Sharma, A.; Arora, S. Experimental Analysis of hill-climbing MPPT algorithms under low irradiance levels. Renew. Sustain. Energy Rev. 2021, 150, 111467. [Google Scholar] [CrossRef]
- Li, X.; Wang, Q.; Wen, H.; Xiao, W. Comprehensive Studies on Operational Principles for Maximum Power Point Tracking in Photovoltaic Systems. IEEE Access 2019, 7, 121407–121420. [Google Scholar] [CrossRef]
- Huang, Y.P.; Huang, M.Y.; Ye, C.E. A Fusion Firefly Algorithm With Simplified Propagation for Photovoltaic MPPT Under Partial Shading Conditions. IEEE Trans. Sustain. Energy 2020, 11, 2641–2652. [Google Scholar] [CrossRef]
- Malla, S.G.; Malla, P.; Malla, J.M.R.; Singla, R.; Choudekar, P.; Koilada, R.; Sahu, M.K. Whale Optimization Algorithm for PV Based Water Pumping System Driven by BLDC Motor Using Sliding Mode Controller. IEEE J. Emerg. Sel. Top. Power Electron. 2022, 10, 4832–4844. [Google Scholar] [CrossRef]
- Shams, I.; Mekhilef, S.; Tey, K.S. Improved-Team-Game-Optimization-Algorithm-Based Solar MPPT With Fast Convergence Speed and Fast Response to Load Variations. IEEE Trans. Ind. Electron. 2021, 68, 7093–7103. [Google Scholar] [CrossRef]
- Kumar, N.; Hussain, I.; Singh, B.; Panigrahi, B.K. MPPT in Dynamic Condition of Partially Shaded PV System by Using WODE Technique. IEEE Trans. Sustain. Energy 2017, 8, 1204–1214. [Google Scholar] [CrossRef]
- Joisher, M.; Singh, D.; Taheri, S.; Espinoza-Trejo, D.R.; Pouresmaeil, E.; Taheri, H. A Hybrid Evolutionary-Based MPPT for Photovoltaic Systems Under Partial Shading Conditions. IEEE Access 2020, 8, 38481–38492. [Google Scholar] [CrossRef]
- Sangrody, R.; Taheri, S.; Cretu, A.M.; Pouresmaeil, E. An Improved PSO-Based MPPT Technique Using Stability and Steady State Analyses Under Partial Shading Conditions. IEEE Trans. Sustain. Energy 2024, 15, 136–145. [Google Scholar] [CrossRef]
- Bollipo, R.B.; Mikkili, S.; Bonthagorla, P.K. Hybrid, optimal, intelligent and classical PV MPPT techniques: A review. CSEE J. Power Energy Syst. 2021, 7, 9–33. [Google Scholar]
- Ali, A.; Almutairi, K.; Padmanaban, S.; Tirth, V.; Algarni, S.; Irshad, K.; Islam, S.; Zahir, M.H.; Shafiullah, M.; Malik, M.Z. Investigation of MPPT Techniques Under Uniform and Non-Uniform Solar Irradiation Condition–A Retrospection. IEEE Access 2020, 8, 127368–127392. [Google Scholar] [CrossRef]
- Lyden, S.; Galligan, H.; Haque, M.E. A Hybrid Simulated Annealing and Perturb and Observe Maximum Power Point Tracking Method. IEEE Syst. J. 2021, 15, 4325–4333. [Google Scholar] [CrossRef]
- Ahmed, N.A.; Rahman, S.A.; Alajmi, B.N. Optimal controller tuning for P&O maximum power point tracking of PV systems using genetic and cuckoo search algorithms. Int. Trans. Electr. Energy Syst. 2021, 31, e12624. [Google Scholar]
- Song, T.; Williams, R.; Ottoson, L.; Mack, C.; Geisz, J.F.; Brewer, J.; Kopidakis, N. Impact of Irradiation-Induced Filter Heating on Calibration of NIR-Longpass-Filtered Reference Solar Cells. IEEE J. Photovolt. 2023, 13, 793–799. [Google Scholar] [CrossRef]
- Beinert, A.J.; Romer, P.; Heinrich, M.; Mittag, M.; Aktaa, J.; Neuhaus, D.H. The Effect of Cell and Module Dimensions on Thermomechanical Stress in PV Modules. IEEE J. Photovolt. 2020, 10, 70–77. [Google Scholar] [CrossRef]
Disclaimer/Publisher’s Note: The statements, opinions and data contained in all publications are solely those of the individual author(s) and contributor(s) and not of MDPI and/or the editor(s). MDPI and/or the editor(s) disclaim responsibility for any injury to people or property resulting from any ideas, methods, instructions or products referred to in the content. |
© 2025 by the authors. Licensee MDPI, Basel, Switzerland. This article is an open access article distributed under the terms and conditions of the Creative Commons Attribution (CC BY) license (https://creativecommons.org/licenses/by/4.0/).