Abstract
The rapid evolution of unmanned aerial vehicle (UAV) technology and low-altitude economic development have propelled drone applications in critical infrastructure monitoring, particularly in intelligent transportation systems where real-time aerial image processing has emerged as a pressing requirement. We address the pivotal challenge of highway lane extraction from low-altitude UAV perspectives by applying a novel three-stage framework. This framework consists of (1) a deep learning-based semantic segmentation module that employs an enhanced STDC network with boundary-aware loss for precise detection of roads and lane markings; (2) an optimized polynomial fitting algorithm incorporating iterative classification and adaptive error thresholds to achieve robust lane marking consolidation; and (3) a global optimization module designed for context-aware lane generation. Our methodology demonstrates superior performance with 94.11% F1-score and 93.84% IoU, effectively bridging the technical gap in UAV-based lane extraction while establishing a reliable foundation for advanced traffic monitoring applications.
1. Introduction
The rapid progression of unmanned aerial vehicle (UAV) technologies and associated mobile communication systems has emerged as a transformative development in modern sensing applications [1]. These systems are particularly valued for their operational flexibility, extended coverage capabilities, and reliable imaging performance, enabling diverse implementations across critical domains including wildfire management, intelligent transportation systems (ITS), aquatic environmental monitoring, and urban infrastructure assessment [2,3]. The exceptional maneuverability and unobstructed aerial perspective of UAV platforms render them particularly effective for situational awareness enhancement in both routine operations and emergency response scenarios. Specific applications demonstrate their versatility, as follows: in wildfire scenarios, UAVs facilitate access to otherwise inaccessible areas for improved fire surveillance and damage evaluation [4]; in transportation networks, they enable comprehensive traffic monitoring for optimized flow management [5]; in environmental protection, hyperspectral-equipped UAVs provide vital water quality assessment through chromatic anomaly detection [6]; while in urban contexts, they support critical infrastructure inspection and regulatory enforcement.
The technical requirements for highway perception systems demand particularly precise lane marking segmentation and extraction methodologies, as these processes fundamentally enable traffic violation identification, flow analysis, and driving behavior assessment [7,8,9]. Beyond immediate monitoring applications, these capabilities prove essential for generating high-definition lane-level maps [10,11]—a critical component for emerging autonomous navigation systems, dynamic map updating protocols, and advanced route planning algorithms. Enhanced lane marking segmentation directly contributes to vehicle localization accuracy, thereby improving decision-making reliability in autonomous driving systems. Furthermore, the analytical potential of robust lane extraction extends to macroscopic traffic optimization through lane utilization pattern analysis, offering substantive benefits for congestion mitigation and infrastructure efficiency [12,13,14,15,16]. From a regulatory perspective, automated lane marking detection provides quantifiable evidence for traffic regulation compliance, significantly enhancing enforcement capabilities and road safety metrics.
Currently, research pertaining to lane detection and segmentation predominantly centers on autonomous driving applications, wherein image data are typically acquired from a ground-level, horizontal perspective [17,18,19,20,21]. In contrast, studies addressing lane feature extraction from unmanned aerial vehicle (UAV) viewpoints remain considerably limited [22,23]. The aerial perspective introduces several fundamental differences: UAV imaging captures comprehensive lane topologies including complex configurations (merges, diverges, and interchanges) across the entire roadway width, whereas ground-level systems typically observe only immediate adjacent lanes with relatively linear geometries. Furthermore, the operational focus of terrestrial systems on immediate navigation needs creates significant methodological incompatibilities for aerial data processing. These differences manifest as unique technical challenges including increased lane pattern variability, perspective-induced geometric distortions, and illumination artifacts characteristic of aerial acquisition—all demanding specialized algorithmic solutions.
Traditional lane detection approaches relying on handcrafted feature extraction (texture, chromatic, or edge-based) demonstrate limited robustness when confronted with aerial imaging challenges such as occlusions, structural complexities, or adverse environmental conditions [24,25,26,27,28]. While these methods maintain utility in constrained scenarios, their performance degrades markedly in operationally relevant environments featuring complex junction topologies, dense traffic conditions, overhead structure interference, and multi-lane configurations. Furthermore, these conventional methods exhibit constrained scalability in multi-lane configurations due to inherent limitations in generalizability across diverse lane topologies.
To address these shortcomings, recent advancements have shifted toward deep learning paradigms that autonomously derive discriminative features through large-scale data-driven learning, thereby mitigating the dependency on manual feature engineering while achieving enhanced performance in challenging environments. A pipeline for automatically extracting lane-level street maps from aerial imagery was introduced by He et al. [22]. Their method operates in two main stages: lane and direction extraction in non-intersection areas using a segmentation model, followed by enumeration and connectivity validation of possible turning lanes at intersections via a classifier. This work primarily addresses urban road intersections, presenting a context distinct from highway scenarios. Similarly, a two-stage deep learning framework was developed by Jiawei Yao et al. for constructing lane-level maps from aerial images [29]. The first stage produces lane segmentation and vertex heatmaps, while the second refines the results through vertex matching to generate topologically structured lane polylines. In another study, Seyed Majid Azimi et al. presented an approach based on wavelet-enhanced cost-sensitive symmetric fully convolutional neural networks to achieve accurate lane-marking segmentation from high-resolution aerial imagery [23]. Additionally, Franz et al. proposed a method for automatic segmentation and 3D reconstruction of road markings from multi-view aerial images, combining an enhanced fully convolutional network for pixel-wise segmentation with a sliding-window least-squares optimization technique for precise 3D line-feature reconstruction [30]. However, it should be noted that both studies [23,30] focus exclusively on road marking extraction—such as lane lines, stop lines, and symbols—and do not accomplish full lane-level segmentation. Although lane extraction from drone-captured aerial imagery has attracted some research interest, it remains underexplored compared to analogous studies in the autonomous driving domain. Furthermore, existing efforts often employ inconsistent evaluation metrics and heterogeneous datasets. Future work should therefore prioritize enhancing the robustness and accuracy of lane detection algorithms in complex environments when applied to aerial imagery acquired by drones.
Our methodological framework addresses these limitations through a multi-stage processing pipeline: initial deep learning-based semantic segmentation generates precise road and lane marking extractions, with subsequent geometric processing employing constrained polynomial fitting for outlier-resistant lane modeling. The system specifically incorporates connected component analysis for lane segment isolation, iterative classification for fragmented marking association, and context-aware lane topology reconstruction. This comprehensive approach demonstrates particular effectiveness in handling real-world complexities including solid/dashed marking patterns and segmentation inconsistencies, ultimately producing accurate lane-level roadway models suitable for advanced transportation applications.
2. Related Work
2.1. Road and Lane Marking Segmentation Model
Conventional approaches to lane marking extraction predominantly depend on hand-engineered feature representations, including histogram distributions, color space transformations, and texture descriptors, typically integrated with edge detection operators and linear feature extraction techniques for lane segment identification. Recent advances in computer vision have witnessed a paradigm shift toward deep learning methodologies, with convolutional neural networks demonstrating particular efficacy in both object detection and semantic segmentation applications for lane analysis. Whereas object detection frameworks localize lane segments through axis-aligned bounding box regression, semantic segmentation architectures achieve superior precision through dense pixel-wise classification, effectively addressing the geometric limitations imposed by perspective distortion in oblique aerial imagery. This pixel-accurate segmentation capability proves particularly advantageous for lane marking extraction, as the non-rectilinear geometry of projected lane segments in UAV-acquired imagery frequently violates the rectangular bounding box assumption fundamental to conventional object detection approaches.
A variety of network architectures have been developed for semantic segmentation. In this study, we provide a concise comparison among STDC (Short-Term Dense Concatenation) [31], BiSeNet [32], ESPNetV2 [33], and D-LinkNet [34], ultimately selecting the STDC network for our task. The STDC architecture incorporates an innovative Short-Term Dense Concatenation backbone that preserves rich multi-scale features while progressively reducing computational channels, leading to a significant improvement in computational efficiency. Its dual-branch design—comprising a spatial path and a context path—inherits the strengths of BiSeNet, effectively combining high-resolution spatial details with deep semantic information to ensure high segmentation accuracy. Compared to D-LinkNet, STDC is lighter and faster; relative to BiSeNet, it employs a more efficient custom backbone; and when compared to ESPNetV2, it achieves superior accuracy while maintaining comparable inference speed. Consequently, STDC presents an ideal solution for real-time semantic segmentation applications that require high accuracy.
The semantic segmentation architecture used by us, illustrated in Figure 1, builds upon the STDC network framework. The model employs a hierarchical backbone network that progressively reduces spatial resolution through five consecutive downsampling stages, each halving the feature map dimensions while expanding channel capacity. Critical intermediate features extracted from the third (feat3), fourth (feat4), and fifth (feat5) stages undergo specialized processing: the deepest features (feat5) first undergo global context aggregation through global average pooling (GAP) to produce the compressed representation “avg”. Concurrently, multi-scale features from stages four and five (feat4, feat5) are refined through channel-wise attention mechanisms, generating enhanced representations feat4arm and feat5arm, respectively.
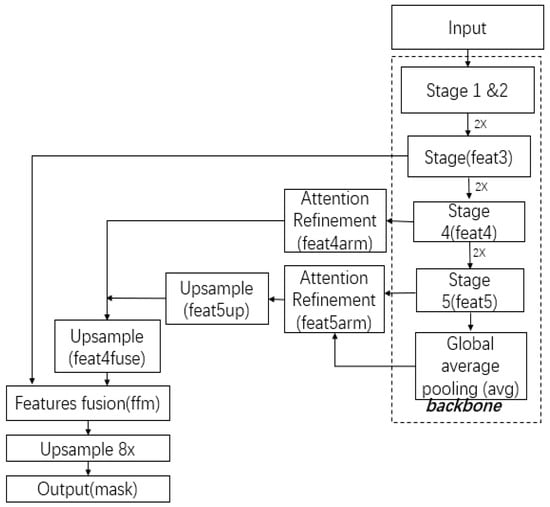
Figure 1.
Architecture of the segmentation network for road and lane marking extraction.
The network then implements a cascaded feature integration strategy, where the global context vector “avg” is combined with the attended high-level features (feat5arm) and upsampled 2× to produce feat5up. This intermediate representation is fused with the attended mid-level features (feat4arm) through element-wise summation, yielding the composite feature feat4fuse. The architecture further integrates lower-level details by combining feat4fuse with the stage three features (feat3) through a dedicated feature fusion module (FFM), which employs both spatial and channel attention to optimally combine multi-scale information. The resultant fused feature map (ffm) undergoes 8× bilinear upsampling to restore original input resolution before final pixel-wise classification. This carefully designed feature hierarchy and fusion strategy enables the STDC network to maintain segmentation precision while operating at real-time speeds.
2.2. Definitions Related to Lane Markings
We aim to generate a comprehensive lane distribution map that partitions the roadway into distinct yet topologically connected regions through precise lane marking segmentation. The fundamental geometric elements comprising our framework—including points, lines, and surfaces—require clear definition to avoid ambiguity. For conceptual clarification, we present in Figure 2 a binary segmentation mask derived from UAV imagery, where lane segments are represented as black regions against a white background denoting non-lane areas. With reference to Figure 2, we formally define the key concepts related to lane segmentation:
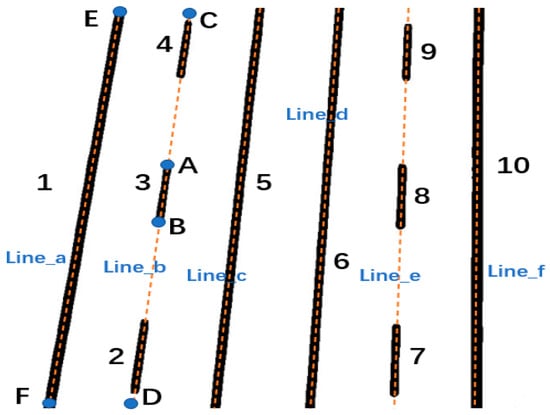
Figure 2.
Conceptual diagram of lane segmentation elements. Numbers 1–10 correspond to distinct line segments in the semantic segmentation results, letters A–F represent independent points, and labels Line_a to Line_f denote different lane markings.
Lane Segment: Defined as a topologically closed, connected component representing a continuous physical lane marking segment in the image domain. As exemplified in Figure 2 (segments 1–10), these manifest as either solid boundary demarcations (e.g., segments 1,5,6,10) or intermittent dashed markings. While projective geometry dictates these segments should theoretically form perspective-transformed quadrilaterals, practical segmentation artifacts typically introduce non-linear boundary perturbations.
Skeleton Line: Derived through medial axis transformation of each lane segment (e.g., line AB in segment 3), serving as a reduced-dimensional representation that preserves the essential linear characteristics of the original region. Under ideal conditions, these skeletal representations would exhibit perfect linearity; however, empirical observations reveal measurable deviations attributable to segmentation noise and environmental factors.
Lane Marking: Constructed through topological concatenation of all skeleton lines belonging to a continuous physical lane marking. For instance, segments 2,3,4 in Figure 2 collectively constitute lane marking Line_a (represented by polyline CD). Each skeleton line maintains bijective correspondence with exactly one lane marking entity, with centerline markings typically comprising multiple discrete skeletal segments while boundary markings often form continuous linear features.
Lane Region: Defined as the drivable surface area delimited by adjacent lane markings (e.g., the region bounded by Line_a and Line_b). This constitutes our primary extraction target, with the known geometric properties of standardized highway lanes (particularly their uniform width characteristics) serving as critical validation metrics during the reconstruction process.
Lane Completeness: Enforced through strict topological constraints requiring both correct classification of all lane segments to their respective markings (e.g., proper association of segments 2–4 to Line_b) and maintenance of full image-spanning continuity (with terminal points intersecting image boundaries). This completeness criterion ensures robust reconstruction of the complete lane network through proper topological connections between adjacent markings.
2.3. Dataset Description
Our dataset comprises aerial imagery captured by unmanned aerial vehicles (UAVs) along highway corridors, with flight altitudes maintained between 50 and 150 m to ensure optimal lane coverage and centering within the image frame. The UAV flight trajectory was carefully aligned with the highway centerline to maintain consistent perspective geometry. As illustrated in Figure 3, all images were captured from videos acquired using high-resolution cameras (1920 × 1080 pixels or higher), with capture angles constrained to less than 45 degrees from either the forward-looking or nadir (vertical downward) directions. The experimental setup utilized a DJI Matrice 300 unmanned aerial vehicle (UAV) equipped with a Zenmuse H20 imaging system mounted on an integrated gimbal. Video data was captured at a frame rate of 30 fps. The dataset consists of 1128 images in total, of which 10% were randomly selected as the validation set, with the remainder used as the training set.
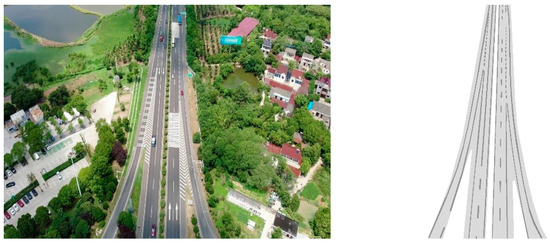
Figure 3.
UAV-captured images and annotation examples. The top image shows the original, while the bottom image displays the annotated version.
In the collected images (Figure 3), lane markings (including solid lines, dashed lines, etc., but excluding arrows or diversion markings) and road regions are annotated.
The dataset annotations, as demonstrated in Figure 3, include two primary classes: (1) lane markings (encompassing both solid and dashed delineators, while explicitly excluding directional arrows and diversion markings) and (2) drivable road regions. The left panel of Figure 3 presents a representative raw image, while the right panel displays its corresponding annotated counterpart, where lane markings and road areas are precisely delineated for subsequent analysis.
3. Methodology
The overall workflow of our proposed algorithm is illustrated in Figure 4. The input semantic segmentation mask, produced by the STDC network (Figure 1), is subjected to connectivity analysis to isolate distinct lane segments and extract their skeletal structures. These resulting skeletons are then approximated using polynomial fitting. Based on the positional relationships between these skeleton lines, we classify them into co-linear groups and ultimately divide the road into distinct lane regions.
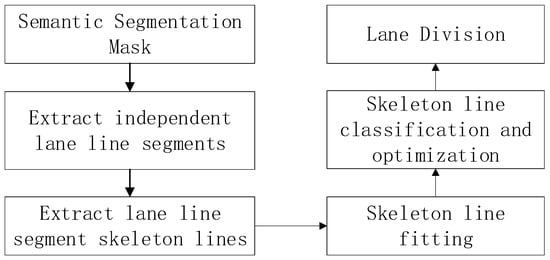
Figure 4.
Overall workflow.
3.1. Connectivity Analysis and Skeleton Line Extraction
The semantic segmentation mask treats lane markings as foreground and other regions as background. Assuming the extracted lane markings are solid, their contours can be represented using isolines. However, segmentation errors may cause discontinuities in inherently continuous lane markings. To address discontinuities caused by segmentation errors, we apply morphological dilation to the mask.
For precise geometric characterization, we employ OpenCV’s findContours algorithm to extract the boundary contours of each lane segment. This computational geometry approach operates by (1) detecting connected components within the binary image space, and (2) tracing continuous pixel sequences along intensity transitions to construct closed polygonal approximations of each contour.
Recognizing the fundamental continuity of lane structures, we subsequently derive medial axis representations (skeleton lines) for each segmented region. These one-dimensional descriptors, formally defined as ordered point sets {p1, p2,..., pn} ∈ ℝ2, provide a compact topological representation that preserves the essential geometric characteristics while converting the two-dimensional region into its dimensional-reduced form.
Lane segments exhibit characteristic quasi-linear, strip-like spatial distributions in the image plane. The extracted skeleton line inherently partitions each segment contour into two distinct boundary components—for vertically oriented segments, these are denoted as the left, , and right boundaries, . To optimize computational efficiency during skeleton extraction, we adopt a simplified representation:
where x and y represent horizontal and vertical coordinates in the image plane. As demonstrated in Figure 5, this approximated skeleton extraction method effectively preserves the geometric properties of lane segments while significantly reducing computational overhead.
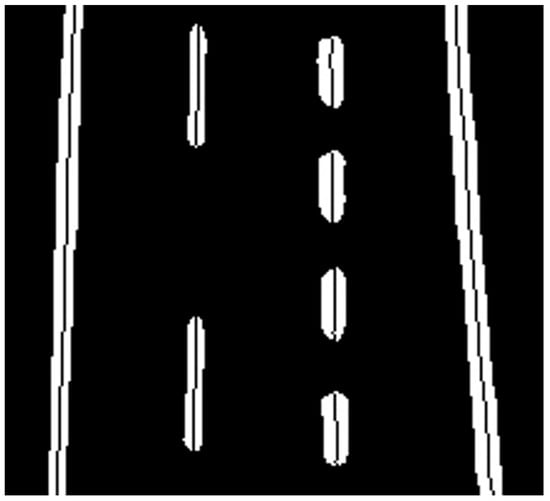
Figure 5.
Example of skeleton line extraction. The white region represents a lane segment, and the black line inside is its skeleton line.
3.2. Preliminary Fitting and Classification of Lane Skeleton Lines
Lane markings exhibit specific linear patterns. Here, we use parabolic or spline models to fit lane markings, representing them with quadratic or cubic polynomial parameters. Thus, lane marking fitting translates into solving polynomial parameters.
Figure 6a shows the lane marking mask obtained through semantic segmentation. After extracting skeleton lines for all lane segments, we sort them by length in the Y-direction. Starting with the longest skeleton line, we fit all skeleton lines using a quadratic function:
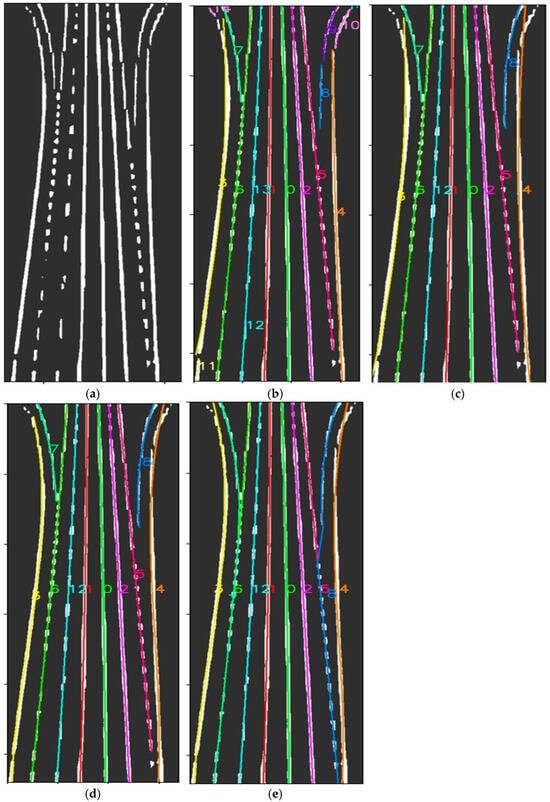
Figure 6.
Illustrative example of lane marking initial fitting process, where the colored curves in Figures (b–e) represent the fitted lane markings, and their corresponding number labels are shown in the same color. (a) Lane marking segmentation mask, where white regions represent lane segments and black denotes background; (b) Initial fitting results of lane markings, with distinct colors indicating different fitted lane curves; (c) Merged lane marking representation after topological combination; (d) Refined boundary representation following edge re-fitting; (e) Final complete lane topology after closure operation.
Here, the points (x, y) on the skeleton line are substituted into Equation (2) to form a system of equations. The least-squares solution for (c0, c1, c2) yields the lane marking’s fitted parameters.
Next, we classify lane markings. Let the parameters of the longest skeleton line be c0, c1, and c2 These parameters are used to fit the remaining skeleton lines, with the fitting error denoted as e:
where represents the coordinates of the ith point on the jth skeleton line, N is the total number of points, and ej is the average fitting error for that skeleton line. If ej is below a threshold (set to 20% of the average lane width), the skeleton line is classified as belonging to the current lane marking; otherwise, it is excluded. This process repeats until all skeleton lines are classified.
Each skeletal line either independently forms a complete lane marking or belongs to exactly one lane marking, with strict exclusivity in the fitting process. Once a skeletal line has been successfully incorporated into a particular lane marking during the fitting procedure, it is excluded from subsequent fitting iterations. As illustrated in Figure 6b, which demonstrates the iterative fitting and classification results, we observe three distinct patterns: (1) longer, continuous skeletal lines (e.g., skeletal lines 0 and 1) independently constitute complete lane markings; (2) certain lane markings (e.g., 6 and 13) are composed of multiple shorter skeletal segments; and (3) segmentation artifacts cause some short skeletal lines (e.g., 8, 9, and 10) to become erroneously detached from their original lane markings, resulting in spurious independent markings. The initial fitting results, designated as the preliminary lane marking set (laneSet0), can be formally represented as shown in Table 1.

Table 1.
Results of initial lane marking fitting.
3.3. Lane Marking Optimization
3.3.1. Removal of Isolated Lane Markings
In practical implementations, semantic segmentation outputs may erroneously classify non-lane objects with similar visual characteristics (e.g., utility poles or guardrails exhibiting high luminance values) as valid lane markings. To address this false positive detection issue, we implement a geometric validation step that systematically examines all candidate lane markings in the detection set. Specifically, we eliminate spurious detections when a lane marking simultaneously satisfies the following conditions regarding its vertical extent and curvature characteristics: (1) the normalized vertical span Ylen/iH falls below a predetermined threshold (as specified in Equation (4)), and (2) the second-order polynomial coefficient c2, which quantitatively characterizes the curvature of the fitted lane model, exceeds a critical value.
The parameter c2 serves as a direct metric for lane curvature, where c2 = 0 indicates perfect linearity (zero curvature) and |c2| > 0 corresponds to increasingly curved geometries. This validation criterion effectively filters out short, highly curved segments that are statistically unlikely to represent genuine lane markings in highway environments. Formally, the elimination condition can be expressed as:
where τ1 and τ2 represent empirically determined thresholds for vertical extent and curvature, respectively. The parameter τ1 is employed to filter out excessively short lane markings, whereas τ2 is utilized to detect curved lane skeleton lines. Instances such as vehicles or road signs on highways can be misclassified as lane lines by the semantic segmentation network. The segmentation masks of these objects often form compact patches instead of elongated structures, leading to a high quadratic coefficient c2 after polynomial fitting of their skeletal representations. These two criteria are combined to effectively remove such false positive lane segments. In our implementation, the threshold τ1 for Ylen/iH is set to 0.1, and τ2 is set to 1.0 × 10⁻⁴.
3.3.2. Merging of Incomplete Lane Markings
The proposed methodology implements a systematic validation process to identify and rectify fragmented lane markings within the preliminary lane set laneSet0, where adjacent segments belonging to the same physical lane may be incorrectly partitioned due to fitting sequence artifacts or continuity disruptions. As exemplified in Figure 6b by lane markings 12/13 and 8/9, such fragmentation occurs when geometrically continuous lane markings are erroneously segmented into discrete components during the initial fitting stage. To address this issue, a formal completeness criterion is established where fully continuous lane markings must span the entire vertical image dimension, with normalized vertical coordinates satisfying y0 = 0 and y1 = iH (image height).
The detection of potentially fragmented lanes proceeds through selective screening of candidates exhibiting vertical discontinuity, specifically those with either y0 > 0.1 iH (incomplete upper termination) or y1 < 0.9 iH (incomplete lower termination). For each identified candidate, a comprehensive matching procedure evaluates all geometrically compatible lane segments in the remaining set that maintain non-overlapping vertical spans, employing a localized fitting approach to assess continuity. As demonstrated in Figure 6b for lanes 8 and 9, this involves applying the parametric model of the reference lane (8) to a strategically selected subset of points from the candidate segment (9), focusing on proximal regions where continuity is most probable.
The merging decision utilizes an adaptive error metric comparing the localized fitting residual against a dynamically determined threshold, accounting for the expected curvature variation in authentic lane markings.
3.3.3. Boundary Lane Marking Refinement
Quadratic polynomial fitting generally provides satisfactory approximation accuracy for lane marking geometry in standard highway segments, serving as the primary mathematical model for initial lane fitting. However, this representation demonstrates limited capability in accurately capturing the complex curvature profiles exhibited at roadway bifurcations or along boundary lanes with pronounced arc geometries, resulting in significantly increased fitting residuals. Such limitations necessitate a comprehensive error evaluation protocol examining the approximation accuracy across all constituent segments of each lane marking.
The proposed framework implements a localized error assessment strategy where segments exhibiting fitting residuals exceeding established thresholds undergo secondary modeling using spline-based representations. As illustrated in Figure 6d, the boundary lane marking 4 demonstrates superior geometric fidelity when modeled with spline functions compared to its parabolic approximation shown in Figure 6c, particularly in regions of high curvature variation. This adaptive approach maintains computational efficiency through selective application of higher-order models, only where necessitated by local geometric complexity.
3.4. Lane Marking Closure and Lane Division
3.4.1. Lane Marking Completion and Continuity Enforcement
In this critical phase of our methodology, we rigorously ensure the topological completeness of all detected lane markings through a multi-stage refinement process. The integrity of lane markings is paramount for accurate lane delineation, particularly in UAV-captured imagery where perspective distortion and segmentation artifacts frequently disrupt linear continuity.
- (1)
- Geometric Completeness Verification
We systematically examine each extracted lane marking for geometric continuity by evaluating its vertical span within the image coordinate system, classifying them into three distinct categories based on their termination points: a lane marking is considered fully continuous when it spans the entire vertical dimension from the top (y0 = 0) to the bottom (y1 = image height) of the image; it is identified as head-truncated when the upper termination point (y0) is displaced from the image boundary; and categorized as tail-truncated when the lower termination point (y1) fails to reach the base of the image, with each classification informing our subsequent processing strategies for lane marking completion and refinement.
- (2)
- Adaptive Extension Algorithm
For markings with minor discontinuities where the vertical gap is less than 10% of the image height (δy < 0.1·iH), we employ polynomial extrapolation based on the established curve parameters. As shown in Figure 6d, lane marking 5 presents a representative case where the bottom segment does not fully extend to the image boundary, yet the missing portion remains sufficiently limited (δy < 10% of iH). In such scenarios, we seamlessly extend the lane marking to the image bottom by applying its original polynomial parameters (c0, c1, c2 from Equation (2)), thereby maintaining the inherent curvature characteristics without introducing additional fitting errors or distortions.
This methodology demonstrates particular effectiveness in addressing several common challenges encountered in aerial lane detection. It reliably handles short gaps resulting from temporary occlusions, compensates for local segmentation failures when flanking regions exhibit consistency, and corrects perspective-induced thinning effects at image boundaries where the overall trajectory remains stable. The approach maintains robust performance across varying image resolutions and flight altitudes.
The extrapolation process ensures geometric coherence through multiple safeguards. It strictly preserves the original polynomial coefficients during extension, cross-validates each extension against parallel lane constraints to maintain road geometry, and implements an extension length limit of 10% of the image height (δy_max = 0.1·iH) to prevent artifacts from over-extension.
- (3)
- Lane Marking Merging
For lane markings that exhibit bifurcation, such as lane marking 8 in Figure 6d, where the bottom portion is significantly incomplete with substantial missing segments, it becomes necessary to establish connections with other lane markings that maintain complete bottom continuity. The process for identifying suitable connecting lane markings follows the same methodology as the lane merging approach described in Section 3.3.2, with the key distinction being the absence of a threshold constraint, in this case. Instead, the optimal connection is determined by selecting the lane marking with the minimal fitting error. As illustrated in Figure 6d, lane marking 8 requires connection to lane marking 5.
The connection between lane markings 8 and 5 is established by directly linking point A (the bottommost point of lane marking 8) to point B on lane marking 5. While point A can be readily identified as the terminal point of lane marking 8, the determination of point B involves consideration of two critical factors: first, whether the candidate point lies along the projected extension direction of lane marking 8, and second, the spatial distance between points A and B. The directional alignment can be evaluated through the fitting error of lane marking 8, while the spatial proximity can be assessed by measuring their vertical (Y-axis) separation distance. In practical implementation, we employ a weighted formula to define a deviation metric:
where normalized distance and fitting error are represented by symbols, ηi and φi, respectively, the subscript i denotes the ith point on the lane segment, the symbol, λi, represents the deviation index relative to lane marking g with higher values indicating greater deviation, and the point with the minimal symbol value is identified as the optimal connection point B.
3.4.2. Lane Division Based on Global Road Information
Following completion of the lane marking refinement procedure, the final lane partitioning is established through a systematic spatial organization of all validated markings. Precise positional ordering is implemented by first sorting markings according to ascending starting X-coordinates in a left-to-right sequence, with secondary sorting based on ending X-coordinates to resolve branching pattern ambiguities. This deterministic arrangement ensures that the planar region delimited by any two adjacent markings in the ordered sequence constitutes a distinct navigable lane, thereby maintaining complete coverage of drivable surfaces while preserving roadway network topology.
Specialized processing addresses two critical edge cases during the division process. Emergency lane identification combines road segmentation masks with lane width consistency metrics to compensate for absent boundary markings, while non-navigable zones including medians and vegetated areas are excluded through statistical analysis of road pixel density within candidate regions. This dual validation methodology, integrating geometric ordering with semantic verification, demonstrates consistent performance across diverse highway configurations and imaging conditions while adhering to established roadway design standards.
4. Experimental Analysis
Our research addresses the critical task of highway lane extraction from UAV imagery through a three-stage computational framework comprising road segmentation, lane marking extraction, and lane division. The semantic segmentation component proves particularly crucial, as its performance directly determines the accuracy of subsequent processing stages. Consequently, our evaluation methodology encompasses both the intermediate semantic segmentation results and final lane extraction outputs.
To optimize the semantic segmentation performance, we implement an enhanced STDC network architecture incorporating dual loss optimization. The primary segmentation loss employs Online Hard Example Mining (OHEM) to prioritize challenging samples during batch training, while the complementary boundary loss utilizes Laplacian-based edge detection to generate precise boundary labels. This combined approach simultaneously optimizes both region coherence and boundary localization through integrated binary cross-entropy and Dice loss minimization.
We adopt mini-batch Stochastic Gradient Descent (SGD) for parameter optimization, with momentum and weight decay set to 0.9 and 5 × 10⁻⁵ respectively. The learning rate, initialized at 0.01, follows a warmup strategy for the first 1000 iterations. Subsequently, the learning rate decays according to the formula: initial learning rate × , where power = 0.9. Figure 7 illustrates the learning rate and loss curves throughout training. After 43,000 iterations, the loss function stabilized with a batch size of 8, indicating successful model training. The hyperparameters associated with the learning rate and optimizer were primarily based on references [34,35]. A batch size of 8 was selected after empirical evaluation of multiple options, including 4, 8, and 16.
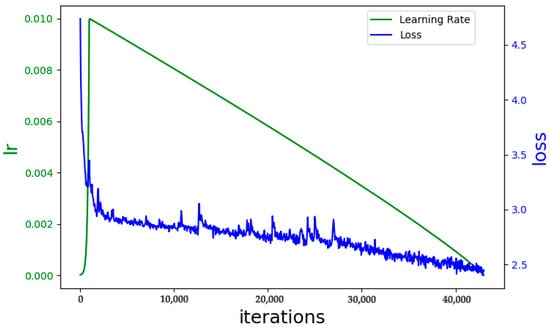
Figure 7.
Learning rate and loss function curves, where the blue line represents the loss value, the green line indicates the learning rate, and the x-axis denotes the number of training iterations.
To enhance model generalization, we implement multiple data augmentation techniques including color jittering [36], random horizontal flipping [36], random cropping [37], and random resizing [38,39]. The original image size is 1920 × 1280. Higher resolution generally results in longer training and inference times for the model, yet it also leads to improved segmentation accuracy. To strike a balance between accuracy and computational cost while preserving the original aspect ratio, we resized the images to 1080 × 720. The training and evaluation environment utilizes the PyTorch 1.9.1 framework with CUDA 11.1 enabled for accelerated computing. The system is equipped with an Intel (R) Xeon (R) Gold 5218R CPU @ 2.10GHz and an NVIDIA GeForce RTX 3090 GPU.
For semantic segmentation evaluation, we employ two standard metrics: Intersection over Union (IoU) and Accuracy (Acc). IoU measures the overlap between predicted and ground truth regions for each category, while Acc calculates pixel-wise classification accuracy. The IoU is mathematically defined as:
where X is the pixel set of a specific category in the ground truth, Y is the corresponding pixel set in the prediction results, |X ∩ Y| denotes the intersection of X and Y, and |X| and |Y| represent the cardinalities of sets X and Y, respectively. As shown in Table 2, the STDC model outperforms the other two compared models, achieving an IoU of 90.97% in road segmentation and 74.03% in lane marking segmentation, along with an overall weighted IoU (FwIoU) of 96.53% and a pixel accuracy of 98.17%.

Table 2.
Metrics for semantic segmentation of roads and lane lines.
Distinct from conventional semantic segmentation approaches for road and lane marking identification, our lane extraction framework addresses an instance segmentation challenge demanding accurate differentiation between individual lane markings. Accordingly, we employ recall (sensitivity), precision, and F1-score as our primary evaluation metrics. Following established practices in object detection, a lane prediction is considered successful when the Intersection over Union (IoU) between the predicted lane mask and ground truth mask exceeds a predetermined threshold, with the constraint that each ground truth lane can be matched to at most one predicted lane.
Table 3 presents the lane prediction performance across varying IoU thresholds. Notably, at an IoU threshold of 0.8, our method achieves comprehensive performance with recall exceeding 90%, precision above 90%, and F1-score maintaining over 90%. The formal definitions of these metrics are:
where TP (True Positive) represents correctly identified lane markings, FP (False Positive) indicates erroneously detected non-lane regions, FN (False Negative) denotes missed actual lane markings, TN (True Negative) refers to correctly rejected background areas. Table 3 presents performance under different IoU thresholds. At IoU = 0.5, our method achieves 93.25% recall, 94.98% precision, and 94.11% F1-score, with mean IoU reaching 93.84%. These results demonstrate robust performance across various matching criteria.

Table 3.
Results of lane segmentation.
Figure 8 showcases qualitative results on two typical UAV images. The right example demonstrates accurate lane extraction from low-altitude imagery where lane markings appear clearly. The left example shows our method’s capability in handling more challenging high-altitude scenarios where lane markings become smaller and less distinct, while still maintaining reliable performance. These visual results complement the quantitative metrics, comprehensively validating our approach’s effectiveness in practical applications.
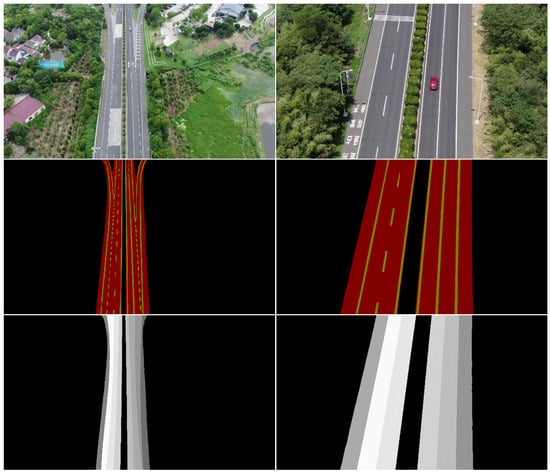
Figure 8.
The extracted lanes, where the first row represents the original images captured by the UAV; the second row represents the segmentation maps of the road and lane lines; and the third row represents the lane maps obtained after processing.
5. Conclusions
We present a comprehensive framework for highway lane extraction from low-altitude UAV imagery, addressing unique challenges of aerial perspectives through a three-stage methodology. First, we achieve robust road and lane marking segmentation using an optimized STDC network, attaining 90.97% road IoU and 74.03% lane marking IoU. Second, we develop a novel polynomial-based iterative fitting algorithm that effectively classifies and merges fragmented lane segments while resolving bifurcations and discontinuities. Finally, we introduce a global-information fusion mechanism for precise lane division, incorporating road topology constraints and adaptive width modeling. Our approach achieves state-of-the-art performance with 93.84% mean IoU, 93.25% recall, and 94.98% precision at IoU threshold 0.5, effectively bridging the research gap in UAV-based lane extraction while establishing a practical foundation for intelligent traffic monitoring systems. The method demonstrates particular robustness across varying flight altitudes and complex highway configurations, validated through extensive experiments on real-world aerial datasets.
Author Contributions
J.W.: Conceptualization, Writing—Original Draft; G.H.: Conceptualization, Formal Analysis; X.D.: Investigation, Data Curation; F.W.: Methodology, Project Administration; Y.Z.: Data Curation, Validation. All authors have read and agreed to the published version of the manuscript.
Funding
This research was funded by the National Natural Science Foundation of China, Grant No. 41801291 and the scientific research foundation of Changzhou University, Grant No. ZMF21020364.
Data Availability Statement
The data presented in this study are available on request from the corresponding author.
Conflicts of Interest
Author Guangjun He was employed by the company Space Star Technology Corporation Limited. The remaining authors declare that the research was conducted in the absence of any commercial or financial relationships that could be construed as a potential conflict of interest.
References
- Mozaffari, M.; Saad, W.; Bennis, M.; Nam, Y.H.; Debbah, M. A tutorial on UAVs for wireless networks: Applications, challenges, and open problems. IEEE Commun. Surv. Tutor. 2019, 21, 2334–2360. [Google Scholar] [CrossRef]
- Butilă, E.V.; Boboc, R.G. Urban traffic monitoring and analysis using unmanned aerial vehicles (UAVs): A systematic literature review. Remote Sens. 2022, 14, 620. [Google Scholar] [CrossRef]
- Shakhatreh, H.; Sawalmeh, A.H.; Al-Fuqaha, A.; Dou, Z.; Almaita, E.; Khalil, I.; Othman, N.S.; Khreishah, A.; Guizani, M. Unmanned aerial vehicles (UAVs): A survey on civil applications and key research challenges. IEEE Access 2019, 7, 48572–48634. [Google Scholar] [CrossRef]
- Alsammak, I.L.H.; Mahmoud, M.A.; Aris, H.; AlKilabi, M.; Mahdi, M.N. The use of swarms of unmanned aerial vehicles in mitigating area coverage challenges of forest-fire-extinguishing activities: A systematic literature review. Forests 2022, 13, 811. [Google Scholar] [CrossRef]
- Khan, M.A.; Ectors, W.; Bellemans, T.; Janssens, D.; Wets, G. UAV-based traffic analysis: A universal guiding framework based on literature survey. Transp. Res. Proced. 2017, 22, 541–550. [Google Scholar] [CrossRef]
- Panetsos, F.; Rousseas, P.; Karras, G.; Bechlioulis, C.; Kyriakopoulos, K.J. A vision-based motion control framework for water quality monitoring using an unmanned aerial vehicle. Sustainability 2022, 14, 6502. [Google Scholar] [CrossRef]
- Wu, Y.; Abdel-Aty, M.; Zheng, O.; Cai, Q.; Zhang, S. Automated safety diagnosis based on unmanned aerial vehicle video and deep learning algorithm. Transp. Res. Rec. 2020, 2674, 350–359. [Google Scholar] [CrossRef]
- Kataev, M.; Kartashov, E.; Avdeenko, V. UAV Image Analysis for Road Surface Violation Detection. In Proceedings of the 2022 International Siberian Conference on Control and Communications (SIBCON), Krasnoyarsk, Russia, 11–13 November 2022; pp. 1–5. [Google Scholar]
- Khan, N.A.; Jhanjhi, N.Z.; Brohi, S.N.; Usmani, R.S.A.; Nayyar, A. Smart traffic monitoring system using unmanned aerial vehicles (UAVs). Comput. Commun. 2020, 157, 434–443. [Google Scholar] [CrossRef]
- Park, C.H.; Choi, K.; Lee, I. Lane extraction through UAV mapping and its accuracy assessment. J. Korean Soc. Surv. Geod. Photogramm. Cartogr. 2016, 34, 11–19. [Google Scholar] [CrossRef]
- Udin, W.S.; Ahmad, A. Assessment of photogrammetric mapping accuracy based on variation flying altitude using unmanned aerial vehicle. In Proceedings of the IOP Conference Series: Earth and Environmental Science, Kuala Lumpur, Malaysia, 26–27 February 2014; Volume 18, No. 1. p. 012027. [Google Scholar]
- Brkić, I.; Miler, M.; Ševrović, M.; Medak, D. An analytical framework for accurate traffic flow parameter calculation from UAV aerial videos. Remote Sens. 2020, 12, 3844. [Google Scholar] [CrossRef]
- Bisio, I.; Garibotto, C.; Haleem, H.; Lavagetto, F.; Sciarrone, A. Traffic analysis through deep-learning-based image segmentation from UAV streaming. IEEE Internet Things J. 2022, 10, 6059–6073. [Google Scholar] [CrossRef]
- Byun, S.; Shin, I.K.; Moon, J.; Kang, J.; Choi, S.I. Road traffic monitoring from UAV images using deep learning networks. Remote Sens. 2021, 13, 4027. [Google Scholar] [CrossRef]
- Ahmed, A.; Ngoduy, D.; Adnan, M.; Baig, M.A.U. On the fundamental diagram and driving behavior modeling of heterogeneous traffic flow using UAV-based data. Transp. Res. Part A Policy Pract. 2021, 148, 100–115. [Google Scholar] [CrossRef]
- Gu, X.; Abdel-Aty, M.; Xiang, Q.; Cai, Q.; Yuan, J. Utilizing UAV video data for in-depth analysis of drivers’ crash risk at interchange merging areas. Accid. Anal. Prev. 2019, 123, 159–169. [Google Scholar] [CrossRef] [PubMed]
- Meyer, A.; Salscheider, N.O.; Orzechowski, P.F.; Stiller, C. Deep semantic lane segmentation for mapless driving. In Proceedings of the 2018 IEEE/RSJ International Conference on Intelligent Robots and Systems (IROS), Madrid, Spain, 1–5 October 2018; pp. 869–875. [Google Scholar]
- Rahman, Z.; Morris, B.T. LVLane: Deep learning for lane detection and classification in challenging conditions. In Proceedings of the 2023 IEEE 26th International Conference on Intelligent Transportation Systems (ITSC), Bilbao, Spain, 24–28 September 2023; pp. 3901–3907. [Google Scholar]
- Pan, X.; Shi, J.; Luo, P.; Wang, X.; Tang, X. Spatial as deep: Spatial cnn for traffic scene understanding. In Proceedings of the 32nd AAAI Conference on Artificial Intelligence (AAAI), New Orleans, LA, USA, 2–7 February 2018; Volume 32. No. 1. [Google Scholar]
- Chougule, S.; Koznek, N.; Ismail, A.; Adam, G.; Narayan, V.; Schulze, M. Reliable multilane detection and classification by utilizing cnn as a regression network. In Proceedings of the European Conference on Computer Vision Workshops (ECCVW), Munich, Germany, 8–14 September 2018; pp. 324–778. [Google Scholar]
- Neven, D.; De Brabandere, B.; Georgoulis, S.; Proesmans, M.; Van Gool, L. Towards end-to-end lane detection: An instance segmentation approach. In Proceedings of the 2018 IEEE Intelligent Vehicles Symposium (IV), Changshu, China, 26–30 June 2018; pp. 286–291. [Google Scholar]
- He, S.; Balakrishnan, H. Lane-level street map extraction from aerial imagery. In Proceedings of the IEEE/CVF Winter Conference on Applications of Computer Vision (WACV), Waikoloa, HI, USA, 3–8 January 2022; pp. 2080–2089. [Google Scholar]
- Azimi, S.M.; Fischer, P.; Körner, M.; Reinartz, P. Aerial LaneNet: Lane-marking semantic segmentation in aerial imagery using wavelet-enhanced cost-sensitive symmetric fully convolutional neural networks. IEEE Trans. Geosci. Remote Sens. 2018, 57, 2920–2938. [Google Scholar] [CrossRef]
- Chiu, K.Y.; Lin, S.F. Lane detection using color-based segmentation. In Proceedings of the 2005 IEEE Intelligent Vehicles Symposium, Las Vegas, NV, USA, 6–8 June 2005; pp. 706–711. [Google Scholar]
- Sun, T.Y.; Tsai, S.J.; Chan, V. HSI color model based lane-marking detection. In Proceedings of the 2006 IEEE Intelligent Transportation Systems Conference, Toronto, ON, Canada, 17–20 September 2006; pp. 1168–1172. [Google Scholar]
- Duan, J.; Zhang, Y.; Zheng, B. Lane line recognition algorithm based on threshold segmentation and continuity of lane line. In Proceedings of the 2016 2nd IEEE International Conference on Computer and Communications (ICCC), Chengdu, China, 14–16 October 2016; pp. 680–684. [Google Scholar]
- Chai, Y.; Wei, S.J.; Li, X.C. The multi-scale Hough transform lane detection method based on the algorithm of Otsu and Canny. Adv. Mater. Res. 2014, 1042, 126–130. [Google Scholar] [CrossRef]
- Gaikwad, V.; Lokhande, S. Lane departure identification for advanced driver assistance. IEEE Trans. Intell. Transp. Syst. 2014, 16, 910–918. [Google Scholar] [CrossRef]
- Yao, J.; Pan, X.; Wu, T.; Zhang, X. Building lane-level maps from aerial images. In Proceedings of the ICASSP 2024–2024 IEEE International Conference on Acoustics, Speech and Signal Processing (ICASSP), Seoul, Republic of Korea, 18 March 2024; pp. 3890–3894. [Google Scholar]
- Kurz, F.; Azimi, S.M.; Sheu, C.Y.; d’Angelo, P. Deep learning segmentation and 3D reconstruction of road markings using multiview aerial imagery. ISPRS Int. J. Geo-Inf. 2019, 8, 47. [Google Scholar] [CrossRef]
- Fan, M.; Lai, S.; Huang, J.; Wei, X.; Chai, Z.; Luo, J.; Wei, X. Rethinking BiSeNet For Real-time Semantic Segmentation. In Proceedings of the IEEE/CVF Conference on Computer Vision and Pattern Recognition (CVPR), Nashville, TN, USA, 20–25 June 2021; pp. 9716–9725. [Google Scholar]
- Yu, C.; Wang, J.; Gao, C.; Yu, G.; Shen, C.; Sang, N. BiSeNet: Bilateral Segmentation Network for Real-time Semantic Segmentation. In Proceedings of the European Conference on Computer Vision (ECCV), Munich, Germany, 8–14 September 2018; pp. 325–341. [Google Scholar]
- Mehta, S.; Rastegari, M.; Caspi, A.; Shapiro, L.; Hajishirzi, H. ESPNetv2: A Light-weight, Power Efficient, and General Purpose Convolutional Neural Network. In Proceedings of the IEEE/CVF Conference on Computer Vision and Pattern Recognition (CVPR), Long Beach, CA, USA, 16–20 June 2019; pp. 9190–9200. [Google Scholar]
- Zhou, L.; Zhang, C.; Wu, M. D-LinkNet: LinkNet with Pretrained Encoder and Dilated Convolution for High Resolution Satellite Imagery Road Extraction. In Proceedings of the IEEE/CVF Conference on Computer Vision and Pattern Recognition Workshops (CVPRW), Salt Lake City, UT, USA, 18–22 June 2018; pp. 182–186. [Google Scholar]
- Goyal, P.; Dollár, P.; Girshick, R.; Noordhuis, P.; Wesolowski, L.; Kyrola, A.; Tulloch, A.; Jia, Y.; He, K. Accurate, Large Minibatch SGD: Training ImageNet in 1 Hour. In Proceedings of the 2018 IEEE/CVF Conference on Computer Vision and Pattern Recognition (CVPR), Salt Lake City, UT, USA, 18–22 June 2018; pp. 6014–6023. [Google Scholar]
- Krizhevsky, A.; Sutskever, I.; Hinton, G.E. ImageNet classification with deep convolutional neural networks. In Proceedings of the Advances in Neural Information Processing Systems 25 (NIPS 2012), Lake Tahoe, NV, USA, 3–6 December 2012; pp. 1097–1105. [Google Scholar]
- Szegedy, C.; Liu, W.; Jia, Y.; Sermanet, P.; Reed, S.; Anguelov, D.; Erhan, D.; Vanhoucke, V.; Rabinovich, A. Going deeper with convolutions. In Proceedings of the 2015 IEEE Conference on Computer Vision and Pattern Recognition (CVPR), Boston, MA, USA, 7–12 June 2015; pp. 1–9. [Google Scholar]
- Lin, T.-Y.; Dollár, P.; Girshick, R.; He, K.; Hariharan, B.; Belongie, S. Feature pyramid networks for object detection. In Proceedings of the 2017 IEEE International Conference on Computer Vision (ICCV), Venice, Italy, 22–29 October 2017; pp. 2117–2125. [Google Scholar]
- He, K.; Gkioxari, G.; Dollár, P.; Girshick, R. Mask R-CNN. In Proceedings of the 2017 IEEE International Conference on Computer Vision (ICCV), Venice, Italy, 22–29 October 2017; pp. 2961–2969. [Google Scholar]
Disclaimer/Publisher’s Note: The statements, opinions and data contained in all publications are solely those of the individual author(s) and contributor(s) and not of MDPI and/or the editor(s). MDPI and/or the editor(s) disclaim responsibility for any injury to people or property resulting from any ideas, methods, instructions or products referred to in the content. |
© 2025 by the authors. Licensee MDPI, Basel, Switzerland. This article is an open access article distributed under the terms and conditions of the Creative Commons Attribution (CC BY) license (https://creativecommons.org/licenses/by/4.0/).