Article

Synchronous Stability Analysis and Enhanced Control of Power Systems with Grid-Following and Grid-Forming Converters Considering Converter Distribution

1
Guangzhou Power Supply Bureau of Guangdong Power Grid Co., Ltd., Guangzhou 510630, China
2
State Key Laboratory of HVDC, Electric Power Research Institute, CSG, Guangzhou 510663, China
*
Author to whom correspondence should be addressed.
Electronics 2025, 14(17), 3539; https://doi.org/10.3390/electronics14173539
Submission received: 30 July 2025 / Revised: 30 August 2025 / Accepted: 1 September 2025 / Published: 5 September 2025

Abstract

Under the backdrop of low-carbon energy transition, the increasing integration of grid-following (GFL) and grid-forming (GFM) converters into power systems is profoundly altering transient synchronous stability. A critical challenge lies in analyzing synchronous stability in grids with high penetration converters and improving converter control strategies to enhance stability. This paper selects virtual synchronous generator (VSG)-based converters as representative GFM units to investigate synchronous stability and control in hybrid systems with both VSG and GFL converters. To simplify stability analysis, this study proposes a novel distribution scheme of power supplies based on an assessment of the ability of different sources to reshape synchronous stability. Specifically, synchronous generators (SGs) and GFL converters are located in the power sending area, while VSGs are deployed in the power receiving area. Under this configuration, synchronous risk is predominantly determined by the power-angle difference between VSGs and SGs. Subsequently, the mechanism by which voltage stability affects synchronous stability between SGs and VSGs is revealed. Furthermore, enhanced control strategies for both VSG and GFL converters are proposed which adjust their transient active/reactive power response characteristics to enhance synchronous stability between SGs and VSGs. Finally, the theoretical analysis and control strategies are validated through simulations on a multi-machine, two-area interconnected power system. Under the proposed enhanced control strategies for GFLs and VSGs, the first-swing power-angle amplitude between VSGs and SGs is reduced by 60% and 49%.

1. Introduction

In recent years, the growing integration of renewable sources has led to an increasing share of voltage source converters (VSCs) in power grids [1]. Consequently, the control strategies of VSCs are playing an increasingly critical role in determining the transient stability of modern power systems.
The control strategies for VSCs primarily include grid-following control (GFL) and grid-forming control (GFM) [2]. The synchronization unit of GFL is the phase-locked loop (PLL). While it offers fast power response, enabling operation at maximum power points or dispatch setpoints, it inherently lacks active voltage and frequency regulation capabilities [3]. In contrast, virtual synchronous generator (VSG) control, as a mainstream GFM approach [4], can autonomously establish AC-side output voltage without dependence on external AC systems while actively participating in frequency and voltage regulation. However, this method typically requires multiple-fold overcurrent capability in design, resulting in poorer economic feasibility [5]. Consequently, to balance both economic and stability requirements in power systems, both GFL and VSG technologies will play crucial roles in future grids with high penetration of power electronic converters.
With the increasing penetration of GFL and VSG converters, their impact on transient synchronous stability has attracted significant attention from researchers.
The transient synchronous stability mechanisms of power systems incorporating GFL converters have been extensively analyzed in [6,7,8,9]. Studies [6,7] demonstrated that the voltage drop occurring across grid impedance renders the point of common coupling (PCC) voltage susceptible to variations in the GFL inverter injection current, thereby inducing dynamic interactions between GFL converters and the main grid. These interactions have been recognized as the root mechanism leading to PLL desynchronization in GFL systems. Based on the equal-area criterion (EAC), investigations in [8,9] derived analytical expressions correlating the levels of GFL penetration with the power-angle disparities among synchronous generators (SGs). Their findings indicated that while initial increases in GFL penetration enhance synchronous stability between SGs, further penetration ultimately compromises it. Thus, an optimal level of GFL penetration exists that maximizes transient synchronous stability performance.
References [10,11,12,13] focus on the transient synchronous stability mechanisms in power systems incorporating VSG converters. Studies [10,11] employ EAC to elucidate the power-angle stability mechanism of VSG under large disturbances. Reference [12] reveals that the transient switching operation mode (TSOM) induced by current saturation limits reduces the deceleration area and consequently degrades transient stability performance. Furthermore, reference [13] investigates the transient loss-of-synchronization mechanism in VSG-SG hybrid systems based on the extended equal area criterion (EEAC), identifying the disparity between VSG and SG governor characteristics as a critical factor affecting transient synchronous stability.
In addition, leveraging the flexible and controllable nature of converters, numerous scholars have adapted the control strategies for GFL/VSG to enhance the synchronous stability of power systems.
Research efforts in [14,15,16,17] explore GFL control methods to strengthen transient synchronous stability. Specifically, refs. [14,15] enhance stability by boosting reactive power injection from GFL converters into the grid. Meanwhile, ref. [16] introduces a novel GFL active power regulation strategy to mitigate power imbalance in adjacent synchronous generators (SGs). Additionally, ref. [17] develops a coordinated approach combining double-fed induction generator active power adjustment with generator tripping control.
In [10,11,18,19,20,21,22], the enhanced control strategies of VSG are discussed. In [10], a flexible control strategy for VSG parameters is proposed to enhance the transient stability by adjusting damping coefficient and rotational inertia. In [11], a mode-adaptive power angle control is proposed to prevent the VSG-based system from collapsing due to the delayed fault clearance or the malfunction of protective relays. In [18], the transient power angle acceleration of VSG is suppressed by adjusting the active power command value. In [19], an anti-windup stability enhancement control strategy is proposed to maintain the normal unsaturated mode of the VSG while ensuring transient stability. In [20], an equal proportional area criterion is introduced to guide the design of VSG control, along with an adaptive strategy for adjusting inertia and damping. In [21], an active power dispatch method aimed at minimizing transient instability risk is proposed. In [22], an adaptive power angle compensation algorithm is developed to improve transient synchronous stability.
In summary, the aforementioned studies have substantially advanced the analysis and control of synchronous stability in power systems incorporating VSG or GFL converters. Nevertheless, two major research gaps persist. First, the underlying mechanisms through which converter distribution and voltage stability affect synchronous stability have not been systematically investigated. Second, while existing enhanced control strategies have been developed for either VSG-SG or SG-GFL systems, there is a notable absence of comprehensive control solutions specifically designed for hybrid VSG-GFL-SG systems due to the complex coherency grouping and strong coupling among multiple types of power sources. Therefore, the contributions of this paper are as follows.
(1) Building upon the analysis of the distinct capabilities of different power sources in reshaping synchronous stability, this paper proposes a novel distribution scheme for VSG, GFL, and SG units to simplify stability analysis and control in future grids with high penetration converters. The proposed scheme strategically locates SGs and GFL converters at the power sending area while locating VSG units at the power receiving area. Under the scheme, transient synchronous stability is determined by the power angle difference between VSGs and SGs.
(2) Based on EEAC, this study analytically examines how the voltage stability affects the synchronous stability between SGs and VSGs. The research reveals that voltage stability and synchronous stability are positively correlated.
(3) Under the proposed distribution scheme of power supplies, this paper develops enhanced control strategies for VSG and GFL converters to regulate their transient active/reactive power response characteristics, thereby enhancing the voltage stability and the synchronous stability between SGs and VSGs.
The rest of the paper is organized as follows: Section 2 introduces the classical control structures of VSG and GFL converters, and the two-area interconnection system. The mechanism analysis is discussed in Section 3. Section 4 proposes enhanced GFL and VSG control strategies. Section 5 validates the mechanism analysis and the proposed control strategy through PSCAD. Section 6 summarizes the conclusions.

2. Modeling

2.1. Classical VSG Control

Figure 1 represents a generalized model for GFM controls, where distinctions among different GFM strategies primarily manifest in the mathematical expressions used in the active power loop. This paper specifically focuses on the VSG control structure, and the expression for its active power control loop is as (1).
M V d 2 δ V d t 2 = P ref 0 P e . V D ( ω V 1 )
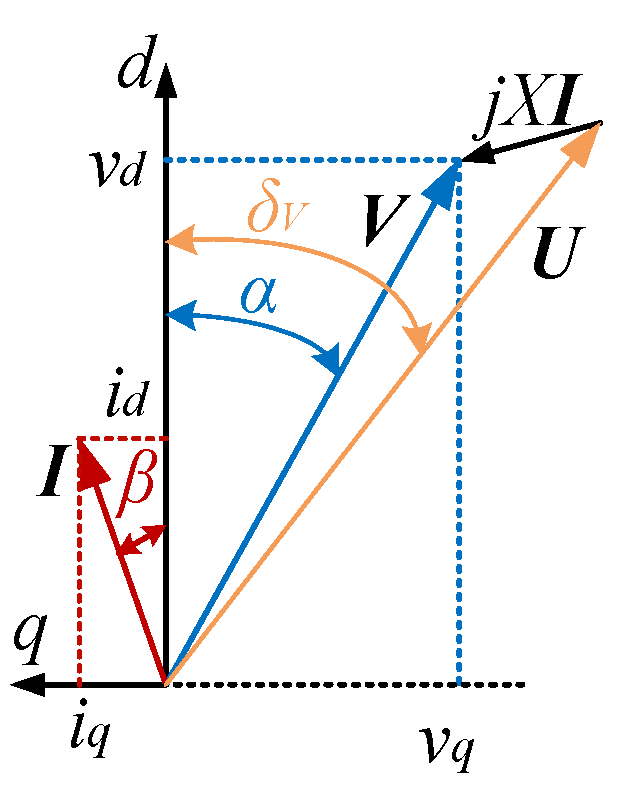
where MV represents the virtual inertia coefficient and D denotes the damping coefficient. ωV is the actual angular speed. Pref0 and Pe.V are the command value and actual value of the active power of VSG. V and U are the voltage vectors of VSG and the grid. I is the current vector of VSG. δV is the virtual power angle of the active power loop of VSG and its specific definition is as follows.
VSG’s virtual power angle is defined as the angle between the d-axis (generated by the active power loop) and the grid’s voltage (U). The relationship between V, U, and I is shown in Figure 2. α is the angle between the d-axis and V. β is the angle between I and the d-axis.

2.2. Classical GFL Control

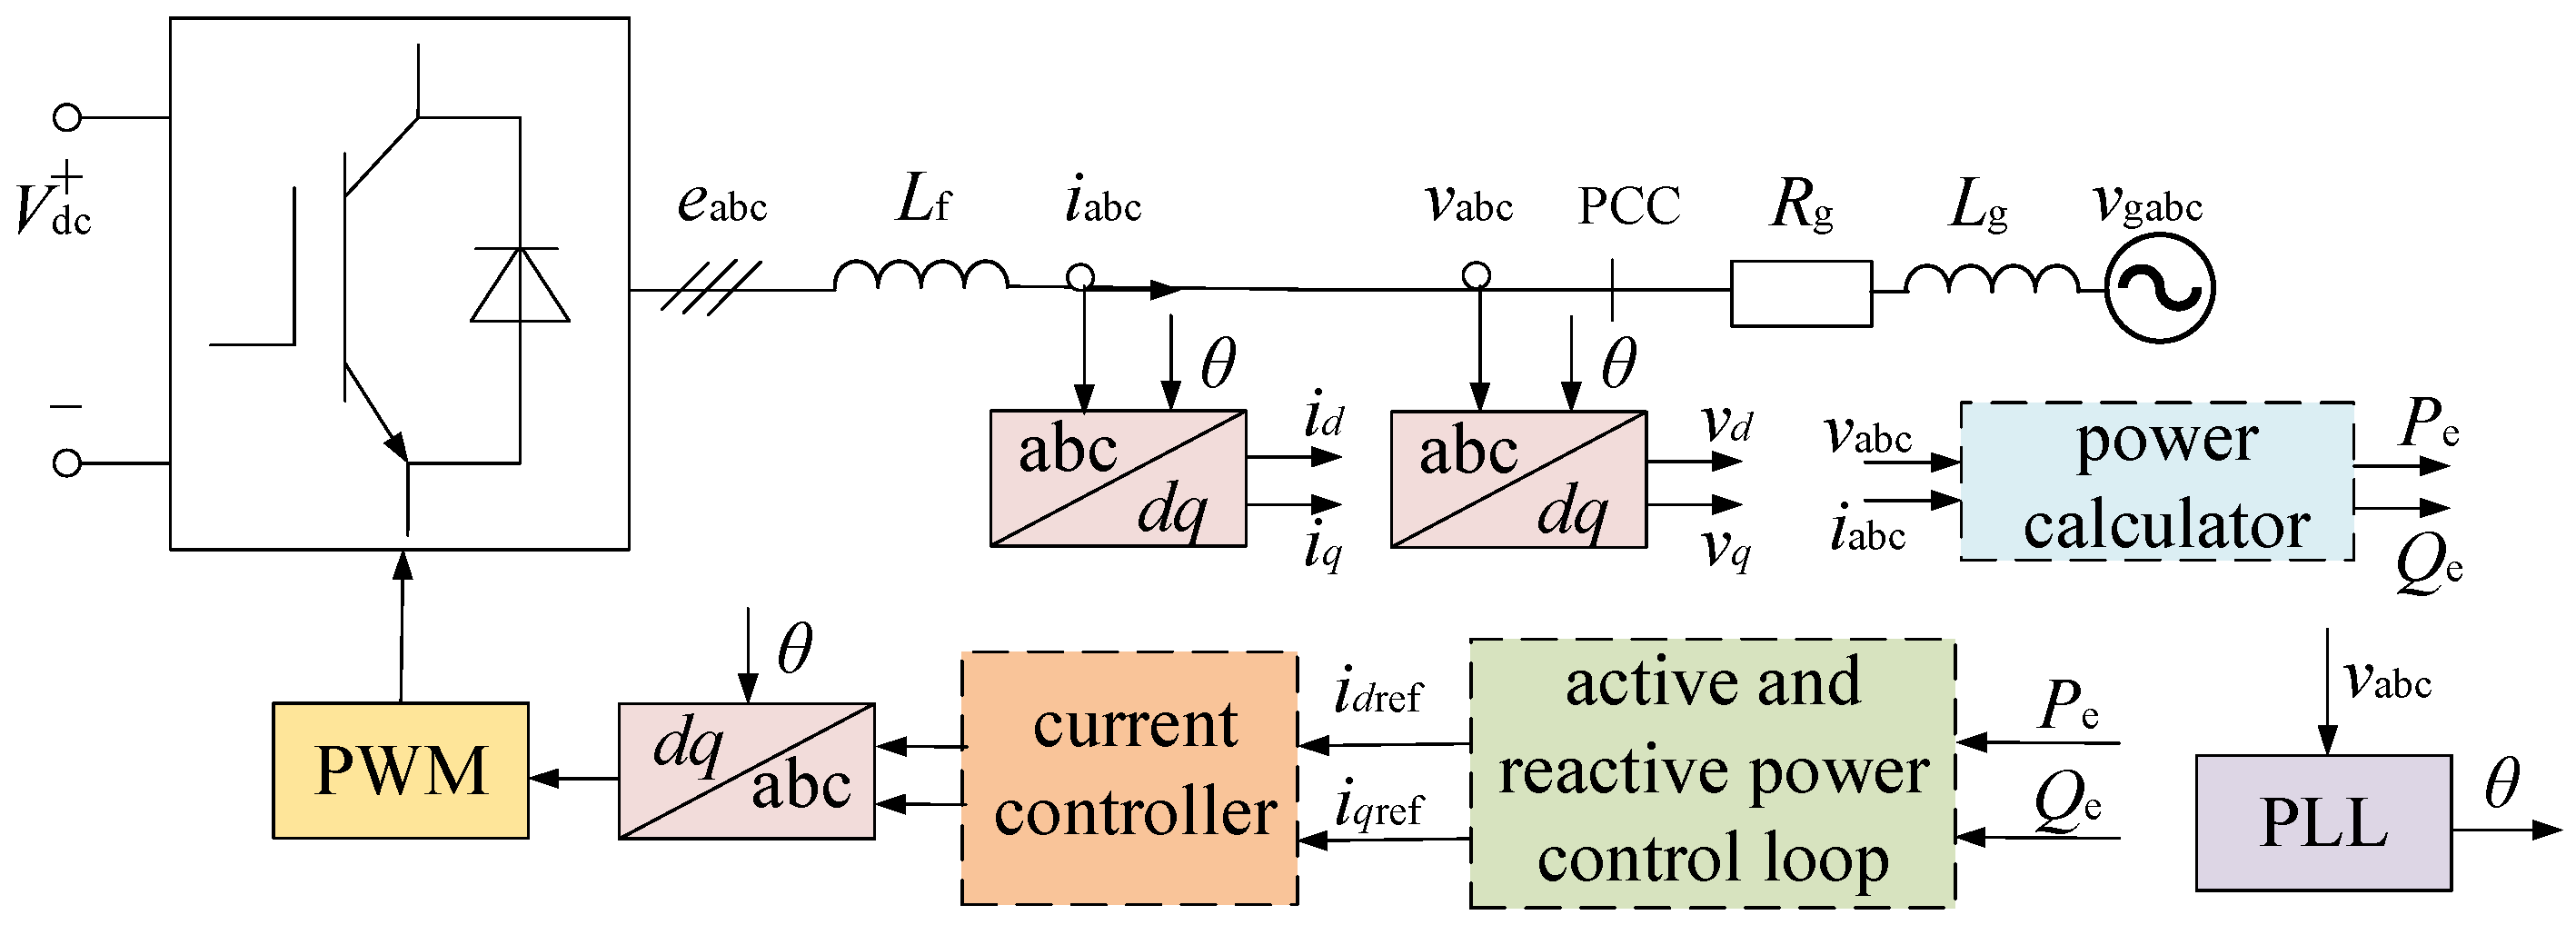
The classical control structure of GFL is as Figure 3.
When the voltage of GFL is less than 0.9 p.u., the control strategy is [23]
(1) iqref
i q ref = 1.5 0.9 U PCC , 0.2 < U PCC < 0.9 i q ref = 1 , U PCC < 0.2
where the upper and lower limits of iqref are imax and −imax. UPCC is the voltage amplitude of PCC in Figure 3.
(2) idref
idref is generated based on the constant active power control as (3).
The expression of the active power control loop is
i d ref = k p ( P ref P e ) + k i ( P ref P e ) d t
where Pref and Pe are the command value and actual value of GFL active power. kp and ki are the proportional and integral coefficients of the PI controller. The upper and lower limits of idref are (imax2iqref2)0.5 and −(imax2iqref2)0.5.
If GFL is equivalent an admittance, the expression can be obtained as [9]
y GFL = g GFL + j b GFL = P GFL U PCC 2 + j Q GFL U PCC 2
where gGFL and bGFL are the conductance and susceptance of GFL. PGFL and QGFL are the active and reactive power of GFL.

2.3. Two-Area Interconnection System

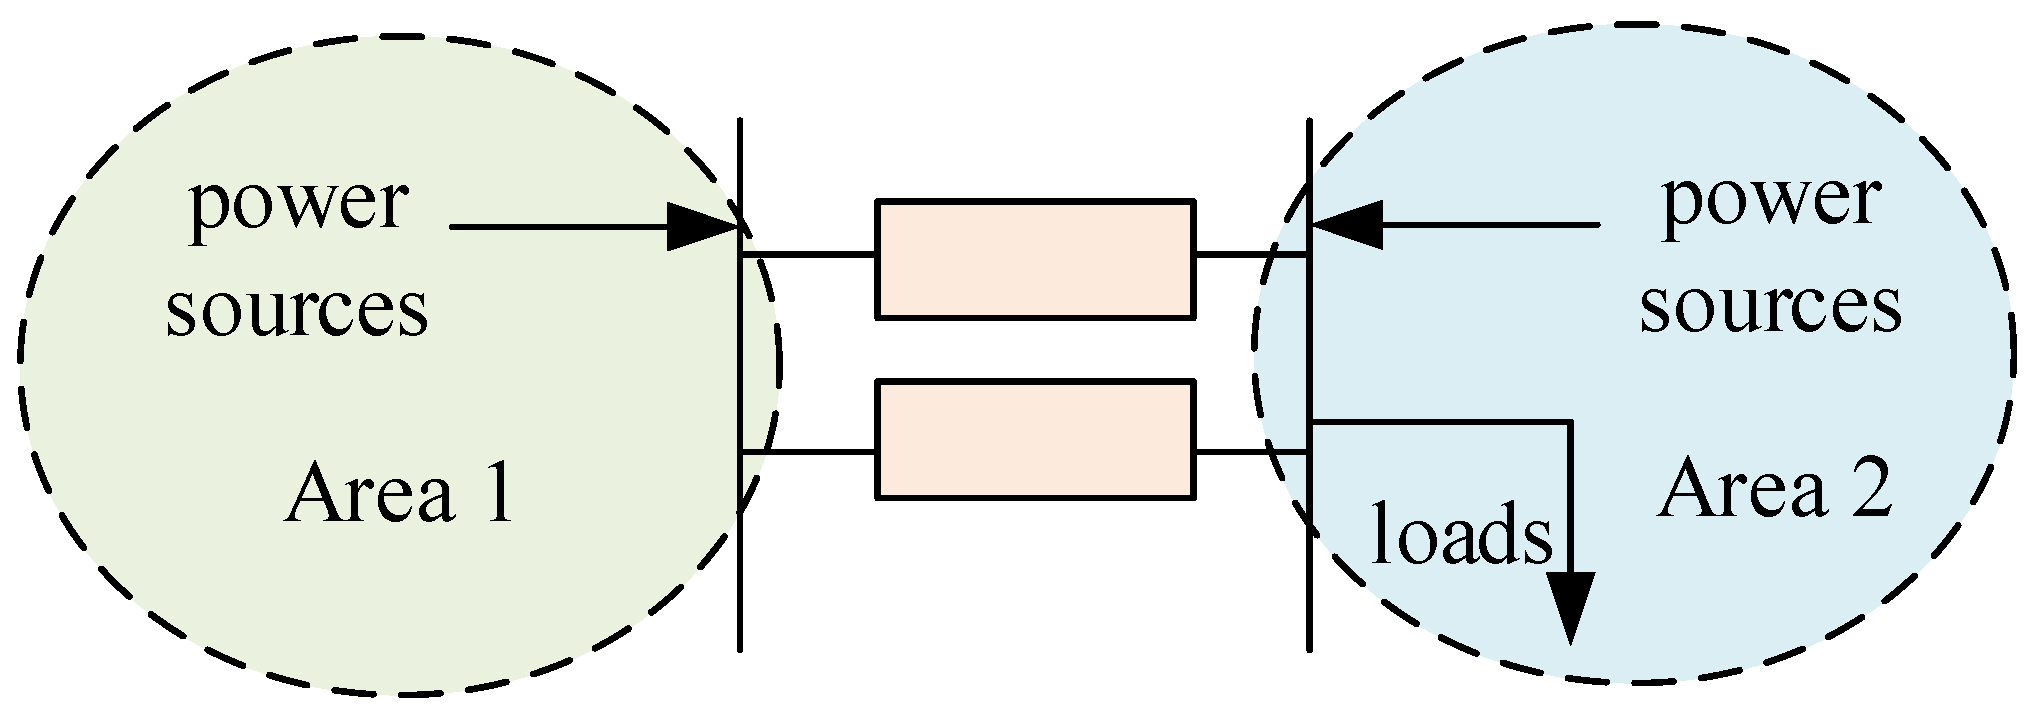
The research object of this paper is a typical two-area interconnection system, as shown in Figure 4.
Here, Area 1 is the power sending area and Area 2 is the power receiving area. The active power of the power supplies in Area 1 is transmitted to Area 2 through a long AC line. Area 2 is distributed with loads and local power sources.
The two-area interconnected power system serves as the foundational assumption and framework for this study. Furthermore, the analysis in this paper is confined solely to symmetrical fault scenarios.

3. Mechanism Analysis

3.1. The Mechanism by Which Converters’ Distribution Affects the Synchronous Stability

3.1.1. Distribution of VSG and SG

If VSG, GFL, and SG are distributed randomly, identifying the critical cluster of machines that lose synchronism following an AC short-circuit fault becomes challenging. In a two-area system, the critical unstable cluster may consist of SGs or VSGs in either the sending or the receiving area. This critical cluster may vary depending on the operating conditions and the location of the fault. Consequently, the analysis and control of transient synchronous stability become significantly more complex under such irregular source configuration.
If the SG is placed in one area (e.g., Area 1) and the VSG in another, then a large AC disturbance would cause them to form distinct coherent groups. In this case, the critically unstable machine cluster would be either the SG cluster of Area 1 or the VSG cluster of Area 2, significantly simplifying the analysis and control of transient synchronous stability.

3.1.2. Distribution of GFL

In this part, the distribution location of GFL can be determined based on the ability of different sources to reshape synchronous stability.
The control parameters of VSG are flexibly adjustable. For critical parameters in its active power loop, appropriate regulation strategies can significantly enhance synchronous stability. Taking Pref0 as an example, reducing its value can effectively suppress rotor acceleration of VSG, thereby reshaping the transient synchronous stability.
In multi-machine systems, merely adjusting the virtual rotor speed of VSGs may be insufficient. A more comprehensive approach requires flexible regulation of SGs’ rotor dynamics to effectively mitigate the power angle divergence between VSGs and SGs. However, SGs cannot flexibly adjust their parameters during transients like converters to control output characteristics. To address this limitation, this paper proposes locating GFL sources near SG clusters, thereby leveraging GFL’s flexible control capabilities to indirectly regulate SG rotor dynamics. The influence of GFL on adjacent SGs can be demonstrated as follows.
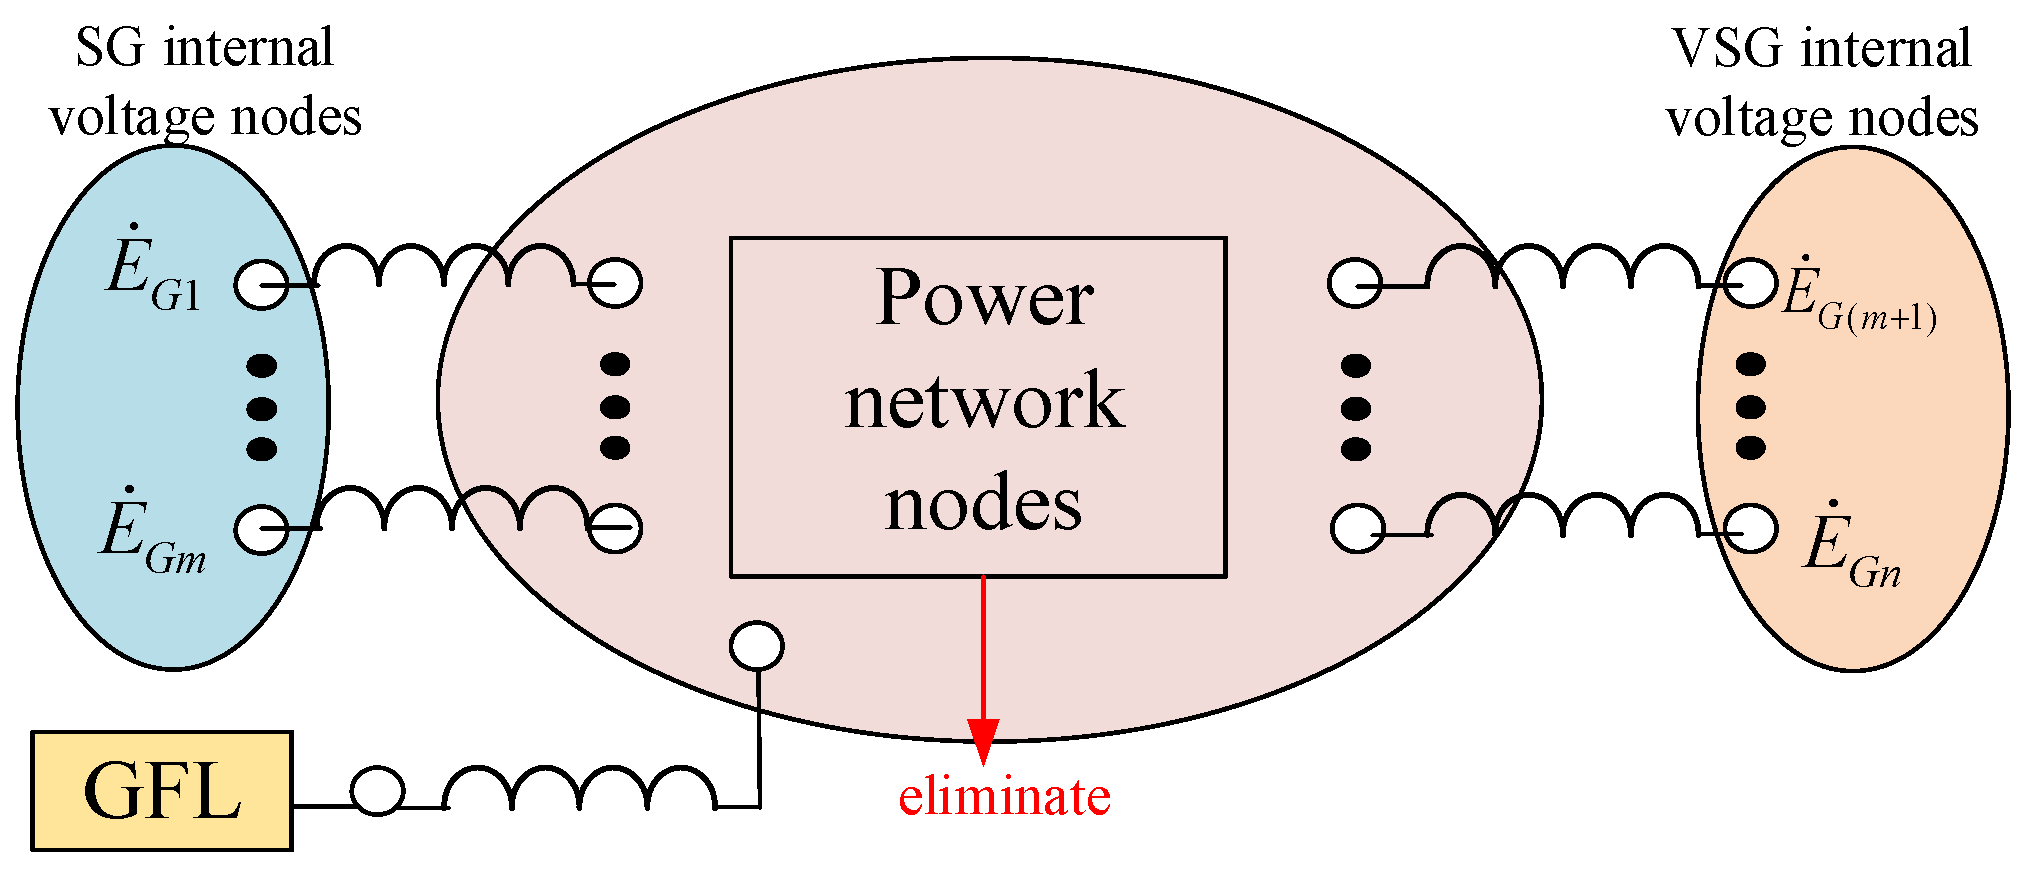
Consider a system comprising three types of nodes, SG internal voltage nodes, VSG internal voltage nodes, and GFL point-of-common-coupling (PCC) nodes, with all other network nodes already eliminated through reduction. A diagram of a power grid with different types of nodes is shown in Figure 5. The nodal voltage equation of the system can be expressed as follows [9]:
I ˙ G I ˙ S I ˙ V = Y G G 0 Y G S Y G V Y S G Y S S Y S V Y V G Y V S Y V V U ˙ G E ˙ S E ˙ V
where I ˙ G   I ˙ S   I ˙ V T is the injection current vector. U ˙ G   E ˙ S   E ˙ V T is voltage vector. Y is the admittance matrix. The subscripts G, S, and V, respectively, represent the clusters composed of GFL PCC nodes, SG internal voltage nodes, and VSG internal voltage nodes.
GFL is equivalent to an admittance according to (4), I ˙ G = 0 , and YGG0 is modified to YGG = YGG0 + yGFL. Then, (5) becomes
0 I ˙ S I ˙ V = Y G G Y G S Y G V Y S G Y S S Y S V Y V G Y V S Y V V U ˙ G E ˙ S E ˙ V
If the PCC nodes of GFL are eliminated, (6) can be written as
I ˙ S I ˙ V = Y S S Y S V Y V S Y V V E ˙ S E ˙ V = ( Y S S Y S V Y V S Y V V Y S G Y G G 1 Y G S Y S G Y G G 1 Y G V Y V G Y G G 1 Y G S Y V G Y G G 1 Y G V ) E ˙ S E ˙ V
Considering that GFLs locate near SGs, Y V G = Y G V 0 , and (7) becomes
I ˙ S I ˙ V = ( Y S S Y S V Y V S Y V V Y S G Y G G 1 Y G S 0 0 0 ) E ˙ S E ˙ V
Define
Y S S Y S V Y V S Y V V = G i j + j B i j n × n
Y S G Y G G 1 Y G S = Δ G i j + j Δ B i j q × q
where Gij and Bij represent the electrical connection attributes of the SG cluster and the VSG cluster before GFLs are connected. ΔGij and ΔBij are functions of the active power and reactive power of GFLs.
From the above derivation, it can be seen that when GFLs are connected near the SG cluster, only the self-admittance of the SG cluster is changed, while the mutual admittance between SGs and VSGs and the self-admittance of the VSG cluster remain unchanged.
The electromagnetic power of the i-th machine in the SG cluster is
P e , i = E i 2 ( G i i + Δ G i i ) + E i k S , k i E k ( G i k + Δ G i k ) + E i l V E l [ B i l sin δ S V + G i l cos δ S V ] , i S
The electromagnetic power of the j-th machine in the VSG cluster is
P e , j = E j 2 G j j + E j k V , k j E k G j k + E j l S E l [ B j l sin δ V S + G j l cos δ V S ] , j V
Based on (8)–(12), when GFLs are connected near SGs, they exclusively modify the electromagnetic power of SGs without affecting the electromagnetic power of VSGs.
Furthermore, if the active power output of GFL units near the SGs is reduced, the principle of active power balance dictates that the electromagnetic power of the SG cluster must correspondingly increase, thereby damping the rotor acceleration of SGs.
In conclusion, we propose the co-location of GFLs and SGs within the same area to leverage GFL’s controllable characteristics for affecting SGs.

3.1.3. The Proposed Distribution Scheme of Power Supplies

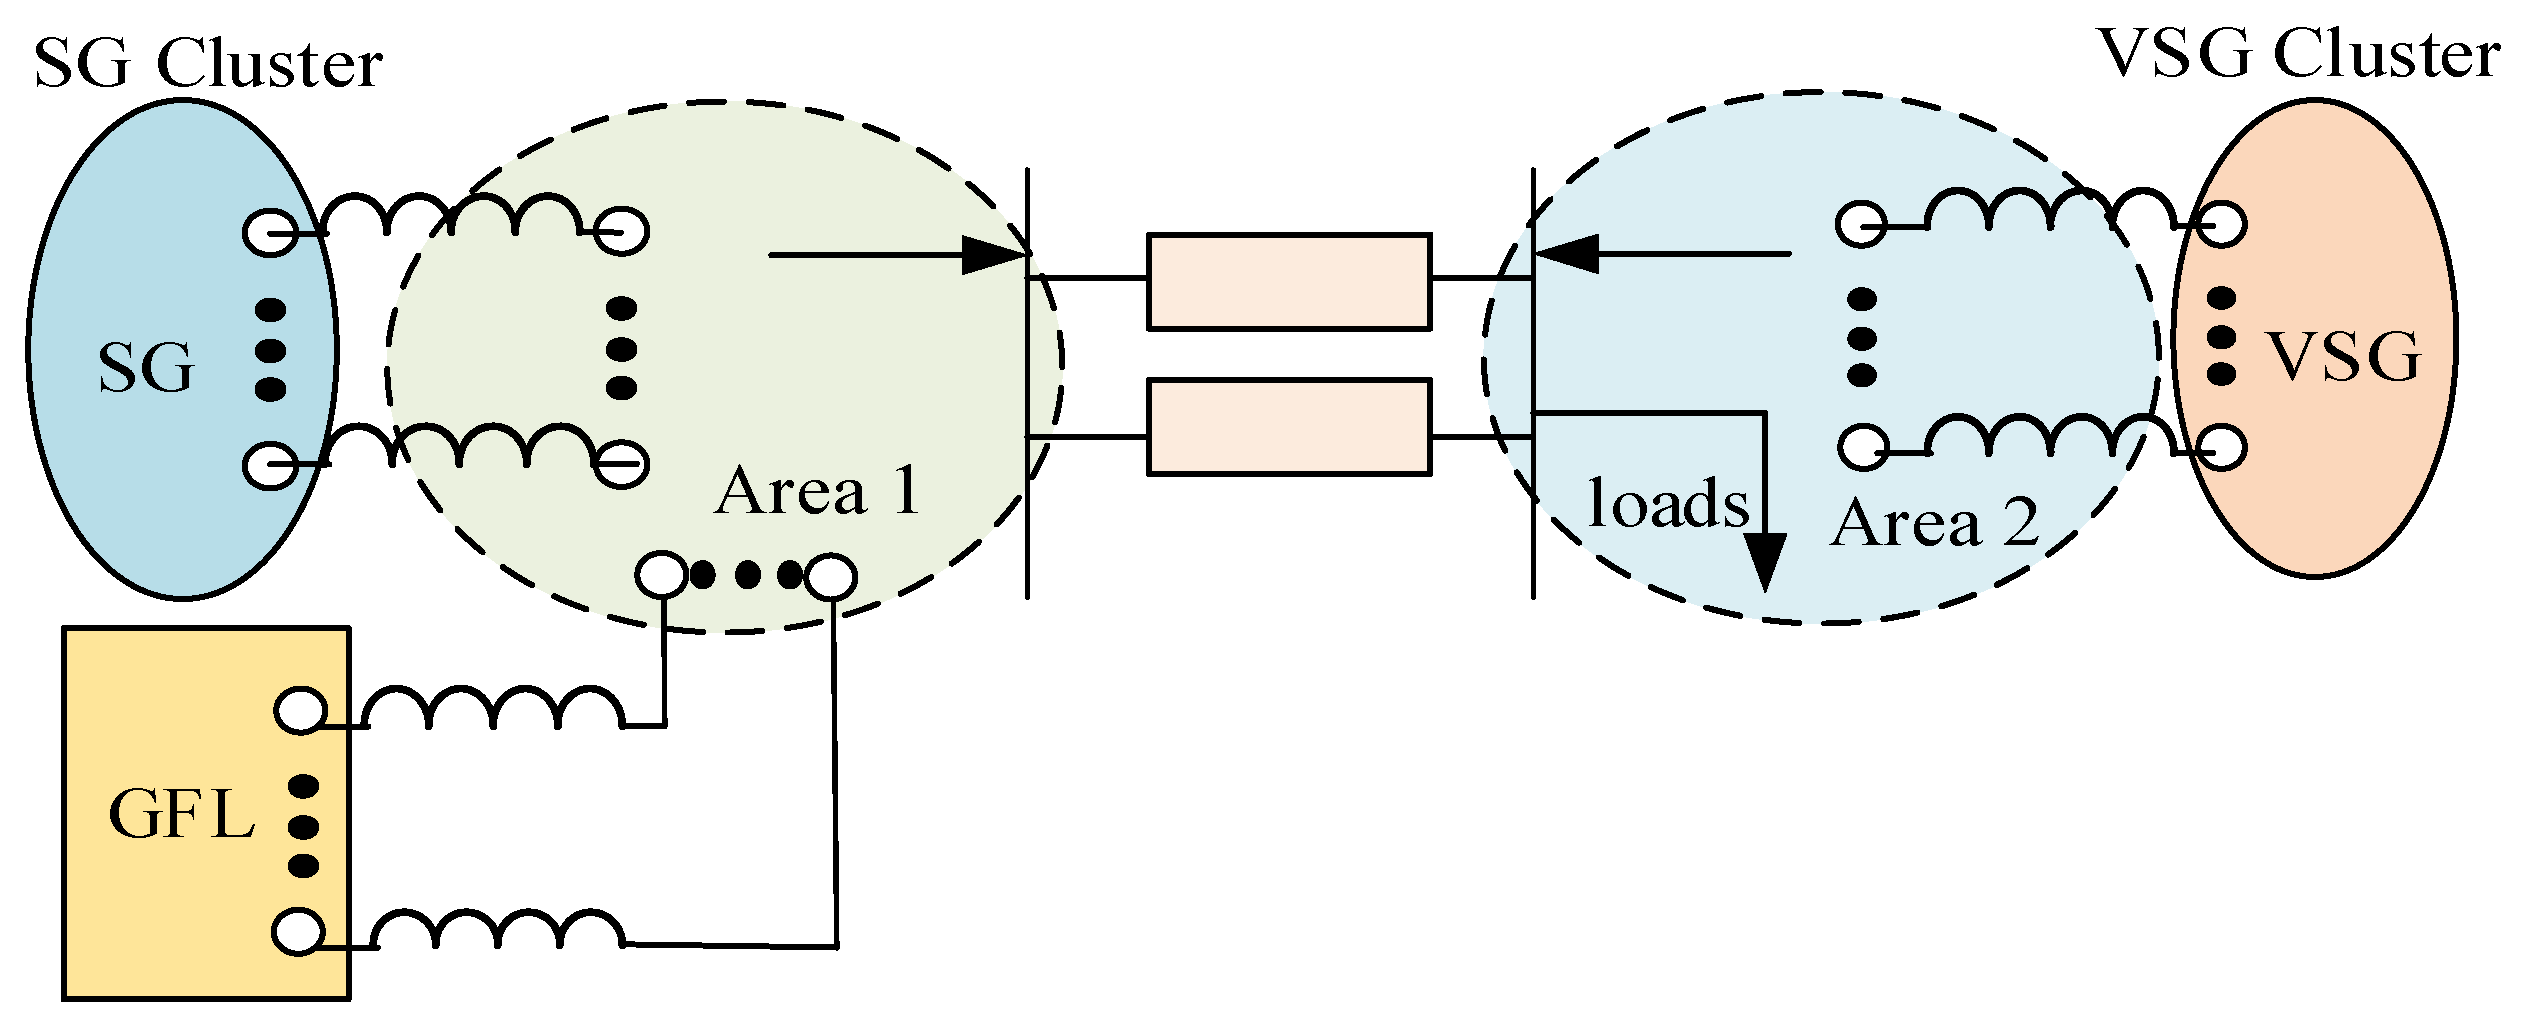
The preceding analysis has established that VSGs should be deployed in one distinct area, while SGs and GFLs should be co-located in another area. However, for a two-area interconnected system, a critical design question remains: should VSGs be located in the power sending area or the power receiving area?
It is anticipated that the proportion of SGs in future power systems will continue to decline. Meanwhile, GFLs exhibit limited reactive power support capabilities. If SGs and GFLs are predominantly concentrated in load-intensive regions such as the receiving end of the grid, the overall voltage stability could be compromised. In contrast, VSGs can provide strong voltage support to the receiving-end grid, owing to their ability to emulate the reactive power and voltage regulation characteristics of SGs. Therefore, from the perspective of enhancing transient voltage stability, it is advisable to deploy VSGs in the power-receiving area while locating SGs and GFLs in the power-sending area.
Ultimately, the proposed distribution scheme of power supplies is shown in Figure 6.
The novel distribution scheme of power supplies can simplify stability analysis and control in future grids with high penetration converters.

3.2. The Mechanism by Which the Voltage Stability Affects the Synchronous Stability

According to EEAC [24] and Section 3.1.1, all voltage sources can be divided into the SG cluster and the VSG cluster. The swing equations of two clusters are
M S d 2 δ S d t 2 = P m . S P e . S M V d 2 δ V d t 2 = P ref 0 P e . V
where MS is the inertia coefficient of the SG cluster. MV is the virtual inertia coefficient of the VSG cluster. δS is the rotor angle of the SG cluster. δV is the virtual rotor angle of the VSG cluster. Pm.S is the total mechanical power of the SG cluster. Pref0 is the active power reference value of the VSG cluster. Pe.S and Pe.V are the total electromagnetic power of the SG cluster and VSG cluster.
It should be noted that since this section does not address the damping characteristics of VSGs, the swing equation of the VSG in (13) omits the damping term to simplify the mathematical model.
Further, (13) can be written as
M S V d 2 δ S V d t 2 = M V P m . S M S P ref 0 M S + M V ( P C + P max sin δ S V γ ) = P m . S V P e . S V
where
δ S V = δ S δ V
M S V = M S M V M S + M V
P C = M V M S + M V i S m S E i E m ( G i m + Δ G i m ) M S M S + M V j V n V E j E n G j n P max = C 2 + D 2 C = M V M S M S + M V i S j V E i E j G i j D = i V j S E i E j B i j γ = a r c t a n C D
where ΔGim reflects the influence of GFLs on the power angle difference between VSGs and SGs, and the definition of ΔGim is the same as (10). Ei is the internal potential of the i-th SG of SG cluster. Ej is the internal potential of the j-th VSG of VSG cluster. The remaining parameters can be referred to [9].
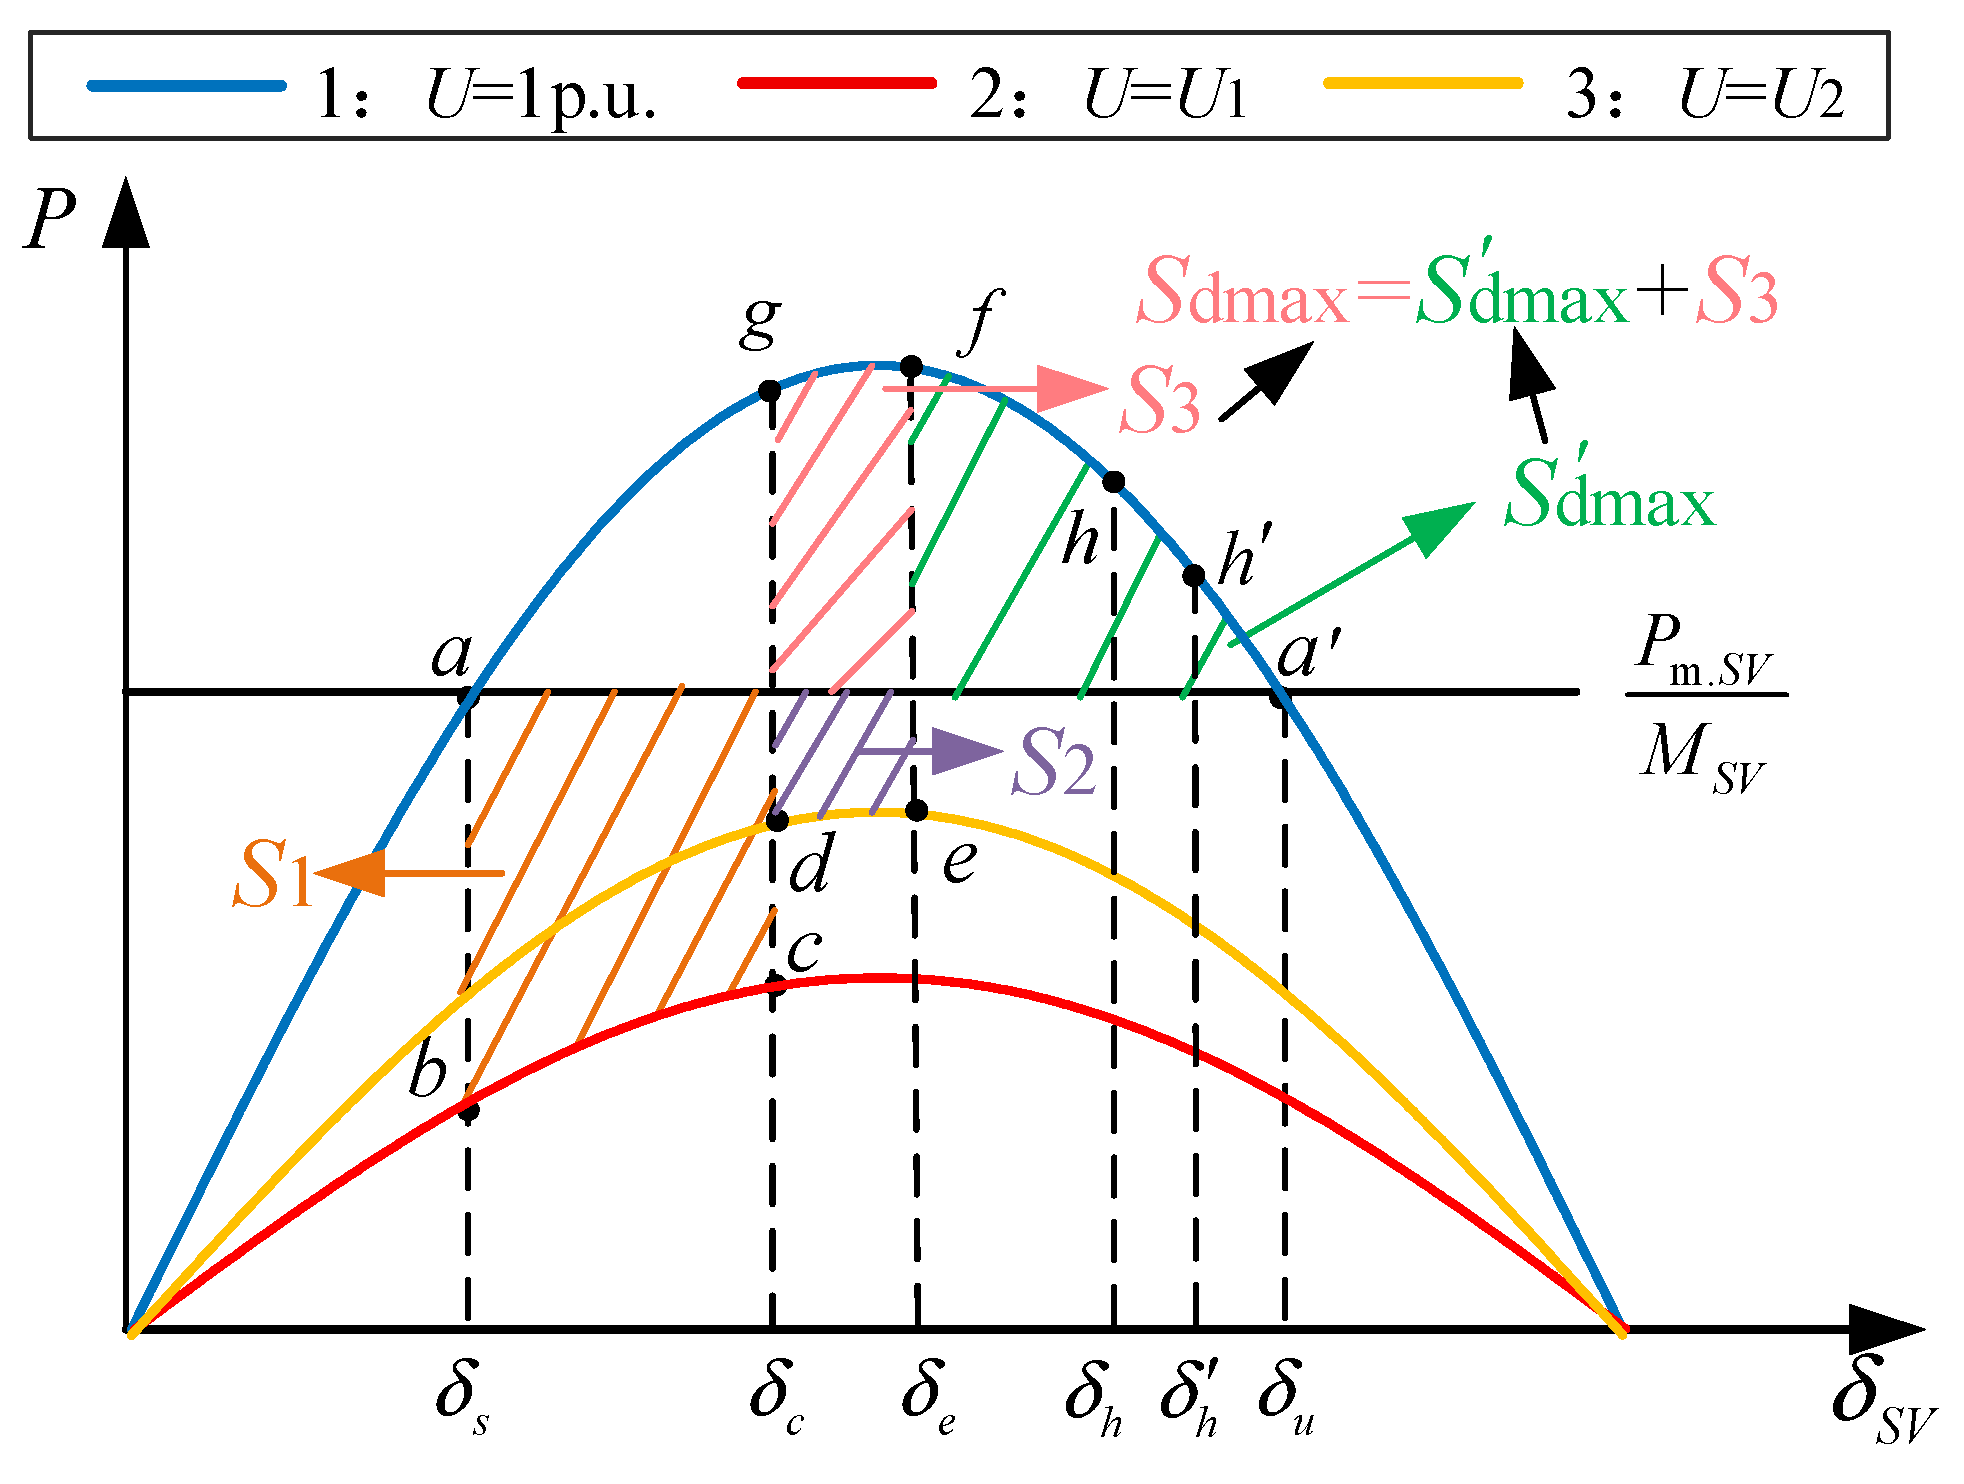
Based on (14), the P-δ curve of the system is shown in Figure 7.
In Figure 7, U1 < U2 < 1 p.u. Curves 1, 2, and 3 represent the P-δ curves at different voltage levels. To present the trajectory of the operating points more clearly, based on Figure 7, Table 1 and Table 2 can be obtained.
Figure 7 and Table 1: During the fault-on period, the operating point shifts from Curve 1 to Curve 2 (trajectory a-b-c) due to voltage sag. After fault clearance, assuming the voltage rapidly recovers from U1 to its rated level, the operating point returns from Curve 2 to Curve 1 (trajectory c-g-h). If Sdmax (namely, the maximum deceleration area) > S1 (namely, the acceleration area) and the acceleration/deceleration areas precisely cancel each other at point h, the operating point will move along Curve 1 from point h back to the steady-state operating point a.
Figure 7 and Table 2: During the fault-on period, the operating point shifts from Curve 1 to Curve 2 (trajectory a-b-c) due to voltage sag. After fault clearance, assuming a relatively slow voltage recovery, the operating point will traverse across curves of different voltage levels (from U1 to U2 and eventually back to the rated level), following the trajectory c-d-e-f-h′. If Sdmax (namely, the maximum deceleration area) > (S1 + S2) (namely, the acceleration area) and the acceleration/deceleration areas precisely cancel each other at point h′, the operating point will subsequently progress along Curve 1 from h′ back to the steady-state operating point a.
From the above analysis, as the voltage stability deteriorates, the acceleration area increases by S2, the maximum deceleration area decreases by S3, and the maximum power angle difference increases by (δhδh). Therefore, voltage stability and synchronous stability are positively correlated.

4. The Enhanced Control Strategies

Building upon the mechanistic analysis presented in Section 3, this section proposes enhanced control strategies for GFL and VSG to improve the transient voltage stability and transient synchronous stability.

4.1. The Enhanced Control of GFL

When the acceleration severity of the SG cluster exceeds that of the VSG group after a fault occurs, measures should be taken to suppress the rotor acceleration of SGs, thereby reducing the power angle difference between SGs and VSGs and enhancing synchronous stability. Based on the analysis in Section 3.1.2, reducing the active power output of GFL converters proves effective in restraining the rotor acceleration of SGs.
Accordingly, idref can be adjusted as
i d ref = k p ( P ref P e ) + k i ( P ref P e ) d t , U PCC > 0.7 i d ref = 0 , U PCC 0.7
During low-voltage conditions when SGs experience the most significant acceleration, the active power reference of GFL converters is set to zero according to (18) to maximally suppress rotor acceleration in SGs.
Furthermore, building upon the analysis in Section 3.2, it is essential to increase the reactive power output of GFL converters to improve both voltage stability and synchronous stability. Consequently, the q-axis current reference for the GFL converter should be determined as follows:
i q ref = 10 0.9 U PCC , 0.2 < U PCC < 0.9 i q ref = 1 , U PCC < 0.2
Compared with (2), (19) increases the amplification factor of the voltage difference, thereby enhancing the reactive power support capability of GFL converters.
If the accelerated motion of the SGs is the primary cause of the power angle separation between VSGs and SGs, synchronous stability can be improved solely by adjusting GFL converters to modify the SGs’ rotor dynamics, while maintaining conventional control strategies for VSGs.
It should be noted that the capacity ratio between GFL converters and SGs influences the degree of impact that GFLs exert on SGs, thereby affecting the efficacy of GFL control strategies in enhancing the synchronous stability between VSGs and SGs.

4.2. The Enhanced Control of VSG

When the acceleration severity of the VSG cluster exceeds that of the SG group after a fault occurs, measures should be taken to suppress the rotor acceleration of VSGs, thereby reducing the power angle difference between SGs and VSGs and enhancing synchronous stability.
Therefore, the active power control loop of VSG can be adjusted as
M V d 2 δ V d t 2 = P ref P e . V D ( ω V 1 ) P ref = U PCC P ref 0
where Pref0 is the steady-state command value of VSG active power. UPCC is the voltage amplitude of PCC in Figure 1.
Based on (20), when voltage sag occurs and the VSG rotor accelerates, Pref will decrease to suppress the VSG’s acceleration. As voltage recovers, Pref will gradually return to its steady-state value.
Interestingly, (20) also enhances the reactive power support capability of VSG, with the underlying mechanism operating as follows.
During voltage sags, VSG increases the reactive power injected into the power grid, which means the q-axis current of VSG is negative and its absolute value increases. As evident from the voltage loop structure in Figure 1, vq is greater than 0, which means V is ahead of the d-axis based on Figure 2. If Pref is reduced through (20), the rotational speed of the d-axis will slow down and vq will increase based on Figure 2. According to the voltage loop structure, the absolute value of iq will also increase, thereby increasing the reactive power output of VSG.
If the accelerated motion of the VSGs is the primary cause of the power angle separation between VSGs and SGs, synchronous stability can be improved solely by adjusting VSG converters, while maintaining classical control strategies for GFLs.
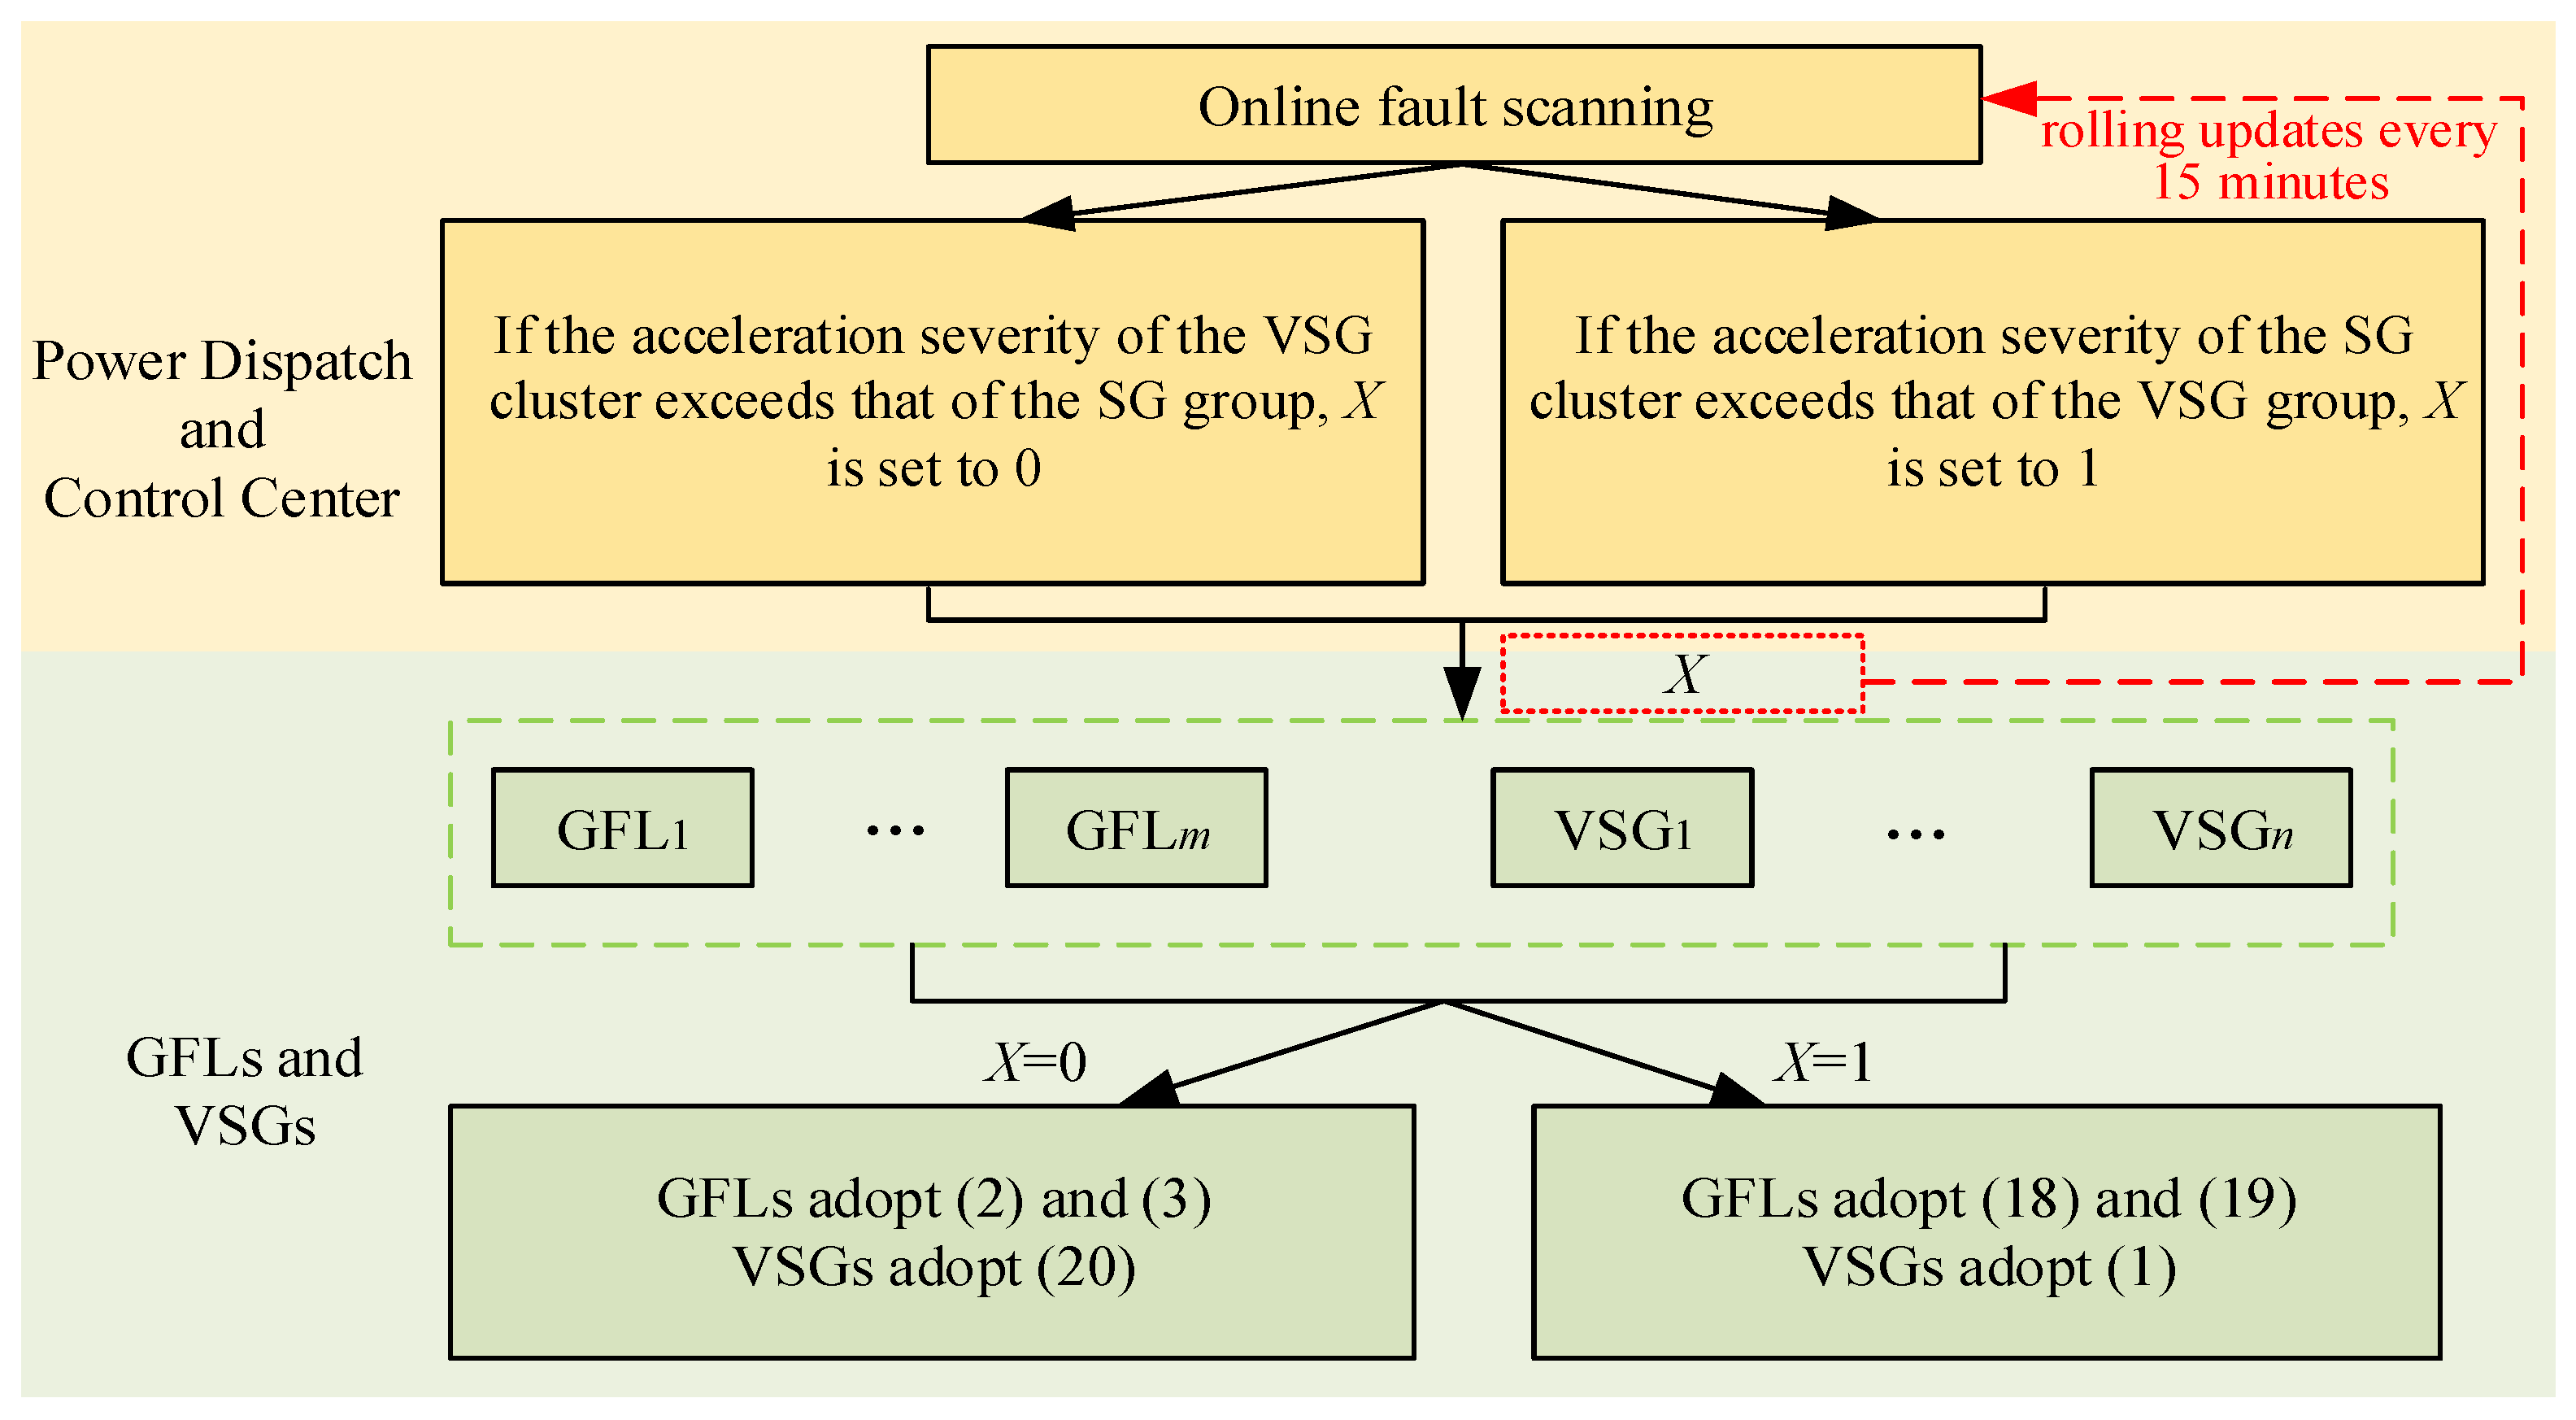
As evidenced by the preceding analysis, when the accelerated motion of the SGs is the primary cause of the power angle separation between VSGs and SGs, GFL inverters should adopt the enhanced control strategy specified in (18) and (19), while VSGs maintain the classical control strategy outlined in (1). Conversely, when the accelerated motion of the VSGs is the primary cause of the power angle separation between VSGs and SGs, GFL should revert to the classical control strategy governed by (2) and (3), whereas VSGs implement the enhanced control approach prescribed in (20).
However, in practice, how can the acceleration severity of VSG and SG clusters under large disturbances be determined in advance to select appropriate control strategies?
To address this challenge, this paper proposes the control framework of Figure 8.
Under this control framework, the power dispatch and control center performs fault simulations every 15 min. The simulated fault is located at the load side of the long AC interconnection corridor in the two-area system, with the fault type being a three-phase short-circuit with zero grounding resistance. After 0.1 s of fault duration, circuit breakers on both ends of the line trip. Based on the simulation results, the acceleration severity of VSG and SG clusters under a large disturbance in the current operational scenario can be identified. If the acceleration severity of the VSG cluster exceeds that of the SG group after a fault occurs, the parameter X is set to 0; otherwise, X is set to 1. Then, X is broadcast to all GFLs and VSGs, enabling them to predetermine their control strategies under large disturbances.
The proposed control architecture relies on rolling updates every 15 min rather than real-time communication, making it less susceptible to delays in real-time data transmission.

5. Case Studies

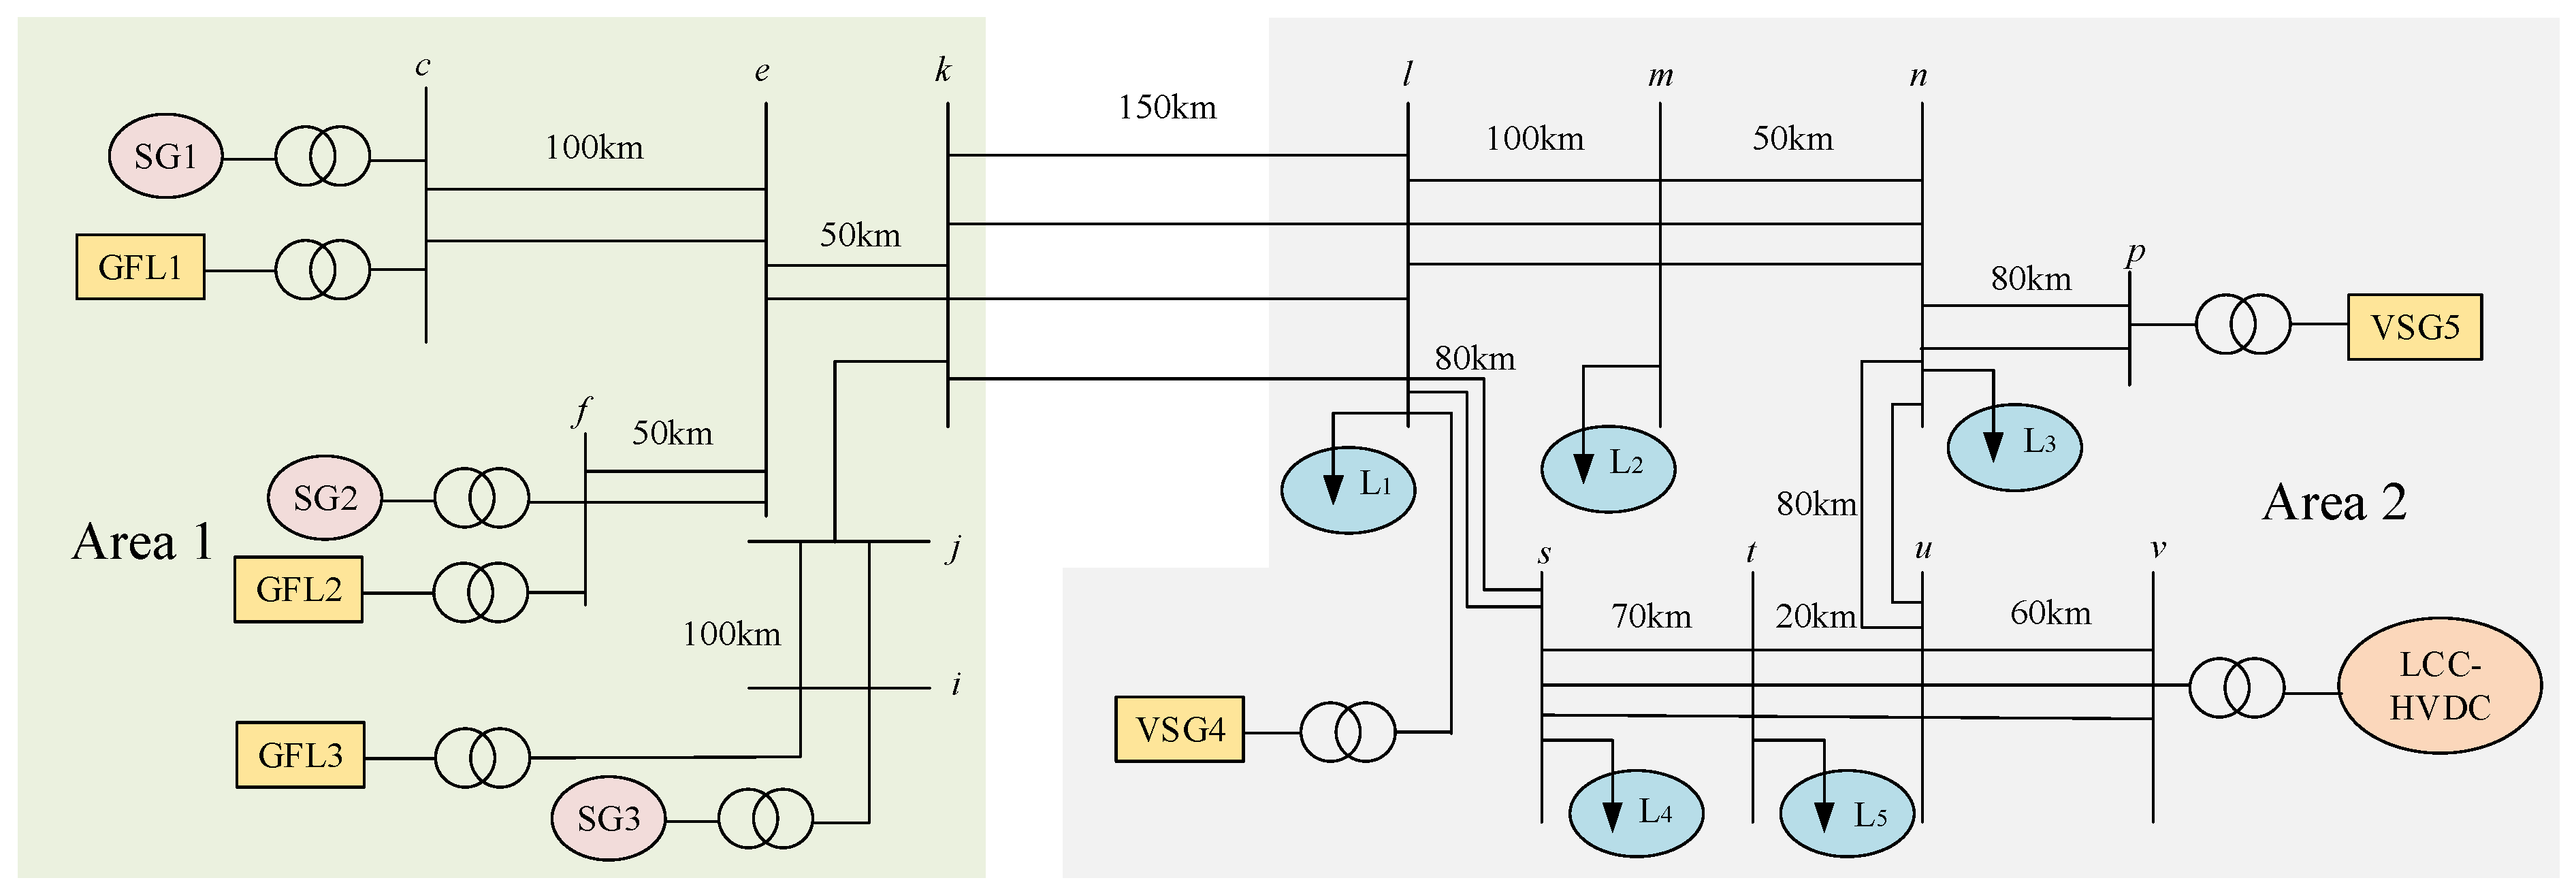
The simplification system of an actual grid is shown in Figure 9. The simulation is based on the PSCAD platform.
The power sending area (Area 1) delivers power to the load center (Area 2). The loads (L1, L2, L3, L4, and L5) are modeled as a hybrid configuration, with 70% of the load constituting constant impedance and the remaining 30% represented by dynamic induction motor models. The total active power of loads is 9,000 MW. For more details of this system, refer to [25]. For GFL, Pref = 0.8 p.u., Uref = 1.03 p.u., Kpll = 50, Tpll = 0.01 s, imax = 1.0 p.u., and kp = 0, ki = 33.3. For VSG, Pref = 0.8 p.u., Qref = 0.2 p.u., MV = 0.1, K = 0.06, Dq = 10, and Ilim = 2.0 p.u. It should be noted that all parameters of the GFL converters in Figure 9 are identical, and similarly, all parameters of the VSG units are uniformly configured. The values of Pref, Qref, Uref, imax, and Ilim can be configured according to specific application requirements, while the values of the remaining parameters in this paper are consistent with those in the GFL and GFM converter models provided on the official PSCAD platform.
Based on Figure 9, Scenario 1 is as follows.
The numbers for SG1, SG2, and SG3 are 2, 2, and 2. The rated capacity and inertial time constant of each SG are 360 MVA and 4 s. The active power of each SG is 288 MW. The active power of the line-commutated converter-based high-voltage DC (LCC-HVDC) is 3000 MW. The active powers of GFL1, GFL2, and GFL3 are 576 MW, 576 MW, and 800 MW. The active powers of VSG4 and VSG5 are both 1152 MW. The damping coefficient D of each VSG is 70.
Obviously, the proposed distribution scheme of Section 3.1 is adopted in Figure 9.
To simulate diverse first-swing power angle separation behaviors between VSGs and SGs, Scenario 2 is derived from Scenario 1 by modifying two parameters: the inertial time constant of each SG is increased to 6 s, and the damping coefficient of each VSG is adjusted to 20.
To study the transient synchronous stability, two distinct fault locations, denoted as Fault 1 and Fault 2, are defined as follows.
Fault 1: A three-phase fault is applied to the l side of one kl line at t = 0.1 s. The fault is then cleared by isolating the affected line at t = 0.2 s.
Fault 2: A three-phase fault is applied to the k side of one kl line at t = 0.1 s. The fault is then cleared by isolating the affected line at t = 0.2 s.

5.1. Scenario 1

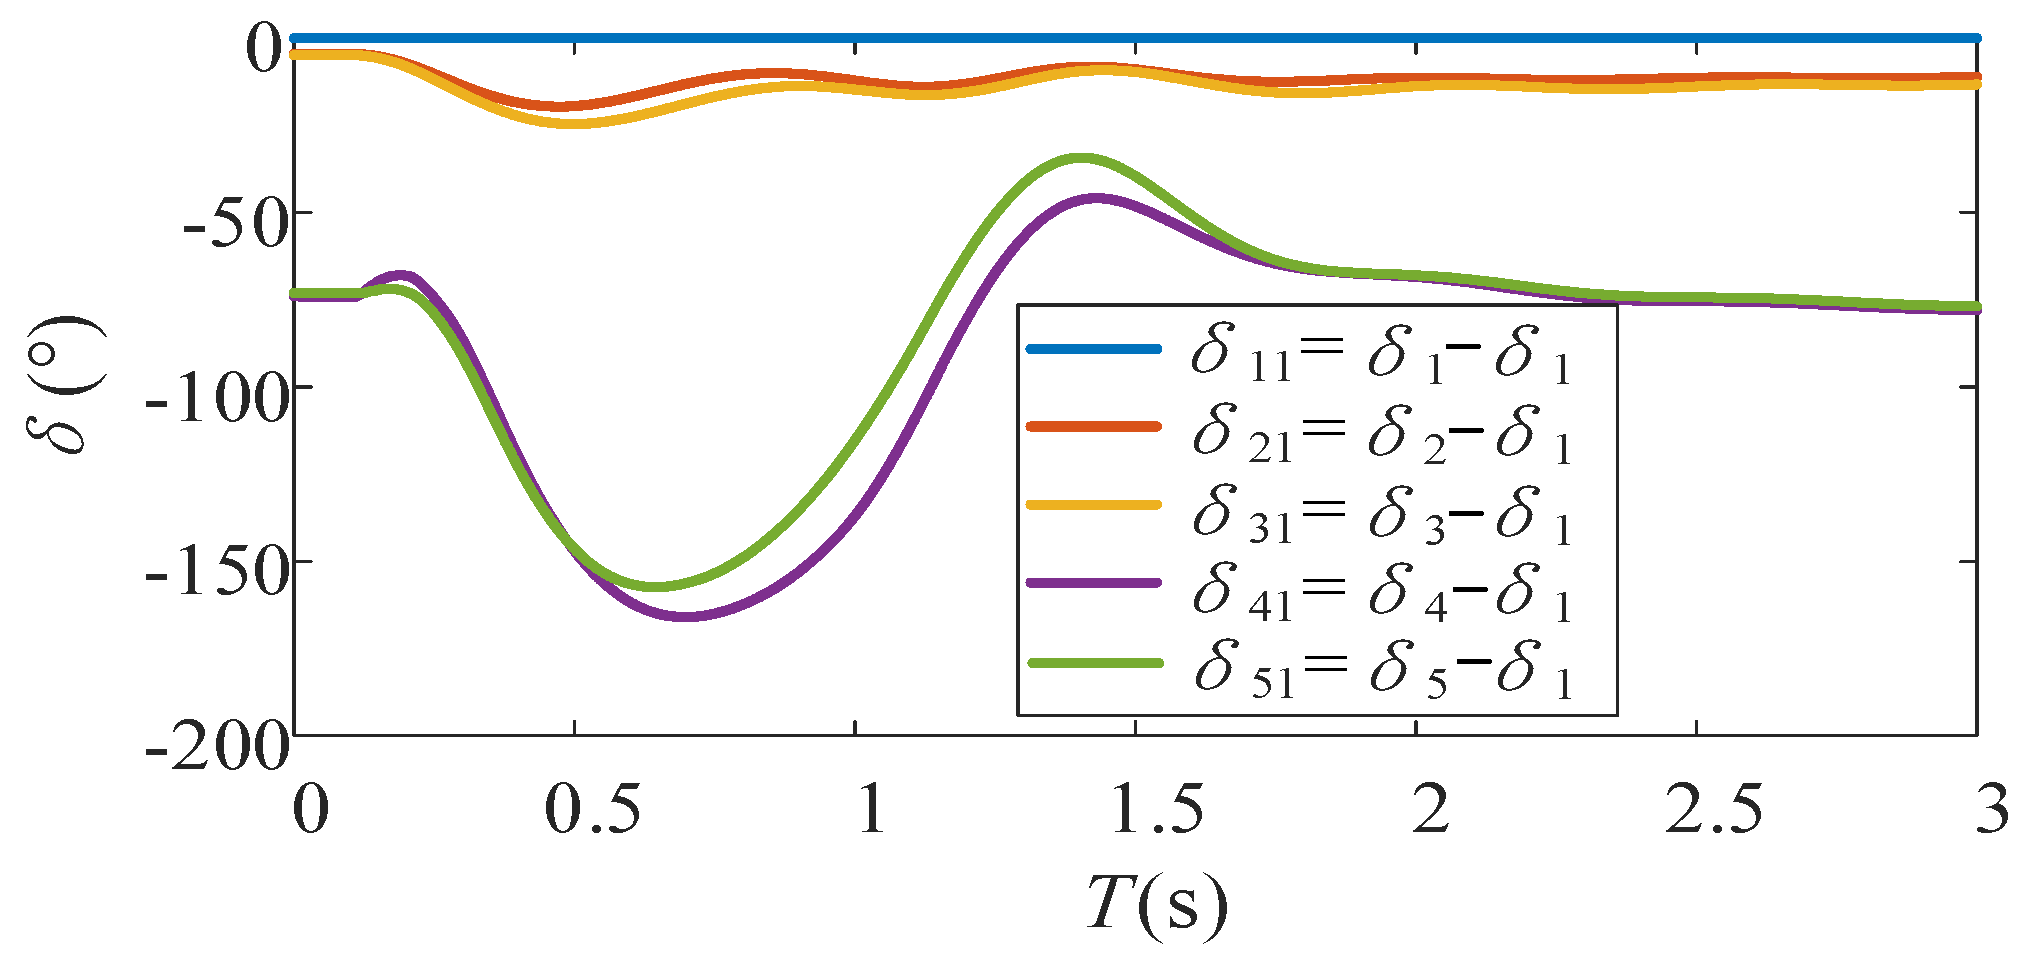
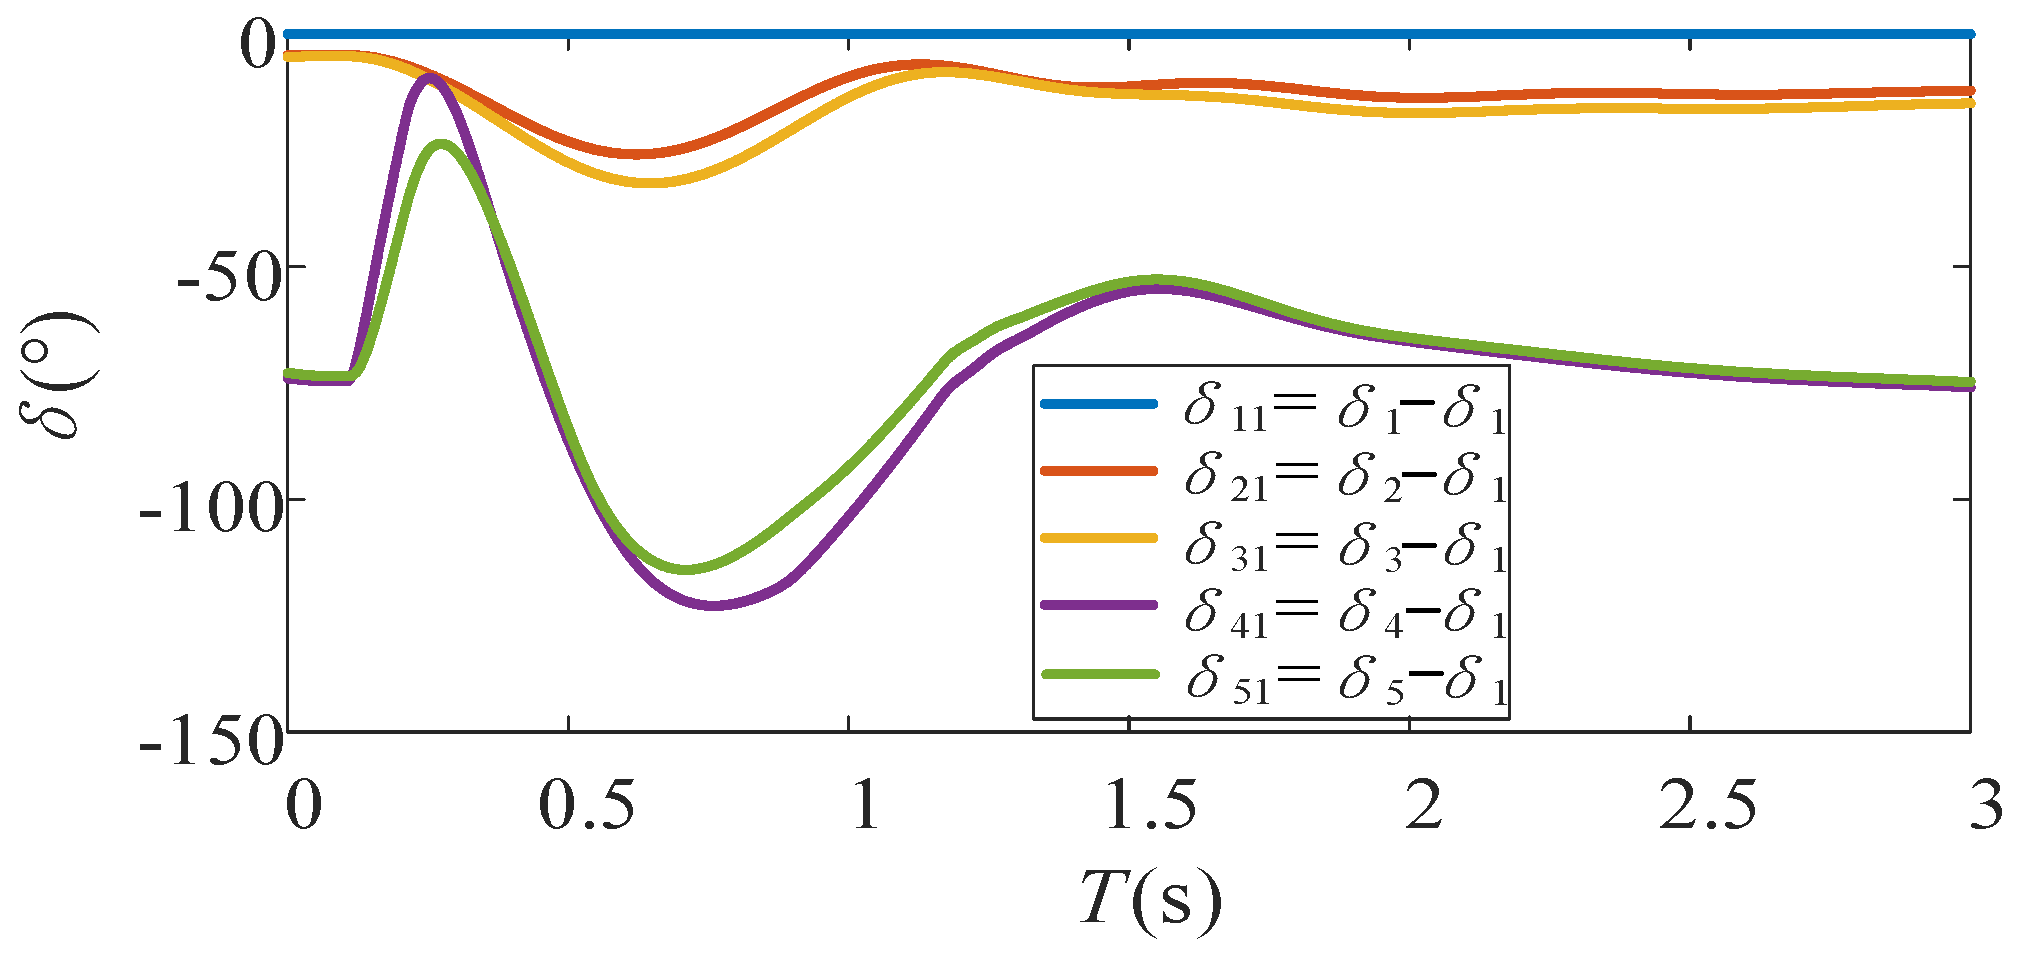
Under the condition that both VSGs and GFLs adopt classical control strategies, the power angle difference curve of Scenario 1 and Fault 1 is obtained, as shown in Figure 10.
Here, δ1, δ2, and δ3 represent the power angle of SG1, SG2, and SG3. δ4 and δ5 represent the virtual power angle of VSG4 and VSG5.
As illustrated in Figure 10, the acceleration severity of the SG cluster exceeds that of the VSG group after a fault occurs. Therefore, according to Section 4, GFLs should adopt the enhanced control strategy, while VSGs maintain the classical control strategy.
Three distinct modes are implemented to validate the efficacy of the proposed GFL control strategy, which is shown in Table 3.
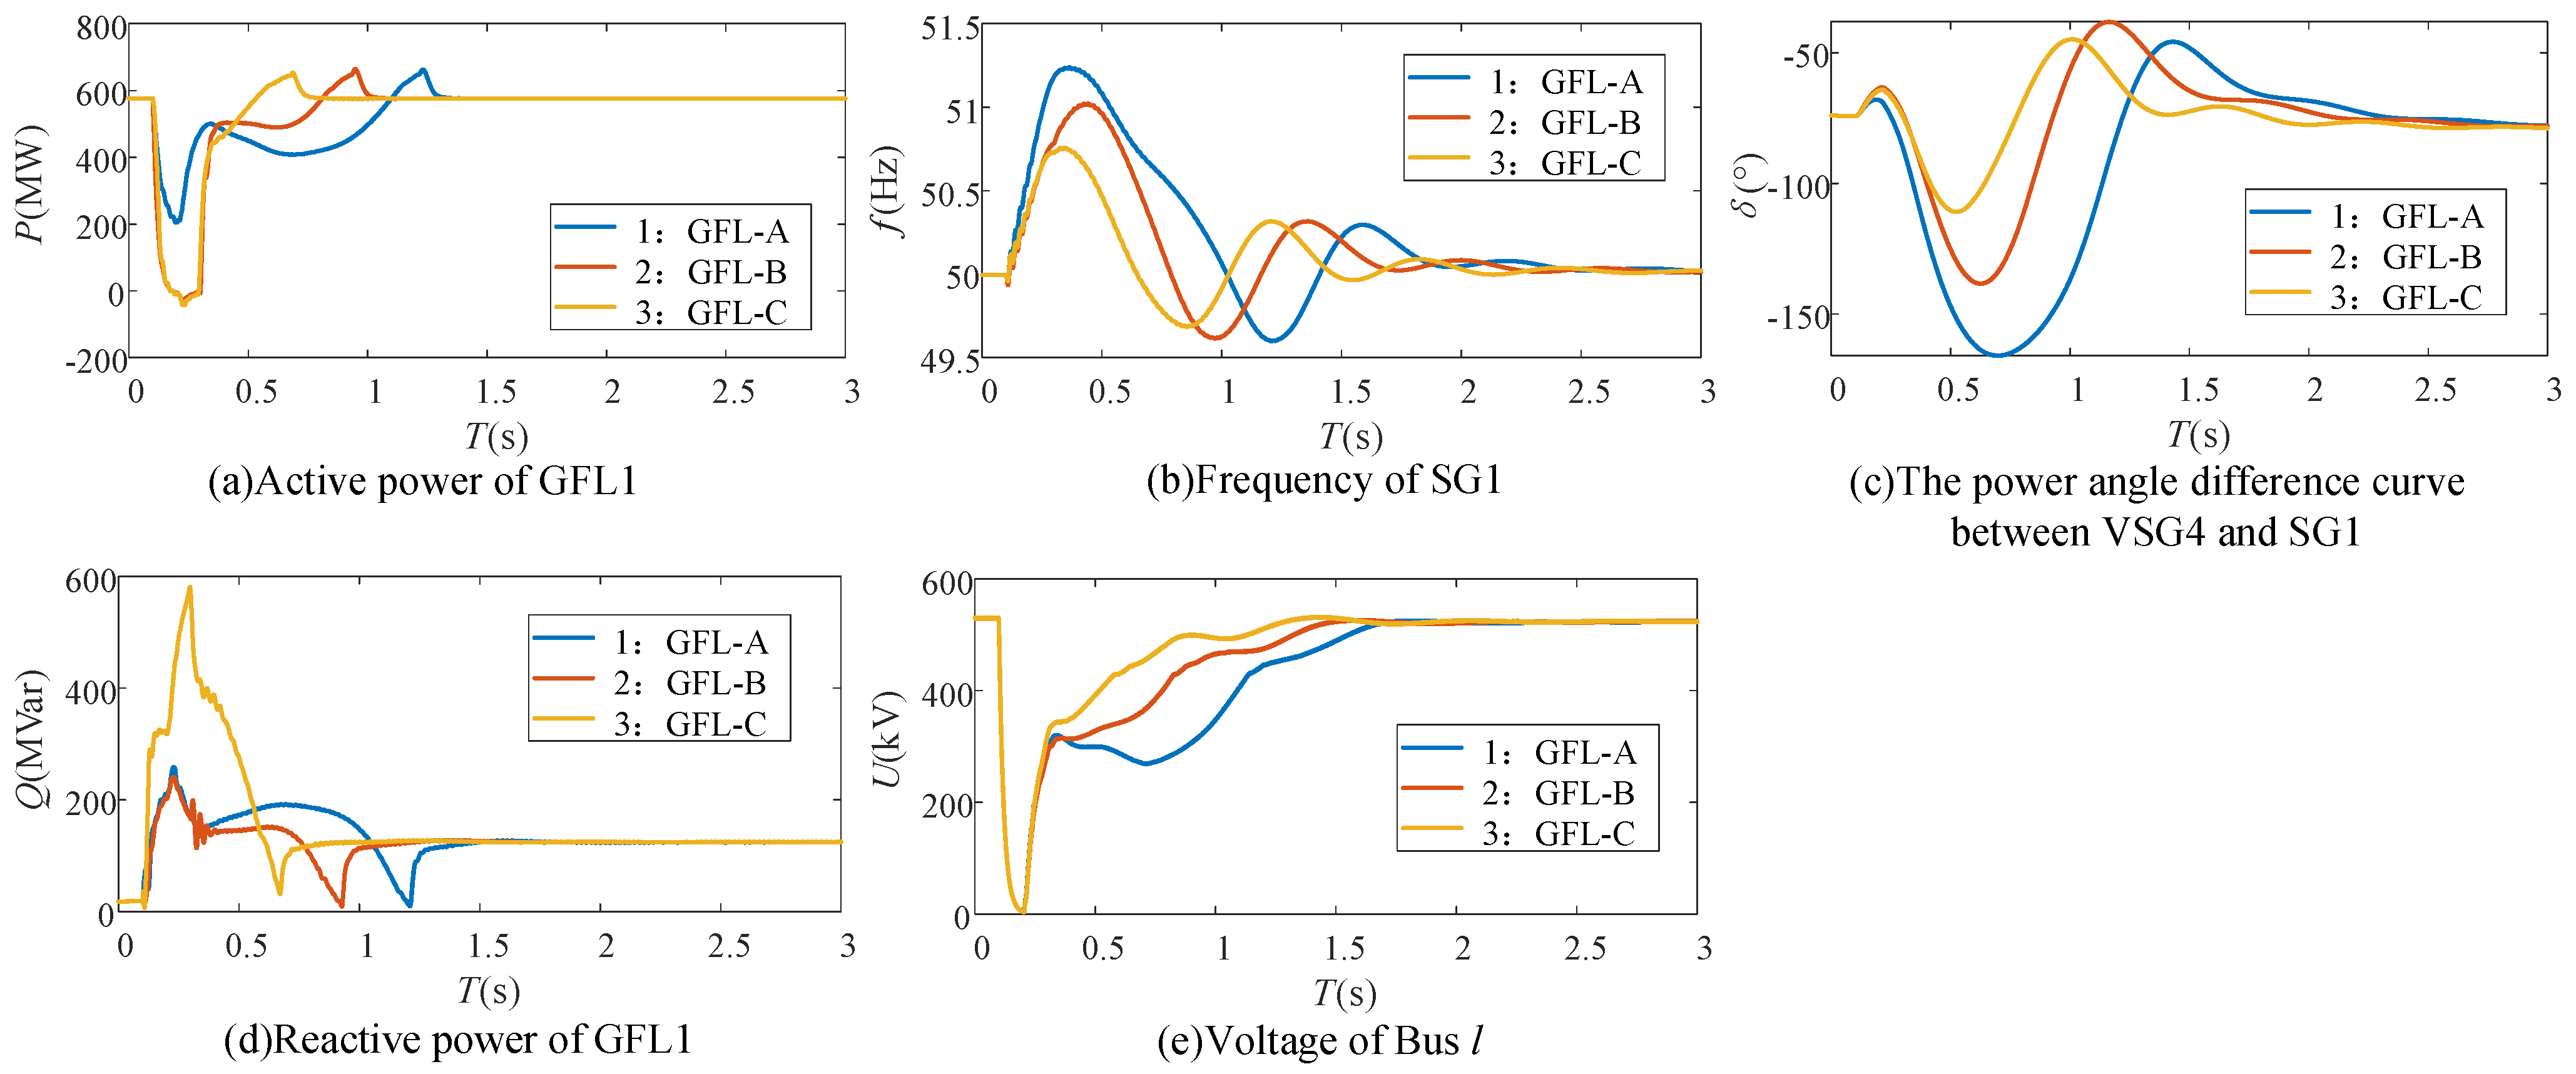
The simulation results of GFL-A, GFL-B, and GFL-C under Scenario 1 and Fault 1 are shown in Figure 11.
From Figure 11, it can be observed that
(1) As evidenced by curves 1 and 2 in (a), (b), and (c), GFL inverters can effectively suppress rotor acceleration of adjacent SGs by reducing their active power output during low-voltage periods. This mitigation strategy consequently reduces the power angle difference between SGs and VSGs in Scenario 1 (where the acceleration severity of the SG cluster exceeds that of the VSG group after a fault occurs), thereby enhancing the transient synchronous stability. These results not only validate the mechanistic analysis presented in Section 3.1.2, but also demonstrate the efficacy of the enhanced GFL control strategy proposed in Section 4.1.
(2) As observed from Curves 2 and 3 in (c), (d), and (e), the GFL inverters enhance their reactive power support capability by increasing the q-axis current reference value, which accelerates the voltage recovery and consequently improves the transient synchronous stability. These findings corroborate the validity of the mechanistic analysis in Section 3.2 and demonstrate the effectiveness of the enhanced GFL control strategy proposed in Section 4.1.
The simulation results of GFL-A, GFL-B, and GFL-C under Scenario 1 and Fault 2 are shown in Figure 12.
A comparison between Figure 11 and Figure 12 confirms the effectiveness of the proposed theoretical analysis and control enhancements under different fault scenarios.

5.2. Scenario 2

Under the condition that both VSGs and GFLs adopt classical control strategies, the power angle difference curve of Scenario 2 and Fault 1 is obtained, as shown in Figure 13.
In Figure 13, δ1, δ2, and δ3 represent the power angle of SG1, SG2, and SG3. δ4 and δ5 represent the virtual power angle of VSG4 and VSG5.
As illustrated in Figure 13, the acceleration severity of the VSG cluster exceeds that of the SG group after a fault occurs. Therefore, according to Section 4, GFLs should revert to the classical control strategy, whereas VSGs implement the enhanced control approach.
Two distinct modes are implemented to validate the efficacy of the proposed VSG control strategy, which is shown in Table 4.
The simulation results of VSG-A and VSG-B under Scenario 2 and Fault 1 are shown in Figure 14.
From Figure 14, it can be observed that:
(1) As demonstrated by Curves 1 and 2 in (a), (b), and (c), VSGs can effectively suppress their own virtual rotor acceleration through adaptive regulation of the active power reference value Pref. This control approach significantly reduces the power angle difference between VSGs and SGs in Scenario 2 (where the acceleration severity of the VSG cluster exceeds that of the SG group after a fault occurs), thereby enhancing the transient synchronous stability. These results not only validate the mechanistic analysis presented in Section 3.1, but also demonstrate the efficacy of the enhanced VSG control strategy proposed in Section 4.2.
(2) As evidenced by Curves 1 and 2 in (c), (d), and (e), the reduction in active power reference values in VSGs enhances their reactive power support capability. This control modification accelerates voltage recovery and consequently improves the transient synchronous stability. These findings corroborate the validity of the mechanistic analysis in Section 3.2 and demonstrate the effectiveness of the enhanced VSG control strategy proposed in Section 4.2.
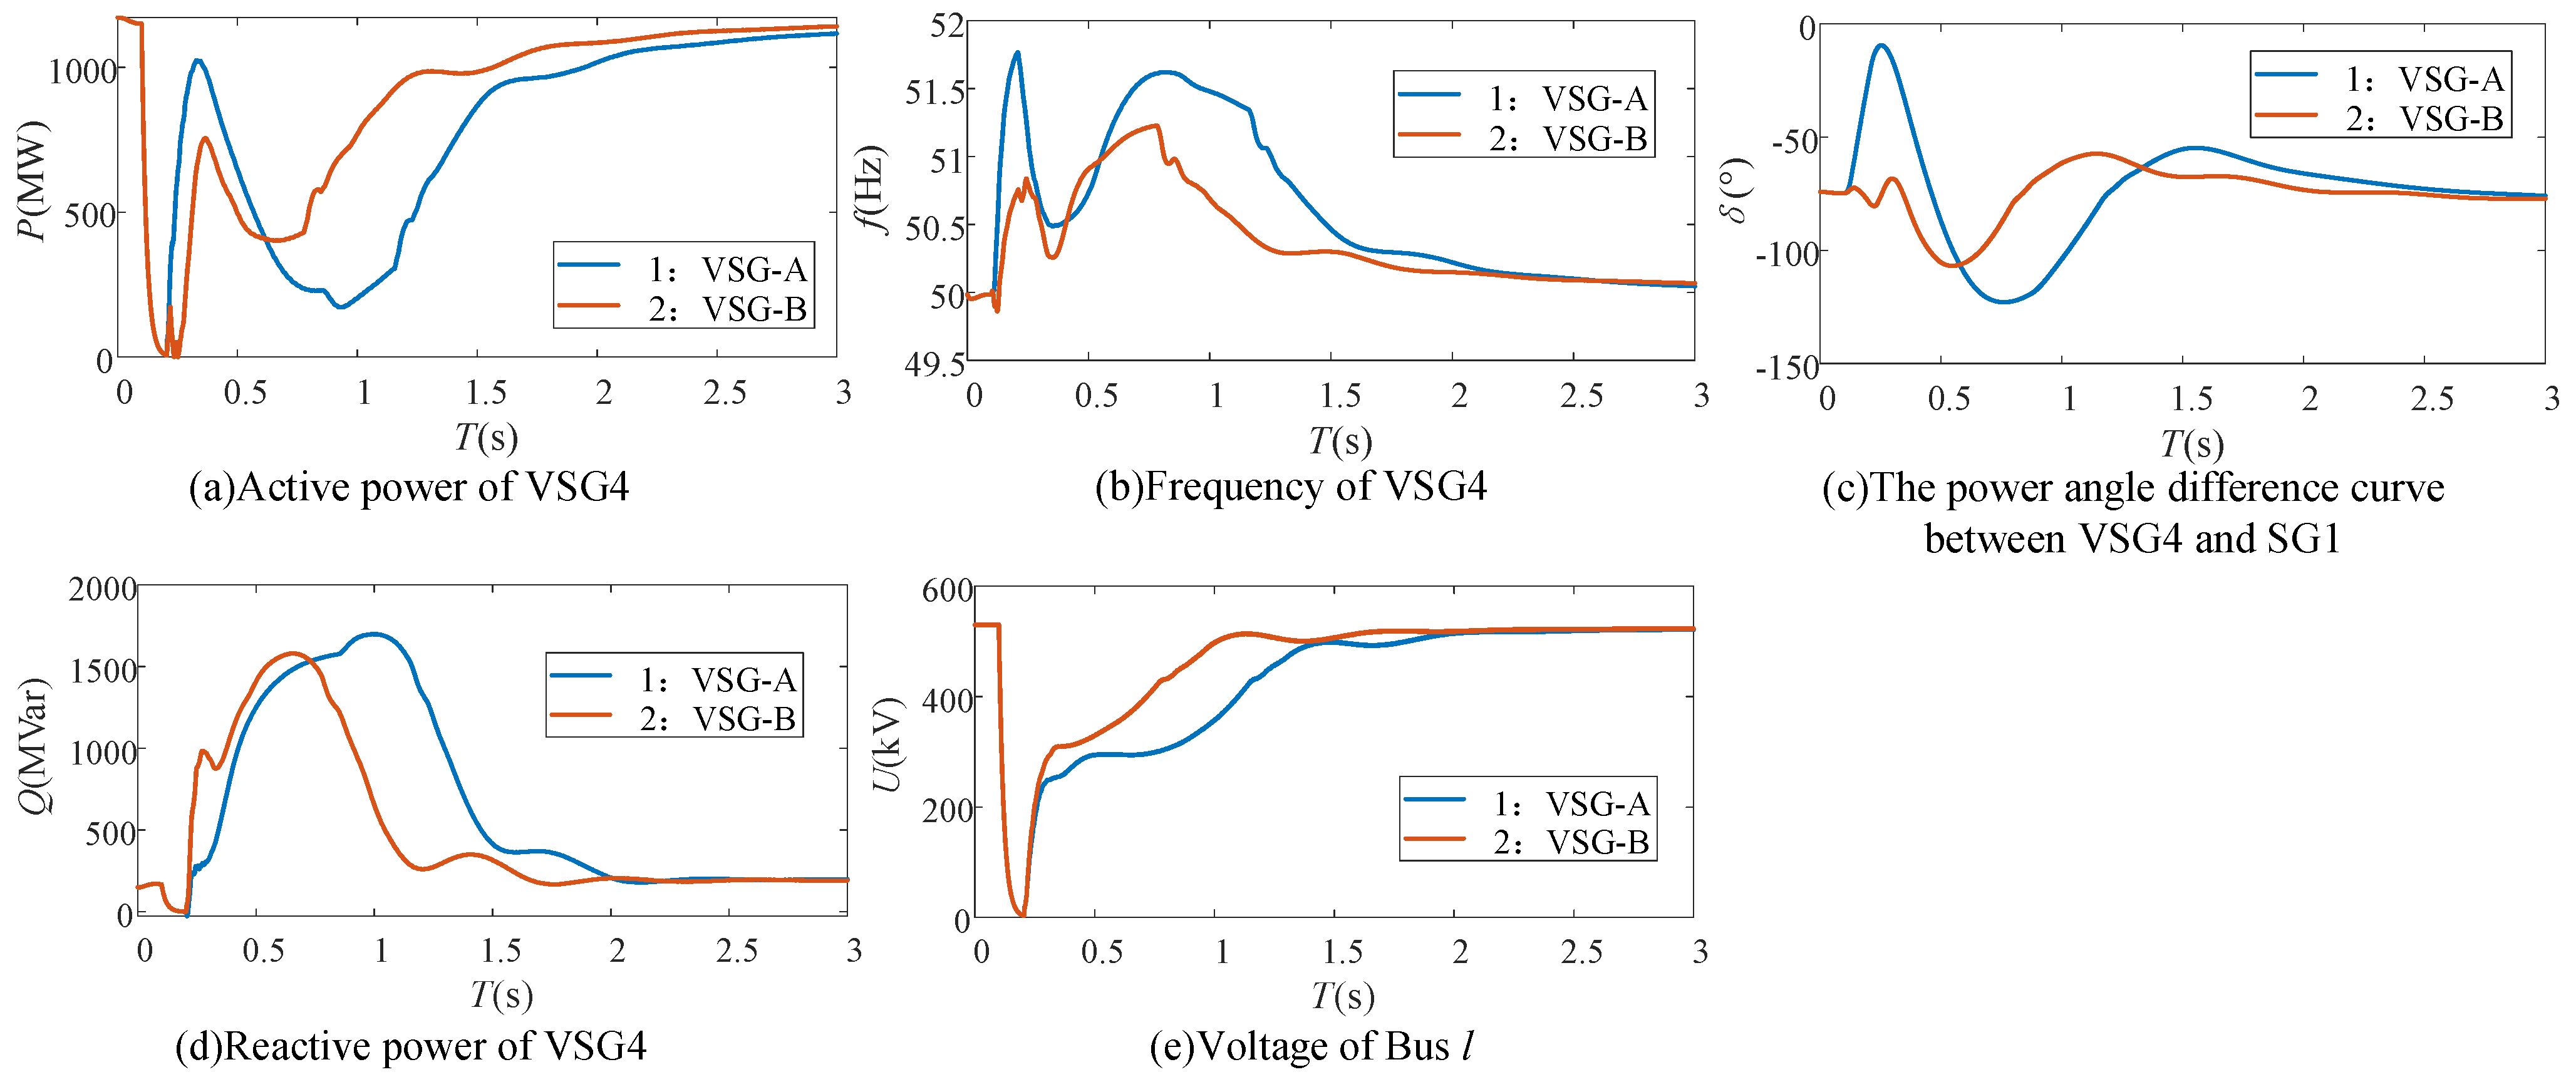
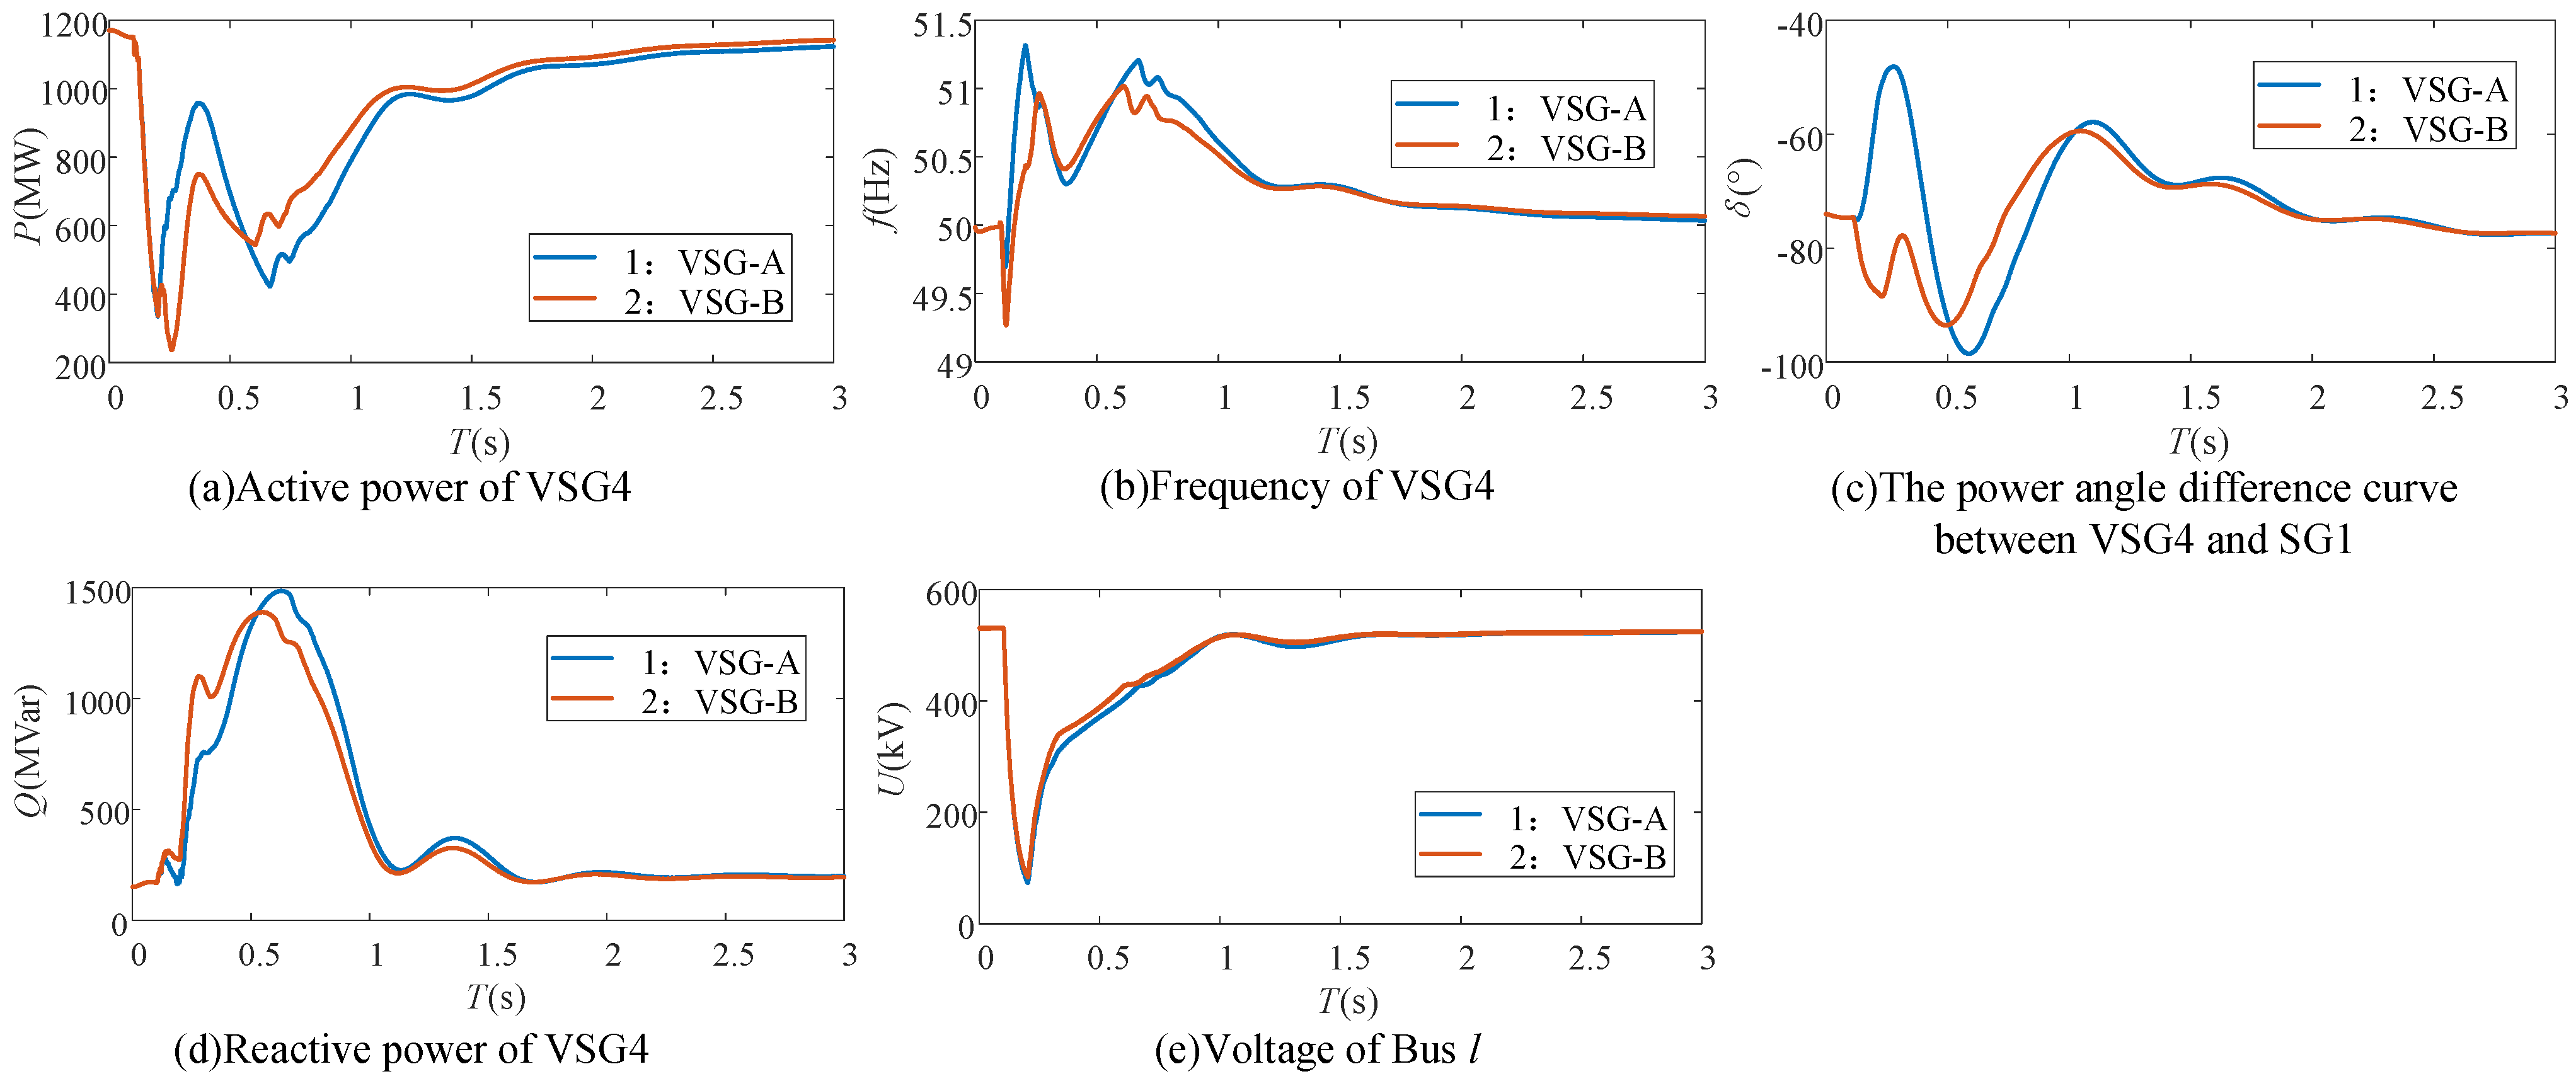
The simulation results of VSG-A and VSG-B under Scenario 2 and Fault 2 are shown in Figure 15.
A comparison between Figure 14 and Figure 15 confirms the effectiveness of the proposed theoretical analysis and control enhancements under different fault scenarios.
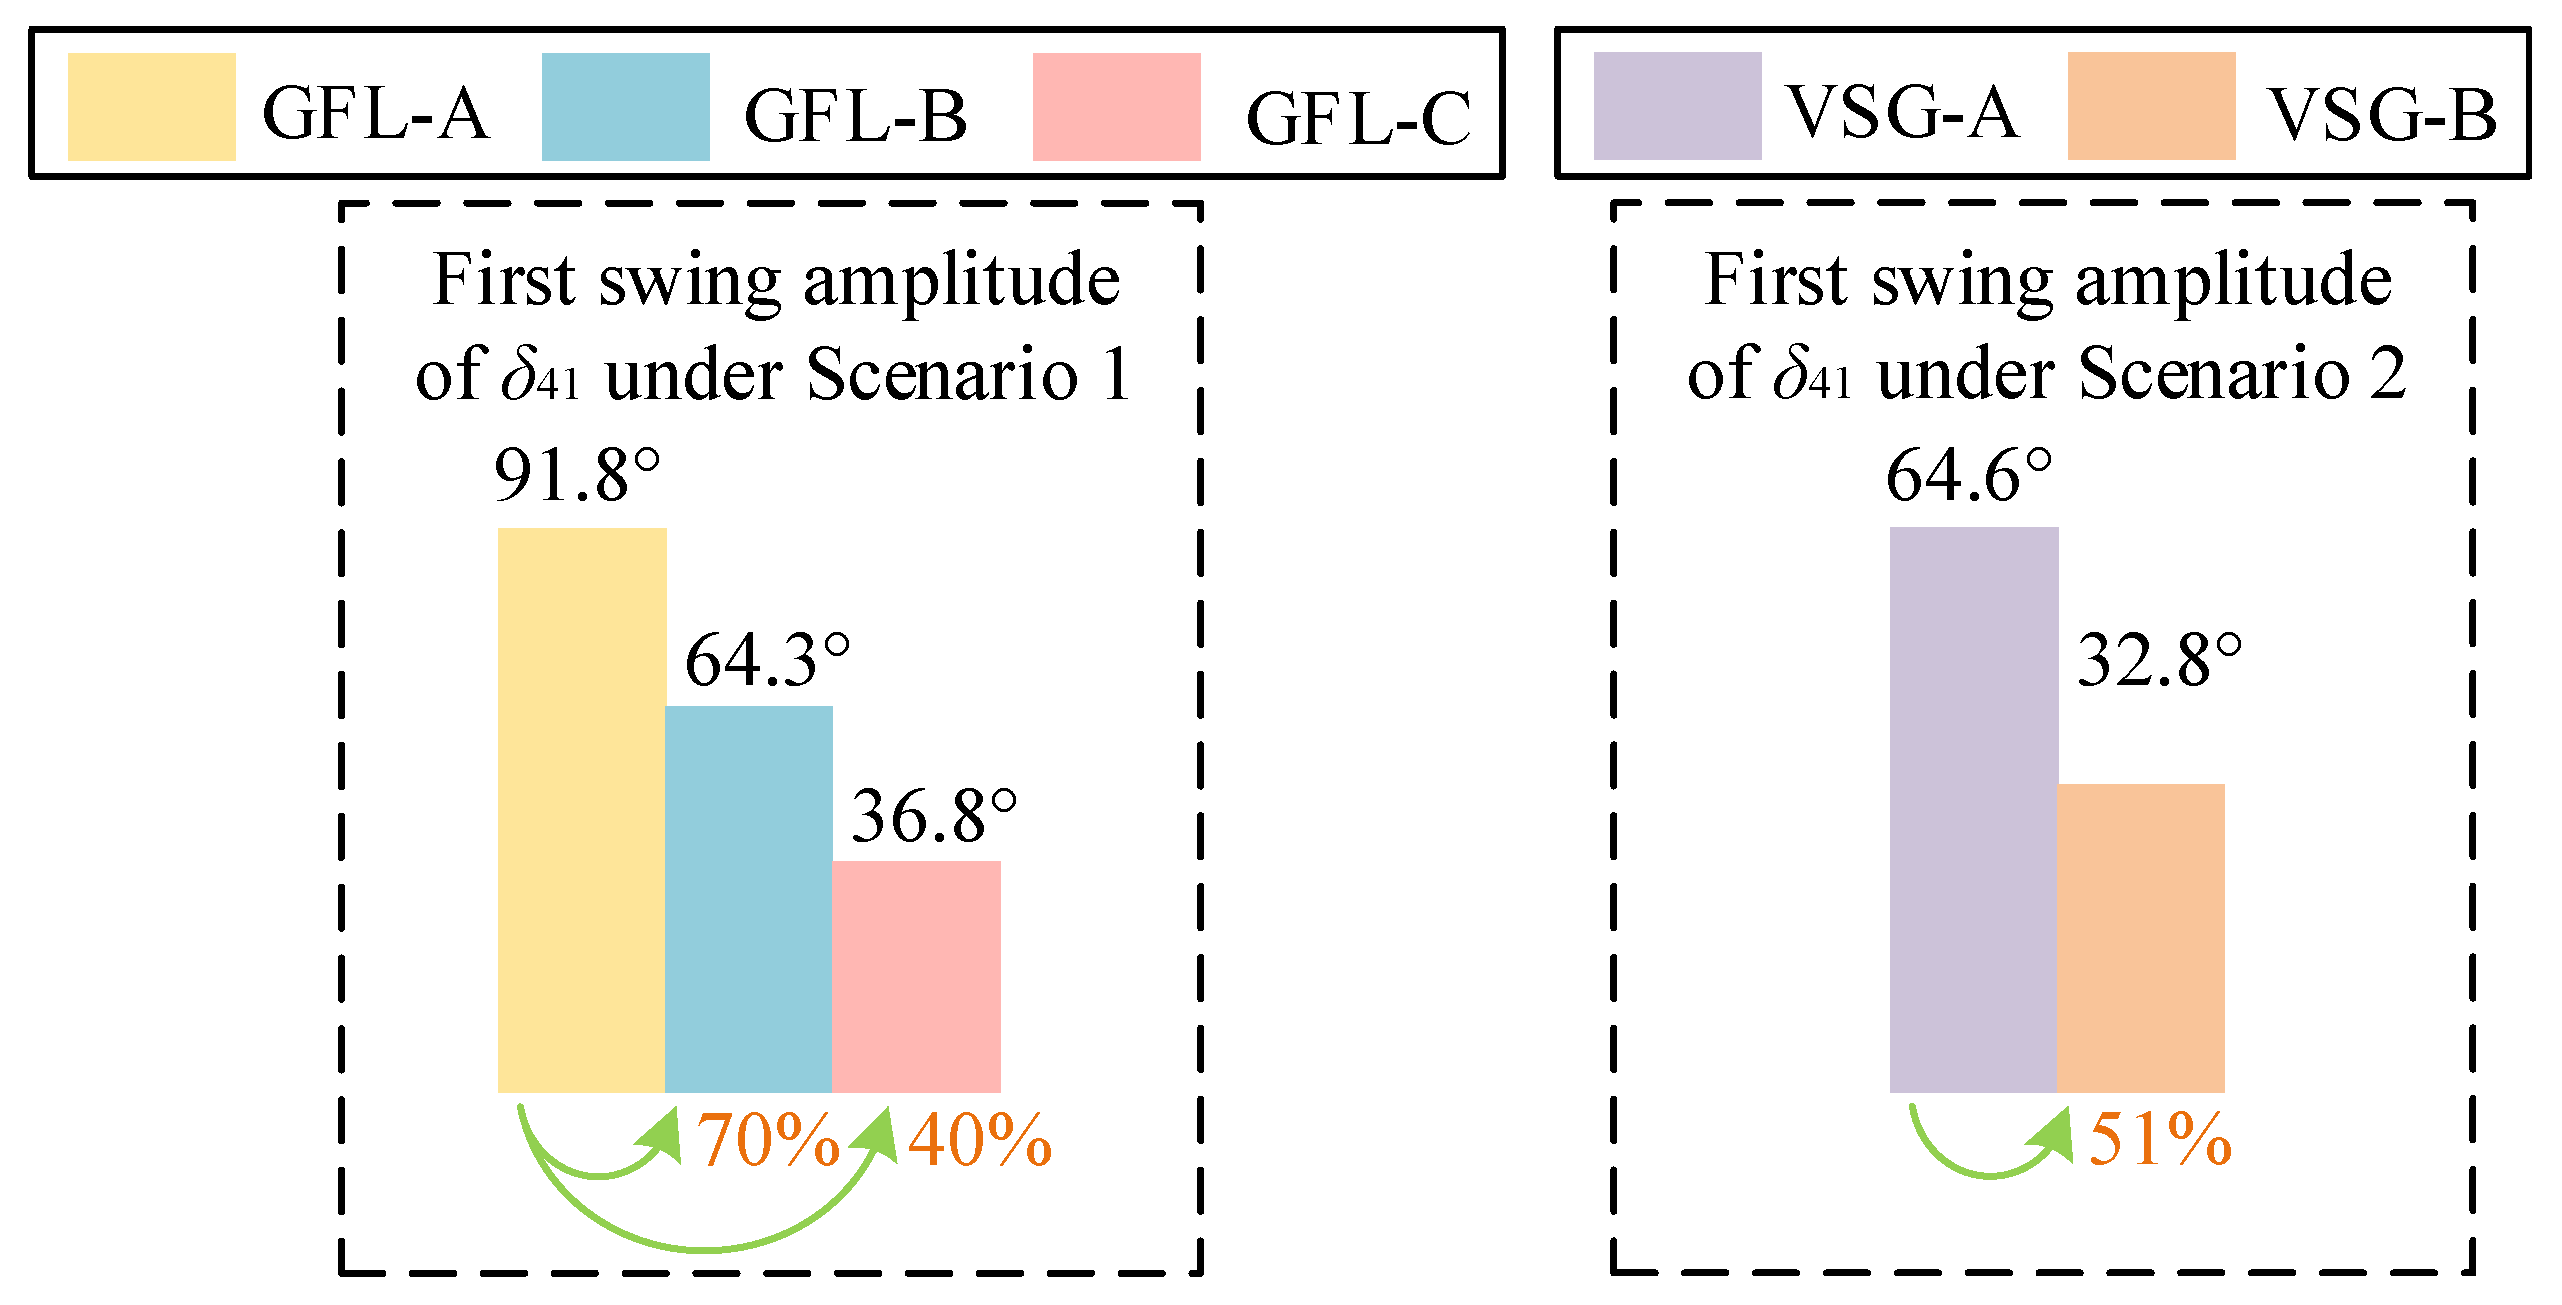
To quantitatively assess how enhanced control strategies for VSGs and GFLs improve synchronous stability, Figure 16 presents the first-swing amplitude of the power angle difference between VSG4 and SG1 across various scenarios and control modes. For brevity, only the results under Fault 1 are presented and analyzed.
Where δ41 is the power angle difference between VSG4 and SG1 corresponding to Figure 11c and Figure 14c.
From Figure 16, it can be observed that
(1) Under the proposed d-axis current control for GFL, the first-swing amplitude of δ41 decreased by 30%, while under the full enhanced GFL control, a reduction of 60% was achieved.
(2) Under the enhanced VSG control, the first-swing amplitude of δ41 decreased by 49%.

6. Conclusions

Based on the analysis of the distinct capabilities of different power sources in reshaping synchronous stability, this paper proposes a novel distribution scheme for VSGs, GFLs, and SGs to simplify synchronous stability analysis and control in future high-converter-penetration power grids. Within this framework, we systematically investigate the mechanistic influence of voltage stability on power angle stability between SGs and VSGs. Building on these insights, enhanced control strategies for both VSGs and GFL converters are developed. The conclusions include the following:
(1) VSGs can flexibly adjust the control parameters to directly reshape synchronous stability. In contrast, by tuning the control parameters to alter the rotor dynamics of nearby SGs, GFLs can indirectly influence synchronous stability.
(2) The proposed scheme strategically locates SGs and GFL converters at the power sending area while locating VSG units at the power receiving area. Under the scheme, transient synchronous stability is determined by the power angle difference between VSGs and SGs.
(3) A weaker voltage stability corresponds to a larger acceleration area and a smaller maximum deceleration area in the system, thereby degrading the transient synchronous stability.
(4) The enhanced control strategies for VSGs and GFLs are proposed to improve the voltage stability and the synchronous stability between SGs and VSGs.
It should be acknowledged that the validation in this study is based on simulations conducted on the PSCAD platform, which lacks verification through physical hardware tests or real systems. Additionally, this research is confined to a two-area interconnected system, necessitating further expansion to more complex grid topologies. These aspects represent important directions for future work.

Author Contributions

Funding acquisition, X.L.; Methodology, Z.C.; Supervision, P.S.; Writing—original draft, Z.C.; Writing—review and editing, X.L., Z.C., F.D., Y.H. and P.S. All authors have read and agreed to the published version of the manuscript.

Funding

This work is supported by the National Major Science and Technology Projects (2024ZD0802600).

Data Availability Statement

The dataset is available on request from the authors. The data are not publicly available due to third-party proprietary restrictions.

Acknowledgments

The authors would like to express their sincere gratitude to the anonymous referees for providing valuable suggestions and comments that have significantly contributed to the improvement of our manuscript.

Conflicts of Interest

Xin Luo, Fei Duan, and Yilong He were employed by the Guangzhou Power Supply Bureau of Guangdong Power Grid Co. Zhiying Chen and Pengwei Sun were employed by the CSG Electric Power Research Institute. The remaining authors declare that this research was conducted in the absence of any commercial or financial relationships that could be construed as a potential conflict of interest.

References

  1. Gu, Y.; Green, T.C. Power system stability with a high penetration of inverter-based resources. Proc. IEEE 2023, 111, 832–853. [Google Scholar] [CrossRef]
  2. Strunz, K.; Almunem, K.; Wulkow, C.; Kuschke, M.; Valescudero, M.; Guillaud, X. Enabling 100% renewable power systems through power electronic grid-forming converter and control: System integration for security, stability, and application to Europe. Proc. IEEE 2023, 111, 891–915. [Google Scholar] [CrossRef]
  3. Li, Y.; Gu, Y.; Green, T. Revisiting grid-forming and grid-following inverters: A duality theory. IEEE Trans. Power Syst. 2022, 37, 4541–4554. [Google Scholar] [CrossRef]
  4. Wu, H.; Ruan, X.; Yang, D.; Chen, X.; Zhao, W. Small-signal modeling and parameters design for virtual synchronous generators. IEEE Trans. Ind. Electron. 2016, 63, 4292–4303. [Google Scholar] [CrossRef]
  5. Zhang, X.; Zhan, X.; Wu, M. Review on grid-following/grid-forming hybrid mode control for grid-connected converter in high-penetration renewable energy generation. Autom. Electr. Power Syst. 2024, 48, 1–15. [Google Scholar]
  6. Wu, H.; Wang, X. Design-oriented transient stability analysis of PLL-synchronized voltage-source converters. IEEE Trans. Power Electron. 2020, 35, 3573–3589. [Google Scholar] [CrossRef]
  7. Ma, S.; Geng, H.; Liu, L.; Yang, G.; Pal, B.C. Grid-synchronization stability improvement of large scale wind farm during severe grid fault. IEEE Trans. Power Syst. 2018, 33, 216–226. [Google Scholar] [CrossRef]
  8. Mu, P.; Zhao, D.; Wang, J. Influence Mechanism Analysis of Large-scale Wind Power Integration on Power System Angle Stability. Proc. CSEE 2017, 37, 1324–1332. [Google Scholar]
  9. Jiang, H.; Zhou, Z.; Cai, J. Analysis method of influence of wind power access proportion on transient power angle stability of power system. Electr. Power Autom. Equip. 2020, 40, 53–67. [Google Scholar]
  10. Ge, P.; Tu, C.; Xiao, F.; Guo, Q. Transient stability enhancement of a VSG based on flexible switching of control parameters. Proc. CSEE 2022, 42, 2109–2124. [Google Scholar]
  11. Wu, H.; Wang, X. A mode-adaptive power-angle control method for transient stability enhancement of virtual synchronous generators. IEEE J. Emerg. Sel. Top. Power Electron. 2020, 8, 1034–1049. [Google Scholar] [CrossRef]
  12. Wang, G.; Fu, L.; Hu, Q.; Liu, C.; Ma, Y. Transient synchronization stability of grid-forming converter during grid fault considering transient switched operation mode. IEEE Trans. Sustain. Energy 2023, 14, 1504–1515. [Google Scholar] [CrossRef]
  13. Lan, Z.; Wu, F.; Yu, X.; He, D.; Tu, C.; Xiao, F. Transient instability analysis and its stability strategies for islanded microgrid with heterogeneous micro-source. Power Syst. Technol. 2023, 47, 4585–4599. [Google Scholar]
  14. Vittal, E.; O’Malley, M.; Keane, A. Rotor angle stability with high penetrations of wind generation. IEEE Trans. Power Syst. 2012, 27, 353–362. [Google Scholar] [CrossRef]
  15. De Rijcke, S.; Ergun, H.; Van Hertem, D.; Driesen, J. Grid impact of voltage control and reactive power support by wind turbines equipped with direct-drive synchronous machines. IEEE Trans. Sustain. Energy 2012, 3, 890–898. [Google Scholar] [CrossRef]
  16. Mitra, A.; Chatterjee, D. Active power control of DFIG-based wind farm for improvement of transient stability of power systems. IEEE Trans. Power Syst. 2016, 31, 82–93. [Google Scholar] [CrossRef]
  17. Zhou, M.; Dong, Z.; Li, H.; Gan, C.; Li, G.; Liu, Y. Coordinated control of DFIG based wind farms and SGs for improving transient stability. IEEE Access 2018, 6, 46844–46855. [Google Scholar] [CrossRef]
  18. Shuai, Z.; Shen, C.; Liu, X.; Li, Z.; Shen, Z.J. Transient angle stability of virtual synchronous generators using Lyapunov’s direct method. IEEE Trans. Smart Grid 2019, 10, 4648–4661. [Google Scholar] [CrossRef]
  19. Zhuang, K.; Xin, H.; Hu, P.; Wang, Z. Current saturation analysis and anti-windup control design of grid-forming voltage source converter. IEEE Trans. Energy Convers. 2022, 37, 2790–2802. [Google Scholar] [CrossRef]
  20. Ge, P.; Tu, C.; Xiao, F.; Guo, Q.; Gao, J. Design-oriented analysis and transient stability enhancement control for a virtual synchronous generator. IEEE Trans. Ind. Electron. 2023, 70, 2675–2684. [Google Scholar] [CrossRef]
  21. Wang, J.; Zhang, X.; Li, M. Transient stability analysis and improvement of mult-paralleled virtual synchronous generators grid-connected system. IEEE J. Emerg. Sel. Top. Power Electron. 2024, 12, 4094–4105. [Google Scholar] [CrossRef]
  22. Meng, Z.; Xing, X.; Li, X.; Ding, W.; Zhang, R.; Blaabjerg, F. An Adaptive Power Angle Compensation Algorithm for Enhancing Transient Stability of Virtual Synchronous Generator. IEEE J. Emerg. Sel. Top. Power Electron. 2025, 13, 966–982. [Google Scholar] [CrossRef]
  23. EAfshari et, al. Control strategy for three-phase grid-connected PV inverters enabling current limitation under unbalanced faults. IEEE Trans. Ind. Electron. 2017, 64, 8908–8918. [Google Scholar] [CrossRef]
  24. Liu, Z.; Liu, C.; Li, G.; Liu, Y.; Liu, Y. Impact study of PMSG-based wind power penetration on power system transient stability using EEAC theory. Energies 2015, 8, 13419–13441. [Google Scholar] [CrossRef]
  25. Gong, H.; Chen, Z.; Fan, W.; Guan, L. A benchmark system for the dynamic study of new power systems with high penetration of nonsynchronous power sources. In Proceedings of the IEEE 7th Conference on Energy Internet and Energy System Integration(EI2), Hangzhou, China, 15–18 December 2023; pp. 489–493. [Google Scholar]
Figure 1. The classical control structure of VSG.
Electronics 14 03539 g001
Figure 2. Vector diagram of VSG.
Electronics 14 03539 g002
Figure 3. The classical control structure of GFL.
Electronics 14 03539 g003
Figure 4. The typical two-area interconnection system.
Electronics 14 03539 g004
Figure 5. A diagram of a power grid with different types of nodes.
Electronics 14 03539 g005
Figure 6. The proposed distribution scheme of power supplies.
Electronics 14 03539 g006
Figure 7. P-δ curve of equivalent single-machine infinite bus system.
Electronics 14 03539 g007
Figure 8. The proposed control architecture.
Electronics 14 03539 g008
Figure 9. The simplification system of an actual grid.
Electronics 14 03539 g009
Figure 10. The power angle difference curves of each voltage source and SG1 under Scenario 1.
Electronics 14 03539 g010
Figure 11. The simulation results of GFL-A, GFL-B, and GFL-C under Scenario 1 and Fault 1.
Electronics 14 03539 g011
Figure 12. The simulation results of GFL-A, GFL-B, and GFL-C under Scenario 1 and Fault 2.
Electronics 14 03539 g012
Figure 13. The power angle difference curves of each voltage source and SG1 under Scenario 2.
Electronics 14 03539 g013
Figure 14. The simulation results of VSG-A and VSG-B under Scenario 2 and Fault 1.
Electronics 14 03539 g014
Figure 15. The simulation results of VSG-A and VSG-B under Scenario 2 and Fault 2.
Electronics 14 03539 g015
Figure 16. The first-swing amplitude of the power angle difference between VSG4 and SG1 across various scenarios and control modes.
Electronics 14 03539 g016
Table 1. The operating point characteristics when the post-fault voltage recovers rapidly.
StageFault-on
(U = U1)
Post-Fault
(U = 1 p.u.)
Operating point a b c c g h a
Curve 1 2 2 1
Table 2. The operating point characteristics when the post-fault voltage recovers slowly.
StageFault-on
(U = U1)
Post-Fault
U = U2U = 1 p.u.
Operating point a b c c d e e f h a
Curve 1 2 2 3 3 1
Table 3. Three distinct modes of GFL.
TypeControl Mode
A(2) + (3)
B(2) + (18)
C(18) + (19)
Table 4. Two distinct modes of VSG.
TypeControl Mode
A(1)
B(20)
Disclaimer/Publisher’s Note: The statements, opinions and data contained in all publications are solely those of the individual author(s) and contributor(s) and not of MDPI and/or the editor(s). MDPI and/or the editor(s) disclaim responsibility for any injury to people or property resulting from any ideas, methods, instructions or products referred to in the content.