Abstract
Driving fatigue is a crucial factor affecting road traffic safety. Accurately assessing the driver’s fatigue status is critical for accident prevention. This paper explores the assessment methods of driving fatigue under different conditions based on multimodal physiological and behavioral data. Physiological data such as heart rate, brainwave, electromyography, and pupil diameter were collected through experiments, as well as behavioral data such as posture changes, vehicle acceleration, and throttle usage. The results show that physiological and behavioral indicators have significant sensitivity to driving fatigue, and the fusion of multimodal data can effectively improve the accuracy of fatigue detection. Based on this, a comprehensive driving fatigue assessment model was constructed, and its applicability and reliability in different driving scenarios were verified. This study provides a theoretical basis for the development and application of driver fatigue monitoring systems, helping to achieve real-time fatigue warnings and protections, thereby improving driving safety.
1. Introduction
Driving fatigue is a major risk factor for traffic accidents [1]. Driver fatigue can be categorized into physical fatigue and mental fatigue [2]. The former is caused by prolonged muscle activity or lack of rest, while the latter results from extended mental concentration. These two types of fatigue interact, with physical fatigue possibly leading to cognitive impairment, while cognitive fatigue depletes brain energy, causing the body to feel exhausted. In addition to personal factors, environmental factors can also influence the sensation of fatigue. The research by Zhu et al. [3] has shown that lighting and air quality in indoor environments significantly impact mental fatigue. Meanwhile, Du et al. [4], through virtual reality experiments, found that different lighting environments can significantly affect individual eye movements and physiological responses, further exacerbating or alleviating fatigue. Jinchun Wu et al. [5] found that moderate road lighting color temperature (around 4500 K) is more suitable for nighttime road lighting, whereas excessive lighting can exacerbate psychological fatigue. Furthermore, He et al. [6] categorized driving fatigue into passive and active fatigue. Active fatigue is usually caused by high cognitive workload from continuous tasks, whereas passive fatigue arises from prolonged tasks. Passive fatigue is more dangerous because it stems from a lack of mental engagement and task involvement.
In the assessment of driving fatigue, commonly used indicators include physiological indicators (such as heart rate, brainwaves, electromyography, and pupil diameter), subjective evaluations, and behavioral indicators. These indicators reflect physical or cognitive fatigue from different perspectives. Kovalenko et al. [7] compiled a dataset for creating fatigue detection models that include eye movement, heart rate, subjective fatigue, behavioral, and postural data. Heart rate variability reflects the autonomic nervous system’s state; brainwave changes can reveal decreases in alertness, and pupil diameter changes are widely used to assess cognitive load. The research by Qi et al. [8] demonstrates that using the feature fusion of electroencephalography (EEG) and electromyography (EMG) along with transfer learning improves the recognition rate of driver fatigue, enhancing the robustness of fatigue assessments across different drivers. Further research by Zhang et al. [9] highlighted changes in EEG indicators under automated driving conditions, revealing reduced cognitive task accuracy and slower response times, both signs of fatigue. Recent studies have indicated that the prolonged wearing of respiratory protection, such as masks, increases respiratory resistance, which in turn elevates subjective discomfort, exertion, and cognitive load. Shenal et al. [10] demonstrated that extended mask usage in healthcare settings leads to increased fatigue and decreased cognitive performance due to the added physiological burden. This evidence supports the inclusion of mask-induced respiratory resistance as a relevant factor in driving fatigue assessment, particularly in the context of widespread mask usage during the ongoing pandemic.
Regarding subjective evaluations, the Karolinska Sleepiness Scale (KSS) is a validated self-assessment scale used by subjects [11]. The Observer-Rated Sleepiness (ORS) scale has also been used in studies on driver fatigue, and Mashko et al. [12] referenced a self-rated sleepiness scale to evaluate driver drowsiness. Additionally, behavioral indicators such as driving skill and reaction time are crucial aspects of fatigue assessment. Li et al. [13] detected fatigue by monitoring the grip force applied to the steering wheel, while Liu et al. [14] focused on reaction time as a key indicator of fatigue.
Typically, a combination of physiological, behavioral, and subjective indicators is used for a more accurate evaluation of driver fatigue. Razak et al. [15] suggest that physiological-based Driver Monitoring Systems (DMS) provide deeper insights into driver monitoring than traditional methods. When non-physiological-based DMS is combined with physiological data analysis, such as EEG, EMG, electrooculography (EOG), and electrocardiogram (ECG), it offers a more comprehensive view of a driver’s physical and emotional state. Chang et al. [16] applied a neural network model to process and analyze driver physiological signals or behavioral characteristics to monitor driver fatigue in real time. Huang et al. [17] assessed fatigue during regular tasks using ECG recordings, building a workload model that revealed a significant interaction between workload and fatigue.
In the direction of multimodal fatigue recognition, Cao et al. [18] proposed a feature-coupled neural network model based on the DROZY dataset (including EEG, ECG, and facial images), in which dynamic interaction between modalities significantly improved fatigue detection performance (accuracy 98.41%, F1-score 98.39%). Li et al. [19] combined wearable physiological signal acquisition with visual information to enable real-time fatigue detection under various lighting and occlusion conditions, maintaining high accuracy. Ahmed et al. [20] provided a comprehensive review of the latest advances in remote photoplethysmography (rPPG) technology for driver monitoring, highlighting that multimodal fusion and deep learning have greatly improved heart rate estimation and fatigue analysis, and suggested integrating emotional and cognitive state evaluation in future systems. Zhou et al. [21] developed an explainable XGBoost model in the context of automated driving, using PERCLOS as the fatigue label and SHAP for model interpretability, achieving a high predictive performance (RMSE of 3.847, MAE of 1.768, and adjusted R2 of 0.996). Most recently, K. and Zeng [22] proposed an efficient dual-sensing fusion system combining real-time facial feature analysis with physiological signal processing, achieving high accuracy in both controlled and real-world environments, showing strong potential for industrial deployment.
In summary, the key to improving driving safety lies in accurately assessing and promptly monitoring driver fatigue. In situations where masks are worn for extended periods, fatigue detection becomes more complex. As Silversmith et al. [23] advocated, using multiple sensor modalities to monitor complex physiological states is a promising direction for future research. With technological advancements, including new sensor technologies and data analysis methods, there are new possibilities for fatigue monitoring. Małecki et al. [24] collected multispectral data to automatically evaluate driver fatigue, while Peng et al. [25] employed a zero-inflated Poisson regression model to study factors influencing accident rates. Kashani et al. [26] used Classification and Regression Trees (CART) to analyze factors affecting the severity of injuries in fatigue-related accidents. Mollicone et al. [27] developed a biomathematical model to predict driver fatigue and correlated it with incidents of hard braking. These data analysis methods offer valuable insights for future research on driver fatigue monitoring. This study aims to establish an effective driver fatigue assessment model based on multimodal physiological and behavioral data. Through experiments, the changes in physiological and behavioral data during varying fatigue levels will be analyzed, and the role of these indicators in fatigue monitoring will be explored, providing a scientific basis for detecting and preventing driver fatigue.
2. Research Methods
2.1. Experimental Setup and Instruments
The instruments used in this experiment included the ErgoSIM intelligent cockpit human factors evaluation driving simulator, ErgoLAB EMG wireless electromyography sensors, ErgoLAB ECG wireless electrocardiography sensors, ErgoLAB EEG wearable electroencephalogram device, and the Tobii Pro Glasses 3 wearable eye tracker. All the equipment mentioned above and its accompanying software are manufactured by KingFar International Inc., Beijing, China.
The experiment was conducted in the laboratory of Jinfa Technology Co., Ltd. The ErgoSIM intelligent cockpit human factors evaluation driving simulation system is based on the “human–vehicle–road environment” and “human-information–physical” systems theory. The ErgoSIM laboratory driving simulation scenario is shown in Figure 1. It is designed and constructed to evaluate human factors in traffic driving and intelligent cockpits. The laboratory uses the ErgoLAB human–vehicle–road environment synchronization platform as its core, enabling the real-time collection of data related to humans, vehicles, and road environments. These data were used to analyze drivers’ behaviors, cognitive load, emotional arousal, fatigue, and comfort under different environments and tasks, providing valuable information for the design and optimization of cockpit layouts, Human–Machine Interface (HMI) systems, smart system designs, and interaction methods.

Figure 1.
ErgoSIM laboratory driving simulation scenario.
2.2. Experimental Content
The purpose of this experiment was to collect physiological and behavioral data from subjects to assess the degree of driving fatigue and explore effective fatigue prevention strategies. By simulating different driving situations, the experiment induced various levels of driver fatigue to comprehensively monitor and analyze fatigue states.
To create different levels of driving fatigue, the experiment was designed with several conditions, one of which involved the use of different types of masks (no mask, medical surgical masks, N95-grade medical protective masks) as external interventions. The purpose was to increase respiratory resistance, indirectly intensifying the driver’s fatigue. In addition to mask usage, other factors such as prolonged driving time and monotonous driving environments were introduced to ensure the subjects experienced varying degrees of fatigue across different scenarios.
The experiment was conducted using a professional driving simulator, and the simulated driving routes mainly included highways and roundabouts, covering typical road structures such as straight roads and large-radius curves. This setup ensured that the subjects experienced fatigue while completing driving tasks of varying complexity. The environmental temperature and humidity were maintained at a constant 25 °C and 50%, respectively, with stable lighting to minimize environmental interference with fatigue assessment.
The subjects consisted of ten driving testers, including four males and six females, aged between 21 and 28 years old, with an average height of 167.1 cm and an average weight of 57.2 kg. The sample covered a range of ages within the young adult group and included different genders, enabling an initial exploration of fatigue characteristics among drivers in this demographic. Each subject completed a driving task under different fatigue-inducing conditions, and subjective fatigue assessments were conducted before and after the experiment to validate the correlation between physiological and behavioral data with fatigue status.
During the experiment, various physiological data were collected, including heart rate, brainwaves, EMG, and pupil diameter. These data were combined with driving behavior data, such as posture changes, steering wheel operation, and vehicle acceleration, to analyze driver fatigue. The data were recorded using computers installed with ErgoLAB software(Version 3.0), eye-tracking software(Version 3.0), and Scaner software(Version 3.0), as well as mobile phones equipped with DataLogger software(Version 3.0). EMG data were collected from the right tibialis anterior muscle, left/right radial wrist extensors, and left/right trapezius muscles. Subjective fatigue state assessments were recorded using the KSS, filled out by the drivers.
2.3. Data Processing Methods
EMG data were analyzed using the ErgoLAB software(Version 3.0) for time-domain analysis, which treats the EMG signals as time functions. The main characteristics analyzed included the average EMG value, maximum value, minimum value, variance, integrated EMG, mean absolute value, range, and root mean square. These indicators were used to better understand muscle fatigue and activity patterns. Heart rate data analysis was based on heart rate (HR) indicators, and the ErgoLAB software(Version 3.0) was used to perform frequency-domain analysis on heart-beat interval signals. This allowed for quantitative assessments of the regulatory effects of the sympathetic and parasympathetic nervous systems. EEG data were analyzed using 16 channels, with the brain regions divided according to the international 10–20 electrode system. The average power in each brain region was calculated, and the relative power in the Theta, Alpha, and Beta frequency bands was extracted to reveal activity states in different brain regions. Pupil diameter data were analyzed using the wireless eye tracker, obtaining the maximum, minimum, and average pupil diameters over different time periods.
Behavioral data were processed using the ErgoLAB platform(Version 3.0), which recorded videos of the subjects during the driving process. Behavioral coding was used to quantify and observe individual behaviors. Two types of behaviors were defined in this experiment: “leaning forward posture” and “leaning back posture.” The frequency of these behaviors was quantified (times per minute), providing indicators for evaluating fatigue levels.
Vehicle data were processed using sensors placed on the simulator’s steering wheel and pedals. The ErgoLAB VRX platform(Version 3.0) was used to record vehicle data, such as speed, acceleration, throttle usage, steering wheel angle, and lane deviation during the experiment. Total acceleration was measured in the X, Y, and Z directions, and the acceleration was categorized into four levels: Weak (0–0.4 m/s2), General (0.4–0.8 m/s2), Strong (0.8–1.2 m/s2), and Rapid (>1.2 m/s2). Throttle usage was recorded as a percentage of how much the pedal was pressed (0–100%).
3. Results
3.1. Descriptive Statistics
This section provides detailed statistical descriptions of 13 indicators from physiological, behavioral, and vehicle data collected during the driving process. Trends of each indicator over time are displayed in graphs to analyze changes in driver fatigue levels at different time points. To ensure data accuracy and reduce interference from random factors, the data were averaged over 10 periods, each lasting 5 min.
3.1.1. Behavioral Data
As driving time increased, the frequency of posture changes by the drivers increased, indicating a gradual increase in fatigue. Drivers showed symptoms such as reduced patience and irritability, which suggested they were reluctant to continue driving. Figure 2 shows the box plot for the frequency of forward posture changes. It can be seen that the frequency of posture changes significantly increased as time progressed.
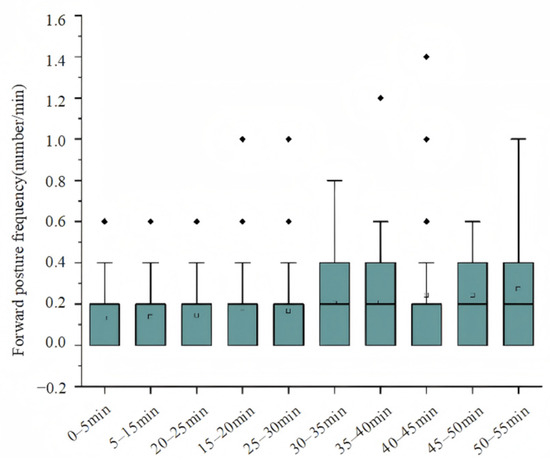
Figure 2.
Box plot of forward posture frequency. Both median and interquartile range increase significantly from 0–5 min to 45–50 min, indicating more frequent body adjustments due to fatigue accumulation.
3.1.2. Physiological Data
Physiological data include heart rate, pupil diameter, EMG signals, and EEG signals.
Heart rate data showed a slight decrease as the driving time lengthened. This indicates that the driving process became less novel and more monotonous, and task difficulty decreased. Figure 3a shows the box plot for heart rate. Heart rate was higher at the beginning of the driving task and gradually decreased over time. However, this decrease in heart rate could also be attributed to other factors, as studies have pointed out that heart rate can drop under stress or tension.
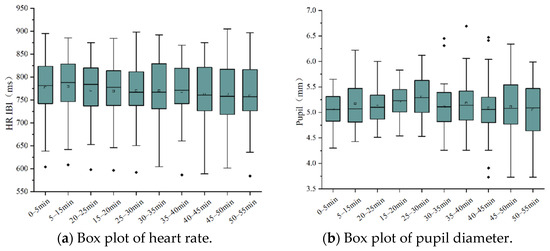
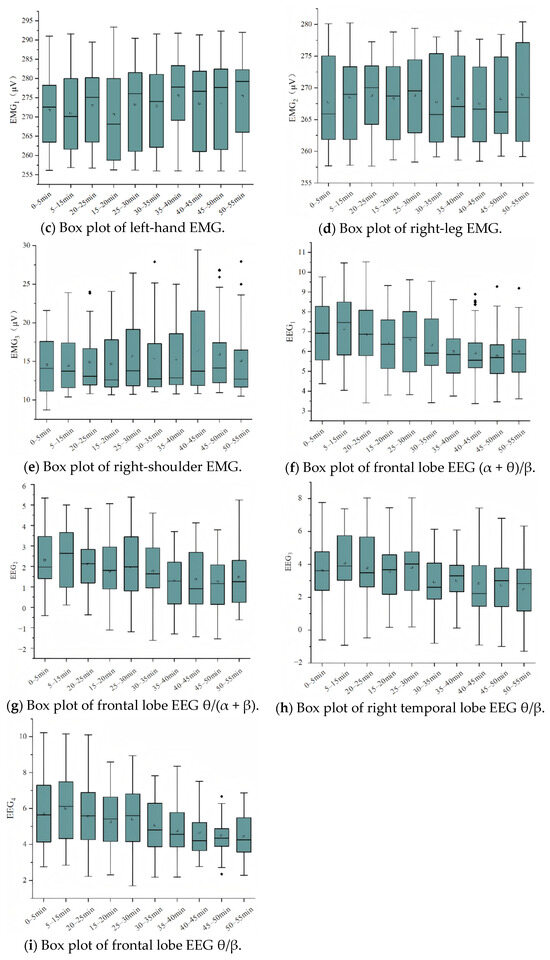
Figure 3.
Box plot of physiological data.
Pupil diameter reflects an individual’s alertness and fatigue level. Pupil diameter tends to remain stable when the subject is awake but gradually decreases as they become fatigued. The box plot of pupil diameter in Figure 3b demonstrates this trend. As drivers became more fatigued, pupil diameter decreased, indicating reduced alertness.
Figure 3c–e show box plots for left-hand EMG, right-leg EMG, and right-shoulder EMG. The maximum and average values of EMG signals from the left hand, right leg, and right shoulder increased as driving time progressed, indicating that muscle load increased as the driving time extended.
The ratio of (α + θ)/β in EEG signals is sensitive to detecting driving fatigue. Figure 3f–i show the trends of EEG indicators in the frontal lobe and right temporal lobe. The experiment demonstrated that EEG indicators in all categories gradually decreased with extended driving time, indicating an increase in drowsiness and a significant reduction in brain activity frequencies in monotonous driving environments.
3.1.3. Vehicle Data
Changes in vehicle acceleration and throttle press ratio also reflected the driver’s fatigue level. Figure 4a–c show box plots for acceleration states and throttle press states. At the beginning of the driving task, drivers were more cautious, frequently accelerating and decelerating rapidly. As time progressed, they became more accustomed to the driving conditions, and the frequency and magnitude of speed changes decreased. However, toward the end of the experiment, drivers displayed signs of obvious fatigue, with rapid acceleration and deceleration reappearing, along with frequent pressing of the throttle and brake.

Figure 4.
Box plot of vehicle data.
3.2. Normality Test for Indicators
The normality test was conducted on the selected data, and the results show that none of the 13 indicators followed a normal distribution. Therefore, non-parametric testing methods were chosen for variance analysis. The paired Wilcoxon signed-rank test was used to evaluate the variance differences of each parameter under different respiratory resistance conditions. Table 1 summarizes the asymptotic significance for each parameter under different respiratory resistance levels. The results show significant differences in these indicators under different respiratory resistance conditions (p < 0.05), indicating that these indicators are effective for assessing driver fatigue under varying respiratory resistance.

Table 1.
Asymptotic significance of parameters under different respiratory resistance levels.
3.3. Analysis of Driving Fatigue Factors
3.3.1. Factor Extraction and Naming
Factor analysis is a method used to extract representative common factors from a group of variables and ascribe them appropriate names, ensuring the accuracy of the analysis. Before conducting factor analysis, a suitability test must be performed on the research data, using the Kaiser–Meyer–Olkin (KMO) test and Bartlett’s test of sphericity to evaluate the data’s appropriateness for factor analysis, and the results are shown in Table 2. A KMO value exceeding 0.8 indicates that the data are very suitable for factor analysis, while a value between 0.7 and 0.8 suggests good suitability, and a value below 0.6 indicates the data are unsuitable. Additionally, a p-value of less than 0.05 in the Bartlett test confirms that the data are appropriate for factor analysis.

Table 2.
KMO and Bartlett spherical test table.
In this study, SPSS 26.0 was used to perform the KMO and Bartlett tests, with the KMO value found to be 0.607 and the p-value of the Bartlett test lower than 0.05, confirming that the data met the conditions for factor analysis.
Using SPSS 26.0, a principal component analysis was performed on the factor load matrix, extracting five factors. The factors were named as follows: brain activity, stability, road condition, patience level, and emergency level. These factors represent the subject’s brain activity, driving stability, driving behavior, posture changes, and emergency response levels.
3.3.2. Factor Rotation and Interpretation
Maximum variance rotation (Varimax) was applied to simplify the interpretation of the factors, maximizing the variance load of each variable to clarify their relationships with the extracted factors. According to Table 3 and Table 4, five common factors were identified: the brain activity factor (F1) includes four EEG indicators; the stability factor (F2) includes heart rate, pupil diameter, right-leg EMG, and General acceleration; the road condition factor (F3) includes left-hand EMG, right-shoulder EMG, and throttle press ratio; the patience level factor (F4) includes forward posture frequency and right-leg EMG; and the emergency level factor (F5) includes Rapid acceleration as the primary indicator.

Table 3.
Total variance of interpretation.

Table 4.
Rotational component matrix.
3.3.3. Factor Score Calculation
After extracting five common factors, regression analysis was used to calculate the component score coefficient matrix, as shown in Table 5.

Table 5.
Factor score matrix table.
Equations (1)–(6) present the comprehensive scoring functions based on the factor scores, which allow for the calculation of each factor score under three experiments.
- Brain Activity Factor (F1)
- 2.
- Stability Factor (F2)
- 3.
- Road Condition Factor (F3)
- 4.
- Patience-Level Factor (F4)
- 5.
- Emergency-Level Factor (F5)
- 6.
- Comprehensive Score
3.3.4. Driving Fatigue Factor Analysis
- Brain Activity Factor (F1)
As driving time increases, Figure 5 shows that the brain activity factor gradually decreases, indicating that fatigue reduces brain excitation, which is detrimental to driving safety. Mental load interference leads to a deviation between driving behavior and actual performance. When this exceeds a certain threshold, it intensifies the impact of driving time on fatigue. Prolonged driving accumulates brain activity load, and driving efficiency rapidly declines. Appropriate rest can alleviate this fatigue after a break. The research by Russo et al. [28] has shown that fatigue is related to brain networks, especially damage to the frontal–thalamic pathway. Multiple studies included in the systematic review by Scarpelli et al. [29] indicated that there are significant differences in brain activity patterns between older drivers and younger groups, which directly affect the variation characteristics of F1 and the performance of fatigued driving. Future studies need to validate F1 across a broader age range to improve the generalizability of the model.
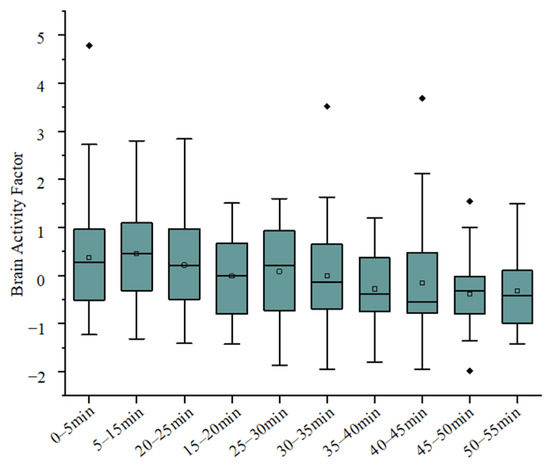
Figure 5.
Trend chart of brain activity factor.
- 2.
- Stability Factor (F2)
The stability factor in Figure 6 shows relatively small changes in its mean value as fatigue increases. However, its minimum value gradually decreases, suggesting that fatigue may intermittently reduce stability. As the driving time lengthens, physical load increases, leading to a drop in driving efficiency. Physical activities, such as standing or low-intensity movements, have been shown to significantly enhance cognitive function during driving, and maintaining the same posture for extended periods may increase fatigue. Zeigler et al. [30] used linear mixed models to examine changes in systolic and diastolic blood pressure and used chi-squared methods to analyze differences in the frequency of blood pressure load. They found that engaging in 2.5 h of light physical activity or standing, as opposed to sitting, during an 8-hour workday effectively reduced dynamic blood pressure during and after work. Height and weight are related to F2’s key indicators (e.g., minimum value trends, driving stability fluctuations). This aligns with Puspasari et al. [31], who found a higher BMI (directly related to weight) affects drivers’ physiological states, possibly accelerating intermittent stability decline (e.g., F2 minimum drop) by altering physical load distribution. Heavier drivers may face more frequent stability drops from physical load, while taller individuals may show different postural fatigue patterns. Future research should expand samples to verify F2’s robustness across height/weight groups.
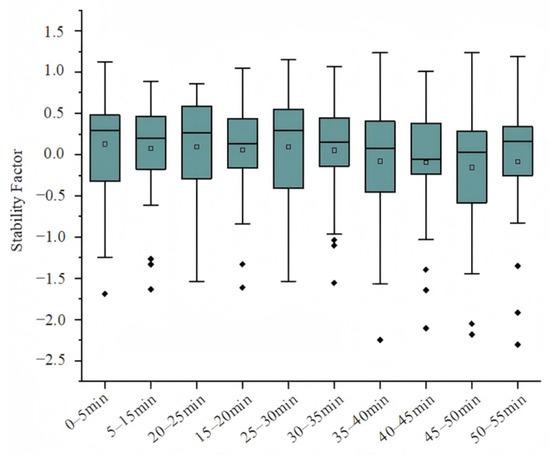
Figure 6.
Trend chart of stability factor.
- 3.
- Road Condition Factor (F3)
Road condition factors refer to driver behavioral responses (e.g., muscle activity, throttle usage) under different road conditions. As time progresses, the road condition factor data in Figure 7 becomes more concentrated, indicating that drivers become more familiar with road conditions and drive more stably. Driver behavioral responses (e.g., muscle activity, throttle usage) under different road conditions. However, when road conditions become particularly difficult, the road condition factor, together with the driving time factor, can significantly contribute to driving fatigue. Poor road conditions increase the challenges of driving, leading to reduced efficiency and accuracy, which accelerates fatigue. Over time, drivers’ fatigue increased significantly under poor road conditions, and their driving efficiency dropped rapidly. Improving lighting conditions can reduce the collision rate by about 30% or more [32], indicating that good lighting conditions are critical to improving driving safety.
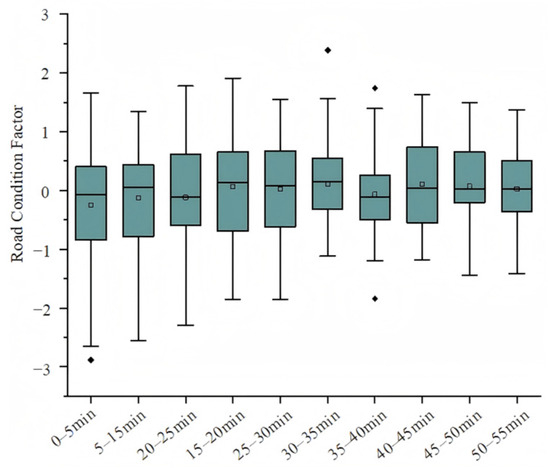
Figure 7.
Trend chart of road condition factor.
- 4.
- Patience-Level Factor (F4)
As shown in Figure 8, the distribution of the patience-level factor becomes more scattered, indicating increased variability in driver patience with fatigue. The frequency of posture changes during driving. Specifically, the patience-level factor reflects the driver’s behavioral stability under fatigue, quantified by monitoring the frequency of posture variations; an increase in posture change frequency corresponds to a decrease in patience level. This increased variability in the patience factor indicates growing uncertainty in driving behavior, which negatively impacts driving safety. Prolonged driving leads to deviations between intended actions and actual performance, but appropriate rest can help restore patience levels.
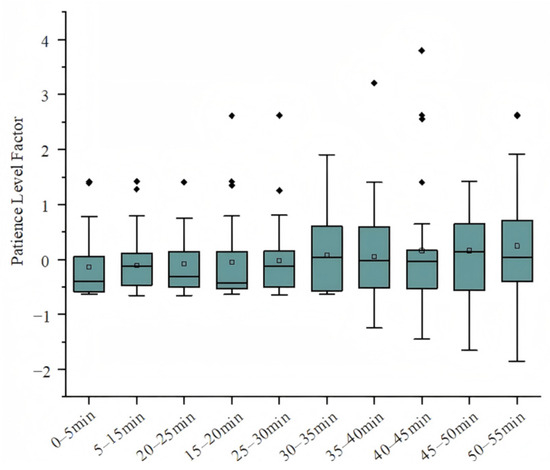
Figure 8.
Trend chart of patience-level factor.
- 5.
- Emergency-Level Factor (F5)
The emergency-level factor in Figure 9 fluctuates during driving, increasing in response to emergencies and decreasing during smoother driving conditions. These fluctuations grow more pronounced as fatigue sets in, suggesting that drivers become more reactive to emergencies and less attentive to routine driving tasks. Frequent emergency responses can contribute to increased fatigue. In their research, Olson et al. [33] identified 4452 safety-critical events, including collisions, near-collisions, collision-related conflicts, and unintended lane departures, as well as 19,888 baseline events. They found that, in most safety-critical events, the driver was performing tasks unrelated to driving. Additionally, the risk of driving significantly increased when performing complex tasks, and eye-tracking analysis revealed that the driver’s gaze position and attention to the road ahead were related to task execution.
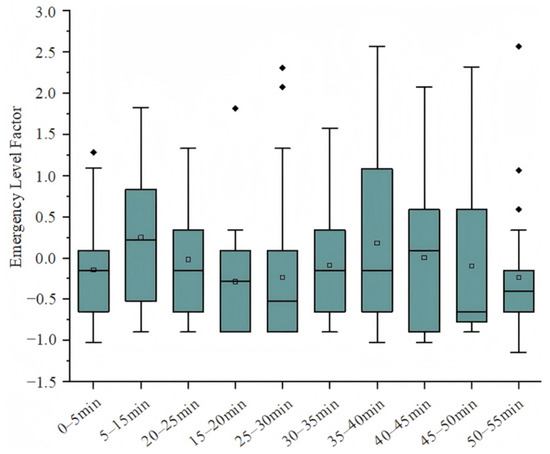
Figure 9.
Trend chart of emergency-level factor.
3.4. Grading of Driving Fatigue Levels
In this study, driving fatigue was divided into four levels, as follows: alert, mild fatigue, moderate fatigue, and severe fatigue. The K-means clustering analysis method achieved a favorable balance between analytical accuracy and computational feasibility, making it well-suited for the integration and stratification of multimodal physiological and behavioral datasets in this study. The K-means clustering analysis method was then applied to cluster the data from the five fatigue factors, determining specific thresholds for the four fatigue levels. Based on the values of the driver’s representative indicators, the fatigue level was preliminarily determined.
3.4.1. Standardization Process and Distance Calculation
In actual clustering operations, the Euclidean distance was used as the basis for calculating the similarity between data points, as shown in Equation (7). Each sample’s observation values for its various indicators were treated as coordinates in a p-dimensional space, and the distance between samples was calculated accordingly.
3.4.2. Clustering Analysis Results
The variance analysis results are shown in Table 6. The mean square error, also known as standard deviation, is the arithmetic square root of the arithmetic average of the squared deviations. It can be considered a measure of uncertainty, and the formula is as follows:

Table 6.
Factor variance results.
During repeated measurements, the standard deviation of the resulting dataset is a key indicator of measurement accuracy. When determining whether the actual measurement results are consistent with the expected values, the standard deviation plays a crucial role. Specifically, if the deviation of the average measurement result from the expected value exceeds the standard deviation, it can be considered that there is significant inconsistency between the two.
The analysis of variance results in Table 6 showed that the five extracted fatigue factors contributed significantly to the clustering process, with the most important factors being the stability factor (F2) and the emergency-level factor (F5), followed by the road condition factor (F3), patience-level factor (F4), and brain activity factor (F1). This suggests that stability and emergency response levels are the most significant contributors to distinguishing between different levels of driving fatigue.
3.4.3. Fatigue-Level Classification
In the iterative process, the distance from each data point to the initial cluster center was first measured, and the data points were assigned to the corresponding cluster based on the nearest-neighbor principle. Then, the center of the newly formed clusters was recalculated, and the distance from each data point to the new center was recomputed. This process was repeated until the convergence criterion was met, or a specified number of iterations was reached, completing the classification. The iteration results are shown in Table 7 where the changes in the cluster centers approach zero after five iterations, thus terminating the process.

Table 7.
Cluster center points.
The cluster centers shown in Table 7 were derived from the original dataset (F1–F5). Based on the original data, we plotted the elbow curve and calculated the silhouette score (Silhouette Score > 0.5). The results indicate that, when K = 4, the clustering quality is good, with high intra-cluster similarity and clear inter-cluster separation, demonstrating the robustness of the clustering results.
Based on the clustering results in Table 7, the thresholds for the five factors at different fatigue levels were determined, as shown in Table 8, enabling the classification of driver fatigue into four levels: alert, mild fatigue, moderate fatigue, and severe fatigue. The thresholds provide a clear range for each factor, allowing for more precise identification of the driver’s fatigue state.

Table 8.
Threshold range of each factor under different fatigue degree.
3.5. Driving Fatigue Assessment Model
Based on research in the field of fuzzy theory, a fuzzy comprehensive evaluation method was used to assess the degree of driving fatigue under different levels of breathing resistance. A fatigue assessment model based on five factors was developed.
3.5.1. Model Development
Based on fuzzy mathematics, driver fatigue scores were set within a continuous range from 0 to 1, where 0 represents full alertness and 1 represents deep sleep. Considering existing research on driving fatigue and the purpose of this study, four levels of fatigue were initially determined, as shown in Table 9. These ranges were based on extensive driving data analysis and scientific evaluation of driver fatigue, and future refinements will be made as more experimental data and theoretical insights are gathered to more accurately reflect the driver’s fatigue state.

Table 9.
The value range of fatigue degree of different grades.
Using the fuzzy comprehensive evaluation method, the degree of driver fatigue under different levels of breathing resistance was assessed. First, the set of factors for determining driving fatigue was defined as follows:
where F1 is the tolerance level factor, F2 is the stable activity factor, F3 is the emergency response factor, F4 is the brain activity factor, and F5 is the road condition factor.
Next, the set of evaluation labels for assessing driving fatigue was defined as:
where v1 represents the alert state, v2 represents mild fatigue, v3 represents moderate fatigue, and v4 represents severe fatigue.
3.5.2. Entropy Weight Method for Weight Calculation
During the comprehensive evaluation process, the entropy weight method assigns weights based on the degree of dispersion of the indicators. In this method, indicators with lower information entropy have higher variability and contain more information, thereby carrying more weight in the evaluation system. Conversely, indicators with higher information entropy carry less weight due to their lower variability and insufficient information content.
As an objective weight assignment method, the core of the entropy value method is to determine the weight based on the degree of dispersion of the indicator values. This method reduces the potential errors that could arise from subjective judgment, making it more accurate and objective than subjective weighting methods, and better reflecting the evaluation results. The existing literature demonstrates that entropy weighting methods generally exhibit robustness, with minor variations in weights resulting in negligible effects on ranking stability [34]. Accordingly, the model outputs presented in this paper can be considered reliable under small perturbations of the weighting scheme.
- (1)
- Calculate the Proportion
After standardizing the data for each indicator, the value is the proportion of the j-th indicator in the i-th set of experimental data, calculated as:
- (2)
- Calculate the Information Entropy
The information entropy of each indicator is calculated as:
- (3)
- Calculate the Weights
The results show that the importance of the five factors is ranked as follows: brain activity factor > tolerance-level factor > stable activity factor > road condition factor > emergency response factor. The weight vector for the five factors is:
where w1 is the tolerance level factor, w2 is the stable activity factor, w3 is the emergency response factor, w4 is the brain activity factor, and w5 is the road condition factor.
3.5.3. Construct the Membership Matrix
The membership matrix for each indicator is constructed as follows:
where rij represents the membership of the i-th indicator for the j-th evaluation label. Based on the threshold ranges of the indicators in different levels of fatigue states, as shown in Table 8, the membership of each indicator is precisely defined for the corresponding evaluation labels (i.e., different levels of fatigue). Specifically, when the value of an indicator falls within the threshold range for the corresponding factor, its membership is equal to 1; otherwise, its membership is equal to 0.
In the fuzzy comprehensive evaluation of driving fatigue, the evaluation result obtained through the membership matrix reveals the overall state of the driver’s fatigue. The evaluation result is:
Based on Table 9, the average value of each fatigue-level range is selected as the score vector A, from which the following can be derived:
Using the above formula, a model can be constructed to calculate the driver’s fatigue index under different mask resistance conditions:
3.5.4. Fatigue Assessment Results
To verify the accuracy of the entropy weight method in calculating fatigue scores, the calculated scores were compared with the results from the subjective evaluation tool (the Stanford Sleepiness Scale). As shown in Table 10, the fatigue index calculation results under different breathing resistance conditions using the constructed driving fatigue assessment model are highly consistent with the evaluation results of the Stanford Sleepiness Scale, as detailed in Table 11, Table 12 and Table 13. This indicates that the constructed model can effectively reflect the driver’s fatigue level under different conditions.

Table 10.
Fatigue assessment model accuracy verification method.

Table 11.
Fatigue assessment results for breathing resistance < 45 Pa.

Table 12.
Fatigue assessment results for 45≤ breathing resistance <130 Pa.

Table 13.
Fatigue assessment results for breathing resistance ≥130 Pa.
3.5.5. Entropy Weight Method Model Assessment Results
4. Discussion
When assessing the driving fatigue model, the following grading standards were applied: situations that fully meet the standard are scored at 100%, situations that mostly meet the standard are scored at 60%, and situations that do not meet the standard are scored at 0%. Based on these standards, the calculated accuracy of the model is 70.2%. This performance is comparable to existing EEG-based fatigue detection systems—Cui et al. [35] report 73.22% cross-subject accuracy using a compact CNN over single-channel EEG data. In addition, Chen et al. [36] reviewed recent multimodal approaches leveraging diverse physiological signals through flexible, high-sensitivity biosensors to enable continuous, real-time monitoring. While our system focuses on EEG-based analysis, its competitive accuracy suggests strong potential for integration into such multimodal wearable platforms.
The study included four male and six female participants (60% female). Despite the small sample size, preliminary trends in gender differences were observed: female participants showed a slightly greater average reduction in pupil diameter (18.2%) during late fatigue (45–50 min) compared to males (14.5%), while males exhibited more significant fluctuations in EMG signals (e.g., right radial wrist extensors) with a variance of 1.23 versus 0.89 in females. These differences may relate to gender-specific variations in physiological load tolerance, potentially mediated by body composition. Due to the limited sample size, no statistical tests were performed; future studies with larger samples should validate whether gender modulates the fatigue assessment model.
One notable limitation is the homogeneous sample, restricted to young adults (21–28 years old) without stratification by BMI. Age and BMI are known to influence physiological responses to fatigue: older individuals often show distinct brain activity and fatigue accumulation patterns, while BMI can affect muscle load and cardiovascular reactions during prolonged driving. This may limit the model’s accuracy for middle-aged/elderly populations or those with extreme BMI. Future studies will expand to broader age ranges (e.g., 20–60 years old) and diverse BMI categories (underweight to obese) to enhance generalizability.
In practical deployment, challenges related to the experimental setup merit attention. The ErgoLAB EEG device (16-channel) and Tobii Pro Glasses 3, while effective for data collection, present issues of intrusiveness due to their bulk and requirement for direct contact, which may hinder real-world applicability. It should be noted that the current experimental setup was conducted in a controlled environment, which does not fully replicate standard vehicle driving conditions. This may limit the direct applicability of the model in real-world scenarios. To facilitate practical deployment, non-invasive alternatives could be explored, such as steering wheel-integrated EMG sensors or in-cabin cameras for remote pupil tracking. Integrating these modalities may allow replication of the experimental conditions in standard vehicles while maintaining the model’s predictive performance. Future studies will aim to validate the model under actual driving conditions, ensuring its reliability and applicability beyond controlled laboratory settings.
5. Conclusions
This study collected and analyzed physiological and behavioral data to explore drivers’ responses under different fatigue conditions. The aim was to establish an effective model for assessing driving fatigue. Through an experimental design, physiological indicators, such as HR, EMG, EEG and pupil diameter, as well as behavioral indicators like posture changes, vehicle acceleration, and throttle press ratios, were comprehensively assessed.
Key conclusions include the following:
- Sensitivity of Physiological and Behavioral Indicators. Physiological indicators such as HR, EMG, EEG, and pupil diameter showed high sensitivity in detecting driving fatigue. As the driving time increased and fatigue levels deepened, these indicators exhibited significant changes, accurately reflecting the development of fatigue. Additionally, behavioral data, such as posture change frequency, vehicle acceleration, and throttle usage, also effectively revealed the correlation between driving behavior and fatigue.
- Effectiveness of Multimodal Data Integration. The integration of multiple physiological and behavioral indicators significantly improved the accuracy and reliability of fatigue detection. Compared to single-indicator monitoring methods, the fusion of multimodal data allowed for a more comprehensive understanding of driver fatigue, capturing subtle changes in fatigue development. This provides strong data support for building a robust driver monitoring system.
- Establishment of a Comprehensive Fatigue Assessment Model. A comprehensive fatigue assessment model was successfully established based on the collected physiological and behavioral data. The model was validated through experiments, demonstrating its effectiveness in the real-time evaluation of driver fatigue levels. The model’s ability to adapt to different driving conditions makes it a valuable tool for future fatigue detection systems and for developing fatigue prevention strategies.
This research provides new methods and tools for assessing and monitoring driving fatigue, showing the potential applications of multimodal data integration in the field of driving safety. Future research could focus on optimizing the model further, exploring additional fatigue prevention mechanisms, and offering comprehensive solutions for improving driving safety.
Author Contributions
Conceptualization, G.Z. and Z.S.; methodology, G.Z.; software, Z.S.; validation, G.Z., Z.S. and X.-L.L.; formal analysis, W.L.; investigation, K.L.; resources, W.L.; data curation, G.Z., Z.S. and X.-L.L.; writing—original draft preparation, G.Z., Z.S. and X.-L.L.; writing—review and editing, G.Z., Z.S. and X.-L.L.; visualization, W.L. and K.L.; supervision, Z.S.; project administration, Z.S.; funding acquisition, G.Z. All authors have read and agreed to the published version of the manuscript.
Funding
This research received no external funding.
Data Availability Statement
The original contributions presented in this study are included in the article. Further inquiries can be directed to the corresponding author.
Conflicts of Interest
The authors declare no conflicts of interest.
Abbreviations
The following abbreviations are used in this manuscript:
| EEG | Electroencephalography |
| EMG | Electromyography |
| KSS | The Karolinska Sleepiness Scale |
| ORS | The Observer-Rated Sleepiness |
| DMS | Driver Monitoring Systems |
| EOG | Electrooculography |
| ECG | Electrocardiogram |
| CART | Classification and Regression Trees |
| HMI | Human–Machine Interface |
| HR | Heart rate |
| KMO | Kaiser–Meyer–Olkin |
References
- Liu, G.; Chen, S.; Zeng, Z.; Cui, H.; Fang, Y.; Gu, D.; Yin, Z.; Wang, Z. Risk factors for extremely serious road accidents: Results from national Road Accident Statistical Annual Report of China. PLoS ONE 2018, 13, e201587. [Google Scholar] [CrossRef] [PubMed]
- Lal, S.K.L.; Craig, A. A critical review of the psychophysiology of driver fatigue. Biol. Psychol. 2001, 55, 173–194. [Google Scholar] [CrossRef]
- Zhu, H.; Ukai, M.; Zhang, F.; Yu, C.W. Mental fatigue evaluations in indoor environment. Indoor Built Environ. 2024, 34, 499–504. [Google Scholar] [CrossRef]
- Du, X.; Zhao, S.; Zhang, D.; Yu, Y. Comparative analysis of light environment perception, eye movement and physiology in university professional classroom based on virtual reality experiment. Indoor Built Environ. 2023, 32, 1152–1169. [Google Scholar] [CrossRef]
- Wu, J.; Pana, Z.; Liua, Y.; Chena, Q.; Zang, F.; Chabebea, A.; Xue, C. Non-visual Effects of Road Lighting CCT on Driver’s Mood, Alertness, Fatigue and Reaction Time: A Comprehensive Neuroergonomic Evaluation Study. arXiv 2023, arXiv:2306.07293. [Google Scholar]
- He, J.; Li, Z.; Ma, Y.; Sun, L.; Ma, K.-H. Physiological and Behavioral Changes of Passive Fatigue on Drivers during On-Road Driving. Appl. Sci. 2023, 13, 1200. [Google Scholar] [CrossRef]
- Kovalenko, S.; Mamonov, A.; Kuznetsov, V.; Bulygin, A.; Shoshina, I.; Brak, I.; Kashevnik, A. OperatorEYEVP: Operator Dataset for Fatigue Detection Based on Eye Movements, Heart Rate Data, and Video Information. Sensors 2023, 23, 6197. [Google Scholar] [CrossRef]
- Qi, M.-S.; Yang, W.-J.; Xie, P.; Liu, Z.-J.; Zhang, Y.-Y.; Cheng, S.-C. Driver fatigue assessment based on the feature fusion and transfer learning of EEG and EMG. In Proceedings of the 2018 Chinese Automation Congress (CAC), Xi’an, China, 30 November–2 December 2018; IEEE: Piscataway, NJ, USA, 2018; pp. 1314–1317. [Google Scholar]
- Zhang, Y.; Ma, J.; Zhang, C.; Chang, R. Electrophysiological frequency domain analysis of driver passive fatigue under automated driving conditions. Sci. Rep. 2021, 11, 1–9. [Google Scholar] [CrossRef]
- Shenal, B.V.; Radonovich, L.J.; Cheng, J.; Hodgson, M.; Bender, B.S. Discomfort and exertion associated with prolonged wear of respiratory protection in a healthcare setting. J. Occup. Environ. Hyg. 2012, 9, 59–64. [Google Scholar] [CrossRef]
- Lu, K.; Dahlman, A.S.; Karlsson, J.; Candefjord, S. Detecting driver fatigue using heart rate variability: A systematic review. Accid. Anal. Prev. 2022, 178, 106830. [Google Scholar] [CrossRef] [PubMed]
- Mashko, A. Subjective Methods for Assessment of Driver Drowsiness. Acta Polytech. Ctu Proc. 2017, 12, 64–67. [Google Scholar] [CrossRef][Green Version]
- Li, R.; Chen, Y.V.; Zhang, L. A method for fatigue detection based on Driver’s steering wheel grip. Int. J. Ind. Ergonom. 2021, 82, 103083. [Google Scholar] [CrossRef]
- Liu, Y.; Wu, T. Fatigued driver’s driving behavior and cognitive task performance: Effects of road environments and road environment changes. Saf. Sci. 2009, 47, 1083–1089. [Google Scholar] [CrossRef]
- Abdul Razak, S.F.; Yogarayan, S.; Abdul Aziz, A.; Abdullah, M.F.A.; Kamis, N.H. Physiological-based Driver Monitoring Systems: A Scoping Review. Civ. Eng. J. 2022, 8, 3952–3967. [Google Scholar] [CrossRef]
- Chang, W.; You, F. The Recognition of Driver’s Fatigue States Based on SSD Neural Network. In Proceedings of the 2020 4th International Conference on Electronic Information Technology and Computer Engineering (EITCE 2020), Xiamen, China, 6–8 November 2020; pp. 560–564. [Google Scholar]
- Huang, Y.-C.; Li, L.-P.; Liu, Z.-G.; Zhu, H.-Y.; Zhu, L. Assessment of Urban Railway Transit Driver Workload and Fatigue under Real Working Conditions. Transport. Res. Rec. 2019, 2673, 891–900. [Google Scholar] [CrossRef]
- Cao, S.; Feng, P.; Kang, W.; Chen, Z.; Wang, B. Optimized Driver Fatigue Detection Method Using Multimodal Neural Networks. Sci. Rep. 2025, 15, 12240. [Google Scholar] [CrossRef]
- Li, W.; Pi, X.; Tang, H.; Qiu, J. Multimodal Fatigue Detection in Drivers via Physiological and Visual Signals. In Artificial Intelligence Security and Privacy; Lecture Notes in Computer Science; Springer: Cham, Switzerland, 2024; pp. 221–236. [Google Scholar]
- Ahmed, S.G.; Verbert, K.; Siedahmed, N.; Alnajjar, F.S. AI Innovations in rPPG Systems for Driver Monitoring: Comprehensive Systematic Review and Future Prospects. Sensors 2025, 25, 1189. [Google Scholar] [CrossRef]
- Zhou, F.; Alsaid, A.; Blommer, M.; Curry, R.; Swaminathan, R.; Kochhar, D.; Talamonti, W.; Tijerina, L. Predicting Driver Fatigue in Automated Driving with Explainability. arXiv 2021, arXiv:2103.02162. [Google Scholar] [CrossRef]
- Leon, C.C.K.; Zeng, H. Dual-Sensing Driving Detection Model. arXiv 2025, arXiv:2505.17392. [Google Scholar] [CrossRef]
- Silversmith, D.; Perkons, N.; Jordan, K.; Brooks, J.; Hairston, W.; Kerick, S.; Lance, B.; McDowell, K.; Nothwang, W. Fusing Multiple Sensor Modalities for Complex Physiological State Monitoring; Technical Report December, DTIC Document; Army Research Laboratory: Adelphi, MD, USA, 2012. [Google Scholar]
- Małecki, K.; Nowosielski, A.; Forczmański, P. Multispectral Data Acquisition in the Assessment of Driver’s Fatigue. In Proceedings of the Conference on Transport Systems Telematics, Katowice-Ustroń, Poland, 5–8 April 2017; pp. 320–332. [Google Scholar]
- Peng, Z.; Wang, Y.; Luo, X. How does financial burden influence the crash rate among taxi drivers? A self-reported questionnaire study in China. Traffic. Inj. Prev. 2020, 21, 324–329. [Google Scholar] [CrossRef]
- Tavakoli Kashani, A.; Rakhshani Moghadam, M.; Amirifar, S. Factors affecting driver injury severity in fatigue and drowsiness accidents: A data mining framework. J. Inj. Violence Res. 2022, 14, 75–88. [Google Scholar] [PubMed]
- Mollicone, D.; Kan, K.; Mott, C.; Bartels, R.; Bruneau, S.; van Wollen, M.; Sparrow, A.R.; Van Dongen, H.P. Predicting performance and safety based on driver fatigue. Accid. Anal. Prev. 2019, 126, 142–145. [Google Scholar] [CrossRef]
- Russo, M.; Calamuneri, A.; Cacciola, A.; Bonanno, L.; Naro, A.; Dattola, V.; Sessa, E.; Buccafusca, M.; Milardi, D.; Bramanti, P.; et al. Neural correlates of fatigue in multiple sclerosis: A combined neurophysiological and neuroimaging approach (R1). Arch. Ital. Biol. 2017, 155, 142–151. [Google Scholar] [CrossRef]
- Scarpelli, S.; Alfonsi, V.; Gorgoni, M.; Camaioni, M.; Giannini, A.M.; De Gennaro, L. Age-Related Effect of Sleepiness on Driving Performance: A Systematic-Review. Brain Sci. 2021, 11, 1090. [Google Scholar] [CrossRef]
- Zeigler, Z.S.; Mullane, S.L.; Crespo, N.C.; Buman, M.P.; Gaesser, G.A. Effects of Standing and Light-Intensity Activity on Ambulatory Blood Pressure. Med. Sci. Sport. Exer. 2016, 48, 175–181. [Google Scholar] [CrossRef]
- Puspasari, M.A.; Pribadyo, C.Y.P.; Junistya, K.N. Analisis Hubungan Chronotype dan Body Mass Index (BMI) terhadap Tingkat Kantuk Pengemudi. J. Rekayasa Sist. Ind. 2023, 12, 105–112. [Google Scholar] [CrossRef]
- Jackett, M.; Frith, W. Quantifying the impact of road lighting on road safety—A New Zealand Study. IATSS Res. 2013, 36, 139–145. [Google Scholar] [CrossRef]
- Olson, R.L.H.R.; Hickman, J.S.B.J. Driver Distraction in Commercial Vehicle Operations; U.S. Department of Transportation: Washington, DC, USA, 2009.
- Žižović, M.; Albijanić, M. An Implementation of the Entropy Method for Determining Weighing Coefficients in a Multicriteria Optimization of Public Procurements. Spectr. Eng. Manag. Sci. 2025, 3, 28–44. [Google Scholar] [CrossRef]
- Cui, J.; Lan, Z.; Liu, Y.; Li, R.; Li, F.; Sourina, O.; Mueller-Wittig, W. A Compact and Interpretable Convolutional Neural Network for Cross-Subject Driver Drowsiness Detection from Single-Channel EEG. arXiv 2021, arXiv:2106.00613. [Google Scholar] [CrossRef] [PubMed]
- Chen, S.; Xu, S.; Fan, X.; Xiao, X.; Duan, Z.; Zhao, X.; Chen, G.; Zhou, Y.; Chen, J. Advances in 2D Materials for Wearable Biomonitoring. Mater. Sci. Eng. R Rep. 2025, 164, 100971. [Google Scholar] [CrossRef]
Disclaimer/Publisher’s Note: The statements, opinions and data contained in all publications are solely those of the individual author(s) and contributor(s) and not of MDPI and/or the editor(s). MDPI and/or the editor(s) disclaim responsibility for any injury to people or property resulting from any ideas, methods, instructions or products referred to in the content. |
© 2025 by the authors. Licensee MDPI, Basel, Switzerland. This article is an open access article distributed under the terms and conditions of the Creative Commons Attribution (CC BY) license (https://creativecommons.org/licenses/by/4.0/).