Abstract
Early and accurate detection of plant diseases is essential for ensuring food security and maintaining sustainable agricultural productivity. However, most deep learning models for plant disease classification rely heavily on large-scale annotated datasets, which are expensive, labor-intensive, and often impractical to obtain in real-world farming environments. To address this limitation, we propose a unified self-supervised learning (SSL) framework that leverages unlabeled plant imagery to learn meaningful and transferable visual representations. Our method integrates three complementary objectives—Bootstrap Your Own Latent (BYOL), Masked Image Modeling (MIM), and contrastive learning—within a ResNet101 backbone, optimized through a hybrid loss function that captures global alignment, local structure, and instance-level distinction. GPU-based data augmentations are used to introduce stochasticity and enhance generalization during pretraining. Experimental results on the challenging PlantDoc dataset demonstrate that our model achieves an accuracy of 77.82%, with macro-averaged precision, recall, and F1-score of 80.00%, 78.24%, and 77.48%, respectively—on par with or exceeding most state-of-the-art supervised and self-supervised approaches. Furthermore, when fine-tuned on the PlantVillage dataset, the pretrained model attains 99.85% accuracy, highlighting its strong cross-domain generalization and practical transferability. These findings underscore the potential of self-supervised learning as a scalable, annotation-efficient, and robust solution for plant disease detection in real-world agricultural settings, especially where labeled data is scarce or unavailable.
1. Introduction
Plant diseases are a major threat to global food security, leading to significant reductions in crop yield and quality. Early and accurate diagnosis is essential to guide timely interventions, but traditional approaches relying on manual scouting or laboratory testing are often labor-intensive, time-consuming, and inaccessible to farmers in remote or resource-limited regions. In recent years, deep learning methods have shown promise in automating plant disease detection through image classification. However, these models typically depend on large-scale, labeled datasets, which are difficult and expensive to collect in real-world agricultural contexts due to the need for expert annotation and the variability of disease expression in field conditions [1]. In this study, we use the term ‘detection’ to refer to disease identification and classification at the image level, rather than object localization or bounding box generation. Thus, our model does not perform region-based object detection but instead categorizes whole images into disease types.
Early methods of plant disease detection employed traditional computer vision techniques using handcrafted features like texture descriptors, color histograms, and shape metrics, coupled with classical classifiers such as Support Vector Machines (SVMs), decision trees, and k-nearest neighbors [2]. Although computationally efficient, these techniques often lacked robustness under varying real-world conditions due to sensitivity to lighting, occlusion, and background complexity.
The advancement of deep learning, particularly Convolutional Neural Networks (CNNs), has significantly improved plant disease classification. Models such as ResNet, DenseNet, and VGGNet facilitated hierarchical feature learning directly from raw image pixels, enhancing classification accuracy and robustness [3]. More recently, Transformer-based models like Vision Transformer (ViT) and Swin Transformer have further demonstrated strong performance in agricultural image analysis. However, supervised methods continue to face challenges related to the scarcity of labeled datasets in agriculture, where expert-labeled data is costly and time-consuming to obtain due to the diversity of crop species, growth stages, and symptom presentations.
Self-supervised learning (SSL) has emerged as a compelling alternative to mitigate the reliance on labeled data. Ref. [4] proposed a progressive SSL pipeline for cassava leaf disease recognition that combined object segmentation and triplet loss with fine-tuned CNNs, achieving strong performance with limited labeled data. Ref. [5] introduced a Self-Supervised Vision Transformer (SSVT) that uses patch-based masked reconstruction and contrastive objectives to model medical disease classification and severity grading. Ref. [6] developed DINOv2, a scalable SSL framework based on Vision Transformers, leveraging a teacher–student distillation setup to extract semantically rich representations from unlabeled imagery.
Ref. [7] provided a comprehensive review of SSL in the plant pathology domain, identifying hybrid approaches as the most effective. These methods combine multiple pretext tasks, such as reconstruction and contrastive learning, to improve feature robustness and transferability. Supporting this view, refs. [8,9] independently demonstrated that pairing masked image modeling with contrastive loss on Transformer backbones yields notable performance gains on large-scale plant disease datasets.
Contrastive methods such as SimCLR [10] and Bootstrap Your Own Latent (BYOL) [11] have also been applied to agricultural image tasks. SimCLR leverages contrastive loss with negative sampling to encourage instance-level separation, whereas BYOL, through dual-network alignment, eliminates the need for negative samples. Despite these advancements, current SSL techniques typically apply these methods in isolation.
To address these gaps, we propose a unified SSL framework integrating Bootstrap Your Own Latent (BYOL) for global representation alignment, Masked Image Modeling (MIM) for spatial feature reconstruction, and contrastive learning for instance-level discrimination. This customized multi-objective strategy is specifically tailored to the challenges of real-world agricultural imagery, enabling the model to capture global semantics, reconstruct occluded regions, and distinguish visually similar samples, all without relying on labeled supervision. The system is built on a ResNet-101 backbone and employs GPU-accelerated augmentations to generate diverse training views. A hybrid loss function combines cosine similarity (BYOL), pixel-level and perceptual loss (MIM), and InfoNCE loss (contrastive learning) into a single optimization objective, supporting robust feature learning for downstream plant disease classification tasks. Experimental validation on the challenging PlantDoc dataset [12], known for its noisy, field-captured images, and transfer learning evaluation on the PlantVillage dataset [13] highlight our model’s robust performance and strong cross-domain generalization, confirming the effectiveness of SSL as a scalable, annotation-efficient, and practical approach for plant disease detection in diverse agricultural settings.
Our main contributions are as follows:
- We propose a unified self-supervised framework integrating BYOL, MIM, and contrastive learning.
- We design a hybrid loss function that captures global, local, and instance-level information.
- We implement an efficient GPU-based augmentation pipeline for robust representation learning.
- We achieve state-of-the-art performance on challenging PlantDoc and Plant Village datasets without using labels during pretraining.
- We demonstrate strong generalization via transfer learning and provide interpretability through Grad-CAM and t-SNE.
2. Methodology
2.1. Overview of the Proposed Framework
As illustrated in Figure 1, the framework begins with stochastic image augmentations, which produce two views of each input. These are passed through three parallel SSL branches:
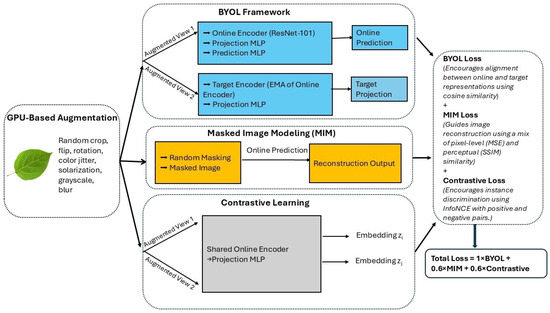
Figure 1.
Overview of the proposed multi-objective self-supervised learning framework for plant disease detection. The architecture unifies BYOL, MIM, and contrastive learning atop a ResNet-101 backbone. GPU-based augmentations generate diverse input views to support representation alignment, masked region reconstruction, and instance-level discrimination. The total training loss is computed as a weighted sum of the BYOL, MIM, and contrastive objectives. The novelty lies in their joint optimization within a single architecture, which is not explored in prior works.
- BYOL, where an online encoder learns to predict the projection of a momentum-updated target encoder;
- MIM, where masked inputs are reconstructed using a combination of pixel-wise accuracy and perceptual similarity;
- Contrastive learning, which brings positive pairs closer and pushes negative pairs apart in the embedding space.
The final loss is a weighted sum of the three objectives, promoting balanced representation learning across semantic, structural, and discriminative dimensions.
2.2. Model Architecture
2.2.1. Backbone Network and BYOL Framework
We employ ResNet101 [14], pretrained on ImageNet [15], as the visual feature extractor. The original classification head is replaced with a multilayer perceptron (MLP) projection head that outputs compact image embeddings. For label-free training, we adopt the Bootstrap Your Own Latent (BYOL) framework, which comprises two networks: an online encoder and a target encoder.
The online encoder is trained to predict the output of the target encoder, promoting representation consistency between two differently augmented views of the same image (e.g., via cropping, flipping, or blurring). Unlike contrastive learning methods, which rely on both positive pairs (from the same image) and negative pairs (from different images) to learn discriminative features, BYOL eliminates the need for negative samples. Instead, it learns by aligning one augmented view with another, allowing the model to extract meaningful representations without contrasting examples from different classes.
The target encoder is updated using an exponential moving average (EMA) of the online encoder’s parameters, which provides a stable learning target throughout training. The BYOL loss minimizes the cosine distance between the online prediction and the target projection :
This objective enables the model to learn semantically rich and robust features that are invariant to viewpoint, lighting, and background variations—conditions commonly encountered in real-world plant imagery.
2.2.2. Masked Image Modeling (MIM)
To enhance the model’s sensitivity to local structure and fine-grained visual patterns, we incorporate a Masked Image Modeling (MIM) objective inspired by the Masked Autoencoder (MAE) framework [16]. During training, a random mask is applied to each input image, occluding 30–60% of the pixels. The model is then tasked with reconstructing the original, unmasked image using only the visible regions.
To better suit fine-grained plant imagery, we employ a hybrid reconstruction loss that combines pixel-level and perceptual fidelity:
Here, mean squared error (MSE) penalizes raw pixel differences, while Structural Similarity Index Measure (SSIM) encourages the preservation of image structure, including texture, edges, and contrast. This hybrid loss ensures that reconstructed images maintain both numerical accuracy and perceptual coherence.
By compelling the model to infer contextual information in masked regions, this MIM objective promotes learning the underlying statistics of texture, shape, and color. Such capability is particularly useful in plant disease detection, where symptoms like lesions, discoloration, or mold often appear in small, localized patches.
2.2.3. Contrastive Learning
To enhance instance-level discrimination, we incorporate a contrastive learning objective based on the Information Noise-Contrastive Estimation (InfoNCE) loss, originally introduced by [17] for Contrastive Predictive Coding (CPC). Following adaptations such as SimCLR, we apply InfoNCE in the context of image augmentations. This encourages the model to pull embeddings of similar images closer together while pushing apart those of dissimilar images within the latent space.
During training, two distinct augmented views and of the same image are generated through GPU-based transformations. These views are passed through the shared online encoder and projection MLP to produce embeddings and , which together form a positive pair. The InfoNCE loss is computed as the following:
Here, denotes cosine similarity, and is the temperature parameter that controls the sharpness of similarity distributions. The denominator aggregates similarities between and all other embeddings in the batch, while the numerator captures the similarity with its positive counterpart . The logarithm in the InfoNCE loss stabilizes optimization by compressing the range of similarity scores, and the negative sign ensures that higher similarity between and results in a lower loss value.
This contrastive objective encourages clustering of similar disease instances (e.g., different views of the same diseased leaf) while enforcing separation between dissimilar instances (e.g., different crops or disease types) in the feature space. Such discriminative structuring is particularly beneficial for fine-grained classification tasks, where subtle visual differences between plant diseases are common.
2.3. GPU-Based Augmentation Pipeline
To enhance visual diversity and boost generalization, we implement a series of GPU-accelerated augmentations using the Kornia library [18]. Executing transformations directly on the GPU reduces data-loading overhead and enables efficient large-batch training.
The augmentation pipeline includes the following transformations:
- Random resized cropping (scale: 60–100%)
- Random horizontal flipping (50% probability)
- Random rotation (±20 degrees)
- Random solarization (threshold = 0.5, 20% probability)
- Random grayscale conversion (20% probability)
- Color jittering (brightness, contrast, saturation, hue)
- Random Gaussian blur ( 30% probability)
These augmentations are applied stochastically to each image during training, encouraging the model to become invariant to common environmental variations such as lighting, orientation, and background noise. This increased diversity promotes the learning of more robust and transferable representations, especially when operating on unlabeled, real-world plant imagery.
2.4. Hybrid Loss Function
To simultaneously capture global semantic features, local structural details, and instance-level distinctions, we formulate a multi-objective loss function that combines the contributions of BYOL, MIM, and contrastive learning:
Each component contributes uniquely to the representation quality:
- promotes alignment between different views of the same image;
- enhances spatial awareness by reconstructing masked regions;
- encourages separation between different instances.
This multi-objective fusion ensures that the model not only aligns semantic representations across augmented views but also retains fine-grained details and learns to distinguish between visually similar classes. In particular, contrastive learning plays a crucial role in overcoming the limited semantic scope of MIM, which alone may struggle to capture class boundaries in the absence of explicit labels.
The final weighting scheme—1.0 (BYOL), 0.6 (MIM), and 0.6 (contrastive)—was empirically determined to effectively balance semantic generalization, spatial awareness, and discriminative capacity.
2.5. Optimization Strategy
AdamW optimizer was used with a base learning rate of 1 × 10⁻⁴, weight decay of 1 × 10⁻⁵, and a 10-epoch linear warmup. The learning rate warm-up strategy stabilizes the initial training phase, mitigating issues arising from overly aggressive updates. Gradient accumulation is employed every two batches to enable larger effective batch sizes while managing GPU memory efficiently. Mixed-precision training via PyTorch 2.1.0+’s GradScaler utility further improves computational efficiency. Checkpoints and models are saved periodically for final downstream evaluation.
2.6. Transfer Learning Evaluation on PlantVillage Dataset
To assess the generalization capability of representations learned through self-supervised pretraining, we conducted a transfer learning evaluation using the PlantVillage dataset. Unlike the field-based and visually noisy conditions of the PlantDoc dataset, PlantVillage comprises high-resolution images captured under controlled lighting, uniform backgrounds, and minimal occlusion, providing a complementary benchmark for cross-domain evaluation.
After pretraining unlabeled PlantDoc images using our proposed SSL framework, the model was fine-tuned on labeled PlantVillage samples. The model achieved consistently high classification performance on the PlantVillage dataset, demonstrating that the learned representations are both robust and transferable. These results underscore the practical utility of our framework for deployment across diverse agricultural contexts, including settings where labeled data may be limited or vary in quality.
2.7. Implementation Details
Table 1 summarizes the key hyperparameters, architectural components, and training configurations used in our experiments. The model was implemented in PyTorch 2.1.0+ and trained on an NVIDIA RTX GPU with mixed precision enabled for memory efficiency. The full implementation, including training scripts, data loaders, and model checkpoints, is available at our public GitHub repository: https://github.com/sherryHuan/SSL_BYOL_MIM_Contrastive/tree/main (accessed on 15 June 2025).

Table 1.
Summary of model architecture, training parameters, and augmentation settings.
3. Results and Discussion
3.1. Experimental Dataset
We evaluate the proposed self-supervised learning framework on two publicly available datasets, each offering unique characteristics that test the model’s robustness and generalization capabilities:
- PlantDoc: This is a challenging real-world dataset consisting of 2598 images spanning 13 plant species and 27 classes, including both diseased and healthy leaf samples. The images were captured under natural field conditions and exhibit considerable variability in lighting, background clutter, leaf orientation, and symptom presentation. The dataset includes crops such as apples, grapes, cotton, and maize, providing a comprehensive benchmark for assessing model robustness in practical agricultural scenarios. Example images from the PlantDoc dataset are shown in Figure 2.
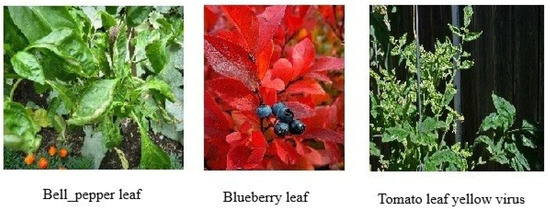 Figure 2. Samples from the PlantDoc dataset.
 - PlantVillage: In contrast, the PlantVillage dataset comprises over 54,000 images representing 38 classes, including a wide variety of healthy and diseased leaf types. The images are captured under controlled laboratory conditions with uniform backgrounds and consistent lighting, making this dataset particularly suitable for evaluating model generalization in clean, noise-free environments. Example images from the PlantVillage dataset are shown in Figure 3.
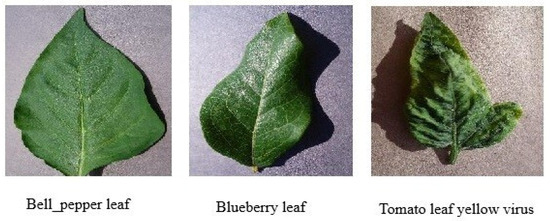 Figure 3. Samples from the PlantVillage dataset.
3.2. Evaluation Metrics
To comprehensively assess the effectiveness of the proposed self-supervised learning framework, we employ a range of widely accepted classification metrics, each capturing a different aspect of model performance:
- Accuracy: Overall proportion of correct predictions across all classes.where TP, TN, FP, and FN denote true positives, true negatives, false positives, and false negatives, respectively.
- Precision: Measures the exactness of the model by computing the proportion of correctly predicted positive instances out of all predicted positives.
- Recall: Also known as sensitivity, it evaluates the model’s ability to identify all actual positive instances.
- F1-score: The harmonic mean of precision and recall, providing a balanced view of performance, especially important in imbalanced datasets.
In addition to these quantitative metrics, we incorporate several qualitative evaluation tools:
- Confusion Matrix: Visualizes the relationship between predicted and actual class labels, revealing common misclassification patterns and class-wise accuracy.
- Grad-CAM (Gradient-weighted Class Activation Mapping): Provides visual interpretability by highlighting image regions that are most influential in the model’s decision-making process.
- t-SNE (t-distributed Stochastic Neighbor Embedding): A dimensionality reduction technique used to visualize high-dimensional feature embeddings in a two-dimensional space, enabling inspection of inter-class separability and clustering behavior.
3.3. Performance on PlantDoc
3.3.1. Per-Class Performance
To assess the real-world effectiveness of the proposed self-supervised learning framework, we evaluated the pretrained model on the PlantDoc dataset, which comprises field-captured images exhibiting high variability in lighting, background complexity, and symptom expression across 27 disease and healthy classes.
Table 2 summarizes the per-class performance metrics, including precision, recall, and F1-score. The model demonstrates consistently strong classification results across most categories. Particularly, it achieves perfect F1-scores (1.0000) in several well-defined classes such as squash powdery mildew leaf, strawberry leaf, tomato leaf yellow virus, grape leaf, and grape leaf black rot. This indicates exceptional precision and recall in detecting these diseases. Additional classes, including raspberry leaf, soyabean leaf, and tomato septoria leaf spot, also yield high F1-scores (above 0.88), showing robust classification even under moderate visual variability. However, performance drops are observed in a few underrepresented or visually ambiguous categories. For instance, corn gray leaf spot (F1-score: 0.267) and tomato mold leaf (F1-score: 0.588) were more frequently misclassified. This is likely due to visual similarity with other leaf conditions or insufficient training examples in these categories. Moreover, categories like cherry leaf and tomato leaf show relatively low recall, indicating a tendency to misclassify these instances.

Table 2.
Per-class precision, recall, and F1-score on the PlantDoc dataset.
Despite these outliers, the model maintains a macro-averaged precision of 80.00%, recall of 78.24%, and F1-score of 77.48%. These results confirm that the proposed self-supervised learning framework effectively learns robust and discriminative features from unlabeled field data, making it well-suited for complex, real-world plant disease detection tasks.
3.3.2. Confusion Matrix Analysis
As shown in Figure 4, the confusion matrix for the PlantDoc test set reveals strong diagonal dominance, indicating high classification accuracy across most categories. Classes such as bell pepper leaf spot, strawberry leaf, tomato septoria leaf spot, and grape leaf black rot exhibit near-perfect separability. Misclassifications occur primarily in visually similar or underrepresented classes. For instance, apple rust leaf is occasionally confused with apple leaf and apple scab leaf, while tomato leaf mosaic virus overlaps with related tomato conditions such as tomato leaf yellow virus. Additionally, harder-to-distinguish categories like corn gray leaf spot and tomato mold leaf show scattered misclassifications, likely due to their subtle visual symptoms and smaller sample sizes.
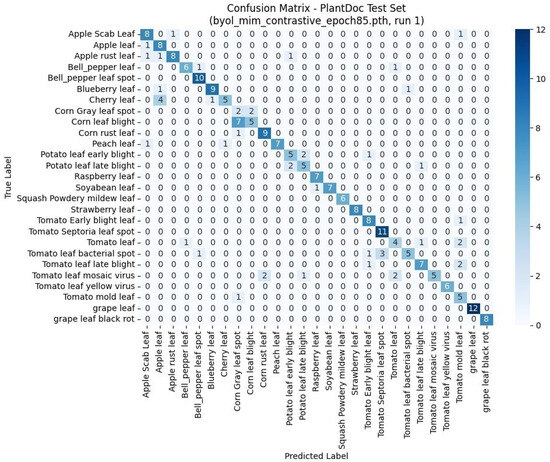
Figure 4.
Confusion matrix of predicted versus actual labels on the PlantDoc test set using the model trained with BYOL + MIM + contrastive learning. The model shows high accuracy and strong class separability, with most predictions concentrated along the diagonal.
Overall, the matrix confirms that the model learns meaningful, discriminative features even under complex, real-world conditions.
3.3.3. Model Interpretability via Grad-CAM
To assess the interpretability of our self-supervised learning model, we employed Gradient-weighted Class Activation Mapping (Grad-CAM), which visualizes class-discriminative regions that influence the model’s predictions. Figure 5 shows two representative examples: apple rust leaf (top row) and grape leaf black rot (bottom row). Each row presents the input image, the Grad-CAM heatmap, and the overlay on the original image.
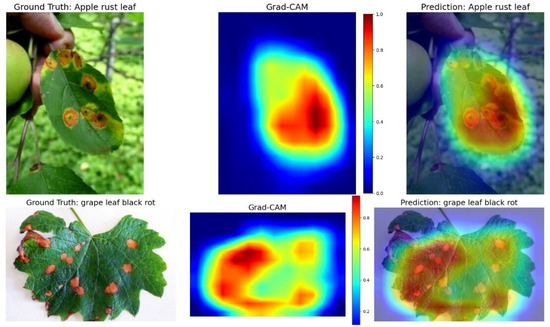
Figure 5.
Grad-CAM visualizations show attention maps for apple rust leaf (top) and grape leaf black rot (bottom), aligning well with true disease symptoms despite no labeled supervision.
In both cases, the highlighted regions closely correspond to disease symptoms, such as rust-colored lesions and dark necrotic spots, indicating that the model attends to pathologically meaningful features rather than background noise. These visualizations enhance the model’s explainability, a critical factor for real-world applications where human-in-the-loop decision support and trust in automated systems are essential.
3.4. Comparison with Existing Models
Table 3 presents a comparative analysis of our proposed self-supervised model against a diverse set of state-of-the-art architectures evaluated on the PlantDoc dataset. Our framework, which integrates BYOL, MIM, and contrastive learning atop a ResNet-101 backbone, achieves a macro precision of 80.00%, macro recall of 78.24%, and macro F1-score of 77.48%. These results demonstrate robust performance under real-world agricultural conditions and position our method among the top-performing models on this benchmark.
Compared to transformer-based models such as Swin Transformer and Vision Transformer (ViT), our method achieves higher recall and competitive F1-scores. The recently proposed Efficient Swin Transformer [19] achieves slightly higher macro precision (80.14%) and macro F1-score (78.16%), but with lower recall (76.27%). Importantly, its confusion matrix reveals a complete failure to classify certain classes—Class 7 (corn gray leaf spot) records zero true positives, indicating weaker robustness for rare or ambiguous disease symptoms. In contrast, our model maintains measurable recall on all classes, including difficult categories, which reflects stronger generalization to challenging, field-based conditions.
Among convolutional networks, our model outperforms GoogLeNet [20], DenseNet [21], and MobileNet [22], validating the efficacy of multi-objective self-supervised pretraining over purely supervised approaches. While lightweight models like ShuffleNet V2 [23] and MobileViT [24] are efficient in computation, they consistently underperform in key evaluation metrics. Our approach also demonstrates favorable results when compared to domain-specific and hybrid models such as T-CNN (ResNet-101) [25] and ICVT [26].
Despite these models being tailored for interpretability or trained with full supervision, their performance does not surpass our label-free pretraining pipeline. The superior generalization and label efficiency of our model demonstrate that carefully designed SSL pipelines can rival or exceed specialized methods in complex, real-world agricultural tasks.

Table 3.
Comparison with existing models on the PlantDoc dataset.
Table 3.
Comparison with existing models on the PlantDoc dataset.
| Model | Precision (%) | Recall (%) | F1-Score (%) |
|---|---|---|---|
| Mobilenet [22] | 55.24 | 52.57 | 53.82 |
| ResNet | 67.36 | 65.34 | 66.28 |
| GoogLeNet [20] | 74.31 | 69.19 | 71.61 |
| DenseNet [21] | 69.26 | 66.17 | 67.61 |
| ShuffleNet V2 [23] | 72.28 | 71.24 | 71.70 |
| MobileViT [24] | 72.55 | 68.22 | 70.32 |
| Vision Transformer | 54.35 | 56.77 | 55.53 |
| Swin Transformer | 75.85 | 69.91 | 72.76 |
| T-CNN (ResNet-101) [25] | 74.44 | - | - |
| ICVT [26] | 77.23 | - | - |
| Efficient Swin Transformer [19] | 80.84 | 76.72 | 78.16 |
| Ours (BYOL + MIM + Contrastive) | 80.00 | 78.24 | 77.48 |
3.5. Ablation Study
We conducted an ablation study to evaluate the individual and combined contributions of BYOL, MIM, and contrastive learning within our self-supervised framework. Additionally, we benchmarked against prominent self-supervised baselines, including SimCLR and DINOv2.
As shown in Table 4, BYOL alone surpasses both baselines and the BYOL + MIM configuration, indicating that while MIM provides structural reconstruction benefits, it may slightly interfere with BYOL’s semantic consistency when applied in isolation. Similarly, the BYOL + Contrastive configuration performs slightly below BYOL + MIM, likely because contrastive objectives alone, without the complementary structural guidance from MIM, can overemphasize inter-instance separation at the expense of fine-grained spatial representations. Nevertheless, the full integration of BYOL, MIM, and contrastive learning yields the best results, achieving 77.82% classification accuracy, 80.00% macro precision, 78.24% macro recall, and 77.48% macro F1-score. These results demonstrate that while MIM alone does not significantly improve performance, its contribution becomes more effective when complemented by contrastive regularization. The combination allows the model to balance global consistency, local reconstruction, and inter-instance discrimination—critical components for robust feature learning in visually diverse plant disease datasets.

Table 4.
Ablation results comparing different self-supervised learning configurations on the PlantDoc dataset.
The comparatively lower performance of SimCLR and DINOv2 is likely due to their reliance on large-scale datasets and architectural sensitivity. SimCLR, which depends heavily on negative sampling and large batch sizes, may be suboptimal under the moderate size and noisy conditions of PlantDoc. Similarly, DINOv2, built on Vision Transformers, typically benefits from extensive data and longer pretraining cycles to reach peak performance.
In contrast, our ResNet-based approach, equipped with GPU-accelerated augmentations and guided by a multi-objective loss, is better suited to real-world agricultural constraints, enabling efficient learning from unlabeled, field-acquired imagery. These findings validate the effectiveness of our framework in data-scarce, noisy domains and highlight the importance of integrating diverse SSL signals for robust plant disease recognition.
3.6. Transferability to PlantVillage
3.6.1. Transfer Performance on PlantVillage
To contextualize the effectiveness of our self-supervised model, we compared its performance with several notable studies that utilized the PlantVillage dataset for plant disease classification. These prior efforts span a wide range of strategies, including deep convolutional architectures, data augmentation, image segmentation, transformer-based models, and ensemble learning techniques.
Ref. [3] achieved 99.75% accuracy using DenseNet, while ref. [27] proposed a CNN-based model with multiple loss functions, reaching 98.93%. Ref. [28] used a two-model ensemble and achieved 99.7%. Ref. [29] combined RGB and segmented inputs with DenseNet, yielding 98.17%, and ref. [30], one of the earliest contributions, reported 99.31% using a basic CNN. Ref. [31] reported the highest accuracy of 99.91% through extensive data augmentation and deeper architecture. Most recently, ref. [32] utilized digital image preprocessing with a ten-model ensemble to achieve 99.89%. In addition, ref. [33] introduced an optimized Vision Transformer (ViT) configuration, achieving 99.77% accuracy on the PlantVillage dataset while maintaining low parameter count and storage requirements.
In comparison, our proposed framework achieves 99.85% accuracy using a single ResNet-101 backbone pretrained in a self-supervised manner using BYOL, MIM, and contrastive learning, without requiring any labeled data during pretraining. While our accuracy is marginally lower than that of refs. [31,32] and higher than the ViT of ref. [33] and other alternative methods, our approach avoids the complexity and computational cost associated with data augmentation, transformers, and ensemble techniques. As summarized in Table 5, these results demonstrate that self-supervised learning can achieve performance on par with state-of-the-art supervised or ensemble methods, while offering significant advantages in scalability, label efficiency, and practical deployment. This reinforces the potential of SSL frameworks in real-world agricultural applications, particularly in data-scarce environments.

Table 5.
Transfer learning comparison on PlantVillage.
Although the PlantDoc and PlantVillage datasets differ in the number of disease categories (27 and 38 classes, respectively), the strong transfer performance demonstrates the strength of our learned representations. Unlike supervised pretraining, self-supervised learning focuses on extracting generalizable visual patterns such as texture, color, and structural cues, without being tied to specific class labels. As a result, the backbone pretrained on unlabeled PlantDoc images is able to adapt effectively to the new class structure of PlantVillage during fine-tuning. The cleaner and less noisy conditions of the PlantVillage dataset further facilitate rapid adaptation, leading to the observed high classification accuracy. This result highlights the domain-agnostic nature of self-supervised features and underscores the practical scalability of the proposed framework across diverse agricultural environments.
While downstream fine-tuning still necessitates labeled data, the self-supervised pretraining phase enables the model to acquire rich and transferable representations without supervision. This substantially reduces the quantity and quality of labeled data required to achieve strong downstream performance, offering a scalable solution for data-scarce agricultural applications.
3.6.2. Training Dynamics
Figure 6 presents the training and validation curves for loss and accuracy during the downstream classification on the PlantVillage dataset. The model exhibits rapid convergence, with validation accuracy exceeding 99% within the first few epochs. Both training and validation losses decrease sharply and stabilize near zero, indicating strong model fitting and effective generalization.
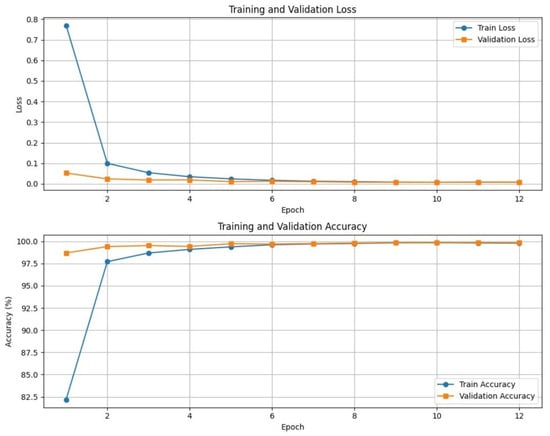
Figure 6.
Training and validation loss (top) and accuracy (bottom) curves on the PlantVillage dataset. The model exhibits rapid convergence and minimal overfitting, reflecting the robustness of the self-supervised pretraining.
Notably, the small gap between training and validation accuracy implies minimal overfitting, underscoring the robustness of the representations learned during self-supervised pretraining. These results demonstrate that the combination of BYOL, MIM, and contrastive learning enables efficient downstream training, requiring fewer labeled examples and epochs to reach near-optimal performance in new domains.
3.6.3. Feature Space Visualization with t-SNE
To further investigate the quality of the learned representations, we employed t-Distributed Stochastic Neighbor Embedding (t-SNE) to visualize the high-dimensional feature space extracted from the PlantVillage dataset. As shown in Figure 7, the self-supervised model produces well-separated and tightly clustered embeddings for most disease classes. Categories such as tomato mosaic virus, potato late blight, and grape black rot form clearly distinguishable clusters, indicating strong intra-class consistency and inter-class separability.
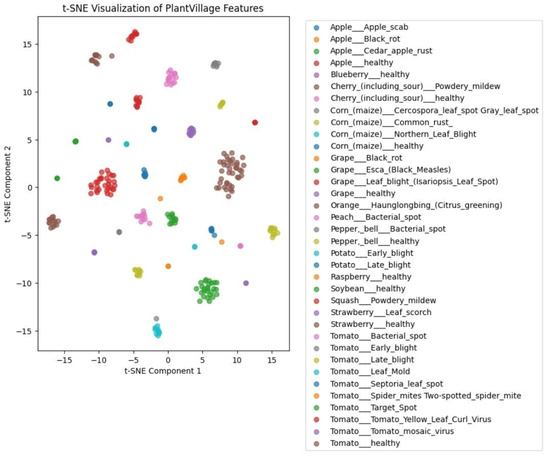
Figure 7.
t-SNE visualization of feature embeddings generated by the SSL-pretrained ResNet-101 on the PlantVillage dataset. Each point represents a sample projected into 2D space. The clear clustering of disease classes illustrates strong semantic structure and discriminative capability of the learned representations.
This structured clustering demonstrates the model’s ability to encode fine-grained visual cues while maintaining reliable, generalizable representations. It highlights the effectiveness of SSL pretraining on unlabeled PlantDoc data in producing discriminative and transferable features across domains.
4. Conclusions
In this study, we proposed a unified self-supervised learning (SSL) framework that integrates Bootstrap Your Own Latent (BYOL), Masked Image Modeling (MIM), and contrastive learning for plant disease detection. Leveraging a ResNet-101 backbone and GPU-accelerated augmentations, the model effectively learns rich and transferable visual representations from unlabeled plant imagery, directly addressing the critical challenge of limited annotated datasets in agriculture.
Through extensive comparisons, ablation studies, and visualization analyses, we demonstrated the complementary benefits of combining global feature alignment (BYOL), local structural reconstruction (MIM), and instance-level discrimination (contrastive learning). Our results confirm that this multi-objective SSL approach not only reduces reliance on labeled data but also achieves high predictive performance in both in-field and laboratory settings.
While PlantVillage yields near-perfect results due to its clean lab conditions, and PlantDoc presents moderate in-field variability, we acknowledge the need to evaluate our method on newer, more challenging large-scale in-field collections.
Future directions include extending this framework to cross-modal SSL using drone or satellite imagery, exploring domain adaptation across different crop species, and incorporating explainable AI techniques to support decision-making for farmers and agronomists. Overall, our findings highlight the practical potential of self-supervised learning in creating scalable, efficient, and intelligent systems for plant disease diagnostics in real-world, resource-constrained agricultural environments.
Author Contributions
Writing—original draft, writing—review and editing, conceptualization, methodology, data curation, software, formal analysis, investigation, validation, X.H.; writing—review and editing, formal analysis, investigation, validation, B.C.; writing—review and editing, formal analysis, investigation, validation, H.Z. All authors have read and agreed to the published version of the manuscript.
Funding
This research received no external funding.
Data Availability Statement
The data presented in this study are openly available in https://github.com/sherryHuan/SSL_BYOL_MIM_Contrastive/tree/main (accessed on 15 June 2025).
Conflicts of Interest
The authors declare no conflict of interest.
References
- Xu, M.; Kim, H.; Yang, J.; Fuentes, A.; Meng, Y. Embracing limited and imperfect training datasets: Opportunities and challenges in plant disease recognition using deep learning. Front. Plant Sci. 2023, 14, 1225409. [Google Scholar] [CrossRef] [PubMed]
- Pujari, J.; Yakkundimath, R.; Byadgi, A. Image Processing Based Detection of Fungal Diseases in Plants. Procedia Comput. Sci. 2015, 46, 1802–1808. [Google Scholar] [CrossRef]
- Too, E.; Yujian, L.; Njuki, S.; Yingchun, L. A comparative study of fine-tuning deep learning models for plant disease identification. Comput. Electron. Agric. 2019, 161, 272–279. [Google Scholar] [CrossRef]
- Che, C.; Xue, N.; Li, Z.; Zhao, Y.; Huang, X. Automatic cassava disease recognition using object segmentation and progressive learning. PeerJ Comput. Sci. 2025, 11, e2721. [Google Scholar] [CrossRef]
- Zhang, J.; Cao, Y.; Xu, D. Uncertainty-aware Masked Modeling in Medical Imaging. In Proceedings of the IEEE International Conference on Acoustics, Speech and Signal Processing (ICASSP), Hyderabad, India, 6–11 April 2025; pp. 1–5. [Google Scholar] [CrossRef]
- Oquab, M.; Darcet, T.; Moutakanni, T.; Vo, H.; Szafraniec, M.; Khalidov, V.; Fernandez, P.; Haziza, D.; Massa, F.; El-Nouby, A.; et al. DINOv2: Learning Robust Visual Features without Supervision. arXiv 2023, arXiv:2304.07193. [Google Scholar] [CrossRef]
- Mamun, A.A.; Ahmedt-Aristizabal, D.; Zhang, M.; Ismail Hossen, M.; Hayder, Z.; Awrangjeb, M. Plant Disease Detection Using Self-supervised Learning: A Systematic Review. IEEE Access 2024, 12, 171926–171943. [Google Scholar] [CrossRef]
- Wang, Z.; Wang, R.; Wang, M.; Lai, T.; Zhang, M. Self-supervised Transformer-Based Pre-training Method with General Plant Infection Dataset. In Lecture Notes in Computer Science, Proceedings of the Pattern Recognition and Computer Vision (PRCV), Urumqi, China, 18–20 October 2024; Springer Nature: Singapore, 2025; Volume 15032. [Google Scholar] [CrossRef]
- Gustineli, M.; Miyaguchi, A.; Stalter, I. Multi-Label Plant Species Classification with Self-Supervised Vision Transformers. arXiv 2024, arXiv:2407.06298. [Google Scholar] [CrossRef]
- Chen, T.; Kornblith, S.; Norouzi, M.; Hinton, G. A simple framework for contrastive learning of visual representations. In Proceedings of the 37th International Conference on Machine Learning (ICML 2020), Virtual Event, 13–18 July 2020; pp. 1597–1607. [Google Scholar] [CrossRef]
- Grill, J.-B.; Strub, F.; Altché, F.; Tallec, C.; Richemond, P.H.; Buchatskaya, E.; Doersch, C.; Avila Pires, B.; Guo, Z.; Gheshlaghi Azar, M.; et al. Bootstrap your own latent: A new approach to self-supervised learning. In Proceedings of the Neural Information Processing Systems 33, Vancouver, BC, Canada, 6–12 December 2020; pp. 21271–21284. Available online: https://proceedings.neurips.cc/paper_files/paper/2020/file/f3ada80d5c4ee70142b17b8192b2958e-Paper.pdf (accessed on 1 March 2025).
- Singh, D.; Jain, N.; Kayal, P.; Sinha, A. PlantDoc: A Dataset for Visual Plant Disease Detection. In Proceedings of the 7th ACM IKDD Conference on Data Science (CoDS) and the 25th Conference on Management of Data (COMAD), Hyderabad, India, 5–7 January 2020. [Google Scholar] [CrossRef]
- Hughes, D.P.; Salathé, M. An open access repository of images on plant health to enable the development of mobile disease diagnostics. arXiv 2015, arXiv:1511.08060. [Google Scholar] [CrossRef]
- He, K.; Zhang, X.; Ren, S.; Sun, J. Deep Residual Learning for Image Recognition. In Proceedings of the IEEE Conference on Computer Vision and Pattern Recognition (CVPR 2016), Las Vegas, NV, USA, 27–30 June 2016; pp. 770–778. [Google Scholar] [CrossRef]
- Deng, J.; Dong, W.; Socher, R.; Li, L.-J.; Li, K.; Li, F.F. ImageNet: A large-scale hierarchical image database. In Proceedings of the IEEE Conference on Computer Vision and Pattern Recognition (CVPR), Miami, FL, USA, 20–25 June 2009; pp. 248–255. [Google Scholar] [CrossRef]
- He, K.; Chen, X.; Xie, S.; Li, Y.; Dollár, P.; Girshick, R. Masked Autoencoders Are Scalable Vision Learners. In Proceedings of the IEEE/CVF Conference on Computer Vision and Pattern Recognition (CVPR), New Orleans, LA, USA, 18–24 June 2022; pp. 15979–15988. [Google Scholar] [CrossRef]
- Oord, A.; Li, Y.; Vinyals, O. Representation Learning with Contrastive Predictive Coding. arXiv 2018, arXiv:1807.03748. [Google Scholar] [CrossRef]
- Riba, E.; Mishkin, D.; Ponsa, D.; Rublee, E.; Bradski, G. Kornia: An Open Source Differentiable Computer Vision Library for PyTorch. In Proceedings of the IEEE Winter Conference on Applications of Computer Vision (WACV), Snowmass, CO, USA, 1–5 March 2020; pp. 3663–3672. [Google Scholar] [CrossRef]
- Liu, W.; Zhang, A. Plant Disease Detection Algorithm Based on Efficient Swin Transformer. Comput. Mater. Contin. 2025, 82, 3045–3068. [Google Scholar] [CrossRef]
- Szegedy, C.; Liu, W.; Jia, Y.; Sermanet, P.; Reed, S.; Anguelov, D.; Erhan, D.; Vanhoucke, V.; Rabinovich, A. Going deeper with convolutions. In Proceedings of the 2015 IEEE Conference on Computer Vision and Pattern Recognition (CVPR), Boston, MA, USA, 7–12 June 2015; pp. 1–9. [Google Scholar] [CrossRef]
- Huang, G.; Liu, Z.; Van Der Maaten, L.; Weinberger, K.Q. Densely Connected Convolutional Networks. In Proceedings of the 2017 IEEE Conference on Computer Vision and Pattern Recognition (CVPR), Honolulu, HI, USA, 21–26 July 2017; pp. 2261–2269. [Google Scholar] [CrossRef]
- Howard, A.G.; Zhu, M.; Chen, B.; Kalenichenko, D.; Wang, W.; Weyand, T.; Andreetto, M.; Adam, H. MobileNets: Efficient convolutional neural networks for mobile vision applications. arXiv 2017, arXiv:1704.04861. [Google Scholar] [CrossRef]
- Ma, N.; Zhang, X.; Zheng, H.T.; Sun, J. ShuffleNet V2: Practical Guidelines for Efficient CNN Architecture Design. In Lecture Notes in Computer Science, Proceedings of the European Conference on Computer Vision (ECCV 2018), Munich, Germany, 8–14 September 2018; Ferrari, V., Hebert, M., Sminchisescu, C., Weiss, Y., Eds.; Springer: Berlin/Heidelberg, Germany, 2018; Volume 11218, pp. 122–138. [Google Scholar] [CrossRef]
- Mehta, S.; Rastegari, M. MobileViT: Light-weight, General-purpose, and Mobile-friendly Vision Transformer. arXiv 2021, arXiv:2110.02178. [Google Scholar] [CrossRef]
- Wang, D.; Wang, J.; Li, W.; Guan, P. T-CNN: Trilinear Convolutional Neural Networks Model for Visual Detection of Plant Diseases. Comput. Electron. Agric. 2021, 190, 106468. [Google Scholar] [CrossRef]
- Yu, S.; Xie, L.; Huang, Q. Inception Convolutional Vision Transformers for Plant Disease Identification. Internet Things 2023, 21, 100650. [Google Scholar] [CrossRef]
- Gokulnath, B.; Usha, D.G. Identifying and classifying plant disease using resilient LF-CNN. Ecol. Inform. 2021, 63, 101283. [Google Scholar] [CrossRef]
- Vo, H.-T.; Quach, L.-D.; Hoang, T. Ensemble of Deep Learning Models for Multi-plant Disease Classification in Smart Farming. Int. J. Adv. Comput. Sci. Appl. 2023, 14. [Google Scholar] [CrossRef]
- Kaya, Y.; Gürsoy, E. A novel multi-head CNN design to identify plant diseases using the fusion of RGB images. Ecol. Inform. 2023, 75, 101998. [Google Scholar] [CrossRef]
- Mohanty, S.; Hughes, D.; Salath’e, M. Using Deep Learning for Image-Based Plant Disease Detection. Front. Plant Sci. 2016, 7, 1419. [Google Scholar] [CrossRef]
- Atila, Ü.; Uçar, M.; Akyol, K.; Uçar, E. Plant leaf disease classification using EfficientNet deep learning model. Ecol. Inform. 2021, 61, 101182. [Google Scholar] [CrossRef]
- Ali, A.H.; Youssef, A.; Abdelal, M.; Raja, M.A. An ensemble of deep learning architectures for accurate plant disease classification. Ecol. Inform. 2024, 81, 102618. [Google Scholar] [CrossRef]
- Ouamane, A.; Chouchane, A.; Himeur, Y.; Miniaoui, S.; Zaguia, A. Optimized vision transformers for superior plant disease detection. IEEE Access 2025, 13, 39165–39181. [Google Scholar] [CrossRef]
Disclaimer/Publisher’s Note: The statements, opinions and data contained in all publications are solely those of the individual author(s) and contributor(s) and not of MDPI and/or the editor(s). MDPI and/or the editor(s) disclaim responsibility for any injury to people or property resulting from any ideas, methods, instructions or products referred to in the content. |
© 2025 by the authors. Licensee MDPI, Basel, Switzerland. This article is an open access article distributed under the terms and conditions of the Creative Commons Attribution (CC BY) license (https://creativecommons.org/licenses/by/4.0/).